FAFEN report
4
452 I www.fafen.org Hir Sian Bauka Kotla Kakeai Malabar Patesar Slimpur Sialkot Catwara Kakeali Rukhana Ramgarh Doburji Kharkana Daluwali Muradpur Ghazipur Dangrial Rangpura Hirapura Hajipura Buraneka Nizampura Fatehgarh Wadi Tejar Brame Chak Kishnewali Nawan Pind Palkhu Nala Jalphanwali Malke Kalan Pakka Garha Muzaffarpur Babe di Ber Doburji Rianda Mianapura Khurd Jodhewali Khurd Jodhewali Kalan Daluwali Railway Station NA-111 NA-110 NA-114 NA-112 NA-111 NA-114 NA-110 NA-112 1 inch = 19.73 miles NA-110 SIALKOT-I predominantly urban area, NA-110 comprises 21 union 1 councils of Sialkot . The Arain, Kashmiri and Sheikh are the largest 2 A groups settled in the area . In significant numbers, the Christians and Sikhs usually vote under the influence of religious 3 leaders . Moreover, the industrial elite, along with the heads of local political factions and castes play a central role in mobilizing voters in 4 support of a particular party/ candidate . Figure 2: Registered Voters by Gender 2008-13 Figure 1: Number of Registered Voters 2002 to 2013 247,536 275,969 342,125 2002 2008 2013 53.4% 56.1% 46.6% 43.9% 2008 2013 Male Voters Female Voters Registered Voters: Polling Scheme Registered Voters: Form-XVII Valid Votes: Rejected Votes: Total Votes Polled: Turnout: 342,125 342,125 176,294 3,290 179,584 52.5% Winner's Status: PML-N (3rd Consecutive Win) Overall Rank by Turnout Turnout Rank in the Region Change in Turnout: 2013 Vs. Avg. of 2002-08 Rank by Increase in Turnout 191 134 9.7% 177 Registered Voters In 2008, the constituency had 275,969 registered voters - 11.5% more than the 247,536 voters in 2002. In 2013, the registered voters increased by another 24% to 342,125. Voters by Gender The share of women in total registered voters decreased between 2008 and 2013, indicating a proportionately higher increase in the number of male voters. In 2008, the constituency had 53.4% male and 46.6% female voters. The share of male voters went up to 56.1% in 2013, while female voters accounted for the remaining 43.9%. 1 Punjab Lok Sujaag, Zila' Sialkot: Taraki Aur Siasat. P.39 2 Ibid 3 Ibid 4 Ibid
-
Upload
hadeedahmedsher -
Category
Documents
-
view
30 -
download
1
description
FAFEN report on NA 110. Khawaja Asif constituency
Transcript of FAFEN report

452 I w w w . f a f e n . o r g
Hir
Sian
Bauka
Kotla
Kakeai
Malabar
Patesar
SlimpurSialkot
Catwara
Kakeali
Rukhana
RamgarhDoburji
Kharkana
Daluwali
Muradpur
Ghazipur
DangrialRangpuraHirapura
Hajipura Buraneka
Nizampura
Fatehgarh
Wadi Tejar
Brame Chak
Kishnewali
Nawan Pind
Palkhu Nala
Jalphanwali
Malke KalanPakka Garha
Muzaffarpur
Babe di Ber
Doburji Rianda
Mianapura Khurd
Jodhewali Khurd
Jodhewali Kalan
Daluwali Railway Station
NA-111
NA-110
NA-114
NA-112
NA-111
NA-114
NA-110
NA-112
1 inch = 19.73 miles
NA-110 SIALKOT-I
predominantly urban area, NA-110 comprises 21 union 1councils of Sialkot . The Arain, Kashmiri and Sheikh are the largest
2Agroups settled in the area . In significant numbers, the Christians and Sikhs usually vote under the influence of religious
3leaders . Moreover, the industrial elite, along with the heads of local political factions and castes play a central role in mobilizing voters in
4support of a particular party/ candidate .
Figure 2: Registered Voters by Gender 2008-13
Figure 1: Number of Registered Voters 2002 to 2013
247,536 275,969
342,125
2002 2008 2013
53.4% 56.1%46.6% 43.9%
2008 2013
Male Voters
Female Voters
Registered Voters: Polling Scheme
Registered Voters: Form-XVII
Valid Votes:
Rejected Votes:
Total Votes Polled:
Turnout:
342,125
342,125
176,294
3,290
179,584
52.5%
Winner's Status: PML-N (3rd Consecutive Win)
Overall Rank by Turnout
Turnout Rank in the Region
Change in Turnout: 2013 Vs. Avg. of 2002-08
Rank by Increase in Turnout
191
134
9.7%
177
Registered Voters
In 2008, the constituency had 275,969 registered voters - 11.5% more than the 247,536 voters in 2002. In 2013, the registered voters increased by another 24% to 342,125.
Voters by Gender
The share of women in total registered voters decreased between 2008 and 2013, indicating a proportionately higher increase in the number of male voters. In 2008, the constituency had 53.4% male and 46.6% female voters. The share of male voters went up to 56.1% in 2013, while female voters accounted for the remaining 43.9%.
1 Punjab Lok Sujaag, Zila' Sialkot: Taraki Aur Siasat. P.392 Ibid3 Ibid4 Ibid
SIALKOT-I NA-110PUNJAB
w w w . f a f e n . o r g I 453
Figure 4: Votes Polled 2002 to 2013
Figure 3: Party Share of Votes in 2013 Elections
Figure 5: Comparative Turnout 2002 to 2013
Figure 6: Comparative Party Shares 2002 to 2013
106,083 118,120
179,584
2002 2008 2013
42.9% 42.8%
52.5%
2002 2008 2013
36.7% 40.3%
61.8%
51.7%
27.2%
39.9%
2002 2008 2013
PML
PML-N
PPPP
PTI
Others 6.6%
PML-N 51.7%
PTI 39.9%
Rejected Votes 1.8%
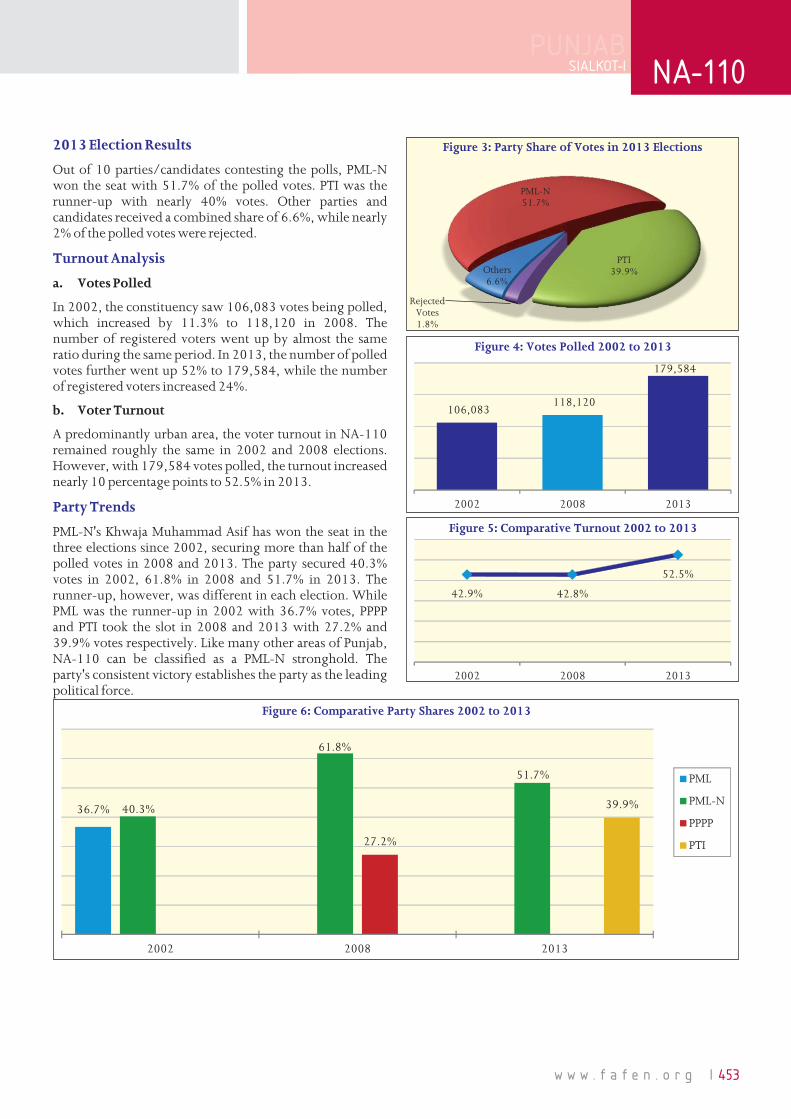
2013 Election Results
Turnout Analysis
Party Trends
Out of 10 parties/candidates contesting the polls, PML-N won the seat with 51.7% of the polled votes. PTI was the runner-up with nearly 40% votes. Other parties and candidates received a combined share of 6.6%, while nearly 2% of the polled votes were rejected.
a. Votes Polled
In 2002, the constituency saw 106,083 votes being polled, which increased by 11.3% to 118,120 in 2008. The number of registered voters went up by almost the same ratio during the same period. In 2013, the number of polled votes further went up 52% to 179,584, while the number of registered voters increased 24%.
b. Voter Turnout
A predominantly urban area, the voter turnout in NA-110 remained roughly the same in 2002 and 2008 elections. However, with 179,584 votes polled, the turnout increased nearly 10 percentage points to 52.5% in 2013.
PML-N's Khwaja Muhammad Asif has won the seat in the three elections since 2002, securing more than half of the polled votes in 2008 and 2013. The party secured 40.3% votes in 2002, 61.8% in 2008 and 51.7% in 2013. The runner-up, however, was different in each election. While PML was the runner-up in 2002 with 36.7% votes, PPPP and PTI took the slot in 2008 and 2013 with 27.2% and 39.9% votes respectively. Like many other areas of Punjab, NA-110 can be classified as a PML-N stronghold. The party's consistent victory establishes the party as the leading political force.

454 I w w w . f a f e n . o r g
NA-110
Figure 7: Vote Consolidation/Fragmentation Patterns 2002 to 2013
Figure 8: Comparative Margin of Victory & Rejected Votes 2002 to 2013
40.3%
61.8%
51.7%
36.7%
27.2%
39.9%
18.3%
8.0% 3.5%
2002 2008 2013
Winner Runner-up Third
3,786
40,850
21,275
4,280 3,295 3,290
2002 2008 2013
Margin of Victory Rejected Votes
Voting Pattern
The voting pattern shows a division of votes between two parties. However, with the exception of 2002, the seat has been won with a comfortable margin. In a close competition, the top two candidates secured 77% of the polled votes collectively. The runner-up, however, lost a considerably vote bank in 2008, which were dominated by PML-N. The competition was relatively strong in 2013. However, the seat was still won with a considerable margin. The second runner-up has consistently lost its vote share, showing a clear two-party race in the constituency. Given the consistent trend, the next polls may witness a similar voting pattern.
Margin of Victory
The margin of victory was less than the number of rejected votes in 2002. However the winning margin was considerably higher in 2008 and 2013 elections. It is also important to note that the number of rejected votes has decreased consistently over the three general elections.

SIALKOT-I NA-110PUNJAB
w w w . f a f e n . o r g I 455
Figure 9: Parallel Vote Tabulation
Election Day Observations at a Glance
0 0
0
Category-A Category-B
Category-C 30Category-D
51.7
39.9
3.5
53.3
44.1
5.1
50.7
41.6
3.9
48.1
39.0
2.7
0.0 10.0 20.0 30.0 40.0 50.0 60.0
PTI
JI
PVT Estimate ECP Results
Categories of Received Form XIV
Figure 12: Comparative Turnoutby Type of Polling Stations
55.4%
50.5%
55.0%54.1%
52.5%
Male Female CombinedProjected
Turnout ± 0.4%
PVT ECPTurnout
Figure 10: Distribution of Registered Voters
Figure 11: Distribution ofPolling Station by Type
135,973
107,111 99,081
24,508 11,204 8,580
Male Female Combined
Polling Scheme PVT Sample
82 82
63
159 6
Male Female Combined
Polling Scheme PVT Sample
PML-N
ViolationsReportedObservation of Voting Process
Voters with any other form of identification are permitted to vote
Voters who have no ID are permitted to vote
Polling Officer is not checking the back of each voter's thumb for indelible ink
APO is not requiring each voter to put a thumbprint on the NA ballot counterfoil
APO is not putting official stamp and signing on the back of each NA ballot
APO is not filling out each NA ballot counterfoil with the voter's CNIC and details
APO is not putting an official stamp and signing each NA ballot counterfoil
Polling Officials are marking NA ballot papers on behalf of voters
Polling agents/ Candidates are marking NA ballot papers on behalf of voters
Security Officials is marking NA ballot papers on behalf of voters
Other personal is marking NA ballot papers on behalf of voters
Government Officials is trying to influence voters to vote for one candidate/party
Polling Officials are trying to influence voters to vote for one candidate/party
Any people with weapons are in the polling booth
Capture of polling station by one party/candidate
Polling Station closes before 5:00 pm
Polling officials didn’t check the stamp and signature on the back of each NA ballot
Polling officials didn’t count two times the NA ballots in each candidate pile
Polling officials didn’t call out loudly if they find a ballot without stamp/signature
Polling officials didn’t put ballots without a stamp/signature in the Invalid pile
Polling officials did not create one pile for “invalid” NA ballots
Polling officials did not fill out the "NA Ballot Account Form”
Not all polling agents sign the NA "Statement of the Count”
Polling officials did not carefully pack all NA materials in separate envelopes
Presiding Officer did not sign NA "Tamper Evident Bag”
Polling officials did not post copy of "Statement of the Count" outside the PS
Ballot Stuffing, Polling Station Capture and Voter Intimidation
Observation of Counting Process
0
0
0
0
0
0
0
0
0
0
0
0
0
0
0
0
0
0
0
0
0
0
0
0
0
0


![ASEC Report ASEC Report 5555월월월 - AhnLab, Inc.download.ahnlab.com/asecReport/ASEC_Report_200705.pdf · 2009-01-09 · ASEC Report ASEC Report 5555월월월 ... [그림 1-4]](https://static.fdocument.pub/doc/165x107/5f2dfaf76488d35fc12c4b7b/asec-report-asec-report-5555-ahnlab-inc-2009-01-09-asec-report-asec.jpg)