Facing the challenge of a new age - 独立行政法人...
43
Logo Gobierno: 160x162px. Ministerio, Subsecretaría, Organismo, etc.:160x145px Facing the challenge of a new age: Chile and mining in the 21st century COCHILCO – Chilean Copper Commission Jorge Cantallopts Research Department Juanuary 20th, 2015
Transcript of Facing the challenge of a new age - 独立行政法人...
Logo Gobierno: 160x162px. Ministerio, Subsecretaría, Organismo, etc.:160x145px
Facing the challenge of a new age:
Chile and mining in the 21st century
COCHILCO – Chilean Copper Commission
Jorge Cantallopts Research Department
Juanuary 20th, 2015
1. Mining in Chile, a brief summary.
2. Enviromental and social licenses.
3. Costs and productivity challenges.
4. Final comments
Content
Ministry of Mines| COCHILCO
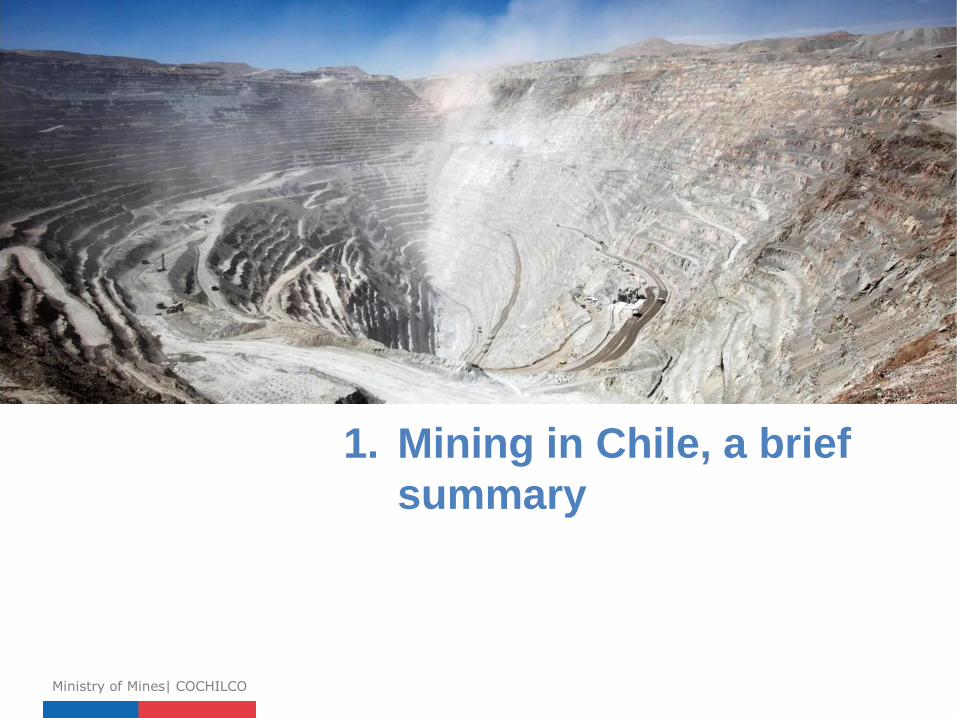
Imagen Referencial
1. Mining in Chile, a brief
summary
Ministry of Mines| COCHILCO
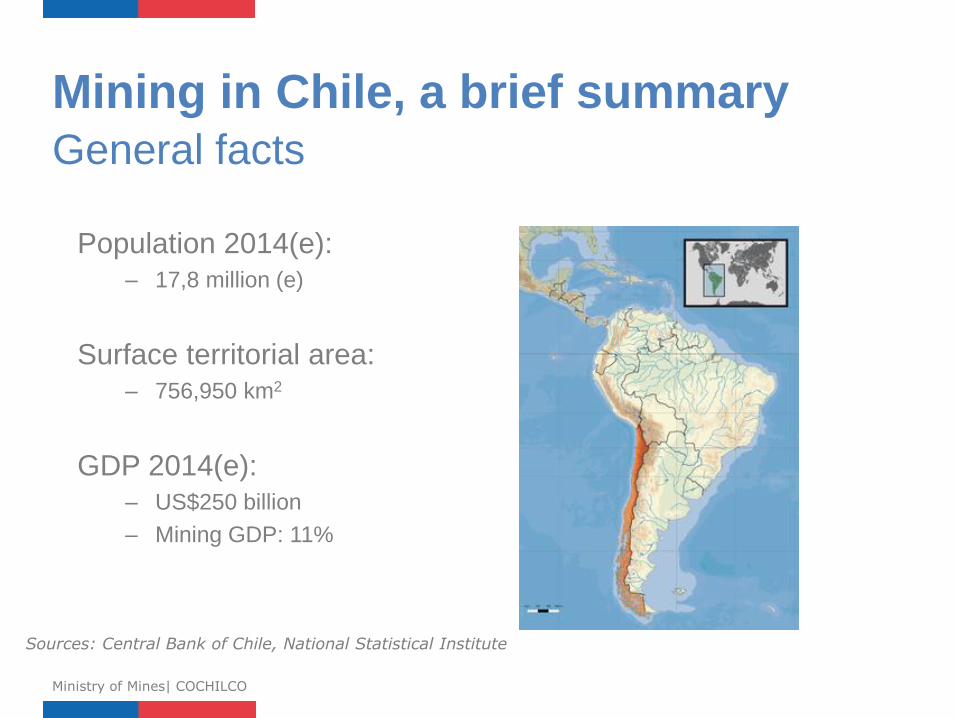
Population 2014(e): – 17,8 million (e)
Surface territorial area: – 756,950 km2
GDP 2014(e): – US$250 billion
– Mining GDP: 11%
Mining in Chile, a brief summary General facts
Ministry of Mines| COCHILCO
Sources: Central Bank of Chile, National Statistical Institute

Mining in Chile, a brief summary Mineral endowment
Ministry of Mines| COCHILCO
Sources: USGS Mineral Commodity Summaries, COCHILCO
Mo
42
95,9
21%
14%
3°
Cu
29
63,5
28% 32%
1°
Au
79
197,0
8% 2%
15°
Ag
47
107,9
14%
5%
7°
Re
75
186,2
52% 52%
1°
Li
3
6,9
58%
35%
1°
Y
53
126,9
24%
61%
1°
Share of world reserves
Share of world production
World production ranking
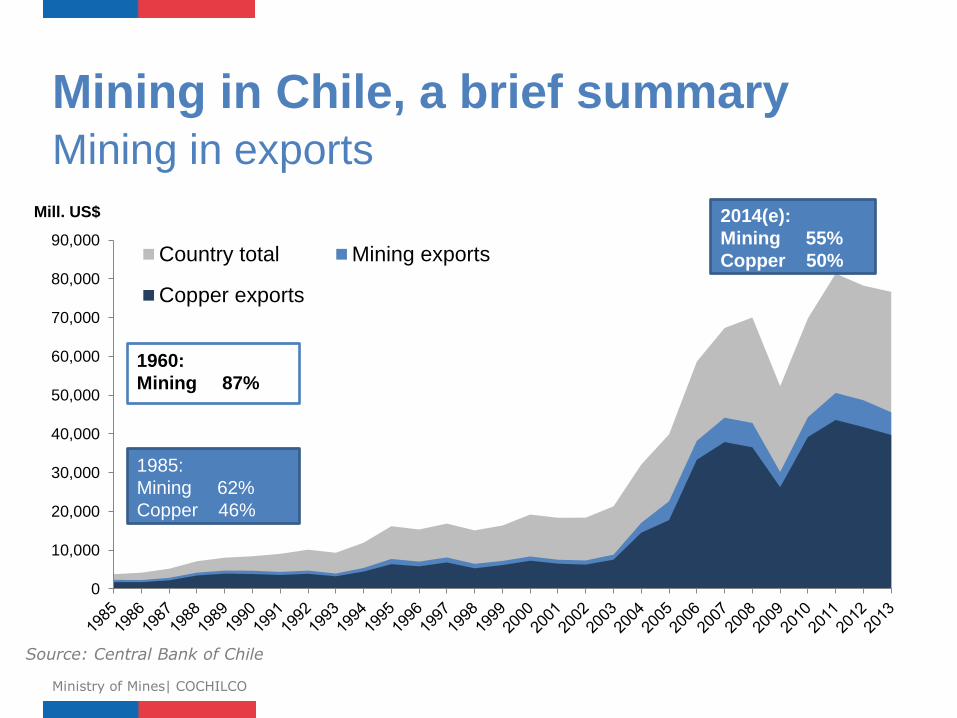
Mining in Chile, a brief summary Mining in exports
Ministry of Mines| COCHILCO
0
10,000
20,000
30,000
40,000
50,000
60,000
70,000
80,000
90,000
Mill. US$
Country total Mining exports
Copper exports
2014(e):
Mining 55%
Copper 50%
1985:
Mining 62%
Copper 46%
1960:
Mining 87%
Source: Central Bank of Chile
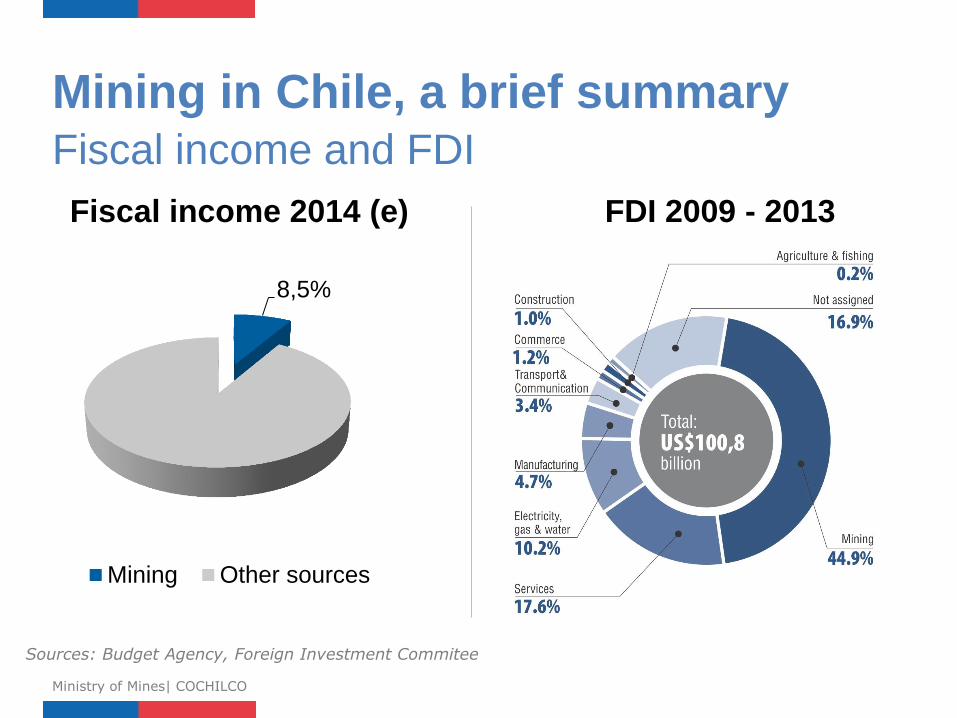
Mining in Chile, a brief summary Fiscal income and FDI
Ministry of Mines| COCHILCO
8,5%
Mining Other sources
Fiscal income 2014 (e)
Sources: Budget Agency, Foreign Investment Commitee
FDI 2009 - 2013
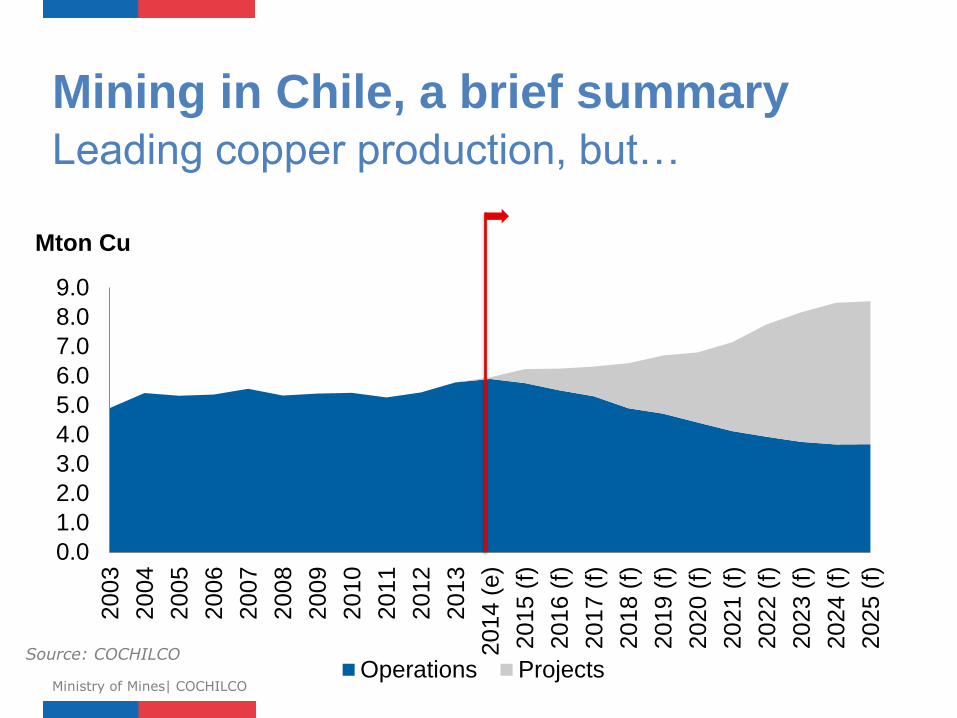
Mining in Chile, a brief summary Leading copper production, but…
Ministry of Mines| COCHILCO
0.0
1.0
2.0
3.0
4.0
5.0
6.0
7.0
8.0
9.0
2003
2004
2005
2006
2007
2008
2009
2010
2011
2012
2013
2014 (
e)
2015 (
f)
2016 (
f)
2017 (
f)
2018 (
f)
2019 (
f)
2020 (
f)
2021 (
f)
20
22
(f)
2023 (
f)
2024 (
f)
2025 (
f)
Mton Cu
Operations ProjectsSource: COCHILCO

Mining in Chile, a brief summary There’s still job to do
Ministry of Mines| COCHILCO
Source: COCHILCO
22%
6%
25%
47%
Mining projects 2014 - 2023 (Mill. US$104.851)
Under construction Probable
Possible Potential
22%
41%
13%
3%
2%
19%
Mining projects 2014 - 2023 (Mill. US$104.851)
State owned Copper Private Copper
Gold and Silver Iron
Industrial minerals Other minerals
Source: COCHILCO
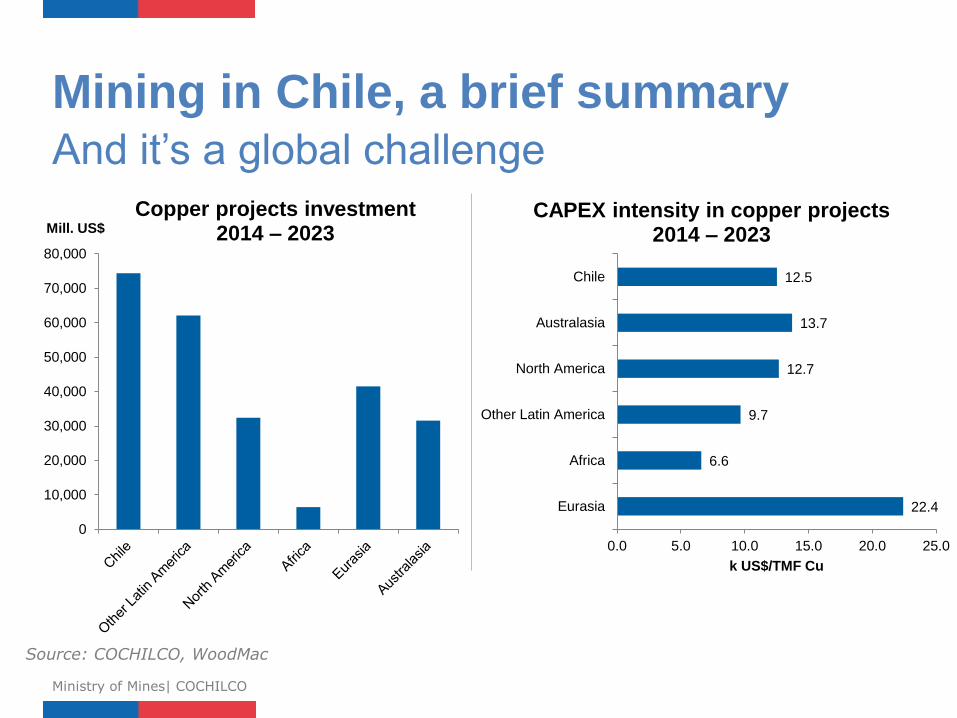
Mining in Chile, a brief summary And it’s a global challenge
Ministry of Mines| COCHILCO
Source: COCHILCO, WoodMac
0
10,000
20,000
30,000
40,000
50,000
60,000
70,000
80,000
Mill. US$
Copper projects investment 2014 – 2023
22.4
6.6
9.7
12.7
13.7
12.5
0.0 5.0 10.0 15.0 20.0 25.0
Eurasia
Africa
Other Latin America
North America
Australasia
Chile
k US$/TMF Cu
CAPEX intensity in copper projects 2014 – 2023
Imagen Referencial
2. Enviromental and social
licenses
Ministry of Mines| COCHILCO
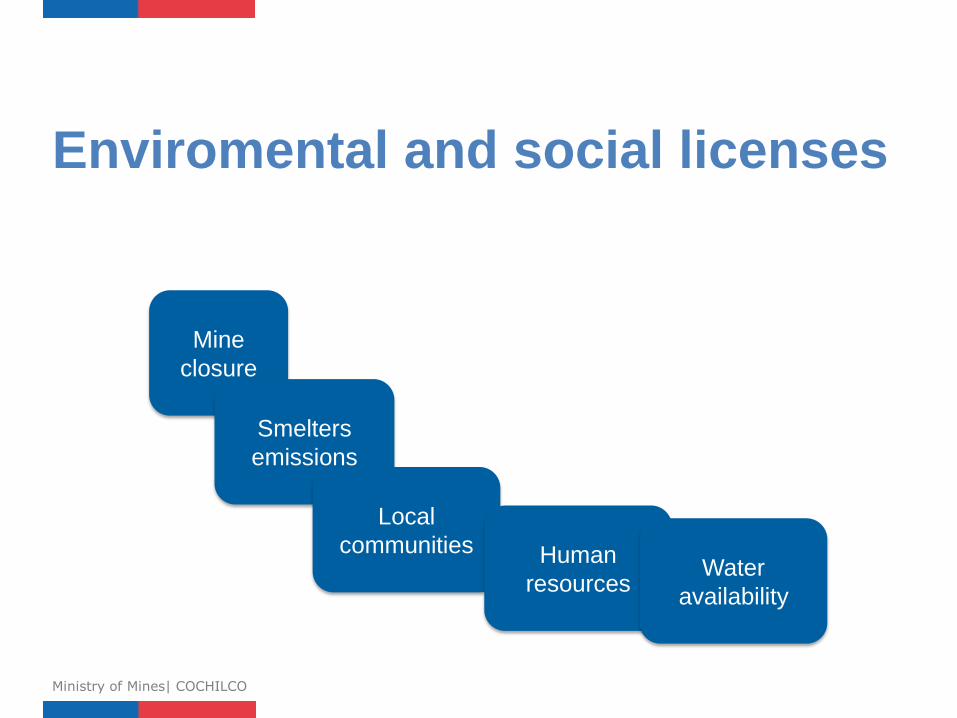
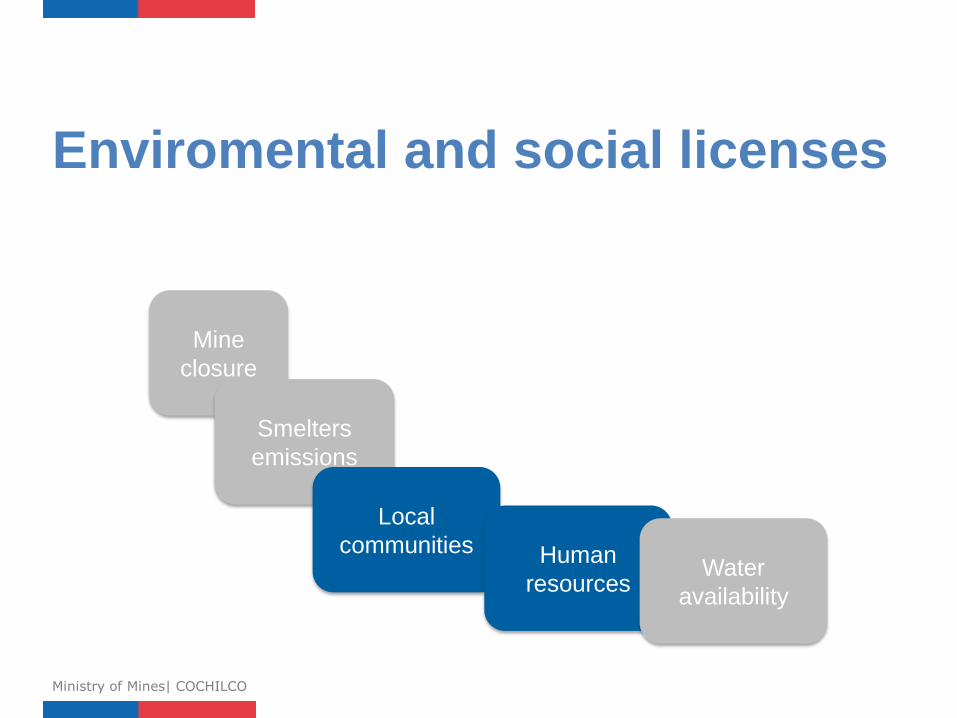
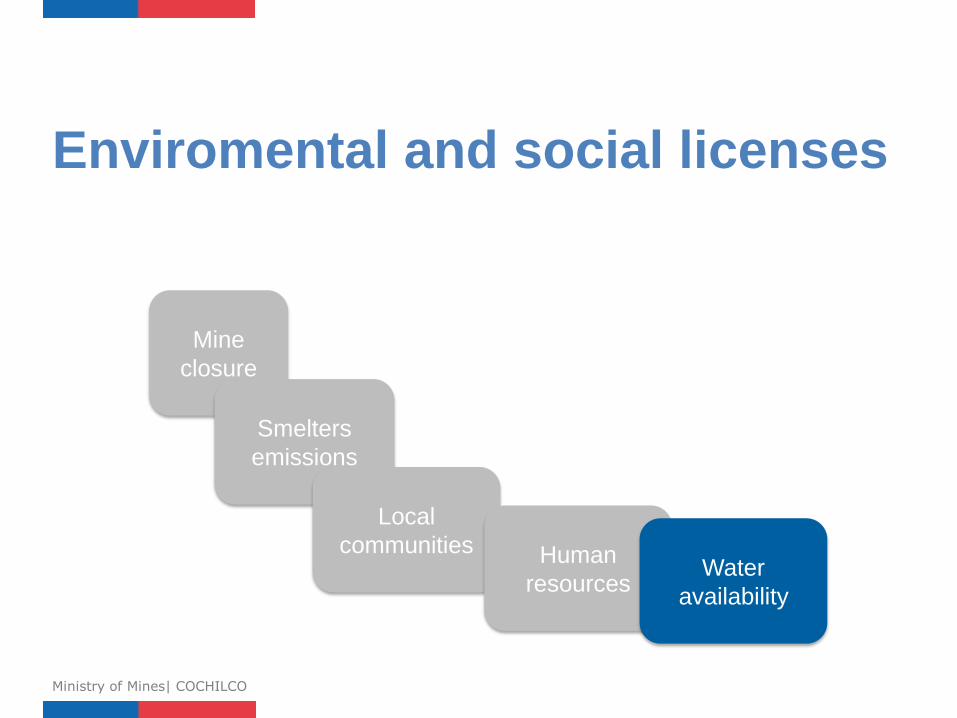
Enviromental and social licenses
Ministry of Mines| COCHILCO
Mine
closure
Smelters
emissions
Local
communities Human
resources Water
availability
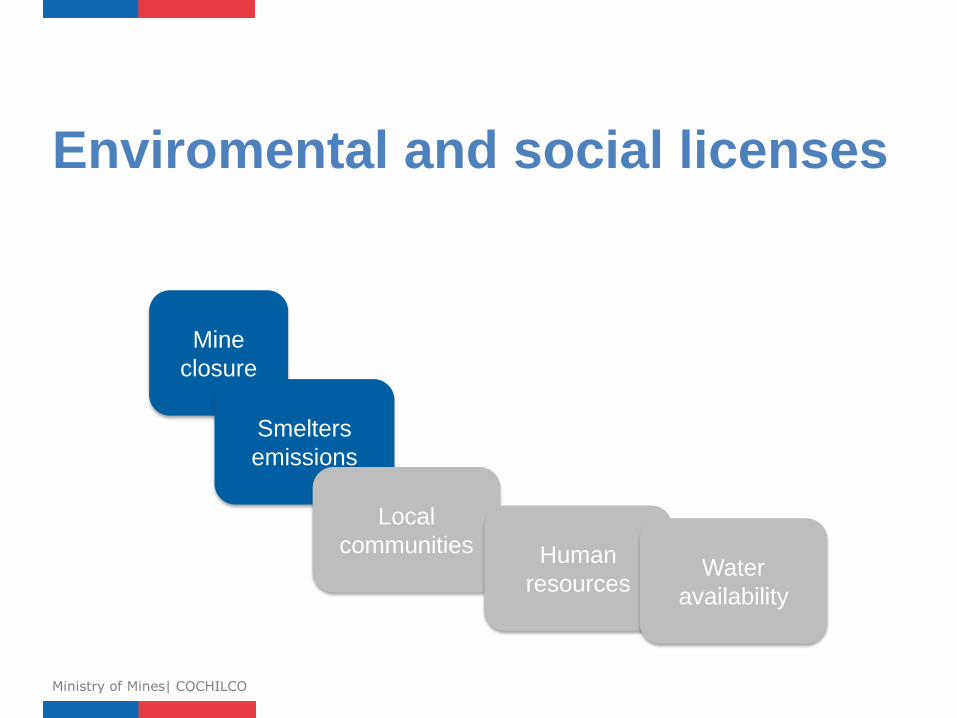
Enviromental and social licenses
Ministry of Mines| COCHILCO
Mine
closure
Smelters
emissions
Local
communities Human
resources Water
availability
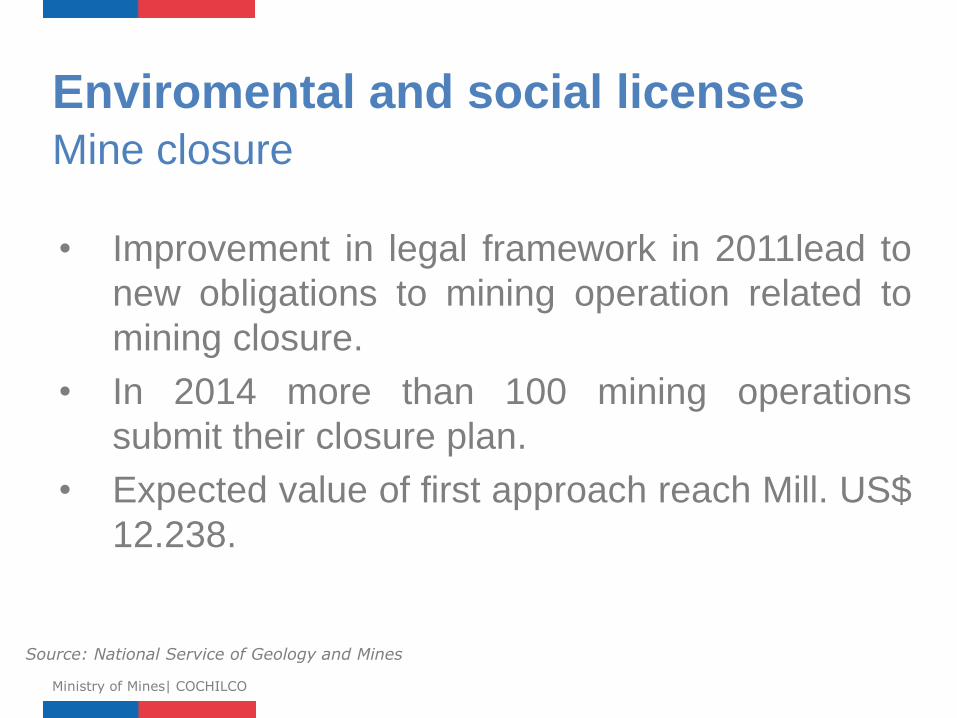
• Improvement in legal framework in 2011lead to
new obligations to mining operation related to
mining closure.
• In 2014 more than 100 mining operations
submit their closure plan.
• Expected value of first approach reach Mill. US$
12.238.
Enviromental and social licenses Mine closure
Ministry of Mines| COCHILCO
Source: National Service of Geology and Mines
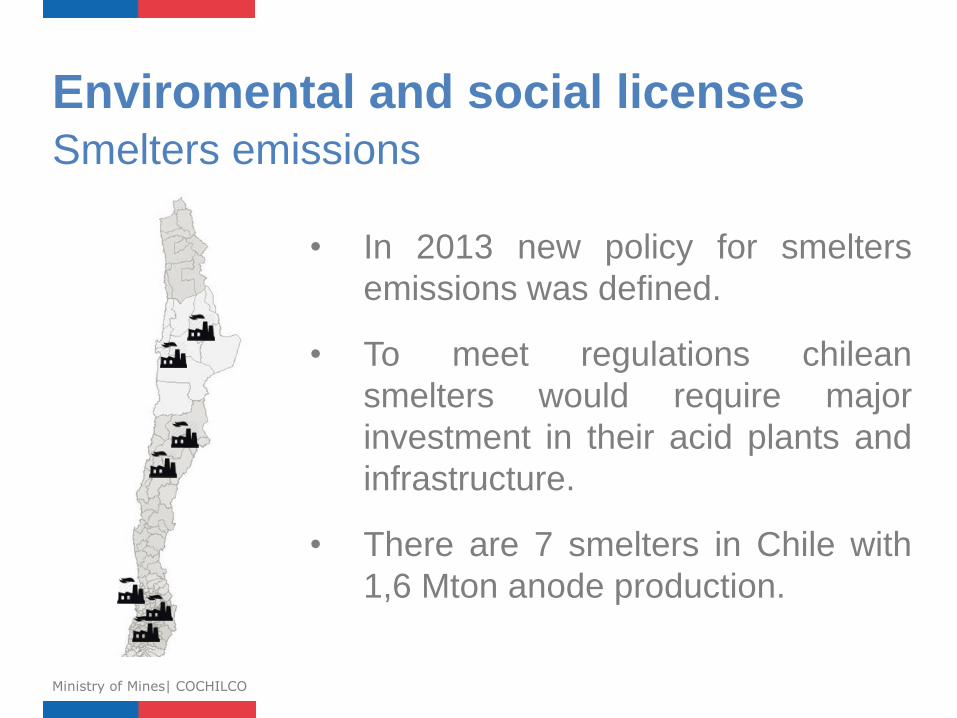
• In 2013 new policy for smelters
emissions was defined.
• To meet regulations chilean
smelters would require major
investment in their acid plants and
infrastructure.
• There are 7 smelters in Chile with
1,6 Mton anode production.
Enviromental and social licenses Smelters emissions
Ministry of Mines| COCHILCO
Enviromental and social licenses
Ministry of Mines| COCHILCO
Mine
closure
Smelters
emissions
Local
communities Human
resources Water
availability
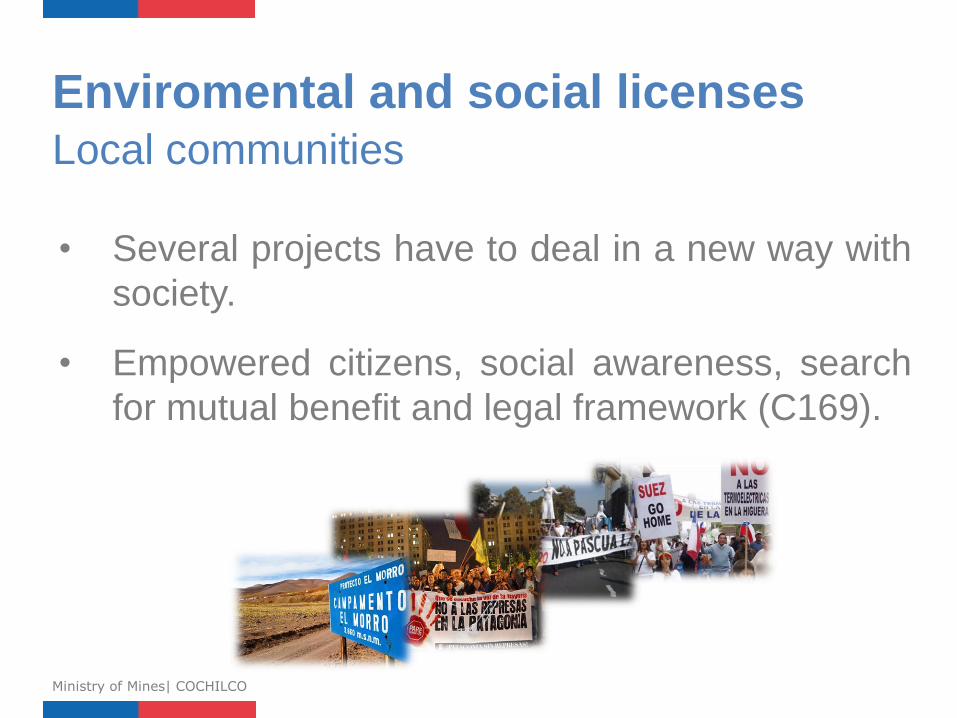
• Several projects have to deal in a new way with
society.
• Empowered citizens, social awareness, search
for mutual benefit and legal framework (C169).
Enviromental and social licenses Local communities
Ministry of Mines| COCHILCO
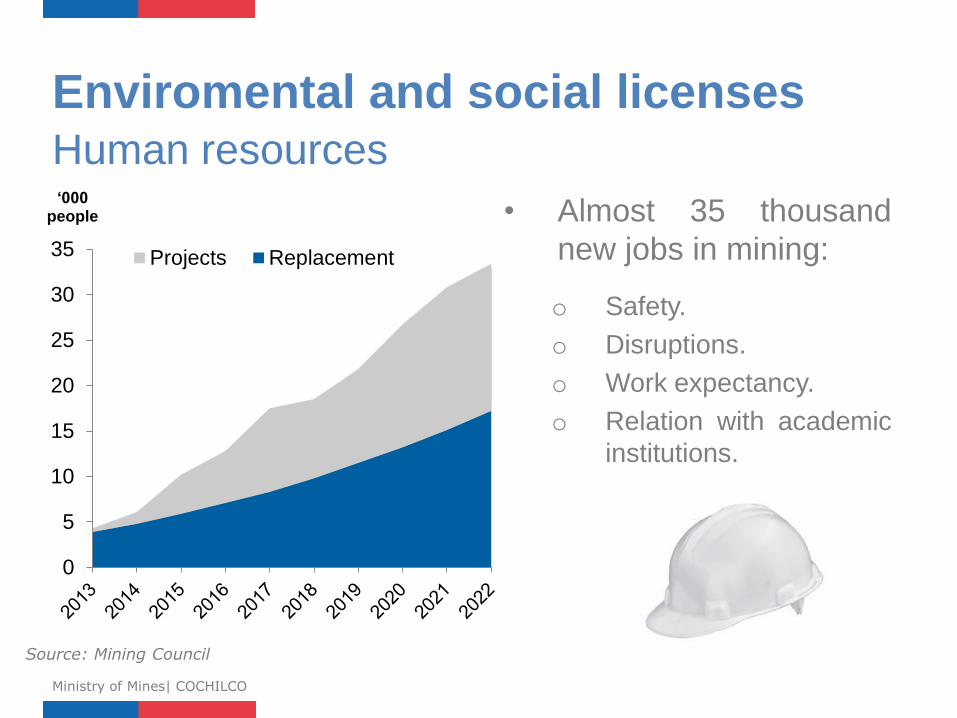
Enviromental and social licenses Human resources
Ministry of Mines| COCHILCO
0
5
10
15
20
25
30
35
‘000 people
Projects Replacement
Source: Mining Council
• Almost 35 thousand
new jobs in mining:
o Safety.
o Disruptions.
o Work expectancy.
o Relation with academic
institutions.
Enviromental and social licenses
Ministry of Mines| COCHILCO
Mine
closure
Smelters
emissions
Local
communities Human
resources Water
availability
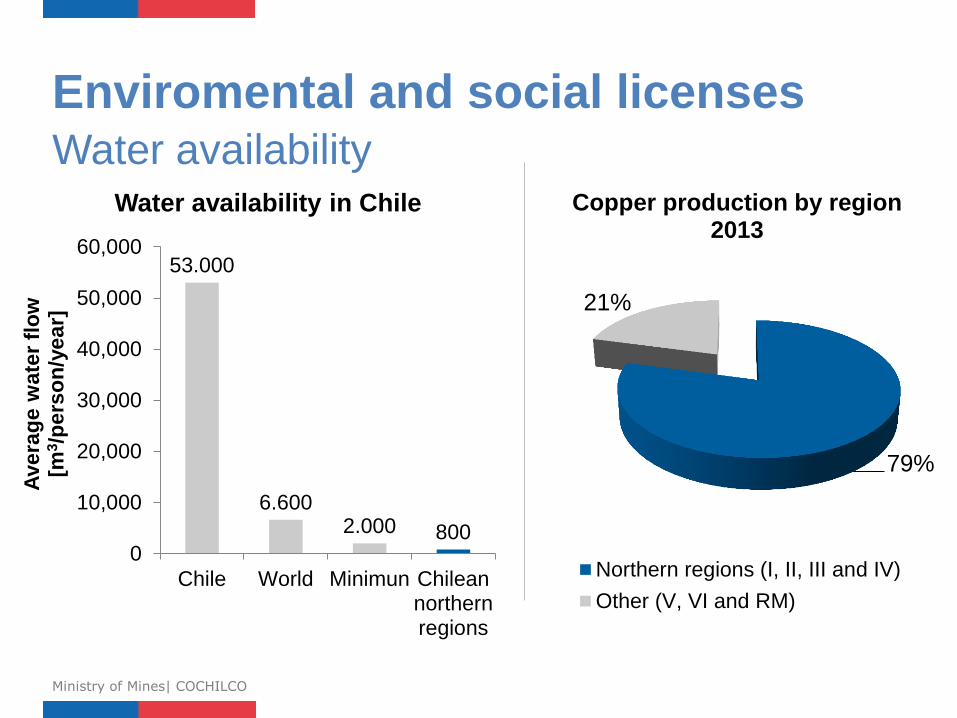
Enviromental and social licenses Water availability
Ministry of Mines| COCHILCO
53.000
6.600 2.000 800
0
10,000
20,000
30,000
40,000
50,000
60,000
Chile World Minimun Chileannorthernregions
Avera
ge
wate
r fl
ow
[m
3/p
ers
on
/ye
ar]
Water availability in Chile
79%
21%
Copper production by region 2013
Northern regions (I, II, III and IV)
Other (V, VI and RM)
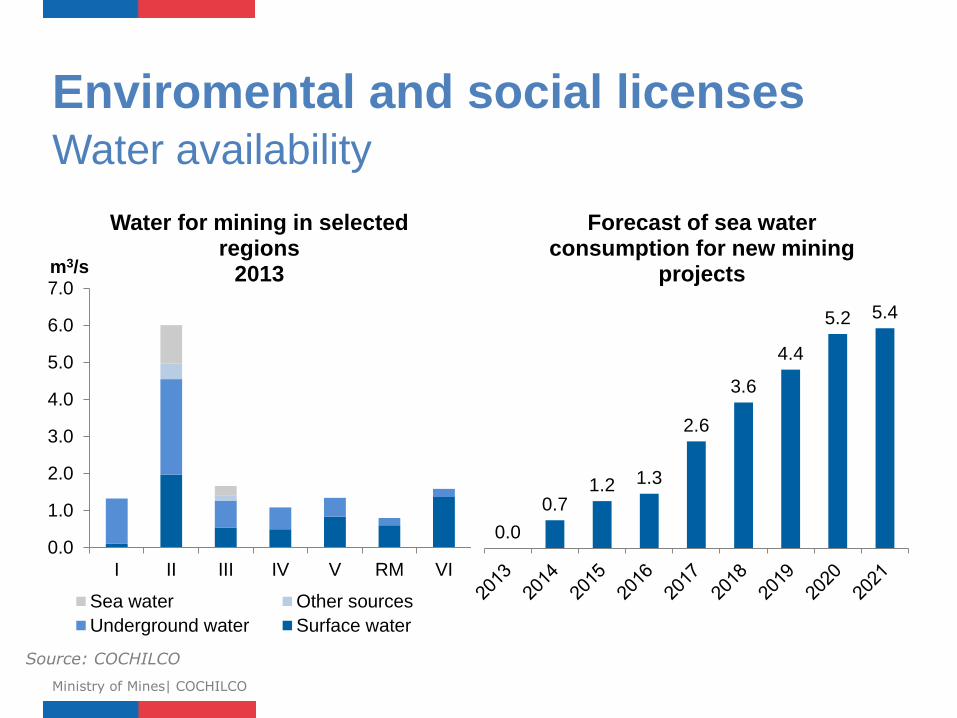
Enviromental and social licenses Water availability
Ministry of Mines| COCHILCO
0.0
0.7 1.2 1.3
2.6
3.6
4.4
5.2 5.4
Forecast of sea water consumption for new mining
projects
0.0
1.0
2.0
3.0
4.0
5.0
6.0
7.0
I II III IV V RM VI
m3/s
千
Water for mining in selected regions
2013
Sea water Other sources
Underground water Surface water
Source: COCHILCO
Imagen Referencial
3. Costs and productivity
challenges
Ministry of Mines| COCHILCO
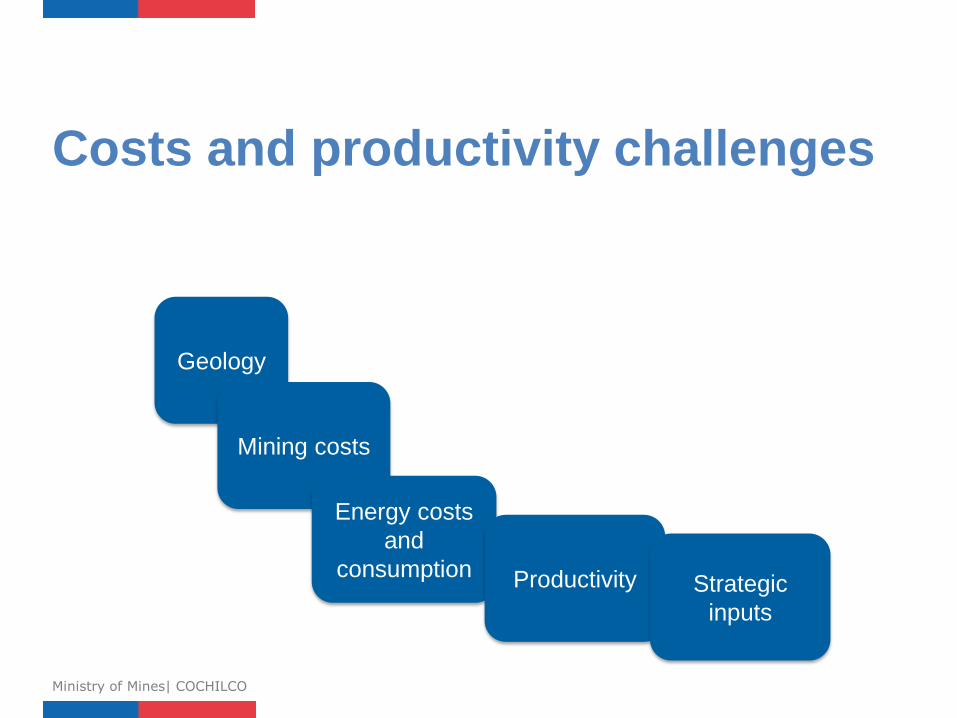
Costs and productivity challenges
Ministry of Mines| COCHILCO
Geology
Mining costs
Energy costs
and
consumption Productivity Strategic
inputs
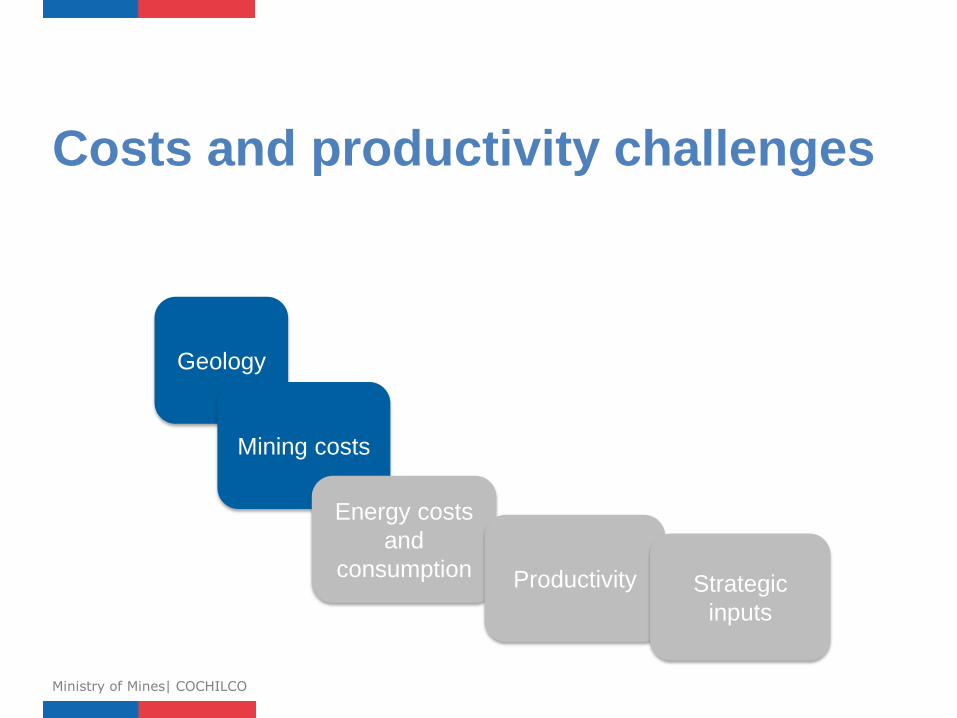
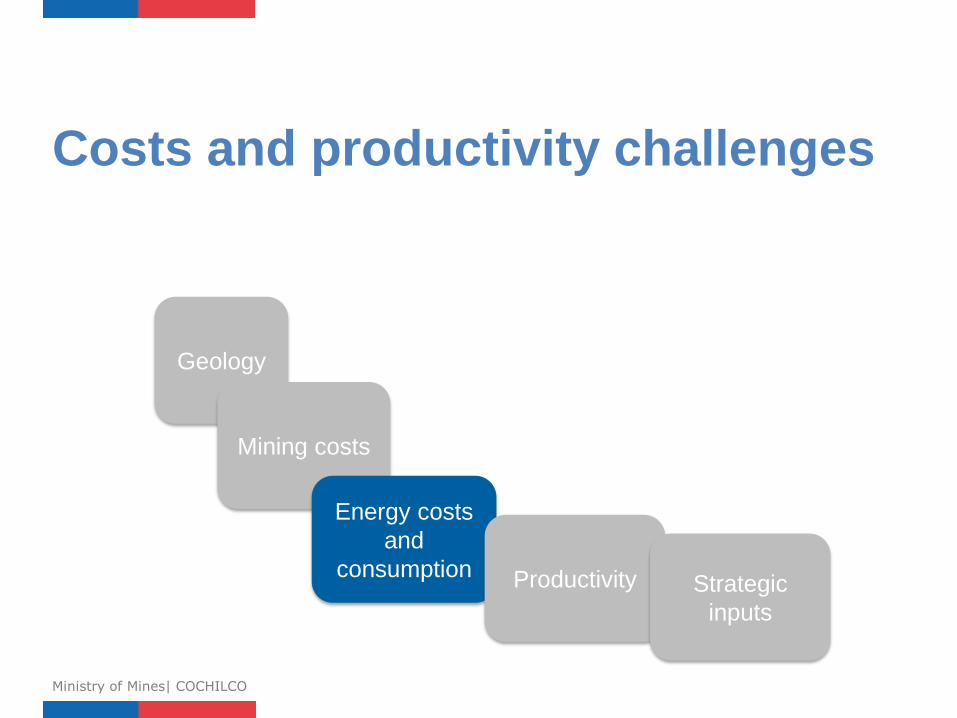
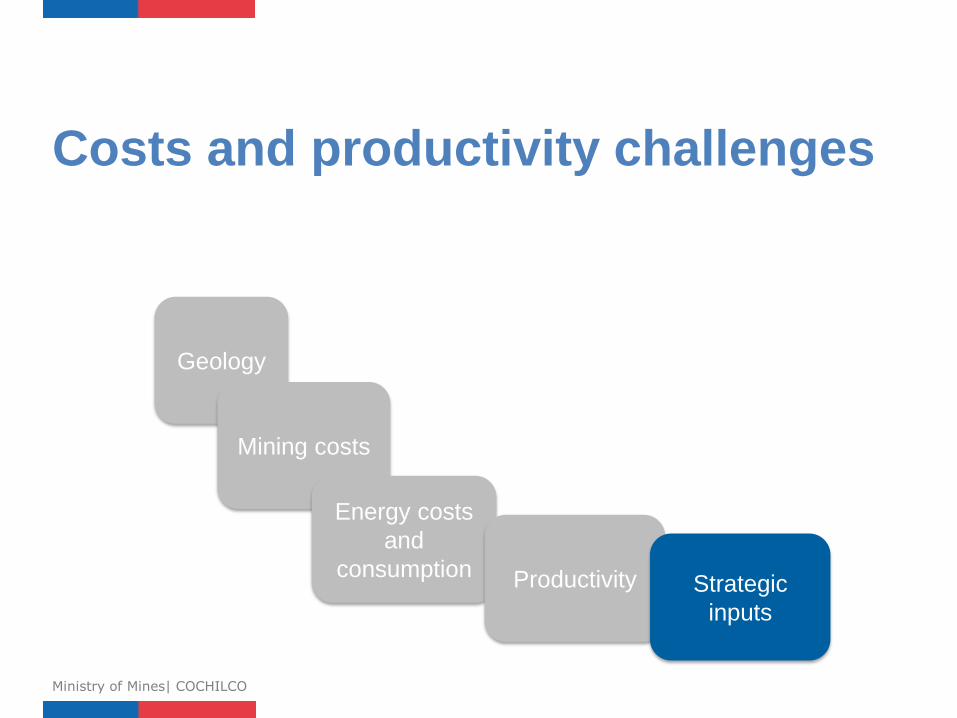
Costs and productivity challenges
Ministry of Mines| COCHILCO
Geology
Mining costs
Energy costs
and
consumption Productivity Strategic
inputs
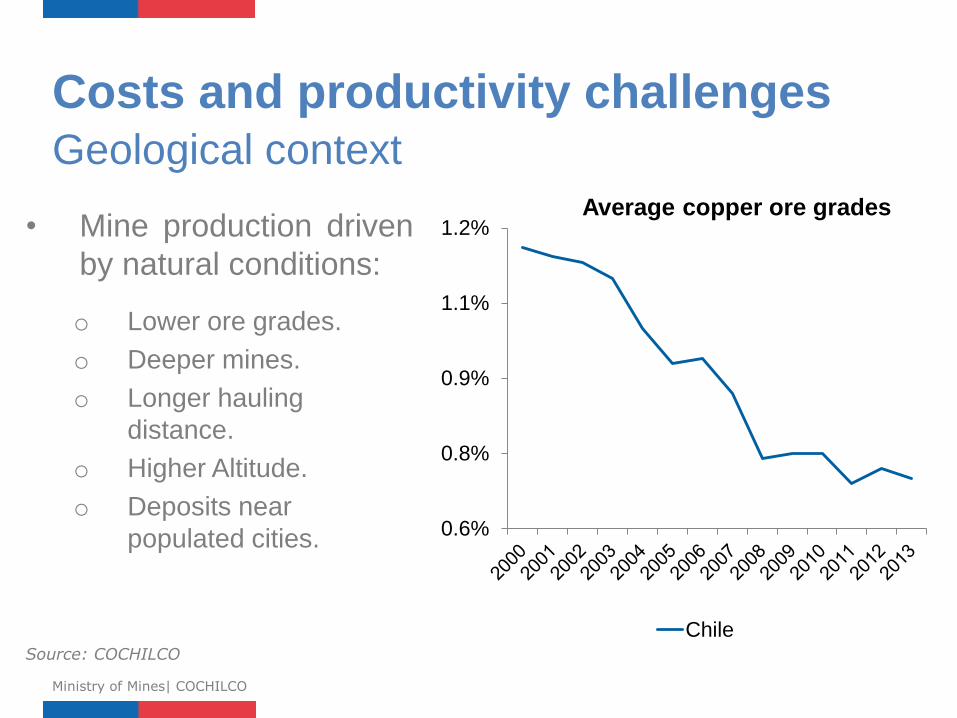
Costs and productivity challenges Geological context
Ministry of Mines| COCHILCO
• Mine production driven
by natural conditions:
o Lower ore grades.
o Deeper mines.
o Longer hauling
distance.
o Higher Altitude.
o Deposits near
populated cities.
Source: COCHILCO
0.6%
0.8%
0.9%
1.1%
1.2%Average copper ore grades
Chile
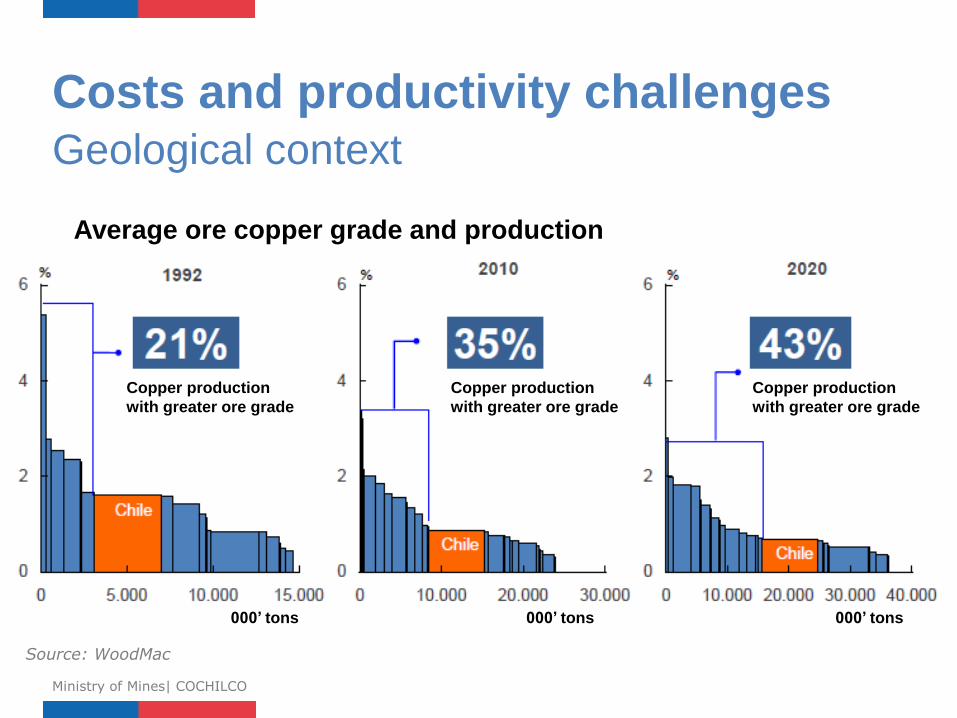
Costs and productivity challenges Geological context
Ministry of Mines| COCHILCO
Source: WoodMac
Average ore copper grade and production
000’ tons 000’ tons 000’ tons
Copper production
with greater ore grade
Copper production
with greater ore grade
Copper production
with greater ore grade
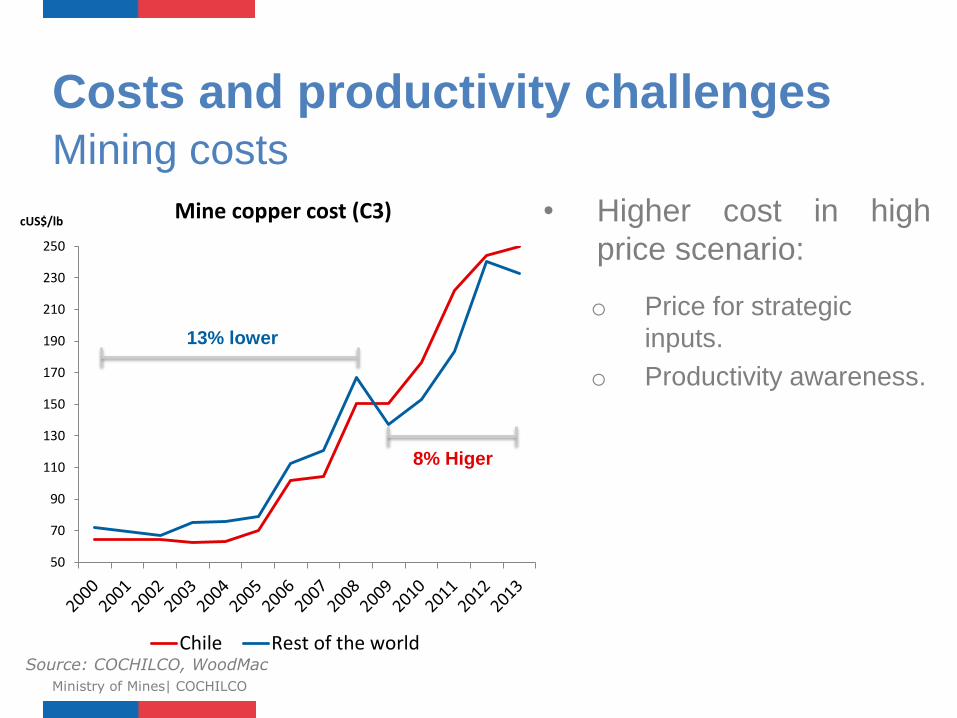
Costs and productivity challenges Mining costs
Ministry of Mines| COCHILCO
• Higher cost in high
price scenario:
o Price for strategic
inputs.
o Productivity awareness.
50
70
90
110
130
150
170
190
210
230
250
cUS$/lb Mine copper cost (C3)
Chile Rest of the world
13% lower
8% Higer
Source: COCHILCO, WoodMac
Costs and productivity challenges
Ministry of Mines| COCHILCO
Geology
Mining costs
Energy costs
and
consumption Productivity Strategic
inputs
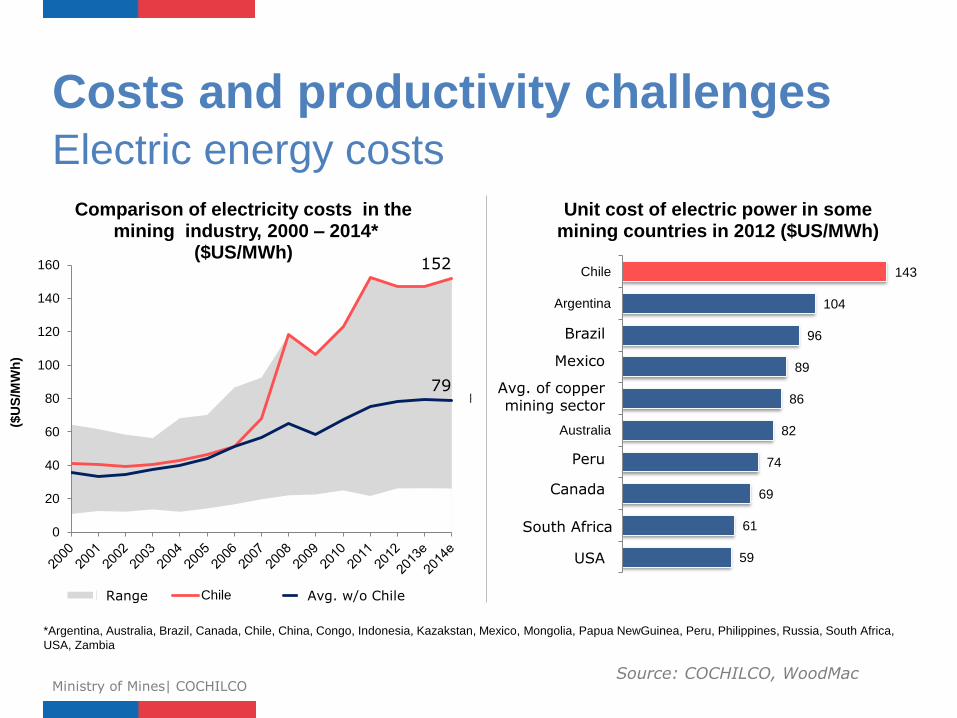
Costs and productivity challenges Electric energy costs
Ministry of Mines| COCHILCO
*Argentina, Australia, Brazil, Canada, Chile, China, Congo, Indonesia, Kazakstan, Mexico, Mongolia, Papua NewGuinea, Peru, Philippines, Russia, South Africa,
USA, Zambia
0
20
40
60
80
100
120
140
160
($U
S/M
Wh
)
Comparison of electricity costs in the mining industry, 2000 – 2014*
($US/MWh)
Max Chile Promedio sin Chile
59
61
69
74
82
86
89
96
104
143
EE.UU.
Sudáfrica
Canadá
Perú
Australia
Prom. Minería de Cobre
México
Brazil
Argentina
Chile
Unit cost of electric power in some mining countries in 2012 ($US/MWh)
Brasil
Avg. w/o Chile
Brazil
Mexico
Avg. of copper mining sector
Peru
Canada
South Africa
USA
Range
79
152
Source: COCHILCO, WoodMac
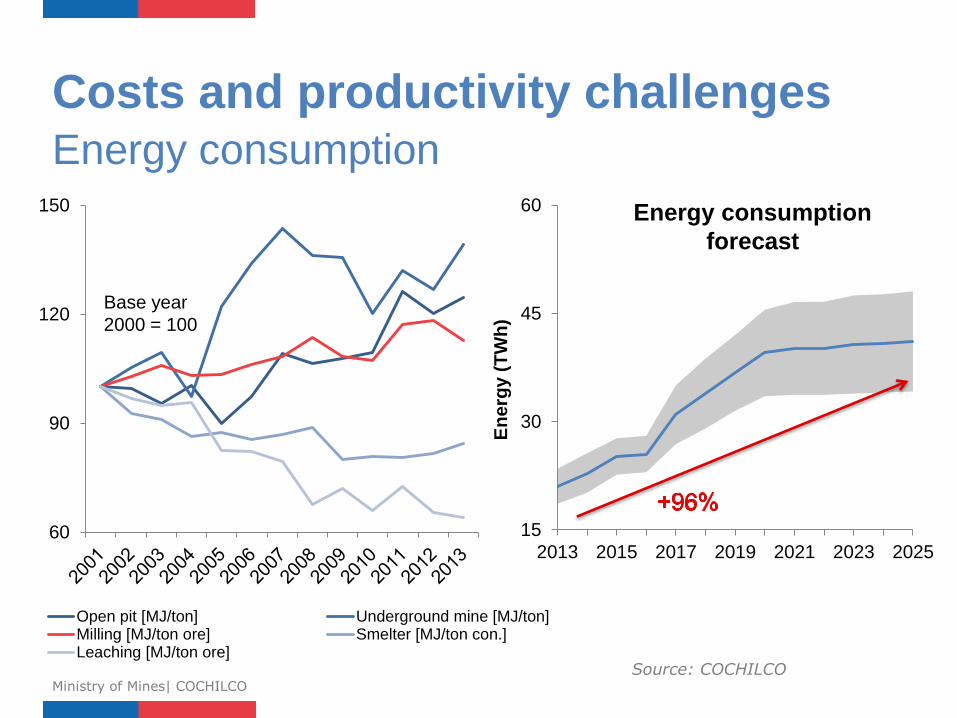
Costs and productivity challenges Energy consumption
Ministry of Mines| COCHILCO
60
90
120
150
Open pit [MJ/ton] Underground mine [MJ/ton]Milling [MJ/ton ore] Smelter [MJ/ton con.]Leaching [MJ/ton ore]
15
30
45
60
2013 2015 2017 2019 2021 2023 2025
En
erg
y (
TW
h)
Source: COCHILCO
Base year
2000 = 100
Energy consumption
forecast
Costs and productivity challenges
Ministry of Mines| COCHILCO
Geology
Mining costs
Energy costs
and
consumption Productivity Strategic
inputs
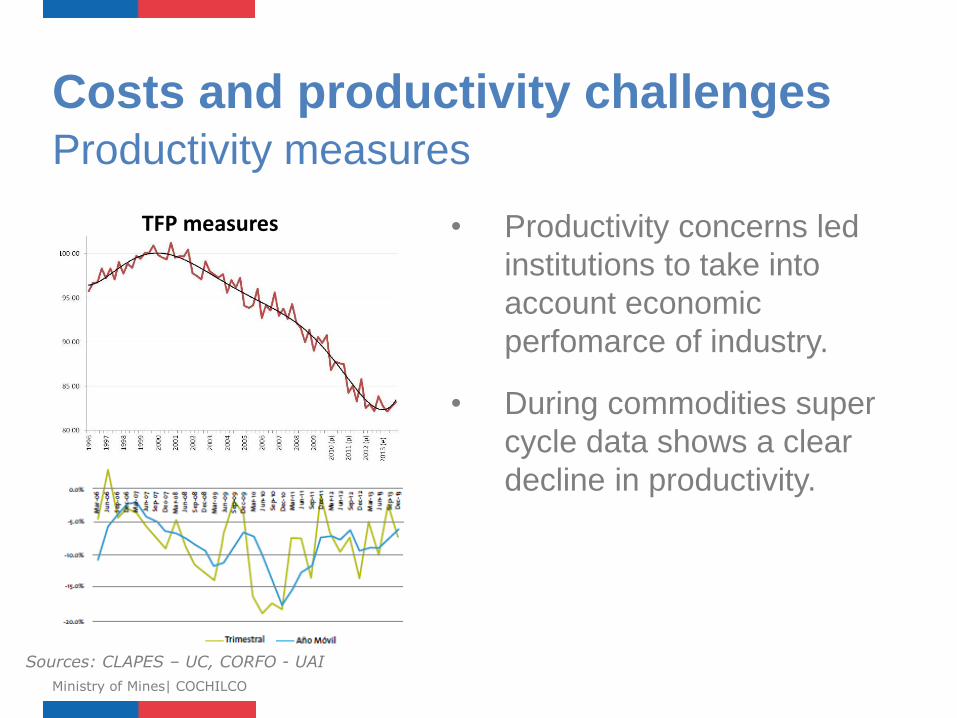
Costs and productivity challenges Productivity measures
Ministry of Mines| COCHILCO
Sources: CLAPES – UC, CORFO - UAI
• Productivity concerns led
institutions to take into
account economic
perfomarce of industry.
• During commodities super
cycle data shows a clear
decline in productivity.
TFP measures
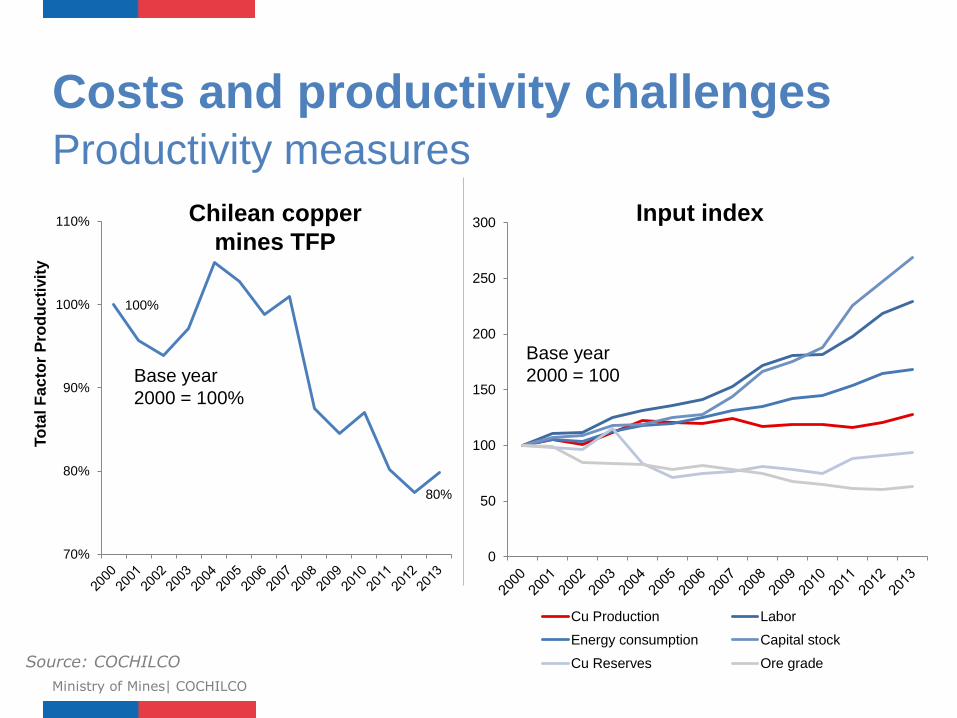
Costs and productivity challenges Productivity measures
Ministry of Mines| COCHILCO
Source: COCHILCO
100%
80%
70%
80%
90%
100%
110%
To
tal F
ac
tor
Pro
du
cti
vit
y
Base year
2000 = 100%
0
50
100
150
200
250
300
Cu Production Labor
Energy consumption Capital stock
Cu Reserves Ore grade
Base year
2000 = 100
Chilean copper
mines TFP
Input index
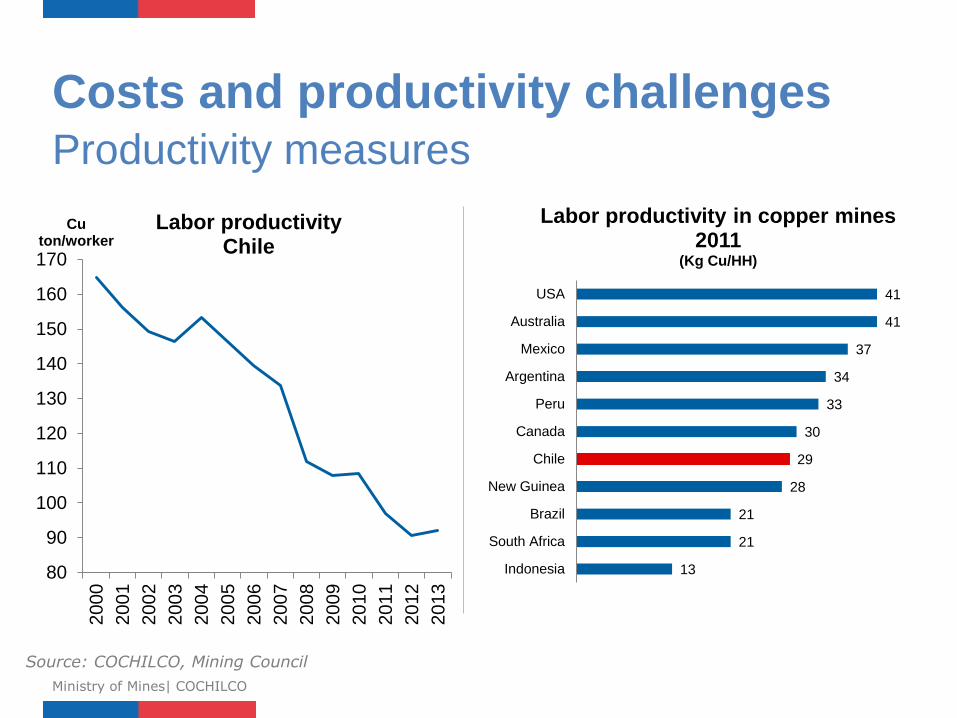
Costs and productivity challenges Productivity measures
Ministry of Mines| COCHILCO
Source: COCHILCO, Mining Council
80
90
100
110
120
130
140
150
160
170
2000
2001
2002
2003
2004
2005
2006
2007
2008
2009
2010
2011
2012
2013
Cu ton/worker
Labor productivity Chile
13
21
21
28
29
30
33
34
37
41
41
Indonesia
South Africa
Brazil
New Guinea
Chile
Canada
Peru
Argentina
Mexico
Australia
USA
Labor productivity in copper mines 2011
(Kg Cu/HH)
Costs and productivity challenges
Ministry of Mines| COCHILCO
Geology
Mining costs
Energy costs
and
consumption Productivity Strategic
inputs
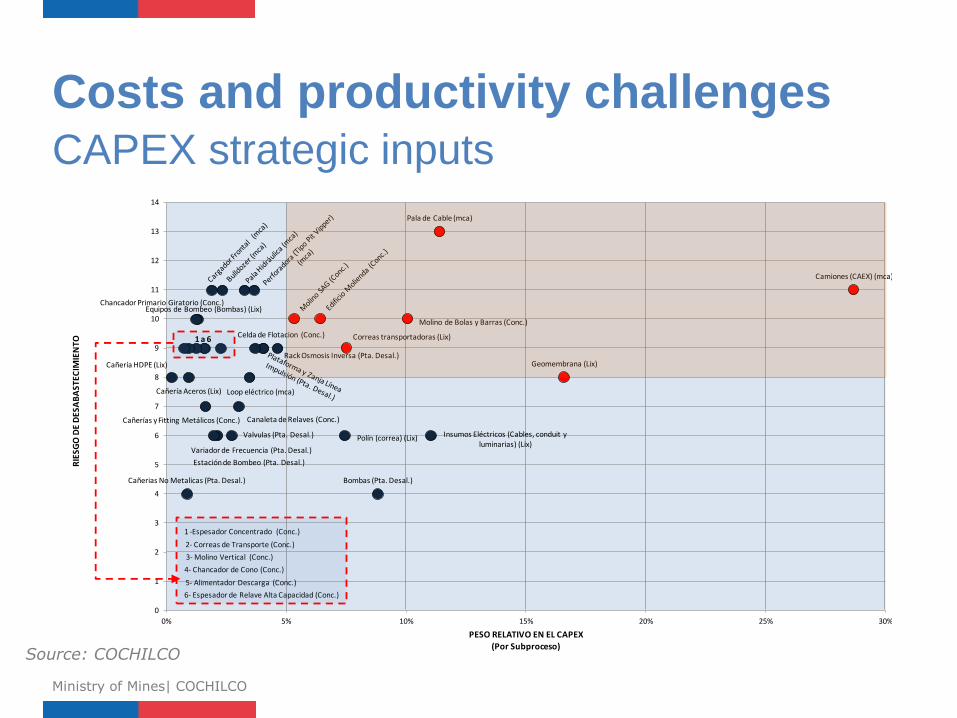
Costs and productivity challenges CAPEX strategic inputs
Ministry of Mines| COCHILCO
Pala de Cable (mca)
Camiones (CAEX) (mca)
Molino de Bolas y Barras (Conc.)
Equipos de Bombeo (Bombas) (Lix)Chancador Primario Giratorio (Conc.)
Correas transportadoras (Lix)
Rack Osmosis Inversa (Pta. Desal.)
Celda de Flotacion (Conc.)
6- Espesador de Relave Alta Capacidad (Conc.)
5- Alimentador Descarga (Conc.)
4- Chancador de Cono (Conc.)
3- Molino Vertical (Conc.)
2- Correas de Transporte (Conc.)
1 -Espesador Concentrado (Conc.)
Geomembrana (Lix)
Loop eléctrico (mca)Cañería Aceros (Lix)
Cañería HDPE (Lix)
Canaleta de Relaves (Conc.)Cañerías y Fitting Metálicos (Conc.)
Insumos Eléctricos (Cables, conduit y luminarias) (Lix)
Polín (correa) (Lix)Valvulas (Pta. Desal.)
Estación de Bombeo (Pta. Desal.)
Variador de Frecuencia (Pta. Desal.)
Bombas (Pta. Desal.)Cañerias No Metalicas (Pta. Desal.)
0
1
2
3
4
5
6
7
8
9
10
11
12
13
14
0% 5% 10% 15% 20% 25% 30%
RIE
SGO
DE
DES
AB
AST
ECIM
IEN
TO
PESO RELATIVO EN EL CAPEX
(Por Subproceso)
1 a 6
Source: COCHILCO
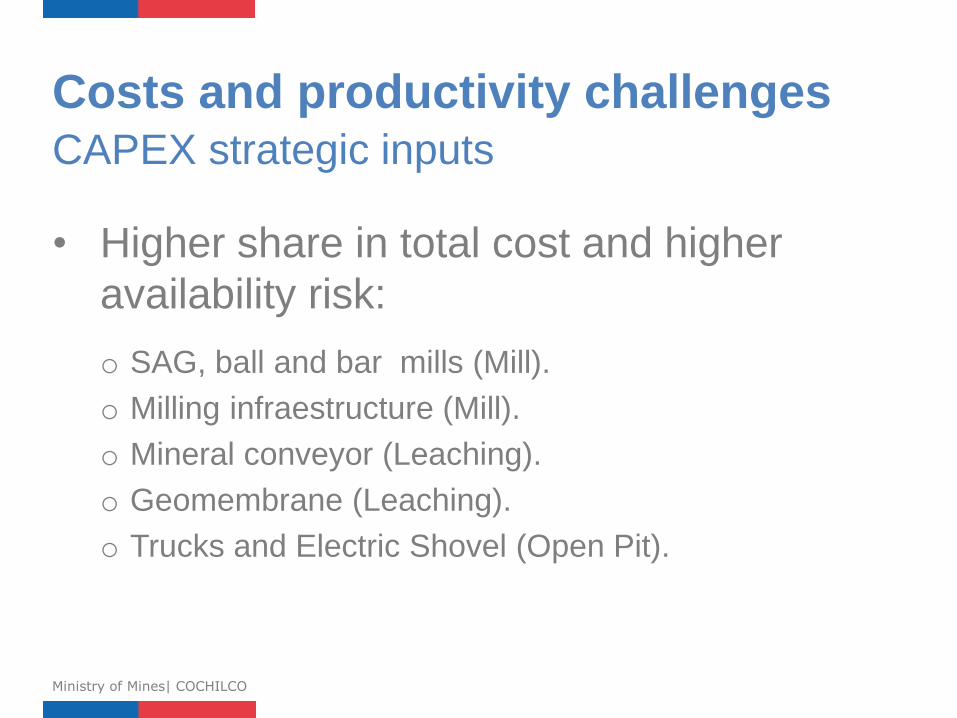
Costs and productivity challenges CAPEX strategic inputs
Ministry of Mines| COCHILCO
• Higher share in total cost and higher
availability risk:
o SAG, ball and bar mills (Mill).
o Milling infraestructure (Mill).
o Mineral conveyor (Leaching).
o Geomembrane (Leaching).
o Trucks and Electric Shovel (Open Pit).
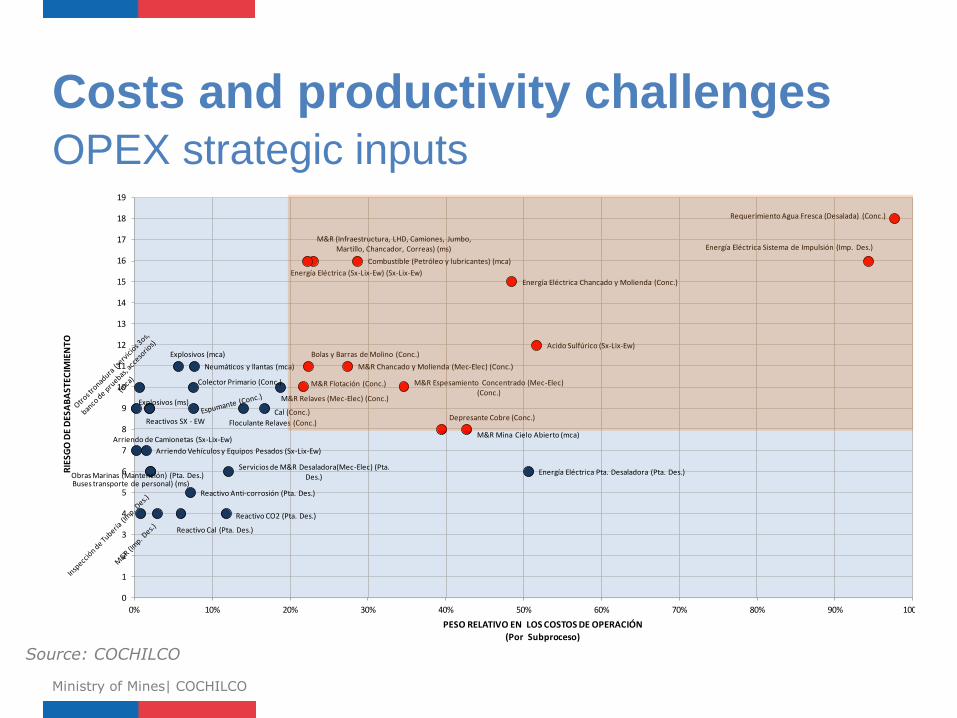
Costs and productivity challenges OPEX strategic inputs
Ministry of Mines| COCHILCO
Source: COCHILCO
Requerimiento Agua Fresca (Desalada) (Conc.)
Energía Eléctrica Sistema de Impulsión (Imp. Des.)
Combustible (Petróleo y lubricantes) (mca)
M&R (Infraestructura, LHD, Camiones, Jumbo, Martillo, Chancador, Correas) (ms)
Energía Eléctrica (Sx-Lix-Ew) (Sx-Lix-Ew)Energía Eléctrica Chancado y Molienda (Conc.)
Acido Sulfúrico (Sx-Lix-Ew)
M&R Chancado y Molienda (Mec-Elec) (Conc.)
Bolas y Barras de Molino (Conc.)
Neumáticos y llantas (mca)
Explosivos (mca)
M&R Espesamiento Concentrado (Mec-Elec) (Conc.)
M&R Flotación (Conc.)
M&R Relaves (Mec-Elec) (Conc.)
Colector Primario (Conc.)
Cal (Conc.)
Floculante Relaves (Conc.)Reactivos SX - EW
Explosivos (ms)
M&R Mina Cielo Abierto (mca)
Depresante Cobre (Conc.)
Arriendo Vehículos y Equipos Pesados (Sx-Lix-Ew)
Arriendo de Camionetas (Sx-Lix-Ew)
Energía Eléctrica Pta. Desaladora (Pta. Des.)Servicios de M&R Desaladora(Mec-Elec) (Pta.
Des.)Obras Marinas (Mantención) (Pta. Des.)Buses transporte de personal) (ms)
Reactivo Anti-corrosión (Pta. Des.)
Reactivo CO2 (Pta. Des.)
Reactivo Cal (Pta. Des.)
0
1
2
3
4
5
6
7
8
9
10
11
12
13
14
15
16
17
18
19
0% 10% 20% 30% 40% 50% 60% 70% 80% 90% 100%
RIE
SGO
DE
DES
AB
AST
ECIM
IEN
TO
PESO RELATIVO EN LOS COSTOS DE OPERACIÓN(Por Subproceso)
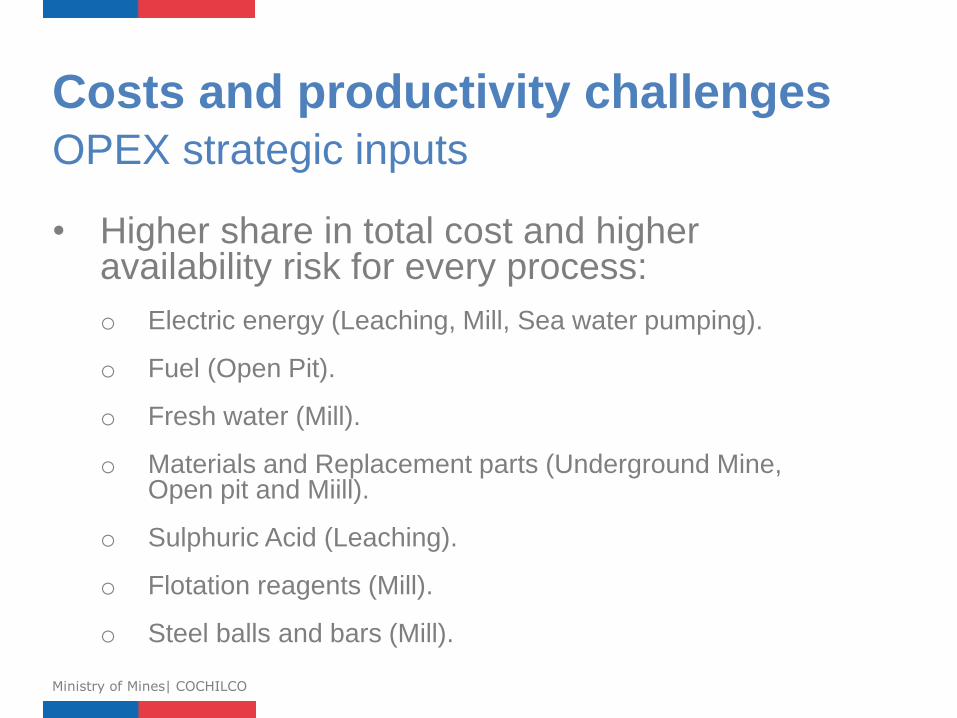
Costs and productivity challenges OPEX strategic inputs
Ministry of Mines| COCHILCO
• Higher share in total cost and higher availability risk for every process:
o Electric energy (Leaching, Mill, Sea water pumping).
o Fuel (Open Pit).
o Fresh water (Mill).
o Materials and Replacement parts (Underground Mine, Open pit and Miill).
o Sulphuric Acid (Leaching).
o Flotation reagents (Mill).
o Steel balls and bars (Mill).
Imagen Referencial
4. Final comments
Ministry of Mines| COCHILCO
• Chile has been recognized as a major center for
mining investment.
• Mineral endowment and projects support mining
production forecasting.
• Challenges arise from several interacting factors:
o Enviromental.
o Local communities
o Productivity.
o Costs
Final comments
Ministry of Mines| COCHILCO
• Lower grades and other natural conditions of
deposits encourage the need to sustain mining
development.
• Technology, innovation, changes in processes,
community relation models and costs restraints
are leading efforts of mining activity in Chile.
Final comments
Ministry of Mines| COCHILCO

Logo Gobierno: 160x162px. Ministerio, Subsecretaría, Organismo, etc.:160x145px
Facing the challenge of a new age:
Chile and mining in the 21st century
COCHILCO – Chilean Copper Commission
Jorge Cantallopts Research Department
Juanuary 20th, 2015