Experimental Conditions and Mathematical Analysis of ......graphical presentation of kinetic data...
28
15 Experimental Conditions and Mathematical Analysis of Kinetic Measurements Using Flow Cytometry – The FacsKin Method Ambrus Kaposi 1 , Gergely Toldi 1 , Gergő Mészáros 1 , Balázs Szalay 2 , Gábor Veress 3 and Barna Vásárhelyi 2,4 1 First Department of Pediatrics, Semmelweis University 2 Department of Laboratory Medicine, Semmelweis University 3 Analytix Ltd. 4 Research Group of Pediatrics and Nephrology, Hungarian Academy of Sciences Hungary 1. Introduction Flow cytometry is in use for the assessment of different cell subsets' prevalence for decades. However, the development of specific dyes sensitive for the quickly changing intracellular analytes provided an opportunity for the real-time monitoring of intracellular processes with flow cytometry. In these kinetic measurements additionally to cell prevalence values the time as a novel variable is introduced. This enables researchers to gather data on cellular functionality from a new perspective, as the recording of a kinetic parameter with flow cytometry provides information on intracellular processes in several cell subtypes in a simultaneous manner, where physiological cell-cell interactions (such as cytokines) are still present. This approach may be a useful tool in many different areas of immune research. However, the mathematical formulae to characterize the several millions of data recorded during one measurement are still missing. During past year our team made efforts to develop algorithms to extract the biologically relevant information from these measurements. 2. Possible ways of analysis of kinetic data obtained with flow cytometry We define here the term ’kinetic measurement’ as when the distribution of a parameter measured varies over time (Figure 1). For commonly used parameters (like FSC, SSC and most fluorescent parameters) this does not apply in general and just simply observing the distribution of these parameters regardless of the time parameter is suitable for statistical comparisons of different measurements. For the description and comparison of kinetic measurements however approaches different from the standard ones should be taken. Table 1 shows a review of the analytical methods already reported in papers on kinetic flow cytometric measurements. www.intechopen.com
Transcript of Experimental Conditions and Mathematical Analysis of ......graphical presentation of kinetic data...

15
Experimental Conditions and Mathematical Analysis of Kinetic Measurements Using
Flow Cytometry – The FacsKin Method
Ambrus Kaposi1, Gergely Toldi1, Gergő Mészáros1, Balázs Szalay2, Gábor Veress3 and Barna Vásárhelyi2,4
1First Department of Pediatrics, Semmelweis University 2Department of Laboratory Medicine, Semmelweis University
3Analytix Ltd. 4Research Group of Pediatrics and Nephrology, Hungarian Academy of Sciences
Hungary
1. Introduction
Flow cytometry is in use for the assessment of different cell subsets' prevalence for decades. However, the development of specific dyes sensitive for the quickly changing intracellular analytes provided an opportunity for the real-time monitoring of intracellular processes with flow cytometry. In these kinetic measurements additionally to cell prevalence values the time as a novel variable is introduced. This enables researchers to gather data on cellular functionality from a new perspective, as the recording of a kinetic parameter with flow cytometry provides information on intracellular processes in several cell subtypes in a simultaneous manner, where physiological cell-cell interactions (such as cytokines) are still present. This approach may be a useful tool in many different areas of immune research. However, the mathematical formulae to characterize the several millions of data recorded during one measurement are still missing.
During past year our team made efforts to develop algorithms to extract the biologically relevant information from these measurements.
2. Possible ways of analysis of kinetic data obtained with flow cytometry
We define here the term ’kinetic measurement’ as when the distribution of a parameter measured varies over time (Figure 1). For commonly used parameters (like FSC, SSC and most fluorescent parameters) this does not apply in general and just simply observing the distribution of these parameters regardless of the time parameter is suitable for statistical comparisons of different measurements. For the description and comparison of kinetic measurements however approaches different from the standard ones should be taken. Table 1 shows a review of the analytical methods already reported in papers on kinetic flow cytometric measurements.
www.intechopen.com
Flow Cytometry – Recent Perspectives
300
2.1 Dot plot
The simplest way of presenting kinetic information is using a scatter plot (or dot plot) with time parameter and measured analyte on axis x and y, respectively, when each dot represents an individual cell. This approach and variants such as density plot (Figure 1, left), contour plot or 3D densitiy plot (June et al., 1986) are widely used (Table 1). The careful selection of cutoff values enables users to compare measurements qualitatively. The use of this technique is limited by its subjective nature. It does not provide data about the magnitude or shape of the kinetic process either.
2.2 Smoothing method
A more complex approach is to average the kinetic parameter at given small time intervals and to replace the dots in the scatter plot with these averaged values (red or green curves on Figure 1, left). This approach replaces the distribution of the kinetic parameter at each different time interval with one average value calculated from that distribution (red or green lines on Figure 1, right). Another way of explaining this method is that it is essentially a smoothing of the spiked curve that goes through all the dots in the scatter plot. There are several averaging methods that could be used: mean (used in Omann et al., 1990; Lund-Johansen et al., 1992; Rijkers et al., 1993; do Céu Monteiro et al., 1999; Jakubczak et al., 2006; Schepers et al., 2009), geometric mean (Bailey et al., 2006), median (Szalay et al., 2012). The mean is sensitive to outliers and is suitable for the characterization of a normal distribution. The median separates the lower and upper 50% range of the data.
There are also different approaches to define time intervals where the averaging takes place. These include partitioning the whole time-frame into intervals of the same length (used in the method described in Section 3); partitioning the whole time-frame into intervals all containing the same number of cells; having a fixed-length time-frame and shifting it through the whole measurement and calculating the average in these (overlapping) intervals (moving average, used in Rijkers et al., 1993, Bailey et al., 2006); using local regression (lowess method, published in (Cleveland, 1979), used in (Szalay et al., 2012)); using cubic splines etc.
The result of a smoothing method is a curve describing the measurement. If one has more measurements from the same type these curves can be averaged. A curve is an easy way to understand the graphical representation of a measurement and it shows information on how a hypothetical “average” cell behaves during the measurement. When using median as averaging method 50% of the cells showed a kinetic reaction that was higher than that of the “average” cell and 50% of the cells showed a lower reaction1.
Furthermore, different parameters with possible biological meaning can be calculated (or simply read) from the curve such as maximum (highest value), time to reach maximum, maximal slope, value at given time points, slope at given time points, AUC (area under curve) etc. Note that these calculated parameters differ from the parameters that would be recorded during the measurement for each cell: from a single measurement one can only derive a single value for each such calculated parameter. It is possible to compare the
1 The precise mathematical formulation of “higher” and “lower” in this sense is not within the scope of this chapter.
www.intechopen.com

Exp
erim
en
tal C
on
ditio
ns a
nd
Ma
the
ma
tica
l An
aly
sis
of
Kin
etic
Me
asu
rem
en
ts U
sin
g F
low
Cyto
me
try –
Th
e F
acsK
in M
eth
od
301
reference investigated cell types
dyes used software used
graphical presentation of kinetic data
standardization against
averaging method
parameters calculated
statistical comparison
June et al., 1986
lymphocytes Indo-1 3D intensity against time density plot mean instensity in 100 equal-length time intervals % of responding cells in 100 equal-length time intervals
first part Mean time to 50% maximal response % of responding cells
-
Omann et al., 1990
leukocytes Fluo-3 BD Chronys
mean intensity of 2 s intervals with 8 s gaps against time
previous calibration of [Ca2+]
Mean intensity 10 s after stimulation
-
Lund-Johansen et al., 1992
monocytes, leukocytes
Fura-Red Cyclops (Cytomation Inc)
intensity against time scatter plot
first 40 s Mean intensity at a given time point
t-test
1990, Norgauer et al., 1993
neutrophils Fluo-3, Indo-1 histogram of intensity values before and 10 s after stimulation smoothed [Ca2+] against time averaged [Ca2+] at 10 s time points
previous calibration of [Ca2+]
mean (?) intensity 10 s after stimulation maximal intensity
-
Rijkers et al., 1993
lymphocytes Fluo-3, SNARF-1 (Ca2+), Mag-indo-1 (Mg2+)
intensity against time scatter plot moving mean of instensity against time
? mean maximal intensity
-
do Céu Monteiro et al., 1999
platelets Fluo-3 EPICS XL-MCL, System II software
intensity against time scatter plot mean intensity every 25 s
first 20 s mean maximal intensity
?
T
able 1. (continues on next p
age) Analysis m
ethods u
sed in a selection of articles p
ublishing
results of kinetic flow
cytometric m
easurem
ents. Inten
sity refers to the fluorescent intensity
value of the m
easured
kinetic param
eter. These valu
es are usu
ally given relative to the begininng valu
es so as to show the fold
increase of intensity. We call the the m
ethod of
transforming raw
values into fold
-increase values (or som
etimes actu
al concentration valu
es) stand
ardization
ww
w.intechopen.com

F
low
Cyto
me
try –
Re
ce
nt P
ers
pe
ctiv
es
302
Jakubczak et al., 2006
Neutrophils Fluo-3, Fura-Red
Statistica 6.0
mean intensity every 60 s
first 40 s mean slope at given time points intensity at given time points
Mann-Whitney U test
Bailey et al., 2006
PBMC, Jurkat
Fluo-3, Fura-Red, Indo-1
FCSPress 1.3
moving geometric mean intensity against time
first part geometric mean
maximum -
Stork et al., 2007
B lymphocytes
Indo-1 FlowJo moving median (?) intensity against time
none ? - -
Demkow et al., 2009
Neutrophils Fluo-3, Fura-Red
Statistica 6.0
- first 40 s mean (?) intensity after 60s
Mann-Whitney U test
Schepers et al., 2009
granulocytes,monocytes, lymphocytes
Fluo-3 intensity against time scatter plot mean intensity every 30 s
first 30 s mean intensity at every 30 s
paired Wilcoxon-test
Szalay et al., 2012
T cells Fluo3AM (cytoplasmic Ca2+), Rhod2-AM (mitochondrial Ca2+ levels), Dihydroethidium (superoxide), DAF-FM diacetate (NO)
R, Statistica 7
moving median intensity against time in representative measurements
first 5 s median AUC maximum time to reach maximum
paired Wilcoxon-test, Mann-Whitney U test
reference investigated cell types
dyes used software used
graphical presentation of kinetic data
standardization against
averaging method
parameters calculated
statistical comparison
T
able 1. (continued
) Analysis m
ethods u
sed in a selection of articles p
ublishing resu
lts of kinetic flow
cytometric m
easurem
ents. Inten
sity refers to the fluorescent intensity valu
e of the m
easured
kinetic param
eter. These valu
es are usu
ally given relative to the begininng valu
es so as to show the fold
increase of intensity. We call the the m
ethod of transform
ing raw
values into fold-increase values (or som
etimes actual concentration valu
es) standardization
ww
w.intechopen.com

Experimental Conditions and Mathematical Analysis of Kinetic Measurements Using Flow Cytometry – The FacsKin Method
303
corresponding parameters of different groups of measurements with regular statistical methods, eg. Mann-Whitney U test for 2 groups (used in Jakubczak et al.; 2006, Demkow et al.; 2009, Toldi et al.; 2010b, Szalay et al., 2012), t-test (used in Lund-Johansen et al., 1992), paired Wilcoxon-test (used in Schepers et al., 2009; Toldi et al., 2010a, Szalay et al., 2012).
The fitting of these curves should be standardized as they usually should start at value 1.0. Hence the values represent relative parameter values (rpv). This can be done by dividing the
Fig. 1. Left side: 2D density plots of SSC over time and Fluo 3 / Fura Red over time in a representative Ca2+-flux measurement (human CD4+ lymphocytes stimulated with PHA). Black areas represent the highest density while white areas represent zero density. The measurement interval was splitted up to 100 time intervals of equal length and medians (red curve) and means (green curve) in each interval were calculated. Right side: histograms of SSC and Fluo 3 / Fura Red parameters at 4 representative time intervals named A, B, C and D. The red line shows the place of the median and the green line that of the mean. Note that the distribution of SSC is constant over time while that of Fluo 3 / Fura Red changes: there is a sudden shift towards higher values at approx. 110 s and a slow continuous shift towards lower values afterwards
www.intechopen.com

Flow Cytometry – Recent Perspectives
304
values at each time point by the value at the beginning of the experiment. This changes the values of those calculated parameters that depend on axis y (i.e. the maximum, slope parameters) but not those dependent only on axis x (i.e. time to reach maximum). Sometimes a calibration is made and the measured kinetic parameter value is converted into real biochemical/biophysical units (as in Omann et al., 1990, Norgauer et al., 1993). Another kind of standardization can be done by shifting the whole measurement by subtracting or adding a time value from/to all time points. This is useful when the exact beginning of the kinetic reaction is not known and the goal is to calculate distances from the maximal value or some well-defined time point inside the measured time-frame.
However, the value of curve parameters derived by smoothing method depends very much on the exact method used and the adjustments that are made. Adjustments have to be done for each measurement manually. Moreover, these methods are very sensitive to experimental conditions and provide no qualitative feedback on the shape of the smoothed curve. Smoothing methods are well-established for presenting but not for analyzing the data (Motulsky et al., 1987).
2.3 Fitting a model to the smoothed values
By selecting a mathematical model the assumptions that one would make about a kinetic process are made explicit (Motulsky et al., 2004). By fitting the model to the smoothed values one can test whether the measured values really follow the selected model; if so, the parameters that describe the model can be calculated. The model can be empirically determined or mechanistic. The former describes the general shape of the data and its parameters do not necessarily correspond to a biological process, while the latter is specifically formulated to describe a biological process with parameters such as dissociation constants, catalytic velocities etc. In our case the model can be formulated by a function that takes a time value and some other parameters describing the exact shape of the function and returns a numeric value that estimates the smoothed kinetic parameter value (an example of an empirically determined function is shown in Figure 2). The parameters describing the exact shape correspond to those calculated from the smoothed curve in 2.2. A series of empirical models is described in (Kaposi et al., 2008, Mészáros et al., 2011). We will describe a version improved further in Section 3. Some applications of this method are described in Section 5 (Toldi et al., 2010a-b-c, 2011a-b). Mechanistic models for calcium flux kinetics are also available (Tang et al., 1996; Politi et al., 2006). Fitting a function to the smoothed kinetic parameter values could be done by non-linear least-squares regression (Bates et al., 1988) or by one of the several robust regression methods (Motulsky et al., 2004). A robust way of testing whether the model fits the dataset is cross-validation (Picard et al., 1984).
2.4 Fitting to quantiles
An extension of the smoothing method using median averaging (method 2.2) which is orthogonal to method 2.3 comes from the idea of quantile regression (Koenker et al., 2001). One limitation of methods 2.2 and 2.3 is that they replace the distributions of the kinetic parameter at each time interval with one single value forgetting about the deviation around this average value. Replacing such a distribution with eg. 100 percentile values preserves the shape of the distribution. Afterwards, one could fit models to values corresponding to the same percentile just as in method 2.3. This is the essence of our method “FacsKin” described precisely in Section 3.
www.intechopen.com

Experimental Conditions and Mathematical Analysis of Kinetic Measurements Using Flow Cytometry – The FacsKin Method
305
Flu
o3/
Fu
raR
ed
0.10
0
0.10
5
0.1
10
0.1
15
0 50 100 150 200 250 300
time (s)
y2
y0
m1
x1
4 1 ( 1)
2 0
0 ( 2 0)logist+( ; 0, 2, 1, 1)= ( 0, 2, 1, 0 and 0 2)
1
m t m
y y
y y yt y y x m y y x m y y
e
∗ ∗ − −
−
+ −≥ <
+
Fig. 2. A kinetic model describing kinetic reactions following an increasing sigmoid shape curve. The corresponding mathematical function is called logist+ function and has 4 parameters that fully describe the shape of a particular logistic function (y0, y2, x1 and m1, black lines with captions). The time parameter is denoted t. The 320 s long kinetic flow cytometric measurement time-frame was divided into 100 time intervals of equal length and the median of the kinetic parameter was calculated in each interval (red curve). The logist+ function was fitted (blue curve) to these median values with Nelder-Mead optimization method minimizing the sum of absolute deviances (Nelder et al., 1965). The result of the current fit was: y0=0.1018, y2=0.1151, x1=160.29, m1=0.0001026
2.5 Fitting to the whole measurement at the same time
Replacing a distribution with percentile (or more generally, quantile) values is unnecessary if the type of the probability distribution is known. In this case fitting the parameters of the probability distribution is a more robust method than fitting functions separately to quantiles. It also helps to avoid overfitting (Hawkins, 2004). Then, it is necessary to describe the change of the parameters of the probability distribution over time by fitting a function to this change as well, one function per parameter for the probability distribution. Having a probability distribution with 2 parameters and two functions each having 8 parameters to describe their changes would result in a model containing 2*8=16 parameters (compare it with the 8*100 parameters for the functions for all 100 percentiles). The same result could be achieved by creating a mechanistic model based on the biological characteristics of the kinetic process but with parameters having exact biological meaning like dissociation
www.intechopen.com

Flow Cytometry – Recent Perspectives
306
constants, enzyme activities, cell types etc. However, this is a great challenge due to the large variety of cells and measurement conditions. The computational capacity required for this approach could be reduced by replacing the whole measurement with percentiles at each time interval.
2.6 Fitting to different measurements at the same time
To statistically compare different (groups of) measurements one can take the (empirical or estimated) distributions of parameters derived from fitting models separately to these measurements and compare them with statistical methods such as Kruskall-Wallis test. In this case, p values should be adjusted for multiple comparisons because each parameter has to be compared separately. A more robust method would be to define a common model for several measurements selecting parameters that are common in different measurements according to the null hypothesis and other parameters that are tested for differences.
3. Description of the FacsKin method
We developed a method for describing and comparing kinetic flow cytometry measurements using method 2.4 described in the previous section. Our aim was to provide a readily usable standard way of analyzing and comparing kinetic measurements. Previous versions of the method were published in (Kaposi et al., 2008) and (Mészáros et al., 2011). A computer program that implements the method is available at the website http://www.facskin.com. The implementation was done in Java (Oracle Inc., Redwood Shores, USA.) and R (R Development Core Team, 2006). This section describes the technical details of the method. A more user-oriented description and tutorial is the User's Guide on the website: http://www.facskin.com/node/3.
3.1 Input data
The input of the method are the time (seconds) and kinetic parameter value (raw measured intensity value or calculated ratio in case of eg. Fluo 3 / Fura Red fluorescent dyes) for each cell in the gated cell population that the user is interested in.
We divide the whole measurement into 100 equal-length time intervals. Sometimes the resolution of the time parameter isn't high enough and the cells are not evenly distributed in the time intervals. To prevent this, we recalculate time values so as to make time points evenly distributed:
(t'i, t'i +1, t'i +2, t'i +3, ... t'j-1) := (ti , t i +d, ti+2*d, ti+3*d, ..., ti+(j-i-1)*d),
where tk is the old time value of the kth cell, t'k is the new time value of the kth cell, ti-1 ≠ ti = ti+1 = ... = tj-1 ≠ tj, d = (tj - ti) / (j - i). In the special case when tj-1 is the time value of the last cell, tj = ti + (ti – ti-1).
In each time interval we calculate the following 201 quantiles distributed equally: 1/402, 1/402 + 1/201, 1/402 + 2/201, 1/402 + 3/201, ... 1/402 + 200/201. We use 201 quantiles so that the quartiles (0.25, 0.5, 0.75 corresponding to 51th, 101th, 151th quantile) can be obtained directly. From now on, we will use these 201 quantiles in each time interval instead of the original measurement data (we replace the original measurement data with 201*100 + 100 = 20,200 values (quantiles + time values)).
www.intechopen.com

Experimental Conditions and Mathematical Analysis of Kinetic Measurements Using Flow Cytometry – The FacsKin Method
307
3.2 Kinetic models
We defined 5 kinetic models (Figure 3) each for different kind of kinetic measurement:
1. constant: the value of the kinetic parameter is constant during the measurement timeframe
2. logist+: the kinetic parameter starts at a given value, increases during the measurement timeframe and reaches a given value
3. logist-: same as logist+, but instead of increasing the kinetic parameter value decreases during the measurement timeframe
4. dlogist+: the kinetic parameter starts at a given value, increases, reaches a maximum value and then decreases and reaches a given value during the measurement timeframe
5. dlogist-: same as dlogist+, but instead of increasing and then decreasing the kinetic parameter value first decreases, reaches a minimum and then increases
logist-
dlogist+ dlogist-
0.025 time (s) 129.2
constant
logist+1.252
0.819
1.682
0.962
1.105
0.684
1.124
0.919
1.092
0.366
0.012 time (s) 600.7 0 time (s) 483.7
0.003 time (s) 1.0E3 0 time (s) 601.7 Fig. 3. Representative plots of the 5 kinetic models fitted to kinetic flow cytometric measurements (calcium flux). The dots represent the median values (quantile 0.5) at each of the 100 time intervals, the curves the functions fitted on these dots
Each model corresponds to a function. Here follows the formula and parameters for each function. Most of the parameters are constrained which means that the domain of the function is restricted to such values. Logist+ and logist- differ only in their constraints and the meaning of their parameters, this is true for dlogist+ and dlogist- as well. The reason for separating these functions is that we would like to avoid fitting increasing functions to some quantiles while decreasing functions to other quantiles of the same measurement.
www.intechopen.com

Flow Cytometry – Recent Perspectives
308
1. constant: The function is a horizontal line having the same value (y) all the time. Formula:
( ); y yconstant t =
Constraints: y ≥ 0. Parameter: y: constant value
2. logist+: an S-shape function that starts at a given value (y0) increases and reaches a higher given value (y2). Formula:
( 1) 42 0
2 0logist ( ; 0, 2, 1, 1) 0
1t x m
y y
y yt y y x m y
e
− + ∗ ∗−
−+ = ++
Constraints: y0 ≥ 0, y2 ≥ 0, x1 ≥ 0, m1 ≥ 0, y0 < y2. Parameters (see also Figure 2): • y0: starting value. The limit of the function at -∞ (minus infinity). It is not
necessarily the value at time point 0. If the function begins with a steep, the starting value is lower than the value at time point 0.
• y2: ending value. The limit of the function at +∞ (positive infinity). Not necessarily the value of the function at the end of the measurement.
• x1: time to reach 50% value. The time point when the function reaches the 50% value. The 50% value is the mean of the starting value and the ending value (unit: s).
• m1: slope at 50% value. The slope of the function at the 50% value (unit: int/s where int is the unit of the vertical axis).
3. logist-: an S-shape function that starts at a given value (y0) decreases and reaches a lower given value (y2). Formula:
( 1) 42 0
2 0logist ( ; 0, 2, 1, 1) 0
1t x m
y y
y yt y y x m y
e
− + ∗ ∗−
−− = ++
Constraints: y0 ≥ 0, y2 ≥ 0, x1 ≥ 0, m1 ≥ 0, y0 < y2. Parameters: • y0: starting value. The limit of the function at -∞ (minus infinity). It is not
necessarily the value at time point 0. If the function begins with a steep, the starting value is higher than the value at time point 0.
• y2: ending value. The limit of the function at +∞ (positive infinity). Not necessarily the value of the function at the end of the measurement.
• x1: time to reach 50% value. The time point when the function reaches the 50% value. The 50% value is the mean of the starting value and the ending value (unit: s).
• m1: slope at 50% value. The slope of the function at the 50% value (unit: int/s where int is the unit of the vertical axis.).
4. dlogist+: a function that starts at a given value (y0), has an increasing phase, reaches a maximum (y1), has a decreasing phase and reaches a given ending value (y2). Formula:
www.intechopen.com

Experimental Conditions and Mathematical Analysis of Kinetic Measurements Using Flow Cytometry – The FacsKin Method
309
0 100 200 300 400 500 600time (s)
Flu
o3/
Fu
raR
ed
0.1
0 0.1
1 0
.12 0.1
3 0
.14 0.1
5
y2
y0
x1
xd0
xd2
y2
2m
Fig. 4. Parameters of the dlogist+ function (the formula is given in 3.2.5). The 600 s long kinetic flow cytometric measurement time-frame was divided into 100 time intervals of equal length and the median of the kinetic parameter was calculated in each interval (red curve). The dlogist+ function was fitted (blue curve) to these median values with Nelder-Mead optimization method minimizing the sum of absolute deviances (Nelder et al., 1965). The result of the current fit was: y0=0.1083, y1=0.1395, y2=0.1222, x1=278.4, xd0=146.7, xd2=145.0, m0=2.657*10-4, m2=-9.519*10-5
4 0 01 0
4 2 22 1
1 00 , t<x1
11
0dlogist ( ; 0, 1, 2, 1, 0, 2, 0 2)
1 22 , t x1
11
2
xd m
y y
xd m
y y
y yy
x t
xdt y y y x xd xd m m
y yy
t x
xd
∗ ∗−
∗ ∗−
−⎧ +⎪⎪ −⎛ ⎞+⎪ ⎜ ⎟⎪ ⎝ ⎠+ = ⎨ −⎪ + ≥⎪ −⎛ ⎞⎪ + ⎜ ⎟⎪ ⎝ ⎠⎩
Constraints: y0 ≥ 0, y1 ≥ 0, y2 ≥ 0, m0 ≥ 0, x1 ≥ 0, xd0 ≥ 0, xd2 ≥ 0, m2 ≤ 0, xd0 ≤ x1, y1 > y0, y1 > y2. Parameters (see also Figure 4): • y0: starting value. The limit of the function at -∞ (minus infinity). It is not
necessarily the value at time point 0. If the function begins with a steep, the starting value is lower than the value at time point 0.
• y1: maximum value. The maximum of the function. It is possible that the maximum point is not in the measurement timeframe (usually meaning that the measurement does not follow this kinetic model).
• y2: ending value. The limit of the function at +∞ (positive infinity). Not necessarily the value of the function at the end of the measurement.
www.intechopen.com
Flow Cytometry – Recent Perspectives
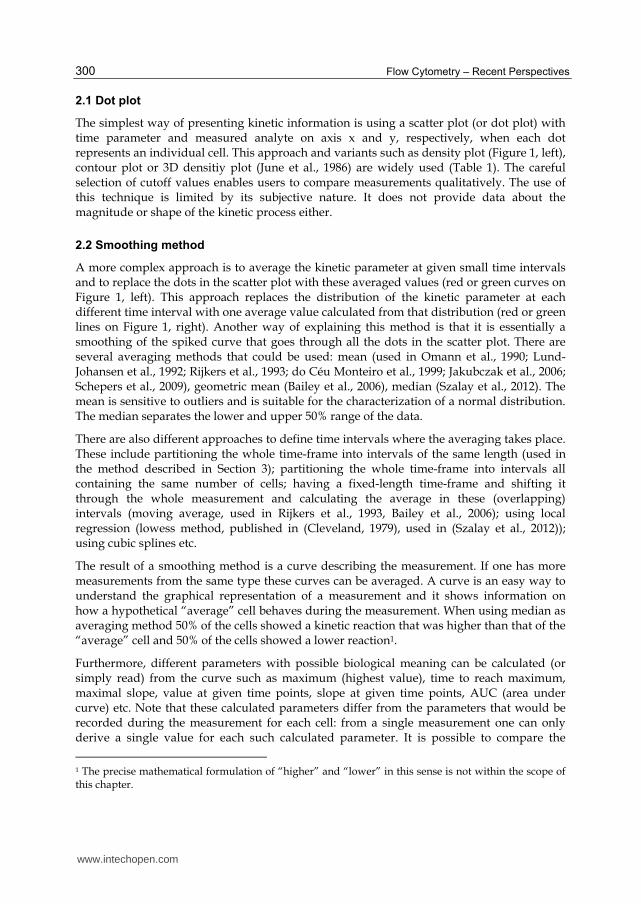
310
• x1: time to reach maximum value. The time point when the function reaches the maximum value (unit: s).
• xd0: time from the first 50% value to maximum. The distance between the time point where the function reaches the first 50% value and where the function reaches the maximum. The first 50% value is the mean of the starting value and the maximum (unit: s).
• m0: slope at first 50% value. The slope of the function at the first 50% value (unit: int/s where int is the unit of the vertical axis).
• xd2: time from maximum to the second 50% value: the distance between the time point where the function reaches the maximum and where the function reaches the second 50% value. The second 50% value is the mean of the maximum and the ending value (unit: s)
• m2: slope at second 50% value: the slope of the function at the second 50% value (unit: int/s where int is the unit of the vertical axis).
5. dlogist-: a function that starts at a given value (y0), has a decreasing phase, reaches a minimum (y1), has an increasing phase and reaches a given ending value (y2). Formula:
4 0 01 0
4 2 22 1
1 00 , t<x1
11
0dlogist ( ; 0, 1, 2, 1, 0, 2, 0 2)
1 22 , t x1
11
2
xd m
y y
xd m
y y
y yy
x t
xdx t y y y x xd xd m m
y yy
t x
xd
∗ ∗−
∗ ∗−
−⎧ +⎪⎪ −⎛ ⎞+⎪ ⎜ ⎟⎪ ⎝ ⎠− = ⎨ −⎪ + ≥⎪ −⎛ ⎞⎪ + ⎜ ⎟⎪ ⎝ ⎠⎩
Constraints: y0 ≥ 0, y1 ≥ 0, y2 ≥ 0, m2 ≥ 0, x1 ≥ 0, xd0 ≥ 0, xd2 ≥ 0, m0 ≤ 0, xd0 ≤ x1, y1 < y0, y1 < y2. Parameters: • y0: starting value. The limit of the function at -∞ (minus infinity). It is not
necessarily the value at time point 0. If the function begins with a steep, the starting value is higher than the value at time point 0.
• y1: minimum value. The minimum of the function. It is possible that the minimum point is not in the measurement timeframe (usually meaning that the measurement does not follow this kinetic model).
• y2: ending value. The limit of the function at +∞ (positive infinity). Not necessarily the value of the function at the end of the measurement
• x1: time to reach minimum value. The time point when the function reaches the minimum value (unit: s).
• xd0: time from the first 50% value to minimum. The distance between the time point where the function reaches the first 50% value and where the function reaches the minimum. The first 50% value is the mean of the starting value and the minimum (unit: s).
• m0: slope at first 50% value: the slope of the function at the first 50% value (unit: int/s where int is the unit of the vertical axis).
• xd2: time from maximum to the second 50% value. The distance between the time point where the function reaches the minimum and where the function reaches the
www.intechopen.com

Experimental Conditions and Mathematical Analysis of Kinetic Measurements Using Flow Cytometry – The FacsKin Method
311
second 50% value. The second 50% value is the mean of the minimum and the ending value (unit: s). • m2: slope at second 50% value. The slope of the function at the second 50% value (unit: int/s where int is the unit of the vertical axis).
The parameters dependent on axis y (y0, y1, y2, m0, m1, m2) can be standardized by dividing each value by the y0 parameter of the same function so that the functions start at value 1.0 and the y0, y1 and y2 parameters become relative parameter values (rpv) while m0, m1 and m2 parameters become values of rpv/s units. The standardization of the parameters dependent only on axis x in case of dlogist+ and dlogist- functions is done by having xd0 and xd2 parameters which are measured as a distance from the maximum, not as the time to reach the 50% values.
3.3 Function fitting
Before fitting a function, we estimate the parameters by applying the lowess smoothing method (Cleveland, 1979) several times with different smoother spans. We fit models with the Nelder-Mead optimisation method (Nelder et al., 1965) to quantile values starting from the estimated parameters minimizing the sum of absolute deviances.
For all 5 functions we do the following:
1. First we use 10-fold cross validation on the three quartiles separately to get an estimation of how well the function fits the measurement data. We summate the sum of absolute distances between the function fitted to the training set and the test set (Picard et al., 1984). The test set is one tenth of the whole dataset (which is 100 time and 100 intensity values for each quartile).
2. Then we fit the function to the 201 quantiles mentioned earlier.
The result of fitting the functions is 201*(1 + 4 + 4 + 8 + 8) = 5025 parameters and the 10-fold cross validation values for the 5 functions.
3.4 Comparison
To describe a measurement, we select the best function (by looking at how well the median function fits the median (0.5 quantile) values and looking for low 10-fold cross validation values) and we create distributions of the parameters by using the corresponding parameters of the 201 functions, hence each parameter will be represented by a distribution of 201 values. For example, in case of the dlogist+ function we can talk about the distribution of the maximum value (Figure 5). The distributions can be summarized by giving median [range] or median [quartiles] values or visually by drawing a histogram or box plot.
To compare different (groups of) measurements we select a common function that describes every measurement well. Then, we summate the distributions of each parameter by group so that each group will have one single distribution for every parameter containing (measurement count in group)*201 values. We can compare distributions of parameters between different groups by probability binning method (Roederer et al., 2001) or by calculating the overlap of the middle 50% of the distributions. The T value given by probability binning and the overlap percentage give a measure of difference between the distributions and the former method also gives a p-value (corresponding to the null hypothesis that the two distributions are equal). There is the possibility of extracting only 1
www.intechopen.com

Flow Cytometry – Recent Perspectives
312
value for each parameter from one measurement, ie. the parameters of the median function (which was fitted to the 0.5 quantile values) and in this case usual nonparametric statistical methods like Mann-Whitney U test (or Kruskall-Wallis test, for more than 2 groups) can be used to compare parameters between different groups.
Fig. 5. Derivation of the distribution of parameter y1 (maximum value) of the dlogist+ function. The 600 s long kinetic flow cytometric measurement time-frame was divided into 100 time intervals of equal length and 201 quantiles were calculated in each interval (black dots). Dlogist+ function was fitted to each quantile (red curves). The maximum parameters (green lines) of each were collected and form a distribution (histogram on the right)
4. Experimental settings
Additionally to cytoplasmic Ca2+ signal (June et al., 1990) the development of a number of fluorescent probes (Johnson, 2001) provided an opportunity to measure the kinetics of other intracellular parameters such as membrane potential, mitochondrial Ca2+ levels and superoxide generation (Mészáros et al., 2011).
The authors of this chapter are mainly interested in investigating the activation process of T-lymphocytes. The experimental procedures described below are useful when examining the first short period of T-lymphocyte activation. We optimized incubation times, temperature and dye concentrations for Jurkat cells. The precise experimental settings can be found in (Mészáros et al., 2011). It should be emphasized that these experimental conditions may be different for other cell types.
4.1 Variables to be standardized during the measurements
Cells: although human peripheral blood samples are probably the most common specimen submitted to flow cytometry laboratory, to optimize an assay for experimental purposes, the most adequate way is to use different cell lines.
How specimens are obtained, handled, and stored is intimately related to the reason for obtaining them (for example, to analyse human peripherial blood lymphocytes, samples should be taken in a heparinized tubes and stored at room temperature). In most instances it
www.intechopen.com
Experimental Conditions and Mathematical Analysis of Kinetic Measurements Using Flow Cytometry – The FacsKin Method
313
is also crucial to assess the viability of separated cells. There are several methods available for this purpose (Stoddart, 2011). Additionally, viability should be determined prior to separation procedures.
The number of cells required per assay depends on the number of experiments planned and on the expected proportion of responding cells. Experiments with cells having a homogeneous response need ~106 cells per 10-min assay to quantify the response of a major population.
Solvents: the choice of cell culture medium can be influenced by two requirements: i) the metabolic requirements of the cells and ii) the solving properties of the fluorescent dyes used. For example cyanine and oxonol dyes are hydrophobic and will tend to plate out of aqueous solutions onto the surfaces of glass and plastic test tubes and onto the tubing in flow cytometers. Most of these compounds are highly soluble in DMSO (dimethylsulfoxide) and DMF (dimethyl formamide), which, because it does not readily evaporate, is a convenient vehicle for preparation of stock and working solutions.
In our protocols given below, and generally as well, the amount of DMSO added to cell suspensions is sufficiently small to keep the overall concentration at under 1% (v/v) (Brayton, 1986).
Dyes: evaluation of live cells using flow cytometry presents some difficult challenges. One of these is the need for maintaining the stability of cells. Therefore fluourescent dyes should not be toxic. During the staining procedure the cells and the reagents must be kept at appropriate temperature and should be carefully checked for pH (7.4), since the cells and some dyes are very sensitive to temperature and pH. The staining procedure should be performed under dimmed light and incubation should be in the dark, because of the light sensitivity of fluorochroms.
Dyes and ionophores for intracellular measurements may stick to cytometer tubing. Therefore, before measurement it is important to preequilibrate the tubing to prevent baseline shift. Likewise, tubing should be thoroughly cleaned after use by flushing the instrument with bleach. In case this is not done, residual dye may migrate from the tubing into cell samples that are introduced later into the instrument, and this may produce the appearance of immunofluorescent staining in unlabeled cells. In some cases ionophore in the sample may stick to the cytometer tubing and subsequently bind to cells in a later sample, producing a real change in the signal. When there is a possibility that this could happen, it may be prudent to flush with bleach between samples.
One has to be aware of a specific problem that may occur when several dyes are used in combination, i.e., their fluorescence emission spectra may overlap. In case quantitative information is required (i.e., the amount of fluorescence has to reflect a biochemical quantity), samples stained with a single dye should be included for use in setting fluorescence compensation (Roederer, 2002).
In the last years we established some flow cytometry methods that enable the users to monitor intracellular processes (membrane potential, mitochondrial Ca2+ levels and superoxide generation). We optimized incubation times, temperature and dye concentrations for T-lymphocytes. The dyes used are listed in Table 2. For more cellular function probes see (Johnson, 2001).
www.intechopen.com

Flow Cytometry – Recent Perspectives
314
4.2 Considerations on timing
For many kinetic experiments with flow cytometry, the cell suspensions are analyzed for a period of 5-20 min. Timing is particularly critical when the change of the intracellular parameter to be observed lasts for a few minutes or less, in which case kinetic measurements incorporating time as a measurement parameter represent the only realistic approach to obtain consistent data. Even when stimuli produce effects lasting longer, it is important to maintain a relatively constant duration of cell incubation with dyes and stimuli from sample to sample.
4.3 Control measurements
Every experiment should include a baseline measurement which runs for 1-2 minutes with no additions to the sample. This provides a view of the degree of homogenity of individual cells in the population. Ideally the population distribution is very tight, but in case of presence of different cell types in the sample, the detected fluorescent signal intensity could be very diverse. In many cases, there is marked heterogenity in the changes that occur, sometimes even in populations of cells that were previously thought to be homogeneous. A limitation of flow cytometry, however, is that it does not permit kinetic resolution of certain complex kinetic responses such as cellular oscillatory responses. This requires video microscopy with digital image analysis, a technique that is complementary to flow cytometry for the study of various parameters of cell activation (Botvinick et al., 2007).
Name of the dye Excitation max, (nm)
Emission max, (nm)
Excitation laser line (nm)
Use
Calcium sensitive ratiometric dyes
Fluo-3-AM 506 526 488
Fura Red 436 655 488
Indo-1 330-361 405-475 365
Cytomplasma Ca2+-level
Membrane potential sensitive dyes
DiBAC4(3) 494 516 488
DiBAC4(5) 590 616 488
Membrane potential
Mitochondrial probes
JC-1 520 530, 590 488
TMRM 543 567 488
Mitochondrial potential
Rhod-2/AM 552 581 488 Mitochondrial Ca2+ level
ROS sensitive dyes
DAF-FM diacetate 495 515 488 NO measurement
HE 518 605 488 O2- generation
measurement
Table 2. Fluorescent probes for kinetic measurements
www.intechopen.com
Experimental Conditions and Mathematical Analysis of Kinetic Measurements Using Flow Cytometry – The FacsKin Method
315
”Pseudo mixing test” is an important control in kinetic flow cytometry measurements. It determines whether the cell population is susceptible to mechanical shear forces like mixing and sample pressurization. These effects can activate pressure sensitive ion flux mechanisms present in some cell lines and can result in changes of the signal detection.
The fact that some of the fluorescent probes can be compartmentalized in cells forces us to use different control experiments. In order to test the validity of assay systems the use of specific activators and/or inhibitors is mandatory. At the end of the measurements to test whether the cells were properly loaded with reporter dye and whether the flow cytometry system was set up properly, the addition of positive or negative control chemicals is needed.
5. Applications of the FacsKin method
FacsKin provides a tool for the evaluation of kinetic flow cytometry data. This section presents some experiments that benefited from opportunities provided by FacsKin.
5.1 The investigation of calcium influx kinetics in Th1 and Th2 cells
Upon antigen presentation, a signal transduction pathway leads to a transient, biphasic elevation of [Ca2+]cyt in lymphocytes (Figure 6). The first phase of the biphasic calcium signal is directly linked to the generation of IP3, and calcium release from the endoplasmic reticulum (ER) upon the binding of IP3 to its designated receptor (Lewis, 2001). The second phase is due to the activation of calcium release activated calcium (CRAC) channels in the cell membrane. The calcium signal converges to the activation of transcription factors leading to cytokine production and further factors needed for the development of an adequate lymphocyte response. The actual distribution of [Ca2+]cyt depends on finely tuned interactions of mechanisms responsible for its elevation and decrease. Besides ER calcium release and calcium entry through the CRAC channels, mitochondria also contribute to the elevation of [Ca2+]cyt via the regulation of CRAC channel functionality. However, in a later phase of lymphocyte activation, they may also take up and store large amounts of calcium via the mitochondrial calcium uniporter (MCU) and, therefore, decrease [Ca2+]cyt (Duchen, 2000). Other mechanisms that specifically contribute to the clearance of elevated [Ca2+]cyt in lymphocytes are the sarco/endoplasmic reticulum calcium ATPase (SERCA) (Feske, 2007) and the plasma membrane calcium ATPase (PMCA) (Di Leva et al., 2008).
The steps of activation begin with identical stimuli in the two major arms of T helper lymphocytes, Th1 and Th2 cells. However, they produce a different set of cytokines, and exert distinct effects on the inflammatory balance. While Th1 cells account for the development of a pro-inflammatory response, Th2 cells produce anti-inflammatory cytokines. Since the expression of cytokine genes is influenced by the characteristics of calcium influx kinetics, the differences in calcium handling of the Th1 and Th2 subset may remarkably contribute to variations in cytokine production (Dolmetsch et al., 1998). Therefore, we investigated the differences of calcium handling between Th1 and Th2 lymphocytes. We tested the contribution of the ER calcium release, the CRAC channel, the MCU, the SERCA pump and the PMCA pump to the regulation of [Ca2+]cyt during the early period of T lymphocyte activation.
First, we compared the kinetics of calcium response in the Th1 and Th2 lymphocyte subsets following lymphocyte activation (Toldi et al., 2011a). AUC, Slope and Max values were
www.intechopen.com

Flow Cytometry – Recent Perspectives
316
lower in the Th2 subset. However, the tmax value did not significantly differ in the two subsets. The higher activity of the SERCA pump, along with the lower activity of mitochondrial calcium reuptake, and therefore of the CRAC channels account for the notion that Th2 cells go through a lower level of lymphocyte activation compared with Th1 cells upon identical activating stimuli.
In contrast to the SERCA pump, which functions from the beginning of calcium influx, the PMCA pump in Th1 cells has a role in the shaping of [Ca2+]cyt kinetics from a stage when [Ca2+]cyt is already elevated, thus ensuring the reconstitution of the original [Ca2+]cyt level. This is represented in our results by the fact that the inhibition of this mechanism affects the Max values but not the Slope value in Th1 cells. The main regulator of the PMCA pump is the elevated level of [Ca2+]cyt (Di Leva et al., 2008). Therefore, the initial calcium uptake of the ER has an important regulatory effect on the function of the PMCA pump. Since calcium reuptake by ER is more active in Th2 cells, [Ca2+]cyt will not increase to the extent observed in Th1 cells. Therefore, it seems that [Ca2+]cyt will not be elevated sufficiently in the Th2 subset to activate the PMCA pump during the initial phase of activation. In contrast, in Th1 cells, due to the lower extent of ER reuptake, [Ca2+]cyt will increase sufficiently to activate the PMCA pump. Differential calcium signaling and distinct kinetics of the alterations of [Ca2+]cyt may have an important contributing role to the production of dissimilar cytokines by Th1 and Th2 cells.
Fig. 6. The regulation of cytoplasmic free calcium level in lymphocytes. Interrupted arrows represent mechanisms responsible for the elevation, whereas bold arrows represent those responsible for the decrease of the cytoplasmic free calcium level. The differential activity of these mechanisms in Th1 and Th2 cells is marked in the gray boxes. TCR: T cell receptor, IP3: inositol trisphosphate, ER: endoplasmic reticulum, CRAC: calcium release activated calcium channel, MCU: mitochondrial calcium uniporter, SERCA: sarco/endoplasmic reticulum calcium ATPase, PMCA: plasma membrane calcium ATPase
www.intechopen.com

Experimental Conditions and Mathematical Analysis of Kinetic Measurements Using Flow Cytometry – The FacsKin Method
317
5.2 The role of lymphocyte potassium channels in the regulation of calcium influx
In order to maintain the electrochemical driving force for calcium entry from the extracellular space, depolarizing calcium influx needs to be counterbalanced by the efflux of cations, predominantly potassium. Therefore, lymphocyte activation is closely linked to and regulated by the function of lymphocyte potassium channels. There are two major types of potassium channels in T lymphocytes: the voltage-gated Kv1.3 and the calcium-activated IKCa1 channels. In our investigations, we studied the role of the Kv1.3 and IKCa1 channels in the process of lymphocyte activation not only in healthy individuals, but also in neonates, pregnancy and immune-mediated disorders, such as preeclampsia, multiple sclerosis and type 1 diabetes.
In healthy individuals, a triarylmethane compound (TRAM), the specific inhibitor of the IKCa1 channel decreased calcium influx in Th2 cells to a lower extent than in Th1 cells (Toldi et al., 2011b). This finding supports previous data from Fanger et al. (2000) obtained by patch clamp, showing that IKCa1 currents are smaller in Th2 cells when compared with the Th1 subset. A possible contributing element to this phenomenon might be that [Ca2+]cyt, which needs to reach a threshold to activate the IKCa1 channels, increases more rapidly in Th1 than in Th2 cells, due to the distinct function of the SERCA pump, as detailed above.
In contrast with IKCa1, the inhibition of Kv1.3 channels by a specific blocker, margatoxin (MGTX) results in a somewhat larger decrease of calcium in Th2 than in Th1 cells. Calcium influx in Th1 cells is less sensitive to the inhibition of the Kv1.3 channel. All in all, a larger amount of compensatory potassium leaves the cells through the Kv1.3 and IKCa1 channels upon lymphocyte activation in the Th1 subset, enabling a larger amount of calcium to enter from the extracellular space compared with the Th2 subset.
In healthy individuals, CD8 cells were more sensitive to the inhibition of the IKCa1 channels than the CD4 subset, responding with a higher level of decrease of the AUC value upon the application of TRAM. However, almost no difference was observed between the sensitivity of CD4 and CD8 cells to the inhibition of the Kv1.3 channel.
5.3 Lymphocyte activation and potassium channels in healthy pregnancy and preeclampsia
Both in pregnancy and in the neonatal period, the immune response and the kinetics of lymphocyte activation are altered compared with the adult, non-pregnant state. Healthy pregnancy is characterized by the development of an immune tolerance specific for the antigens presented by the developing fetus. The impairment of this tolerance and the development of an abnormal immune response play a major role in adverse pregnancy outcomes, including preeclampsia (Saito et al., 2007). This disorder is characterized by hypertension, proteinuria, edema and endothelial dysfunction usually evolving in the third trimester of pregnancy. The development of a maternal systemic inflammatory response has also been described in PE (Saito et al., 2007). An important feature of this disorder is the absence of Th2 skewness and thus the predominance of pro-inflammatory cytokines, as shown by a number of investigations (Darmochwal-Kolarz et al., 2002; Rein et al., 2002; Saito et al., 1999).
Our results indicate marked differences of calcium influx kinetics and sensitivity to Kv1.3 and IKCa1 channel inhibition (by margatoxin (MGTX) and a triarylmethane compound
www.intechopen.com

Flow Cytometry – Recent Perspectives
318
(TRAM), respectively) in major lymphocyte subsets (i.e. Th1, Th2, CD4 and CD8 cells) between non-pregnant, healthy pregnant and preeclamptic lymphocytes (Toldi et al., 2010a). These properties in preeclampsia are more comparable to the non-pregnant state than to healthy pregnancy, suggesting that there is a characteristic pattern of calcium influx in healthy pregnant women that is missing in preeclamptic patients. This raises the notion that lymphocyte calcium handling upon activation may have a role in the characteristic immune status of healthy pregnancy.
AUC values of the calcium response are lower in healthy pregnancy in the Th1, CD4 and CD8 lymphocyte subsets. On contrary to Th1 cells, the activation induced calcium response of the Th2 subset is not decreased compared with the non-pregnant state. The decreased activation of the Th1 subset and the lack of decrease in Th2 cells may partly be responsible for the well established Th2 skewness in healthy pregnancy (Darmochwal-Kolarz et al., 2002; Rein et al., 2002; Saito et al., 1999). Unlike in healthy pregnancy, we could not detect a difference in the AUC values of calcium influx of Th1 and CD8 cells in preeclampsia compared to non-pregnant women. The maintained activation properties of Th1 lymphocytes in preeclamptic patients may contribute to the lack of Th2 dominance associated with normal pregnancy. It is of particular interest that calcium influx of Th2 lymphocytes in healthy pregnancy was insensitive to potassium channel inhibition, while calcium influx decreased significantly in non-pregnant samples upon treatment with the specific channel blockers. Of note, Th2 lymphocytes in preeclampsia presented with non-pregnant-like characteristics, and were also sensitive to MGTX and TRAM treatment. Since the regulatory function of Kv1.3 and IKCa1 channels on calcium influx appears to be limited in healthy pregnant samples, this may be an element contributing to the Th2 shift present in healthy pregnancy, but absent in preeclampsia. While calcium influx in CD8 and Th1 lymphocytes was resistant to potassium channel inhibition in preeclamptic, that of healthy pregnant lymphocytes was sensitive. Similarly to Th2 cells, while it is unclear whether the resistance of Th1 lymphocytes to potassium channel inhibition is reflected in their function, the insensitivity of the Th1 subset to the inhibition of regulatory lymphocyte potassium channels in preeclampsia may be linked to the Th1 skewness.
5.4 Lymphocyte activation and potassium channels in the newborn
Decreased functionality of neonatal T cells is a widely recognized experimental and clinical phenomenon. Reduced functioning is well characterized by a lower level of cytokine production compared to adult T cells (Cohen et al., 1999; García Vela et al., 2000). Several factors might be responsible for the decreased cytokine expression compared to adult lymphocytes. We hypothesized that short-term T lymphocyte activation properties are different in neonates compared to adults. We aimed to characterize the calcium influx kinetics upon activation in major T lymphocyte subsets (i.e. Th1, Th2, CD4 and CD8 cells) in the neonate, and its sensitivity to the specific inhibition of Kv1.3 and IKCa1 lymphocyte potassium channels (Toldi et al., 2010b).
Lower AUC and Max values in most of the investigated subsets suggest that short-term activation and associated calcium influx are decreased in neonatal lymphocytes, in line with the fact that newborns mount lower immune responses to distinct stimuli. Upon treatment of lymphocytes with selective inhibitors of the Kv1.3 and IKCa1 channels (MGTX and TRAM, respectively), calcium influx decreases in most investigated lymphocyte subsets isolated
www.intechopen.com

Experimental Conditions and Mathematical Analysis of Kinetic Measurements Using Flow Cytometry – The FacsKin Method
319
from adults. However, with the exception of the CD8 subset, such a reduction was not demonstrated in neonatal lymphocytes. These findings may partly explain why neonatal lymphocytes are less responsive to activating stimuli and, hence, exert a lower intensity of immune response. Our results improve the understanding of the mechanisms that prevent neonatal T cells from adequate activation upon activating stimuli, and partially elucidate previous experimental data indicating that a greater amount of stimulation is needed in neonatal lymphocytes compared with adults to achieve a similar immune response (Adkins, 1999; Cohen et al., 1999). The functional impairment of lymphocyte potassium channels may be of importance in those mechanisms.
5.5 Lymphocyte activation and potassium channels in multiple sclerosis
We also investigated calcium influx kinetics in multiple sclerosis (MS) patients without and with interferon (IFN) beta treatment compared to healthy individuals (Toldi et al., 2011b). We aimed to describe the effects of Kv1.3 and IKCa1 channel inhibitors on calcium influx, and to assess whether these inhibitors could potentially contribute to the treatment of MS via the selective reduction of lymphocyte activation as suggested before (Wulff et al., 2003). We demonstrated that the reactivity of lymphocytes isolated from MS patients receiving no IFN beta treatment is increased compared to healthy individuals, reflected by lower tmax and elevated Slope values in the CD4, Th1 and Th2 subsets (i.e. the peak of the calcium influx is reached more rapidly). Interestingly, these alterations were not present in the CD8 subset. Of note, while the kinetics of calcium influx is altered, comparable AUC and Max values indicate that the amount of calcium entering the lymphocytes in MS is not different from that in healthy individuals.
In healthy individuals, we found prominent differences between Th1 and Th2 cells with regard to their sensitivity to IKCa1 channel inhibition, as described above. In contrast with healthy subjects, the investigated lymphocyte subsets show altered sensitivity to the inhibition of the Kv1.3 and IKCa1 channels in MS patients without IFN beta. In this group, the inhibition of the IKCa1 channel results in a similar decrease of calcium influx in all investigated subsets. However, MGTX, the specific blocker of the Kv1.3 channel decreased the AUC value to a higher extent in CD8 cells than in CD4 cells. Therefore, the contribution of Kv1.3 channels to the activation of CD8 lymphocytes is increased in MS patients receiving no IFN beta. However, the specificity of Kv1.3 inhibition is limited to CD8 cells since other cell types, including Th1 and Th2 cells, behave in a similar manner in MS patients without IFN beta upon Kv1.3 channel inhibition. Therefore, on contrary to previous suggestions (Wulff et al., 2003), the inhibition of this channel does not seem to be specific enough, since it also affects anti-inflammatory cytokine producing Th2 cells. This would probably result in a setback of therapeutic efforts in MS. Therefore, the effects of administration of Kv1.3 channel inhibitors need to be further investigated and characterized in MS.
IFN beta therapy induces compensatory changes in calcium influx kinetics and lymphocyte potassium channel function in MS, shaping these properties more similar to those of healthy individuals. However, the suppressive effect of IFN beta treatment on lymphocyte activation is seen in Th1 cells selectively, while Th2 function is less affected. These observations might indicate a novel mechanism through which IFN beta exerts beneficial therapeutic effects on immune functionality in MS.
www.intechopen.com

Flow Cytometry – Recent Perspectives
320
5.6 Lymphocyte activation and potassium channels in type 1 diabetes
In samples taken from type 1 diabetes mellitus (T1DM) patients, the activation characteristics of lymphocytes show an evident alteration compared to healthy samples (Toldi et al., 2010c). First, we noticed that the peak of calcium influx in the overall lymphocyte population and the Th1 subset is reached more rapidly in T1DM (i.e. tmax values were decreased), while AUC and Max values were comparable. Similarly to MS, this finding raised the notion of an increased reactivity of lymphocytes in T1DM.
In lymphocytes of healthy subjects both Kv1.3 and IKCa1 channels contribute to the maintenance of calcium influx upon activation. On the contrary, the sensitivity of T1DM lymphocytes to the inhibition of Kv1.3 channels is increased, probably due to the increased expression of Kv1.3 channels (Toldi et al., 2010c). The altered activation kinetics of T1DM lymphocytes may at least partly be attributed to the increased significance of Kv1.3 channels.
Based on promising animal data, the specific inhibition of Kv1.3 channels is under extensive investigation as a possible measure to prevent the development of the autoimmune response against pancreatic beta cells (Chandy et al., 2004). Our data indicate that by specific inhibition of Kv1.3 channels, lymphocyte activation can be modulated in T1DM. However, our findings provide clear evidence for Kv1.3 channels to have an important role in each lymphocyte subset in T1DM, including Th2 lymphocytes acting as counterbalancing factors in the development of T1DM through the production of anti-inflammatory cytokines (Yoon and Jun, 2001). Therefore, administration of Kv1.3 channel inhibitors would not have an exclusive effect on cells responsible for the autoimmune response in T1DM, but may have an impact on the activation characteristics of immune cells in general. The finding that increased significance of Kv1.3 channels in lymphocyte activation is not exclusive for a specific subset, but is characteristic for most of major lymphocyte subsets in T1DM, alerts us that the overall immunomodulatory effect upon inhibition of Kv1.3 channels in T1DM needs to be further characterized.
6. References
Adkins, B. (1999). T-cell function in newborn mice and humans. Immunol Today, Vol.20, No.7, (July 1999), pp. 330-335
Bailey, S., Macardle, P.J. (2006). A flow cytometric comparison of Indo-1 to fluo-3 and Fura Red excited with low power lasers for detecting Ca(2+) flux. J Immunol Methods, Vol.311, No.1-2, (April 2006), pp. 220-225
Bates, D.M., Watts, D.G. (1988). Nonlinear Regression Analysis and its Applications. Wiley Book, New York. ISBN 0471-816434
Botvinick, E.L. Shah, J.V. (2007). Laser-based measurements in cell biology. Methods Cell Biol, Vol.82, Part I, (2007), pp. 81-109.
Brayton, C.F. (1986). Dimethyl sulfoxide (DMSO): a review. Cornell Vet, Vol.76, No.1, (January 1986), pp. 61-90.
Chandy, K.G., Wulff, H., Beeton, C., Pennington, M., Gutman, G.A., Cahalan, M.D. (2004). K+ channels as targets for specific immunomodulation. Trends Pharmacol Sci, Vol.25, No.5, (May 2004), pp. 280–289
www.intechopen.com
Experimental Conditions and Mathematical Analysis of Kinetic Measurements Using Flow Cytometry – The FacsKin Method
321
Cleveland, W.S. (1979). Robust Locally Weighed Regression and Smoothing Scatterplots. Journal of the American Statistical Association, Vol.74, No.368 (December 1979), pp. 829-836
Cohen, S.B., Perez-Cruz, I., Fallen, P., Gluckman, E., Madrigal, J.A. (1999). Analysis of the cytokine production by cord and adult blood. Hum Immunol, Vol.60, No.4, (April 1999), pp. 331-336
Darmochwal-Kolarz, D., Rolinski, J., Leszczynska-Goarzelak, B., Oleszczuk, J. (2002). The expressions of intracellular cytokines in the lymphocytes of preeclamptic patients. Am J Reprod Immunol, Vol.48, No.6, (December 2002), pp. 381-386
Demkow, U., Winklewski, P., Potapinska, O., Popko, K., Lipinska, A., Wasik, M. (2009). Kinetics of calcium ion concentration accompanying transduction of signals into neutrophils from diabetic patients and its modification by insulin. J Physiol Pharmacol, Vol.60, No.5, (November 2009), pp. 37-40
Di Leva, F., Domi, T., Fedrizzi, L., Lim, D., Carafoli, E. (2008). The plasma membrane Ca2+ ATPase of animal cells: structure, function and regulation. Arch Biochem Biophys, Vol.476, No.1, (August 2008), pp. 65–74
do Céu Monteiro, M., Sansonetty, F., Gonçalves, M.J., O'Connor, J.E.. (1999). Flow cytometric kinetic assay of calcium mobilization in whole blood platelets using Fluo-3 and CD41. Cytometry, Vol.35, No.4, (April 1999), pp. 302-310
Dolmetsch, R.E., Xu, K., Lewis, R.S. (1998). Calcium oscillations increase the efficiency and specificity of gene expression. Nature, Vol.392, No.6679, (April 1998), pp. 933–936
Duchen, M.R. (2000). Mitochondria and calcium: from cell signalling to cell death. J Physiol, Vol.529, Pt.1, (November 2000), pp. 57–68
Fanger, C.M., Neben, A.L., Cahalan, M.D. (2000). Differential Ca2+ influx, KCa channel activity, and Ca2+ clearance distinguish Th1 and Th2 lymphocytes. J Immunol, Vol.164, No.3, (February 2000), pp. 1153–1160
Feske, S. (2007). Calcium signalling in lymphocyte activation and disease. Nat Rev Immunol, Vol.7, No.9, (September 2007), pp. 690–702
García Vela, J.A., Delgado, I., Bornstein, R., Alvarez, B., Auray, M.C., Martin, I., Oña F., Gilsanz F. (2000). Comparative intracellular cytokine production by in vitro stimulated T lymphocytes from human umbilical cord blood (HUCB) and adult peripheral blood (APB). Anal Cell Pathol, Vol.20, No.2-3, (2000), pp. 93-98
Hawkins, D.M. (2004). The Problem of Overfitting. J Chem Inf Comput Sci, Vol.44, No.1 (January 2004), pp 1–12
Jakubczak, B., Wasik, M., Popko, K., Demkow, U. (2006). Kinetics of calcium ion concentration accompanying signal transduction in neutrophils from children with increased susceptibility to infections. J Physiol Pharmacol, Vol.57, No.4, (September 2006), pp. 131-137
Johnson, D.I. (2001). Cellular function probes. Current Protocols in Cytometry, Chapter4, Unit4.4, (May 2001).
June, C.H., Ledbetter, J.A., Rabinovitch, P.S., Martin, P.J., Beatty, P.G., Hansen, J.A. (1986). Distinct patterns of transmembrane calcium flux and intracellular calcium mobilization after differentiation antigen cluster 2 (E rosette receptor) or 3 (T3) stimulation of human lymphocytes. J Clin Invest, Vol.77, No.4, (April 1986), pp. 1224-1232
www.intechopen.com

Flow Cytometry – Recent Perspectives
322
June, C.H., Rabinovitch, P.S. (1990). Flow cytometric measurement of intracellular ionized calcium in single cells with indo-1 and fluo-3. Methods Cell Biol, Vol.33, Chapter5, (1990), pp.37-58.
Kaposi, A.S., Veress, G., Vásárhelyi, B., Macardle, P., Bailey, S., Tulassay, T., Treszl, A. (2008). Cytometry-acquired calcium-flux data analysis in activated lymphocytes. Cytometry A, Vol.73, No.3, (March 2008), pp. 246-253
Koenker, R., Hallock, K.F. (2001). Quantile Regression. Journal of Economic Perspectives, Vol.15, No.4 (Fall 2001), pp. 143-156
Lewis, RS. (2001). Calcium signaling mechanisms in T lymphocytes. Annu Rev Immunol, Vol.19, (April 2001), pp. 497-521
Lund-Johansen, F, Olweus, J. (1992). Signal transduction in monocytes and granulocytes measured by multiparameter flow cytometry. Cytometry, Vol.13, No.7, (September 1992), pp. 693-702
Mészáros, G., Szalay, B., Toldi, G., Kaposi, A., Vásárhelyi, B., Treszl, A. (2011). Kinetic measurements using flow cytometry: new methods for monitoring intracellular processes. Assay Drug Dev Technol, [Epub ahead of print], (September 2011).
Motulsky, H.J., Ransnas, L.A. (1987). Fitting curves to data using nonlinear regression: a practical and nonmathematical review. FASEB J, Vol.1, No.5, (November 1987), pp. 365-374
Motulsky, H., Christopoulos, A. (2004). Fitting models to biological data using linear and nonlinear regression: a practical guide to curve fitting. Oxford University Press, USA
Nelder, J.A., Mead, R. (1965). A Simplex Method for Function Minimization. Computer Journal, Vol.7, No.4, (January 1965), pp. 308-313
Norgauer, J., Dobos, G., Kownatzki, E., Dahinden, C., Burger, R., Kupper, R., Gierschik, P. (1993). Complement fragment C3a stimulates Ca2+ influx in neutrophils via a pertussis-toxin-sensitive G protein. Eur J Biochem, Vol.217, No.1, (October 1993), pp. 289-94.
Omann, G.M., Harter, J.M. (1991). Pertussis toxin effects on chemoattractant-induced response heterogeneity in human PMNs utilizing Fluo-3 and flow cytometry. Cytometry, Vol.12, No.3, (March 1991), pp. 252-259
Picard R.R., Cook, R.D. (1984). Cross-Validation of Regression Models. Journal of the American Statistical Association, Vol.79, No.387 (September 1984), pp. 575-583
Politi, A., Gaspers, L.D., Thomas, A.P., Höfer, T. (2006). Models of IP3 and Ca2+ oscillations: frequency encoding and identification of underlying feedbacks. Biophys J, Vol.90, No.9, (May 2006), pp. 3120-3133
R Development Core Team. (2006). R: A Language and Environment for Statistical Computing. Vienna, Austria: R Foundation for Statistical Computing. ISBN 3-900051-07-0
Rein, D.T., Schondorf, T., Gohring, U.J., Kurbacher, C.M., Pinto, I., Breidenbach, M., Mallmann, P., Kolhagen, H., Engel, H. (2002). Cytokine expression in peripheral blood lymphocytes indicates a switch to T(HELPER) cells in patients with preeclampsia. J Reprod Immunol, Vol.54, No.1-2, (March 2002), pp. 133-142
Rijkers, G.T., Griffioen, A.W. (1993). Changes in free cytoplasmic magnesium following activation of human lymphocytes. Biochem J, Vol.289, No.2, (January 1993), pp. 373-377
www.intechopen.com

Experimental Conditions and Mathematical Analysis of Kinetic Measurements Using Flow Cytometry – The FacsKin Method
323
Roederer, M., Treister, A., Moore, W., Herzenberg, L.A. (2001). Probability binning comparison: a metric for quantitating univariate distribution differences. Cytometry, Vol.45, No.1, (September 2001), pp. 37-46
Roederer, M. (2002). Compensation in flow cytometry. Current Protocols in Cytometry, Chapter 1, Unit 1.14, (December 2002).
Saito, S., Umekage, H., Sakamoto, Y., Sakai, M., Tanebe, K., Sasaki, Y., Morikawa, H. Increased T-helper-1-type immunity and decreased T-helper-2-type immunity in patients with preeclampsia. Am J Reprod Immunol, Vol.41, No.5, (May 1999), pp. 297-306
Saito, S., Shiozaki, A., Nakashima, A., Sakai, M., Sasaki, Y. (2007). The role of the immune system in preeclampsia. Mol. Aspects Med., Vol.28, No.2, (April 2007), pp. 192-209
Schepers, E., Glorieux, G., Dhondt, A., Leybaert, L., Vanholder, R. (2009). Flow cytometric calcium flux assay: evaluation of cytoplasmic calcium kinetics in whole blood leukocytes. J Immunol Methods, Vol.348, No.1-2, (August 2009), pp. 74-82
Stoddart, M.J. (2011). Cell viability assays: introduction. Methods Mol Biol, Vol.740, Mammalian Cell Viability, (2011), pp.1-6.
Stork, B., Neumann, K., Goldbeck, I., Alers, S., Kähne, T., Naumann, M., Engelke, M., Wienands, J. (2007). Subcellular localization of Grb2 by the adaptor protein Dok-3 restricts the intensity of Ca2+ signaling in B cells. EMBO J, Vol.26, No.4, (February 2007), pp. 1140-1149
Szalay, B., Mészáros, G., Cseh, A., Acs, L., Deák, M., Kovács, L., Vásárhelyi, B., Balog, A. (2012). Adaptive Immunity in Ankylosing Spondylitis: Phenotype and Functional Alterations of T-Cells before and during Infliximab Therapy. Clin Dev Immunol, Vol.2012, (Epub September 2011), 808724
Tang, Y., Stephenson, J.L., Othmer, H.G. (1996). Simplification and analysis of models of calcium dynamics based on IP3-sensitive calcium channel kinetics. Biophys J. Vol.70, No.1, (January 1996), pp. 246-263
Toldi, G., Stenczer, B., Treszl, A., Kollar, S., Molvarec, A., Tulassay, T., Rigo, J.Jr, Vasarhelyi, B. (2010a). Lymphocyte calcium influx characteristics and their modulation by Kv1.3 and IKCa1 channel inhibitors in healthy pregnancy and preeclampsia. Am J Reprod Immunol. Vol.65, No.2, (February 2011), pp. 154-163
Toldi, G., Treszl, A., Pongor, V., Gyarmati, B., Tulassay, T., Vasarhelyi, B. (2010b). T-lymphocyte calcium influx characteristics and their modulation by Kv1.3 and IKCa1 channel inhibitors in the neonate. Int Immunol, Vol.22, No.9, (September 2010), pp. 769-774
Toldi, G., Vasarhelyi, B., Kaposi, A.S., Meszaros, G., Panczel, P., Hosszufalusi, N., Tulassay, T., Treszl, A. (2010c). Lymphocyte activation in type 1 diabetes mellitus: the increased significance of Kv1.3 potassium channels. Immunol Lett. Vol.133, No.1, (September 2010), pp. 35-41
Toldi, G., Kaposi, A., Zsembery, Á., Treszl, A., Tulassay, T., Vásárhelyi, B. (2011a). Human Th1 and Th2 lymphocytes are distinguished by calcium flux regulation during the first ten minutes of lymphocyte activation. Immunobiology, [Epub ahead of print], (August 2011)
Toldi, G., Folyovich, A., Simon, Z., Zsiga, K., Kaposi, A., Mészáros, G., Tulassay, T., Vasarhelyi, B. (2011b). Lymphocyte calcium influx kinetics in multiple sclerosis treated without or with interferon beta. J Neuroimmunol, Vol.237, No.1-2, (August 2011), pp. 80-86
www.intechopen.com

Flow Cytometry – Recent Perspectives
324
Wulff, H., Calabresi, P.A., Allie, R., Yun, S., Pennington, M., Beeton, C., Chandy, K.G. (2003). The voltage-gated Kv1.3 K+channel in effector memory T cells as new target for MS. J Clin Invest. Vol.111, No.11, (June 2003), pp. 1703–1713
Yoon, J.W., Jun, H.S. (2001). Cellular and molecular pathogenic mechanisms of insulin-dependent diabetes mellitus. Ann N Y Acad Sci, Vol.928, (April 2001), pp. 200–211
www.intechopen.com

Flow Cytometry - Recent PerspectivesEdited by M.Sc. Ingrid Schmid
ISBN 978-953-51-0626-5Hard cover, 500 pagesPublisher InTechPublished online 13, June, 2012Published in print edition June, 2012
InTech EuropeUniversity Campus STeP Ri Slavka Krautzeka 83/A 51000 Rijeka, Croatia Phone: +385 (51) 770 447 Fax: +385 (51) 686 166www.intechopen.com
InTech ChinaUnit 405, Office Block, Hotel Equatorial Shanghai No.65, Yan An Road (West), Shanghai, 200040, China
Phone: +86-21-62489820 Fax: +86-21-62489821
"Flow Cytometry - Recent Perspectives" is a compendium of comprehensive reviews and original scientificpapers. The contents illustrate the constantly evolving application of flow cytometry to a multitude of scientificfields and technologies as well as its broad use as demonstrated by the international composition of thecontributing author group. The book focuses on the utilization of the technology in basic sciences and coverssuch diverse areas as marine and plant biology, microbiology, immunology, and biotechnology. It is hoped thatit will give novices a valuable introduction to the field, but will also provide experienced flow cytometrists withnovel insights and a better understanding of the subject.
How to referenceIn order to correctly reference this scholarly work, feel free to copy and paste the following:
Ambrus Kaposi, Gergely Toldi, Gergoo Meszaros, Balazs Szalay, Gabor Veress and Barna Vasarhelyi (2012).Experimental Conditions and Mathematical Analysis of Kinetic Measurements Using Flow Cytometry – TheFacsKin Method, Flow Cytometry - Recent Perspectives, M.Sc. Ingrid Schmid (Ed.), ISBN: 978-953-51-0626-5,InTech, Available from: http://www.intechopen.com/books/flow-cytometry-recent-perspectives/experimental-conditions-and-mathematical-analysis-of-kinetic-measurements-using-flow-cytometry-t

© 2012 The Author(s). Licensee IntechOpen. This is an open access articledistributed under the terms of the Creative Commons Attribution 3.0License, which permits unrestricted use, distribution, and reproduction inany medium, provided the original work is properly cited.