Excellence - publicbank.com.hk · Branch Network Chairman’s Statement Our Corporate Family Report...
132
Annual Report 2013 有限公司 大眾銀行 Excellence is Our Commitment
Transcript of Excellence - publicbank.com.hk · Branch Network Chairman’s Statement Our Corporate Family Report...

Annual Report 2013
有 限 公 司大 眾 銀 行
Excellenceis Our Commitment

CORPORATE INFORMATION
Board of DirectorsNon-executive ChairmanTan Sri Dato’ Sri Dr. Teh Hong Piow (Chairman),
also Founder and Chairman of
Public Bank Berhad
Executive DirectorsTan Yoke Kong
Chong Yam Kiang
Non-executive DirectorsTan Sri Dato’ Sri Tay Ah Lek
Quah Poh Keat (Re-designated as
Non-executive Director on 3 October 2013)
Dato’ Chang Kat Kiam
Independent Non-executive DirectorsTan Sri Datuk Seri Utama Thong Yaw Hong
(Co-Chairman)
Lee Chin Guan
Company SecretaryChan Sau Kuen
Registered Office and Head Office2/F, Public Bank Centre
120 Des Voeux Road Central
Central, Hong Kong
Telephone : (852) 2541 9222
Facsimile : (852) 2541 0009
Website : www.publicbank.com.hk
AuditorsErnst & Young
Certified Public Accountants
Legal AdvisersCharles Yeung Clement Lam Liu & Yip
Deacons
Siao, Wen and Leung
Principal BankersThe Bank of East Asia, Limited
CIMB Bank Berhad
Oversea-Chinese Banking Corporation Limited
Public Bank Berhad
Public Bank (L) Ltd
The Standard Bank of South Africa Limited
Standard Chartered Bank (Hong Kong) Limited
The Hongkong and Shanghai Banking Corporation Limited
This report is printed on recyclable paper
Branch Network
Chairman’s Statement
Our Corporate Family
Report of the Directors
Independent Auditors’ Report
Consolidated Income Statement
Consolidated Statement of
Comprehensive Income
02
04
06
10
13
14
15
Consolidated Statement of
Financial Position
Consolidated Statement of
Changes in Equity
Consolidated Statement of
Cash Flows
Notes to Financial Statements
Supplementary Financial Information
16
18
19
21
116
CONTENTS
Public Bank (Hong Kong) LimitedAnnual Report 2013
23
26
30
24
27
31
25
28
3229
1111
1519
12
16
20
13
17
21
14
18
22
15 9
26
9
10
35
34 33
63
7 14
8
Kowloon
New Territories
Hong Kong Island
China
02
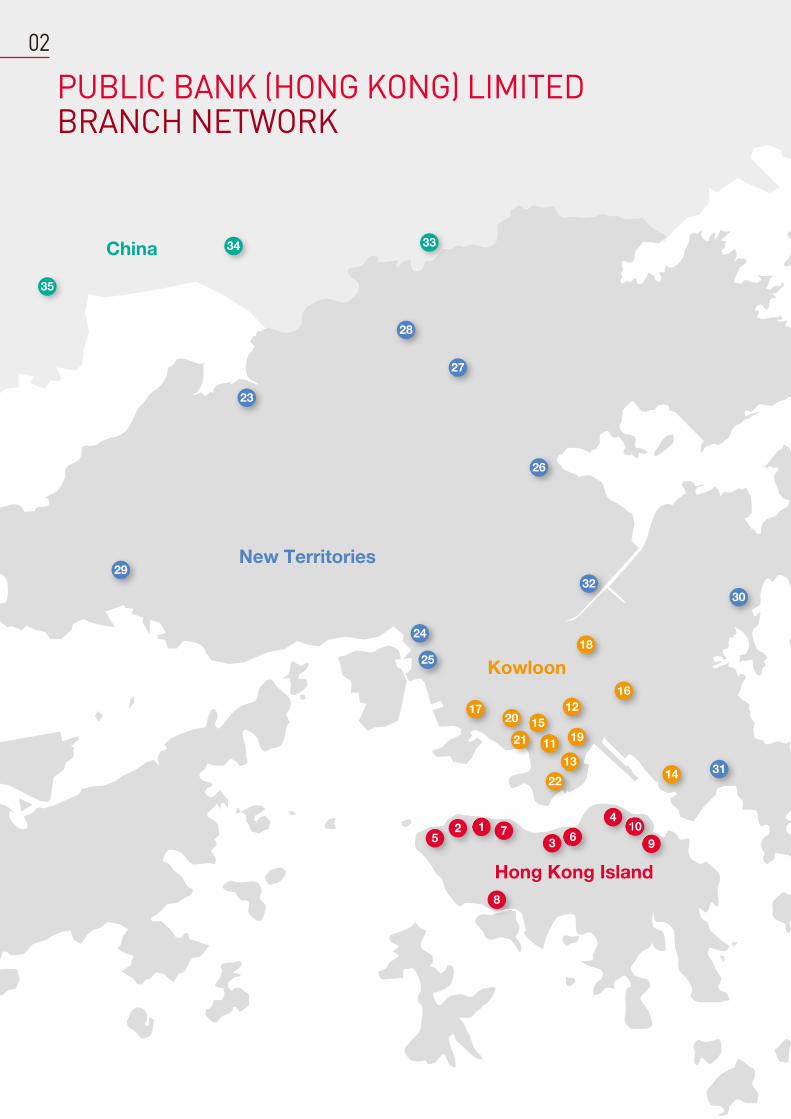
PUBLIC BANK (HONG KONG) LIMITED BRANCH NETWORK

Public Bank (Hong Kong) Limited Annual Report 2013 03
1 Main BranchG/F, Public Bank Centre120 Des Voeux Road CentralTel: 2541 9222 Fax: 2545 2866Manager: So Wai Ming, Aubrey
2 Western BranchShop 2-3, G/F, Kam Kwan Building163-173 Des Voeux Road WestTel: 2858 2220 Fax: 2858 2638Manager: Pang Ching Fan, Fanny
3 Wanchai Commercial CentreUnit A, 9/F, China Overseas Building139 Hennessy RoadTel: 2891 4171 Fax: 2834 1012
4 North Point BranchShop 2, G/F, Two Chinachem Exchange Square338 King’s RoadTel: 2568 5141 Fax: 2567 0655Manager: Ng Ngan Sum, Helen
11 Yaumatei BranchShop 6, G/F, Wing Kiu Building530-538 Nathan RoadTel: 2381 1678 Fax: 2395 6398Manager: Wong Mun Yu, Moon
12 Kowloon City BranchG/F, 15 Nga Tsin Wai RoadTel: 2382 0147 Fax: 2718 4281Manager: Yan Yi Kam, Patrick
13 Hung Hom BranchG/F, Hunghom Commercial Centre37 Ma Tau Wai RoadTel: 2363 9213 Fax: 2363 3195Manager: Lee Wai Kwan, Luceta
14 Kwun Tong BranchUnit 2310, Tower 1, Millennium City 1388 Kwun Tong RoadTel: 2389 9119 Fax: 2389 9969Manager: Wong Lam Fai, Philip
23 Yuen Long BranchShop 5, G/F, Fu Ho Building3-7 Kau Yuk RoadTel: 2479 4265 Fax: 2473 3934Manager: Fong Fung Mei, Marisa
24 Tsuen Wan BranchG/F, Victory Court, 185-187 Castle Peak RoadTel: 2490 4191 Fax: 2490 4811Manager: Kan Pak Ling, Lucia
25 Kwai Chung BranchShop 88B of Trendy Place,3/F, Kwai Chung Plaza7-11 Kwai Foo RoadTel: 2480 0002 Fax: 2401 2367Manager: Lau Yiu Fai, Lawrence
33 Shenzhen BranchShop No. 1, G/F, Carrianna Friendship SquareRenminnan Road, ShenzhenPeople’s Republic of ChinaTel : (86-755) 2518 2822Fax : (86-755) 2518 2327Manager : Cheung Po Tung, David
34 Futian Sub-branch1-3 Jinrun Mansion, No. 6019 Shennan RoadFutian District, ShenzhenPeople’s Republic of ChinaTel : (86-755) 8280 0026Fax : (86-755) 8280 0016Manager : Ye Jun Liang, Leo
Kowloon
New Territories
China
15 Mongkok BranchG/F, JCG Building, 16 Mongkok RoadTel: 2391 8393 Fax: 2391 6909Manager: Chan Sau Ping, Rebecca
16 San Po Kong BranchShop B, G/F, Perfect Industrial Building31 Tai Yau StreetTel: 2326 8318 Fax: 2326 9180Manager: Lau Keung Fai, David
17 Cheung Sha Wan BranchUnit C2, G/F, 746 Cheung Sha Wan RoadTel: 2786 9858 Fax: 2786 9506Manager: Lai Siu Yee, Flora
18 Wong Tai Sin BranchShop 641-642, 6/F,Tsz Wan Shan Shopping CentreTel: 2328 7332 Fax: 2328 7991Manager: Kwong Hon Wun, Peter
19 To Kwa Wan BranchShop D, G/F, In House, No. 307 To Kwa Wan RoadTel: 2362 0238 Fax: 2362 3999Manager: Choi Kam Yee, Catalina
20 Prince Edward BranchG/F, 751 Nathan RoadTel: 2397 3830 Fax: 2397 1006Manager: Leung Yuen Fan, Maggie
21 Tai Kok Tsui BranchShop 2B, G/F, Tai Chuen Building88-102 Ivy StreetTel: 2392 1538 Fax: 2392 1101Manager: So Tak Fai, Peter
22 Tsim Sha Tsui BranchG/F, (Front Portion),43 Mody RoadTel: 2721 1218 Fax: 2721 1028Manager: Yam Oi Yin, Pauline
26 Tai Po BranchEastmost Shop on G/F, Nos. 37/39 Po Yick StreetTel: 2657 2861 Fax: 2657 7389Manager: Tsang Wai Chor
27 Fanling BranchG/F, 11 Wo Lung StreetLuen Wo MarketTel: 2669 1559 Fax: 2669 8780Manager: Wong Kai Ip, Jimmy
28 Sheung Shui BranchG/F, 137 San Shing AvenueTel: 2639 0307 Fax: 3124 0091Manager: Chong Mei Kuen, Joe
29 Tuen Mun BranchShop E, G/F, Kam Lai BuildingNos. 1-7 Kai Man PathTel: 2440 1298 Fax: 2440 1398Manager: Lam Wong Kan, Kent
30 Sai Kung BranchG/F, 16 Yi Chun StreetTel: 2792 8588 Fax: 2791 0077Manager: Kee Ka Wai
31 Tseung Kwan O BranchG105-106, G/F, Metro City Plaza ITel: 2701 7688 Fax: 2701 7628Manager: Lau Chi Kai, Thomas
32 Shatin BranchShop Nos. 4-6B, Lucky Plaza Commercial CentreTel: 2601 6308 Fax: 2601 3686Manager: Fok Man Yi, Grace
35 Shekou Sub-branchShop No.155-156, Coastal Building (East Block)Hai De San Dao, Nanshan District, ShenzhenPeople’s Republic of ChinaTel : (86-755) 8627 1388Fax : (86-755) 8627 0699Manager : Ying Wei Jun, Yoyo
Shenyang Representative OfficeUnit 1801, 18/F, Sunwah Hi-tech BuildingNo. 262 Shifu Road, Shenhe District, ShenyangLiaoning Province, People’s Republic of ChinaTel : (86-24) 2279 1368Fax : (86-24) 2279 1369Representative : Li Yu Jie
Shanghai Representative OfficeRoom G, 8/F, Majesty Building138 Pu Dong Avenue, ShanghaiPeople’s Republic of ChinaTel : (86-21) 5887 8851Fax : (86-21) 5887 9951Representative : Chen Li Hang
Taipei Representative OfficeRoom 905, 9/F, No. 18 Section 1Chang-An E. Road, Taipei, TaiwanTel : (886-2) 2563 8789Fax : (886-2) 2564 2047Representative : Lu Chia Nan, Deanna
5 Shek Tong Tsui BranchShop B1, G/F, Hong Kong Plaza369-375 Des Voeux Road WestTel: 2546 2055 Fax: 2559 7962Manager: Ting Lai May, May
6 Causeway Bay BranchG/F and M/F, 447 Hennessy RoadTel: 2572 2363 Fax: 2572 3033Manager: Leung Siu Ying, Fanny
7 Central BranchUnit A, G/F, Wing On House71 Des Voeux Road CentralTel: 2147 2140 Fax: 2147 2244Manager: Wong Hon Choi
8 Aberdeen BranchShop C, G/F, Kong Kai Building184 Aberdeen Main RoadTel: 2871 0928 Fax: 2871 0383Manager: Wong Chun Hoi, Wilson
9 Shau Kei Wan BranchShop 2, G/F, Hong Tai Building326-332 Shaukeiwan RoadTel: 2884 3993 Fax: 2885 9283Manager: Ngan Pui Shan, Sandy
10 Quarry Bay BranchShop 8, G/F, Oceanic Mansion1010-1026 King’s RoadTel: 2856 3880 Fax: 2856 0833Manager: Chui King Yan, Connie
Head Office and BranchesHead Office
2/F, Public Bank Centre, 120 Des Voeux Road Central
Tel : 2541 9222 Telex : 73085 CBHK HKHH
P.O. Box : G.P.O. Box 824 Fax : 2541 0009
Website : www.publicbank.com.hk
Hong Kong Island

CHAIRMAN’S STATEMENT04
Tan Sri Dato’ Sri Dr. Teh Hong Piow, Chairman
I am delighted to deliver the results of Public Bank (Hong Kong) Limited (the “Bank”) and its subsidiaries (the “Group”) for the year 2013.
Financial HighlightsThe Group recorded a profit after tax of HK$352.1 million for the year ended 31 December 2013, representing an
increase of HK$19.9 million or 6.0% when compared to the previous year. Total loans and advances (including trade bills)
of the Group increased by HK$89.1 million or 0.3% to HK$27.09 billion as at 31 December 2013 from HK$27.0 billion as
at 31 December 2012. Customer deposits of the Group increased by HK$677.4 million or 2.3% to HK$30.09 billion as at
31 December 2013 from HK$29.41 billion as at 31 December 2012.
The Board of Directors (the “Board”) had declared an interim dividend of HK$5.989 (2012: HK$5.203) per share and
a special dividend of HK$37.122 (2012: Nil) per share in June 2013. The Board recommends the payment of a final
dividend of HK$5.541 (2012: HK$5.2349) per share, making a total dividend of HK$48.652 (2012: HK$10.4379) per
share for 2013. The total dividend declared and recommended for the year 2013 amounted to HK$720.8 million.
For the year under review, the Group’s net interest income increased by HK$71.3 million or 5.8% to HK$1.30 billion from
HK$1.23 billion in the previous year. Interest income increased by HK$11.7 million or 0.7% to HK$1.61 billion, whilst
interest expense decreased by HK$59.6 million or 16.1% to HK$310.7 million. Total operating income of the Group
increased by HK$66.8 million or 4.6% to HK$1.50 billion for the year 2013 as a result of the increase in net interest
income in 2013. Total operating expenses (before changes in fair value of investment properties) of the Group increased
by HK$16.6 million or 2.2% to HK$755.6 million, mainly due to increase in staff costs and branch premises related
costs. Gains on fair value of investment properties decreased by HK$13.3 million to HK$2.0 million as compared to the
previous year. Impairment allowances for loans and advances increased by HK$8.2 million or 2.6% to HK$322.0 million
when compared to the previous year. The impairment allowances were mainly related to the unsecured personal loans
business of Public Finance Limited (“Public Finance”).
CHAIRMAN’S STATEMENT
Public Bank (Hong Kong) Limited Annual Report 2013 05
Branch Network and Business ReviewIn 2013, the Bank, which has a branch network of 32 branches in Hong Kong and 3 branches in Shenzhen in the
People’s Republic of China (“PRC”), continued to focus on providing a broad range of commercial and retail banking
services to its targeted market segments. Public Finance, a subsidiary of the Bank, which has a branch network of 42
branches in Hong Kong, continued to focus on its core business in personal lending. The Group has a combined network
of 77 branches as at the end of 2013. The Group also undertakes securities trading business through two stock broking
subsidiaries. The Group will continue to adopt prudent and flexible business strategies and adjust to market changes
accordingly in the expansion of its customer base and business.
Loans and DepositsDuring the year under review, the Group’s total loans and advances increased by HK$89.1 million or 0.3% to HK$27.09
billion as at 31 December 2013. The Bank recorded an increase in total loans and advances (including trade bills) of
HK$183.1 million or 0.8% to HK$22.55 billion as at 31 December 2013. Public Finance recorded a decrease in total
loans and advances of HK$94.0 million or 2.0% to HK$4.54 billion as at 31 December 2013. The Group’s impaired loans
to total loans ratio improved to 0.63% as at 31 December 2013 from 0.85% as at 31 December 2012. The impaired
loans were mainly related to the unsecured personal loans business of Public Finance.
The Group’s customer deposits for the year under review increased by HK$677.4 million or 2.3% to HK$30.09 billion
as at 31 December 2013 from HK$29.41 billion as at 31 December 2012. The Bank recorded an increase in customer
deposits of HK$464.8 million or 1.8% to HK$26.20 billion as at 31 December 2013. Public Finance recorded an increase
in customer deposits of HK$219.9 million or 5.7% to HK$4.05 billion as at 31 December 2013.
The Group will continue to focus on expanding its retail and commercial banking and consumer loan businesses through
the extensive branch network of the Group, offering innovative products and pursuing aggressive marketing activities and
competitive pricing strategies, whilst providing excellent customer service.
The Group will continue to seek further synergies in developing the Group’s businesses as well as to enhance its
operating cost efficiency, and streamline the support services of the combined branch networks of the Bank and Public
Finance.
AcknowledgementOn behalf of the Board, I wish to take this opportunity to express our appreciation to the management and staff of the
Group for their commitment, dedication and perseverance, and sincere gratitude to our customers for their invaluable
patronage, and to the shareholders for their continued confidence in and support of the Group. I would also like to
express our appreciation and gratitude to the Hong Kong Monetary Authority (the “HKMA”), the Securities and Futures
Commission and other relevant authorities for their invaluable advice, guidance and support.
Tan Sri Dato’ Sri Dr. Teh Hong Piow
Chairman

5
1
6
2
7
8
3
4
9
10
Corporate Events & Recreational Activities
OUR CORPORATE FAMILY06

1 Mr. Tan delivering his key-note address at the Group’s Annual Dinner 2013
2 Mr. Tan, Chief Executive of Public Bank (Hong Kong), shook hands with the Chief Executive of AIA Hong Kong at the Bancassurance Partnership Launching Ceremony
3 Re-location of Tsim Sha Tsui Branch of Public Bank (Hong Kong) to a better site in December 2013
4 A happy gathering of the staff and families at the Cultural-Heritage Day Trip to the New Territories organised by the Group’s Sports Club
5 Senior management of Public Bank (Hong Kong) and AIA Hong Kong at the launching ceremony of the “Partnership for a Lean of Triumph” – partnership on bancassurance business
6 The Rocking Gangnam Style Dance “Battle of the Sexes” performed by staff at the Group’s Annual Dinner 2013
7 A group photo at the Sheung Shui Branch of Public Bank (Hong Kong) re-location opening ceremony
8 Dance performed by the PB Cheering Team at the Group’s Annual Dinner 2013
9 Mr. Tan posing with the staff performers and the Organising Committee of the Group’s Annual Dinner 2013 after enjoying the excellent shows
10 The PB Football Team celebrates the victory in the ICBC (Asia) Football League 2013
Public Bank (Hong Kong) Limited Annual Report 2013 07

Marketing & Promotions
OUR CORPORATE FAMILY08

Public Bank (Hong Kong) Limited Annual Report 2013 09
REPORT OFTHE DIRECTORS
10
The Directors present their report and the audited financial statements of the Bank and of the Group for the year ended
31 December 2013.
Principal ActivitiesThe principal activities of the Group have not changed during the year and consisted of the provision of a comprehensive
range of banking, financial and related services.
Results and DividendsThe Group’s profit for the year ended 31 December 2013 and the state of affairs of the Bank and of the Group as at that
date are set out in the financial statements on pages 14 to 115.
Interim dividend of HK$5.989 (2012: HK$5.203) and special dividend of HK$37.122 (2012: Nil) per ordinary share were
declared and paid during the year. The Directors recommend the payment of a final dividend of HK$5.5410 (2012:
HK$5.2349) per ordinary share for the year.
Property and Equipment, Land Held Under Finance Leases and Investment PropertiesDetails of movements in the property and equipment, land held under finance leases and investment properties of the
Bank and of the Group during the year are set out in notes 25, 26 and 27 to the financial statements, respectively.
Share CapitalThere was no movement in either the Bank’s authorised or issued share capital during the year.
ReservesDetails of movements in the reserves of the Bank and of the Group during the year are set out in note 33 to the financial
statements and the consolidated statement of changes in equity.
DirectorsThe Directors of the Bank during the year and up to the date of this report were as follows:
Non-executive Directors:
Tan Sri Dato’ Sri Dr. Teh Hong Piow, Chairman
Tan Sri Dato’ Sri Tay Ah Lek
Quah Poh Keat (Re-designated as Non-executive Director on 3 October 2013)
Dato’ Chang Kat Kiam
Independent Non-executive Directors:
Tan Sri Datuk Seri Utama Thong Yaw Hong, Co-Chairman
Lee Chin Guan
Executive Directors:
Tan Yoke Kong
Chong Yam Kiang
In accordance with Articles 105 and 106 of the New Articles of Association of the Bank, Tan Sri Dato’ Sri Dr. Teh Hong
Piow, Mr. Quah Poh Keat and Mr. Lee Chin Guan shall retire by rotation and, being eligible, will offer themselves for
re-election at the forthcoming annual general meeting (“AGM”).
Public Bank (Hong Kong) Limited Annual Report 2013 11
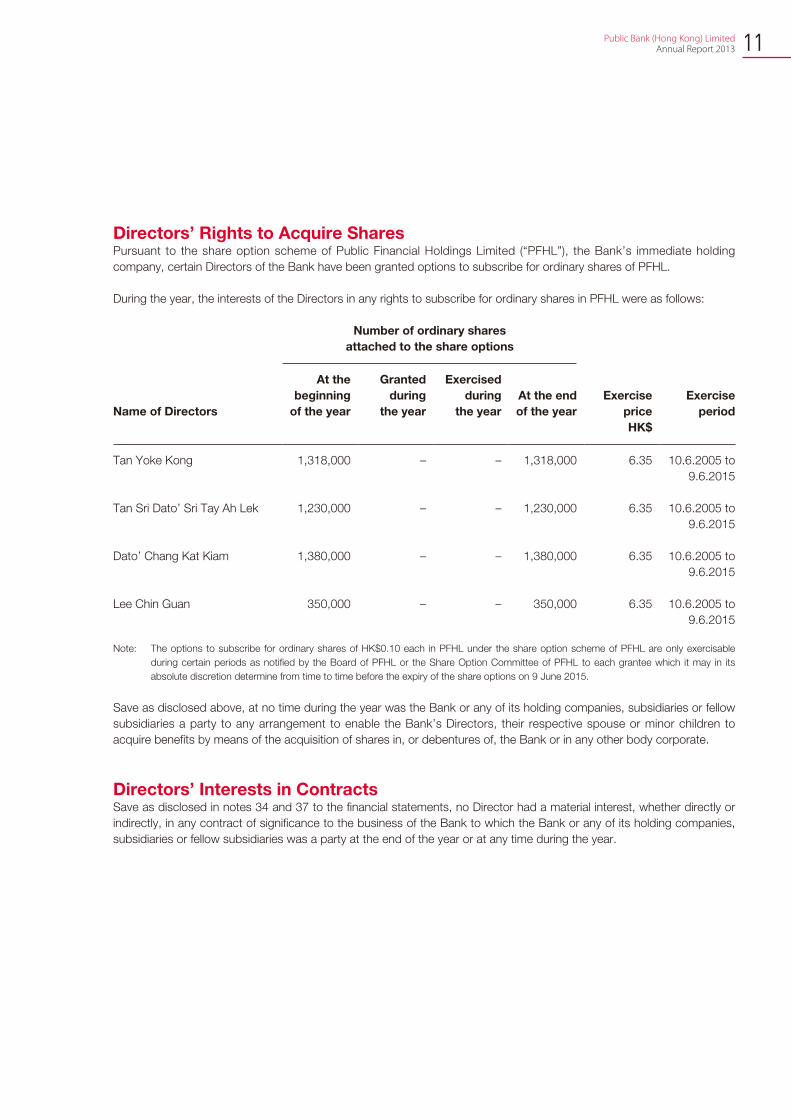
Directors’ Rights to Acquire SharesPursuant to the share option scheme of Public Financial Holdings Limited (“PFHL”), the Bank’s immediate holding
company, certain Directors of the Bank have been granted options to subscribe for ordinary shares of PFHL.
During the year, the interests of the Directors in any rights to subscribe for ordinary shares in PFHL were as follows:
Number of ordinary shares
attached to the share options
Name of Directors
At the
beginning
of the year
Granted
during
the year
Exercised
during
the year
At the end
of the year
Exercise
price
Exercise
period
HK$
Tan Yoke Kong 1,318,000 – – 1,318,000 6.35 10.6.2005 to
9.6.2015
Tan Sri Dato’ Sri Tay Ah Lek 1,230,000 – – 1,230,000 6.35 10.6.2005 to
9.6.2015
Dato’ Chang Kat Kiam 1,380,000 – – 1,380,000 6.35 10.6.2005 to
9.6.2015
Lee Chin Guan 350,000 – – 350,000 6.35 10.6.2005 to
9.6.2015
Note: The options to subscribe for ordinary shares of HK$0.10 each in PFHL under the share option scheme of PFHL are only exercisable
during certain periods as notified by the Board of PFHL or the Share Option Committee of PFHL to each grantee which it may in its
absolute discretion determine from time to time before the expiry of the share options on 9 June 2015.
Save as disclosed above, at no time during the year was the Bank or any of its holding companies, subsidiaries or fellow
subsidiaries a party to any arrangement to enable the Bank’s Directors, their respective spouse or minor children to
acquire benefits by means of the acquisition of shares in, or debentures of, the Bank or in any other body corporate.
Directors’ Interests in ContractsSave as disclosed in notes 34 and 37 to the financial statements, no Director had a material interest, whether directly or
indirectly, in any contract of significance to the business of the Bank to which the Bank or any of its holding companies,
subsidiaries or fellow subsidiaries was a party at the end of the year or at any time during the year.
REPORT OFTHE DIRECTORS
12
Compliance with Supervisory Policy ManualThe Group has complied with the guidelines in the Supervisory Policy Manual (“SPM”) issued by the HKMA as follows:
i) Module CA-D-1 “Guideline on the Application of the Banking (Disclosure) Rules (“BDR”)”, ii) Module CG-1 “Corporate
Governance of Locally Incorporated Authorised Institutions” except for Paragraph 4.5 which requires licenced banks to
have either one-third or three of board members, whichever is higher, to be independent non-executive directors; and iii)
Module CG-5 “Guideline on a Sound Remuneration System”.
The non-compliance of Paragraph 4.5 of SPM Module CG-1 arose from the re-designation of Mr. Quah Poh Keat as
a Non-executive Director of the Bank on 3 October 2013 upon his appointment as a Deputy Chief Executive of Public
Bank Berhad (“Public Bank”), the ultimate holding Company of the Bank. Following Mr. Quah’s re-designation, the Bank
only has 2 Independent Non-executive Directors and hence, fails to meet the requirement under Paragraph 4.5 of SPM
Module CG-1. The Bank then identified two suitable candidates to fill the required number of Independent Non-executive
Directors, and relevant applications have been submitted to the HKMA for approval.
The Bank has complied with the capital requirements related to capital base and capital adequacy ratio stipulated by the
HKMA.
DonationsDuring the year, the Group made charitable donations totaling HK$84,600 (2012: Nil).
AuditorsErnst & Young retire and a resolution for their re-appointment as auditors of the Bank will be proposed at the forthcoming
AGM.
ON BEHALF OF THE BOARD
Tan Sri Datuk Seri Utama Thong Yaw Hong Tan Yoke Kong
Director Director
Hong Kong
16 January 2014
INDEPENDENT AUDITORS’ REPORT
Public Bank (Hong Kong) Limited Annual Report 2013 13
To the shareholders of Public Bank (Hong Kong) Limited(Incorporated in Hong Kong with limited liability)
We have audited the consolidated financial statements of Public Bank (Hong Kong) Limited (the “Bank”) and its subsidiaries (together, the “Group”) set out on pages 14 to 115, which comprise the consolidated and the Bank’s statements of financial position as at 31 December 2013, and the consolidated income statement, the consolidated statement of comprehensive income, the consolidated statement of changes in equity and the consolidated statement of cash flows for the year then ended, and a summary of significant accounting policies and other explanatory information.
Directors’ Responsibility for the Consolidated Financial StatementsThe directors of the Bank are responsible for the preparation of consolidated financial statements that give a true and fair view in accordance with Hong Kong Financial Reporting Standards issued by the Hong Kong Institute of Certified Public Accountants and the Hong Kong Companies Ordinance, and for such internal control as the directors determine is necessary to enable the preparation of consolidated financial statements that are free from material misstatement, whether due to fraud or error.
Auditors’ ResponsibilityOur responsibility is to express an opinion on these consolidated financial statements based on our audit. Our report is made solely to you, as a body, in accordance with Section 141 of the Hong Kong Companies Ordinance, and for no other purpose. We do not assume responsibility towards or accept liability to any other person for the contents of this report.
We conducted our audit in accordance with Hong Kong Standards on Auditing issued by the Hong Kong Institute of Certified Public Accountants. Those standards require that we comply with ethical requirements and plan and perform the audit to obtain reasonable assurance about whether the consolidated financial statements are free from material misstatement.
An audit involves performing procedures to obtain audit evidence about the amounts and disclosures in the consolidated financial statements. The procedures selected depend on the auditors’ judgement, including the assessment of the risks of material misstatement of the consolidated financial statements, whether due to fraud or error. In making those risk assessments, the auditors consider internal control relevant to the entity’s preparation of consolidated financial statements that give a true and fair view in order to design audit procedures that are appropriate in the circumstances, but not for the purpose of expressing an opinion on the effectiveness of the entity’s internal control. An audit also includes evaluating the appropriateness of accounting policies used and the reasonableness of accounting estimates made by the directors, as well as evaluating the overall presentation of the consolidated financial statements.
We believe that the audit evidence we have obtained is sufficient and appropriate to provide a basis for our audit opinion.
OpinionIn our opinion, the consolidated financial statements give a true and fair view of the state of affairs of the Bank and of the Group as at 31 December 2013, and of the Group’s profit and cash flows for the year then ended in accordance with Hong Kong Financial Reporting Standards and have been properly prepared in accordance with the Hong Kong Companies Ordinance.
Ernst & YoungCertified Public Accountants22/F CITIC Tower1 Tim Mei AvenueCentral, Hong Kong16 January 2014
CONSOLIDATED INCOME STATEMENTFor the year ended 31 December 2013
14
2013 2012
Notes HK$’000 HK$’000
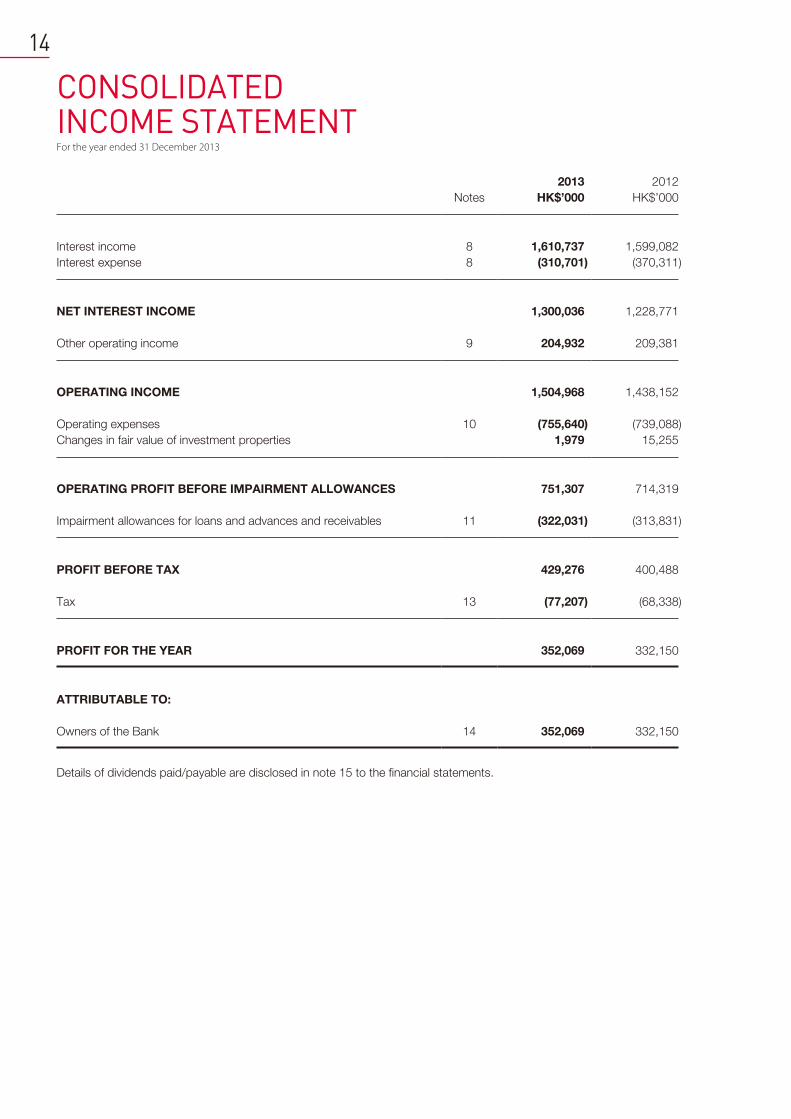
Interest income 8 1,610,737 1,599,082
Interest expense 8 (310,701) (370,311)
NET INTEREST INCOME 1,300,036 1,228,771
Other operating income 9 204,932 209,381
OPERATING INCOME 1,504,968 1,438,152
Operating expenses 10 (755,640) (739,088)
Changes in fair value of investment properties 1,979 15,255
OPERATING PROFIT BEFORE IMPAIRMENT ALLOWANCES 751,307 714,319
Impairment allowances for loans and advances and receivables 11 (322,031) (313,831)
PROFIT BEFORE TAX 429,276 400,488
Tax 13 (77,207) (68,338)
PROFIT FOR THE YEAR 352,069 332,150
ATTRIBUTABLE TO:
Owners of the Bank 14 352,069 332,150
Details of dividends paid/payable are disclosed in note 15 to the financial statements.

Public Bank (Hong Kong) Limited Annual Report 2013
CONSOLIDATED STATEMENT OF COMPREHENSIVE INCOME
For the year ended 31 December 2013
15
2013 2012
HK$’000 HK$’000
PROFIT FOR THE YEAR 352,069 332,150
OTHER COMPREHENSIVE INCOME FOR THE YEAR
Other comprehensive income to be reclassified to profit or loss in
subsequent periods:
Exchange gain on translating foreign operations, net of tax 13,661 5,646
TOTAL COMPREHENSIVE INCOME FOR THE YEAR 365,730 337,796
ATTRIBUTABLE TO:
Owners of the Bank 365,730 337,796
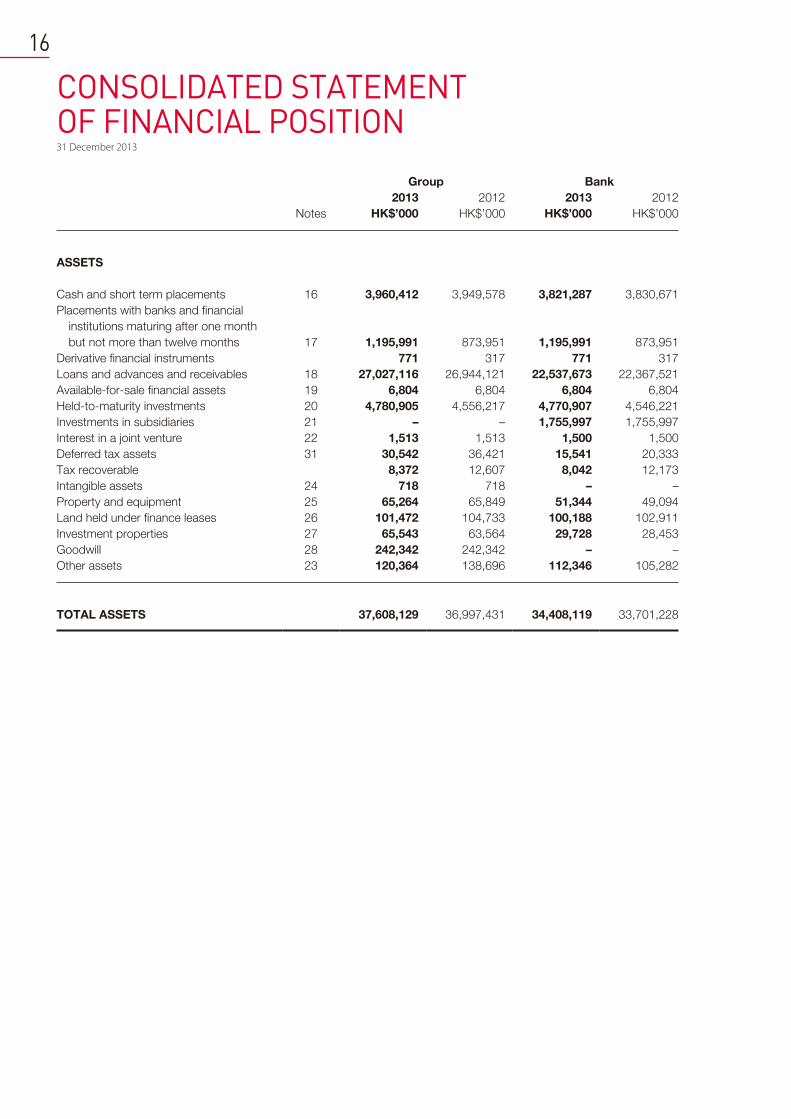
CONSOLIDATED STATEMENT OF FINANCIAL POSITION31 December 2013
16
Group Bank
2013 2012 2013 2012
Notes HK$’000 HK$’000 HK$’000 HK$’000
ASSETS
Cash and short term placements 16 3,960,412 3,949,578 3,821,287 3,830,671
Placements with banks and financial
institutions maturing after one month
but not more than twelve months 17 1,195,991 873,951 1,195,991 873,951
Derivative financial instruments 771 317 771 317
Loans and advances and receivables 18 27,027,116 26,944,121 22,537,673 22,367,521
Available-for-sale financial assets 19 6,804 6,804 6,804 6,804
Held-to-maturity investments 20 4,780,905 4,556,217 4,770,907 4,546,221
Investments in subsidiaries 21 – – 1,755,997 1,755,997
Interest in a joint venture 22 1,513 1,513 1,500 1,500
Deferred tax assets 31 30,542 36,421 15,541 20,333
Tax recoverable 8,372 12,607 8,042 12,173
Intangible assets 24 718 718 – –
Property and equipment 25 65,264 65,849 51,344 49,094
Land held under finance leases 26 101,472 104,733 100,188 102,911
Investment properties 27 65,543 63,564 29,728 28,453
Goodwill 28 242,342 242,342 – –
Other assets 23 120,364 138,696 112,346 105,282
TOTAL ASSETS 37,608,129 36,997,431 34,408,119 33,701,228

Public Bank (Hong Kong) Limited Annual Report 2013 17
Group Bank
2013 2012 2013 2012
Notes HK$’000 HK$’000 HK$’000 HK$’000
EQUITY AND LIABILITIES
LIABILITIES
Deposits and balances of banks and
other financial institutions at
amortised cost 483,401 538,296 1,256,280 1,123,404
Derivative financial instruments 610 135 610 135
Customer deposits at amortised cost 29 30,090,403 29,412,992 26,250,420 25,786,603
Certificates of deposit issued at
amortised cost 1,794,492 649,833 1,794,492 649,833
Unsecured bank loans at amortised cost 30 – 797,061 – 797,061
Current tax payable 22,285 18,307 12,895 5,229
Deferred tax liabilities 31 6,907 8,326 4,232 5,466
Other liabilities 23 317,178 329,065 260,259 239,867
TOTAL LIABILITIES 32,715,276 31,754,015 29,579,188 28,607,598
EQUITY ATTRIBUTABLE TO OWNERS
OF THE BANK
Issued capital 32 1,481,600 1,481,600 1,481,600 1,481,600
Reserves 33 3,411,253 3,761,816 3,347,331 3,612,030
TOTAL EQUITY 4,892,853 5,243,416 4,828,931 5,093,630
TOTAL EQUITY AND LIABILITIES 37,608,129 36,997,431 34,408,119 33,701,228
Tan Sri Datuk Seri Utama Thong Yaw Hong Tan Yoke Kong Chong Yam Kiang
Director Director Director
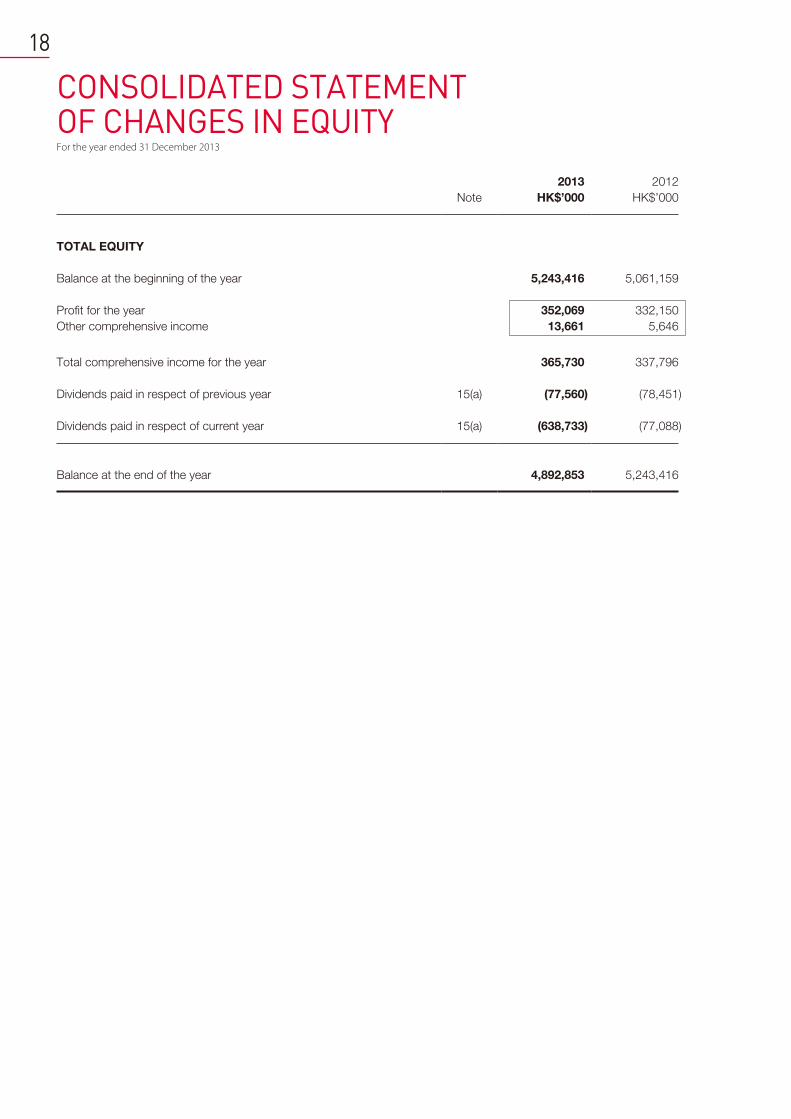
CONSOLIDATED STATEMENT OF CHANGES IN EQUITYFor the year ended 31 December 2013
18
2013 2012
Note HK$’000 HK$’000
TOTAL EQUITY
Balance at the beginning of the year 5,243,416 5,061,159
Profit for the year 352,069 332,150
Other comprehensive income 13,661 5,646
Total comprehensive income for the year 365,730 337,796
Dividends paid in respect of previous year 15(a) (77,560) (78,451)
Dividends paid in respect of current year 15(a) (638,733) (77,088)
Balance at the end of the year 4,892,853 5,243,416
Public Bank (Hong Kong) Limited Annual Report 2013
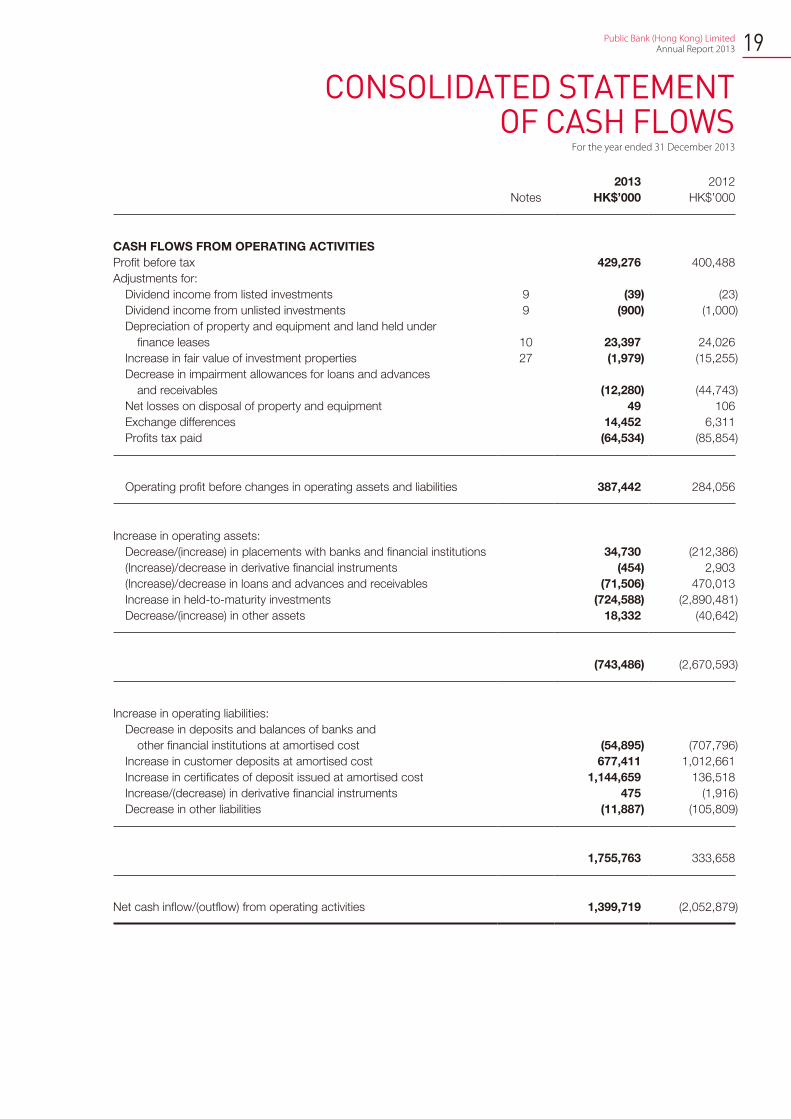
CONSOLIDATED STATEMENT OF CASH FLOWS
For the year ended 31 December 2013
19
2013 2012
Notes HK$’000 HK$’000
CASH FLOWS FROM OPERATING ACTIVITIES
Profit before tax 429,276 400,488
Adjustments for:
Dividend income from listed investments 9 (39) (23)
Dividend income from unlisted investments 9 (900) (1,000)
Depreciation of property and equipment and land held under
finance leases 10 23,397 24,026
Increase in fair value of investment properties 27 (1,979) (15,255)
Decrease in impairment allowances for loans and advances
and receivables (12,280) (44,743)
Net losses on disposal of property and equipment 49 106
Exchange differences 14,452 6,311
Profits tax paid (64,534) (85,854)
Operating profit before changes in operating assets and liabilities 387,442 284,056
Increase in operating assets:
Decrease/(increase) in placements with banks and financial institutions 34,730 (212,386)
(Increase)/decrease in derivative financial instruments (454) 2,903
(Increase)/decrease in loans and advances and receivables (71,506) 470,013
Increase in held-to-maturity investments (724,588) (2,890,481)
Decrease/(increase) in other assets 18,332 (40,642)
(743,486) (2,670,593)
Increase in operating liabilities:
Decrease in deposits and balances of banks and
other financial institutions at amortised cost (54,895) (707,796)
Increase in customer deposits at amortised cost 677,411 1,012,661
Increase in certificates of deposit issued at amortised cost 1,144,659 136,518
Increase/(decrease) in derivative financial instruments 475 (1,916)
Decrease in other liabilities (11,887) (105,809)
1,755,763 333,658
Net cash inflow/(outflow) from operating activities 1,399,719 (2,052,879)
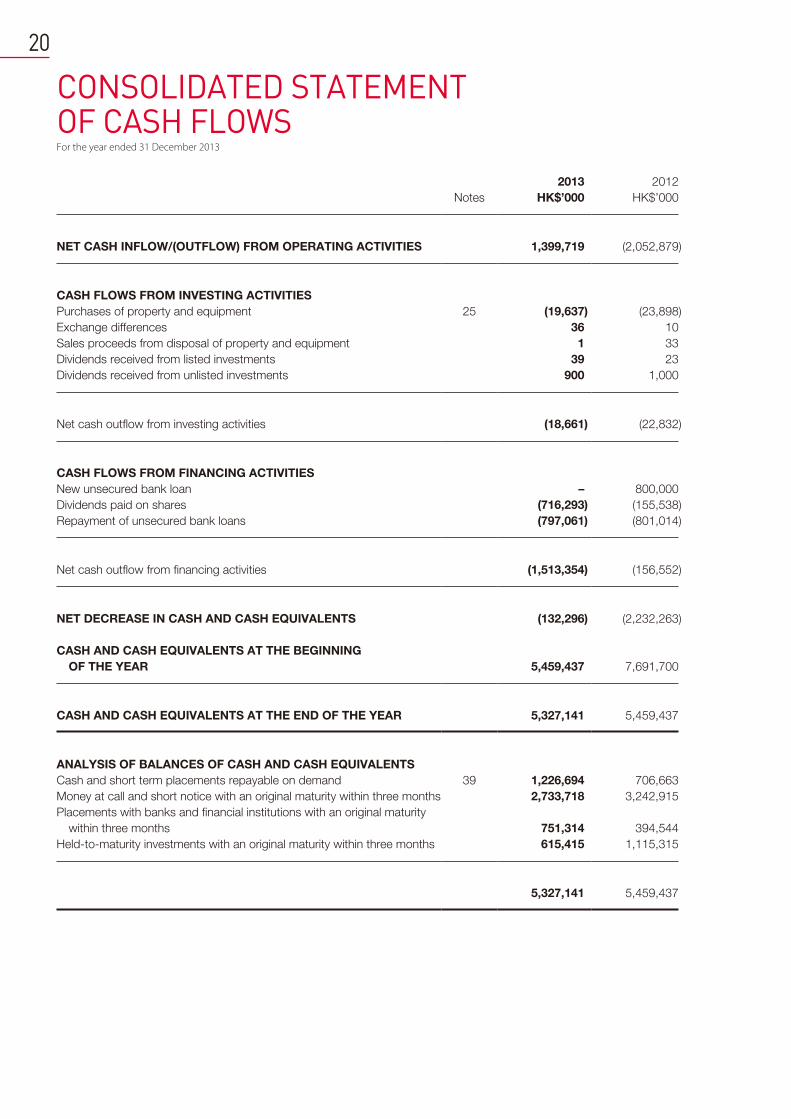
CONSOLIDATED STATEMENT OF CASH FLOWSFor the year ended 31 December 2013
20
2013 2012
Notes HK$’000 HK$’000
NET CASH INFLOW/(OUTFLOW) FROM OPERATING ACTIVITIES 1,399,719 (2,052,879)
CASH FLOWS FROM INVESTING ACTIVITIES
Purchases of property and equipment 25 (19,637) (23,898)
Exchange differences 36 10
Sales proceeds from disposal of property and equipment 1 33
Dividends received from listed investments 39 23
Dividends received from unlisted investments 900 1,000
Net cash outflow from investing activities (18,661) (22,832)
CASH FLOWS FROM FINANCING ACTIVITIES
New unsecured bank loan – 800,000
Dividends paid on shares (716,293) (155,538)
Repayment of unsecured bank loans (797,061) (801,014)
Net cash outflow from financing activities (1,513,354) (156,552)
NET DECREASE IN CASH AND CASH EQUIVALENTS (132,296) (2,232,263)
CASH AND CASH EQUIVALENTS AT THE BEGINNING
OF THE YEAR 5,459,437 7,691,700
CASH AND CASH EQUIVALENTS AT THE END OF THE YEAR 5,327,141 5,459,437
ANALYSIS OF BALANCES OF CASH AND CASH EQUIVALENTS
Cash and short term placements repayable on demand 39 1,226,694 706,663
Money at call and short notice with an original maturity within three months 2,733,718 3,242,915
Placements with banks and financial institutions with an original maturity
within three months 751,314 394,544
Held-to-maturity investments with an original maturity within three months 615,415 1,115,315
5,327,141 5,459,437

NOTES TO FINANCIAL STATEMENTS
21 Public Bank (Hong Kong) Limited Annual Report 2013
1. Corporate InformationThe Bank is a limited liability company and its registered office is located at 2/F, Public Bank Centre, 120 Des
Voeux Road Central, Central, Hong Kong. During the year, the Group’s principal activities were the provision of a
comprehensive range of commercial and retail banking, financial and related services.
Details of the principal activities of the Bank’s subsidiaries are set out in note 21 to the financial statements.
The Bank is a wholly-owned subsidiary of PFHL. In the opinion of the Directors, the ultimate holding company of
the Bank is Public Bank, which was incorporated in Malaysia.
2. Basis of PreparationThe consolidated financial statements have been prepared in accordance with all applicable Hong Kong Financial
Reporting Standards (“HKFRSs”) (a collective term which includes all applicable individual HKFRSs, Hong Kong
Accounting Standards (“HKASs”) and Interpretations (“Int”)) issued by the Hong Kong Institute of Certified
Public Accountants (the “HKICPA”), accounting principles generally accepted in Hong Kong and the Hong Kong
Companies Ordinance. The consolidated financial statements also comply with the disclosure requirements of the
Guideline on the Application of the BDR under the SPM issued by the HKMA.
The consolidated financial statements have been prepared under the historical cost convention, as modified for
the revaluation of investment properties, available-for-sale financial assets, financial assets and financial liabilities
(including derivative financial instruments) at fair value through profit or loss.
3. Basis of ConsolidationThe consolidated financial statements include the financial statements of the Bank and its subsidiaries for the
year ended 31 December 2013. The financial statements of the subsidiaries are prepared for the same reporting
period as the Bank, using consistent accounting policies. The results of subsidiaries are consolidated from the
date on which the Group obtains control, and continue to be consolidated until the date that such control ceases.
Profit or loss and each component of other comprehensive income are attributed to the owners of the parent of
the Group. All intra-group assets and liabilities, equity, income, expenses and cash flows relating to transactions
between members of the Group are eliminated in full on consolidation.
The Group reassesses whether or not it controls an investee if facts and circumstances indicate that there are
changes to one or more of the three elements of control described in the accounting policy for subsidiaries
below. A change in the ownership interest of a subsidiary, without a loss of control, is accounted for as an equity
transaction.
If the Group loses control over a subsidiary, it derecognises (i) the assets (including goodwill) and liabilities of the
subsidiary, (ii) the carrying amount of any non-controlling interest and (iii) the cumulative translation differences
recorded in equity; and recognises (i) the fair value of the consideration received, (ii) the fair value of any
investment retained and (iii) any resulting surplus or deficit in profit or loss. The Group’s share of components
previously recognised in other comprehensive income is reclassified to profit or loss or retained profits, as
appropriate, on the same basis as would be required if the Group had directly disposed of the related assets or
liabilities.
NOTES TO FINANCIAL STATEMENTS
22
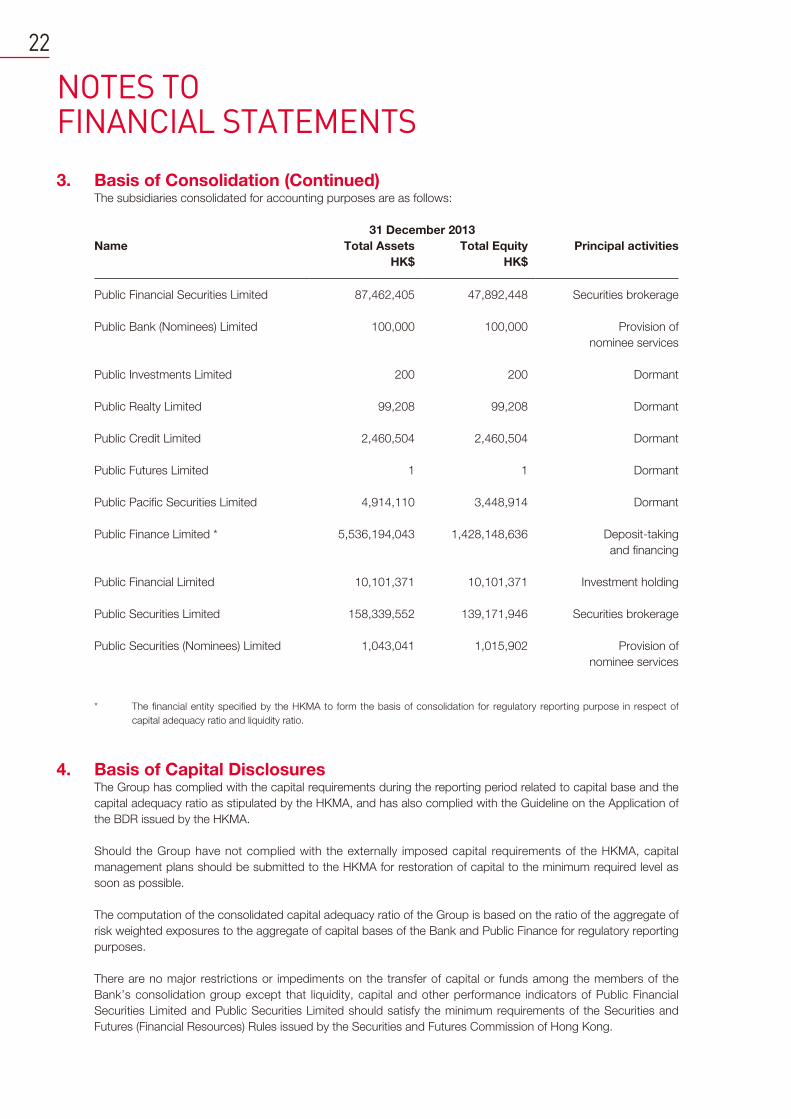
3. Basis of Consolidation (Continued)The subsidiaries consolidated for accounting purposes are as follows:
31 December 2013
Name Total Assets Total Equity Principal activities
HK$ HK$
Public Financial Securities Limited 87,462,405 47,892,448 Securities brokerage
Public Bank (Nominees) Limited 100,000 100,000 Provision of
nominee services
Public Investments Limited 200 200 Dormant
Public Realty Limited 99,208 99,208 Dormant
Public Credit Limited 2,460,504 2,460,504 Dormant
Public Futures Limited 1 1 Dormant
Public Pacific Securities Limited 4,914,110 3,448,914 Dormant
Public Finance Limited * 5,536,194,043 1,428,148,636 Deposit-taking
and financing
Public Financial Limited 10,101,371 10,101,371 Investment holding
Public Securities Limited 158,339,552 139,171,946 Securities brokerage
Public Securities (Nominees) Limited 1,043,041 1,015,902 Provision of
nominee services
* The financial entity specified by the HKMA to form the basis of consolidation for regulatory reporting purpose in respect of
capital adequacy ratio and liquidity ratio.
4. Basis of Capital DisclosuresThe Group has complied with the capital requirements during the reporting period related to capital base and the
capital adequacy ratio as stipulated by the HKMA, and has also complied with the Guideline on the Application of
the BDR issued by the HKMA.
Should the Group have not complied with the externally imposed capital requirements of the HKMA, capital
management plans should be submitted to the HKMA for restoration of capital to the minimum required level as
soon as possible.
The computation of the consolidated capital adequacy ratio of the Group is based on the ratio of the aggregate of
risk weighted exposures to the aggregate of capital bases of the Bank and Public Finance for regulatory reporting
purposes.
There are no major restrictions or impediments on the transfer of capital or funds among the members of the
Bank’s consolidation group except that liquidity, capital and other performance indicators of Public Financial
Securities Limited and Public Securities Limited should satisfy the minimum requirements of the Securities and
Futures (Financial Resources) Rules issued by the Securities and Futures Commission of Hong Kong.
23 Public Bank (Hong Kong) Limited Annual Report 2013
4. Basis of Capital Disclosures (Continued)A portion of retained profits, based on a percentage of gross loans and advances, is set aside as a non-
distributable regulatory reserve as part of Common Equity Tier 1 (“CET1”) capital and is included in the capital
base pursuant to the HKMA capital requirements.
With effect from 1 January 2013, the Group has adopted the provisions of the Banking (Amendment) Ordinance
2012 relating to the Basel III capital standards and the amended Banking (Capital) Rules (the “Capital Rules”). The
Capital Rules outline the general requirements on regulatory capital adequacy ratios, the components of eligible
regulatory capital as well as the levels of those ratios at which banking institutions are required to operate. The
Capital Rules have been developed based on internationally-agreed standards on capital adequacy promulgated
by the Basel Committee on Banking Supervision. Under the Capital Rules, the minimum capital adequacy ratios
are progressively increased from 1 January 2013 to 1 January 2019, and include a phased introduction of a
new capital conservation buffer of 2.5%. Additional capital requirements, including a new counter-cyclical buffer
ranging from 0% to 2.5%, will be detailed at a later stage.
5. Accounting PoliciesChanges in accounting policies and disclosuresThe HKICPA has issued a number of new and revised HKFRSs, which are generally effective for accounting
periods beginning on or after 1 January 2013. The Group has adopted the following new and revised HKFRSs
issued up to 31 December 2013 which are pertinent to its operations and relevant to these financial statements.
• HKFRS 1 Amendments Amendments to HKFRS 1 First Time Adoption of Hong Kong
Financial Reporting Standards – Government Loans
• HKFRS 7 Amendments Amendments to HKFRS 7 Financial Instruments:
Disclosures – Offsetting Financial Assets and
Financial Liabilities
• HKFRS 10 Consolidated Financial Statements
• HKFRS 11 Joint Arrangements
• HKFRS 12 Disclosure of Interests in Other Entities
• HKFRS 10, HKFRS 11 and
HKFRS 12 Amendments
Amendments to HKFRS 10, HKFRS 11 and
HKFRS 12 – Transition Guidance
• HKFRS 13 Fair Value Measurement
• HKAS 1 Amendments Amendments to HKAS 1 Presentation of Financial Statements
– Presentation of Items of Other Comprehensive Income
• HKAS 19 (2011) Employee Benefits
• HKAS 27 (2011) Separate Financial Statements
• HKAS 28 (2011) Investments in Associates and Joint Ventures
• HKAS 36 Amendments Amendments to HKAS 36 Impairment of Assets – Recoverable
Amount Disclosures for Non-financial Assets (early adopted)
• HK(IFRIC)-Int 20 Stripping Costs in the Production Phase of a Surface Mine
• Annual Improvements 2009-2011 Cycle Amendments to a number of HKFRSs issued in June 2012
The principal effects of adopting these new and revised HKFRSs are as follows:
HKFRS 7 Amendments require an entity to disclose information about rights to set-off and related arrangements
(e.g., collateral agreements). The disclosures provide users with information that is useful in evaluating the effect of
netting arrangements on an entity’s financial position. The new disclosures are required for all recognised financial
instruments that are set off in accordance with HKAS 32 Financial Instruments: Presentation. The disclosures also
apply to recognised financial instruments that are subject to an enforceable master netting arrangement or similar
agreement, irrespective of whether they are set off in accordance with HKAS 32. The amendments do not have
any material financial impact on the Group.
NOTES TO FINANCIAL STATEMENTS
24
5. Accounting Policies (Continued)Changes in accounting policies and disclosures (Continued)HKFRS 10 replaces the portion of HKAS 27 Consolidated and Separate Financial Statements that addresses
the accounting for consolidated financial statements and addresses the issues in HK(SIC)-Int 12 Consolidation
– Special Purpose Entities. It establishes a single control model used for determining which entities are
consolidated. To meet the definition of control in HKFRS 10, an investor must have (a) power over an investee, (b)
exposure, or rights, to variable returns from its involvement with the investee, and (c) the ability to use its power
over the investee to affect the amount of the investor’s returns. The changes introduced by HKFRS 10 require
management of the Group to exercise significant judgement to determine which entities are controlled. The
application of this new standard has no financial impact on the Group.
Consequential amendments were made to HKAS 27 and HKAS 28 as a result of the issuance of HKFRS 10,
HKFRS 11 and HKFRS 12. The Group adopted HKFRS 10, HKFRS 11, HKFRS 12, HKAS 27 (2011), HKAS 28
(2011), and the subsequent amendments to these standards issued in July and December 2012 from 1 January
2013.
HKFRS 11 replaces HKAS 31 Interests in Joint Ventures and HK(SIC)-Int 13 Jointly Controlled Entities – Non-
Monetary Contributions by Venturers. It describes the accounting for joint arrangements with joint control. It
addresses only two forms of joint arrangements, i.e. joint operations and joint ventures, and removes the option
to account for joint ventures using proportionate consolidation. The classification of joint arrangements under
HKFRS 11 depends on the parties’ rights and obligations arising from the arrangements. A joint operation is a
joint arrangement whereby the joint operators have rights to the assets and obligations for the liabilities of the
arrangement and is accounted for on a line-by-line basis to the extent of the joint operator’s rights and obligations
in the joint operation. A joint venture is a joint arrangement whereby the joint venturers have rights to the net assets
of the arrangement and is required to be accounted for using the equity method in accordance with HKAS 28
(2011). The application of this new standard has no material financial impact on the Group.
HKFRS 12 sets out the disclosure requirements for subsidiaries, joint arrangements, associates and structured
entities previously included in HKAS 27 Consolidated and Separate Financial Statements, HKAS 31 Interests
in Joint Ventures and HKAS 28 Investments in Associates. It also introduces a number of new disclosure
requirements for these entities. Details of the disclosures for subsidiaries and a joint venture are included in notes
26 and 27 to the financial statements.
The HKFRS 10, HKFRS 11 and HKFRS 12 Amendments clarify the transition guidance in HKFRS 10 and provide
further relief from full retrospective application of these standards, limiting the requirement to provide adjusted
comparative information to only the preceding comparative period. The amendments clarify that retrospective
adjustments are only required if the consolidation conclusion as to which entities are controlled by the Group
is different between HKFRS 10 and HKAS 27 or HK(SIC)-Int 12 at the beginning of the annual period in which
HKFRS 10 is applied for the first time. These amendments have no material impact on the Group.
HKFRS 13 provides a precise definition of fair value and a single source of fair value measurement and disclosure
requirements for use across HKFRSs. The standard does not change the circumstances in which the Group
is required to use fair value, but rather provides guidance on how fair value should be applied where its use is
already required or permitted under other HKFRSs. HKFRS 13 is applied prospectively and the adoption has had
no material impact on the Group’s fair value measurements. As a result of the guidance in HKFRS 13, the policies
for measuring fair value have been amended. Additional disclosures required by HKFRS 13 for the fair value
measurements of investment properties and financial instruments are included in notes 27 and 38 to the financial
statements. The application of this new standard has no material financial impact on the Group.
25 Public Bank (Hong Kong) Limited Annual Report 2013
5. Accounting Policies (Continued)Changes in accounting policies and disclosures (Continued)The HKAS 1 Amendments change the grouping of items presented in other comprehensive income (“OCI”).
Items that could be reclassified (or recycled) to profit or loss at a future point in time (e.g. exchange differences
on translation of foreign operations, net movement on cash flow hedges and net loss or gain on available-for-sale
financial assets) are presented separately from items which will never be reclassified (e.g. the revaluation of land
and buildings). The amendments have affected the presentation only and have had no material financial impact on
the Group.
HKAS 19 (2011) includes a number of amendments that range from fundamental changes to simple clarifications
and re-wording. The revised standard introduces significant changes in the accounting for defined benefit pension
plans including removing the choice to defer the recognition of actuarial gains and losses. Other changes include
modifications to the timing of recognition for termination benefits, the classification of short-term employee
benefits and disclosures of defined benefit plans. As the Group does not have any defined benefit plan or
employee termination plan and the Group does not have any significant employee benefits that are expected to
be settled for more than twelve months after the reporting period, the adoption of the revised standard has had
no material financial impact on the Group.
The HKAS 36 Amendments remove the unintended disclosure requirement made by HKFRS 13 on the
recoverable amount of a cash-generating unit which is not impaired. In addition, the amendments require the
disclosure of the recoverable amounts for the assets or cash-generating units for which an impairment loss has
been recognised or reversed during the reporting period, and expand the disclosure requirements regarding the
fair value measurement for these assets or units if their recoverable amounts are based on fair value less costs
of disposal. The amendments are effective retrospectively for annual periods beginning on or after 1 January
2014 with earlier application permitted, provided HKFRS 13 is also applied. The Group has early adopted the
amendments in these financial statements. The amendments have had no material financial impact on the Group.
Annual Improvements 2009-2011 Cycle issued in June 2012 sets out the amendments to a number of standards.
There are separate transitional provisions for each standard. While the adoption of some of the amendments may
result in changes in accounting policies, none of these amendments have had a significant financial impact on the
Group. Details of the key amendments most applicable to the Group are as follows:
(a) HKAS 1 Presentation of Financial Statements: Clarifies the difference between voluntary additional
comparative information and minimum required comparative information. Generally, the minimum required
comparative period is the previous period. An entity must include comparative information in the related
notes to the financial statements when it voluntarily provides comparative information beyond the previous
period. The additional comparative information does not need to contain a complete set of financial
statements.
In addition, the amendment clarifies that the opening statement of financial position as at the beginning
of the preceding period must be presented when an entity changes its accounting policies; makes
retrospective restatements or makes reclassifications, and the change has a material effect on the
statement of financial position. However, the related notes to the opening statement of financial position as
at the beginning of the preceding period are not required to be presented.
(b) HKAS 16 Property, Plant and Equipment: Clarifies that major spare parts and servicing equipment that
meet the definition of property, plant and equipment are not inventories.
(c) HKAS 32 Financial Instruments: Presentation: Clarifies that income taxes arising from distributions to
equity holders are accounted for in accordance with HKAS 12 Income Taxes. The amendment removes
existing income tax requirements from HKAS 32 and requires entities to apply the requirements in HKAS
12 to any income tax arising from distributions to equity holders.
NOTES TO FINANCIAL STATEMENTS
26
5. Accounting Policies (Continued)Impact of issued but not yet effective HKFRSsThe Group has not applied the following new and revised HKFRSs, that have been issued but are not yet
effective, in these financial statements:
• HKFRS 9 Financial Instruments3
• HKFRS 9, HKFRS 7 and
HKAS 39 Amendments
Hedge Accounting and amendments to HKFRS 9, HKFRS 7
and HKAS 393
• HKFRS 10, HKFRS 12 and
HKAS 27 (2011) Amendments
Amendments to HKFRS 10, HKFRS 12 and
HKAS 27 (2011) – Investment Entities1
• HKAS 19 Amendments Amendments to HKAS 19 Employee Benefits – Defined
Benefit Plans: Employee Contributions2
• HKAS 32 Amendments Amendments to HKAS 32 Financial Instruments:
Presentation – Offsetting Financial Assets and
Financial Liabilities1
• HKAS 39 Amendments Amendments to HKAS 39 Financial Instruments:
Recognition and measurement – Novation of Derivatives
and Continuation of Hedge Accounting1
• HK(IFRIC)-Int 21 Levies1
1 effective for annual periods beginning on or after 1 January 20142 effective for annual periods beginning on or after 1 July 20143 no mandatory effective date yet determined but is available for adoption
HKFRS 9 issued in November 2009 is the first part of phase 1 of a comprehensive project to entirely replace
HKAS 39 Financial Instruments: Recognition and Measurement. This phase focuses on the classification and
measurement of financial assets. Instead of classifying financial assets into four categories, an entity shall classify
financial assets as subsequently measured at either amortised cost or fair value, on the basis of both the entity’s
business model for managing the financial assets and the contractual cash flow characteristics of the financial
assets. This aims to improve and simplify the approach for the classification and measurement of financial assets
compared with the requirements of HKAS 39.
In November 2010, the HKICPA issued additions to HKFRS 9 to address financial liabilities (the “Additions”) and
incorporated in HKFRS 9 the current derecognition principles of financial instruments of HKAS 39. Most of the
Additions were carried forward unchanged from HKAS 39, while changes were made to the measurement of
financial liabilities designated at fair value through profit or loss using the fair value option (“FVO”). For these FVO
liabilities, the amount of change in the fair value of a liability that is attributable to changes in credit risk must be
presented in OCI. The remainder of the change in fair value is presented in profit or loss, unless presentation of
the fair value change in respect of the liability’s credit risk in OCI would create or enlarge an accounting mismatch
in profit or loss. However, loan commitments and financial guarantee contracts which have been designated
under the FVO are scoped out of the Additions.
In December 2013, the HKICPA added to HKFRS 9 the requirements related to hedge accounting and made
some related changes to HKAS 39 and HKFRS 7 which include the corresponding disclosures about risk
management activity for applying hedge accounting. The amendments to HKFRS 9 relax the requirements for
assessing hedge effectiveness which result in more risk management strategies being eligible for hedge accounting.
The amendments also allow greater flexibility on the hedged items and relax the rules on using purchased options
and non-derivative financial instruments as hedging instruments. In addition, the amendments to HKFRS 9 allow
an entity to apply only the improved accounting for own credit-risk related fair value gains and losses arising on
FVO liabilities as introduced in 2010 without applying the other HKFRS 9 requirements at the same time.

27 Public Bank (Hong Kong) Limited Annual Report 2013
5. Accounting Policies (Continued)Impact of issued but not yet effective HKFRSs (Continued)HKAS 39 is aimed to be replaced by HKFRS 9 in its entirety. Before this entire replacement, the guidance in
HKAS 39 on impairment of financial assets continues to apply. The previous mandatory effective date of HKFRS
9 was removed by the HKICPA in December 2013 and a mandatory effective date will be determined after the
entire replacement of HKAS 39 is completed. However, the standard is available for application now. The Group
will quantify the effect in conjunction with other phases, when the final standard including all phases is issued.
Amendments to HKFRS 10 include a definition of an investment entity and provide an exception to the
consolidation requirement for entities that meet the definition of an investment entity. Investment entities are
required to account for subsidiaries at fair value through profit or loss in accordance with HKFRS 9 rather than
consolidate them. Consequential amendments were made to HKFRS 12 and HKAS 27 (2011). The amendments
to HKFRS 12 also set out the disclosure requirements for investment entities. The Group expects that these
amendments will not have any impact on the Group as the Bank is not an investment entity as defined in HKFRS
10.
The HKAS 19 Amendments apply to contributions from employees or third parties to defined benefits plans. The
amendments simplify the accounting for contributions that are independent of the number of years of employee
service, for example, employee contributions that are calculated according to a fixed percentage of salary. If the
amount of the contributions is independent of the number of years of service, an entity is permitted to recognise
such contributions as a reduction of the service cost in the period in which the related service is rendered. The
amendments are not expected to have any impact on the financial position or performance of the Group upon
adoption on 1 January 2015.
HKAS 32 Amendments clarify the meaning of “currently has a legally enforceable right to set-off” for offsetting
financial assets and financial liabilities. The amendments also clarify the application of the offsetting criteria
in HKAS 32 to settlement systems (such as central clearing house systems) which apply gross settlement
mechanisms that are not simultaneous. The amendments are not expected to have any impact on the financial
position or performance of the Group upon adoption on 1 January 2014.
The HKAS 39 Amendments provide an exception to the requirement of discontinuing hedge accounting in
situations where over-the-counter (“OTC”) derivatives designated in hedging relationships are directly or indirectly,
novated to a central counterparty as a consequence of laws or regulations, or the introduction of laws or
regulations. For continuance of hedge accounting under this exception, all of the following criteria must be met: (i)
the novations must arise as a consequence of laws or regulations, or the introduction of laws or regulations; (ii) the
parties to the hedging instrument agree that one or more clearing counterparties replace their original counterparty
to become the new counterparty to each of the parties; and (iii) the novations do not result in changes to the
terms of the original derivative other than changes directly attributable to the change in counterparty to achieve
clearing. The amendments are not expected to have any impact on the financial position or performance of the
Group upon adoption on 1 January 2014.
HK(IFRIC)-Int 21 clarifies that an entity recognises a liability for a levy when the activity that triggers payment,
as identified by the relevant legislation, occurs. The interpretation also clarifies that a levy liability is accrued
progressively only if the activity that triggers payment occurs over a period of time, in accordance with the
relevant legislation. For a levy that is triggered upon reaching a minimum threshold, the interpretation clarifies
that no liability should be recognised before the specified minimum threshold is reached. The interpretation is not
expected to have any impact on the financial position or performance of the Group upon adoption on 1 January
2014.
NOTES TO FINANCIAL STATEMENTS
28
5. Accounting Policies (Continued)Summary of significant accounting policiesThe principal accounting policies applied in the preparation of these consolidated financial statements are set out
below.
(1) Foreign currency translation
The consolidated financial statements are presented in Hong Kong dollars, which is the Group’s functional
and presentation currency. Each entity in the Group determines its own functional currency and items
included in the financial statements of each entity are measured using that functional currency.
(i) Transactions and balances
Transactions in foreign currencies are initially recorded in the functional currency rates prevailing at
the dates of the transactions.
Monetary assets and liabilities denominated in foreign currencies are translated at the functional
currency rates of exchange ruling at the end of the reporting period. Differences arising on
settlement or translation of monetary items are recognised in “Other operating income” or “Other
operating expenses” in the consolidated income statement with the exception of differences on
foreign currency borrowings that provide an effective hedge against a net investment in a foreign
entity which is taken directly to equity until the disposal of the net investment, at which time they
are recognised in the consolidated income statement. Tax charges and credits attributable to
exchange differences on those borrowings are also recorded in OCI.
Non-monetary items that are measured in terms of historical cost in a foreign currency are
translated using the exchange rates as at the dates of the initial transactions. Non-monetary items
measured at fair value in a foreign currency are translated using the exchange rates at the date
when the fair value was measured. The gain or loss arising on translation of a non-monetary item
measured at fair value is treated in line with the recognition of the gain or loss on change in fair
value of the item (i.e., translation difference on the item whose fair value gain or loss is recognised
in OCI or profit or loss is also recognised in OCI or profit or loss, respectively).
Any goodwill arising on the acquisition of a foreign operation and any fair value adjustments to
the carrying amounts of assets and liabilities arising on the acquisition are treated as assets and
liabilities of the foreign operation and translated at the closing rate.
(ii) Group companies
As at the reporting date, the assets and liabilities of subsidiaries and overseas branches and offices
are translated into the Group’s presentation currency at the rates of exchange ruling at the end of
the reporting period, and their income statements are translated at the weighted average exchange
rates for the year. Exchange differences arising on translation are taken directly to a separate
component of equity. On disposal of a foreign entity, the deferred cumulative amount recognised
in equity relating to that particular foreign operation is recognised in the consolidated income
statement as part of gain or loss on disposal.
29 Public Bank (Hong Kong) Limited Annual Report 2013
5. Accounting Policies (Continued)Summary of significant accounting policies (Continued)(2) Financial instruments – initial recognition and subsequent measurement
(i) Date of recognition
Purchases or sales of financial assets that require delivery of assets within the time frame generally
established by regulation or convention in the market place are recognised on the trade date, i.e.,
the date that the Group commits to purchase or sell the asset. Derivatives are recognised on the
trade date basis.
(ii) Initial recognition of financial instruments
The classification of financial instruments at initial recognition depends on the purpose for which the
financial instruments are acquired and their characteristics. All financial instruments are measured
initially at their fair value plus, in the case of financial assets and financial liabilities not at fair value
through profit or loss, any directly attributable incremental costs of acquisition or issue.
(iii) Derivative financial instruments
Derivatives include interest rate swaps and futures, cross currency swaps, forward foreign
exchange contracts and options on interest rates, foreign currencies and equities. Derivatives are
recorded at fair value and carried as assets when their fair value is positive and as liabilities when
their fair value is negative. Changes in the fair value of derivatives held for trading are included in “Net
gain or loss on derivative financial instruments”.
Derivatives embedded in other financial instruments, such as the conversion option in an acquired
convertible bond, are treated as separate derivatives and recorded at fair value if their economic
characteristics and risks are not closely related to those of the host contract, and the host contract
is not itself held for trading or designated at fair value through profit or loss. The embedded
derivatives separated from the host contract are carried at fair value in the trading portfolio with
changes in fair value recognised in the consolidated income statement.
(iv) Financial assets designated at fair value through profit or loss
Financial assets classified in this category are held for trading or are designated by management
on initial recognition when the following criteria are met:
• the designation eliminates or significantly reduces the inconsistent treatment that would
otherwise arise from measuring the assets or liabilities or recognising gains or losses on
them on a different basis;
• the assets and liabilities are part of a group of financial assets, financial liabilities or both
which are managed and their performance evaluated on a fair value basis, in accordance
with a documented risk management or investment strategy; or
• the financial instrument contains an embedded derivative, unless the embedded derivative
does significantly modify the cash flows or it is clear, with little or no analysis, that it would
not be separately recorded.
Financial assets and financial liabilities at fair value through profit or loss are recorded in the
consolidated statement of financial position at fair value. Changes in fair value are recorded in
“Net gain or loss on financial assets designated at fair value through profit or loss”. Interest earned
or incurred is accrued in interest income or expense, respectively, according to the terms of the
contract, while dividend income is recorded in “Other operating income” when the right to the
payment has been established.
NOTES TO FINANCIAL STATEMENTS
30
5. Accounting Policies (Continued)Summary of significant accounting policies (Continued)(2) Financial instruments – initial recognition and subsequent measurement (Continued)
(v) Held-to-maturity investments
Held-to-maturity investments measured at amortised cost are those which carry fixed or
determinable payments and have fixed maturity and which the Group has the intention and ability
to hold to maturity. After initial measurement, held-to-maturity investments are subsequently
measured at amortised cost using the effective interest rate method, less allowance for impairment.
Amortised cost is calculated by taking into account any discount or premium on acquisition and
fees that are an integral part of the effective interest rate. The amortisation is included in “Interest
income” in the consolidated income statement. The losses arising from impairment of such
investments are recognised in the consolidated income statement as “Impairment allowances for
held-to-maturity investments”.
(vi) Cash and short term placements, placements with banks and financial institutions, and loans and
advances and receivables
Cash and short term placements, placements with banks and financial institutions, and loans and
advances and receivables are categorised as loans and advances. They are carried at amortised
cost and are financial assets with fixed or determinable payments and fixed maturities that are
not quoted in an active market. They are not entered into with the intention of immediate or short
term resale. After initial measurement, amounts due from banks and loans and advances are
subsequently measured at amortised cost using the effective interest rate method, less allowance
for impairment. Amortised cost is calculated by taking into account any discount or premium
on acquisition and fees and costs that are an integral part of the effective interest rate. The
amortisation is included in “Interest income” in the consolidated income statement. The losses
arising from impairment are recognised in the consolidated income statement in “Impairment
allowances for loans and advances and receivables”.
(vii) Available-for-sale financial assets
Available-for-sale financial assets are those which are designated as such or do not qualify to be
classified as designated at fair value through profit or loss, held-to-maturity investments or loans
and advances. They include equity instruments, investments in mutual funds and money markets
and other debt instruments.
After initial measurement, available-for-sale financial assets are subsequently measured at fair
value. Unrealised gains and losses are recognised directly in equity in the “Available-for-sale
financial asset revaluation reserve”.
When the security is disposed of, the cumulative gain or loss previously recognised in equity
is recognised in the consolidated income statement in “Other operating income” or “Other
operating expenses”. Where the Group holds more than one investment in the same security,
they are deemed to be disposed of on a first-in, first-out basis. Interest earned whilst holding
available-for-sale financial assets is reported as interest income using the effective interest rate
method. Dividends earned whilst holding available-for-sale financial assets are recognised in the
consolidated income statement as “Other operating income” when the right of the payment has
been established. The losses arising from impairment of such investments are recognised in the
consolidated income statement in “Impairment allowances for available-for-sale financial assets”
and removed from the “Available-for-sale financial asset revaluation reserve”.
31 Public Bank (Hong Kong) Limited Annual Report 2013
5. Accounting Policies (Continued)Summary of significant accounting policies (Continued)(2) Financial instruments – initial recognition and subsequent measurement (Continued)
(viii) Certificates of deposit
Issued financial instruments or their components, which are not designated at fair value through
profit or loss, are classified as liabilities under “Certificates of deposit issued at amortised cost”
where the substance of the contractual arrangement results in the Group having an obligation
either to deliver cash or another financial asset to the holder, or to satisfy the obligation other than
by the exchange of a fixed amount of cash or another financial asset for a fixed number or own
equity shares. The components of compound financial instruments, that contain both liability and
equity elements, are accounted for separately, with the equity component being assigned the
residual amount after deducting from the instrument as a whole the amount separately determined
as the fair value of the liability component on the date of issue.
After initial measurement, debt issued and other borrowings are subsequently measured at
amortised cost using the effective interest rate method. Amortised cost is calculated by taking into
account any discount or premium on the issue and costs that are an integral part of the effective
interest rate.
(ix) Loans and borrowings
After initial recognition, interest-bearing loans and borrowings are subsequently measured at
amortised cost, using the effective interest rate method unless the effect of discounting would
be immaterial, in which case they are stated at cost. Gains and losses are recognised in the
consolidated income statement when the liabilities are derecognised as well as through the
amortisation process using effective interest rate method. Amortised cost is calculated by taking
into account any discount or premium on acquisition and fees or costs that are an integral part of
the effective interest rate. The effective interest rate amortisation is included in finance costs in the
consolidated income statement.
(3) Financial guarantees
In the ordinary course of business, the Group gives financial guarantees, consisting of letters of credit,
guarantees and acceptances. Financial guarantees are initially recognised in the financial statements in
“Other liabilities” at fair value less transaction costs that are directly attributable to the acquisition or issue
of the financial guarantee contract, except when such contract is recognised at fair value through profit or
loss. Subsequent to initial recognition, the Group measures the financial guarantee contract at the higher
of the amortised premium and the best estimate of expenditure required to settle any financial obligation
arising as a result of the guarantee.
Any increase in the liability relating to financial guarantees is taken to the consolidated income statement.
The premium received is recognised in the consolidated income statement in “Net fees and commission
income” under “Other operating income” on a straight-line basis over the life of the guarantee.
NOTES TO FINANCIAL STATEMENTS
32
5. Accounting Policies (Continued)Summary of significant accounting policies (Continued)(4) Derecognition of financial assets and financial liabilities
(i) Financial assets
A financial asset (or, where applicable, a part of a financial asset or part of a group of similar
financial assets) is primarily derecognised when:
• the rights to receive cash flows from the asset have expired; or
• the Group has transferred its rights to receive cash flows from the asset or has assumed
an obligation to pay the received cash flows in full without material delay to a third party
under a “pass-through” arrangement; and either (a) the Group has transferred substantially
all the risks and rewards of the asset, or (b) the Group has neither transferred nor retained
substantially all the risks and rewards of the asset, but has transferred control of the asset.
When the Group has transferred its rights to receive cash flows from an asset or has entered into a
“pass-through” arrangement, it evaluates if and to what extent it has retained the risk and rewards
of ownership of the asset. When it has neither transferred nor retained substantially all the risks
and rewards of the asset nor transferred control of the asset, the Group continues to recognise the
transferred asset to the extent of the Group’s continuing involvement. In that case, the Group also
recognises an associated liability. The transferred asset and the associated liability are measured
on a basis that reflects the rights and obligations that the Group has retained.
(ii) Financial liabilities
A financial liability is derecognised when the obligation under the liability is discharged or cancelled,
or expires. Where an existing financial liability is replaced by another from the same lender on
substantially different terms, or the terms of an existing liability are substantially modified, such an
exchange or modification is treated as a derecognition of the original liability and the recognition
of a new liability, and the difference in the respective carrying amounts is recognised in the
consolidated income statement.
(iii) Offsetting of financial instruments
Financial assets and financial liabilities are offset and the net amount is reported in the statement
of financial position if there is a currently enforceable legal right to offset the recognised amounts
and there is an intention to settle on a net basis, or to realise the assets and settle the liabilities
simultaneously.
(5) Fair value measurement
The Group measures its investment properties and derivative financial instruments at fair value at the end
of each reporting period. Fair value is the price that will be received from selling an asset or paid to transfer
a liability in an orderly transaction between market participants at the measurement date. The fair value
measurement is based on the presumption that the transaction to sell the asset or transfer the liability
takes place either in the principal market for the asset or liability, or in the absence of a principal market,
in the most advantageous market for the asset or liability. The principal or the most advantageous market
must be accessible by the Group. The fair value of an asset or a liability is measured using the assumptions
that market participants would use when pricing the asset or liability, assuming that market participants
act in their economic best interest.
A fair value measurement of a non-financial asset takes into account a market participant’s ability to
generate economic benefits by using the asset in its highest and best use or by selling it to another market
participant that will use the asset in its highest and best use.
33 Public Bank (Hong Kong) Limited Annual Report 2013
5. Accounting Policies (Continued)Summary of significant accounting policies (Continued)(5) Fair value measurement (Continued)
The Group uses valuation techniques that are appropriate in the circumstances and for which sufficient
data are available to measure fair value, maximising the use of relevant observable inputs and minimising
the use of unobservable inputs.
All assets and liabilities for which fair value is measured or disclosed in the financial statements are
categorised within the fair value hierarchy, described as follows, based on the lowest level input that is
significant to the fair value measurement as a whole:
Level 1: based on quoted prices (unadjusted) in active markets for identical assets or liabilities
Level 2: based on valuation techniques for which the lowest level input that is significant to the fair value
measurement is observable, either directly or indirectly
Level 3: based on valuation techniques for which the lowest level input that is significant to the fair value
measurement is unobservable
For assets and liabilities that are recognised in the financial statements on a recurring basis, the Group
determines whether transfers have occurred between levels in the hierarchy by reassessing categorisation
(based on the lowest level input that is significant to the fair value measurement as a whole) at the end of
each reporting period.
(6) Impairment of financial assets
The Group assesses at the end of each reporting period whether there is objective evidence that a
financial asset or a group of financial assets is impaired. An impairment exists if one or more events that
occurred after the initial recognition of the asset has/have an impact on the estimated future cash flows of
the financial asset or the group of financial assets that can be reliably estimated. Evidence of impairment
may include indications that a borrower or a group of borrowers is/are experiencing significant financial
difficulty, default or delinquency in interest or principal payments, the probability that they will enter
bankruptcy or other financial reorganisation and observable data indicating that there is a measurable
decrease in the estimated future cash flows, such as changes in arrears or economic conditions that
correlate with default.
(i) Placements with banks and financial institutions, and loans and advances and receivables
For amounts due from banks and loans and advances to customers carried at amortised cost, the
Group first assesses whether impairment exists individually for financial assets that are individually
significant, or collectively for financial assets that are not individually significant. If the Group
determines that no objective evidence of impairment exists for an individually assessed financial
asset, whether significant or not, the asset is included in a group of financial assets with similar
credit risk characteristics and the Group collectively assesses them for impairment. Assets that
are individually assessed for impairment and for which an impairment loss is, or continues to be,
recognised are not included in a collective assessment of impairment.
NOTES TO FINANCIAL STATEMENTS
34
5. Accounting Policies (Continued)Summary of significant accounting policies (Continued)(6) Impairment of financial assets (Continued)
(i) Placements with banks and financial institutions, and loans and advances and receivables
(Continued)
The amount of any impairment loss identified is measured as the difference between the asset’s
carrying amount and the present value of estimated future cash flows (excluding future expected
credit losses that have not yet been incurred). The carrying amount of the asset is reduced through
the use of an allowance account and the loss is recognised in the consolidated income statement.
Interest income continues to be accrued on the reduced carrying amount based on the original
effective interest rate of the asset. Loans together with the associated allowance are written off
when there is no realistic prospect of future recovery and all collateral had been realised or had
been transferred to the Group. If, in a subsequent year, the amount of the estimated impairment
loss increases or decreases because of an event occurring after the impairment was recognised,
the previously recognised impairment loss is increased or reduced by adjusting the allowance
account. Any subsequent reversal of an impairment is recognised in the consolidated income
statement, to the extent that the carrying value of the asset does not exceed its amortised cost
at the reversal date. If a future write-off is later recovered, the recovery is credited to “Impairment
losses and allowances” in the consolidated income statement.
The present value of the estimated future cash flows is discounted at the financial asset’s original
effective interest rate. The calculation of the present value of the estimated future cash flows of a
collateralised financial asset reflects the cash flows that may result from foreclosure less costs for
obtaining and selling the collateral, whether or not foreclosure is probable.
For the purpose of a collective evaluation of impairment, financial assets are grouped on the basis
of the Group’s internal credit risk-based system that considers credit risk characteristics such as
asset type, industry, collateral type, economic factors and other relevant factors.
Future cash flows on a group of financial assets that are collectively evaluated for impairment are
estimated on the basis of historical loss experience for assets with credit risk characteristics similar
to those in the group. Historical loss experience is adjusted on the basis of current observable data
to reflect the effects of current conditions that did not affect the years on which the historical loss
experience is based and to remove the effects of conditions in the historical period that do not exist
currently. Estimates of changes in future cash flows reflect, and are directionally consistent with,
changes in related observable data from year to year (such as changes in unemployment rates,
property prices, commodity prices, payment status, or other factors that are indicative of incurred
losses in the group and their magnitude). The methodology and assumptions used for estimating
future cash flows are reviewed regularly to reduce any differences between loss estimates and
actual loss experience.
(ii) Held-to-maturity investments
For held-to-maturity investments, the Group assesses individually whether there is objective
evidence of impairment. If there is objective evidence that an impairment loss has been incurred,
the amount of the loss is measured as the difference between the asset’s carrying amount and the
present value of estimated future cash flows. The carrying amount of the asset is reduced and the
amount of the loss is recognised in the consolidated income statement.
If, in a subsequent year, the amount of the estimated impairment loss decreases because of an
event occurring after the impairment was recognised, any amounts formerly charged are credited
to “Impairment allowances for held-to-maturity investments”, to the extent that the carrying value of
the asset does not exceed its amortised cost at the reversal date.
35 Public Bank (Hong Kong) Limited Annual Report 2013
5. Accounting Policies (Continued)Summary of significant accounting policies (Continued)(6) Impairment of financial assets (Continued)
(iii) Available-for-sale financial assets
For available-for-sale financial assets, the Group assesses at the end of each reporting period
whether there is objective evidence that an investment or a group of investments is impaired.
If an available-for-sale asset is impaired, an amount comprising the difference between its cost
(net of any principal payment and amortisation) and its current fair value, less any impairment loss
previously recognised in the consolidated income statement, is removed from OCI and recognised
in the consolidated income statement.
In the case of equity investments classified as available for sale, objective evidence would include a
significant or prolonged decline in the fair value of an investment below its cost. The determination
of what is “significant” or “prolonged” requires judgement. “Significant” is evaluated against the
original cost of the investment and “prolonged” against the period in which the fair value has been
below its original cost. Where there is evidence of impairment, the cumulative loss – measured as
the difference between the acquisition cost and the current fair value, less any impairment loss on
that investment previously recognised in the consolidated income statement – is removed from OCI
and recognised in the consolidated income statement. Impairment losses on equity instruments
classified as available for sale are not reversed through the consolidated income statement.
Increases in their fair value after impairment are recognised directly in OCI.
In the case of debt instruments classified as available for sale, impairment is assessed based on
the same criteria as financial assets carried at amortised cost. However, the amount recorded for
impairment is the cumulative loss measured as the difference between the amortised cost and
the current fair value, less any impairment loss on that investment previously recognised in the
consolidated income statement. Future interest income continues to be accrued based on the
reduced carrying amount of the asset and is accrued using the rate of interest used to discount
the future cash flows for the purpose of measuring the impairment loss. The interest income is
recorded as part of finance income. Impairment losses on debt instruments are reversed through
the consolidated income statement if the increase in fair value of the instruments can be objectively
related to an event occurring after the impairment loss was recognised in the consolidated income
statement.
(7) Leases
The determination of whether an arrangement is, or contains, a lease is based on the substance of the
arrangement at the inception date: whether the fulfillment of the arrangement is dependent on the use of a
specific asset or assets and the arrangement conveys a right to use the asset.
(i) Group as a lessee
Finance leases, which transfer to the Group substantially all the risks and benefits incidental to
ownership of the leased item other than legal titles, are capitalised at the inception of the lease
at the fair value of the leased property or, if lower, at the present value of the minimum lease
payments and classified as “Property and equipment” but represented on a separate line with the
corresponding liability to the lessor included in “Other liabilities”. Lease payments are apportioned
between the finance charges and reduction of the lease liability so as to achieve a constant rate
of interest on the remaining balance of the liability. Finance charges are charged directly against
income in “Interest expense” in the consolidated income statement.
Capitalised leased assets are depreciated over the shorter of the estimated useful life of the asset
and the lease term, if there is no reasonable certainty that the Group will obtain ownership by the
end of the lease term.
NOTES TO FINANCIAL STATEMENTS
36
5. Accounting Policies (Continued)Summary of significant accounting policies (Continued)(7) Leases (Continued)
(i) Group as a lessee (Continued)
Operating lease payments are not recognised in the consolidated statement of financial position.
Any rentals payable are accounted for on a straight-line basis over the lease term and are included
in “Operating expenses”.
Land held under finance leases are stated at cost less accumulated depreciation and any
impairment, and are depreciated over the remaining lease terms on a straight-line basis to the
consolidated income statement.
Medium term leases are leases with remaining lease period of more than 10 years but not more
than 50 years. Long term leases are leases with remaining lease period of more than 50 years.
(ii) Group as a lessor
Leases where the Group retains substantially all the risks and benefits of ownership of the asset are
classified as operating leases. The Group leases out all of its investment properties as operating
leases, thus generating rental income. Initial direct costs incurred in negotiating operating leases
are added to the carrying amount of the leased asset and are recognised over the lease term on
the same basis as rental income. Contingent rents are recognised as revenue in the period in which
they are earned.
The amounts due from the lessees under finance leases are recorded in the consolidated
statement of financial position as loans and advances to customers. The amount comprises the
gross investment in the finance leases less gross earnings allocated to future accounting periods.
The total gross earnings under finance leases are allocated to the accounting periods over the
duration of the underlying agreements so as to produce an approximately constant periodic rate of
return on the net cash investment for each accounting period.
(8) Recognition of revenue and expenditure
Revenue is recognised to the extent that it is probable that the economic benefits will flow to the Group
and the revenue can be reliably measured. The following specific recognition criteria must also be met
before revenue is recognised:
(i) Interest income and expense
For all financial instruments measured at amortised cost and interest-bearing financial instruments
classified as available-for-sale financial assets, interest income or expense is recorded at the
effective interest rate, which is the rate that exactly discounts estimated future cash payments or
receipts over the expected life of the financial instrument or a shorter period, where appropriate, to
the net carrying amount of the financial asset or financial liability. The calculation takes into account
all contractual terms of the financial instrument (for example, prepayment options) and includes any
fees or incremental costs that are directly attributable to the instrument and are an integral part of
the effective interest rate, but not future credit losses. The carrying amount of the financial asset or
financial liability is adjusted if the Group revises its estimates of payments or receipts. The adjusted
carrying amount is calculated based on the original effective interest rate and the change in the
carrying amount is recorded as interest income or expense.
Once the value of a financial asset or a group of similar financial assets had been reduced due to
an impairment loss, interest income continues to be recognised using the original effective interest
rate applied to the new carrying amount.

37 Public Bank (Hong Kong) Limited Annual Report 2013
5. Accounting Policies (Continued)Summary of significant accounting policies (Continued)(8) Recognition of revenue and expenditure (Continued)
(ii) Fee and commission income
The Group earns fee and commission income from a diverse range of services it provides to its
customers. Fee income can be divided into the following two categories:
(a) Fee income earned from services that are provided over a certain period of time
Fees earned from the provision of services over a period of time are accrued over that
period. These fees include commission income and asset management, custody and other
management and advisory fees. Loan commitment fees for loans that are likely to be drawn
down and other credit related fees are deferred (together with any incremental costs) and
recognised as an adjustment to the effective interest rate on the loan.
(b) Fee income from providing transaction services
Fees arising from negotiating or participating in the negotiation of a transaction for a third
party, such as the arrangement of the acquisition of shares or other securities or the
purchase or sale of businesses, are recognised on completion of the underlying transaction.
(iii) Dividend income
Dividend income is recognised when the Group’s right to receive the payment is established.
(iv) Net trading income
Net trading income arising from trading activities includes all gains and losses from changes in
fair value for financial assets and financial liabilities held for trading. Gains and losses on foreign
exchange trading and other transactions are also reported as “Net trading income” except for
those gains and losses on translation of foreign currencies recognised in the translation reserve.
(v) Rental income
Rental income arising on investment properties is accounted for on a straight-line basis over the
lease terms on ongoing leases and is recorded in the consolidated income statement as “Other
operating income”.
(9) Cash and cash equivalents
For the purpose of consolidated statement of cash flows, cash and cash equivalents consist of cash on
hand, amounts due from banks on demand or with original maturity within three months and held-to-
maturity investments with original maturity within three months.
(10) Business combinations and goodwill
Business combinations are accounted for using the acquisition method. The consideration transferred
is measured at the acquisition date fair value which is the sum of the acquisition date fair values of
assets transferred by the Group, liabilities assumed by the Group to the former owners of the acquiree
and the equity interests issued by the Group in exchange for control of the acquiree. For each business
combination, the Group elects whether to measure the non-controlling interests in the acquiree that are
present ownership interests and entitle their holders to a proportionate share of net assets in the event
of liquidation at fair value or at the proportionate share of the acquiree’s identifiable net assets. All other
components of non-controlling interests are measured at fair value. Acquisition-related costs are expensed
as incurred.
NOTES TO FINANCIAL STATEMENTS
38
5. Accounting Policies (Continued)Summary of significant accounting policies (Continued)(10) Business combinations and goodwill (Continued)
When the Group acquires a business, it assesses the financial assets and liabilities assumed for
appropriate classification and designation in accordance with the contractual terms, economic
circumstances and pertinent conditions as at the acquisition date. This includes the separation of
embedded derivatives in host contracts by the acquiree.
If the business combination is achieved in stages, the previously held equity interest is remeasured at its
acquisition date fair value and any resulting gain or loss is recognised in profit or loss.
Any contingent consideration to be transferred by the acquirer is recognised at fair value at the acquisition
date. Contingent consideration classified as an asset or a liability that is a financial instrument and within
the scope of HKAS 39 is measured at fair value with changes in fair value either recognised in profit or loss
or as a change to OCI. If the contingent consideration is not within the scope of HKAS 39, it is measured
in accordance with the appropriate HKFRS. Contingent consideration that is classified as equity is not
remeasured and subsequent settlement is accounted for within equity.
Goodwill is initially measured at cost, being the excess of the aggregate of the consideration transferred,
the amount recognised for non-controlling interests and any fair value of the Group’s previously held
equity interests in the acquiree over the identifiable net assets acquired and liabilities assumed. If the sum
of this consideration and other items is lower than fair value of the net assets of the subsidiary acquired,
the difference is, after reassessment, recognised in consolidated income statement as gain on bargain
purchase.
After initial recognition, goodwill is measured at cost less any accumulated impairment losses. Goodwill
is tested for impairment annually or more frequently if events or changes in circumstances indicate that
the carrying value may be impaired. The Group performs its annual impairment test of goodwill as at 31
December. For the purpose of impairment testing, goodwill acquired in a business combination is, from
the acquisition date, allocated to each of the Group’s cash-generating units, or groups of cash-generating
units, that are expected to benefit from the synergies of the combination, irrespective of whether other
assets or liabilities of the Group are assigned to those units or groups of units.
Impairment is determined by assessing the recoverable amount of the cash-generating unit (or groups
of cash-generating units) to which the goodwill relates. Where the recoverable amount of the cash-
generating unit (or groups of cash-generating units) is less than the carrying amount, an impairment loss is
recognised. An impairment loss recognised for goodwill is not reversed in a subsequent period.
Where goodwill has been allocated to a cash-generating unit (or groups of cash-generating units) and
part of the operation within that unit is disposed of, the goodwill associated with the operation disposed
of is included in the carrying amount of the operation when determining the gain or loss on the disposal.
Goodwill disposed in these circumstances is measured based on the relative values of the disposed
operation and the portion of the cash-generating unit retained.
39 Public Bank (Hong Kong) Limited Annual Report 2013
5. Accounting Policies (Continued)Summary of significant accounting policies (Continued)(11) Subsidiaries
A subsidiary is an entity (including a structured entity), directly or indirectly, controlled by the Bank. Control
is achieved when the Group is exposed, or has rights, to variable returns from its involvement with the
investee and has the ability to affect those returns through its power over the investee (i.e., existing rights
that give the Group the current ability to direct the relevant activities of the investee).
When the Bank has, directly or indirectly, less than a majority of the voting or similar rights of an investee,
the Group considers all relevant facts and circumstances in assessing whether it has power over an
investee, including:
(a) the contractual arrangement with the other vote holders of the investee;
(b) rights arising from other contractual arrangements; and
(c) the Group’s voting rights and potential voting rights.
The results of subsidiaries are included in the Bank’s income statement to the extent of dividends received
and receivable.
(12) Joint venture companies
A joint venture is a type of joint arrangement whereby the parties that have joint control of the arrangement
have rights to the net assets of the joint venture. Joint control is the contractually agreed sharing of control
of an arrangement, which exists only when decisions about the relevant activities require the unanimous
consent of the parties sharing control.
The Group’s investments in joint ventures are stated in the consolidated statement of financial position at
the Group’s share of net assets under the equity method of accounting, less any impairment loss.
The Group’s share of the post-acquisition results and OCI of joint ventures is included in the consolidated
income statement and consolidated comprehensive income, respectively. In addition, when there has
been a change recognised directly in the equity of the joint venture, the Group recognises its share of any
change, when applicable, in the consolidated statement of changes in equity. Unrealised gains and losses
resulting from transactions between the Group and its associates or joint ventures are eliminated to the
extent of the Group’s investments in the joint ventures, except where unrealised losses provide evidence
of an impairment of the asset transferred.
The results of joint ventures are included in the Bank’s income statement to the extent of dividends
received and receivable. The Bank’s investments in joint ventures are treated as non-current assets and
are stated at cost less any impairment loss.
NOTES TO FINANCIAL STATEMENTS
40
5. Accounting Policies (Continued)Summary of significant accounting policies (Continued)(13) Related parties
A party is considered to be related to the Group if:
(a) the party is a person or a close member of that person’s family and that person
(i) has control or joint control over the Group;
(ii) has significant influence over the Group; or
(iii) is a member of the key management personnel of the Group or of a parent of the Group;
or
(b) the party is an entity where any of the following conditions applies
(i) the entity and the Group are members of the same group;
(ii) one entity is an associate or joint venture of the other entity (or of a parent, subsidiary or
fellow subsidiary of the other entity);
(iii) the entity and the Group are joint ventures of the same third party;
(iv) one entity is a joint venture of a third entity and the other entity is an associate of the third
entity;
(v) the entity is a post-employment benefit plan for the benefit of employees of either the Group
or an entity related to the Group;
(vi) the entity is controlled or jointly controlled by a person identified in (a); and
(vii) a person identified in (a)(i) has significant influence over the entity or is a member of the key
management personnel of the entity (or of a parent of the entity).
(14) Property and equipment, and depreciation
The property and equipment is stated at cost, except for certain buildings transferred from investment
properties, which are stated at deemed cost at the date of transfer, less accumulated depreciation and
impairment. The cost of an asset comprises its purchase price and any directly attributable costs of
bringing the asset to its working condition and location for its intended use. Expenditure incurred after
items of property and equipment have been put into operation, such as repairs and maintenance, is
normally charged to the consolidated income statement in the period in which it is incurred. In situations
where it can be clearly demonstrated that the expenditure has resulted in an increase in the future
economic benefits expected to be obtained from the use of an item of property and equipment, and where
the cost of the item can be measured reliably, the expenditure is capitalised as an additional cost of that
asset or as a replacement.

41 Public Bank (Hong Kong) Limited Annual Report 2013
5. Accounting Policies (Continued)Summary of significant accounting policies (Continued)(14) Property and equipment, and depreciation (Continued)
Depreciation is calculated on a straight-line basis to write off the cost of each item of property and
equipment to its residual value over its estimated useful life. The estimated useful lives are as follows:
• Buildings Over the shorter of the remaining lease terms and 50 years
• Leasehold improvements:
Own leasehold buildings 3 to 5 years
Others Over the shorter of the remaining lease terms and 7 years
• Furniture, fixtures, equipment and
motor vehicles
3 to 10 years
• Land held under finance leases Over the lease term
Where parts of an item of property and equipment have different useful lives, the cost of that item is
allocated on a reasonable basis among the parts and each part is depreciated separately.
Residual values, useful lives and the depreciation method are reviewed, and adjusted if appropriate, at the
end of each reporting period.
An item of property and equipment is derecognised upon disposal or when no future economic benefits
are expected from its use or disposal. Any gain or loss on disposal or retirement recognised in the
consolidated income statement in the year the asset is derecognised is the difference between the net
sales proceeds and the carrying amount of the relevant asset.
Land held under finance leases are stated at cost less accumulated depreciation and any impairment,
and are depreciated over the remaining lease terms on a straight-line basis to the consolidated income
statement.
Medium term leases are leases with remaining lease periods of more than 10 years to 50 years. Long term
leases are leases with remaining lease periods of more than 50 years.
(15) Investment properties
Investment properties are interests in land and buildings held to earn rental income and/or for capital
appreciation, rather than for use in the production or supply of goods or services or for administrative
purposes; or for sale in the ordinary course of business. Such properties are measured initially at cost,
including transaction costs. Subsequent to initial recognition, investment properties are stated at fair value,
which reflects market conditions at the end of the reporting period. Gains or losses arising from changes
in the fair values of investment properties are included in the consolidated income statement in the year in
which they arise.
Any gains or losses on the retirement or disposal of an investment property are recognised in the
consolidated income statement in the year of retirement or disposal.
For a transfer from investment properties to owner-occupied properties or inventories, the deemed cost of
a property for subsequent accounting is its fair value at the date of change in use. If a property occupied
by the Group as an owner-occupied property becomes an investment property, the Group accounts for
such property in accordance with the policy stated under “Property and equipment, and depreciation”
up to the date of change in use, and any difference at that date between the carrying amount and the fair
value of the property is accounted for as a revaluation in accordance with the policy stated under “Property
and equipment, and depreciation” above. For a transfer from inventories to investment properties,
any difference between the fair value of the property at that date and its previous carrying amount is
recognised in the consolidated income statement.
NOTES TO FINANCIAL STATEMENTS
42
5. Accounting Policies (Continued)Summary of significant accounting policies (Continued)(16) Intangible assets (other than goodwill)
Intangible assets, representing eligibility rights to trade on or through Hong Kong Exchanges and Clearing
Limited, are stated at cost less impairment. The useful lives are assessed to be indefinite and they are
reviewed annually to determine whether the indefinite life assessment continues to be supportable. If not,
the change in the useful life assessment from indefinite to finite is accounted for on a prospective basis.
The carrying amount of intangible assets is subject to an annual impairment test, and impairment, if any, is
charged to the consolidated income statement.
(17) Impairment of non-financial assets
The Group assesses at each reporting date or more frequently if events or changes in circumstances
indicate that the carrying value may be impaired, whether there is an indication that a non-financial asset
may be impaired. If any such indication exists, or when annual impairment testing for an asset is required,
the Group makes an estimate of the asset’s recoverable amount. Where the carrying amount of an asset
(or cash-generating unit) exceeds its recoverable amount, the asset (or cash-generating unit) the Group
considered impaired is written down to its recoverable amount.
For assets excluding goodwill and deferred tax assets, an assessment is made at each reporting date
as to whether there is an indication that previously recognised impairment losses may no longer exist
or may have decreased. If such an indication exists, the recoverable amount is estimated. A previously
recognised impairment loss is reversed only if there has been a change in the estimates used to determine
the asset’s recoverable amount but not to an amount higher than the carrying amount that would have
been determined (net of any depreciation/amortisation) had no impairment been recognised for the asset
in prior years. A reversal of such an impairment loss is credited to the consolidated income statement in
the period it arises.
(18) Repossessed assets and valuation of collateral
Collateral assets for loans and advances and receivables are repossessed by the Group when the
borrowers are unable to service their repayments, and would be realised in satisfaction of outstanding
debts. Advances with repossessed collateral assets will continue to be accounted for as customer
advances, except for those where the Group has taken the legal title and control of the repossessed
collateral assets, in which cases the repossessed assets are shown under other accounts at the
predetermined value with a corresponding reduction in the related advances. Individual impairment
allowance is made on the shortfall between the expected net realisable value of the repossessed assets
and the outstanding advances.
Collateral assets (including repossessed assets and assets not yet repossessed) are recognised at the
lower of the carrying amount of the related loans and advances and receivables and fair value less costs to
sell.
(19) Provisions
A provision is recognised when a present obligation (legal or constructive) has arisen as a result of a past
event and it is probable that a future outflow of resources will be required to settle the obligation, provided
that a reliable estimate can be made of the amount of the obligation.
When the effect of discounting is material, the amount recognised for a provision is the present value at
the end of the reporting period of the future expenditures expected to be required to settle the obligation.
The increase in the discounted present value amount arising from the passage of time is included in
“Operating expenses” in the consolidated income statement.

43 Public Bank (Hong Kong) Limited Annual Report 2013
5. Accounting Policies (Continued)Summary of significant accounting policies (Continued)(20) Income tax
Income tax comprises current and deferred tax. Income tax is recognised in the consolidated income
statement, or in equity if it relates to items that are recognised in the same or a different period directly in
equity.
Current tax assets and liabilities for the current and prior periods are measured at the amount expected to
be recovered from or paid to the taxation authorities.
Deferred tax is provided, using the liability method, on all temporary differences at the end of the reporting
period between the tax bases of assets and liabilities and their carrying amounts for financial reporting
purposes.
Deferred tax liabilities are recognised for all taxable temporary differences, except:
• when the deferred tax liability arises from the initial recognition of an asset or a liability in a
transaction that is not a business combination and, at the time of the transaction, affects neither
the accounting profit nor taxable profit or loss; and
• in respect of taxable temporary differences associated with investments in subsidiaries and joint
ventures, when the timing of the reversal of the temporary differences can be controlled and it is
probable that the temporary differences will not reverse in the foreseeable future.
Deferred tax assets are recognised for all deductible temporary differences, the carryforward of unused tax
credit and any unused tax losses. Deferred tax assets are recognised, to the extent that it is probable that
taxable profit will be available against which the deductible temporary differences, and the carryforward of
unused tax credit and unused tax losses can be utilised except:
• when the deferred tax asset relating to the deductible temporary differences arises from the initial
recognition of an asset or a liability in a transaction that is not a business combination and, at the
time of the transaction, affects neither the accounting profit nor taxable profit or loss; and
• in respect of deductible temporary differences associated with investments in subsidiaries and
joint ventures, deferred tax assets are only recognised to the extent that it is probable that the
temporary differences will reverse in the foreseeable future and taxable profit will be available
against which the temporary differences can be utilised.
The carrying amount of deferred tax assets is reviewed at the end of each reporting period and reduced to
the extent that it is no longer probable that sufficient taxable profit will be available to allow all or part of the
deferred tax asset to be utilised. Conversely, previously unrecognised deferred tax assets are reassessed
at the end of each reporting period and are recognised to the extent that it is probable that sufficient
taxable profit will be available to allow all or part of the deferred tax asset to be utilised.
Deferred tax assets and liabilities are measured at the tax rates that are expected to apply to the period
when the asset is realised or the liability is settled, based on tax rates and tax laws that have been enacted
or substantively enacted at the end of the reporting period.
Deferred tax assets and deferred tax liabilities are offset if a legally enforceable right exists to set off current
tax assets against current tax liabilities and the deferred taxes relate to the same taxable entity and the
same taxation authority.
NOTES TO FINANCIAL STATEMENTS
44
5. Accounting Policies (Continued)Summary of significant accounting policies (Continued)(21) Employee benefits
(a) Retirement benefit schemes
The Group participates in two defined contribution retirement benefit schemes for those employees
who are eligible to participate. The assets of the schemes are held separately from those of the
Group in independently administered funds.
Contribution for Mandatory Provident Fund Scheme is made based on a percentage of the
participating employees’ relevant monthly income from the Group while contribution for
Occupational Retirement Scheme Ordinance Scheme is made based on the participating
employees’ basic salary, and the contributions are charged to the consolidated income statement as
they become payable in accordance with the rules of the respective schemes. When an employee
leaves the Group prior to his/her interest in the Group’s employer non-mandatory contributions
vesting with the employee, the ongoing contributions payable by the Group may be reduced by the
relevant amount of forfeited contributions. The Group’s mandatory contributions vest fully with the
employee.
(b) Share option scheme
PFHL operates a share option scheme (the “Scheme”) for the purpose of providing incentives and
rewards to eligible participants who contribute to the success of the PFHL Group’s operations.
Employees (including Directors) of the Group receive remuneration in the form of share-based
payments whereby employees render services as consideration for equity-settled transactions.
For share options granted under the Scheme, the fair value of the employee’s services rendered
in exchange for the grant of the options is recognised as an expense and credited to an employee
share-based compensation reserve under equity. The total amount to be expensed over the
vesting period is determined by reference to the fair value of the options granted at the grant date.
At the end of each reporting period, the PFHL Group revises its estimates of the number of options
that is expected to become exercisable. It recognises the impact of the revision of the original
estimates, if any, in the consolidated income statement, and a corresponding adjustment to the
employee share-based compensation reserve over the remaining vesting period.
Where the terms of an equity-settled award are modified, as a minimum an expense is recognised
as if the terms had not been modified if the original terms of the award are met. In addition, an
expense is recognised for any modification, which increases the total fair value of the share-based
payments, or is otherwise beneficial to the employee as measured at the date of modification.
Where an equity-settled award is cancelled, it is treated as if it had vested on the date of
cancellation, and any expense not yet recognised for the award is recognised immediately.
However, if a new award is substituted for the cancelled award, and is designated as a
replacement award on the date that is granted, the cancelled and new awards are treated as if
they were a modification of the original award, as described in the previous paragraph.
(c) Employee leave entitlements
The cost of accumulating compensated absences is recognised as an expense and measured
based on the additional amount that the Group expects to pay as a result of the unused entitlement
that has accumulated as at the end of the reporting period.
45 Public Bank (Hong Kong) Limited Annual Report 2013
5. Accounting Policies (Continued)Summary of significant accounting policies (Continued)(22) Dividends
Final dividends proposed by the Directors will remain in retained profits within reserves in the consolidated
statement of financial position, until they have been approved by the shareholders in general meeting.
When these dividends are approved by the shareholders and declared, they are recognised as a liability.
Interim dividends and special dividends are simultaneously proposed and declared by the Directors.
Consequently, interim dividends and special dividends are recognised directly as a liability when they are
proposed and declared.
6. Significant Accounting EstimatesEstimation uncertaintyThe key assumptions concerning the future and other key sources of estimation uncertainty at the end of the
reporting period, that have a significant risk of causing a material adjustment to the carrying amounts of assets
and liabilities within the next financial year, are described below.
Impairment allowances on loans and advances and receivables, and held-to-maturity investments
The Group reviews its portfolios of loans and advances and receivables and held-to-maturity investments to assess
impairment on a regular basis. In determining whether an impairment loss should be recorded in the consolidated
income statement, the Group makes judgements as to whether there is any observable data indicating that there
is a measurable decrease in the discounted estimated future cash flows from a portfolio of loans and advances
and receivables, and held-to-maturity investments before the decrease can be identified with an individual loan
or held-to-maturity investment in those portfolios. This evidence may include observable data indicating that
there has been an adverse change in the payment status of borrowers in a group, or national or local economic
conditions that correlate with defaults on assets in the group.
For loans and advances and receivables for which no individual impairment is observed, management uses
estimates based on historical loss experience for assets with credit risk characteristics and objective evidence
of impairment similar to those in the loan portfolio when scheduling its future cash flows. The methodology and
assumptions used for estimating both the amount and timing of future cash flows are reviewed regularly to reduce
any differences between loss estimates and actual loss experience.
Impairment of goodwill
The Group determines whether goodwill is impaired at least on an annual basis. This requires an estimation of the
value in use of the cash-generating units to which the goodwill is allocated. Estimating the value in use requires
the Group to make an estimate of the expected future cash flows from the cash-generating unit and also to
choose a suitable discount rate in order to calculate the present value of those cash flows. The carrying amount
of goodwill at 31 December 2013 and 2012 was HK$242,342,000. Further details are set out in note 28 to the
financial statements.
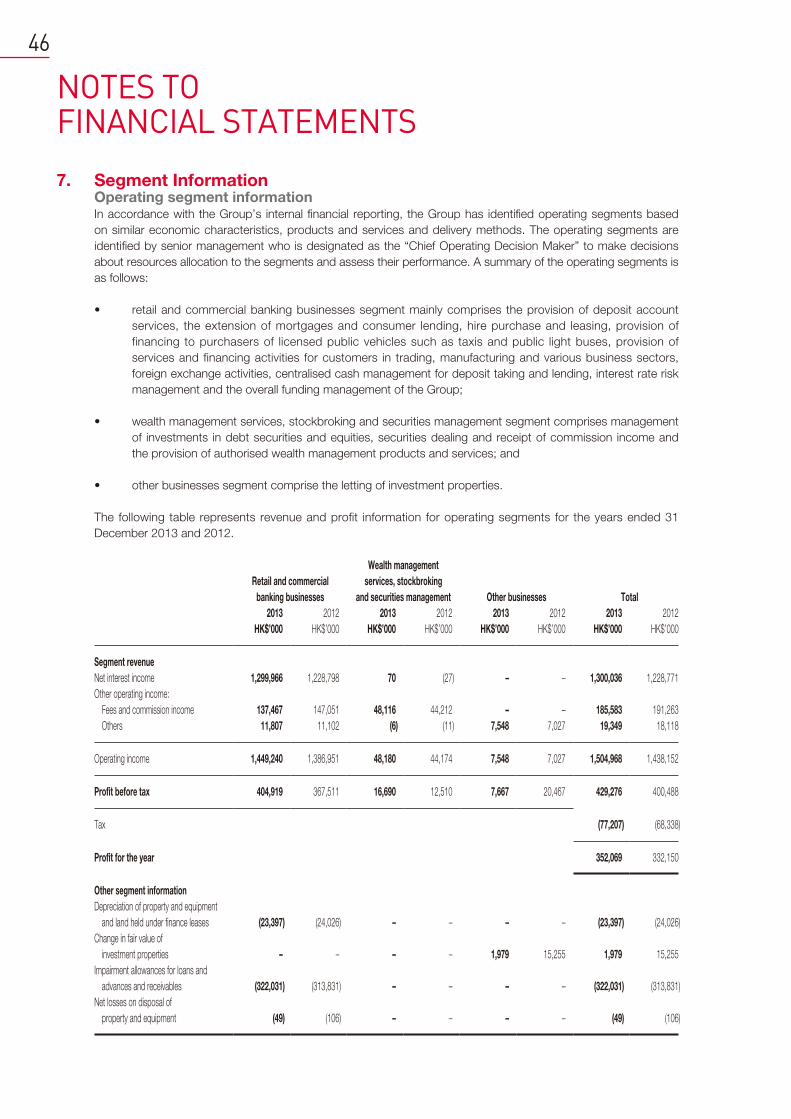
NOTES TO FINANCIAL STATEMENTS
46
7. Segment InformationOperating segment informationIn accordance with the Group’s internal financial reporting, the Group has identified operating segments based
on similar economic characteristics, products and services and delivery methods. The operating segments are
identified by senior management who is designated as the “Chief Operating Decision Maker” to make decisions
about resources allocation to the segments and assess their performance. A summary of the operating segments is
as follows:
• retail and commercial banking businesses segment mainly comprises the provision of deposit account
services, the extension of mortgages and consumer lending, hire purchase and leasing, provision of
financing to purchasers of licensed public vehicles such as taxis and public light buses, provision of
services and financing activities for customers in trading, manufacturing and various business sectors,
foreign exchange activities, centralised cash management for deposit taking and lending, interest rate risk
management and the overall funding management of the Group;
• wealth management services, stockbroking and securities management segment comprises management
of investments in debt securities and equities, securities dealing and receipt of commission income and
the provision of authorised wealth management products and services; and
• other businesses segment comprise the letting of investment properties.
The following table represents revenue and profit information for operating segments for the years ended 31
December 2013 and 2012.
Retail and commercial
banking businesses
Wealth management
services, stockbroking
and securities management Other businesses Total
2013 2012 2013 2012 2013 2012 2013 2012
HK$’000 HK$’000 HK$’000 HK$’000 HK$’000 HK$’000 HK$’000 HK$’000
Segment revenue
Net interest income 1,299,966 1,228,798 70 (27) – – 1,300,036 1,228,771
Other operating income:
Fees and commission income 137,467 147,051 48,116 44,212 – – 185,583 191,263
Others 11,807 11,102 (6) (11) 7,548 7,027 19,349 18,118
Operating income 1,449,240 1,386,951 48,180 44,174 7,548 7,027 1,504,968 1,438,152
Profit before tax 404,919 367,511 16,690 12,510 7,667 20,467 429,276 400,488
Tax (77,207) (68,338)
Profit for the year 352,069 332,150
Other segment information
Depreciation of property and equipment
and land held under finance leases (23,397) (24,026) – – – – (23,397) (24,026)
Change in fair value of
investment properties – – – – 1,979 15,255 1,979 15,255
Impairment allowances for loans and
advances and receivables (322,031) (313,831) – – – – (322,031) (313,831)
Net losses on disposal of
property and equipment (49) (106) – – – – (49) (106)
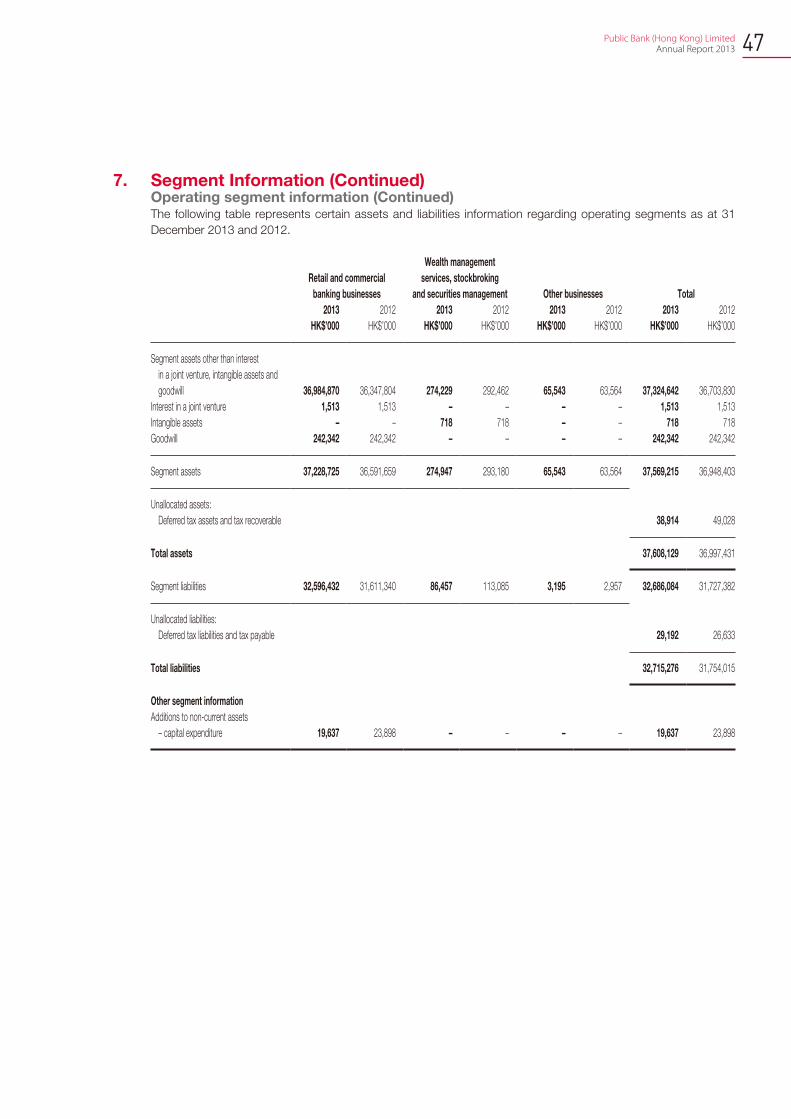
47 Public Bank (Hong Kong) Limited Annual Report 2013
7. Segment Information (Continued)Operating segment information (Continued)The following table represents certain assets and liabilities information regarding operating segments as at 31
December 2013 and 2012.
Retail and commercial
banking businesses
Wealth management
services, stockbroking
and securities management Other businesses Total
2013 2012 2013 2012 2013 2012 2013 2012
HK$’000 HK$’000 HK$’000 HK$’000 HK$’000 HK$’000 HK$’000 HK$’000
Segment assets other than interest
in a joint venture, intangible assets and
goodwill 36,984,870 36,347,804 274,229 292,462 65,543 63,564 37,324,642 36,703,830
Interest in a joint venture 1,513 1,513 – – – – 1,513 1,513
Intangible assets – – 718 718 – – 718 718
Goodwill 242,342 242,342 – – – – 242,342 242,342
Segment assets 37,228,725 36,591,659 274,947 293,180 65,543 63,564 37,569,215 36,948,403
Unallocated assets:
Deferred tax assets and tax recoverable 38,914 49,028
Total assets 37,608,129 36,997,431
Segment liabilities 32,596,432 31,611,340 86,457 113,085 3,195 2,957 32,686,084 31,727,382
Unallocated liabilities:
Deferred tax liabilities and tax payable 29,192 26,633
Total liabilities 32,715,276 31,754,015
Other segment information
Additions to non-current assets
– capital expenditure 19,637 23,898 – – – – 19,637 23,898
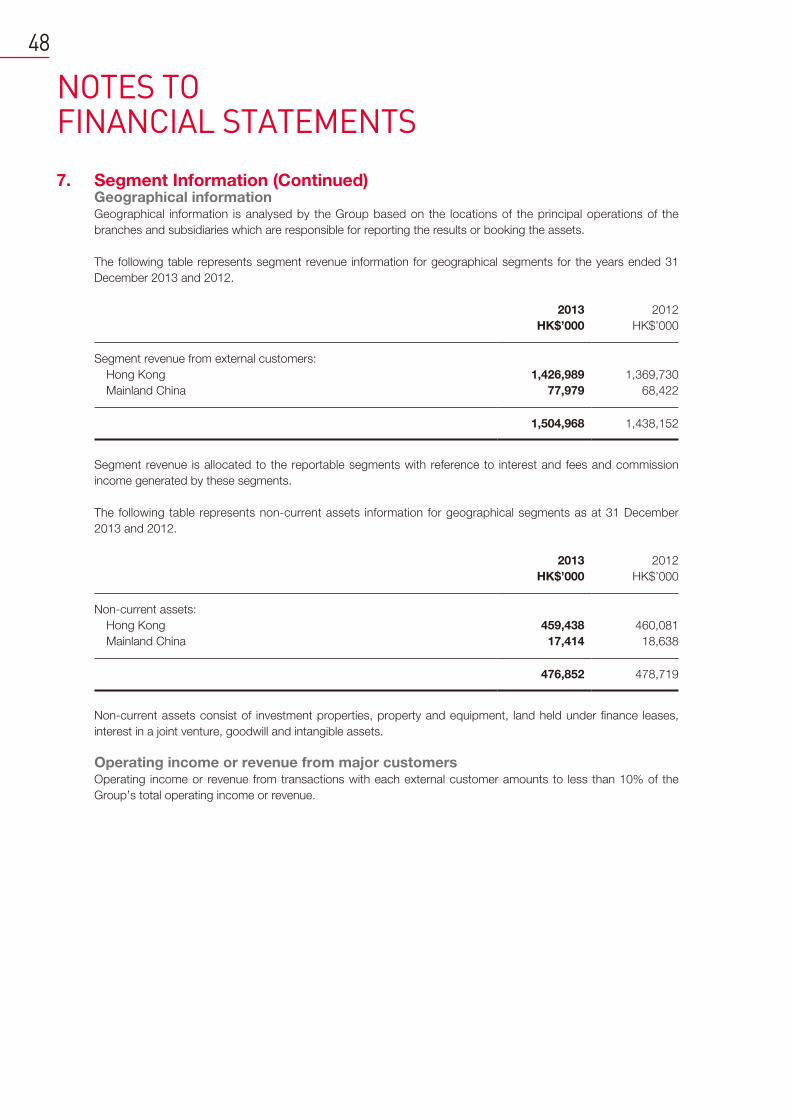
NOTES TO FINANCIAL STATEMENTS
48
7. Segment Information (Continued)Geographical informationGeographical information is analysed by the Group based on the locations of the principal operations of the
branches and subsidiaries which are responsible for reporting the results or booking the assets.
The following table represents segment revenue information for geographical segments for the years ended 31
December 2013 and 2012.
2013 2012
HK$’000 HK$’000
Segment revenue from external customers:
Hong Kong 1,426,989 1,369,730
Mainland China 77,979 68,422
1,504,968 1,438,152
Segment revenue is allocated to the reportable segments with reference to interest and fees and commission
income generated by these segments.
The following table represents non-current assets information for geographical segments as at 31 December
2013 and 2012.
2013 2012
HK$’000 HK$’000
Non-current assets:
Hong Kong 459,438 460,081
Mainland China 17,414 18,638
476,852 478,719
Non-current assets consist of investment properties, property and equipment, land held under finance leases,
interest in a joint venture, goodwill and intangible assets.
Operating income or revenue from major customersOperating income or revenue from transactions with each external customer amounts to less than 10% of the
Group’s total operating income or revenue.
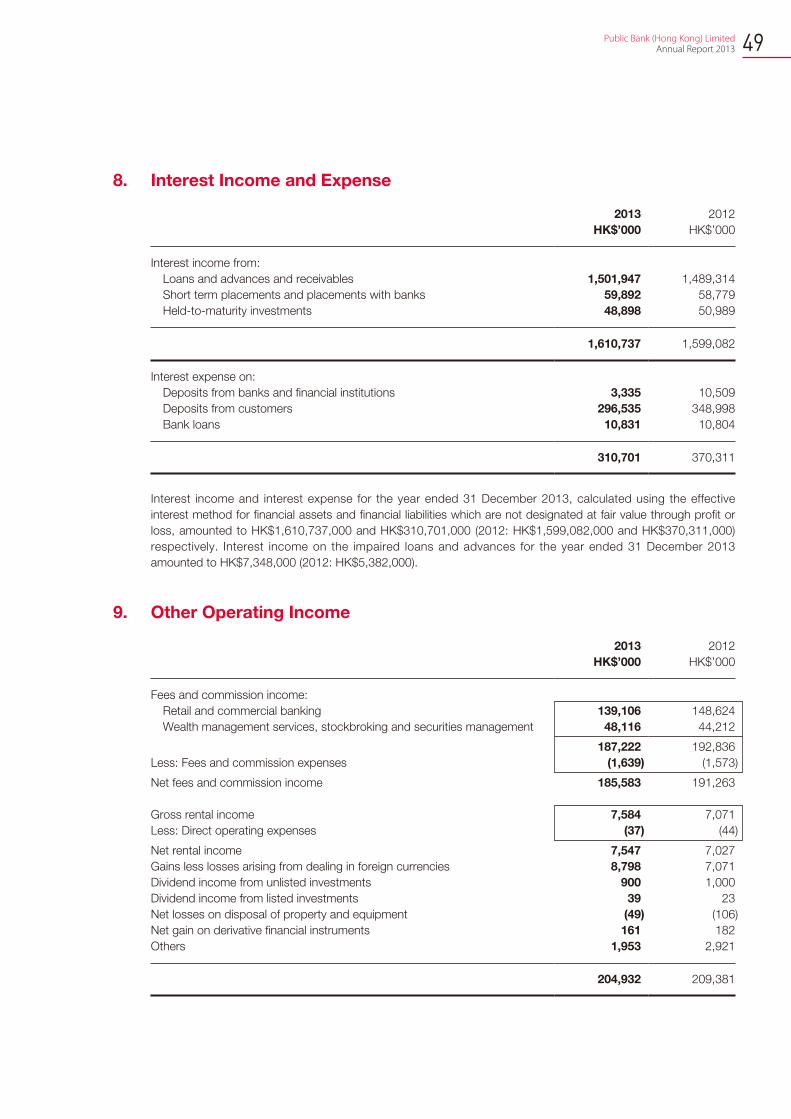
49 Public Bank (Hong Kong) Limited Annual Report 2013
8. Interest Income and Expense
2013 2012
HK$’000 HK$’000
Interest income from:
Loans and advances and receivables 1,501,947 1,489,314
Short term placements and placements with banks 59,892 58,779
Held-to-maturity investments 48,898 50,989
1,610,737 1,599,082
Interest expense on:
Deposits from banks and financial institutions 3,335 10,509
Deposits from customers 296,535 348,998
Bank loans 10,831 10,804
310,701 370,311
Interest income and interest expense for the year ended 31 December 2013, calculated using the effective
interest method for financial assets and financial liabilities which are not designated at fair value through profit or
loss, amounted to HK$1,610,737,000 and HK$310,701,000 (2012: HK$1,599,082,000 and HK$370,311,000)
respectively. Interest income on the impaired loans and advances for the year ended 31 December 2013
amounted to HK$7,348,000 (2012: HK$5,382,000).
9. Other Operating Income
2013 2012
HK$’000 HK$’000
Fees and commission income:
Retail and commercial banking 139,106 148,624
Wealth management services, stockbroking and securities management 48,116 44,212
187,222 192,836
Less: Fees and commission expenses (1,639) (1,573)
Net fees and commission income 185,583 191,263
Gross rental income 7,584 7,071
Less: Direct operating expenses (37) (44)
Net rental income 7,547 7,027
Gains less losses arising from dealing in foreign currencies 8,798 7,071
Dividend income from unlisted investments 900 1,000
Dividend income from listed investments 39 23
Net losses on disposal of property and equipment (49) (106)
Net gain on derivative financial instruments 161 182
Others 1,953 2,921
204,932 209,381
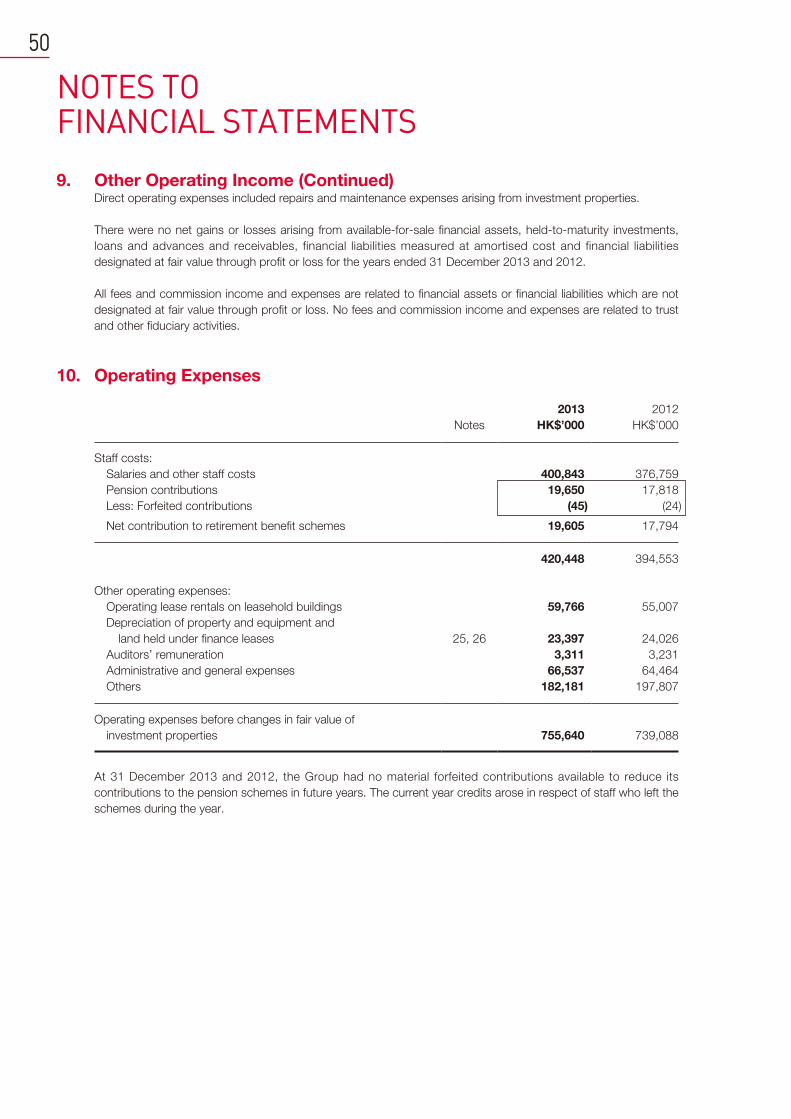
NOTES TO FINANCIAL STATEMENTS
50
9. Other Operating Income (Continued)Direct operating expenses included repairs and maintenance expenses arising from investment properties.
There were no net gains or losses arising from available-for-sale financial assets, held-to-maturity investments,
loans and advances and receivables, financial liabilities measured at amortised cost and financial liabilities
designated at fair value through profit or loss for the years ended 31 December 2013 and 2012.
All fees and commission income and expenses are related to financial assets or financial liabilities which are not
designated at fair value through profit or loss. No fees and commission income and expenses are related to trust
and other fiduciary activities.
10. Operating Expenses
2013 2012
Notes HK$’000 HK$’000
Staff costs:
Salaries and other staff costs 400,843 376,759
Pension contributions 19,650 17,818
Less: Forfeited contributions (45) (24)
Net contribution to retirement benefit schemes 19,605 17,794
420,448 394,553
Other operating expenses:
Operating lease rentals on leasehold buildings 59,766 55,007
Depreciation of property and equipment and
land held under finance leases 25, 26 23,397 24,026
Auditors’ remuneration 3,311 3,231
Administrative and general expenses 66,537 64,464
Others 182,181 197,807
Operating expenses before changes in fair value of
investment properties 755,640 739,088
At 31 December 2013 and 2012, the Group had no material forfeited contributions available to reduce its
contributions to the pension schemes in future years. The current year credits arose in respect of staff who left the
schemes during the year.
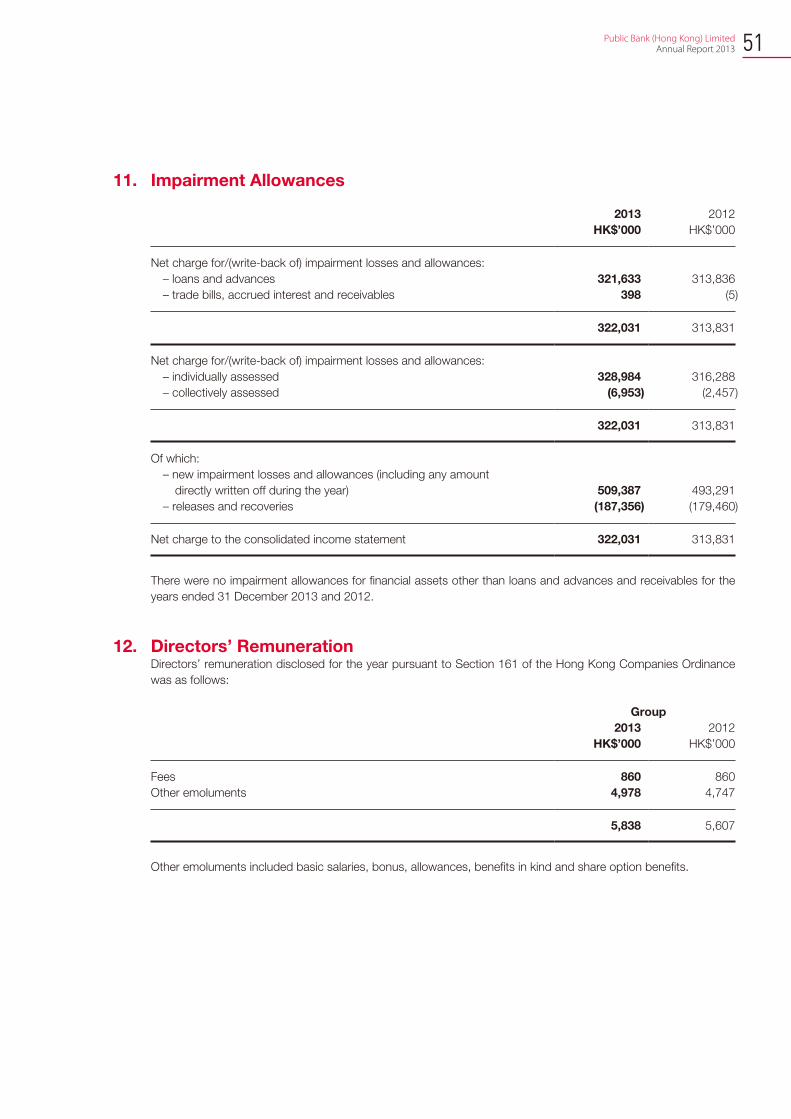
51 Public Bank (Hong Kong) Limited Annual Report 2013
11. Impairment Allowances
2013 2012
HK$’000 HK$’000
Net charge for/(write-back of) impairment losses and allowances:
– loans and advances 321,633 313,836
– trade bills, accrued interest and receivables 398 (5)
322,031 313,831
Net charge for/(write-back of) impairment losses and allowances:
– individually assessed 328,984 316,288
– collectively assessed (6,953) (2,457)
322,031 313,831
Of which:
– new impairment losses and allowances (including any amount
directly written off during the year) 509,387 493,291
– releases and recoveries (187,356) (179,460)
Net charge to the consolidated income statement 322,031 313,831
There were no impairment allowances for financial assets other than loans and advances and receivables for the
years ended 31 December 2013 and 2012.
12. Directors’ RemunerationDirectors’ remuneration disclosed for the year pursuant to Section 161 of the Hong Kong Companies Ordinance
was as follows:
Group
2013 2012
HK$’000 HK$’000
Fees 860 860
Other emoluments 4,978 4,747
5,838 5,607
Other emoluments included basic salaries, bonus, allowances, benefits in kind and share option benefits.
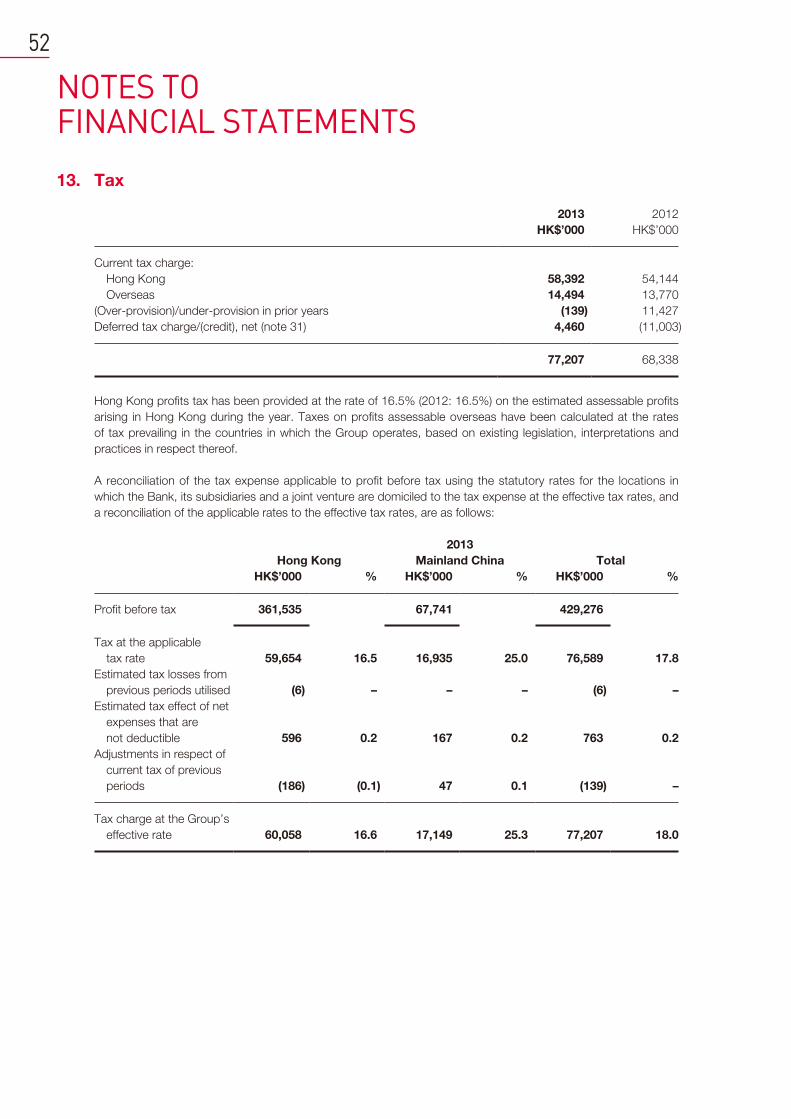
NOTES TO FINANCIAL STATEMENTS
52
13. Tax
2013 2012
HK$’000 HK$’000
Current tax charge:
Hong Kong 58,392 54,144
Overseas 14,494 13,770
(Over-provision)/under-provision in prior years (139) 11,427
Deferred tax charge/(credit), net (note 31) 4,460 (11,003)
77,207 68,338
Hong Kong profits tax has been provided at the rate of 16.5% (2012: 16.5%) on the estimated assessable profits
arising in Hong Kong during the year. Taxes on profits assessable overseas have been calculated at the rates
of tax prevailing in the countries in which the Group operates, based on existing legislation, interpretations and
practices in respect thereof.
A reconciliation of the tax expense applicable to profit before tax using the statutory rates for the locations in
which the Bank, its subsidiaries and a joint venture are domiciled to the tax expense at the effective tax rates, and
a reconciliation of the applicable rates to the effective tax rates, are as follows:
2013
Hong Kong Mainland China Total
HK$’000 % HK$’000 % HK$’000 %
Profit before tax 361,535 67,741 429,276
Tax at the applicable
tax rate 59,654 16.5 16,935 25.0 76,589 17.8
Estimated tax losses from
previous periods utilised (6) – – – (6) –
Estimated tax effect of net
expenses that are
not deductible 596 0.2 167 0.2 763 0.2
Adjustments in respect of
current tax of previous
periods (186) (0.1) 47 0.1 (139) –
Tax charge at the Group’s
effective rate 60,058 16.6 17,149 25.3 77,207 18.0
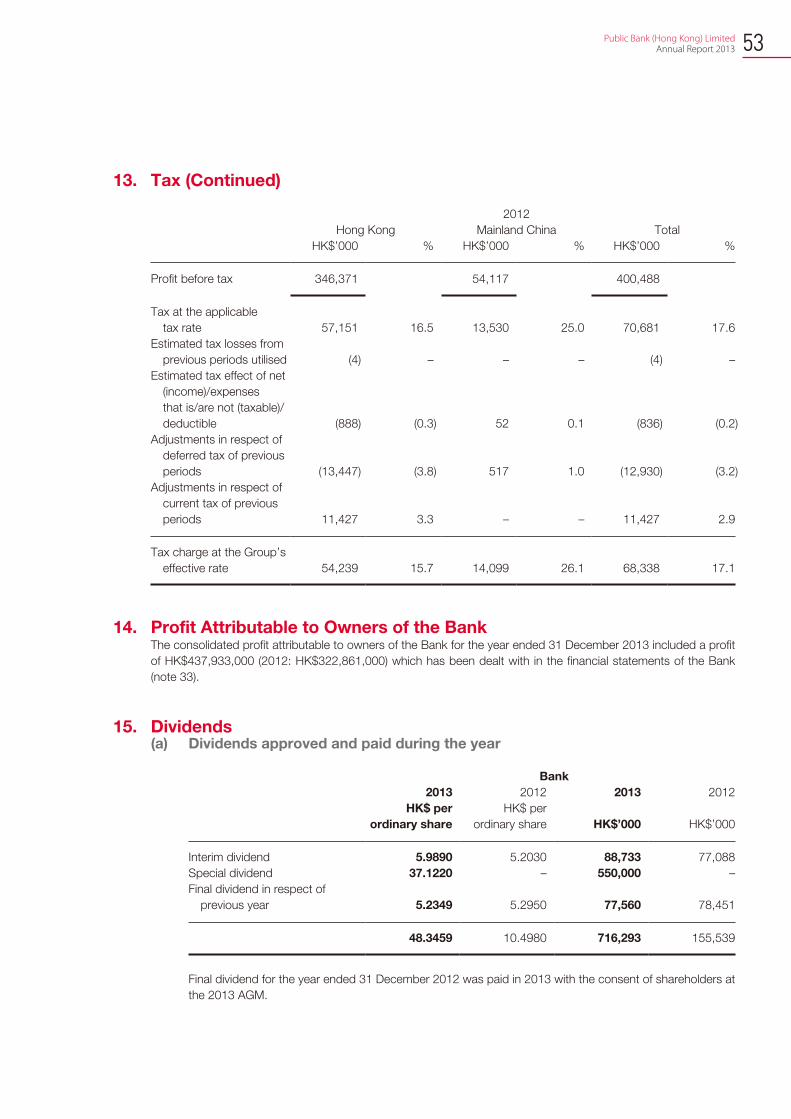
53 Public Bank (Hong Kong) Limited Annual Report 2013
13. Tax (Continued)
2012
Hong Kong Mainland China Total
HK$’000 % HK$’000 % HK$’000 %
Profit before tax 346,371 54,117 400,488
Tax at the applicable
tax rate 57,151 16.5 13,530 25.0 70,681 17.6
Estimated tax losses from
previous periods utilised (4) – – – (4) –
Estimated tax effect of net
(income)/expenses
that is/are not (taxable)/
deductible (888) (0.3) 52 0.1 (836) (0.2)
Adjustments in respect of
deferred tax of previous
periods (13,447) (3.8) 517 1.0 (12,930) (3.2)
Adjustments in respect of
current tax of previous
periods 11,427 3.3 – – 11,427 2.9
Tax charge at the Group’s
effective rate 54,239 15.7 14,099 26.1 68,338 17.1
14. Profit Attributable to Owners of the BankThe consolidated profit attributable to owners of the Bank for the year ended 31 December 2013 included a profit
of HK$437,933,000 (2012: HK$322,861,000) which has been dealt with in the financial statements of the Bank
(note 33).
15. Dividends(a) Dividends approved and paid during the year
Bank
2013 2012 2013 2012
HK$ per
ordinary share
HK$ per
ordinary share HK$’000 HK$’000
Interim dividend 5.9890 5.2030 88,733 77,088
Special dividend 37.1220 – 550,000 –
Final dividend in respect of
previous year 5.2349 5.2950 77,560 78,451
48.3459 10.4980 716,293 155,539
Final dividend for the year ended 31 December 2012 was paid in 2013 with the consent of shareholders at
the 2013 AGM.
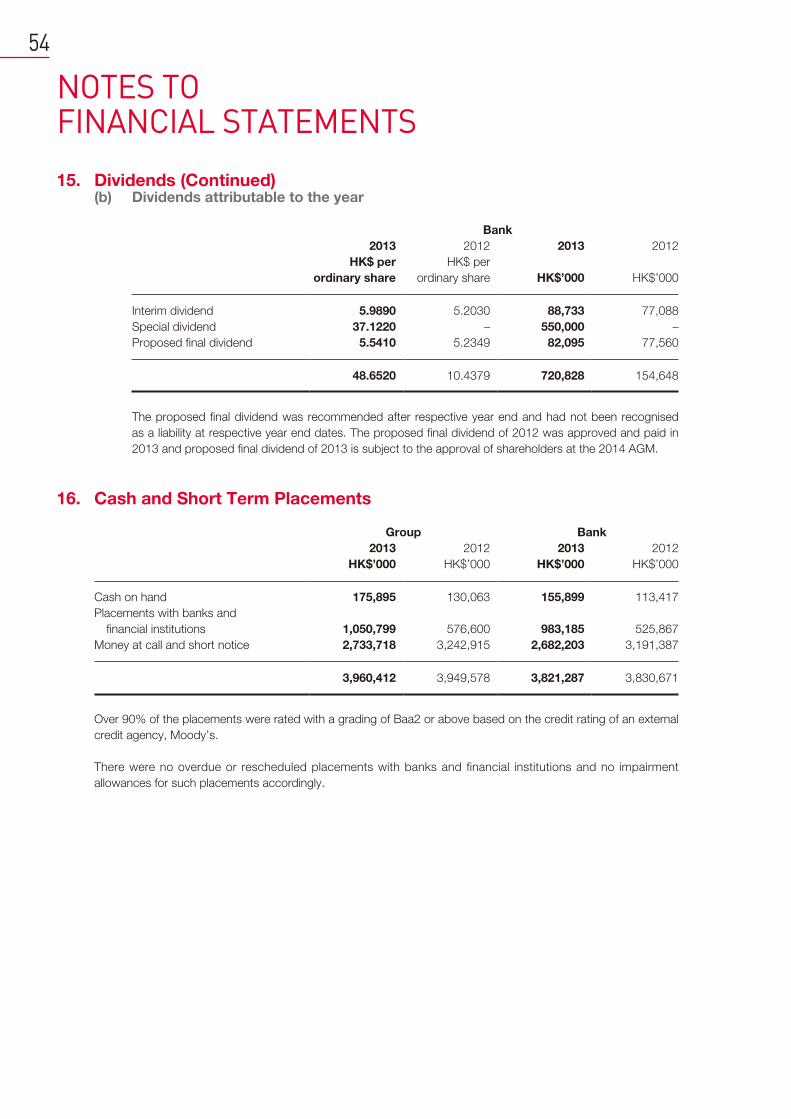
NOTES TO FINANCIAL STATEMENTS
54
15. Dividends (Continued)(b) Dividends attributable to the year
Bank
2013 2012 2013 2012
HK$ per
ordinary share
HK$ per
ordinary share HK$’000 HK$’000
Interim dividend 5.9890 5.2030 88,733 77,088
Special dividend 37.1220 – 550,000 –
Proposed final dividend 5.5410 5.2349 82,095 77,560
48.6520 10.4379 720,828 154,648
The proposed final dividend was recommended after respective year end and had not been recognised
as a liability at respective year end dates. The proposed final dividend of 2012 was approved and paid in
2013 and proposed final dividend of 2013 is subject to the approval of shareholders at the 2014 AGM.
16. Cash and Short Term Placements
Group Bank
2013 2012 2013 2012
HK$’000 HK$’000 HK$’000 HK$’000
Cash on hand 175,895 130,063 155,899 113,417
Placements with banks and
financial institutions 1,050,799 576,600 983,185 525,867
Money at call and short notice 2,733,718 3,242,915 2,682,203 3,191,387
3,960,412 3,949,578 3,821,287 3,830,671
Over 90% of the placements were rated with a grading of Baa2 or above based on the credit rating of an external
credit agency, Moody’s.
There were no overdue or rescheduled placements with banks and financial institutions and no impairment
allowances for such placements accordingly.
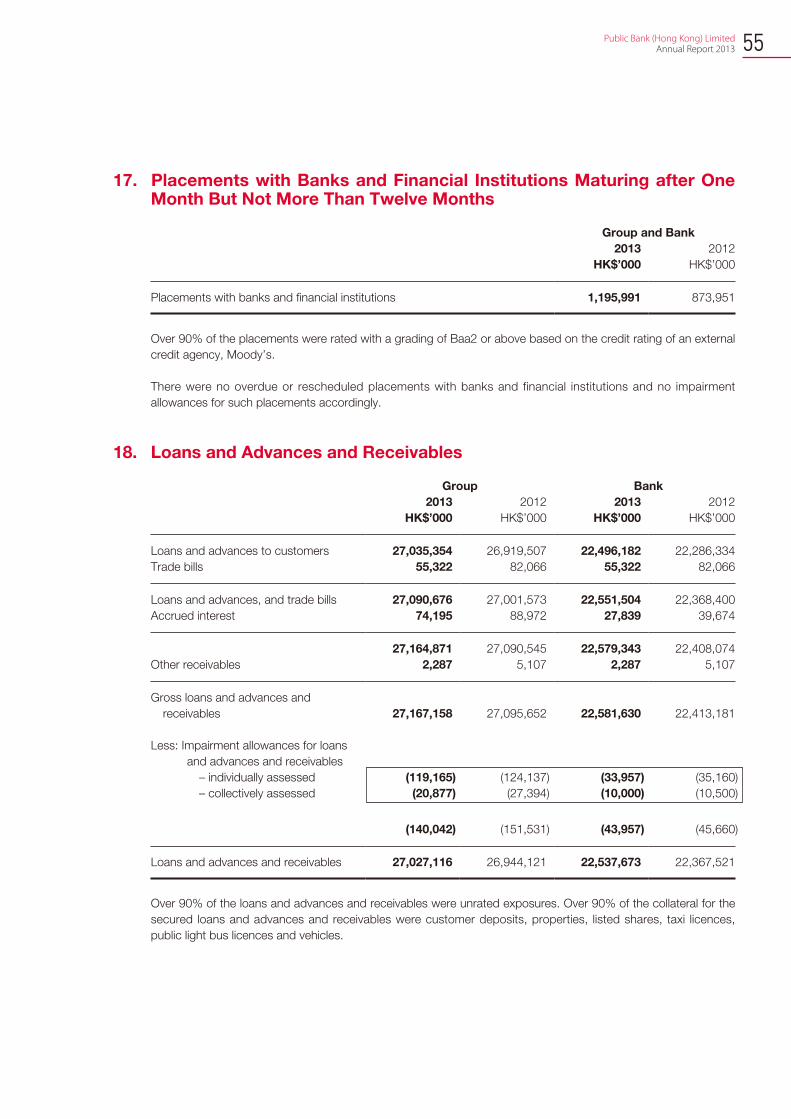
55 Public Bank (Hong Kong) Limited Annual Report 2013
17. Placements with Banks and Financial Institutions Maturing after One Month But Not More Than Twelve Months
Group and Bank
2013 2012
HK$’000 HK$’000
Placements with banks and financial institutions 1,195,991 873,951
Over 90% of the placements were rated with a grading of Baa2 or above based on the credit rating of an external
credit agency, Moody’s.
There were no overdue or rescheduled placements with banks and financial institutions and no impairment
allowances for such placements accordingly.
18. Loans and Advances and Receivables
Group Bank
2013 2012 2013 2012
HK$’000 HK$’000 HK$’000 HK$’000
Loans and advances to customers 27,035,354 26,919,507 22,496,182 22,286,334
Trade bills 55,322 82,066 55,322 82,066
Loans and advances, and trade bills 27,090,676 27,001,573 22,551,504 22,368,400
Accrued interest 74,195 88,972 27,839 39,674
27,164,871 27,090,545 22,579,343 22,408,074
Other receivables 2,287 5,107 2,287 5,107
Gross loans and advances and
receivables 27,167,158 27,095,652 22,581,630 22,413,181
Less: Impairment allowances for loans
and advances and receivables
– individually assessed (119,165) (124,137) (33,957) (35,160)
– collectively assessed (20,877) (27,394) (10,000) (10,500)
(140,042) (151,531) (43,957) (45,660)
Loans and advances and receivables 27,027,116 26,944,121 22,537,673 22,367,521
Over 90% of the loans and advances and receivables were unrated exposures. Over 90% of the collateral for the
secured loans and advances and receivables were customer deposits, properties, listed shares, taxi licences,
public light bus licences and vehicles.
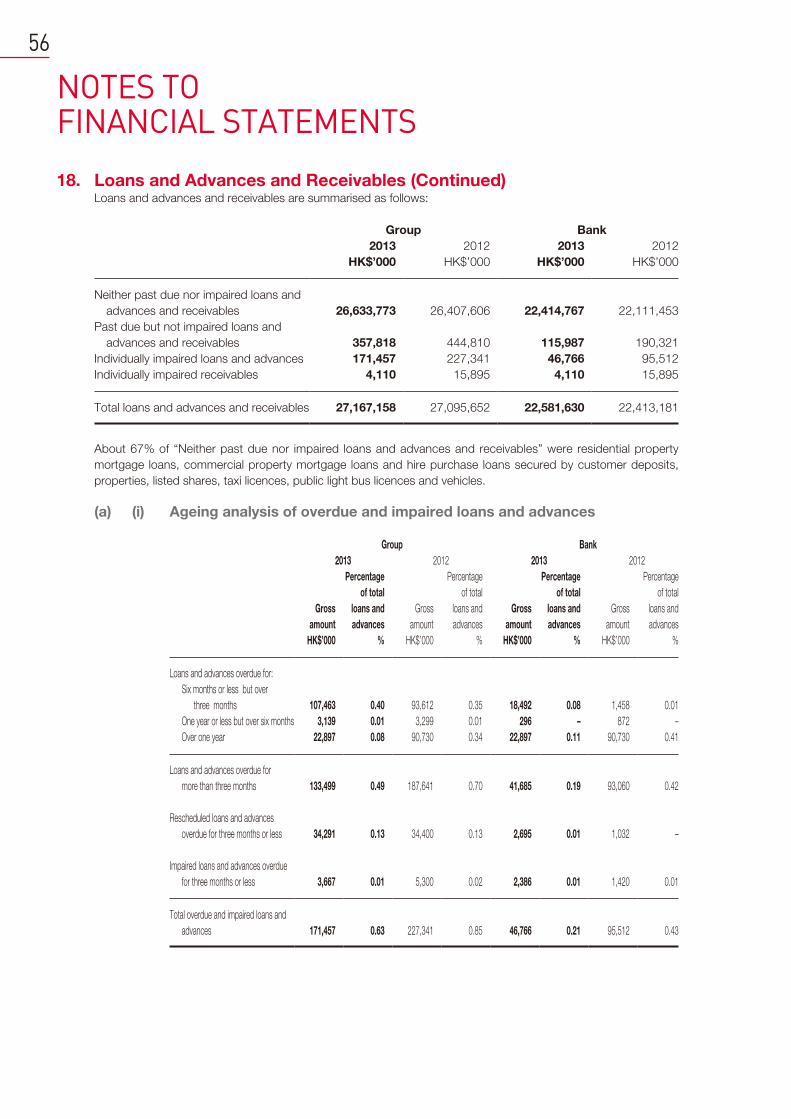
NOTES TO FINANCIAL STATEMENTS
56
18. Loans and Advances and Receivables (Continued)Loans and advances and receivables are summarised as follows:
Group Bank
2013 2012 2013 2012
HK$’000 HK$’000 HK$’000 HK$’000
Neither past due nor impaired loans and
advances and receivables 26,633,773 26,407,606 22,414,767 22,111,453
Past due but not impaired loans and
advances and receivables 357,818 444,810 115,987 190,321
Individually impaired loans and advances 171,457 227,341 46,766 95,512
Individually impaired receivables 4,110 15,895 4,110 15,895
Total loans and advances and receivables 27,167,158 27,095,652 22,581,630 22,413,181
About 67% of “Neither past due nor impaired loans and advances and receivables” were residential property
mortgage loans, commercial property mortgage loans and hire purchase loans secured by customer deposits,
properties, listed shares, taxi licences, public light bus licences and vehicles.
(a) (i) Ageing analysis of overdue and impaired loans and advances
Group Bank
2013 2012 2013 2012
Gross
amount
Percentage
of total
loans and
advances
Gross
amount
Percentage
of total
loans and
advances
Gross
amount
Percentage
of total
loans and
advances
Gross
amount
Percentage
of total
loans and
advances
HK$’000 % HK$’000 % HK$’000 % HK$’000 %
Loans and advances overdue for:
Six months or less but over
three months 107,463 0.40 93,612 0.35 18,492 0.08 1,458 0.01
One year or less but over six months 3,139 0.01 3,299 0.01 296 – 872 –
Over one year 22,897 0.08 90,730 0.34 22,897 0.11 90,730 0.41
Loans and advances overdue for
more than three months 133,499 0.49 187,641 0.70 41,685 0.19 93,060 0.42
Rescheduled loans and advances
overdue for three months or less 34,291 0.13 34,400 0.13 2,695 0.01 1,032 –
Impaired loans and advances overdue
for three months or less 3,667 0.01 5,300 0.02 2,386 0.01 1,420 0.01
Total overdue and impaired loans and
advances 171,457 0.63 227,341 0.85 46,766 0.21 95,512 0.43
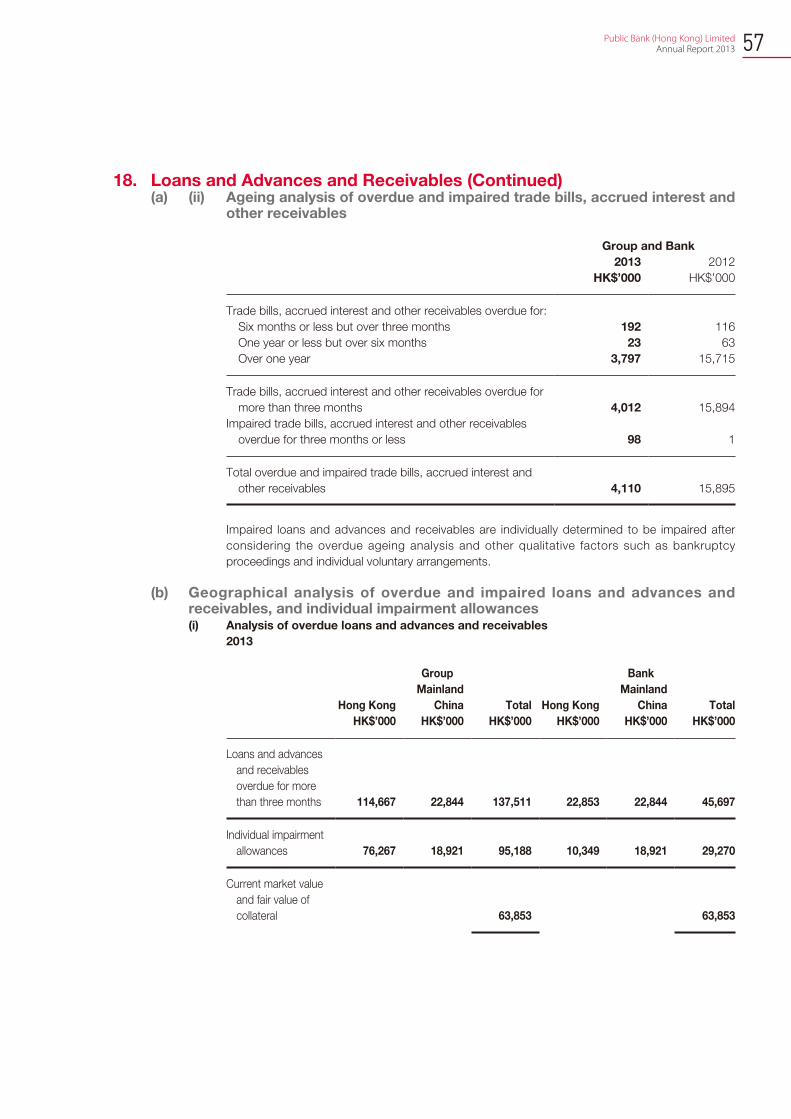
57 Public Bank (Hong Kong) Limited Annual Report 2013
18. Loans and Advances and Receivables (Continued)(a) (ii) Ageing analysis of overdue and impaired trade bills, accrued interest and
other receivables
Group and Bank
2013 2012
HK$’000 HK$’000
Trade bills, accrued interest and other receivables overdue for:
Six months or less but over three months 192 116
One year or less but over six months 23 63
Over one year 3,797 15,715
Trade bills, accrued interest and other receivables overdue for
more than three months 4,012 15,894
Impaired trade bills, accrued interest and other receivables
overdue for three months or less 98 1
Total overdue and impaired trade bills, accrued interest and
other receivables 4,110 15,895
Impaired loans and advances and receivables are individually determined to be impaired after
considering the overdue ageing analysis and other qualitative factors such as bankruptcy
proceedings and individual voluntary arrangements.
(b) Geographical analysis of overdue and impaired loans and advances and receivables, and individual impairment allowances(i) Analysis of overdue loans and advances and receivables
2013
Group Bank
Hong Kong
Mainland
China Total Hong Kong
Mainland
China Total
HK$’000 HK$’000 HK$’000 HK$’000 HK$’000 HK$’000
Loans and advances
and receivables
overdue for more
than three months 114,667 22,844 137,511 22,853 22,844 45,697
Individual impairment
allowances 76,267 18,921 95,188 10,349 18,921 29,270
Current market value
and fair value of
collateral 63,853 63,853
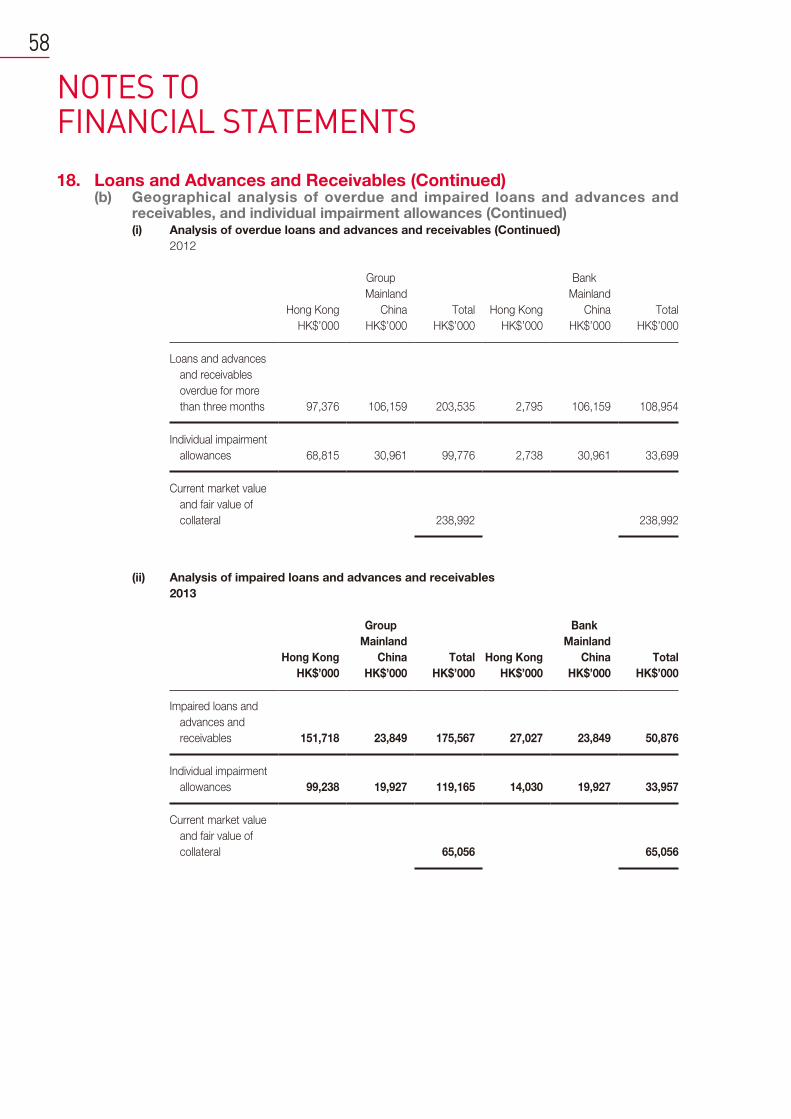
NOTES TO FINANCIAL STATEMENTS
58
18. Loans and Advances and Receivables (Continued)(b) Geographical analysis of overdue and impaired loans and advances and
receivables, and individual impairment allowances (Continued)(i) Analysis of overdue loans and advances and receivables (Continued)
2012
Group Bank
Hong Kong
Mainland
China Total Hong Kong
Mainland
China Total
HK$’000 HK$’000 HK$’000 HK$’000 HK$’000 HK$’000
Loans and advances
and receivables
overdue for more
than three months 97,376 106,159 203,535 2,795 106,159 108,954
Individual impairment
allowances 68,815 30,961 99,776 2,738 30,961 33,699
Current market value
and fair value of
collateral 238,992 238,992
(ii) Analysis of impaired loans and advances and receivables
2013
Group Bank
Hong Kong
Mainland
China Total Hong Kong
Mainland
China Total
HK$’000 HK$’000 HK$’000 HK$’000 HK$’000 HK$’000
Impaired loans and
advances and
receivables 151,718 23,849 175,567 27,027 23,849 50,876
Individual impairment
allowances 99,238 19,927 119,165 14,030 19,927 33,957
Current market value
and fair value of
collateral 65,056 65,056
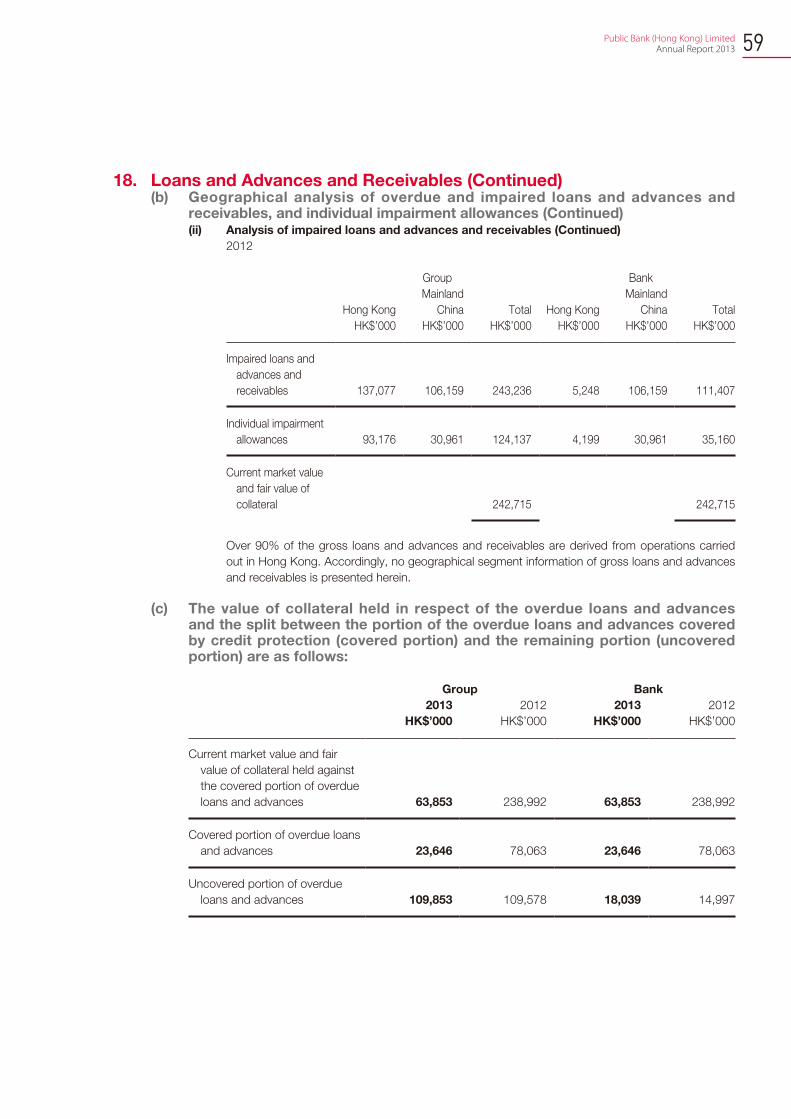
59 Public Bank (Hong Kong) Limited Annual Report 2013
18. Loans and Advances and Receivables (Continued)(b) Geographical analysis of overdue and impaired loans and advances and
receivables, and individual impairment allowances (Continued)(ii) Analysis of impaired loans and advances and receivables (Continued)
2012
Group Bank
Hong Kong
Mainland
China Total Hong Kong
Mainland
China Total
HK$’000 HK$’000 HK$’000 HK$’000 HK$’000 HK$’000
Impaired loans and
advances and
receivables 137,077 106,159 243,236 5,248 106,159 111,407
Individual impairment
allowances 93,176 30,961 124,137 4,199 30,961 35,160
Current market value
and fair value of
collateral 242,715 242,715
Over 90% of the gross loans and advances and receivables are derived from operations carried
out in Hong Kong. Accordingly, no geographical segment information of gross loans and advances
and receivables is presented herein.
(c) The value of collateral held in respect of the overdue loans and advances and the split between the portion of the overdue loans and advances covered by credit protection (covered portion) and the remaining portion (uncovered portion) are as follows:
Group Bank
2013 2012 2013 2012
HK$’000 HK$’000 HK$’000 HK$’000
Current market value and fair
value of collateral held against
the covered portion of overdue
loans and advances 63,853 238,992 63,853 238,992
Covered portion of overdue loans
and advances 23,646 78,063 23,646 78,063
Uncovered portion of overdue
loans and advances 109,853 109,578 18,039 14,997
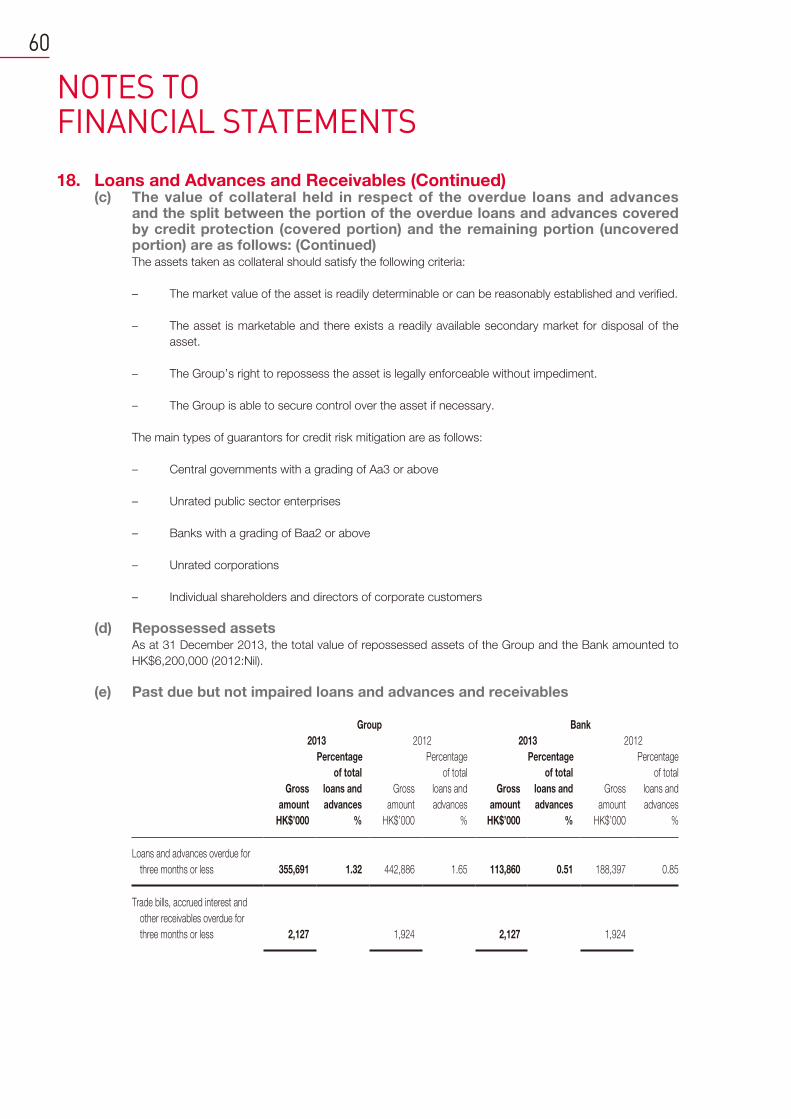
NOTES TO FINANCIAL STATEMENTS
60
18. Loans and Advances and Receivables (Continued)(c) The value of collateral held in respect of the overdue loans and advances
and the split between the portion of the overdue loans and advances covered by credit protection (covered portion) and the remaining portion (uncovered portion) are as follows: (Continued)The assets taken as collateral should satisfy the following criteria:
– The market value of the asset is readily determinable or can be reasonably established and verified.
– The asset is marketable and there exists a readily available secondary market for disposal of the
asset.
– The Group’s right to repossess the asset is legally enforceable without impediment.
– The Group is able to secure control over the asset if necessary.
The main types of guarantors for credit risk mitigation are as follows:
– Central governments with a grading of Aa3 or above
– Unrated public sector enterprises
– Banks with a grading of Baa2 or above
– Unrated corporations
– Individual shareholders and directors of corporate customers
(d) Repossessed assetsAs at 31 December 2013, the total value of repossessed assets of the Group and the Bank amounted to
HK$6,200,000 (2012:Nil).
(e) Past due but not impaired loans and advances and receivables
Group Bank
2013 2012 2013 2012
Gross
amount
Percentage
of total
loans and
advances
Gross
amount
Percentage
of total
loans and
advances
Gross
amount
Percentage
of total
loans and
advances
Gross
amount
Percentage
of total
loans and
advances
HK$’000 % HK$’000 % HK$’000 % HK$’000 %
Loans and advances overdue for
three months or less 355,691 1.32 442,886 1.65 113,860 0.51 188,397 0.85
Trade bills, accrued interest and
other receivables overdue for
three months or less 2,127 1,924 2,127 1,924
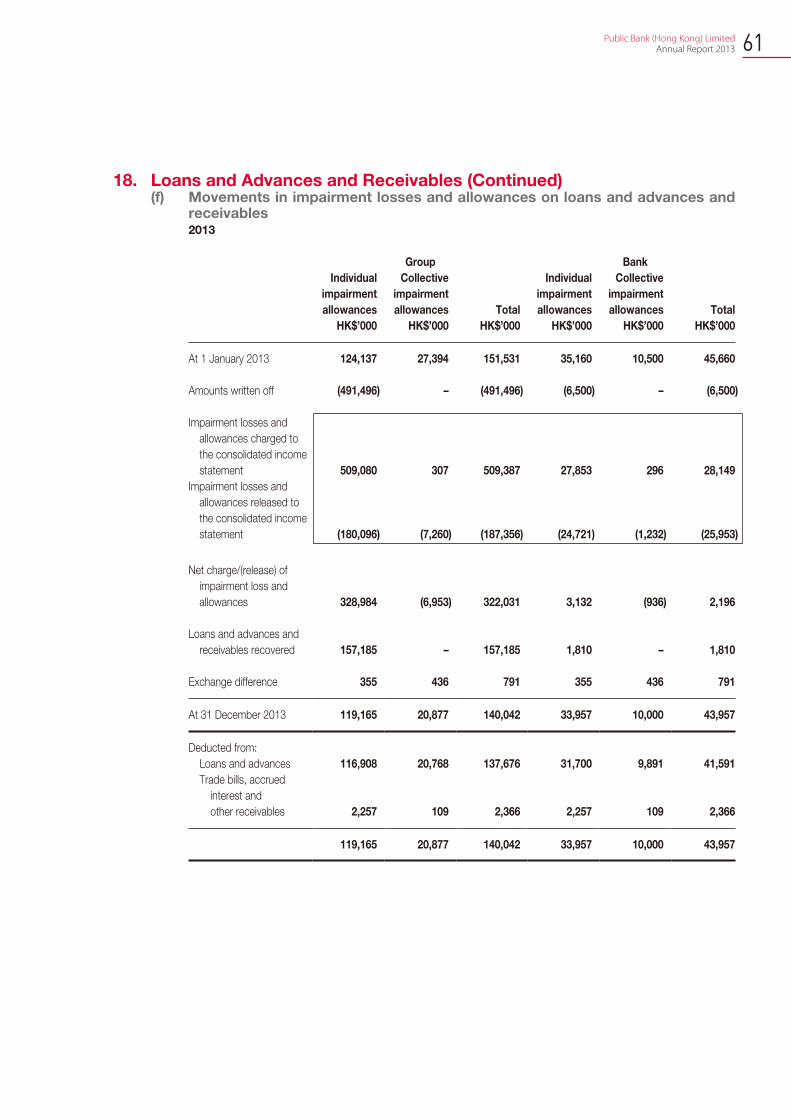
61 Public Bank (Hong Kong) Limited Annual Report 2013
18. Loans and Advances and Receivables (Continued)(f) Movements in impairment losses and allowances on loans and advances and
receivables2013
Group Bank
Individual
impairment
allowances
Collective
impairment
allowances Total
Individual
impairment
allowances
Collective
impairment
allowances Total
HK$’000 HK$’000 HK$’000 HK$’000 HK$’000 HK$’000
At 1 January 2013 124,137 27,394 151,531 35,160 10,500 45,660
Amounts written off (491,496) – (491,496) (6,500) – (6,500)
Impairment losses and
allowances charged to
the consolidated income
statement 509,080 307 509,387 27,853 296 28,149
Impairment losses and
allowances released to
the consolidated income
statement (180,096) (7,260) (187,356) (24,721) (1,232) (25,953)
Net charge/(release) of
impairment loss and
allowances 328,984 (6,953) 322,031 3,132 (936) 2,196
Loans and advances and
receivables recovered 157,185 – 157,185 1,810 – 1,810
Exchange difference 355 436 791 355 436 791
At 31 December 2013 119,165 20,877 140,042 33,957 10,000 43,957
Deducted from:
Loans and advances 116,908 20,768 137,676 31,700 9,891 41,591
Trade bills, accrued
interest and
other receivables 2,257 109 2,366 2,257 109 2,366
119,165 20,877 140,042 33,957 10,000 43,957
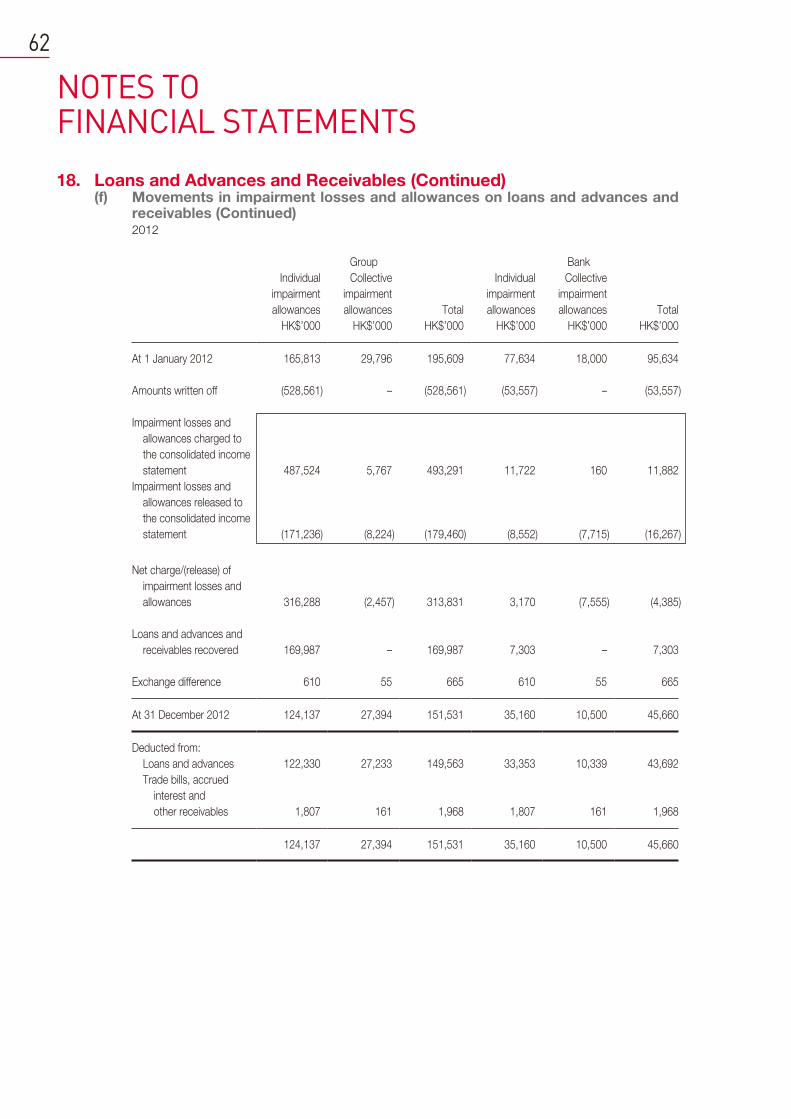
NOTES TO FINANCIAL STATEMENTS
62
18. Loans and Advances and Receivables (Continued)(f) Movements in impairment losses and allowances on loans and advances and
receivables (Continued)2012
Group Bank
Individual
impairment
allowances
Collective
impairment
allowances Total
Individual
impairment
allowances
Collective
impairment
allowances Total
HK$’000 HK$’000 HK$’000 HK$’000 HK$’000 HK$’000
At 1 January 2012 165,813 29,796 195,609 77,634 18,000 95,634
Amounts written off (528,561) – (528,561) (53,557) – (53,557)
Impairment losses and
allowances charged to
the consolidated income
statement 487,524 5,767 493,291 11,722 160 11,882
Impairment losses and
allowances released to
the consolidated income
statement (171,236) (8,224) (179,460) (8,552) (7,715) (16,267)
Net charge/(release) of
impairment losses and
allowances 316,288 (2,457) 313,831 3,170 (7,555) (4,385)
Loans and advances and
receivables recovered 169,987 – 169,987 7,303 – 7,303
Exchange difference 610 55 665 610 55 665
At 31 December 2012 124,137 27,394 151,531 35,160 10,500 45,660
Deducted from:
Loans and advances 122,330 27,233 149,563 33,353 10,339 43,692
Trade bills, accrued
interest and
other receivables 1,807 161 1,968 1,807 161 1,968
124,137 27,394 151,531 35,160 10,500 45,660
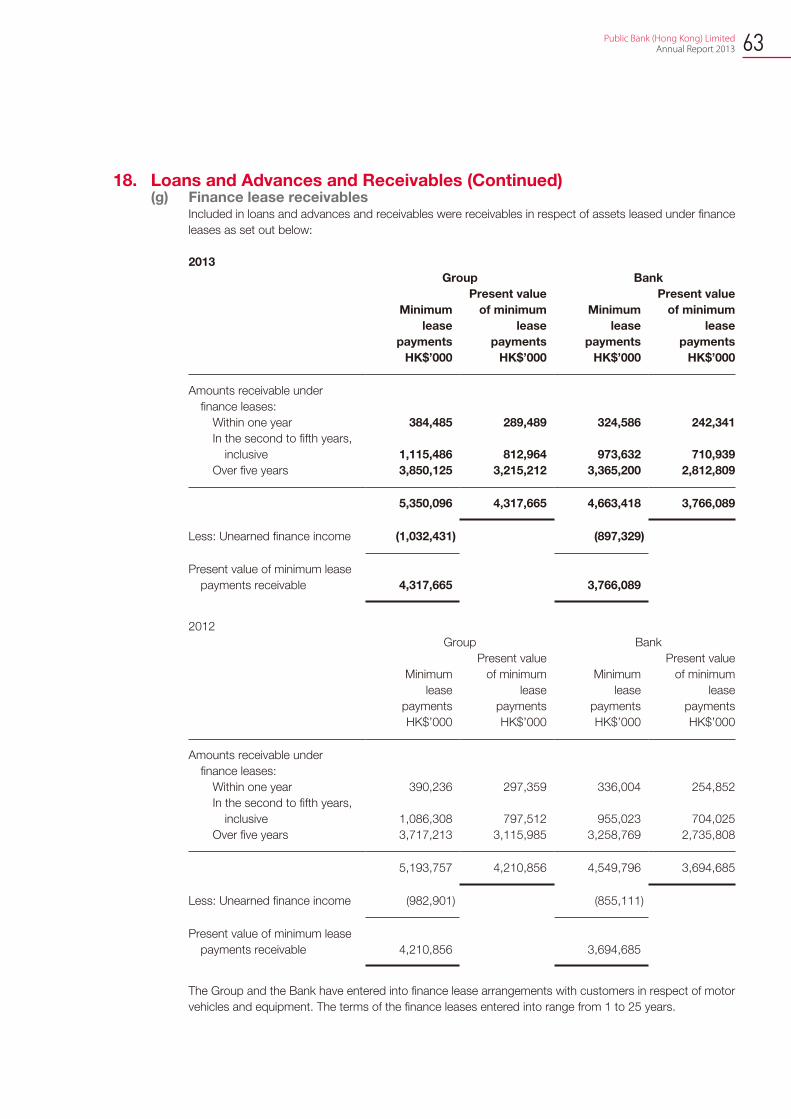
63 Public Bank (Hong Kong) Limited Annual Report 2013
18. Loans and Advances and Receivables (Continued)(g) Finance lease receivables
Included in loans and advances and receivables were receivables in respect of assets leased under finance
leases as set out below:
2013
Group Bank
Minimum
lease
payments
Present value
of minimum
lease
payments
Minimum
lease
payments
Present value
of minimum
lease
payments
HK$’000 HK$’000 HK$’000 HK$’000
Amounts receivable under
finance leases:
Within one year 384,485 289,489 324,586 242,341
In the second to fifth years,
inclusive 1,115,486 812,964 973,632 710,939
Over five years 3,850,125 3,215,212 3,365,200 2,812,809
5,350,096 4,317,665 4,663,418 3,766,089
Less: Unearned finance income (1,032,431) (897,329)
Present value of minimum lease
payments receivable 4,317,665 3,766,089
2012
Group Bank
Minimum
lease
payments
Present value
of minimum
lease
payments
Minimum
lease
payments
Present value
of minimum
lease
payments
HK$’000 HK$’000 HK$’000 HK$’000
Amounts receivable under
finance leases:
Within one year 390,236 297,359 336,004 254,852
In the second to fifth years,
inclusive 1,086,308 797,512 955,023 704,025
Over five years 3,717,213 3,115,985 3,258,769 2,735,808
5,193,757 4,210,856 4,549,796 3,694,685
Less: Unearned finance income (982,901) (855,111)
Present value of minimum lease
payments receivable 4,210,856 3,694,685
The Group and the Bank have entered into finance lease arrangements with customers in respect of motor
vehicles and equipment. The terms of the finance leases entered into range from 1 to 25 years.
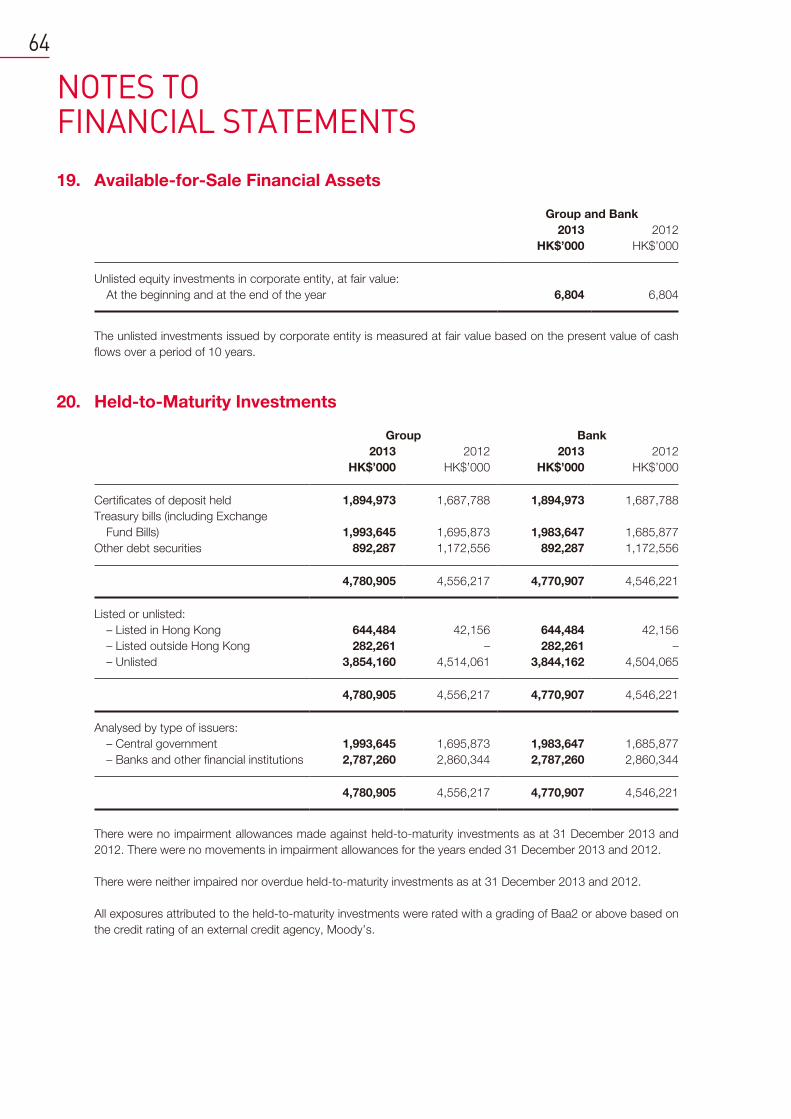
NOTES TO FINANCIAL STATEMENTS
64
19. Available-for-Sale Financial Assets
Group and Bank
2013 2012
HK$’000 HK$’000
Unlisted equity investments in corporate entity, at fair value:
At the beginning and at the end of the year 6,804 6,804
The unlisted investments issued by corporate entity is measured at fair value based on the present value of cash
flows over a period of 10 years.
20. Held-to-Maturity Investments
Group Bank
2013 2012 2013 2012
HK$’000 HK$’000 HK$’000 HK$’000
Certificates of deposit held 1,894,973 1,687,788 1,894,973 1,687,788
Treasury bills (including Exchange
Fund Bills) 1,993,645 1,695,873 1,983,647 1,685,877
Other debt securities 892,287 1,172,556 892,287 1,172,556
4,780,905 4,556,217 4,770,907 4,546,221
Listed or unlisted:
– Listed in Hong Kong 644,484 42,156 644,484 42,156
– Listed outside Hong Kong 282,261 – 282,261 –
– Unlisted 3,854,160 4,514,061 3,844,162 4,504,065
4,780,905 4,556,217 4,770,907 4,546,221
Analysed by type of issuers:
– Central government 1,993,645 1,695,873 1,983,647 1,685,877
– Banks and other financial institutions 2,787,260 2,860,344 2,787,260 2,860,344
4,780,905 4,556,217 4,770,907 4,546,221
There were no impairment allowances made against held-to-maturity investments as at 31 December 2013 and
2012. There were no movements in impairment allowances for the years ended 31 December 2013 and 2012.
There were neither impaired nor overdue held-to-maturity investments as at 31 December 2013 and 2012.
All exposures attributed to the held-to-maturity investments were rated with a grading of Baa2 or above based on
the credit rating of an external credit agency, Moody’s.
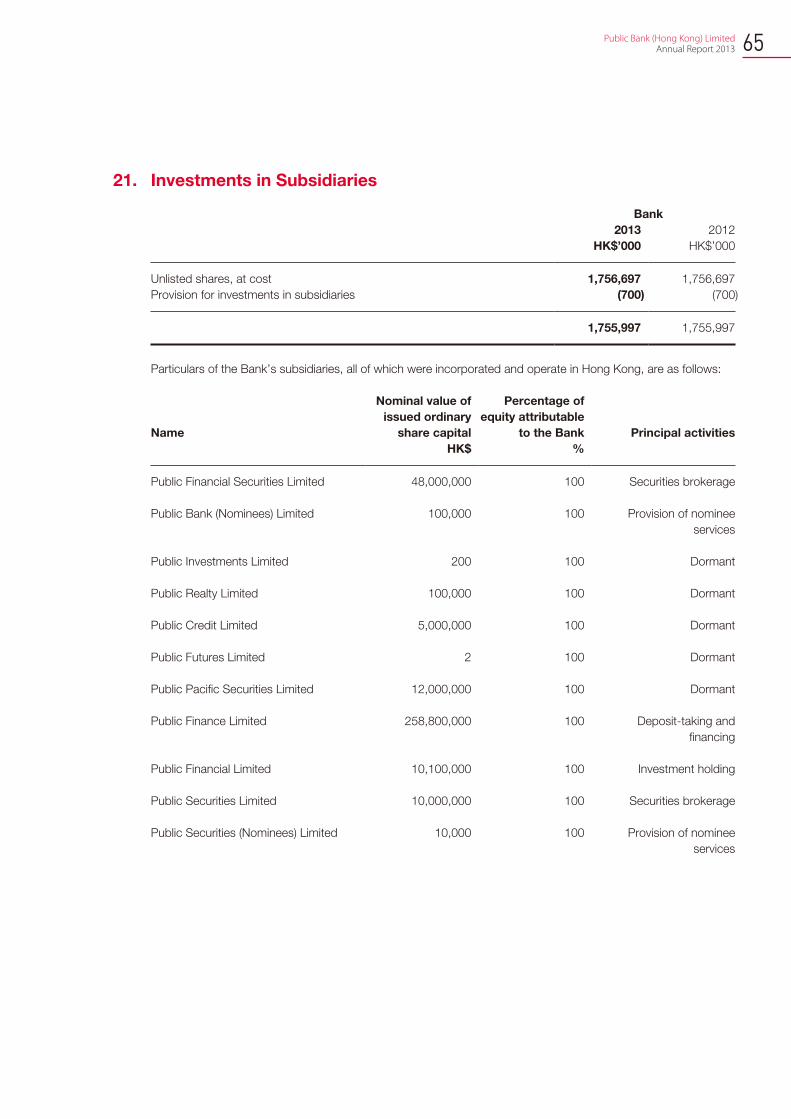
65 Public Bank (Hong Kong) Limited Annual Report 2013
21. Investments in Subsidiaries
Bank
2013 2012
HK$’000 HK$’000
Unlisted shares, at cost 1,756,697 1,756,697
Provision for investments in subsidiaries (700) (700)
1,755,997 1,755,997
Particulars of the Bank’s subsidiaries, all of which were incorporated and operate in Hong Kong, are as follows:
Name
Nominal value of
issued ordinary
share capital
Percentage of
equity attributable
to the Bank Principal activities
HK$ %
Public Financial Securities Limited 48,000,000 100 Securities brokerage
Public Bank (Nominees) Limited 100,000 100 Provision of nominee
services
Public Investments Limited 200 100 Dormant
Public Realty Limited 100,000 100 Dormant
Public Credit Limited 5,000,000 100 Dormant
Public Futures Limited 2 100 Dormant
Public Pacific Securities Limited 12,000,000 100 Dormant
Public Finance Limited 258,800,000 100 Deposit-taking and
financing
Public Financial Limited 10,100,000 100 Investment holding
Public Securities Limited 10,000,000 100 Securities brokerage
Public Securities (Nominees) Limited 10,000 100 Provision of nominee
services
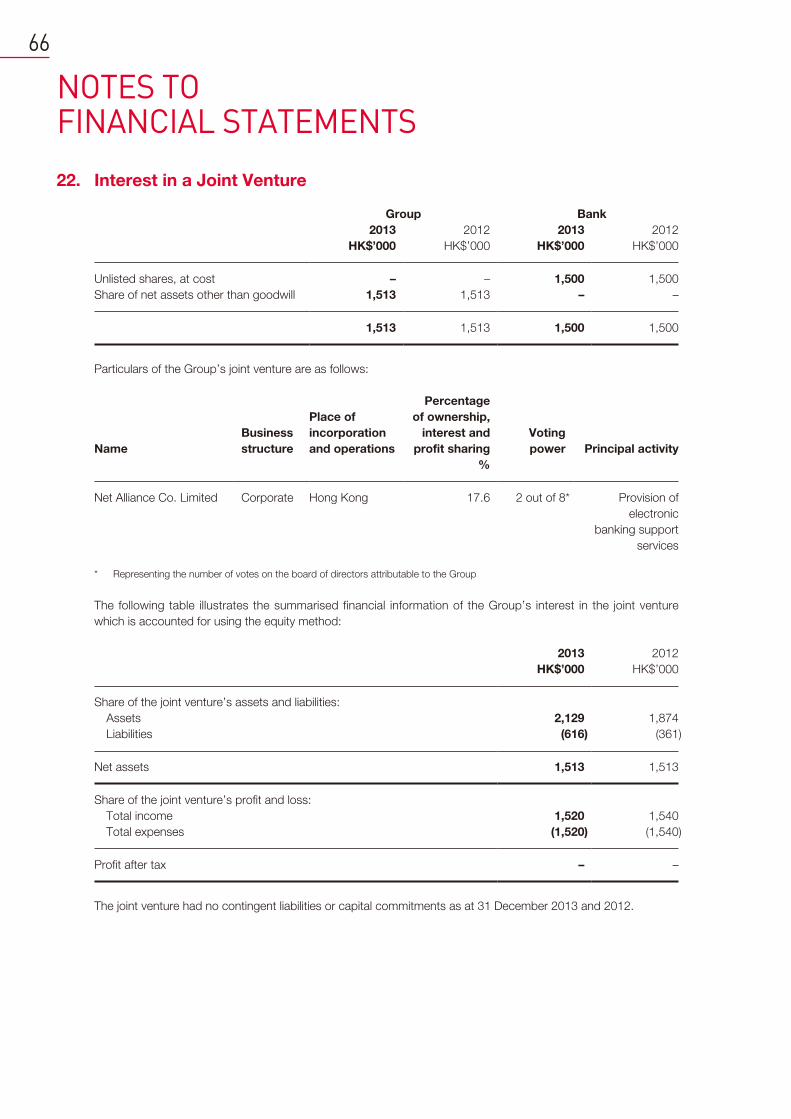
NOTES TO FINANCIAL STATEMENTS
66
22. Interest in a Joint Venture
Group Bank
2013 2012 2013 2012
HK$’000 HK$’000 HK$’000 HK$’000
Unlisted shares, at cost – – 1,500 1,500
Share of net assets other than goodwill 1,513 1,513 – –
1,513 1,513 1,500 1,500
Particulars of the Group’s joint venture are as follows:
Name
Business
structure
Place of
incorporation
and operations
Percentage
of ownership,
interest and
profit sharing
Voting
power Principal activity
%
Net Alliance Co. Limited Corporate Hong Kong 17.6 2 out of 8* Provision of
electronic
banking support
services
* Representing the number of votes on the board of directors attributable to the Group
The following table illustrates the summarised financial information of the Group’s interest in the joint venture
which is accounted for using the equity method:
2013 2012
HK$’000 HK$’000
Share of the joint venture’s assets and liabilities:
Assets 2,129 1,874
Liabilities (616) (361)
Net assets 1,513 1,513
Share of the joint venture’s profit and loss:
Total income 1,520 1,540
Total expenses (1,520) (1,540)
Profit after tax – –
The joint venture had no contingent liabilities or capital commitments as at 31 December 2013 and 2012.
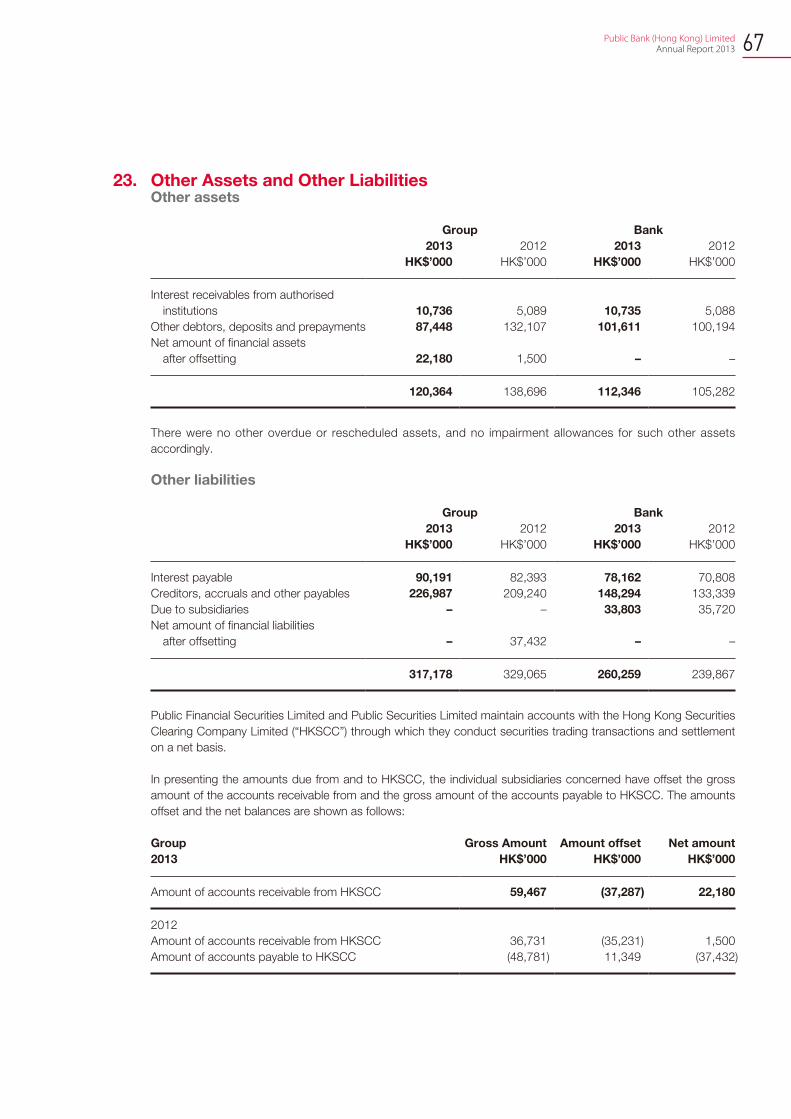
67 Public Bank (Hong Kong) Limited Annual Report 2013
23. Other Assets and Other LiabilitiesOther assets
Group Bank
2013 2012 2013 2012
HK$’000 HK$’000 HK$’000 HK$’000
Interest receivables from authorised
institutions 10,736 5,089 10,735 5,088
Other debtors, deposits and prepayments 87,448 132,107 101,611 100,194
Net amount of financial assets
after offsetting 22,180 1,500 – –
120,364 138,696 112,346 105,282
There were no other overdue or rescheduled assets, and no impairment allowances for such other assets
accordingly.
Other liabilities
Group Bank
2013 2012 2013 2012
HK$’000 HK$’000 HK$’000 HK$’000
Interest payable 90,191 82,393 78,162 70,808
Creditors, accruals and other payables 226,987 209,240 148,294 133,339
Due to subsidiaries – – 33,803 35,720
Net amount of financial liabilities
after offsetting – 37,432 – –
317,178 329,065 260,259 239,867
Public Financial Securities Limited and Public Securities Limited maintain accounts with the Hong Kong Securities
Clearing Company Limited (“HKSCC”) through which they conduct securities trading transactions and settlement
on a net basis.
In presenting the amounts due from and to HKSCC, the individual subsidiaries concerned have offset the gross
amount of the accounts receivable from and the gross amount of the accounts payable to HKSCC. The amounts
offset and the net balances are shown as follows:
Group Gross Amount Amount offset Net amount
2013 HK$’000 HK$’000 HK$’000
Amount of accounts receivable from HKSCC 59,467 (37,287) 22,180
2012
Amount of accounts receivable from HKSCC 36,731 (35,231) 1,500
Amount of accounts payable to HKSCC (48,781) 11,349 (37,432)
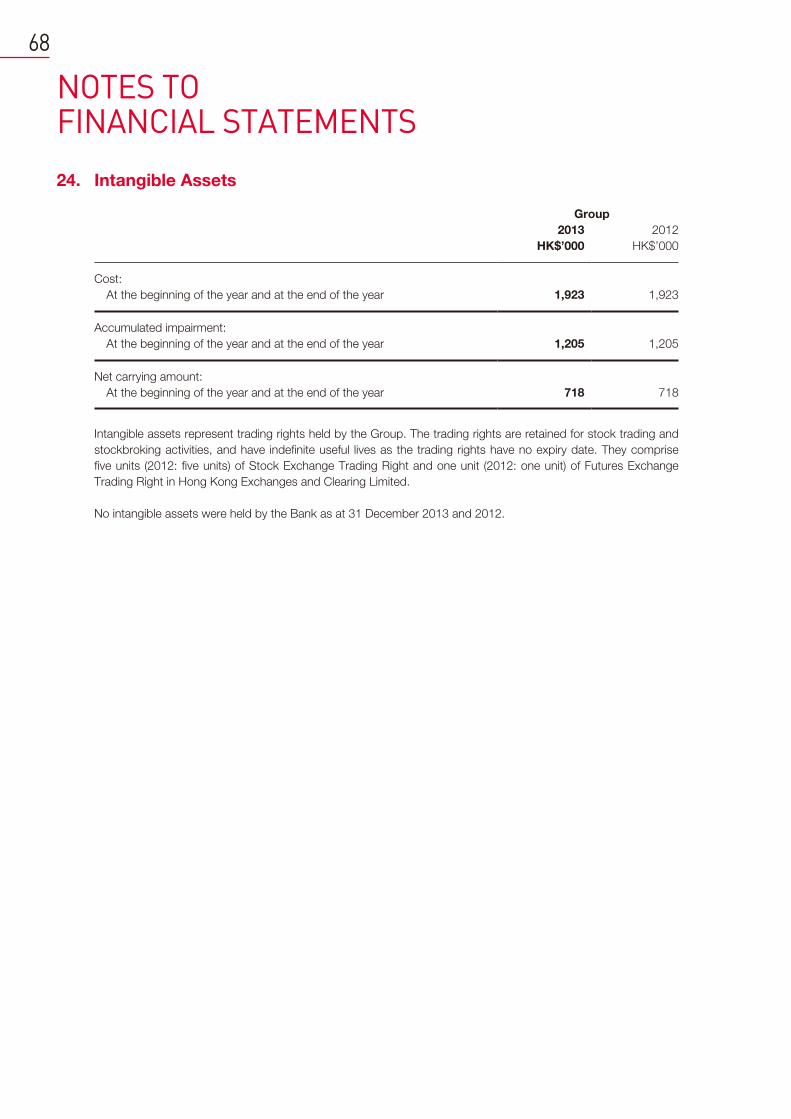
NOTES TO FINANCIAL STATEMENTS
68
24. Intangible Assets
Group
2013 2012
HK$’000 HK$’000
Cost:
At the beginning of the year and at the end of the year 1,923 1,923
Accumulated impairment:
At the beginning of the year and at the end of the year 1,205 1,205
Net carrying amount:
At the beginning of the year and at the end of the year 718 718
Intangible assets represent trading rights held by the Group. The trading rights are retained for stock trading and
stockbroking activities, and have indefinite useful lives as the trading rights have no expiry date. They comprise
five units (2012: five units) of Stock Exchange Trading Right and one unit (2012: one unit) of Futures Exchange
Trading Right in Hong Kong Exchanges and Clearing Limited.
No intangible assets were held by the Bank as at 31 December 2013 and 2012.
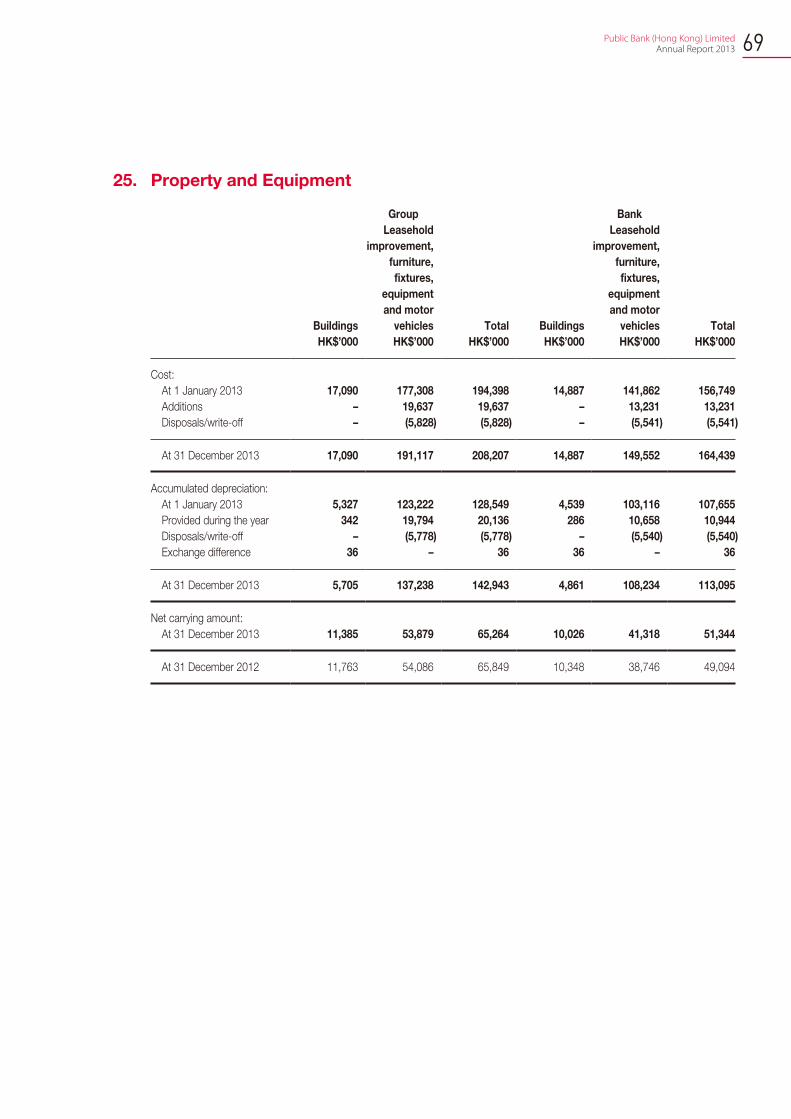
69 Public Bank (Hong Kong) Limited Annual Report 2013
25. Property and Equipment
Group Bank
Buildings
Leasehold
improvement,
furniture,
fixtures,
equipment
and motor
vehicles Total Buildings
Leasehold
improvement,
furniture,
fixtures,
equipment
and motor
vehicles Total
HK$’000 HK$’000 HK$’000 HK$’000 HK$’000 HK$’000
Cost:
At 1 January 2013 17,090 177,308 194,398 14,887 141,862 156,749
Additions – 19,637 19,637 – 13,231 13,231
Disposals/write-off – (5,828) (5,828) – (5,541) (5,541)
At 31 December 2013 17,090 191,117 208,207 14,887 149,552 164,439
Accumulated depreciation:
At 1 January 2013 5,327 123,222 128,549 4,539 103,116 107,655
Provided during the year 342 19,794 20,136 286 10,658 10,944
Disposals/write-off – (5,778) (5,778) – (5,540) (5,540)
Exchange difference 36 – 36 36 – 36
At 31 December 2013 5,705 137,238 142,943 4,861 108,234 113,095
Net carrying amount:
At 31 December 2013 11,385 53,879 65,264 10,026 41,318 51,344
At 31 December 2012 11,763 54,086 65,849 10,348 38,746 49,094
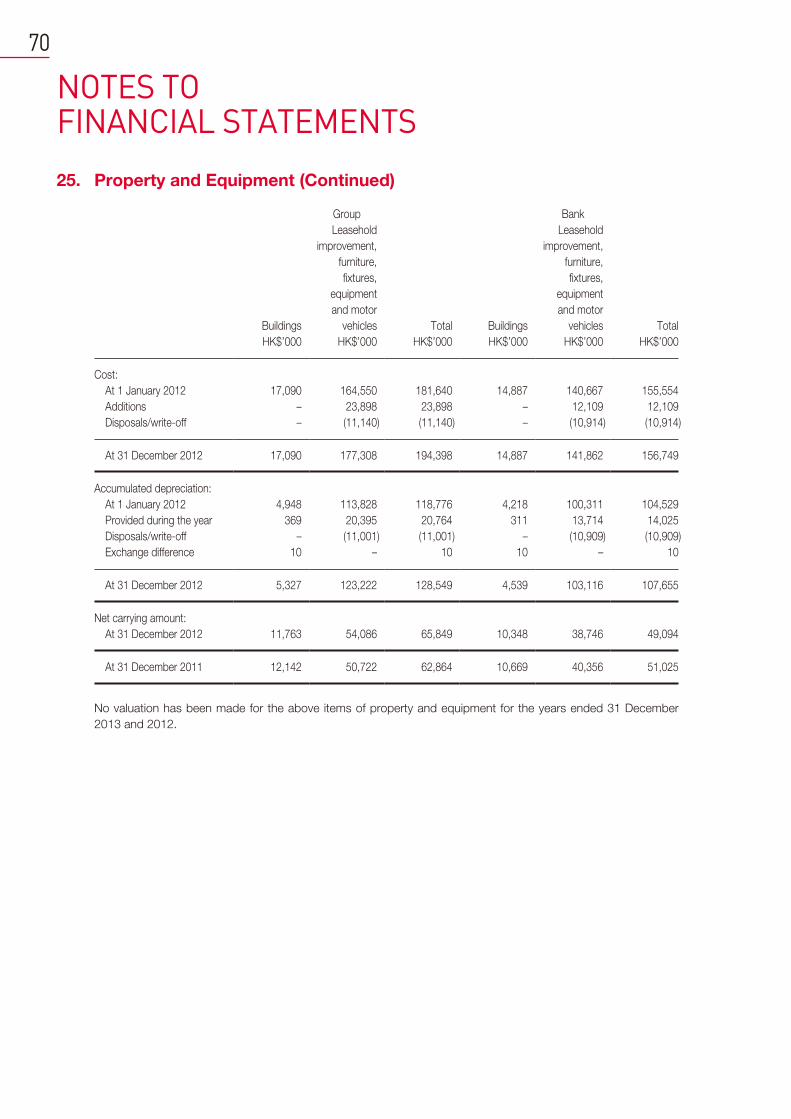
NOTES TO FINANCIAL STATEMENTS
70
25. Property and Equipment (Continued)
Group Bank
Buildings
Leasehold
improvement,
furniture,
fixtures,
equipment
and motor
vehicles Total Buildings
Leasehold
improvement,
furniture,
fixtures,
equipment
and motor
vehicles Total
HK$’000 HK$’000 HK$’000 HK$’000 HK$’000 HK$’000
Cost:
At 1 January 2012 17,090 164,550 181,640 14,887 140,667 155,554
Additions – 23,898 23,898 – 12,109 12,109
Disposals/write-off – (11,140) (11,140) – (10,914) (10,914)
At 31 December 2012 17,090 177,308 194,398 14,887 141,862 156,749
Accumulated depreciation:
At 1 January 2012 4,948 113,828 118,776 4,218 100,311 104,529
Provided during the year 369 20,395 20,764 311 13,714 14,025
Disposals/write-off – (11,001) (11,001) – (10,909) (10,909)
Exchange difference 10 – 10 10 – 10
At 31 December 2012 5,327 123,222 128,549 4,539 103,116 107,655
Net carrying amount:
At 31 December 2012 11,763 54,086 65,849 10,348 38,746 49,094
At 31 December 2011 12,142 50,722 62,864 10,669 40,356 51,025
No valuation has been made for the above items of property and equipment for the years ended 31 December
2013 and 2012.
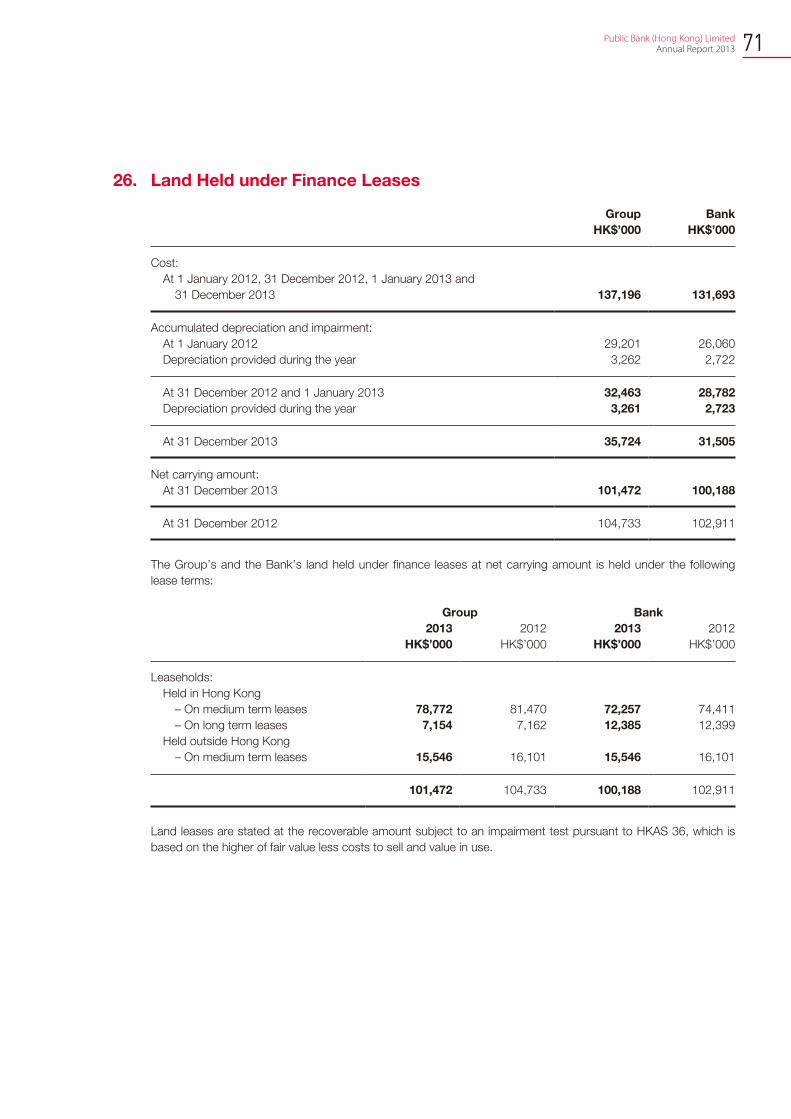
71 Public Bank (Hong Kong) Limited Annual Report 2013
26. Land Held under Finance Leases
Group Bank
HK$’000 HK$’000
Cost:
At 1 January 2012, 31 December 2012, 1 January 2013 and
31 December 2013 137,196 131,693
Accumulated depreciation and impairment:
At 1 January 2012 29,201 26,060
Depreciation provided during the year 3,262 2,722
At 31 December 2012 and 1 January 2013 32,463 28,782
Depreciation provided during the year 3,261 2,723
At 31 December 2013 35,724 31,505
Net carrying amount:
At 31 December 2013 101,472 100,188
At 31 December 2012 104,733 102,911
The Group’s and the Bank’s land held under finance leases at net carrying amount is held under the following
lease terms:
Group Bank
2013 2012 2013 2012
HK$’000 HK$’000 HK$’000 HK$’000
Leaseholds:
Held in Hong Kong
– On medium term leases 78,772 81,470 72,257 74,411
– On long term leases 7,154 7,162 12,385 12,399
Held outside Hong Kong
– On medium term leases 15,546 16,101 15,546 16,101
101,472 104,733 100,188 102,911
Land leases are stated at the recoverable amount subject to an impairment test pursuant to HKAS 36, which is
based on the higher of fair value less costs to sell and value in use.

NOTES TO FINANCIAL STATEMENTS
72
27. Investment Properties
Group Bank
2013 2012 2013 2012
HK$’000 HK$’000 HK$’000 HK$’000
Carrying amount at 1 January 63,564 48,309 28,453 22,801
Change in fair value recognised in
income statement 1,979 15,255 1,275 5,652
Carrying amount at 31 December 65,543 63,564 29,728 28,453
The Group’s and the Bank’s investment properties are situated in Hong Kong and are held under medium term
leases in Hong Kong.
All investment properties were classified under Level 3 in the fair value hierarchy. During the year, there were
no transfers of fair value measurements between Level 1 and Level 2 and no transfer into or out of Level 3. The
Group and the Bank have assessed that the highest and best use of its properties did not differ from their existing
use.
At 31 December 2013, investment properties were revalued according to the revaluation reports issued by
C S Surveyors Limited, a firm of independent professionally qualified valuers. Finance & Control Department have
discussions with the valuer on the valuation methodology and valuation results twice a year when the valuation is
performed for interim and annual financial reporting.
The fair value of investment properties located in Hong Kong is determined using market comparison approach by
reference to recent sales price of comparable properties on a price per square metre basis. Below is a summary
of the significant inputs to the valuation of investment properties:
Group
Range (weighted average)
Bank
Range (weighted average)
Price per square metre HK$65,000 to
HK$442,000 (HK$191,000)
HK$99,000 to
HK$442,000 (HK$339,000)
A significant increase/decrease in the price per square metre would result in a significant increase/decrease in the
fair value of the investment properties.
The investment properties held by the Group and the Bank are let under operating leases from which the Group
and the Bank earn rental income. Details of future annual rental receivables under operating leases are included in
note 36(a) to the financial statements.
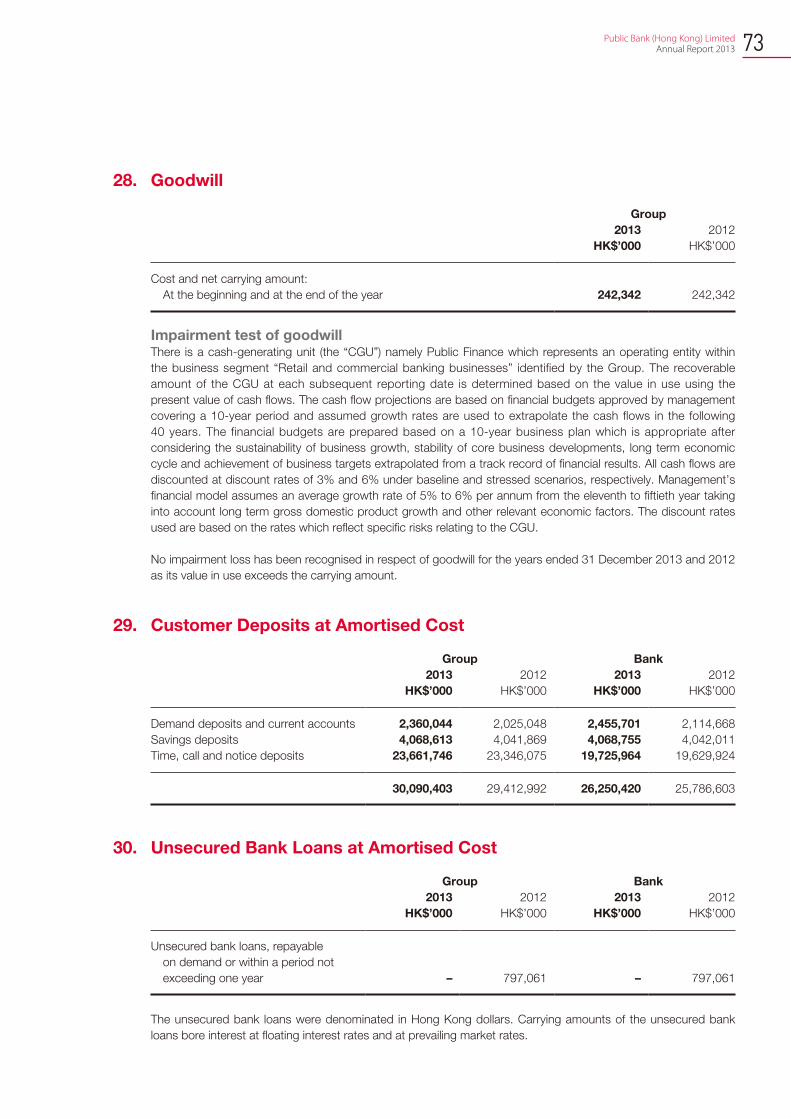
73 Public Bank (Hong Kong) Limited Annual Report 2013
28. Goodwill
Group
2013 2012
HK$’000 HK$’000
Cost and net carrying amount:
At the beginning and at the end of the year 242,342 242,342
Impairment test of goodwillThere is a cash-generating unit (the “CGU”) namely Public Finance which represents an operating entity within
the business segment “Retail and commercial banking businesses” identified by the Group. The recoverable
amount of the CGU at each subsequent reporting date is determined based on the value in use using the
present value of cash flows. The cash flow projections are based on financial budgets approved by management
covering a 10-year period and assumed growth rates are used to extrapolate the cash flows in the following
40 years. The financial budgets are prepared based on a 10-year business plan which is appropriate after
considering the sustainability of business growth, stability of core business developments, long term economic
cycle and achievement of business targets extrapolated from a track record of financial results. All cash flows are
discounted at discount rates of 3% and 6% under baseline and stressed scenarios, respectively. Management’s
financial model assumes an average growth rate of 5% to 6% per annum from the eleventh to fiftieth year taking
into account long term gross domestic product growth and other relevant economic factors. The discount rates
used are based on the rates which reflect specific risks relating to the CGU.
No impairment loss has been recognised in respect of goodwill for the years ended 31 December 2013 and 2012
as its value in use exceeds the carrying amount.
29. Customer Deposits at Amortised Cost
Group Bank
2013 2012 2013 2012
HK$’000 HK$’000 HK$’000 HK$’000
Demand deposits and current accounts 2,360,044 2,025,048 2,455,701 2,114,668
Savings deposits 4,068,613 4,041,869 4,068,755 4,042,011
Time, call and notice deposits 23,661,746 23,346,075 19,725,964 19,629,924
30,090,403 29,412,992 26,250,420 25,786,603
30. Unsecured Bank Loans at Amortised Cost
Group Bank
2013 2012 2013 2012
HK$’000 HK$’000 HK$’000 HK$’000
Unsecured bank loans, repayable
on demand or within a period not
exceeding one year – 797,061 – 797,061
The unsecured bank loans were denominated in Hong Kong dollars. Carrying amounts of the unsecured bank
loans bore interest at floating interest rates and at prevailing market rates.
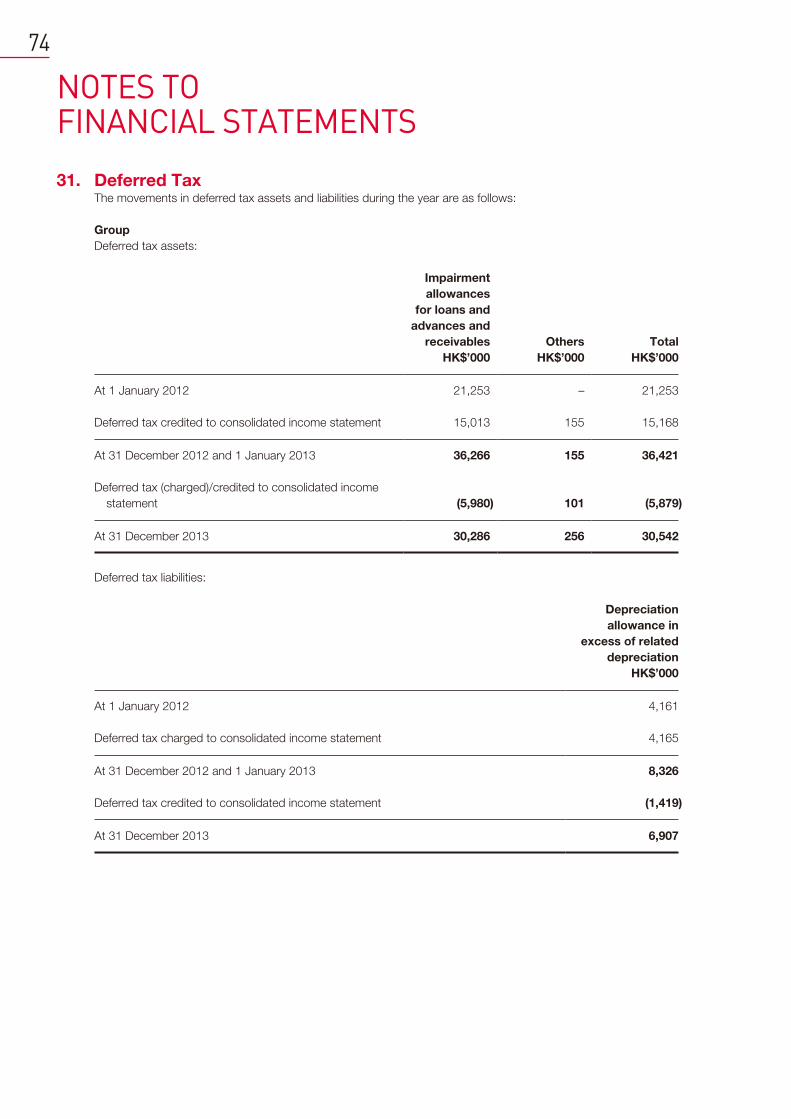
NOTES TO FINANCIAL STATEMENTS
74
31. Deferred TaxThe movements in deferred tax assets and liabilities during the year are as follows:
Group
Deferred tax assets:
Impairment
allowances
for loans and
advances and
receivables Others Total
HK$’000 HK$’000 HK$’000
At 1 January 2012 21,253 – 21,253
Deferred tax credited to consolidated income statement 15,013 155 15,168
At 31 December 2012 and 1 January 2013 36,266 155 36,421
Deferred tax (charged)/credited to consolidated income
statement (5,980) 101 (5,879)
At 31 December 2013 30,286 256 30,542
Deferred tax liabilities:
Depreciation
allowance in
excess of related
depreciation
HK$’000
At 1 January 2012 4,161
Deferred tax charged to consolidated income statement 4,165
At 31 December 2012 and 1 January 2013 8,326
Deferred tax credited to consolidated income statement (1,419)
At 31 December 2013 6,907
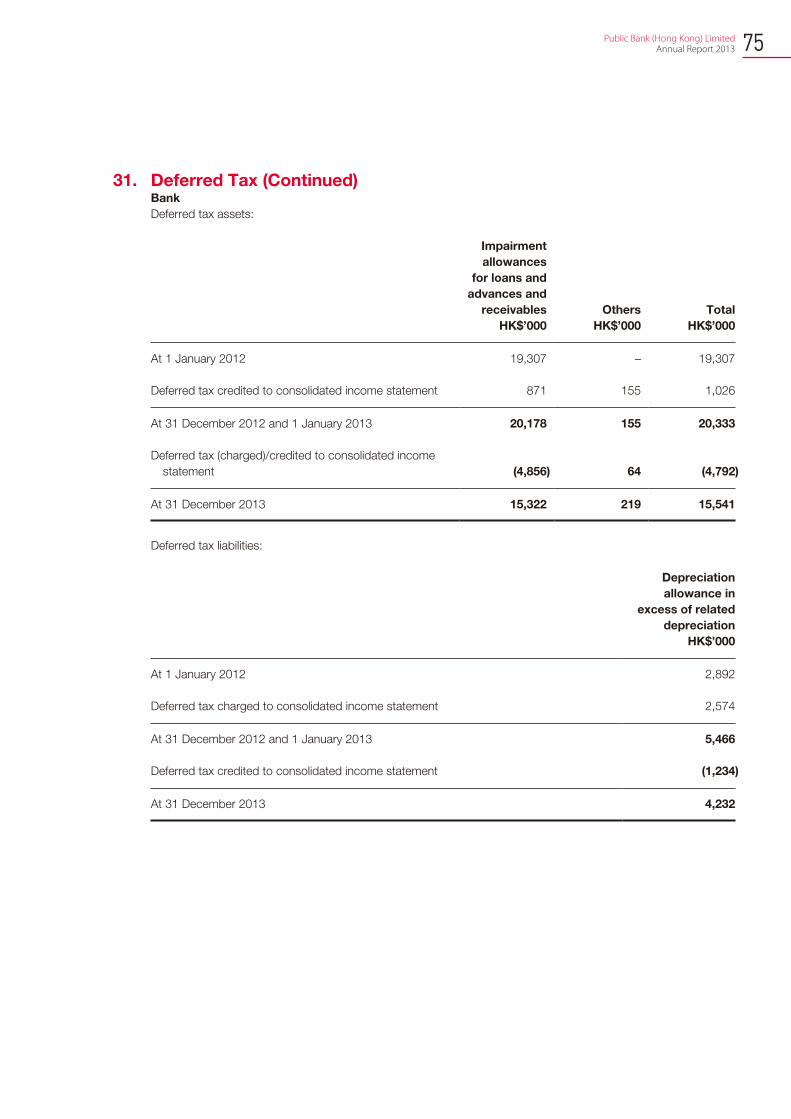
75 Public Bank (Hong Kong) Limited Annual Report 2013
31. Deferred Tax (Continued)Bank
Deferred tax assets:
Impairment
allowances
for loans and
advances and
receivables Others Total
HK$’000 HK$’000 HK$’000
At 1 January 2012 19,307 – 19,307
Deferred tax credited to consolidated income statement 871 155 1,026
At 31 December 2012 and 1 January 2013 20,178 155 20,333
Deferred tax (charged)/credited to consolidated income
statement (4,856) 64 (4,792)
At 31 December 2013 15,322 219 15,541
Deferred tax liabilities:
Depreciation
allowance in
excess of related
depreciation
HK$’000
At 1 January 2012 2,892
Deferred tax charged to consolidated income statement 2,574
At 31 December 2012 and 1 January 2013 5,466
Deferred tax credited to consolidated income statement (1,234)
At 31 December 2013 4,232
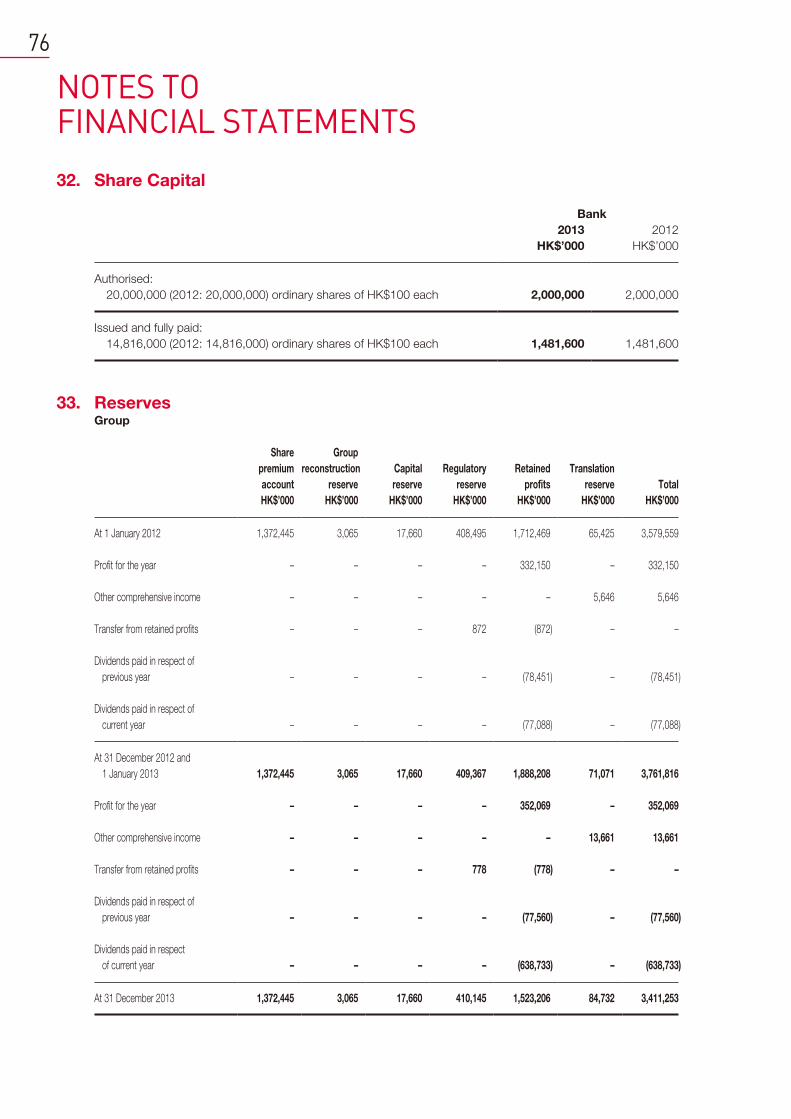
NOTES TO FINANCIAL STATEMENTS
76
32. Share Capital
Bank
2013 2012
HK$’000 HK$’000
Authorised:
20,000,000 (2012: 20,000,000) ordinary shares of HK$100 each 2,000,000 2,000,000
Issued and fully paid:
14,816,000 (2012: 14,816,000) ordinary shares of HK$100 each 1,481,600 1,481,600
33. ReservesGroup
Share
premium
account
Group
reconstruction
reserve
Capital
reserve
Regulatory
reserve
Retained
profits
Translation
reserve Total
HK$’000 HK$’000 HK$’000 HK$’000 HK$’000 HK$’000 HK$’000
At 1 January 2012 1,372,445 3,065 17,660 408,495 1,712,469 65,425 3,579,559
Profit for the year – – – – 332,150 – 332,150
Other comprehensive income – – – – – 5,646 5,646
Transfer from retained profits – – – 872 (872) – –
Dividends paid in respect of
previous year – – – – (78,451) – (78,451)
Dividends paid in respect of
current year – – – – (77,088) – (77,088)
At 31 December 2012 and
1 January 2013 1,372,445 3,065 17,660 409,367 1,888,208 71,071 3,761,816
Profit for the year – – – – 352,069 – 352,069
Other comprehensive income – – – – – 13,661 13,661
Transfer from retained profits – – – 778 (778) – –
Dividends paid in respect of
previous year – – – – (77,560) – (77,560)
Dividends paid in respect
of current year – – – – (638,733) – (638,733)
At 31 December 2013 1,372,445 3,065 17,660 410,145 1,523,206 84,732 3,411,253
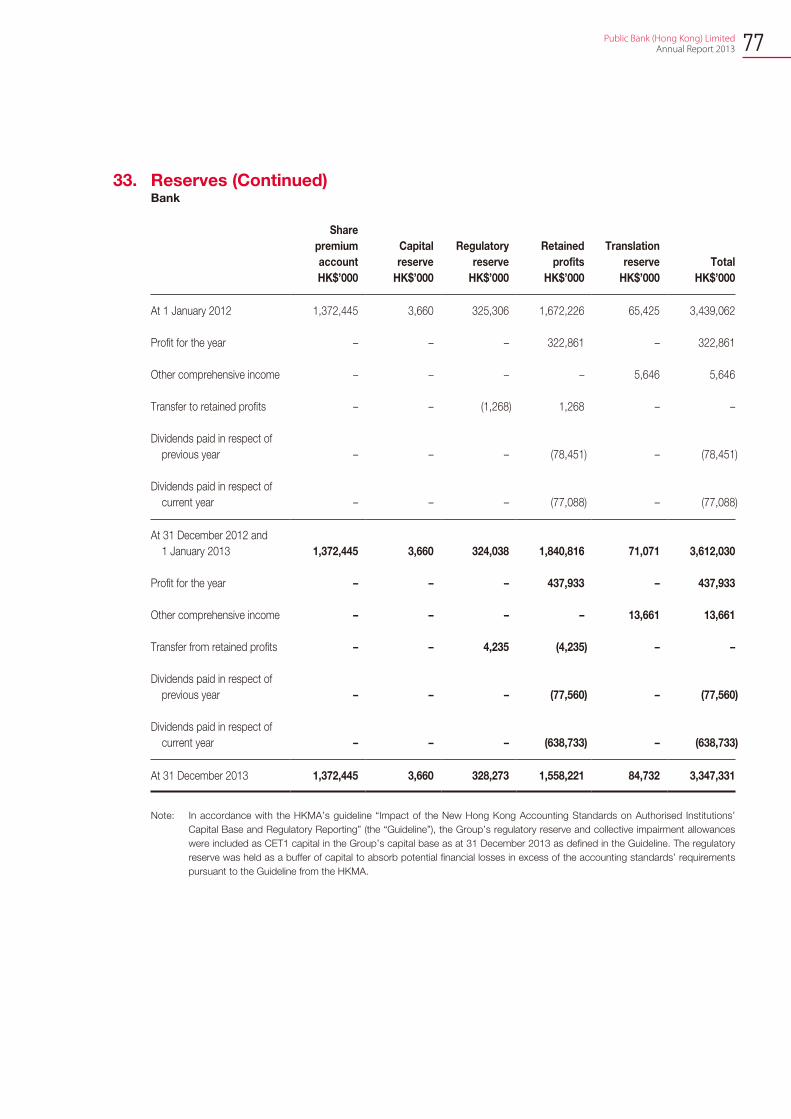
77 Public Bank (Hong Kong) Limited Annual Report 2013
33. Reserves (Continued)Bank
Share
premium
account
Capital
reserve
Regulatory
reserve
Retained
profits
Translation
reserve Total
HK$’000 HK$’000 HK$’000 HK$’000 HK$’000 HK$’000
At 1 January 2012 1,372,445 3,660 325,306 1,672,226 65,425 3,439,062
Profit for the year – – – 322,861 – 322,861
Other comprehensive income – – – – 5,646 5,646
Transfer to retained profits – – (1,268) 1,268 – –
Dividends paid in respect of
previous year – – – (78,451) – (78,451)
Dividends paid in respect of
current year – – – (77,088) – (77,088)
At 31 December 2012 and
1 January 2013 1,372,445 3,660 324,038 1,840,816 71,071 3,612,030
Profit for the year – – – 437,933 – 437,933
Other comprehensive income – – – – 13,661 13,661
Transfer from retained profits – – 4,235 (4,235) – –
Dividends paid in respect of
previous year – – – (77,560) – (77,560)
Dividends paid in respect of
current year – – – (638,733) – (638,733)
At 31 December 2013 1,372,445 3,660 328,273 1,558,221 84,732 3,347,331
Note: In accordance with the HKMA’s guideline “Impact of the New Hong Kong Accounting Standards on Authorised Institutions’
Capital Base and Regulatory Reporting” (the “Guideline”), the Group’s regulatory reserve and collective impairment allowances
were included as CET1 capital in the Group’s capital base as at 31 December 2013 as defined in the Guideline. The regulatory
reserve was held as a buffer of capital to absorb potential financial losses in excess of the accounting standards’ requirements
pursuant to the Guideline from the HKMA.
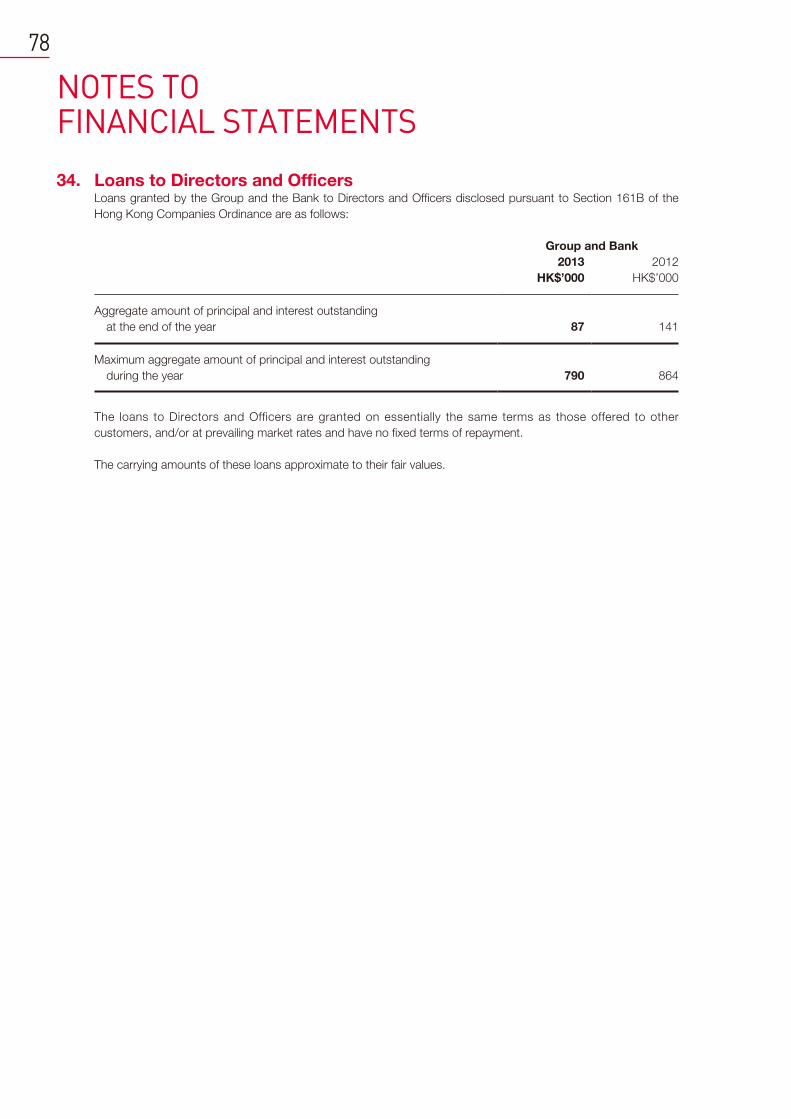
NOTES TO FINANCIAL STATEMENTS
78
34. Loans to Directors and OfficersLoans granted by the Group and the Bank to Directors and Officers disclosed pursuant to Section 161B of the
Hong Kong Companies Ordinance are as follows:
Group and Bank
2013 2012
HK$’000 HK$’000
Aggregate amount of principal and interest outstanding
at the end of the year 87 141
Maximum aggregate amount of principal and interest outstanding
during the year 790 864
The loans to Directors and Officers are granted on essentially the same terms as those offered to other
customers, and/or at prevailing market rates and have no fixed terms of repayment.
The carrying amounts of these loans approximate to their fair values.
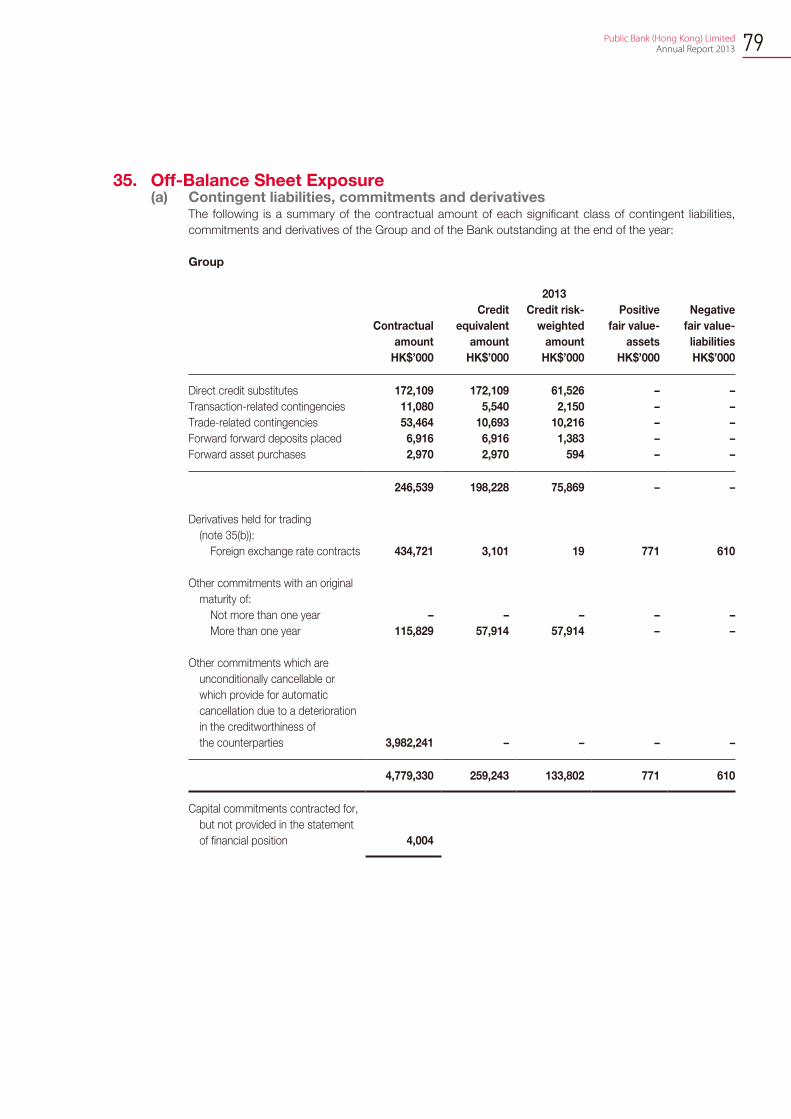
79 Public Bank (Hong Kong) Limited Annual Report 2013
35. Off-Balance Sheet Exposure(a) Contingent liabilities, commitments and derivatives
The following is a summary of the contractual amount of each significant class of contingent liabilities,
commitments and derivatives of the Group and of the Bank outstanding at the end of the year:
Group
2013
Contractual
amount
Credit
equivalent
amount
Credit risk-
weighted
amount
Positive
fair value-
assets
Negative
fair value-
liabilities
HK$’000 HK$’000 HK$’000 HK$’000 HK$’000
Direct credit substitutes 172,109 172,109 61,526 – –
Transaction-related contingencies 11,080 5,540 2,150 – –
Trade-related contingencies 53,464 10,693 10,216 – –
Forward forward deposits placed 6,916 6,916 1,383 – –
Forward asset purchases 2,970 2,970 594 – –
246,539 198,228 75,869 – –
Derivatives held for trading
(note 35(b)):
Foreign exchange rate contracts 434,721 3,101 19 771 610
Other commitments with an original
maturity of:
Not more than one year – – – – –
More than one year 115,829 57,914 57,914 – –
Other commitments which are
unconditionally cancellable or
which provide for automatic
cancellation due to a deterioration
in the creditworthiness of
the counterparties 3,982,241 – – – –
4,779,330 259,243 133,802 771 610
Capital commitments contracted for,
but not provided in the statement
of financial position 4,004
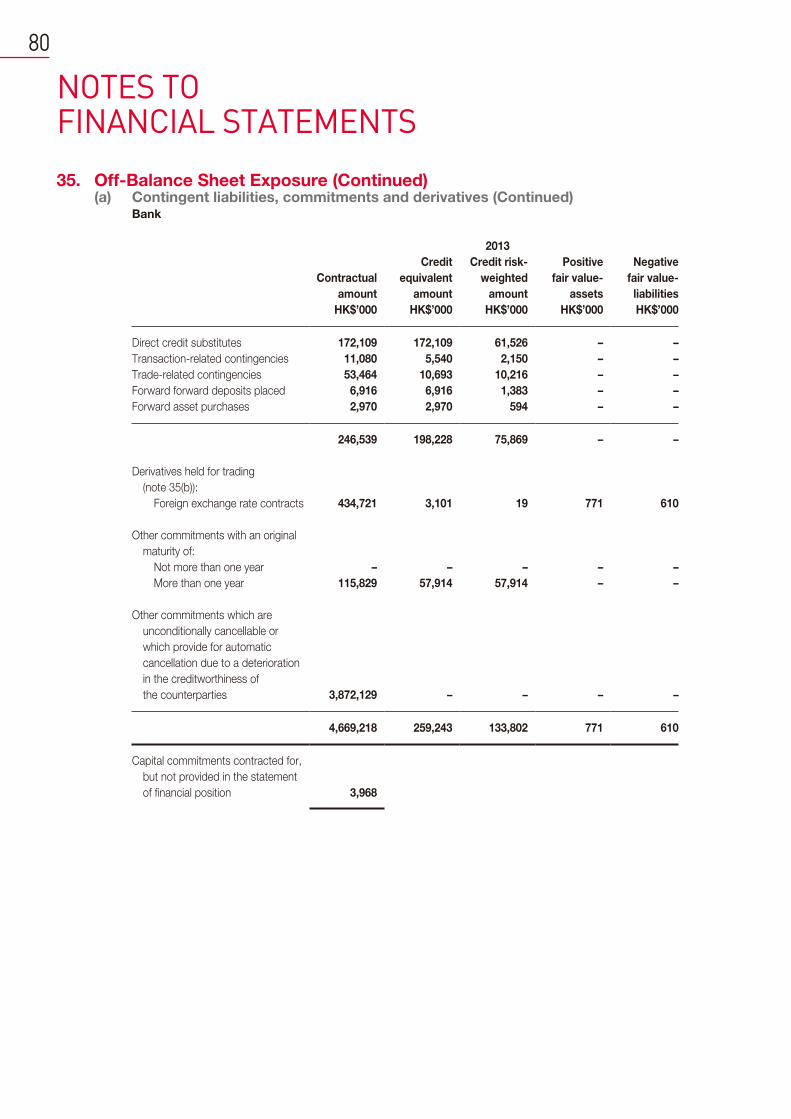
NOTES TO FINANCIAL STATEMENTS
80
35. Off-Balance Sheet Exposure (Continued)(a) Contingent liabilities, commitments and derivatives (Continued)
Bank
2013
Contractual
amount
Credit
equivalent
amount
Credit risk-
weighted
amount
Positive
fair value-
assets
Negative
fair value-
liabilities
HK$’000 HK$’000 HK$’000 HK$’000 HK$’000
Direct credit substitutes 172,109 172,109 61,526 – –
Transaction-related contingencies 11,080 5,540 2,150 – –
Trade-related contingencies 53,464 10,693 10,216 – –
Forward forward deposits placed 6,916 6,916 1,383 – –
Forward asset purchases 2,970 2,970 594 – –
246,539 198,228 75,869 – –
Derivatives held for trading
(note 35(b)):
Foreign exchange rate contracts 434,721 3,101 19 771 610
Other commitments with an original
maturity of:
Not more than one year – – – – –
More than one year 115,829 57,914 57,914 – –
Other commitments which are
unconditionally cancellable or
which provide for automatic
cancellation due to a deterioration
in the creditworthiness of
the counterparties 3,872,129 – – – –
4,669,218 259,243 133,802 771 610
Capital commitments contracted for,
but not provided in the statement
of financial position 3,968
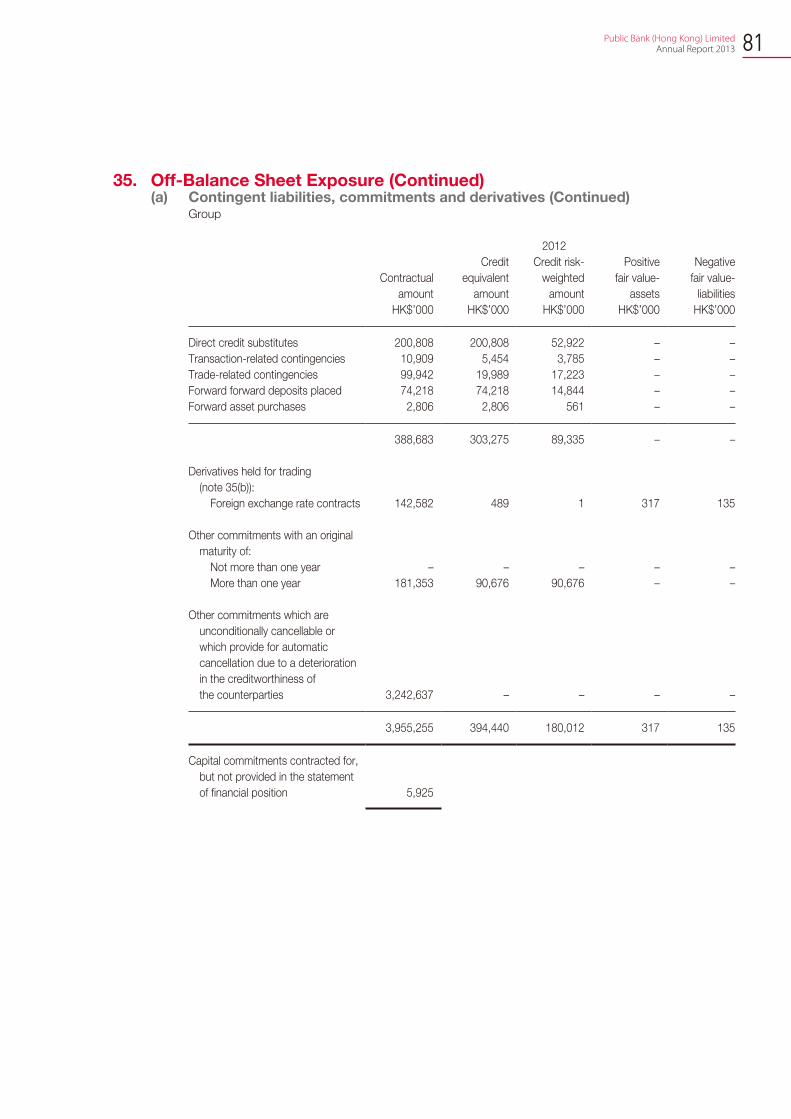
81 Public Bank (Hong Kong) Limited Annual Report 2013
35. Off-Balance Sheet Exposure (Continued)(a) Contingent liabilities, commitments and derivatives (Continued)
Group
2012
Contractual
amount
Credit
equivalent
amount
Credit risk-
weighted
amount
Positive
fair value-
assets
Negative
fair value-
liabilities
HK$’000 HK$’000 HK$’000 HK$’000 HK$’000
Direct credit substitutes 200,808 200,808 52,922 – –
Transaction-related contingencies 10,909 5,454 3,785 – –
Trade-related contingencies 99,942 19,989 17,223 – –
Forward forward deposits placed 74,218 74,218 14,844 – –
Forward asset purchases 2,806 2,806 561 – –
388,683 303,275 89,335 – –
Derivatives held for trading
(note 35(b)):
Foreign exchange rate contracts 142,582 489 1 317 135
Other commitments with an original
maturity of:
Not more than one year – – – – –
More than one year 181,353 90,676 90,676 – –
Other commitments which are
unconditionally cancellable or
which provide for automatic
cancellation due to a deterioration
in the creditworthiness of
the counterparties 3,242,637 – – – –
3,955,255 394,440 180,012 317 135
Capital commitments contracted for,
but not provided in the statement
of financial position 5,925
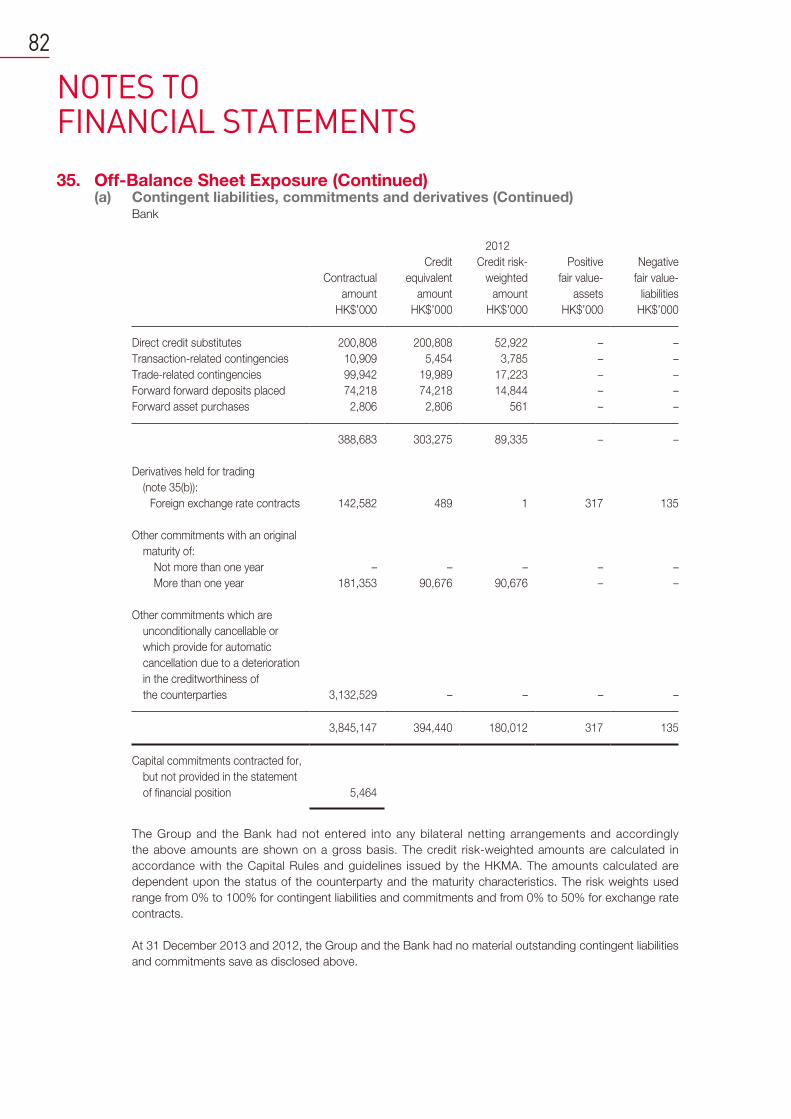
NOTES TO FINANCIAL STATEMENTS
82
35. Off-Balance Sheet Exposure (Continued)(a) Contingent liabilities, commitments and derivatives (Continued)
Bank
2012
Contractual
amount
Credit
equivalent
amount
Credit risk-
weighted
amount
Positive
fair value-
assets
Negative
fair value-
liabilities
HK$’000 HK$’000 HK$’000 HK$’000 HK$’000
Direct credit substitutes 200,808 200,808 52,922 – –
Transaction-related contingencies 10,909 5,454 3,785 – –
Trade-related contingencies 99,942 19,989 17,223 – –
Forward forward deposits placed 74,218 74,218 14,844 – –
Forward asset purchases 2,806 2,806 561 – –
388,683 303,275 89,335 – –
Derivatives held for trading
(note 35(b)):
Foreign exchange rate contracts 142,582 489 1 317 135
Other commitments with an original
maturity of:
Not more than one year – – – – –
More than one year 181,353 90,676 90,676 – –
Other commitments which are
unconditionally cancellable or
which provide for automatic
cancellation due to a deterioration
in the creditworthiness of
the counterparties 3,132,529 – – – –
3,845,147 394,440 180,012 317 135
Capital commitments contracted for,
but not provided in the statement
of financial position 5,464
The Group and the Bank had not entered into any bilateral netting arrangements and accordingly
the above amounts are shown on a gross basis. The credit risk-weighted amounts are calculated in
accordance with the Capital Rules and guidelines issued by the HKMA. The amounts calculated are
dependent upon the status of the counterparty and the maturity characteristics. The risk weights used
range from 0% to 100% for contingent liabilities and commitments and from 0% to 50% for exchange rate
contracts.
At 31 December 2013 and 2012, the Group and the Bank had no material outstanding contingent liabilities
and commitments save as disclosed above.
83 Public Bank (Hong Kong) Limited Annual Report 2013
35. Off-Balance Sheet Exposure (Continued)(b) Derivative financial instruments
The Group uses the following derivative financial instruments:
Currency forwards represent commitments to purchase foreign and domestic currencies, including
undelivered spot transactions. Foreign currency and interest rate futures are contractual obligations to
receive or pay a net amount based on changes in currency rates or interest rates, or to buy or sell a
foreign currency or a financial instrument on a future date at a specified price, established in an organised
financial market. The credit risk is negligible, as changes in the futures contract value are settled daily with
the exchange. Forward rate agreements are individually negotiated interest rate futures that call for a cash
settlement at a future date for the difference between a contracted rate of interest and the current market
rate, based on a notional principal amount.
Interest rate swaps are commitments to exchange one set of cash flows for another. Swaps result in an
exchange of interest rates (for example, fixed rate or floating rate). No exchange of principal takes place.
The Group’s credit risk represents the potential cost to replace the swap contracts if counterparties fail
to perform their obligations. This risk is monitored on an ongoing basis with reference to the current fair
value, a proportion of the notional amount of the contracts and the liquidity of the market. To control the
level of credit risk taken, the Group assesses counterparties using the same techniques as used for its
lending activities.
The notional amounts of certain types of financial instruments provide a basis for comparison with
instruments recognised in the consolidated statement of financial position but do not necessarily indicate
the amounts of future cash flows involved or the current fair value of the instruments and, therefore, do
not indicate the Group’s exposure to credit or price risk. The derivative financial instruments become
favourable (assets) or unfavourable (liabilities) as a result of fluctuations in market interest rates or foreign
exchange rates relative to their terms. The aggregate contractual or notional amount of derivative financial
instruments on hand, the extent to which the instruments are favourable or unfavourable, and thus the
aggregate fair values of derivative financial assets and liabilities, can fluctuate significantly from time to
time.
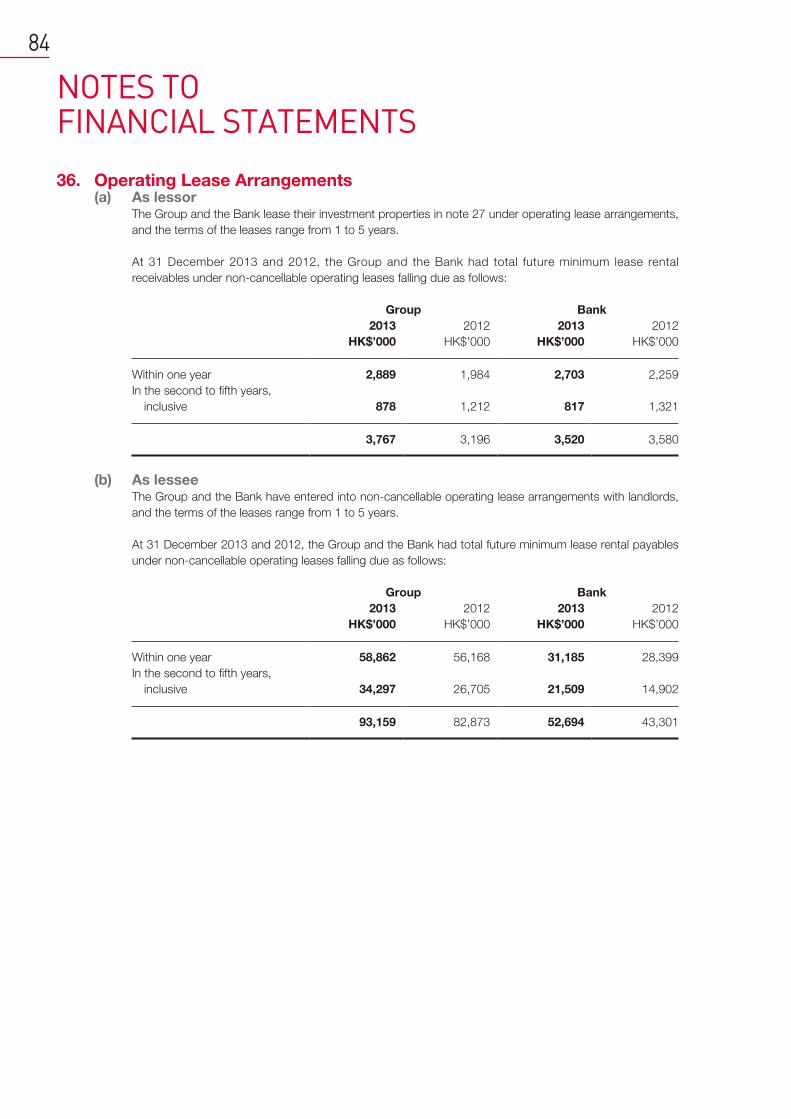
NOTES TO FINANCIAL STATEMENTS
84
36. Operating Lease Arrangements(a) As lessor
The Group and the Bank lease their investment properties in note 27 under operating lease arrangements,
and the terms of the leases range from 1 to 5 years.
At 31 December 2013 and 2012, the Group and the Bank had total future minimum lease rental
receivables under non-cancellable operating leases falling due as follows:
Group Bank
2013 2012 2013 2012
HK$’000 HK$’000 HK$’000 HK$’000
Within one year 2,889 1,984 2,703 2,259
In the second to fifth years,
inclusive 878 1,212 817 1,321
3,767 3,196 3,520 3,580
(b) As lesseeThe Group and the Bank have entered into non-cancellable operating lease arrangements with landlords,
and the terms of the leases range from 1 to 5 years.
At 31 December 2013 and 2012, the Group and the Bank had total future minimum lease rental payables
under non-cancellable operating leases falling due as follows:
Group Bank
2013 2012 2013 2012
HK$’000 HK$’000 HK$’000 HK$’000
Within one year 58,862 56,168 31,185 28,399
In the second to fifth years,
inclusive 34,297 26,705 21,509 14,902
93,159 82,873 52,694 43,301
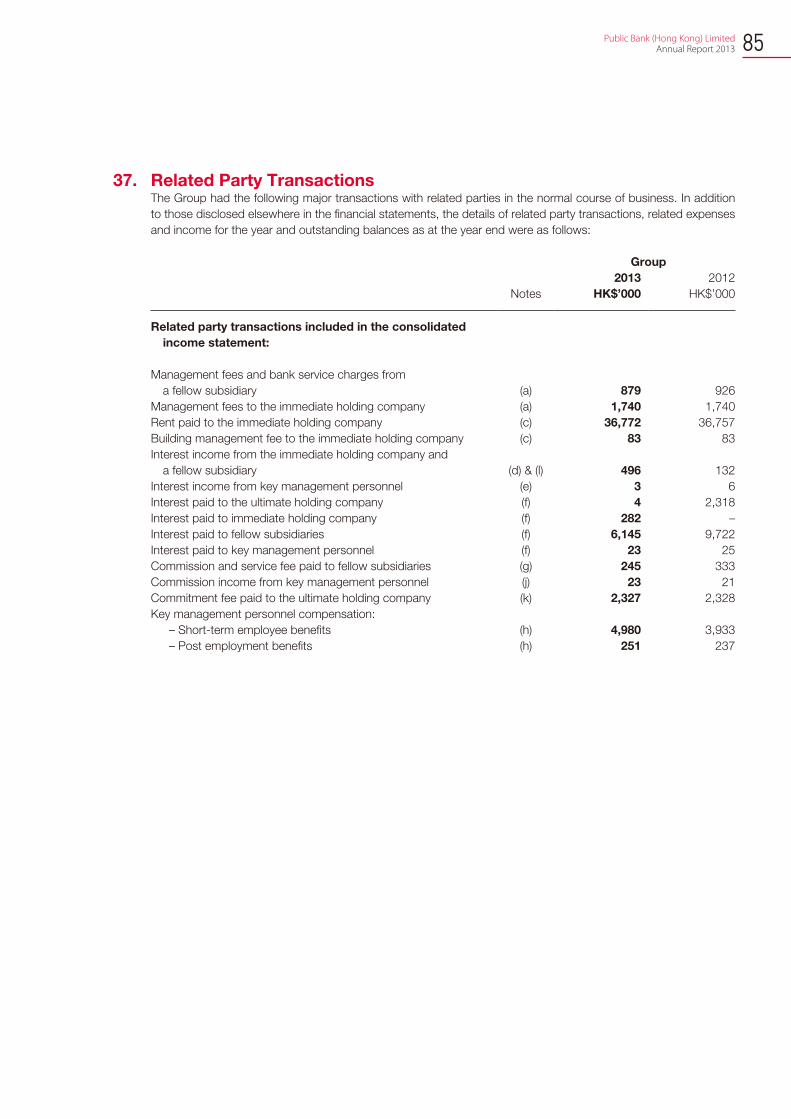
85 Public Bank (Hong Kong) Limited Annual Report 2013
37. Related Party TransactionsThe Group had the following major transactions with related parties in the normal course of business. In addition
to those disclosed elsewhere in the financial statements, the details of related party transactions, related expenses
and income for the year and outstanding balances as at the year end were as follows:
Group
2013 2012
Notes HK$’000 HK$’000
Related party transactions included in the consolidated
income statement:
Management fees and bank service charges from
a fellow subsidiary (a) 879 926
Management fees to the immediate holding company (a) 1,740 1,740
Rent paid to the immediate holding company (c) 36,772 36,757
Building management fee to the immediate holding company (c) 83 83
Interest income from the immediate holding company and
a fellow subsidiary (d) & (l) 496 132
Interest income from key management personnel (e) 3 6
Interest paid to the ultimate holding company (f) 4 2,318
Interest paid to immediate holding company (f) 282 –
Interest paid to fellow subsidiaries (f) 6,145 9,722
Interest paid to key management personnel (f) 23 25
Commission and service fee paid to fellow subsidiaries (g) 245 333
Commission income from key management personnel (j) 23 21
Commitment fee paid to the ultimate holding company (k) 2,327 2,328
Key management personnel compensation:
– Short-term employee benefits (h) 4,980 3,933
– Post employment benefits (h) 251 237
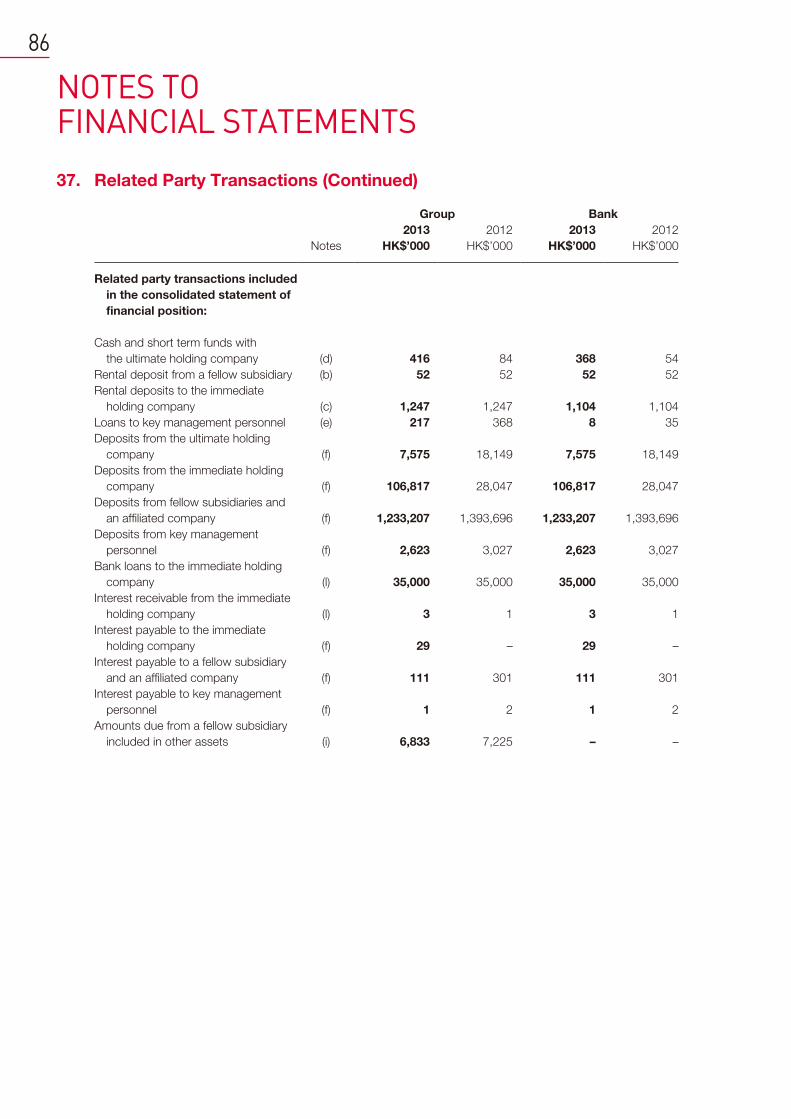
NOTES TO FINANCIAL STATEMENTS
86
37. Related Party Transactions (Continued)
Group Bank
2013 2012 2013 2012
Notes HK$’000 HK$’000 HK$’000 HK$’000
Related party transactions included
in the consolidated statement of
financial position:
Cash and short term funds with
the ultimate holding company (d) 416 84 368 54
Rental deposit from a fellow subsidiary (b) 52 52 52 52
Rental deposits to the immediate
holding company (c) 1,247 1,247 1,104 1,104
Loans to key management personnel (e) 217 368 8 35
Deposits from the ultimate holding
company (f) 7,575 18,149 7,575 18,149
Deposits from the immediate holding
company (f) 106,817 28,047 106,817 28,047
Deposits from fellow subsidiaries and
an affiliated company (f) 1,233,207 1,393,696 1,233,207 1,393,696
Deposits from key management
personnel (f) 2,623 3,027 2,623 3,027
Bank loans to the immediate holding
company (l) 35,000 35,000 35,000 35,000
Interest receivable from the immediate
holding company (l) 3 1 3 1
Interest payable to the immediate
holding company (f) 29 – 29 –
Interest payable to a fellow subsidiary
and an affiliated company (f) 111 301 111 301
Interest payable to key management
personnel (f) 1 2 1 2
Amounts due from a fellow subsidiary
included in other assets (i) 6,833 7,225 – –
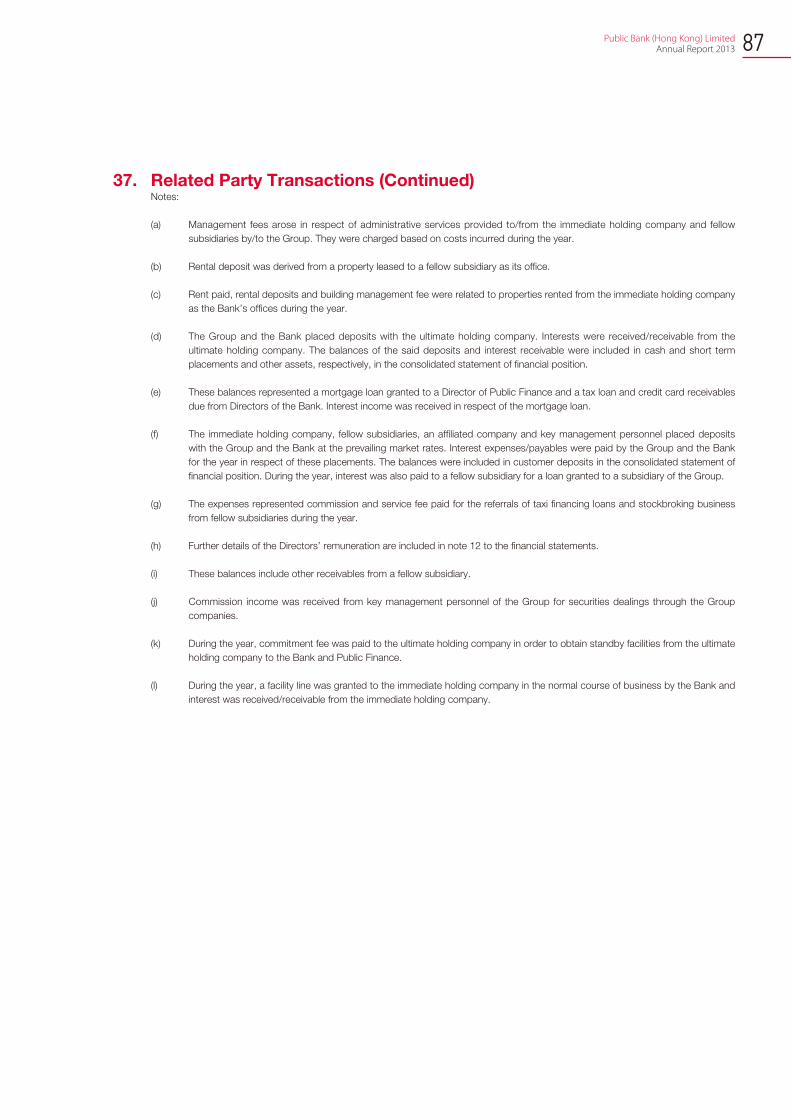
87 Public Bank (Hong Kong) Limited Annual Report 2013
37. Related Party Transactions (Continued)Notes:
(a) Management fees arose in respect of administrative services provided to/from the immediate holding company and fellow
subsidiaries by/to the Group. They were charged based on costs incurred during the year.
(b) Rental deposit was derived from a property leased to a fellow subsidiary as its office.
(c) Rent paid, rental deposits and building management fee were related to properties rented from the immediate holding company
as the Bank’s offices during the year.
(d) The Group and the Bank placed deposits with the ultimate holding company. Interests were received/receivable from the
ultimate holding company. The balances of the said deposits and interest receivable were included in cash and short term
placements and other assets, respectively, in the consolidated statement of financial position.
(e) These balances represented a mortgage loan granted to a Director of Public Finance and a tax loan and credit card receivables
due from Directors of the Bank. Interest income was received in respect of the mortgage loan.
(f) The immediate holding company, fellow subsidiaries, an affiliated company and key management personnel placed deposits
with the Group and the Bank at the prevailing market rates. Interest expenses/payables were paid by the Group and the Bank
for the year in respect of these placements. The balances were included in customer deposits in the consolidated statement of
financial position. During the year, interest was also paid to a fellow subsidiary for a loan granted to a subsidiary of the Group.
(g) The expenses represented commission and service fee paid for the referrals of taxi financing loans and stockbroking business
from fellow subsidiaries during the year.
(h) Further details of the Directors’ remuneration are included in note 12 to the financial statements.
(i) These balances include other receivables from a fellow subsidiary.
(j) Commission income was received from key management personnel of the Group for securities dealings through the Group
companies.
(k) During the year, commitment fee was paid to the ultimate holding company in order to obtain standby facilities from the ultimate
holding company to the Bank and Public Finance.
(l) During the year, a facility line was granted to the immediate holding company in the normal course of business by the Bank and
interest was received/receivable from the immediate holding company.
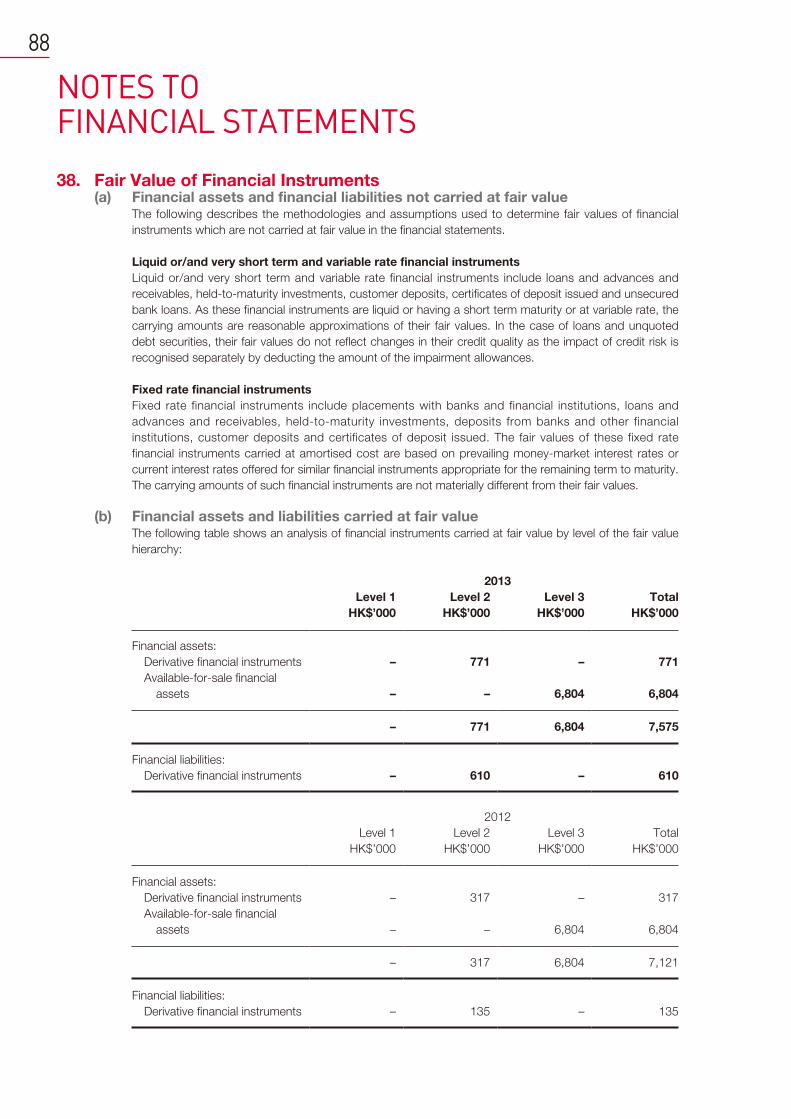
NOTES TO FINANCIAL STATEMENTS
88
38. Fair Value of Financial Instruments(a) Financial assets and financial liabilities not carried at fair value
The following describes the methodologies and assumptions used to determine fair values of financial
instruments which are not carried at fair value in the financial statements.
Liquid or/and very short term and variable rate financial instruments
Liquid or/and very short term and variable rate financial instruments include loans and advances and
receivables, held-to-maturity investments, customer deposits, certificates of deposit issued and unsecured
bank loans. As these financial instruments are liquid or having a short term maturity or at variable rate, the
carrying amounts are reasonable approximations of their fair values. In the case of loans and unquoted
debt securities, their fair values do not reflect changes in their credit quality as the impact of credit risk is
recognised separately by deducting the amount of the impairment allowances.
Fixed rate financial instruments
Fixed rate financial instruments include placements with banks and financial institutions, loans and
advances and receivables, held-to-maturity investments, deposits from banks and other financial
institutions, customer deposits and certificates of deposit issued. The fair values of these fixed rate
financial instruments carried at amortised cost are based on prevailing money-market interest rates or
current interest rates offered for similar financial instruments appropriate for the remaining term to maturity.
The carrying amounts of such financial instruments are not materially different from their fair values.
(b) Financial assets and liabilities carried at fair valueThe following table shows an analysis of financial instruments carried at fair value by level of the fair value
hierarchy:
2013
Level 1 Level 2 Level 3 Total
HK$’000 HK$’000 HK$’000 HK$’000
Financial assets:
Derivative financial instruments – 771 – 771
Available-for-sale financial
assets – – 6,804 6,804
– 771 6,804 7,575
Financial liabilities:
Derivative financial instruments – 610 – 610
2012
Level 1 Level 2 Level 3 Total
HK$’000 HK$’000 HK$’000 HK$’000
Financial assets:
Derivative financial instruments – 317 – 317
Available-for-sale financial
assets – – 6,804 6,804
– 317 6,804 7,121
Financial liabilities:
Derivative financial instruments – 135 – 135
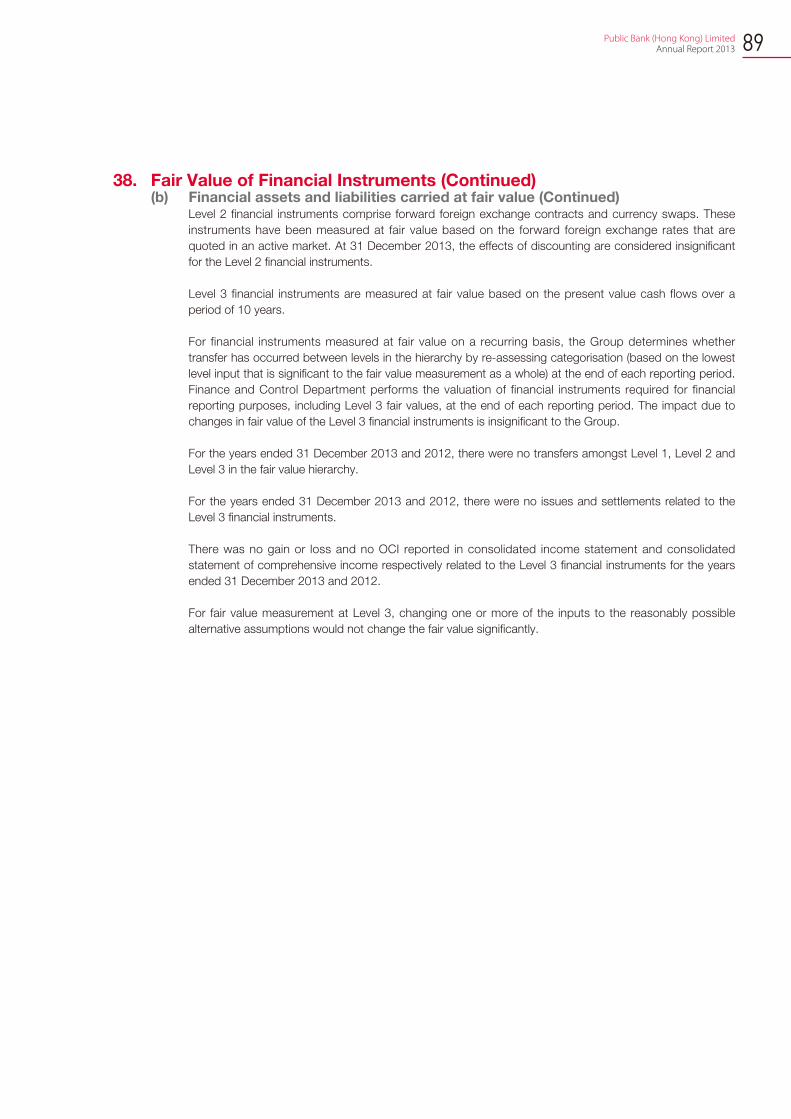
89 Public Bank (Hong Kong) Limited Annual Report 2013
38. Fair Value of Financial Instruments (Continued)(b) Financial assets and liabilities carried at fair value (Continued)
Level 2 financial instruments comprise forward foreign exchange contracts and currency swaps. These
instruments have been measured at fair value based on the forward foreign exchange rates that are
quoted in an active market. At 31 December 2013, the effects of discounting are considered insignificant
for the Level 2 financial instruments.
Level 3 financial instruments are measured at fair value based on the present value cash flows over a
period of 10 years.
For financial instruments measured at fair value on a recurring basis, the Group determines whether
transfer has occurred between levels in the hierarchy by re-assessing categorisation (based on the lowest
level input that is significant to the fair value measurement as a whole) at the end of each reporting period.
Finance and Control Department performs the valuation of financial instruments required for financial
reporting purposes, including Level 3 fair values, at the end of each reporting period. The impact due to
changes in fair value of the Level 3 financial instruments is insignificant to the Group.
For the years ended 31 December 2013 and 2012, there were no transfers amongst Level 1, Level 2 and
Level 3 in the fair value hierarchy.
For the years ended 31 December 2013 and 2012, there were no issues and settlements related to the
Level 3 financial instruments.
There was no gain or loss and no OCI reported in consolidated income statement and consolidated
statement of comprehensive income respectively related to the Level 3 financial instruments for the years
ended 31 December 2013 and 2012.
For fair value measurement at Level 3, changing one or more of the inputs to the reasonably possible
alternative assumptions would not change the fair value significantly.
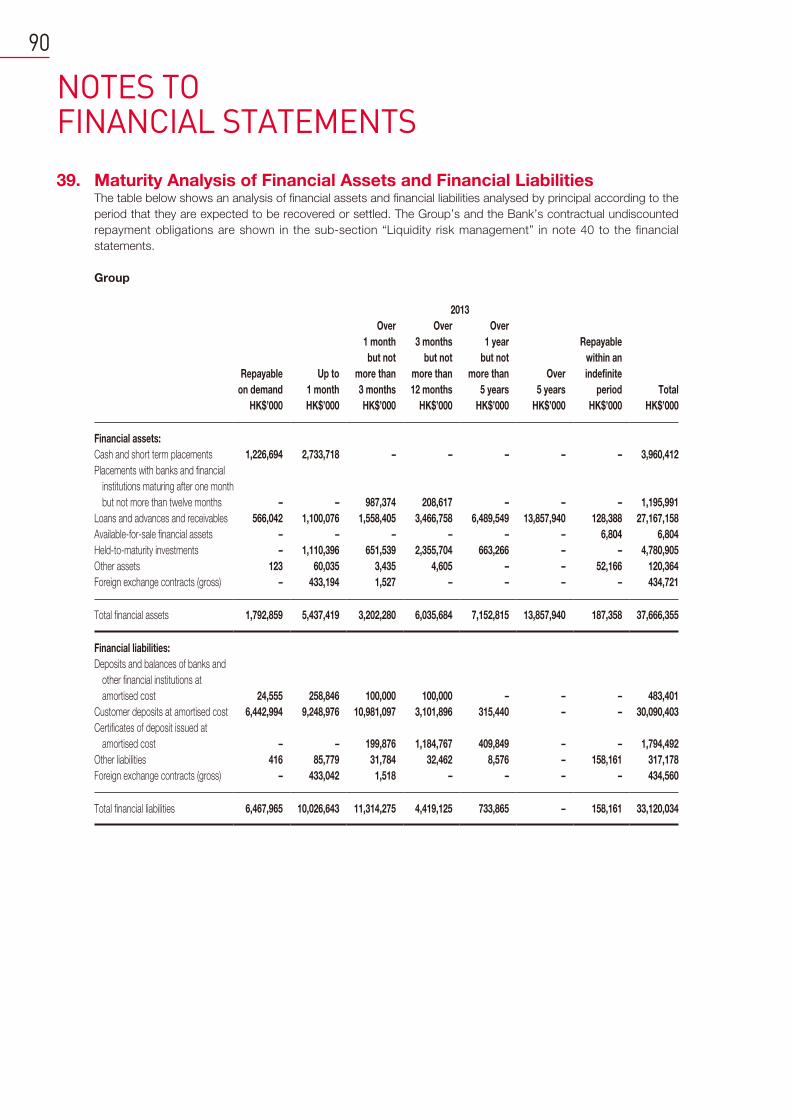
NOTES TO FINANCIAL STATEMENTS
90
39. Maturity Analysis of Financial Assets and Financial LiabilitiesThe table below shows an analysis of financial assets and financial liabilities analysed by principal according to the
period that they are expected to be recovered or settled. The Group’s and the Bank’s contractual undiscounted
repayment obligations are shown in the sub-section “Liquidity risk management” in note 40 to the financial
statements.
Group
2013
Repayable
on demand
Up to
1 month
Over
1 month
but not
more than
3 months
Over
3 months
but not
more than
12 months
Over
1 year
but not
more than
5 years
Over
5 years
Repayable
within an
indefinite
period Total
HK$’000 HK$’000 HK$’000 HK$’000 HK$’000 HK$’000 HK$’000 HK$’000
Financial assets:
Cash and short term placements 1,226,694 2,733,718 – – – – – 3,960,412
Placements with banks and financial
institutions maturing after one month
but not more than twelve months – – 987,374 208,617 – – – 1,195,991
Loans and advances and receivables 566,042 1,100,076 1,558,405 3,466,758 6,489,549 13,857,940 128,388 27,167,158
Available-for-sale financial assets – – – – – – 6,804 6,804
Held-to-maturity investments – 1,110,396 651,539 2,355,704 663,266 – – 4,780,905
Other assets 123 60,035 3,435 4,605 – – 52,166 120,364
Foreign exchange contracts (gross) – 433,194 1,527 – – – – 434,721
Total financial assets 1,792,859 5,437,419 3,202,280 6,035,684 7,152,815 13,857,940 187,358 37,666,355
Financial liabilities:
Deposits and balances of banks and
other financial institutions at
amortised cost 24,555 258,846 100,000 100,000 – – – 483,401
Customer deposits at amortised cost 6,442,994 9,248,976 10,981,097 3,101,896 315,440 – – 30,090,403
Certificates of deposit issued at
amortised cost – – 199,876 1,184,767 409,849 – – 1,794,492
Other liabilities 416 85,779 31,784 32,462 8,576 – 158,161 317,178
Foreign exchange contracts (gross) – 433,042 1,518 – – – – 434,560
Total financial liabilities 6,467,965 10,026,643 11,314,275 4,419,125 733,865 – 158,161 33,120,034
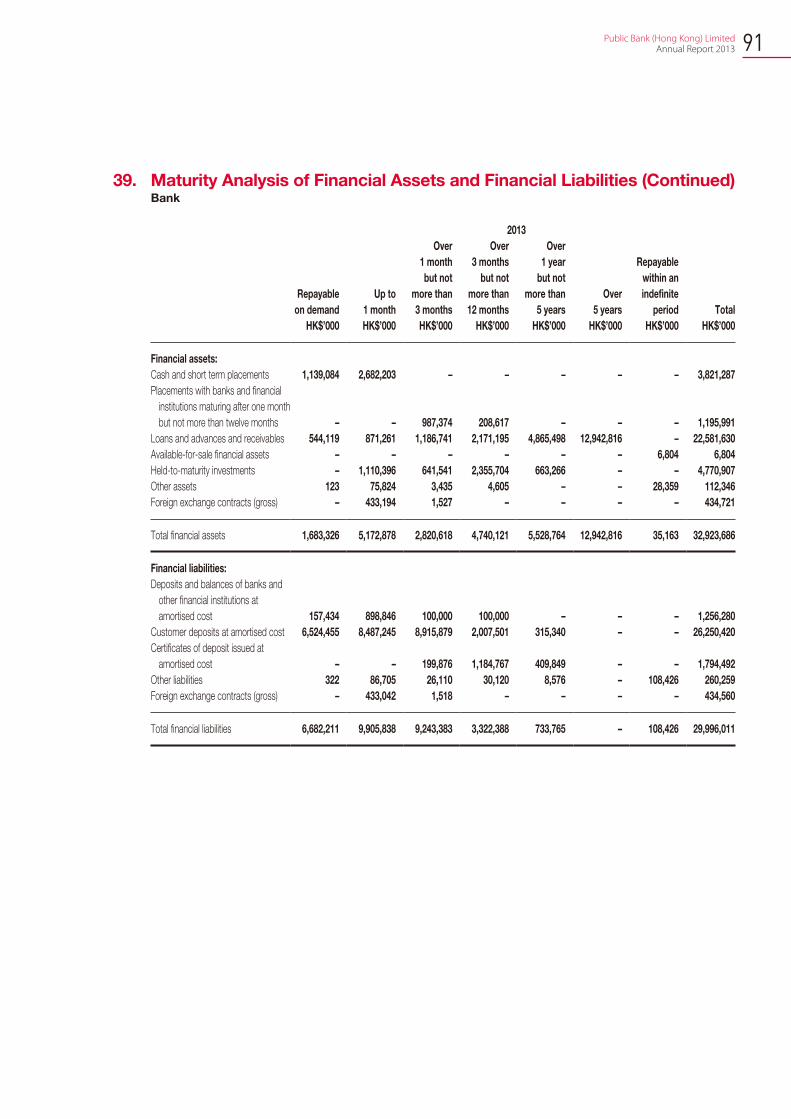
91 Public Bank (Hong Kong) Limited Annual Report 2013
39. Maturity Analysis of Financial Assets and Financial Liabilities (Continued)Bank
2013
Repayable
on demand
Up to
1 month
Over
1 month
but not
more than
3 months
Over
3 months
but not
more than
12 months
Over
1 year
but not
more than
5 years
Over
5 years
Repayable
within an
indefinite
period Total
HK$’000 HK$’000 HK$’000 HK$’000 HK$’000 HK$’000 HK$’000 HK$’000
Financial assets:
Cash and short term placements 1,139,084 2,682,203 – – – – – 3,821,287
Placements with banks and financial
institutions maturing after one month
but not more than twelve months – – 987,374 208,617 – – – 1,195,991
Loans and advances and receivables 544,119 871,261 1,186,741 2,171,195 4,865,498 12,942,816 – 22,581,630
Available-for-sale financial assets – – – – – – 6,804 6,804
Held-to-maturity investments – 1,110,396 641,541 2,355,704 663,266 – – 4,770,907
Other assets 123 75,824 3,435 4,605 – – 28,359 112,346
Foreign exchange contracts (gross) – 433,194 1,527 – – – – 434,721
Total financial assets 1,683,326 5,172,878 2,820,618 4,740,121 5,528,764 12,942,816 35,163 32,923,686
Financial liabilities:
Deposits and balances of banks and
other financial institutions at
amortised cost 157,434 898,846 100,000 100,000 – – – 1,256,280
Customer deposits at amortised cost 6,524,455 8,487,245 8,915,879 2,007,501 315,340 – – 26,250,420
Certificates of deposit issued at
amortised cost – – 199,876 1,184,767 409,849 – – 1,794,492
Other liabilities 322 86,705 26,110 30,120 8,576 – 108,426 260,259
Foreign exchange contracts (gross) – 433,042 1,518 – – – – 434,560
Total financial liabilities 6,682,211 9,905,838 9,243,383 3,322,388 733,765 – 108,426 29,996,011
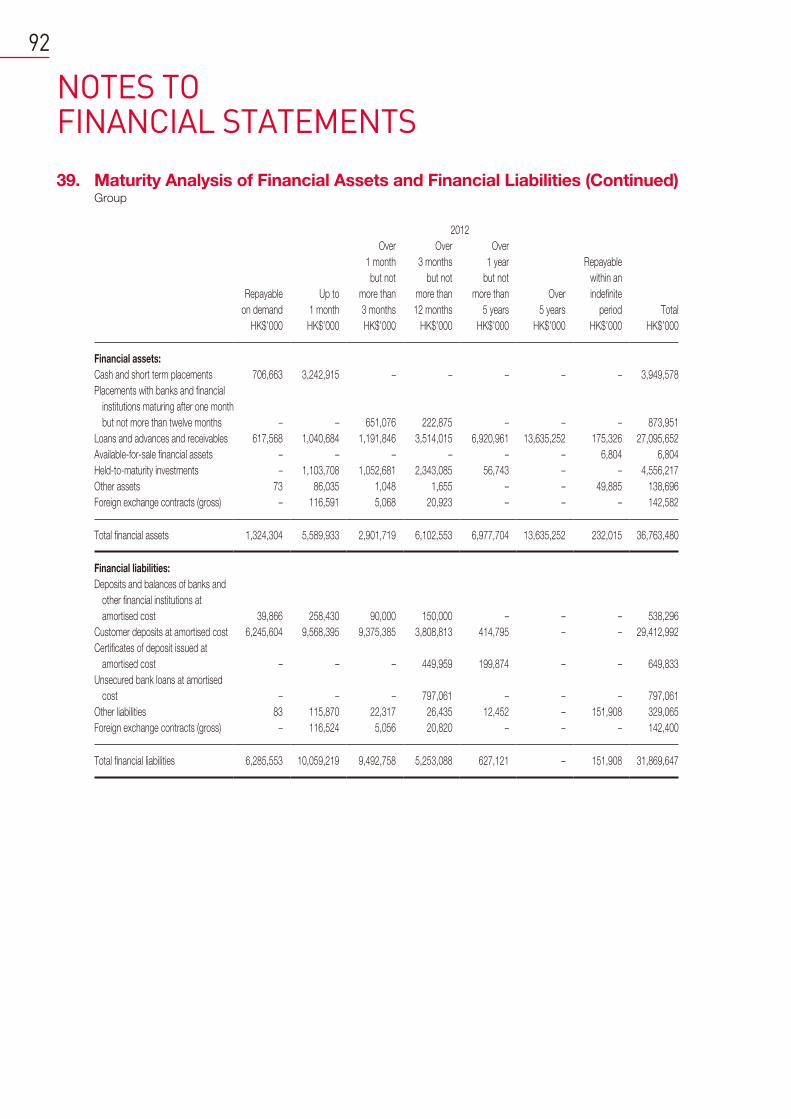
NOTES TO FINANCIAL STATEMENTS
92
39. Maturity Analysis of Financial Assets and Financial Liabilities (Continued)Group
2012
Repayable
on demand
Up to
1 month
Over
1 month
but not
more than
3 months
Over
3 months
but not
more than
12 months
Over
1 year
but not
more than
5 years
Over
5 years
Repayable
within an
indefinite
period Total
HK$’000 HK$’000 HK$’000 HK$’000 HK$’000 HK$’000 HK$’000 HK$’000
Financial assets:
Cash and short term placements 706,663 3,242,915 – – – – – 3,949,578
Placements with banks and financial
institutions maturing after one month
but not more than twelve months – – 651,076 222,875 – – – 873,951
Loans and advances and receivables 617,568 1,040,684 1,191,846 3,514,015 6,920,961 13,635,252 175,326 27,095,652
Available-for-sale financial assets – – – – – – 6,804 6,804
Held-to-maturity investments – 1,103,708 1,052,681 2,343,085 56,743 – – 4,556,217
Other assets 73 86,035 1,048 1,655 – – 49,885 138,696
Foreign exchange contracts (gross) – 116,591 5,068 20,923 – – – 142,582
Total financial assets 1,324,304 5,589,933 2,901,719 6,102,553 6,977,704 13,635,252 232,015 36,763,480
Financial liabilities:
Deposits and balances of banks and
other financial institutions at
amortised cost 39,866 258,430 90,000 150,000 – – – 538,296
Customer deposits at amortised cost 6,245,604 9,568,395 9,375,385 3,808,813 414,795 – – 29,412,992
Certificates of deposit issued at
amortised cost – – – 449,959 199,874 – – 649,833
Unsecured bank loans at amortised
cost – – – 797,061 – – – 797,061
Other liabilities 83 115,870 22,317 26,435 12,452 – 151,908 329,065
Foreign exchange contracts (gross) – 116,524 5,056 20,820 – – – 142,400
Total financial liabilities 6,285,553 10,059,219 9,492,758 5,253,088 627,121 – 151,908 31,869,647
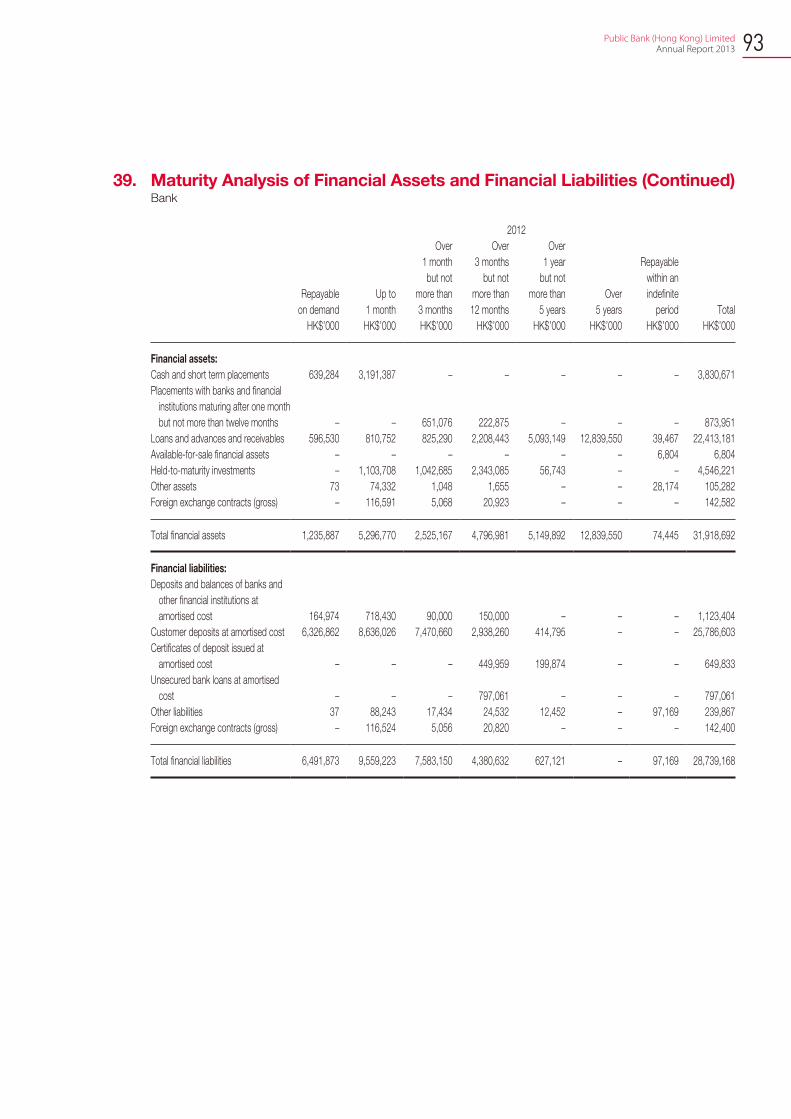
93 Public Bank (Hong Kong) Limited Annual Report 2013
39. Maturity Analysis of Financial Assets and Financial Liabilities (Continued)Bank
2012
Repayable
on demand
Up to
1 month
Over
1 month
but not
more than
3 months
Over
3 months
but not
more than
12 months
Over
1 year
but not
more than
5 years
Over
5 years
Repayable
within an
indefinite
period Total
HK$’000 HK$’000 HK$’000 HK$’000 HK$’000 HK$’000 HK$’000 HK$’000
Financial assets:
Cash and short term placements 639,284 3,191,387 – – – – – 3,830,671
Placements with banks and financial
institutions maturing after one month
but not more than twelve months – – 651,076 222,875 – – – 873,951
Loans and advances and receivables 596,530 810,752 825,290 2,208,443 5,093,149 12,839,550 39,467 22,413,181
Available-for-sale financial assets – – – – – – 6,804 6,804
Held-to-maturity investments – 1,103,708 1,042,685 2,343,085 56,743 – – 4,546,221
Other assets 73 74,332 1,048 1,655 – – 28,174 105,282
Foreign exchange contracts (gross) – 116,591 5,068 20,923 – – – 142,582
Total financial assets 1,235,887 5,296,770 2,525,167 4,796,981 5,149,892 12,839,550 74,445 31,918,692
Financial liabilities:
Deposits and balances of banks and
other financial institutions at
amortised cost 164,974 718,430 90,000 150,000 – – – 1,123,404
Customer deposits at amortised cost 6,326,862 8,636,026 7,470,660 2,938,260 414,795 – – 25,786,603
Certificates of deposit issued at
amortised cost – – – 449,959 199,874 – – 649,833
Unsecured bank loans at amortised
cost – – – 797,061 – – – 797,061
Other liabilities 37 88,243 17,434 24,532 12,452 – 97,169 239,867
Foreign exchange contracts (gross) – 116,524 5,056 20,820 – – – 142,400
Total financial liabilities 6,491,873 9,559,223 7,583,150 4,380,632 627,121 – 97,169 28,739,168
NOTES TO FINANCIAL STATEMENTS
94
40. Financial Risk Management Objectives and PoliciesThe Group’s principal financial instruments, other than derivatives, comprise certificates of deposit issued and
cash and short term deposits. The main purpose of these financial instruments is to raise finance for the Group’s
operations. The Group has various other financial assets such as trade bills, held-to-maturity investments, loans
and advances and receivables, available-for-sale financial assets and financial assets designated at fair value
through profit or loss, which arise directly from its operations.
The Group also enters into derivative transactions, including principally interest rate swaps and forward currency
contracts held for trading. The purpose is to manage or mitigate interest rate risk and currency risk arising from
the Group’s operations.
The main risks arising from the Group’s financial instruments are market risk, credit risk, liquidity risk and
operational risk. The Board reviews and approves policies for managing each of these risks and they are
summarised below.
Risk managementThe Group has established systems, policies and procedures for the control and monitoring of interest rate,
foreign currency price, credit, liquidity, capital, market and operational risks, which are approved and endorsed
by the Board and reviewed regularly by the Group’s management, Credit Risk Management Committee, Credit
Committee, Assets and Liabilities Management Committee (“ALCO”), Operational Risk Management Committee
and other designated committees or working groups. Material risks are identified and assessed by designated
committees and/or working groups before the launch of new products or business activities, and are monitored,
documented and controlled against applicable risk limits after the introduction of new products or services or
implementation of new business activities. Internal auditors of the Bank also perform regular audits to ensure
compliance with the policies and procedures.
95 Public Bank (Hong Kong) Limited Annual Report 2013
40. Financial Risk Management Objectives and Policies (Continued)Market risk management(a) Interest rate risk
Interest rate risk is the risk that the Group’s position may be adversely affected by a change of market
interest rates. The Group’s interest rate risk arises primarily from the timing difference in the maturity
and the repricing of the Group’s interest-bearing assets, liabilities and off-balance sheet commitments.
The primary objective of interest rate risk management is to limit the potential adverse effects of interest
rate movements in net interest income by closely monitoring the net repricing gap of the Group’s assets
and liabilities. Interest rate risk is daily managed by the Group’s Treasury Department and monitored
and measured by the respective ALCO of the Bank and Public Finance against limits approved by the
respective Boards.
Interest rate risk exposures in the banking book:
The relevant interest rate risk arises from repricing risk and basis risk.
Repricing risk is one of the sources of interest rate risk which arises from timing differences in interest rate
changes and cash flows that occur in the repricing and maturity of fixed and floating rate assets, liabilities
and off-balance sheet financial instruments. Should the interest rate increase/decrease by 200 basis points
and the positive net interest gap be HK$2,507 million (2012: HK$3,692 million) up to 12 months in 2013,
profit before tax in 2013 would increase/decrease by HK$84 million or 1.71% of equity (2012: HK$92
million or 1.75% of equity). Profit before tax would increase/decrease by HK$49 million or 1.01% of equity
(2012: HK$86 million or 1.64% of equity) for the next 12 months after the reporting date.
Based on the positive net interest gap of HK$4,505 million (2012: HK$5,244 million) up to five years, the
economic value would increase by HK$84 million (2012: HK$52 million).
Basis risk is one of the sources of interest rate risk which arises from the difference in the changes of
interest rates earned and paid on different financial instruments with similar repricing characteristics. The
Group adopts two stress-testing scenarios for the sensitivity analysis:
(i) Interest rates on managed-rate assets would decrease by 200 basis points whilst interest rates on
other interest-bearing assets and interest-bearing liabilities would be kept unchanged. Based on
this scenario assumption, profit before tax would decrease by HK$278 million or 5.69% of equity
(2012: HK$244 million or 4.65% of equity) for the year ended 31 December 2013. Profit before tax
would decrease by HK$292 million or 5.97% of equity (2012: HK$273 million or 5.20% of equity)
for the next 12 months after the reporting date.
(ii) Interest rates on interest-bearing assets and liabilities, except for interest rates on fixed rate assets
and managed-rate assets, would increase by 200 basis points. Based on this scenario assumption,
profit before tax would decrease by HK$352 million or 7.19% of equity (2012: HK$330 million
or 6.29% of equity) for the year ended 31 December 2013. Profit before tax would decrease by
HK$387 million or 7.90% of equity (2012: HK$342 million or 6.52% of equity) for the next 12
months after the reporting date.
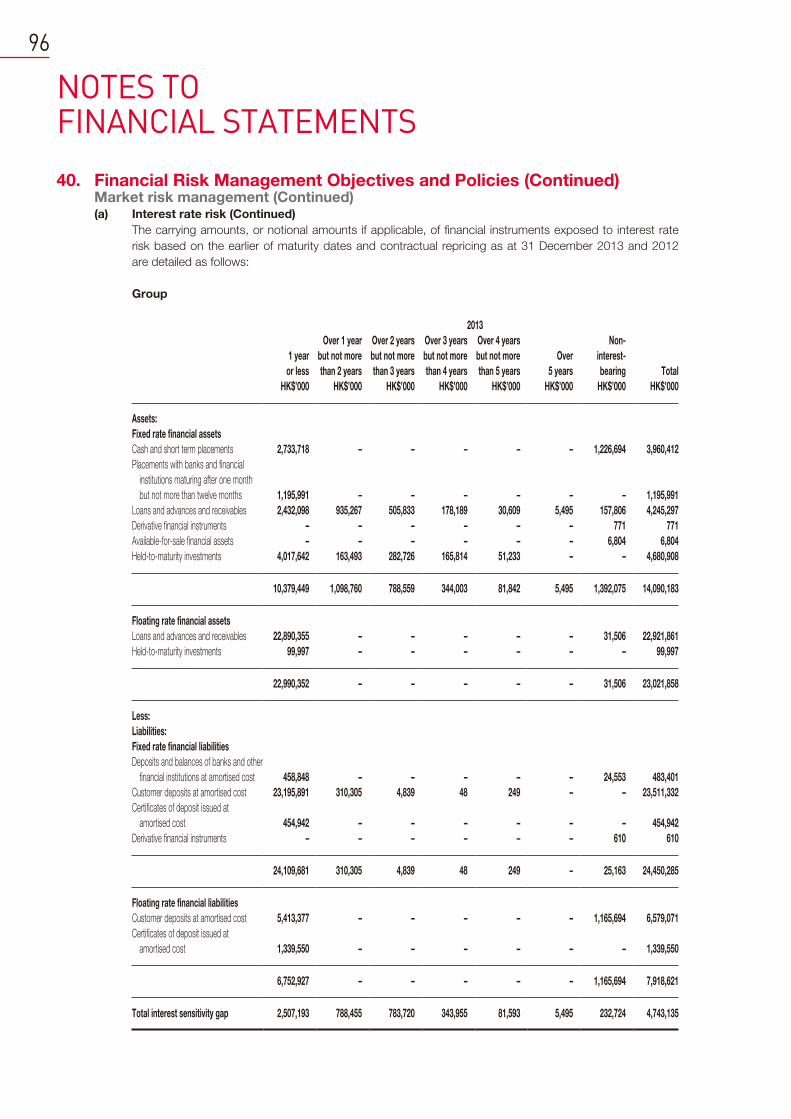
NOTES TO FINANCIAL STATEMENTS
96
40. Financial Risk Management Objectives and Policies (Continued)Market risk management (Continued)(a) Interest rate risk (Continued)
The carrying amounts, or notional amounts if applicable, of financial instruments exposed to interest rate
risk based on the earlier of maturity dates and contractual repricing as at 31 December 2013 and 2012
are detailed as follows:
Group
2013
1 year
or less
Over 1 year
but not more
than 2 years
Over 2 years
but not more
than 3 years
Over 3 years
but not more
than 4 years
Over 4 years
but not more
than 5 years
Over
5 years
Non-
interest-
bearing Total
HK$’000 HK$’000 HK$’000 HK$’000 HK$’000 HK$’000 HK$’000 HK$’000
Assets:
Fixed rate financial assets
Cash and short term placements 2,733,718 – – – – – 1,226,694 3,960,412
Placements with banks and financial
institutions maturing after one month
but not more than twelve months 1,195,991 – – – – – – 1,195,991
Loans and advances and receivables 2,432,098 935,267 505,833 178,189 30,609 5,495 157,806 4,245,297
Derivative financial instruments – – – – – – 771 771
Available-for-sale financial assets – – – – – – 6,804 6,804
Held-to-maturity investments 4,017,642 163,493 282,726 165,814 51,233 – – 4,680,908
10,379,449 1,098,760 788,559 344,003 81,842 5,495 1,392,075 14,090,183
Floating rate financial assets
Loans and advances and receivables 22,890,355 – – – – – 31,506 22,921,861
Held-to-maturity investments 99,997 – – – – – – 99,997
22,990,352 – – – – – 31,506 23,021,858
Less:
Liabilities:
Fixed rate financial liabilities
Deposits and balances of banks and other
financial institutions at amortised cost 458,848 – – – – – 24,553 483,401
Customer deposits at amortised cost 23,195,891 310,305 4,839 48 249 – – 23,511,332
Certificates of deposit issued at
amortised cost 454,942 – – – – – – 454,942
Derivative financial instruments – – – – – – 610 610
24,109,681 310,305 4,839 48 249 – 25,163 24,450,285
Floating rate financial liabilities
Customer deposits at amortised cost 5,413,377 – – – – – 1,165,694 6,579,071
Certificates of deposit issued at
amortised cost 1,339,550 – – – – – – 1,339,550
6,752,927 – – – – – 1,165,694 7,918,621
Total interest sensitivity gap 2,507,193 788,455 783,720 343,955 81,593 5,495 232,724 4,743,135
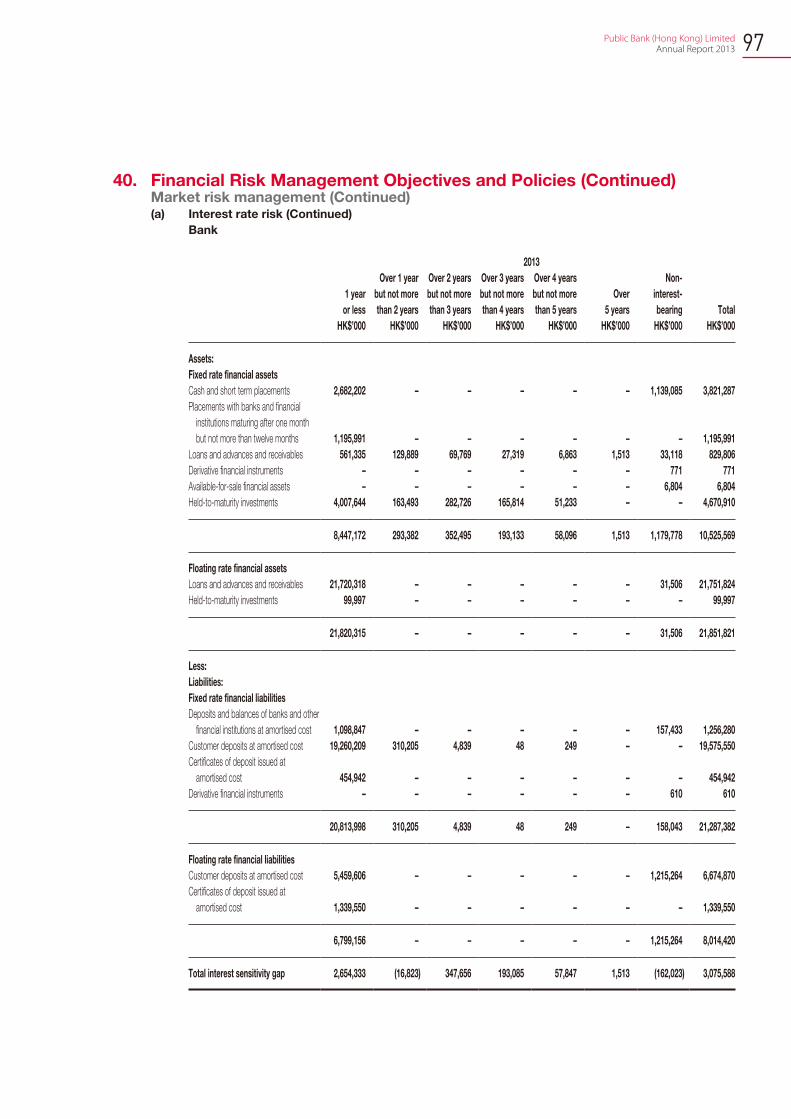
97 Public Bank (Hong Kong) Limited Annual Report 2013
40. Financial Risk Management Objectives and Policies (Continued)Market risk management (Continued)(a) Interest rate risk (Continued)
Bank
2013
1 year
or less
Over 1 year
but not more
than 2 years
Over 2 years
but not more
than 3 years
Over 3 years
but not more
than 4 years
Over 4 years
but not more
than 5 years
Over
5 years
Non-
interest-
bearing Total
HK$’000 HK$’000 HK$’000 HK$’000 HK$’000 HK$’000 HK$’000 HK$’000
Assets:
Fixed rate financial assets
Cash and short term placements 2,682,202 – – – – – 1,139,085 3,821,287
Placements with banks and financial
institutions maturing after one month
but not more than twelve months 1,195,991 – – – – – – 1,195,991
Loans and advances and receivables 561,335 129,889 69,769 27,319 6,863 1,513 33,118 829,806
Derivative financial instruments – – – – – – 771 771
Available-for-sale financial assets – – – – – – 6,804 6,804
Held-to-maturity investments 4,007,644 163,493 282,726 165,814 51,233 – – 4,670,910
8,447,172 293,382 352,495 193,133 58,096 1,513 1,179,778 10,525,569
Floating rate financial assets
Loans and advances and receivables 21,720,318 – – – – – 31,506 21,751,824
Held-to-maturity investments 99,997 – – – – – – 99,997
21,820,315 – – – – – 31,506 21,851,821
Less:
Liabilities:
Fixed rate financial liabilities
Deposits and balances of banks and other
financial institutions at amortised cost 1,098,847 – – – – – 157,433 1,256,280
Customer deposits at amortised cost 19,260,209 310,205 4,839 48 249 – – 19,575,550
Certificates of deposit issued at
amortised cost 454,942 – – – – – – 454,942
Derivative financial instruments – – – – – – 610 610
20,813,998 310,205 4,839 48 249 – 158,043 21,287,382
Floating rate financial liabilities
Customer deposits at amortised cost 5,459,606 – – – – – 1,215,264 6,674,870
Certificates of deposit issued at
amortised cost 1,339,550 – – – – – – 1,339,550
6,799,156 – – – – – 1,215,264 8,014,420
Total interest sensitivity gap 2,654,333 (16,823) 347,656 193,085 57,847 1,513 (162,023) 3,075,588
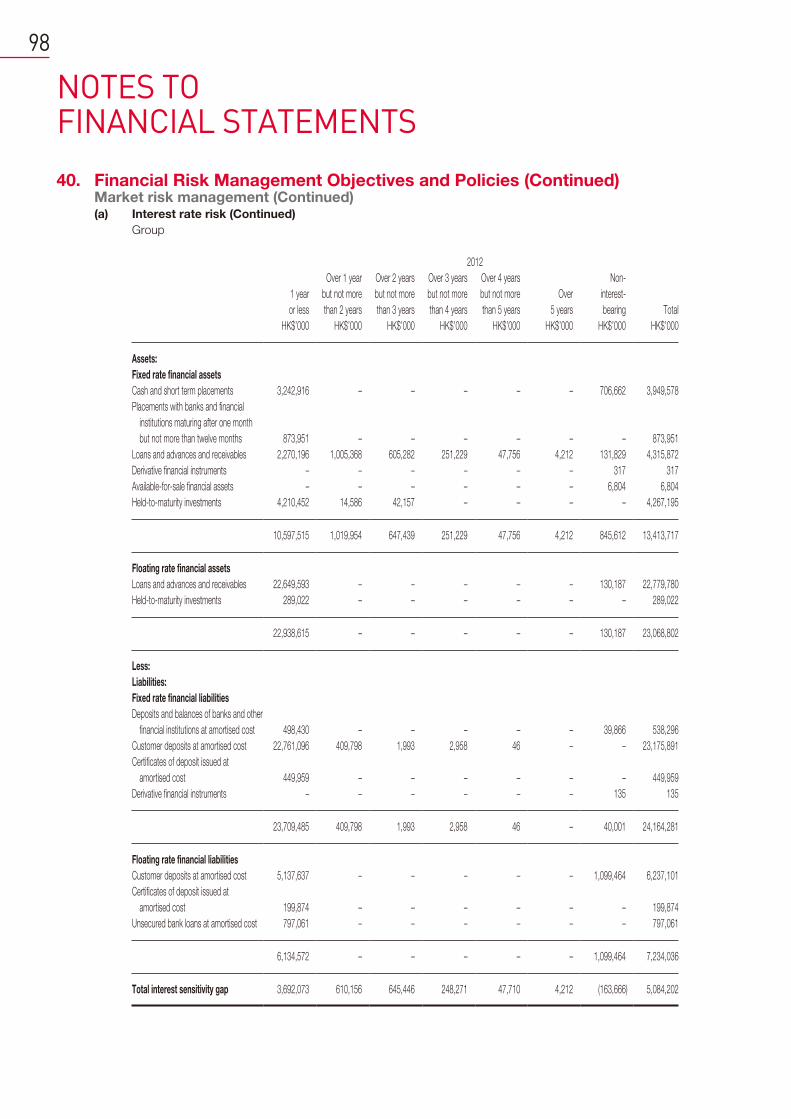
NOTES TO FINANCIAL STATEMENTS
98
40. Financial Risk Management Objectives and Policies (Continued)Market risk management (Continued)(a) Interest rate risk (Continued)
Group
2012
1 year
or less
Over 1 year
but not more
than 2 years
Over 2 years
but not more
than 3 years
Over 3 years
but not more
than 4 years
Over 4 years
but not more
than 5 years
Over
5 years
Non-
interest-
bearing Total
HK$’000 HK$’000 HK$’000 HK$’000 HK$’000 HK$’000 HK$’000 HK$’000
Assets:
Fixed rate financial assets
Cash and short term placements 3,242,916 – – – – – 706,662 3,949,578
Placements with banks and financial
institutions maturing after one month
but not more than twelve months 873,951 – – – – – – 873,951
Loans and advances and receivables 2,270,196 1,005,368 605,282 251,229 47,756 4,212 131,829 4,315,872
Derivative financial instruments – – – – – – 317 317
Available-for-sale financial assets – – – – – – 6,804 6,804
Held-to-maturity investments 4,210,452 14,586 42,157 – – – – 4,267,195
10,597,515 1,019,954 647,439 251,229 47,756 4,212 845,612 13,413,717
Floating rate financial assets
Loans and advances and receivables 22,649,593 – – – – – 130,187 22,779,780
Held-to-maturity investments 289,022 – – – – – – 289,022
22,938,615 – – – – – 130,187 23,068,802
Less:
Liabilities:
Fixed rate financial liabilities
Deposits and balances of banks and other
financial institutions at amortised cost 498,430 – – – – – 39,866 538,296
Customer deposits at amortised cost 22,761,096 409,798 1,993 2,958 46 – – 23,175,891
Certificates of deposit issued at
amortised cost 449,959 – – – – – – 449,959
Derivative financial instruments – – – – – – 135 135
23,709,485 409,798 1,993 2,958 46 – 40,001 24,164,281
Floating rate financial liabilities
Customer deposits at amortised cost 5,137,637 – – – – – 1,099,464 6,237,101
Certificates of deposit issued at
amortised cost 199,874 – – – – – – 199,874
Unsecured bank loans at amortised cost 797,061 – – – – – – 797,061
6,134,572 – – – – – 1,099,464 7,234,036
Total interest sensitivity gap 3,692,073 610,156 645,446 248,271 47,710 4,212 (163,666) 5,084,202
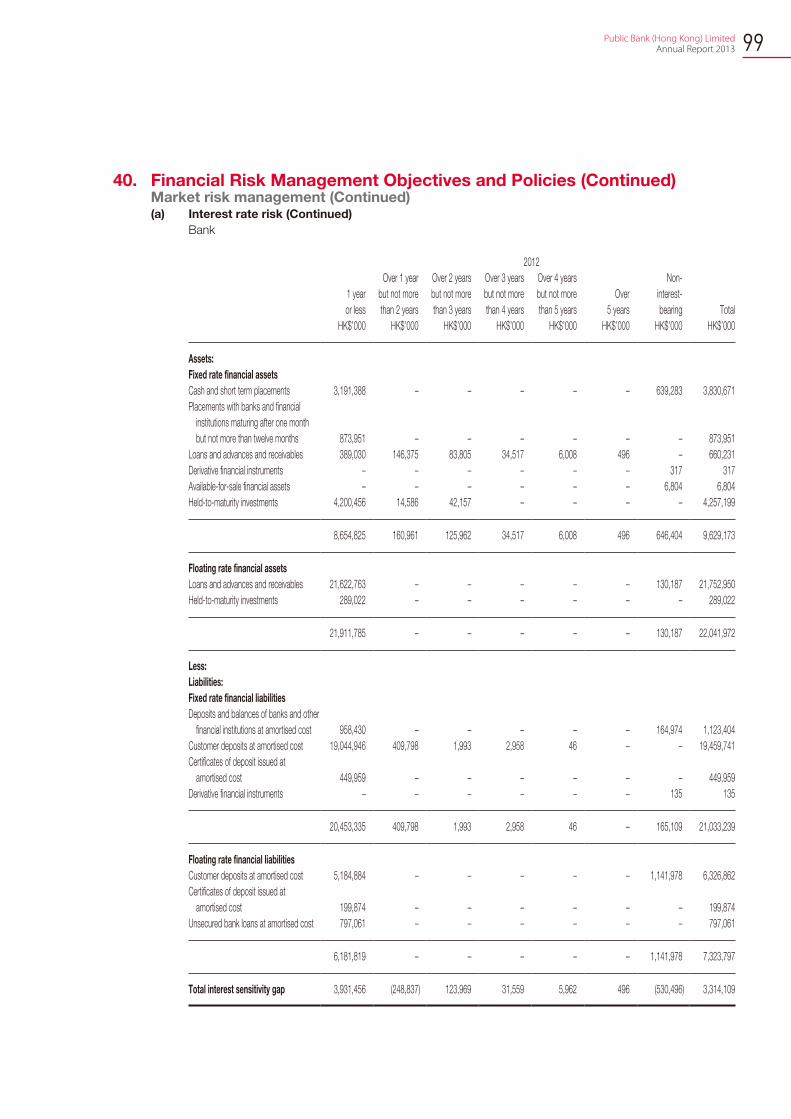
99 Public Bank (Hong Kong) Limited Annual Report 2013
40. Financial Risk Management Objectives and Policies (Continued)Market risk management (Continued)(a) Interest rate risk (Continued)
Bank
2012
1 year
or less
Over 1 year
but not more
than 2 years
Over 2 years
but not more
than 3 years
Over 3 years
but not more
than 4 years
Over 4 years
but not more
than 5 years
Over
5 years
Non-
interest-
bearing Total
HK$’000 HK$’000 HK$’000 HK$’000 HK$’000 HK$’000 HK$’000 HK$’000
Assets:
Fixed rate financial assets
Cash and short term placements 3,191,388 – – – – – 639,283 3,830,671
Placements with banks and financial
institutions maturing after one month
but not more than twelve months 873,951 – – – – – – 873,951
Loans and advances and receivables 389,030 146,375 83,805 34,517 6,008 496 – 660,231
Derivative financial instruments – – – – – – 317 317
Available-for-sale financial assets – – – – – – 6,804 6,804
Held-to-maturity investments 4,200,456 14,586 42,157 – – – – 4,257,199
8,654,825 160,961 125,962 34,517 6,008 496 646,404 9,629,173
Floating rate financial assets
Loans and advances and receivables 21,622,763 – – – – – 130,187 21,752,950
Held-to-maturity investments 289,022 – – – – – – 289,022
21,911,785 – – – – – 130,187 22,041,972
Less:
Liabilities:
Fixed rate financial liabilities
Deposits and balances of banks and other
financial institutions at amortised cost 958,430 – – – – – 164,974 1,123,404
Customer deposits at amortised cost 19,044,946 409,798 1,993 2,958 46 – – 19,459,741
Certificates of deposit issued at
amortised cost 449,959 – – – – – – 449,959
Derivative financial instruments – – – – – – 135 135
20,453,335 409,798 1,993 2,958 46 – 165,109 21,033,239
Floating rate financial liabilities
Customer deposits at amortised cost 5,184,884 – – – – – 1,141,978 6,326,862
Certificates of deposit issued at
amortised cost 199,874 – – – – – – 199,874
Unsecured bank loans at amortised cost 797,061 – – – – – – 797,061
6,181,819 – – – – – 1,141,978 7,323,797
Total interest sensitivity gap 3,931,456 (248,837) 123,969 31,559 5,962 496 (530,496) 3,314,109
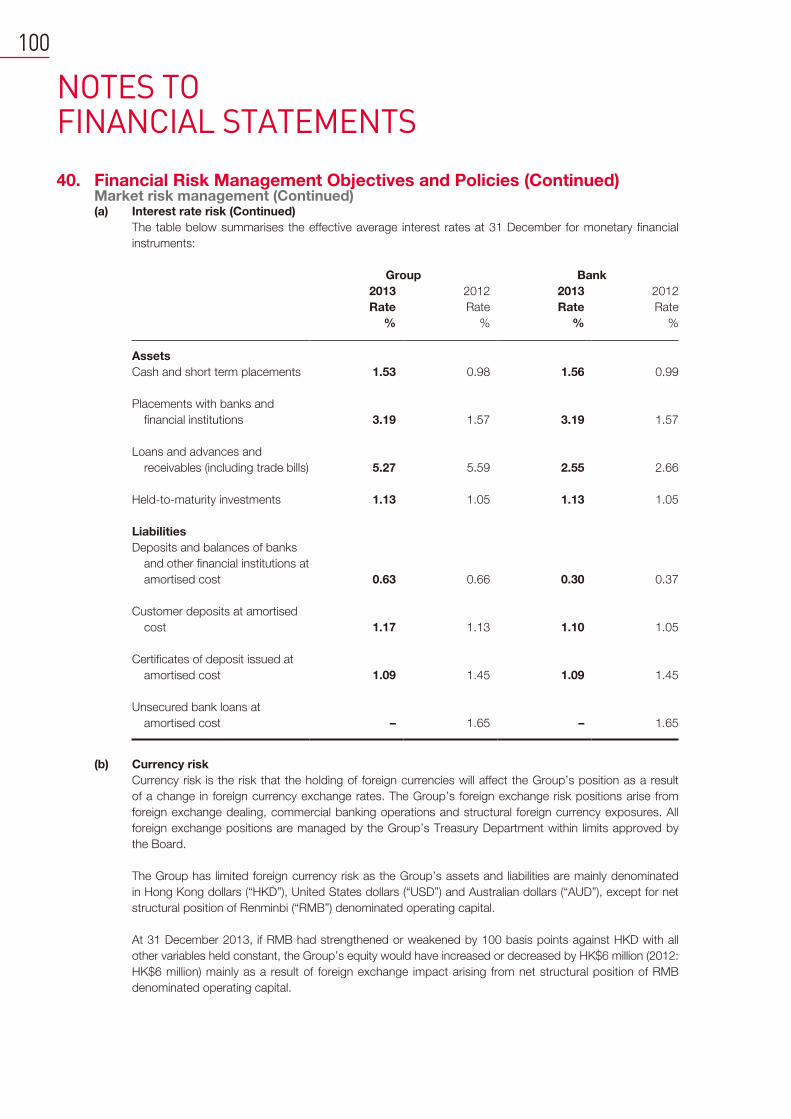
NOTES TO FINANCIAL STATEMENTS
100
40. Financial Risk Management Objectives and Policies (Continued)Market risk management (Continued)(a) Interest rate risk (Continued)
The table below summarises the effective average interest rates at 31 December for monetary financial
instruments:
Group Bank
2013 2012 2013 2012
Rate Rate Rate Rate
% % % %
Assets
Cash and short term placements 1.53 0.98 1.56 0.99
Placements with banks and
financial institutions 3.19 1.57 3.19 1.57
Loans and advances and
receivables (including trade bills) 5.27 5.59 2.55 2.66
Held-to-maturity investments 1.13 1.05 1.13 1.05
Liabilities
Deposits and balances of banks
and other financial institutions at
amortised cost 0.63 0.66 0.30 0.37
Customer deposits at amortised
cost 1.17 1.13 1.10 1.05
Certificates of deposit issued at
amortised cost 1.09 1.45 1.09 1.45
Unsecured bank loans at
amortised cost – 1.65 – 1.65
(b) Currency risk
Currency risk is the risk that the holding of foreign currencies will affect the Group’s position as a result
of a change in foreign currency exchange rates. The Group’s foreign exchange risk positions arise from
foreign exchange dealing, commercial banking operations and structural foreign currency exposures. All
foreign exchange positions are managed by the Group’s Treasury Department within limits approved by
the Board.
The Group has limited foreign currency risk as the Group’s assets and liabilities are mainly denominated
in Hong Kong dollars (“HKD”), United States dollars (“USD”) and Australian dollars (“AUD”), except for net
structural position of Renminbi (“RMB”) denominated operating capital.
At 31 December 2013, if RMB had strengthened or weakened by 100 basis points against HKD with all
other variables held constant, the Group’s equity would have increased or decreased by HK$6 million (2012:
HK$6 million) mainly as a result of foreign exchange impact arising from net structural position of RMB
denominated operating capital.
101 Public Bank (Hong Kong) Limited Annual Report 2013
40. Financial Risk Management Objectives and Policies (Continued)Market risk management (Continued)(c) Price risk
Price risk is the risk to the Group’s earnings and capital due to changes in the prices of securities,
including commodities, debt securities and equities.
The Group monitors price risk principally by limits established for transactions and open positions. These
limits are reviewed and approved by the Board and are monitored on a daily basis.
The Group did not actively trade in financial instruments and in the opinion of the Directors, the price risk
related to trading activities to which the Group was exposed was not material. Accordingly, no quantitative
market risk disclosures for price risk have been made.
Credit risk managementCredit risk is the risk that a customer or counterparty in a transaction may default. It arises from the lending, trade
finance, treasury and other activities undertaken by the Group.
The Group has a credit risk management process to measure, monitor and control credit risk. Its Credit Policy
Manual defines the credit extension and measurement criteria, the credit review, approval and monitoring
processes, and the loan classification and provisioning systems. It has a hierarchy of credit authority which
approves credit in compliance with the Group’s credit policy. Credit risk exposures are measured and monitored
against credit limits and other control limits (such as connected exposures, large exposures and risk concentration
limits set by the Credit Risk Management Committee and approved by the Board). Segregation of duties in
key credit functions is in place to ensure separate credit control and monitoring. Management and recovery of
problem credits are handled by an independent work-out team.
The Group manages its credit risk within a conservative framework. Its credit policy is regularly revised, taking
into account factors such as prevailing business and economic conditions, regulatory requirements and its
capital resources. Its policy on connected lending exposures defines and states connected parties, statutory and
applicable connected lending limits, types of connected transactions, the taking of collateral, the capital adequacy
treatment, and detailed procedures and controls for monitoring connected lending exposures. In general, interest
rates and other terms and conditions applying to connected lending should not be more favourable than those
loans offered to non-connected borrowers under similar circumstances. The terms and conditions should be
determined on normal commercial terms at arm’s length and in the ordinary course of business of the Group.
Credit and compliance audits are periodically conducted by Internal Audit Department to evaluate the
effectiveness of the credit review, approval and monitoring processes and to ensure that the established credit
policies and procedures are complied with.
Compliance Department conducts compliance test at selected business units on identified high risk areas for
adherence to regulatory and operational requirements and credit policies.
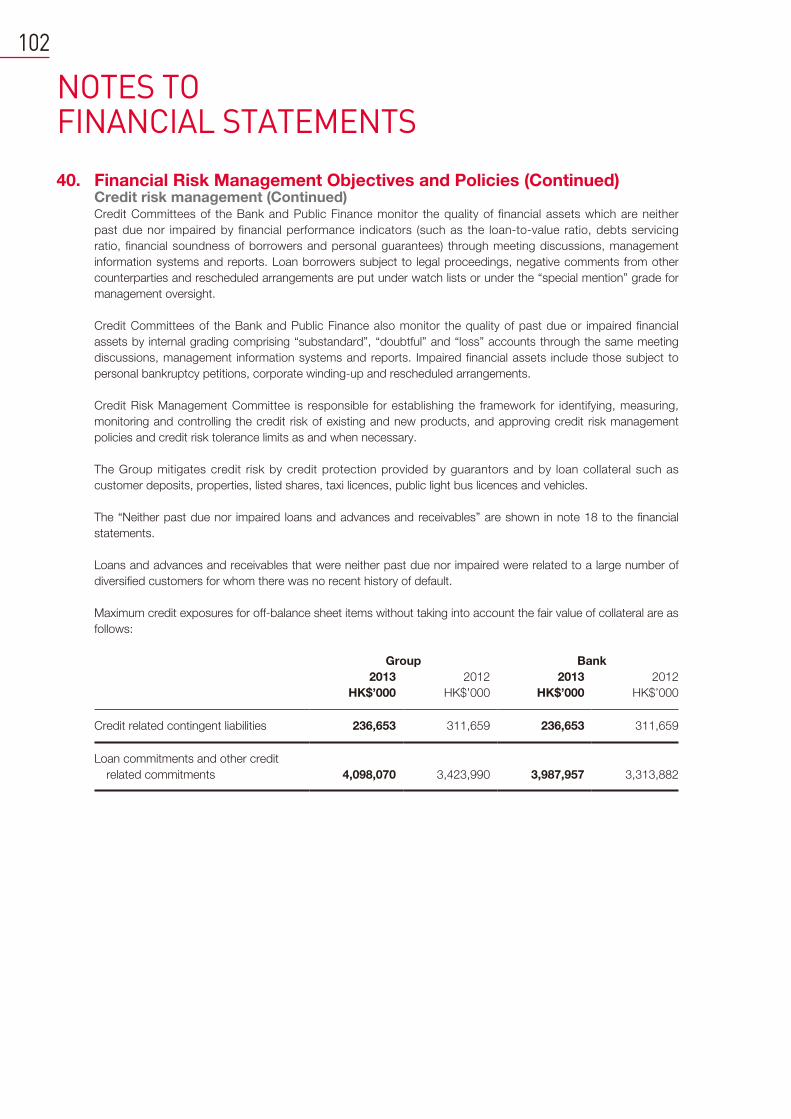
NOTES TO FINANCIAL STATEMENTS
102
40. Financial Risk Management Objectives and Policies (Continued)Credit risk management (Continued)Credit Committees of the Bank and Public Finance monitor the quality of financial assets which are neither
past due nor impaired by financial performance indicators (such as the loan-to-value ratio, debts servicing
ratio, financial soundness of borrowers and personal guarantees) through meeting discussions, management
information systems and reports. Loan borrowers subject to legal proceedings, negative comments from other
counterparties and rescheduled arrangements are put under watch lists or under the “special mention” grade for
management oversight.
Credit Committees of the Bank and Public Finance also monitor the quality of past due or impaired financial
assets by internal grading comprising “substandard”, “doubtful” and “loss” accounts through the same meeting
discussions, management information systems and reports. Impaired financial assets include those subject to
personal bankruptcy petitions, corporate winding-up and rescheduled arrangements.
Credit Risk Management Committee is responsible for establishing the framework for identifying, measuring,
monitoring and controlling the credit risk of existing and new products, and approving credit risk management
policies and credit risk tolerance limits as and when necessary.
The Group mitigates credit risk by credit protection provided by guarantors and by loan collateral such as
customer deposits, properties, listed shares, taxi licences, public light bus licences and vehicles.
The “Neither past due nor impaired loans and advances and receivables” are shown in note 18 to the financial
statements.
Loans and advances and receivables that were neither past due nor impaired were related to a large number of
diversified customers for whom there was no recent history of default.
Maximum credit exposures for off-balance sheet items without taking into account the fair value of collateral are as
follows:
Group Bank
2013 2012 2013 2012
HK$’000 HK$’000 HK$’000 HK$’000
Credit related contingent liabilities 236,653 311,659 236,653 311,659
Loan commitments and other credit
related commitments 4,098,070 3,423,990 3,987,957 3,313,882

103 Public Bank (Hong Kong) Limited Annual Report 2013
40. Financial Risk Management Objectives and Policies (Continued)Liquidity risk managementLiquidity risk is the risk that the Group cannot meet its current obligations. Major sources of liquidity risk of the
Group are the early or unexpected withdrawals of deposits in cash outflow and the delay in cash inflow from loan
repayments. To manage liquidity risk, the Group has established a liquidity risk management framework which
incorporates liquidity risk related policies and procedures, risk related metrics and tools, risk related assumptions,
and the manner of reporting significant matters. The major objectives of liquidity risk management framework are
to identify, measure and control liquidity risk exposures with proper implementation of funding strategies and with
reporting of significant risk related matters to management. Liquidity risk related policies are reviewed by senior
management and dedicated committees, and significant changes in such policies are approved by the Board
or committees delegated by the Board. The Board is responsible for exercising management oversight over the
liquidity risk management framework of the Group.
ALCO of the Bank and Public Finance monitor the liquidity position as part of the ongoing management of
assets and liabilities, and set up trigger limits to monitor liquidity risk. They also closely monitor the liquidity of
the subsidiaries on a periodic basis to ensure that the liquidity structure of the subsidiaries’ assets, liabilities and
commitments can meet their funding needs, and that internal liquidity trigger limits are complied with.
Treasury Department of the Bank and a dedicated department of Public Finance are responsible for carrying out
the strategies and policies approved by the dedicated committees and the Board, and to develop operational
procedures and controls to ensure the compliance with the aforesaid policies and to minimise operational
disruptions in case of a liquidity crisis.
Risk Management Team of the Group is responsible for day-to-day monitoring of liquidity ratio, loans to deposits
ratios, concentration related ratios and other liquidity risk related ratios coupled with the use of cash flow
projections, maturity ladder, stress-testing methodologies and other applicable risk assessment tools and metrics
to detect early warning signals and identify vulnerabilities to potential liquidity risk on forward-looking basis with
the objective of ensuring different types of liquidity risks of the Bank are appropriately identified, measured,
assessed and reported. The Risk Management Team carries out analysis based on risk-based MIS reports,
summarises the data from those reports and presents the key information to the ALCO on a regular (at least
monthly) basis. In case of significant issues, such as serious limit excesses or breaches or early warning signals
of potential severe impact on the Bank, are identified from aforesaid MIS reports or market information obtained
from Treasury Department and other business units, a designated ALCO member will convene a meeting (involving
senior management members) to discuss risk related matters and propose actions to the ALCO whenever
necessary. A high level summary of the Bank’s liquidity risk performance will then be presented by the ALCO to
Risk Management Committee and the Board.
The examples of liquidity risk related metrics of the Bank and Public Finance include internal minimum liquidity
ratio of 30% and an internal trigger point of liquidity ratio which is higher than the aforesaid minimum liquidity ratio;
cash flow mismatches under normal and different stressed scenarios; concentration related limits such as top ten
deposits as a percentage of total deposits and the reliance of banking facilities, and maturity profile of major assets
and liabilities (including on-and-off-balance sheet items).

NOTES TO FINANCIAL STATEMENTS
104
40. Financial Risk Management Objectives and Policies (Continued)Liquidity risk management (Continued)The funding strategies of the Group are to (i) diversify funding sources for containing liquidity risk exposures,
(ii) minimise disruptions due to operational issues such as transfer of liquidity across group entities, (iii) ensure
contingency funding is available to the Group; and (iv) maintain sufficient liquidity cushion to meet critical liquidity
needs such as loan commitments and deposits’ withdrawals in stressed situations. For illustration, concentration
of funding sources such as intra-group funding limits are set to reduce reliance on single source of funding.
Contingency funding plan is formulated to address liquidity needs under different stages including the mechanism
for the detection of early warning signals of potential crisis at early stage and obtaining of emergent funding in
bank-run scenario at later stage. Designated roles and responsibilities of Crisis Management Team, departments
and business units and their emergency contact information are documented clearly in contingency funding plan
policy as part of business continuity planning, and contingency funding measures are in place to set priorities of
funding arrangements with counterparties, to set procedures for intraday liquidity risk management and intragroup
funding support, to manage media relationship and to communicate with internal and external parties during a
liquidity crisis. The stress-testing results are updated and reported to senior management regularly and the results
such as survival period for positive cashflow mismatches are used in contingency funding planning. Standby
facilities and liquid assets are maintained to provide liquidity to meet unexpected and material cash outflows in
stressed situations.
The Group maintains sufficient liquidity cushion comprising mainly bills, notes or bonds issued by eligible central
governments in total amount not less than HK$1 billion to address critical and emergent liquidity needs on intraday
basis and over other different time horizons. The Group is not subject to particular collateral arrangements or
requirements in contracts if there is a credit rating downgrade of entities within the Group.
Apart from cash flow projections under normal scenario to manage liquidity under different time horizons, different
stressed scenarios such as institution-specific scenario, market crisis scenario and the combination of such
scenarios (“combined scenario”) with assumptions are set and reviewed by dedicated committees and approved
by the Board. For instance, in institution-specific scenario, loan repayments from some customers are assumed
to be delayed. The projected cash inflow would be reduced by the amount of rollover of banking facilities by
some corporate customers. Core deposits ratio would decrease and there would be early withdrawals of some
fixed deposits before contractual maturity dates. In market crisis scenario, some undrawn banking facilities are
not to honored upon drawdown as a portion of bank counterparties will not have sufficient liquidity to honor their
obligations in market. The Group may pledge or liquidate its liquid assets such as debt securities (including but
not limited to treasury bills or notes issued by eligible central governments) to secure funding to address potential
liquidity crisis. Liquidity stress-tests are conducted regularly (at least monthly) and the results are utilised for part
of contingency funding plan or for providing insights to management about latest liquidity positions of the Group.
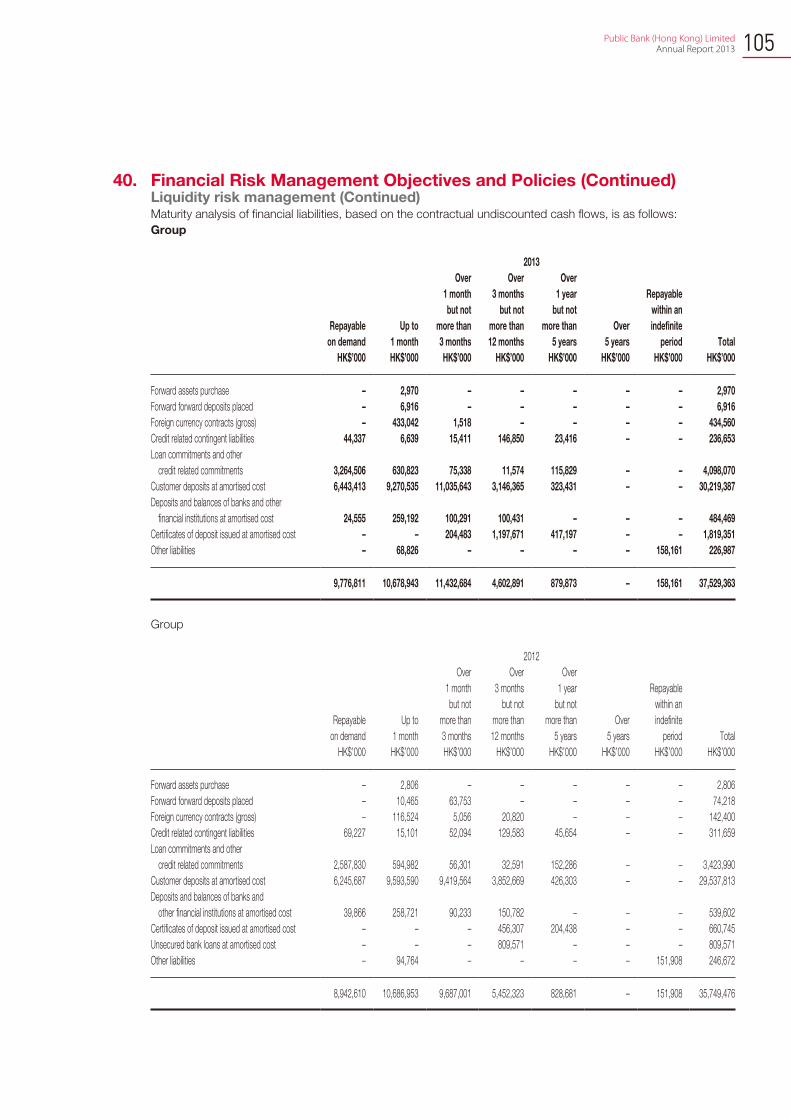
105 Public Bank (Hong Kong) Limited Annual Report 2013
40. Financial Risk Management Objectives and Policies (Continued)Liquidity risk management (Continued)Maturity analysis of financial liabilities, based on the contractual undiscounted cash flows, is as follows:
Group
2013
Repayable
on demand
Up to
1 month
Over
1 month
but not
more than
3 months
Over
3 months
but not
more than
12 months
Over
1 year
but not
more than
5 years
Over
5 years
Repayable
within an
indefinite
period Total
HK$’000 HK$’000 HK$’000 HK$’000 HK$’000 HK$’000 HK$’000 HK$’000
Forward assets purchase – 2,970 – – – – – 2,970
Forward forward deposits placed – 6,916 – – – – – 6,916
Foreign currency contracts (gross) – 433,042 1,518 – – – – 434,560
Credit related contingent liabilities 44,337 6,639 15,411 146,850 23,416 – – 236,653
Loan commitments and other
credit related commitments 3,264,506 630,823 75,338 11,574 115,829 – – 4,098,070
Customer deposits at amortised cost 6,443,413 9,270,535 11,035,643 3,146,365 323,431 – – 30,219,387
Deposits and balances of banks and other
financial institutions at amortised cost 24,555 259,192 100,291 100,431 – – – 484,469
Certificates of deposit issued at amortised cost – – 204,483 1,197,671 417,197 – – 1,819,351
Other liabilities – 68,826 – – – – 158,161 226,987
9,776,811 10,678,943 11,432,684 4,602,891 879,873 – 158,161 37,529,363
Group
2012
Repayable
on demand
Up to
1 month
Over
1 month
but not
more than
3 months
Over
3 months
but not
more than
12 months
Over
1 year
but not
more than
5 years
Over
5 years
Repayable
within an
indefinite
period Total
HK$’000 HK$’000 HK$’000 HK$’000 HK$’000 HK$’000 HK$’000 HK$’000
Forward assets purchase – 2,806 – – – – – 2,806
Forward forward deposits placed – 10,465 63,753 – – – – 74,218
Foreign currency contracts (gross) – 116,524 5,056 20,820 – – – 142,400
Credit related contingent liabilities 69,227 15,101 52,094 129,583 45,654 – – 311,659
Loan commitments and other
credit related commitments 2,587,830 594,982 56,301 32,591 152,286 – – 3,423,990
Customer deposits at amortised cost 6,245,687 9,593,590 9,419,564 3,852,669 426,303 – – 29,537,813
Deposits and balances of banks and
other financial institutions at amortised cost 39,866 258,721 90,233 150,782 – – – 539,602
Certificates of deposit issued at amortised cost – – – 456,307 204,438 – – 660,745
Unsecured bank loans at amortised cost – – – 809,571 – – – 809,571
Other liabilities – 94,764 – – – – 151,908 246,672
8,942,610 10,686,953 9,687,001 5,452,323 828,681 – 151,908 35,749,476
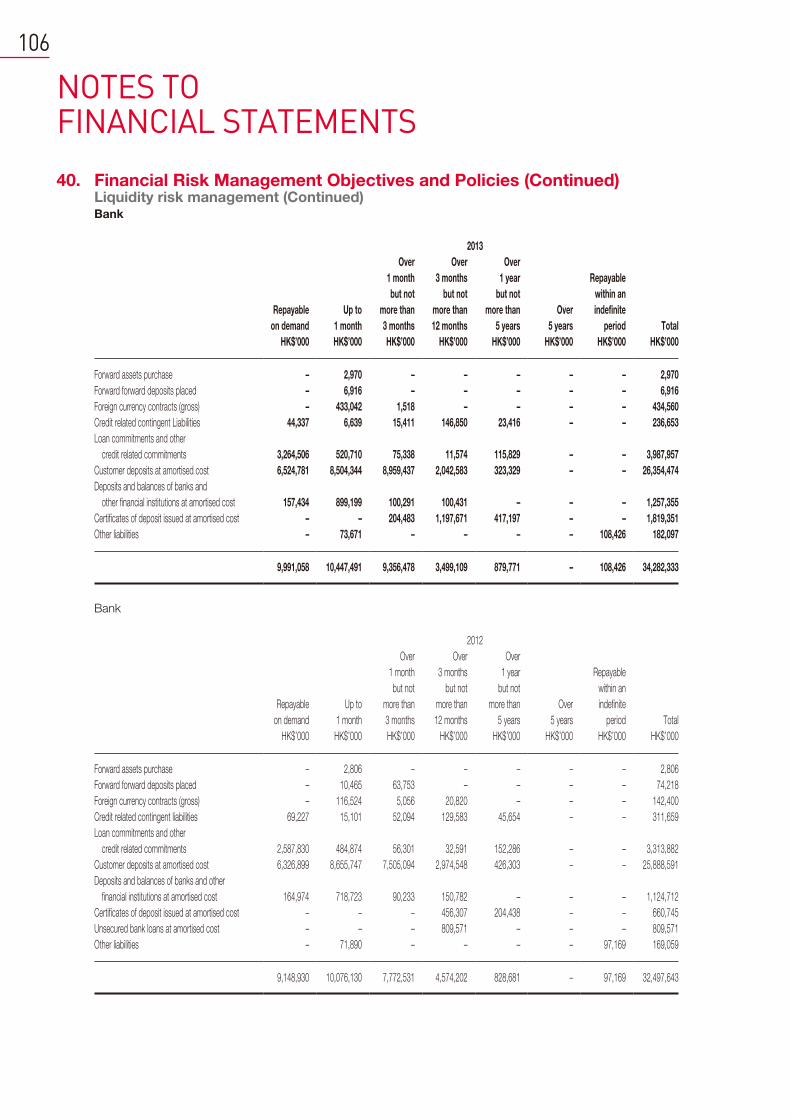
NOTES TO FINANCIAL STATEMENTS
106
40. Financial Risk Management Objectives and Policies (Continued)Liquidity risk management (Continued)Bank
2013
Repayable
on demand
Up to
1 month
Over
1 month
but not
more than
3 months
Over
3 months
but not
more than
12 months
Over
1 year
but not
more than
5 years
Over
5 years
Repayable
within an
indefinite
period Total
HK$’000 HK$’000 HK$’000 HK$’000 HK$’000 HK$’000 HK$’000 HK$’000
Forward assets purchase – 2,970 – – – – – 2,970
Forward forward deposits placed – 6,916 – – – – – 6,916
Foreign currency contracts (gross) – 433,042 1,518 – – – – 434,560
Credit related contingent Liabilities 44,337 6,639 15,411 146,850 23,416 – – 236,653
Loan commitments and other
credit related commitments 3,264,506 520,710 75,338 11,574 115,829 – – 3,987,957
Customer deposits at amortised cost 6,524,781 8,504,344 8,959,437 2,042,583 323,329 – – 26,354,474
Deposits and balances of banks and
other financial institutions at amortised cost 157,434 899,199 100,291 100,431 – – – 1,257,355
Certificates of deposit issued at amortised cost – – 204,483 1,197,671 417,197 – – 1,819,351
Other liabilities – 73,671 – – – – 108,426 182,097
9,991,058 10,447,491 9,356,478 3,499,109 879,771 – 108,426 34,282,333
Bank
2012
Repayable
on demand
Up to
1 month
Over
1 month
but not
more than
3 months
Over
3 months
but not
more than
12 months
Over
1 year
but not
more than
5 years
Over
5 years
Repayable
within an
indefinite
period Total
HK$’000 HK$’000 HK$’000 HK$’000 HK$’000 HK$’000 HK$’000 HK$’000
Forward assets purchase – 2,806 – – – – – 2,806
Forward forward deposits placed – 10,465 63,753 – – – – 74,218
Foreign currency contracts (gross) – 116,524 5,056 20,820 – – – 142,400
Credit related contingent liabilities 69,227 15,101 52,094 129,583 45,654 – – 311,659
Loan commitments and other
credit related commitments 2,587,830 484,874 56,301 32,591 152,286 – – 3,313,882
Customer deposits at amortised cost 6,326,899 8,655,747 7,505,094 2,974,548 426,303 – – 25,888,591
Deposits and balances of banks and other
financial institutions at amortised cost 164,974 718,723 90,233 150,782 – – – 1,124,712
Certificates of deposit issued at amortised cost – – – 456,307 204,438 – – 660,745
Unsecured bank loans at amortised cost – – – 809,571 – – – 809,571
Other liabilities – 71,890 – – – – 97,169 169,059
9,148,930 10,076,130 7,772,531 4,574,202 828,681 – 97,169 32,497,643
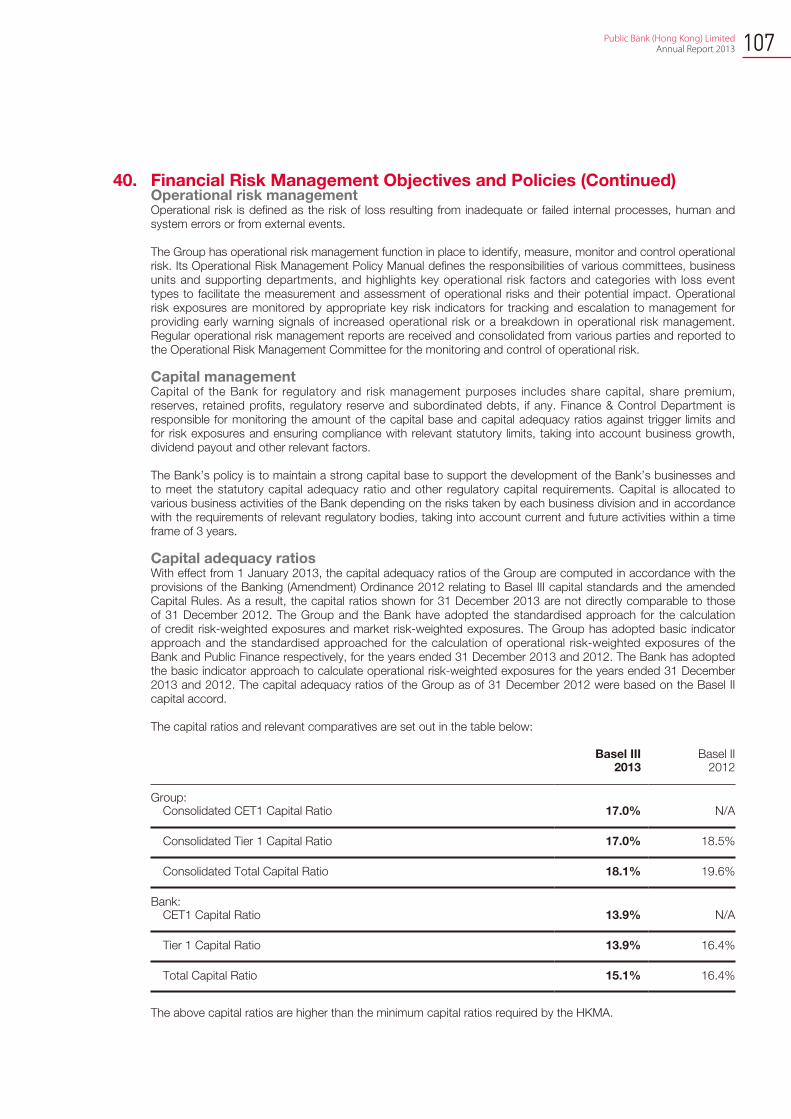
107 Public Bank (Hong Kong) Limited Annual Report 2013
40. Financial Risk Management Objectives and Policies (Continued)Operational risk managementOperational risk is defined as the risk of loss resulting from inadequate or failed internal processes, human and system errors or from external events.
The Group has operational risk management function in place to identify, measure, monitor and control operational risk. Its Operational Risk Management Policy Manual defines the responsibilities of various committees, business units and supporting departments, and highlights key operational risk factors and categories with loss event types to facilitate the measurement and assessment of operational risks and their potential impact. Operational risk exposures are monitored by appropriate key risk indicators for tracking and escalation to management for providing early warning signals of increased operational risk or a breakdown in operational risk management. Regular operational risk management reports are received and consolidated from various parties and reported to the Operational Risk Management Committee for the monitoring and control of operational risk.
Capital managementCapital of the Bank for regulatory and risk management purposes includes share capital, share premium, reserves, retained profits, regulatory reserve and subordinated debts, if any. Finance & Control Department is responsible for monitoring the amount of the capital base and capital adequacy ratios against trigger limits and for risk exposures and ensuring compliance with relevant statutory limits, taking into account business growth, dividend payout and other relevant factors.
The Bank’s policy is to maintain a strong capital base to support the development of the Bank’s businesses and to meet the statutory capital adequacy ratio and other regulatory capital requirements. Capital is allocated to various business activities of the Bank depending on the risks taken by each business division and in accordance with the requirements of relevant regulatory bodies, taking into account current and future activities within a time frame of 3 years.
Capital adequacy ratiosWith effect from 1 January 2013, the capital adequacy ratios of the Group are computed in accordance with the provisions of the Banking (Amendment) Ordinance 2012 relating to Basel III capital standards and the amended Capital Rules. As a result, the capital ratios shown for 31 December 2013 are not directly comparable to those of 31 December 2012. The Group and the Bank have adopted the standardised approach for the calculation of credit risk-weighted exposures and market risk-weighted exposures. The Group has adopted basic indicator approach and the standardised approached for the calculation of operational risk-weighted exposures of the Bank and Public Finance respectively, for the years ended 31 December 2013 and 2012. The Bank has adopted the basic indicator approach to calculate operational risk-weighted exposures for the years ended 31 December 2013 and 2012. The capital adequacy ratios of the Group as of 31 December 2012 were based on the Basel II capital accord.
The capital ratios and relevant comparatives are set out in the table below:
Basel III Basel II2013 2012
Group:Consolidated CET1 Capital Ratio 17.0% N/A
Consolidated Tier 1 Capital Ratio 17.0% 18.5%
Consolidated Total Capital Ratio 18.1% 19.6%
Bank:CET1 Capital Ratio 13.9% N/A
Tier 1 Capital Ratio 13.9% 16.4%
Total Capital Ratio 15.1% 16.4%
The above capital ratios are higher than the minimum capital ratios required by the HKMA.
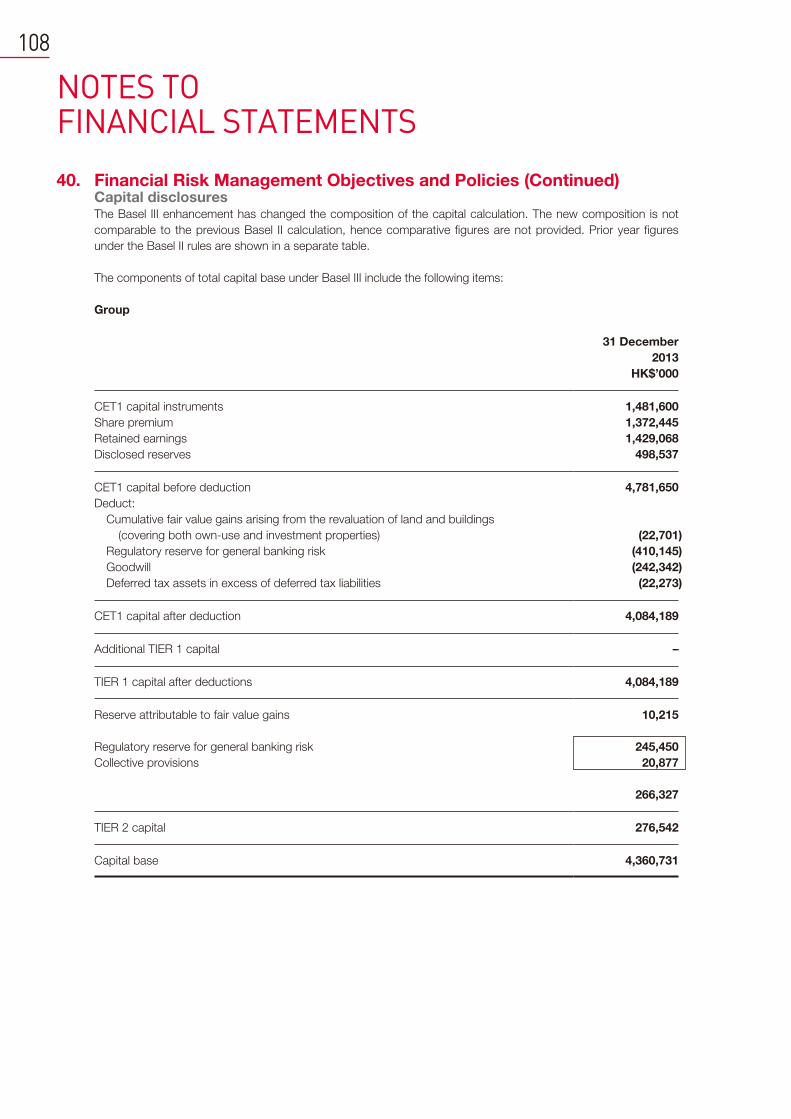
NOTES TO FINANCIAL STATEMENTS
108
40. Financial Risk Management Objectives and Policies (Continued)Capital disclosuresThe Basel III enhancement has changed the composition of the capital calculation. The new composition is not
comparable to the previous Basel II calculation, hence comparative figures are not provided. Prior year figures
under the Basel II rules are shown in a separate table.
The components of total capital base under Basel III include the following items:
Group
31 December
2013
HK$’000
CET1 capital instruments 1,481,600
Share premium 1,372,445
Retained earnings 1,429,068
Disclosed reserves 498,537
CET1 capital before deduction 4,781,650
Deduct:
Cumulative fair value gains arising from the revaluation of land and buildings
(covering both own-use and investment properties) (22,701)
Regulatory reserve for general banking risk (410,145)
Goodwill (242,342)
Deferred tax assets in excess of deferred tax liabilities (22,273)
CET1 capital after deduction 4,084,189
Additional TIER 1 capital –
TIER 1 capital after deductions 4,084,189
Reserve attributable to fair value gains 10,215
Regulatory reserve for general banking risk 245,450
Collective provisions 20,877
266,327
TIER 2 capital 276,542
Capital base 4,360,731
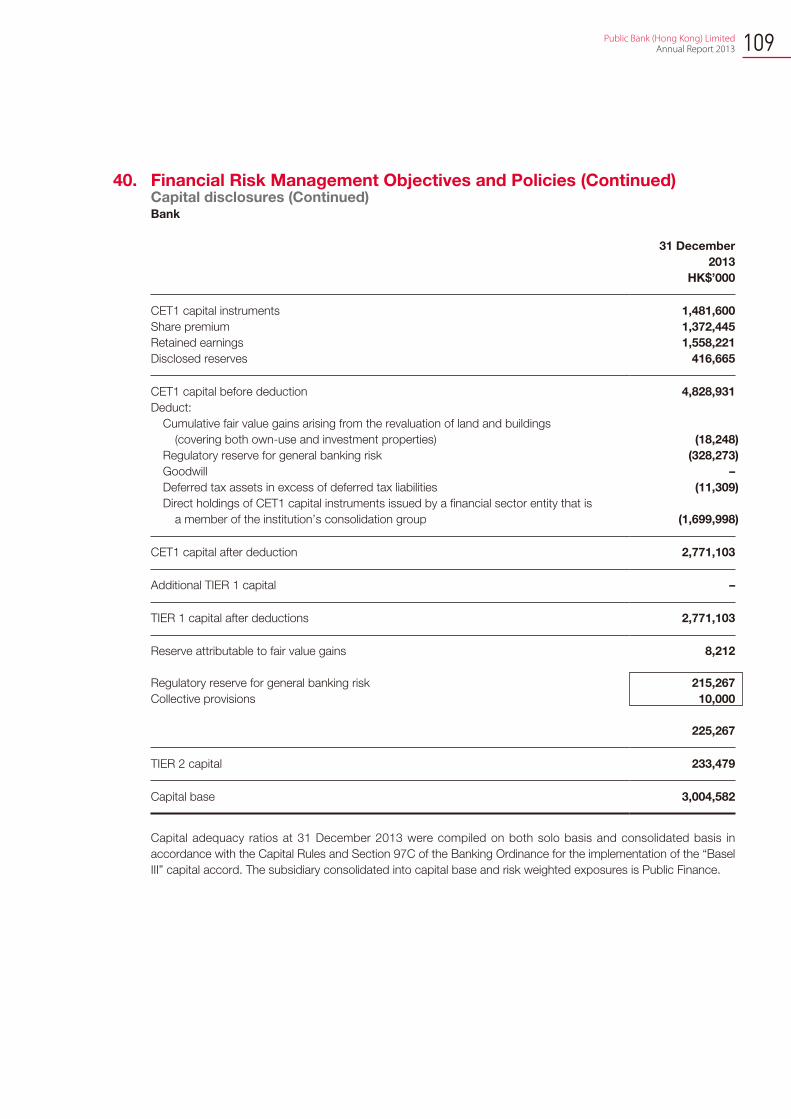
109 Public Bank (Hong Kong) Limited Annual Report 2013
40. Financial Risk Management Objectives and Policies (Continued)Capital disclosures (Continued)Bank
31 December
2013
HK$’000
CET1 capital instruments 1,481,600
Share premium 1,372,445
Retained earnings 1,558,221
Disclosed reserves 416,665
CET1 capital before deduction 4,828,931
Deduct:
Cumulative fair value gains arising from the revaluation of land and buildings
(covering both own-use and investment properties) (18,248)
Regulatory reserve for general banking risk (328,273)
Goodwill –
Deferred tax assets in excess of deferred tax liabilities (11,309)
Direct holdings of CET1 capital instruments issued by a financial sector entity that is
a member of the institution’s consolidation group (1,699,998)
CET1 capital after deduction 2,771,103
Additional TIER 1 capital –
TIER 1 capital after deductions 2,771,103
Reserve attributable to fair value gains 8,212
Regulatory reserve for general banking risk 215,267
Collective provisions 10,000
225,267
TIER 2 capital 233,479
Capital base 3,004,582
Capital adequacy ratios at 31 December 2013 were compiled on both solo basis and consolidated basis in
accordance with the Capital Rules and Section 97C of the Banking Ordinance for the implementation of the “Basel
III” capital accord. The subsidiary consolidated into capital base and risk weighted exposures is Public Finance.
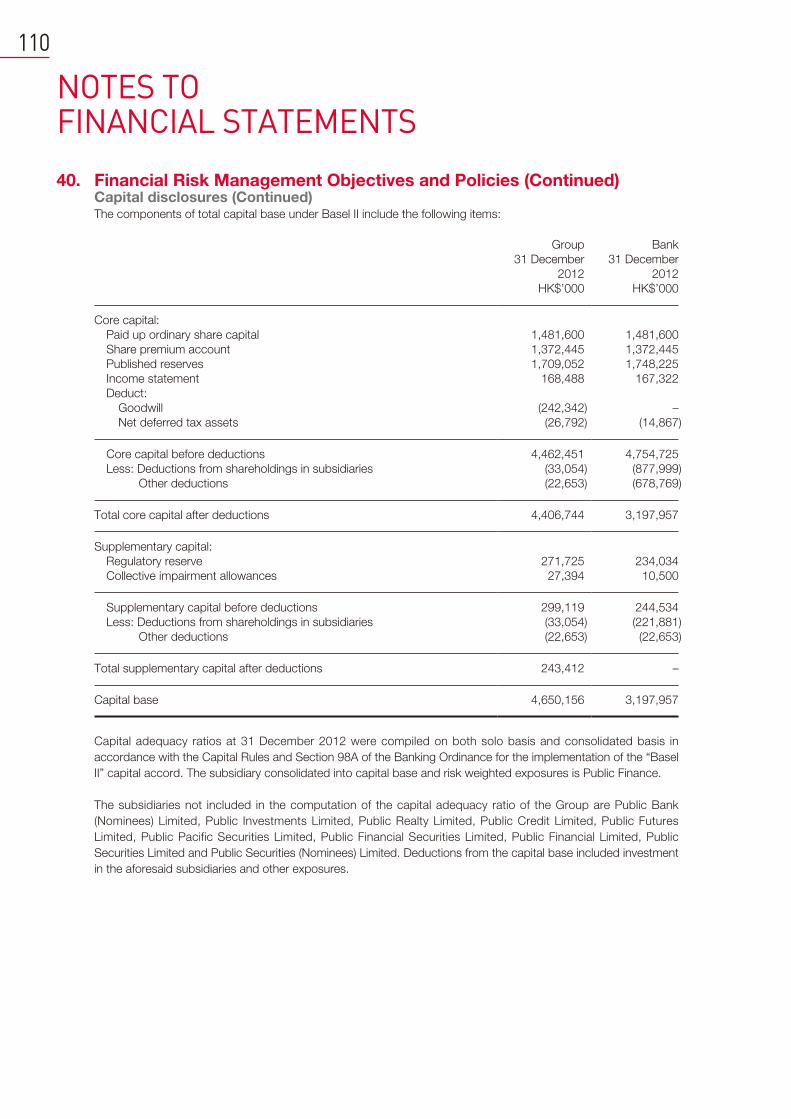
NOTES TO FINANCIAL STATEMENTS
110
40. Financial Risk Management Objectives and Policies (Continued)Capital disclosures (Continued)The components of total capital base under Basel II include the following items:
Group Bank
31 December 31 December
2012 2012
HK$’000 HK$’000
Core capital:
Paid up ordinary share capital 1,481,600 1,481,600
Share premium account 1,372,445 1,372,445
Published reserves 1,709,052 1,748,225
Income statement 168,488 167,322
Deduct:
Goodwill (242,342) –
Net deferred tax assets (26,792) (14,867)
Core capital before deductions 4,462,451 4,754,725
Less: Deductions from shareholdings in subsidiaries (33,054) (877,999)
Other deductions (22,653) (678,769)
Total core capital after deductions 4,406,744 3,197,957
Supplementary capital:
Regulatory reserve 271,725 234,034
Collective impairment allowances 27,394 10,500
Supplementary capital before deductions 299,119 244,534
Less: Deductions from shareholdings in subsidiaries (33,054) (221,881)
Other deductions (22,653) (22,653)
Total supplementary capital after deductions 243,412 –
Capital base 4,650,156 3,197,957
Capital adequacy ratios at 31 December 2012 were compiled on both solo basis and consolidated basis in
accordance with the Capital Rules and Section 98A of the Banking Ordinance for the implementation of the “Basel
II” capital accord. The subsidiary consolidated into capital base and risk weighted exposures is Public Finance.
The subsidiaries not included in the computation of the capital adequacy ratio of the Group are Public Bank
(Nominees) Limited, Public Investments Limited, Public Realty Limited, Public Credit Limited, Public Futures
Limited, Public Pacific Securities Limited, Public Financial Securities Limited, Public Financial Limited, Public
Securities Limited and Public Securities (Nominees) Limited. Deductions from the capital base included investment
in the aforesaid subsidiaries and other exposures.
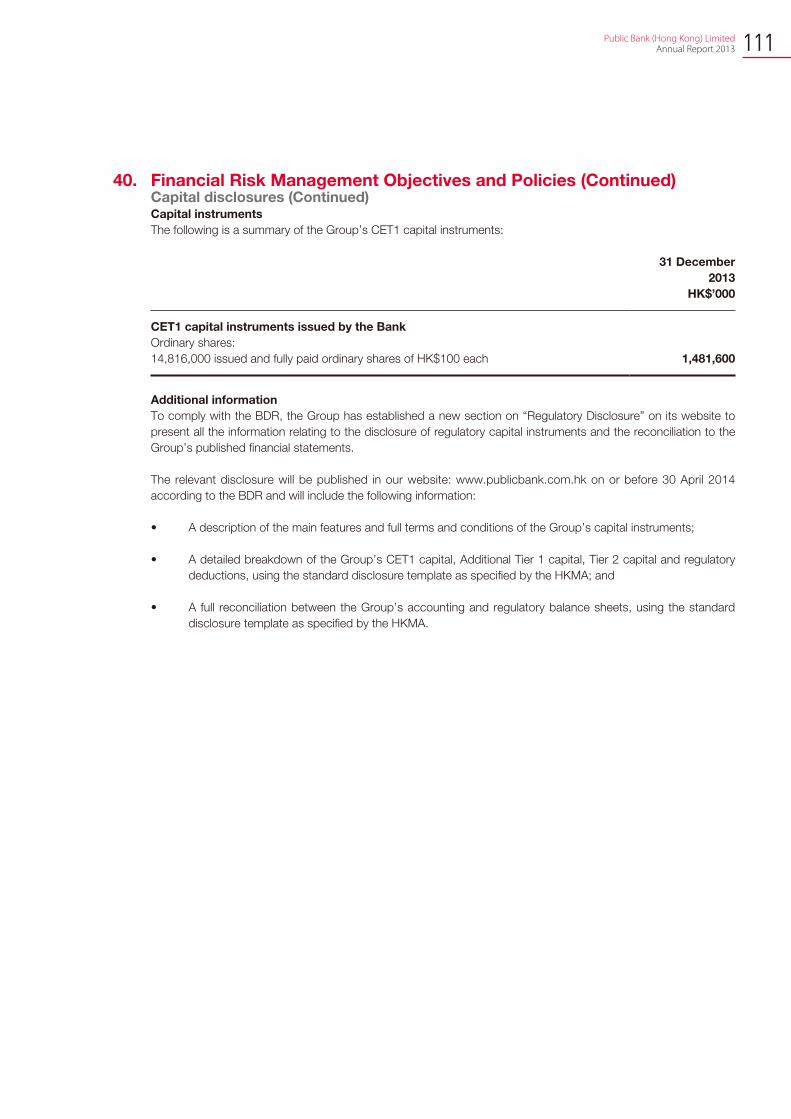
111 Public Bank (Hong Kong) Limited Annual Report 2013
40. Financial Risk Management Objectives and Policies (Continued)Capital disclosures (Continued)Capital instruments
The following is a summary of the Group’s CET1 capital instruments:
31 December
2013
HK$’000
CET1 capital instruments issued by the Bank
Ordinary shares:
14,816,000 issued and fully paid ordinary shares of HK$100 each 1,481,600
Additional information
To comply with the BDR, the Group has established a new section on “Regulatory Disclosure” on its website to
present all the information relating to the disclosure of regulatory capital instruments and the reconciliation to the
Group’s published financial statements.
The relevant disclosure will be published in our website: www.publicbank.com.hk on or before 30 April 2014
according to the BDR and will include the following information:
• A description of the main features and full terms and conditions of the Group’s capital instruments;
• A detailed breakdown of the Group’s CET1 capital, Additional Tier 1 capital, Tier 2 capital and regulatory
deductions, using the standard disclosure template as specified by the HKMA; and
• A full reconciliation between the Group’s accounting and regulatory balance sheets, using the standard
disclosure template as specified by the HKMA.
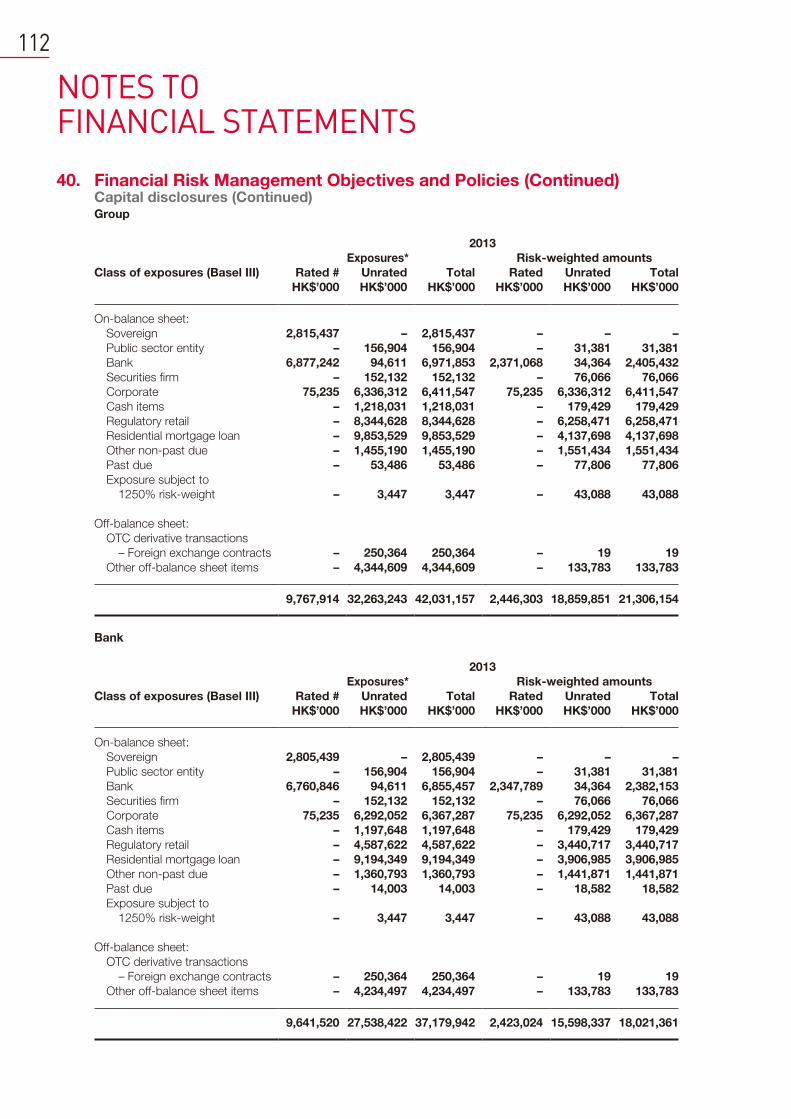
NOTES TO FINANCIAL STATEMENTS
112
40. Financial Risk Management Objectives and Policies (Continued)Capital disclosures (Continued)Group
2013
Exposures* Risk-weighted amounts
Class of exposures (Basel III) Rated # Unrated Total Rated Unrated Total
HK$’000 HK$’000 HK$’000 HK$’000 HK$’000 HK$’000
On-balance sheet:
Sovereign 2,815,437 – 2,815,437 – – –
Public sector entity – 156,904 156,904 – 31,381 31,381
Bank 6,877,242 94,611 6,971,853 2,371,068 34,364 2,405,432
Securities firm – 152,132 152,132 – 76,066 76,066
Corporate 75,235 6,336,312 6,411,547 75,235 6,336,312 6,411,547
Cash items – 1,218,031 1,218,031 – 179,429 179,429
Regulatory retail – 8,344,628 8,344,628 – 6,258,471 6,258,471
Residential mortgage loan – 9,853,529 9,853,529 – 4,137,698 4,137,698
Other non-past due – 1,455,190 1,455,190 – 1,551,434 1,551,434
Past due – 53,486 53,486 – 77,806 77,806
Exposure subject to
1250% risk-weight – 3,447 3,447 – 43,088 43,088
Off-balance sheet:
OTC derivative transactions
– Foreign exchange contracts – 250,364 250,364 – 19 19
Other off-balance sheet items – 4,344,609 4,344,609 – 133,783 133,783
9,767,914 32,263,243 42,031,157 2,446,303 18,859,851 21,306,154
Bank
2013
Exposures* Risk-weighted amounts
Class of exposures (Basel III) Rated # Unrated Total Rated Unrated Total
HK$’000 HK$’000 HK$’000 HK$’000 HK$’000 HK$’000
On-balance sheet:
Sovereign 2,805,439 – 2,805,439 – – –
Public sector entity – 156,904 156,904 – 31,381 31,381
Bank 6,760,846 94,611 6,855,457 2,347,789 34,364 2,382,153
Securities firm – 152,132 152,132 – 76,066 76,066
Corporate 75,235 6,292,052 6,367,287 75,235 6,292,052 6,367,287
Cash items – 1,197,648 1,197,648 – 179,429 179,429
Regulatory retail – 4,587,622 4,587,622 – 3,440,717 3,440,717
Residential mortgage loan – 9,194,349 9,194,349 – 3,906,985 3,906,985
Other non-past due – 1,360,793 1,360,793 – 1,441,871 1,441,871
Past due – 14,003 14,003 – 18,582 18,582
Exposure subject to
1250% risk-weight – 3,447 3,447 – 43,088 43,088
Off-balance sheet:
OTC derivative transactions
– Foreign exchange contracts – 250,364 250,364 – 19 19
Other off-balance sheet items – 4,234,497 4,234,497 – 133,783 133,783
9,641,520 27,538,422 37,179,942 2,423,024 15,598,337 18,021,361

113 Public Bank (Hong Kong) Limited Annual Report 2013
40. Financial Risk Management Objectives and Policies (Continued)Capital disclosures (Continued)Group
2012
Exposures* Risk-weighted amounts
Class of exposures (Basel II) Rated # Unrated Total Rated Unrated Total
HK$’000 HK$’000 HK$’000 HK$’000 HK$’000 HK$’000
On-balance sheet:
Sovereign 2,075,191 – 2,075,191 – – –
Public sector entity – 184,139 184,139 – 36,828 36,828
Bank 7,210,597 53,624 7,264,221 2,114,818 25,623 2,140,441
Securities firm – 49,839 49,839 – 24,920 24,920
Corporate – 6,502,922 6,502,922 – 6,502,922 6,502,922
Cash items – 881,173 881,173 – 111,990 111,990
Regulatory retail – 8,427,862 8,427,862 – 6,320,897 6,320,897
Residential mortgage loan – 9,973,266 9,973,266 – 4,281,137 4,281,137
Other non-past due – 1,213,491 1,213,491 – 1,213,491 1,213,491
Past due – 117,695 117,695 – 176,304 176,304
Off-balance sheet:
OTC derivative transactions
– Foreign exchange contracts – 32,516 32,516 – 1 1
Other off-balance sheet items – 3,812,673 3,812,673 – 180,011 180,011
9,285,788 31,249,200 40,534,988 2,114,818 18,874,124 20,988,942
Bank
2012
Exposures * Risk-weighted amounts
Class of exposures (Basel II) Rated # Unrated Total Rated Unrated Total
HK$’000 HK$’000 HK$’000 HK$’000 HK$’000 HK$’000
On-balance sheet:
Sovereign 2,065,194 – 2,065,194 – – –
Public sector entity – 184,139 184,139 – 36,828 36,828
Bank 7,110,777 53,624 7,164,401 2,094,853 25,623 2,120,476
Securities firm – 49,839 49,839 – 24,920 24,920
Corporate – 6,482,716 6,482,716 – 6,482,716 6,482,716
Cash items – 863,520 863,520 – 111,990 111,990
Regulatory retail – 4,446,477 4,446,477 – 3,334,858 3,334,858
Residential mortgage loan – 9,425,226 9,425,226 – 4,089,323 4,089,323
Other non-past due – 1,126,722 1,126,722 – 1,126,722 1,126,722
Past due – 74,843 74,843 – 112,026 112,026
Off-balance sheet:
OTC derivative transactions
– Foreign exchange contracts – 32,516 32,516 – 1 1
Other off-balance sheet items – 3,702,565 3,702,565 – 180,011 180,011
9,175,971 26,442,187 35,618,158 2,094,853 15,525,018 17,619,871
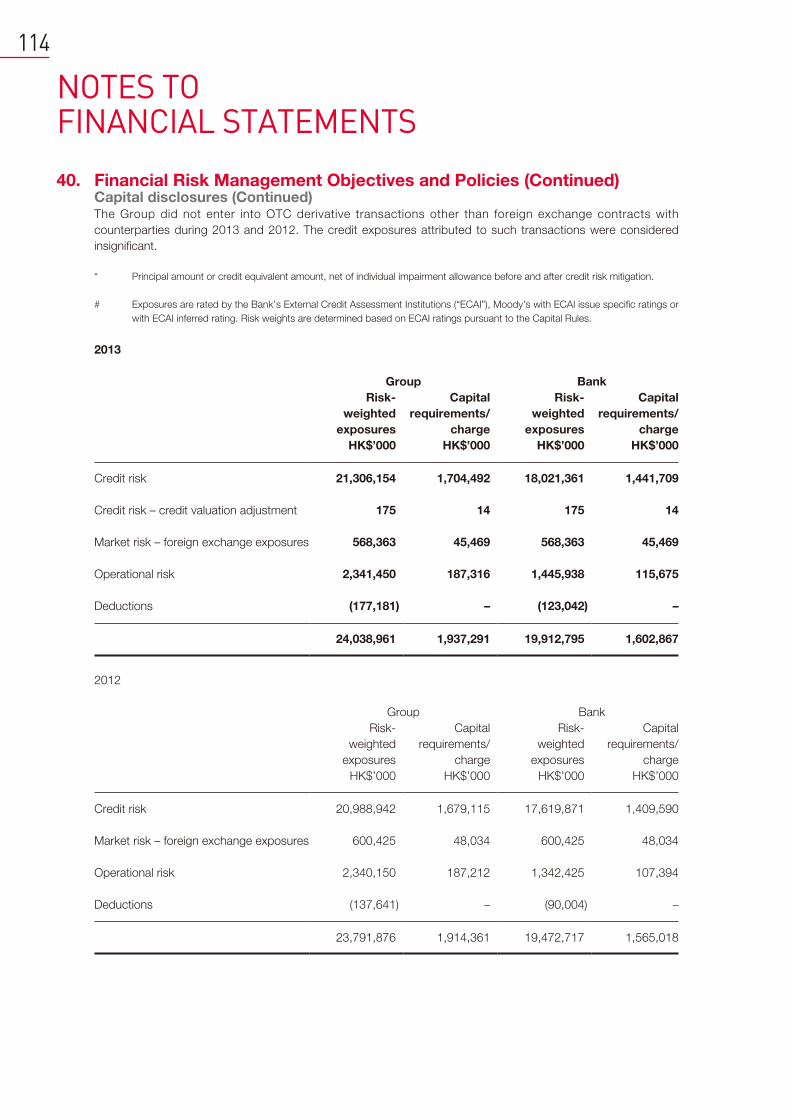
NOTES TO FINANCIAL STATEMENTS
114
40. Financial Risk Management Objectives and Policies (Continued)Capital disclosures (Continued)The Group did not enter into OTC derivative transactions other than foreign exchange contracts with
counterparties during 2013 and 2012. The credit exposures attributed to such transactions were considered
insignificant.
* Principal amount or credit equivalent amount, net of individual impairment allowance before and after credit risk mitigation.
# Exposures are rated by the Bank’s External Credit Assessment Institutions (“ECAI”), Moody’s with ECAI issue specific ratings or
with ECAI inferred rating. Risk weights are determined based on ECAI ratings pursuant to the Capital Rules.
2013
Group Bank
Risk-
weighted
exposures
Capital
requirements/
charge
Risk-
weighted
exposures
Capital
requirements/
charge
HK$’000 HK$’000 HK$’000 HK$’000
Credit risk 21,306,154 1,704,492 18,021,361 1,441,709
Credit risk – credit valuation adjustment 175 14 175 14
Market risk – foreign exchange exposures 568,363 45,469 568,363 45,469
Operational risk 2,341,450 187,316 1,445,938 115,675
Deductions (177,181) – (123,042) –
24,038,961 1,937,291 19,912,795 1,602,867
2012
Group Bank
Risk-
weighted
exposures
Capital
requirements/
charge
Risk-
weighted
exposures
Capital
requirements/
charge
HK$’000 HK$’000 HK$’000 HK$’000
Credit risk 20,988,942 1,679,115 17,619,871 1,409,590
Market risk – foreign exchange exposures 600,425 48,034 600,425 48,034
Operational risk 2,340,150 187,212 1,342,425 107,394
Deductions (137,641) – (90,004) –
23,791,876 1,914,361 19,472,717 1,565,018

115 Public Bank (Hong Kong) Limited Annual Report 2013
40. Financial Risk Management Objectives and Policies (Continued)Capital disclosures (Continued)The Group and the Bank have adopted the standardised approach for calculation of credit risk-weighted
exposures and market risk-weighted exposures. The Group has adopted the basic indicator approach and the
standardised approach for the calculation of operational risk-weighted exposures of the Bank and Public Finance
respectively, for the years ended 31 December 2013 and 2012. The Bank has adopted the basic indicator
approach to calculate operational risk-weighted exposures for the years ended 31 December 2013 and 2012.
As at 31 December 2013 and 2012 respectively, the Bank had no securitisation and counterparty credit risk-
related exposure.
41. Approval of the Financial StatementsThe financial statements were approved and authorised for issue by the Board on 16 January 2014.
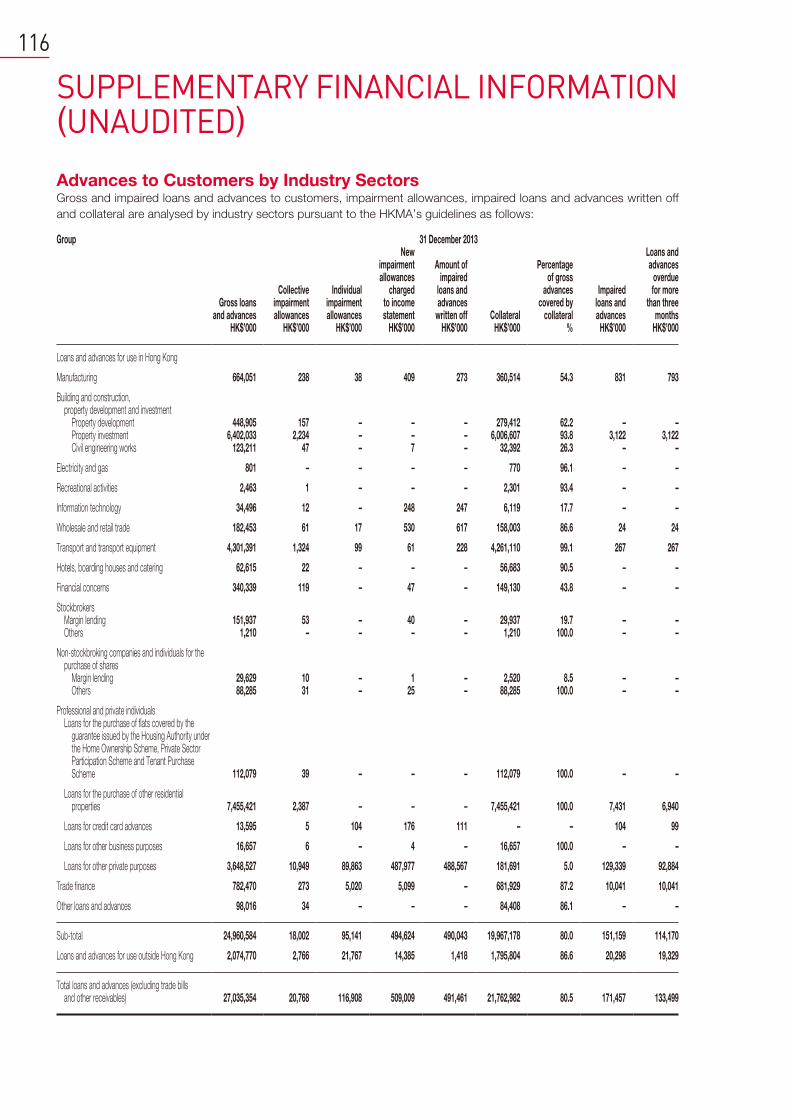
SUPPLEMENTARY FINANCIAL INFORMATION (UNAUDITED)
116
Advances to Customers by Industry SectorsGross and impaired loans and advances to customers, impairment allowances, impaired loans and advances written off
and collateral are analysed by industry sectors pursuant to the HKMA’s guidelines as follows:
Group 31 December 2013
Gross loans and advances
Collective impairment allowances
Individual impairment allowances
New impairment allowances
charged to income statement
Amount of impaired
loans and advances
written off Collateral
Percentage of gross
advances covered by
collateral
Impaired loans and advances
Loans and advances overdue for more
than three months
HK$’000 HK$’000 HK$’000 HK$’000 HK$’000 HK$’000 % HK$’000 HK$’000
Loans and advances for use in Hong Kong
Manufacturing 664,051 238 38 409 273 360,514 54.3 831 793
Building and construction, property development and investment
Property development 448,905 157 – – – 279,412 62.2 – –Property investment 6,402,033 2,234 – – – 6,006,607 93.8 3,122 3,122Civil engineering works 123,211 47 – 7 – 32,392 26.3 – –
Electricity and gas 801 – – – – 770 96.1 – –
Recreational activities 2,463 1 – – – 2,301 93.4 – –
Information technology 34,496 12 – 248 247 6,119 17.7 – –
Wholesale and retail trade 182,453 61 17 530 617 158,003 86.6 24 24
Transport and transport equipment 4,301,391 1,324 99 61 228 4,261,110 99.1 267 267
Hotels, boarding houses and catering 62,615 22 – – – 56,683 90.5 – –
Financial concerns 340,339 119 – 47 – 149,130 43.8 – –
StockbrokersMargin lending 151,937 53 – 40 – 29,937 19.7 – –Others 1,210 – – – – 1,210 100.0 – –
Non-stockbroking companies and individuals for the purchase of shares
Margin lending 29,629 10 – 1 – 2,520 8.5 – –Others 88,285 31 – 25 – 88,285 100.0 – –
Professional and private individualsLoans for the purchase of flats covered by the
guarantee issued by the Housing Authority under the Home Ownership Scheme, Private Sector Participation Scheme and Tenant Purchase Scheme 112,079 39 – – – 112,079 100.0 – –
Loans for the purchase of other residential properties 7,455,421 2,387 – – – 7,455,421 100.0 7,431 6,940
Loans for credit card advances 13,595 5 104 176 111 – – 104 99
Loans for other business purposes 16,657 6 – 4 – 16,657 100.0 – –
Loans for other private purposes 3,648,527 10,949 89,863 487,977 488,567 181,691 5.0 129,339 92,884
Trade finance 782,470 273 5,020 5,099 – 681,929 87.2 10,041 10,041
Other loans and advances 98,016 34 – – – 84,408 86.1 – –
Sub-total 24,960,584 18,002 95,141 494,624 490,043 19,967,178 80.0 151,159 114,170
Loans and advances for use outside Hong Kong 2,074,770 2,766 21,767 14,385 1,418 1,795,804 86.6 20,298 19,329
Total loans and advances (excluding trade bills and other receivables) 27,035,354 20,768 116,908 509,009 491,461 21,762,982 80.5 171,457 133,499
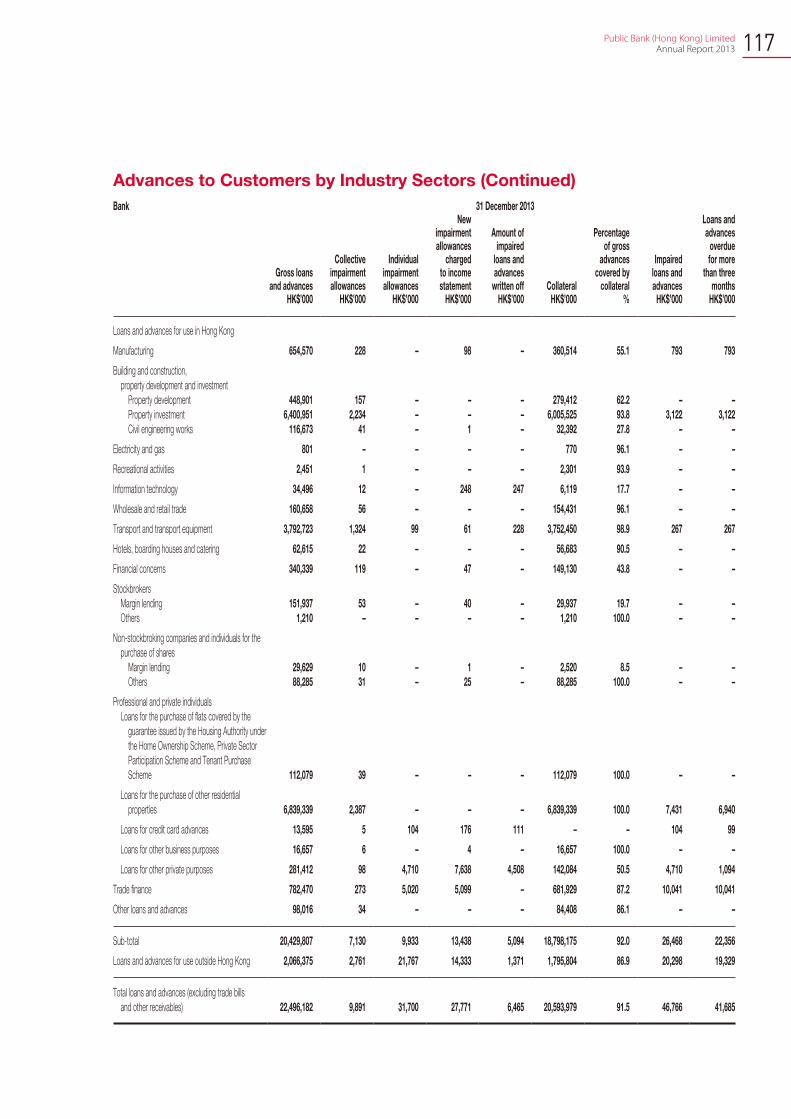
Public Bank (Hong Kong) Limited Annual Report 2013 117
Advances to Customers by Industry Sectors (Continued)
Bank 31 December 2013
Gross loans and advances
Collective impairment allowances
Individual impairment allowances
New impairment allowances
charged to income statement
Amount of impaired
loans and advances
written off Collateral
Percentage of gross
advances covered by
collateral
Impaired loans and advances
Loans and advances
overdue for more
than three months
HK$’000 HK$’000 HK$’000 HK$’000 HK$’000 HK$’000 % HK$’000 HK$’000
Loans and advances for use in Hong Kong
Manufacturing 654,570 228 – 98 – 360,514 55.1 793 793
Building and construction,
property development and investment
Property development 448,901 157 – – – 279,412 62.2 – –
Property investment 6,400,951 2,234 – – – 6,005,525 93.8 3,122 3,122
Civil engineering works 116,673 41 – 1 – 32,392 27.8 – –
Electricity and gas 801 – – – – 770 96.1 – –
Recreational activities 2,451 1 – – – 2,301 93.9 – –
Information technology 34,496 12 – 248 247 6,119 17.7 – –
Wholesale and retail trade 160,658 56 – – – 154,431 96.1 – –
Transport and transport equipment 3,792,723 1,324 99 61 228 3,752,450 98.9 267 267
Hotels, boarding houses and catering 62,615 22 – – – 56,683 90.5 – –
Financial concerns 340,339 119 – 47 – 149,130 43.8 – –
Stockbrokers
Margin lending 151,937 53 – 40 – 29,937 19.7 – –
Others 1,210 – – – – 1,210 100.0 – –
Non-stockbroking companies and individuals for the
purchase of shares
Margin lending 29,629 10 – 1 – 2,520 8.5 – –
Others 88,285 31 – 25 – 88,285 100.0 – –
Professional and private individuals
Loans for the purchase of flats covered by the
guarantee issued by the Housing Authority under
the Home Ownership Scheme, Private Sector
Participation Scheme and Tenant Purchase
Scheme 112,079 39 – – – 112,079 100.0 – –
Loans for the purchase of other residential
properties 6,839,339 2,387 – – – 6,839,339 100.0 7,431 6,940
Loans for credit card advances 13,595 5 104 176 111 – – 104 99
Loans for other business purposes 16,657 6 – 4 – 16,657 100.0 – –
Loans for other private purposes 281,412 98 4,710 7,638 4,508 142,084 50.5 4,710 1,094
Trade finance 782,470 273 5,020 5,099 – 681,929 87.2 10,041 10,041
Other loans and advances 98,016 34 – – – 84,408 86.1 – –
Sub-total 20,429,807 7,130 9,933 13,438 5,094 18,798,175 92.0 26,468 22,356
Loans and advances for use outside Hong Kong 2,066,375 2,761 21,767 14,333 1,371 1,795,804 86.9 20,298 19,329
Total loans and advances (excluding trade bills
and other receivables) 22,496,182 9,891 31,700 27,771 6,465 20,593,979 91.5 46,766 41,685
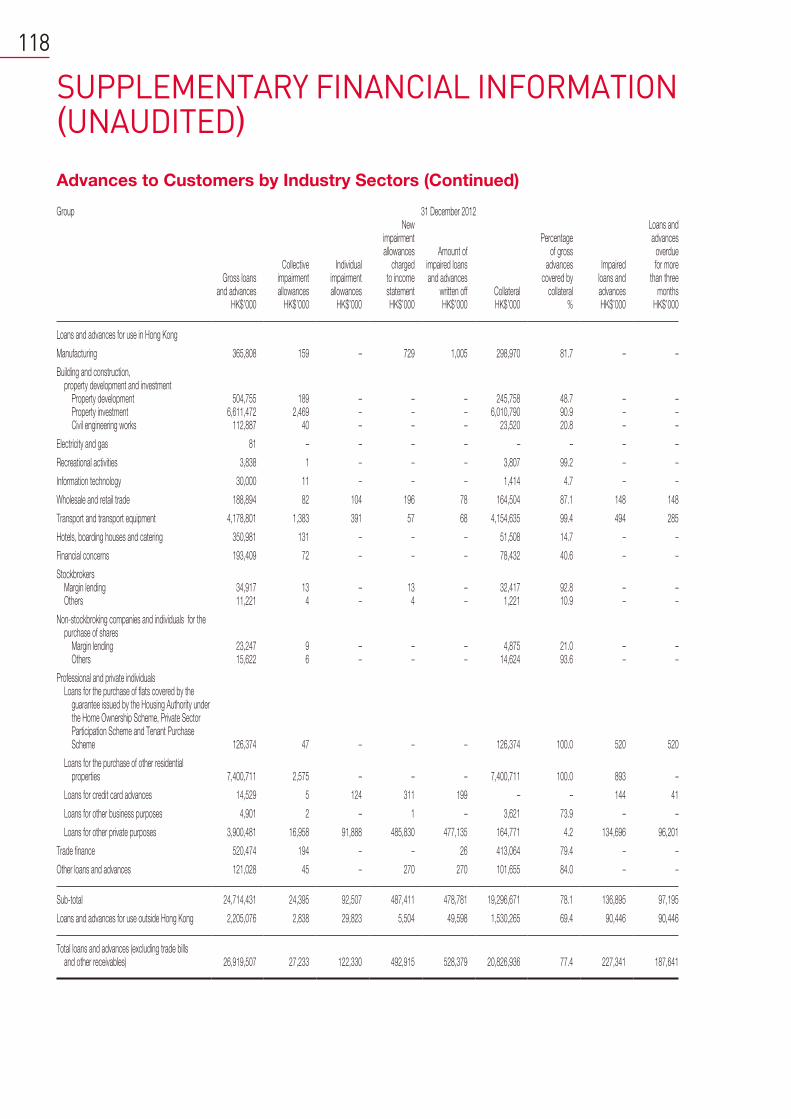
SUPPLEMENTARY FINANCIAL INFORMATION (UNAUDITED)
118
Advances to Customers by Industry Sectors (Continued)
Group 31 December 2012
Gross loans and advances
Collective impairment allowances
Individual impairment allowances
New impairment allowances
charged to income statement
Amount of impaired loans and advances
written off Collateral
Percentage of gross
advances covered by
collateral
Impaired loans and advances
Loans and advances
overdue for more
than three months
HK$’000 HK$’000 HK$’000 HK$’000 HK$’000 HK$’000 % HK$’000 HK$’000
Loans and advances for use in Hong Kong
Manufacturing 365,808 159 – 729 1,005 298,970 81.7 – –
Building and construction, property development and investment
Property development 504,755 189 – – – 245,758 48.7 – –Property investment 6,611,472 2,469 – – – 6,010,790 90.9 – –Civil engineering works 112,887 40 – – – 23,520 20.8 – –
Electricity and gas 81 – – – – – – – –
Recreational activities 3,838 1 – – – 3,807 99.2 – –
Information technology 30,000 11 – – – 1,414 4.7 – –
Wholesale and retail trade 188,894 82 104 196 78 164,504 87.1 148 148
Transport and transport equipment 4,178,801 1,383 391 57 68 4,154,635 99.4 494 285
Hotels, boarding houses and catering 350,981 131 – – – 51,508 14.7 – –
Financial concerns 193,409 72 – – – 78,432 40.6 – –
StockbrokersMargin lending 34,917 13 – 13 – 32,417 92.8 – –Others 11,221 4 – 4 – 1,221 10.9 – –
Non-stockbroking companies and individuals for the purchase of shares
Margin lending 23,247 9 – – – 4,875 21.0 – –Others 15,622 6 – – – 14,624 93.6 – –
Professional and private individualsLoans for the purchase of flats covered by the
guarantee issued by the Housing Authority under the Home Ownership Scheme, Private Sector Participation Scheme and Tenant Purchase Scheme 126,374 47 – – – 126,374 100.0 520 520
Loans for the purchase of other residential properties 7,400,711 2,575 – – – 7,400,711 100.0 893 –
Loans for credit card advances 14,529 5 124 311 199 – – 144 41
Loans for other business purposes 4,901 2 – 1 – 3,621 73.9 – –
Loans for other private purposes 3,900,481 16,958 91,888 485,830 477,135 164,771 4.2 134,696 96,201
Trade finance 520,474 194 – – 26 413,064 79.4 – –
Other loans and advances 121,028 45 – 270 270 101,655 84.0 – –
Sub-total 24,714,431 24,395 92,507 487,411 478,781 19,296,671 78.1 136,895 97,195
Loans and advances for use outside Hong Kong 2,205,076 2,838 29,823 5,504 49,598 1,530,265 69.4 90,446 90,446
Total loans and advances (excluding trade bills and other receivables) 26,919,507 27,233 122,330 492,915 528,379 20,826,936 77.4 227,341 187,641
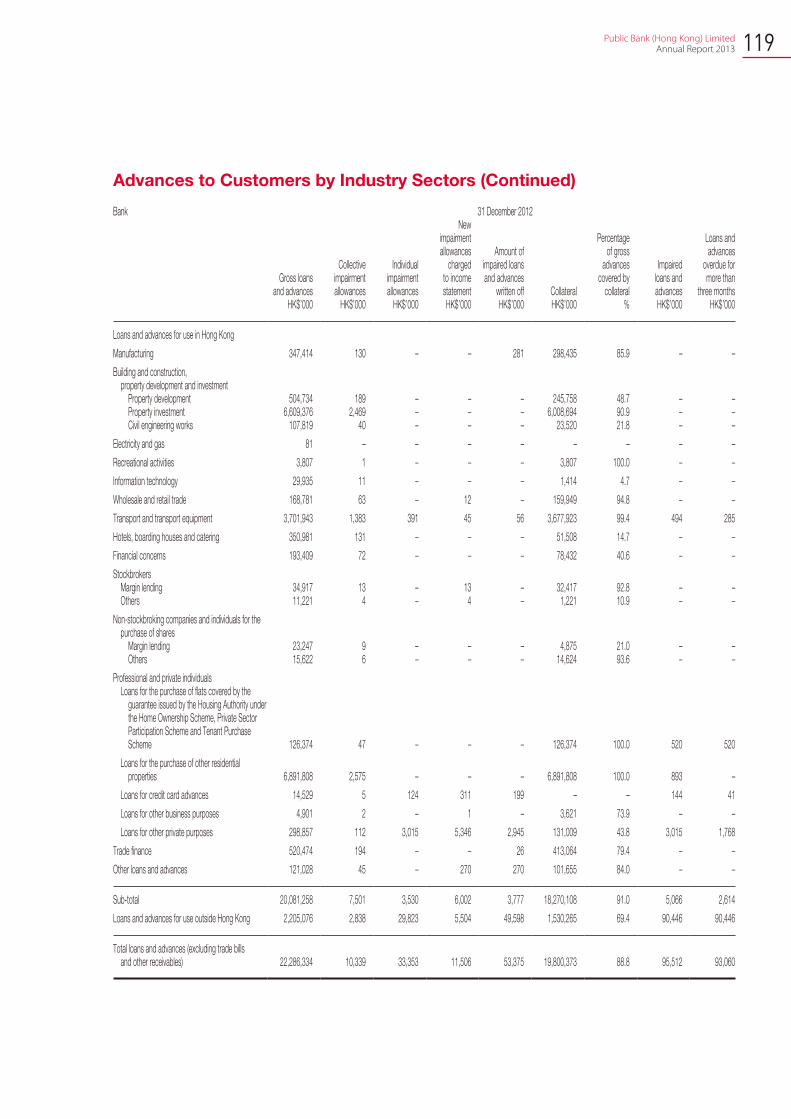
Public Bank (Hong Kong) Limited Annual Report 2013 119
Advances to Customers by Industry Sectors (Continued)
Bank 31 December 2012
Gross loans and advances
Collective impairment allowances
Individual impairment allowances
New impairment allowances
charged to income statement
Amount of impaired loans and advances
written off Collateral
Percentage of gross
advances covered by
collateral
Impaired loans and advances
Loans and advances
overdue for more than
three monthsHK$’000 HK$’000 HK$’000 HK$’000 HK$’000 HK$’000 % HK$’000 HK$’000
Loans and advances for use in Hong Kong
Manufacturing 347,414 130 – – 281 298,435 85.9 – –
Building and construction, property development and investment
Property development 504,734 189 – – – 245,758 48.7 – –Property investment 6,609,376 2,469 – – – 6,008,694 90.9 – –Civil engineering works 107,819 40 – – – 23,520 21.8 – –
Electricity and gas 81 – – – – – – – –
Recreational activities 3,807 1 – – – 3,807 100.0 – –
Information technology 29,935 11 – – – 1,414 4.7 – –
Wholesale and retail trade 168,781 63 – 12 – 159,949 94.8 – –
Transport and transport equipment 3,701,943 1,383 391 45 56 3,677,923 99.4 494 285
Hotels, boarding houses and catering 350,981 131 – – – 51,508 14.7 – –
Financial concerns 193,409 72 – – – 78,432 40.6 – –
StockbrokersMargin lending 34,917 13 – 13 – 32,417 92.8 – –Others 11,221 4 – 4 – 1,221 10.9 – –
Non-stockbroking companies and individuals for the purchase of shares
Margin lending 23,247 9 – – – 4,875 21.0 – –Others 15,622 6 – – – 14,624 93.6 – –
Professional and private individualsLoans for the purchase of flats covered by the
guarantee issued by the Housing Authority under the Home Ownership Scheme, Private Sector Participation Scheme and Tenant Purchase Scheme 126,374 47 – – – 126,374 100.0 520 520
Loans for the purchase of other residential properties 6,891,808 2,575 – – – 6,891,808 100.0 893 –
Loans for credit card advances 14,529 5 124 311 199 – – 144 41
Loans for other business purposes 4,901 2 – 1 – 3,621 73.9 – –
Loans for other private purposes 298,857 112 3,015 5,346 2,945 131,009 43.8 3,015 1,768
Trade finance 520,474 194 – – 26 413,064 79.4 – –
Other loans and advances 121,028 45 – 270 270 101,655 84.0 – –
Sub-total 20,081,258 7,501 3,530 6,002 3,777 18,270,108 91.0 5,066 2,614
Loans and advances for use outside Hong Kong 2,205,076 2,838 29,823 5,504 49,598 1,530,265 69.4 90,446 90,446
Total loans and advances (excluding trade bills and other receivables) 22,286,334 10,339 33,353 11,506 53,375 19,800,373 88.8 95,512 93,060
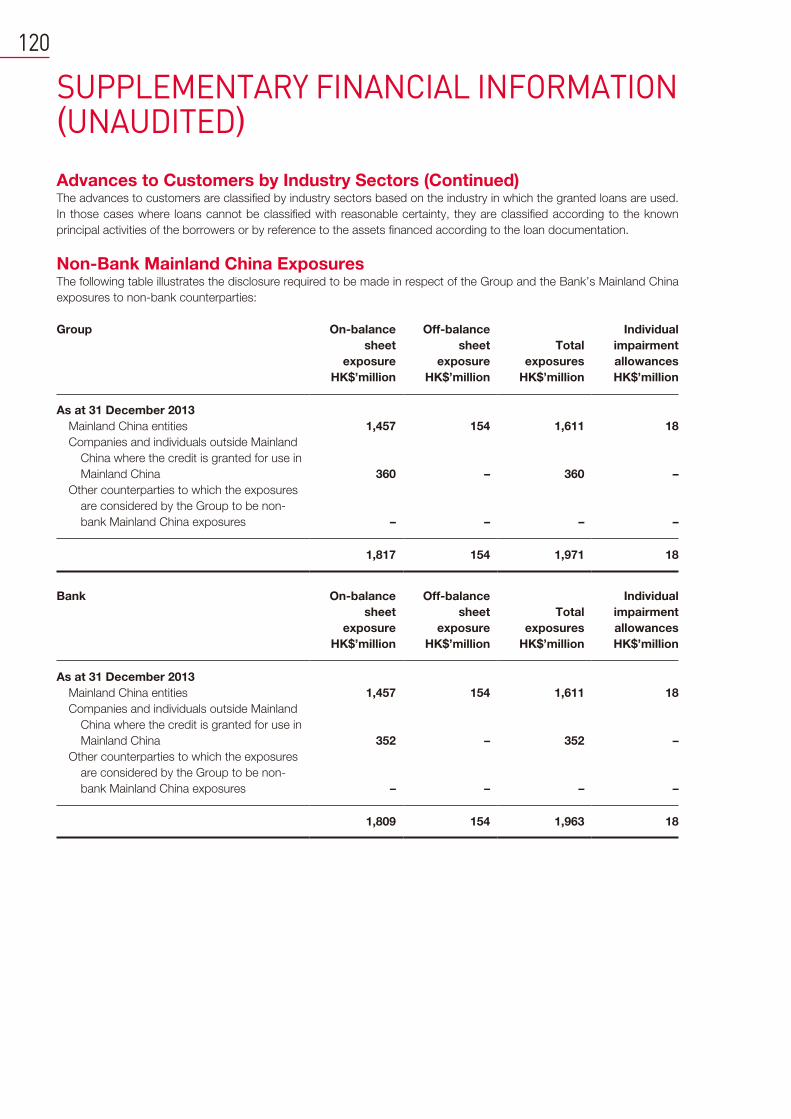
SUPPLEMENTARY FINANCIAL INFORMATION (UNAUDITED)
120
Advances to Customers by Industry Sectors (Continued)The advances to customers are classified by industry sectors based on the industry in which the granted loans are used.
In those cases where loans cannot be classified with reasonable certainty, they are classified according to the known
principal activities of the borrowers or by reference to the assets financed according to the loan documentation.
Non-Bank Mainland China Exposures The following table illustrates the disclosure required to be made in respect of the Group and the Bank’s Mainland China
exposures to non-bank counterparties:
Group On-balance
sheet
exposure
Off-balance
sheet
exposure
Total
exposures
Individual
impairment
allowances
HK$’million HK$’million HK$’million HK$’million
As at 31 December 2013
Mainland China entities 1,457 154 1,611 18
Companies and individuals outside Mainland
China where the credit is granted for use in
Mainland China 360 – 360 –
Other counterparties to which the exposures
are considered by the Group to be non-
bank Mainland China exposures – – – –
1,817 154 1,971 18
Bank On-balance
sheet
exposure
Off-balance
sheet
exposure
Total
exposures
Individual
impairment
allowances
HK$’million HK$’million HK$’million HK$’million
As at 31 December 2013
Mainland China entities 1,457 154 1,611 18
Companies and individuals outside Mainland
China where the credit is granted for use in
Mainland China 352 – 352 –
Other counterparties to which the exposures
are considered by the Group to be non-
bank Mainland China exposures – – – –
1,809 154 1,963 18
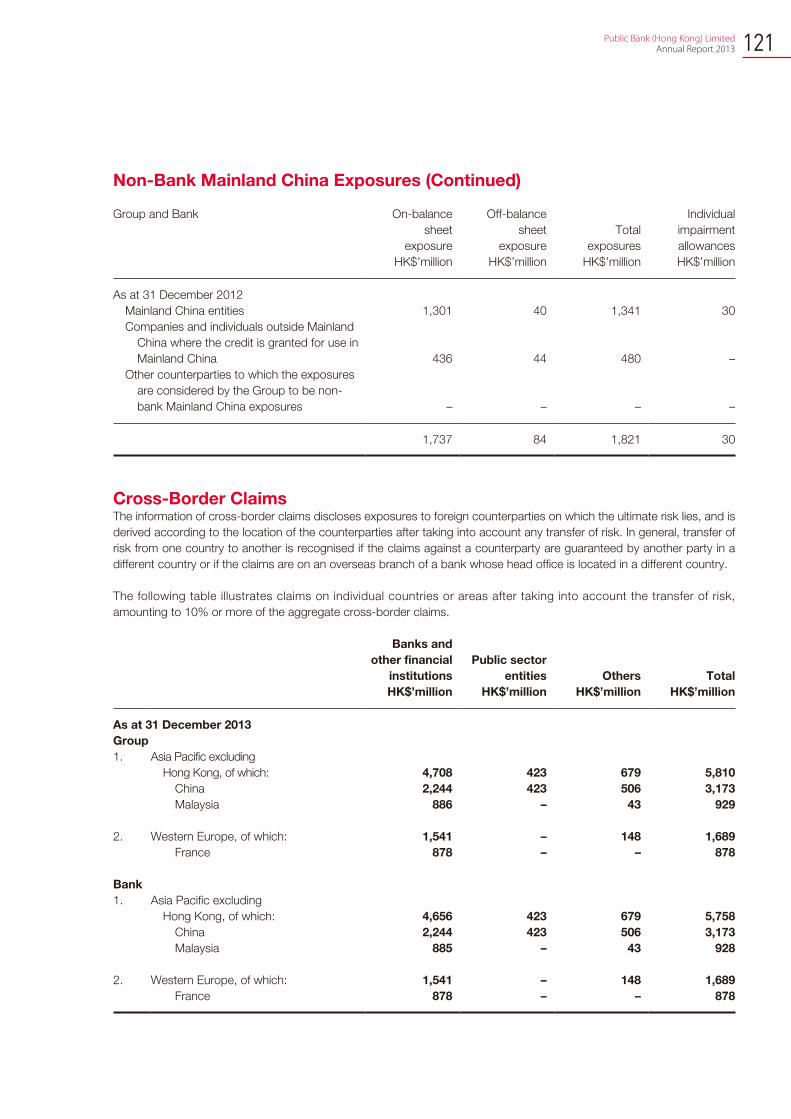
Public Bank (Hong Kong) Limited Annual Report 2013 121
Non-Bank Mainland China Exposures (Continued)
Group and Bank On-balance
sheet
exposure
Off-balance
sheet
exposure
Total
exposures
Individual
impairment
allowances
HK$’million HK$’million HK$’million HK$’million
As at 31 December 2012
Mainland China entities 1,301 40 1,341 30
Companies and individuals outside Mainland
China where the credit is granted for use in
Mainland China 436 44 480 –
Other counterparties to which the exposures
are considered by the Group to be non-
bank Mainland China exposures – – – –
1,737 84 1,821 30
Cross-Border Claims The information of cross-border claims discloses exposures to foreign counterparties on which the ultimate risk lies, and is
derived according to the location of the counterparties after taking into account any transfer of risk. In general, transfer of
risk from one country to another is recognised if the claims against a counterparty are guaranteed by another party in a
different country or if the claims are on an overseas branch of a bank whose head office is located in a different country.
The following table illustrates claims on individual countries or areas after taking into account the transfer of risk,
amounting to 10% or more of the aggregate cross-border claims.
Banks and
other financial
institutions
Public sector
entities Others Total
HK$’million HK$’million HK$’million HK$’million
As at 31 December 2013
Group
1. Asia Pacific excluding
Hong Kong, of which: 4,708 423 679 5,810
China 2,244 423 506 3,173
Malaysia 886 – 43 929
2. Western Europe, of which: 1,541 – 148 1,689
France 878 – – 878
Bank
1. Asia Pacific excluding
Hong Kong, of which: 4,656 423 679 5,758
China 2,244 423 506 3,173
Malaysia 885 – 43 928
2. Western Europe, of which: 1,541 – 148 1,689
France 878 – – 878
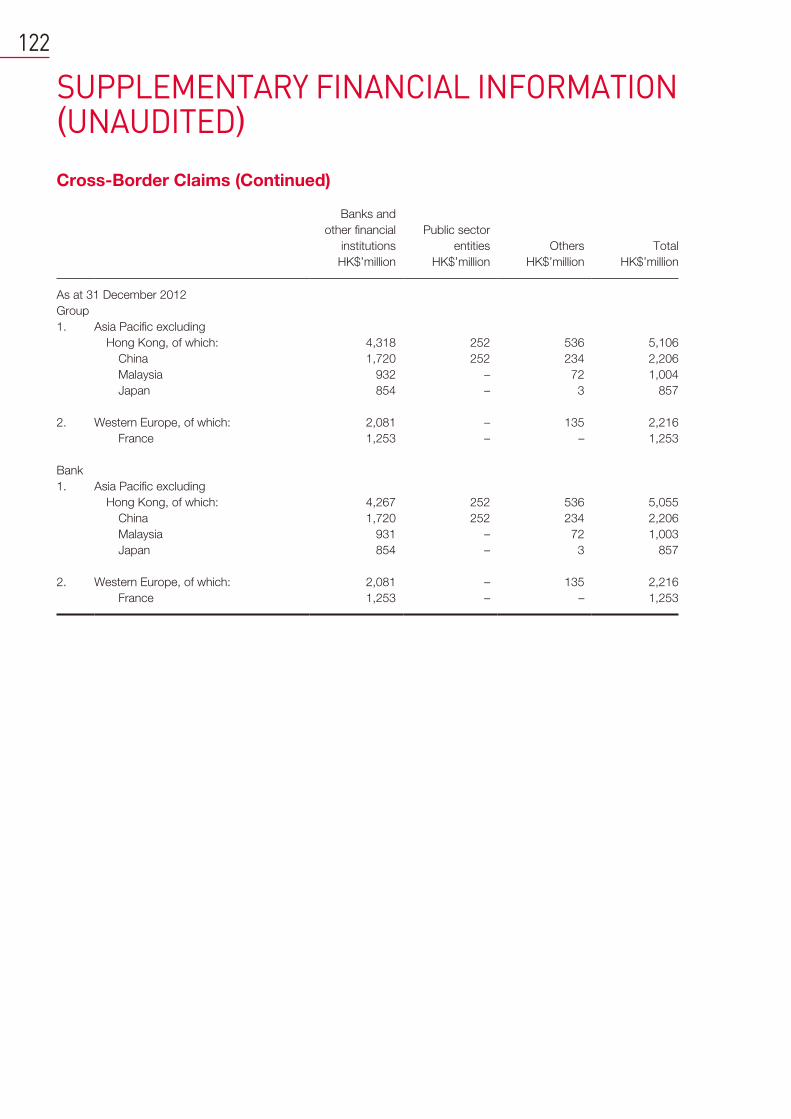
SUPPLEMENTARY FINANCIAL INFORMATION (UNAUDITED)
122
Cross-Border Claims (Continued)
Banks and
other financial
institutions
Public sector
entities Others Total
HK$’million HK$’million HK$’million HK$’million
As at 31 December 2012
Group
1. Asia Pacific excluding
Hong Kong, of which: 4,318 252 536 5,106
China 1,720 252 234 2,206
Malaysia 932 – 72 1,004
Japan 854 – 3 857
2. Western Europe, of which: 2,081 – 135 2,216
France 1,253 – – 1,253
Bank
1. Asia Pacific excluding
Hong Kong, of which: 4,267 252 536 5,055
China 1,720 252 234 2,206
Malaysia 931 – 72 1,003
Japan 854 – 3 857
2. Western Europe, of which: 2,081 – 135 2,216
France 1,253 – – 1,253
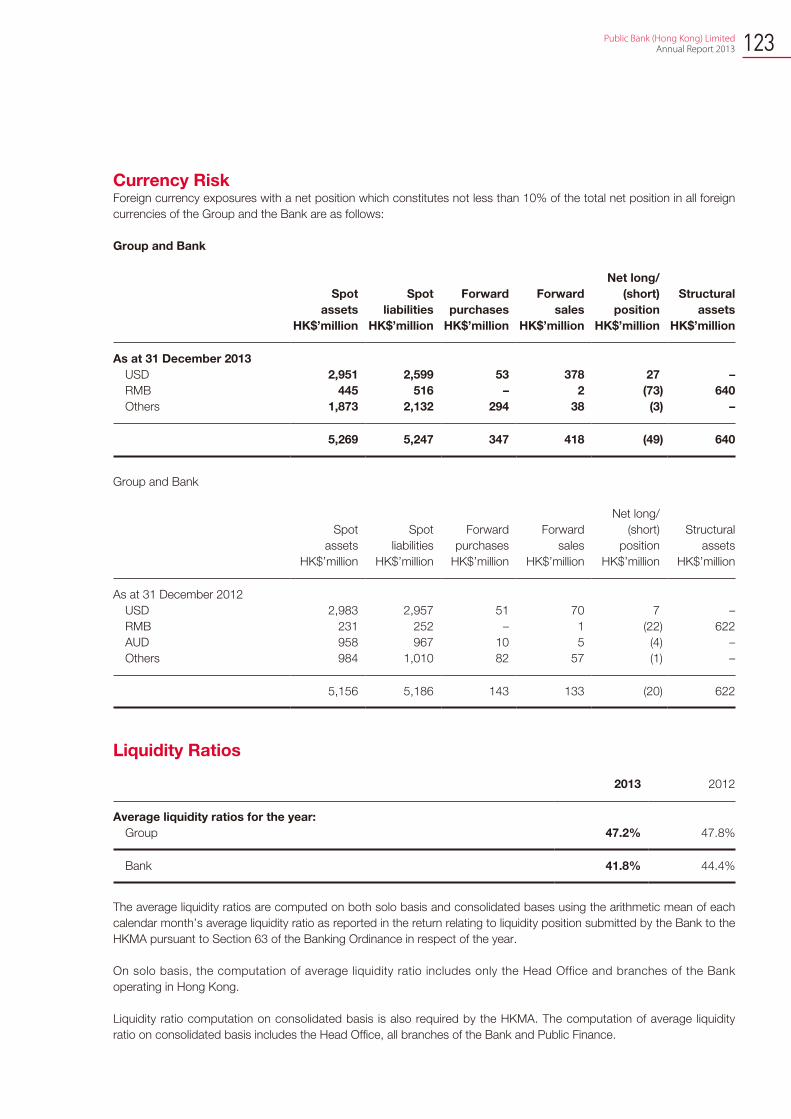
Public Bank (Hong Kong) Limited Annual Report 2013 123
Currency Risk Foreign currency exposures with a net position which constitutes not less than 10% of the total net position in all foreign
currencies of the Group and the Bank are as follows:
Group and Bank
Spot
assets
Spot
liabilities
Forward
purchases
Forward
sales
Net long/
(short)
position
Structural
assets
HK$’million HK$’million HK$’million HK$’million HK$’million HK$’million
As at 31 December 2013
USD 2,951 2,599 53 378 27 –
RMB 445 516 – 2 (73) 640
Others 1,873 2,132 294 38 (3) –
5,269 5,247 347 418 (49) 640
Group and Bank
Spot
assets
Spot
liabilities
Forward
purchases
Forward
sales
Net long/
(short)
position
Structural
assets
HK$’million HK$’million HK$’million HK$’million HK$’million HK$’million
As at 31 December 2012
USD 2,983 2,957 51 70 7 –
RMB 231 252 – 1 (22) 622
AUD 958 967 10 5 (4) –
Others 984 1,010 82 57 (1) –
5,156 5,186 143 133 (20) 622
Liquidity Ratios
2013 2012
Average liquidity ratios for the year:
Group 47.2% 47.8%
Bank 41.8% 44.4%
The average liquidity ratios are computed on both solo basis and consolidated bases using the arithmetic mean of each
calendar month’s average liquidity ratio as reported in the return relating to liquidity position submitted by the Bank to the
HKMA pursuant to Section 63 of the Banking Ordinance in respect of the year.
On solo basis, the computation of average liquidity ratio includes only the Head Office and branches of the Bank
operating in Hong Kong.
Liquidity ratio computation on consolidated basis is also required by the HKMA. The computation of average liquidity
ratio on consolidated basis includes the Head Office, all branches of the Bank and Public Finance.
SUPPLEMENTARY FINANCIAL INFORMATION (UNAUDITED)
124
Disclosure of the Remuneration SystemRemuneration CommitteeThe Bank has established its Remuneration Committee with written terms of reference with effect from 1 January 2011
in compliance with the requirements of the SPM Module CG-5 on “Guideline on a Sound Remuneration System” (the
“Remuneration Guideline”) issued by the HKMA. There were four members in the Remuneration Committee and two
were Independent Non-executive Directors. The Remuneration Committee was chaired by Tan Sri Datuk Seri Utama
Thong Yaw Hong, the Independent Non-Executive Co-Chairman of the Bank. The other members were Tan Sri Dato’ Sri
Tay Ah Lek, Mr. Quah Poh Keat and Mr. Lee Chin Guan.
The Remuneration Committee meets at least once a year to review and make recommendations to the Board of the
Bank on the overall remuneration policy, specific remuneration packages and compensation arrangement relating to the
termination of their office or appointment of Directors, Chief Executive, senior management and key personnel, and for
the formulation of the remuneration policy applicable to all employees of the Bank and its subsidiaries other than Public
Finance and its subsidiaries.
Three meetings were held in 2013. The attendance of each member in 2013 is set out below:
Name of members
Number of
meetings
attended
in 2013
Attendance
rate
Tan Sri Datuk Seri Utama Thong Yaw Hong, Chairman 3/3 100%
Tan Sri Dato’ Sri Tay Ah Lek 3/3 100%
Mr. Quah Poh Keat 3/3 100%
Mr. Lee Chin Guan 3/3 100%
During the year, Directors’ fees, movement of senior officials, 2013 annual salary review, allocation of discretionary bonus
and annual review of the remuneration policy and system in compliance with the Remuneration Guideline of the HKMA
were reviewed and noted.
Remuneration of the Directors, Chief Executive, senior management and key personnel is determined by reference to
factors including the level of workload, responsibilities and commitments, performance and remuneration packages. No
individual Director or any of his associate is involved in deciding his own remuneration.
The scales of Directors’ fees of the Bank for the years 2013 and 2012 are outlined as follows:
Range
Chairman/Co-Chairman HK$60,000 – HK$102,500
Other directors HK$25,000 – HK$92,500
No remuneration was paid to members of the Remuneration Committee for the years 2013 and 2012 except the
aforesaid Directors’ fees.
Public Bank (Hong Kong) Limited Annual Report 2013 125
Disclosure of the Remuneration System (Continued)Design and structure of the remuneration processesThe Board of the Bank oversees the formulation, maintenance and implementation of the Remuneration Policy.
The Remuneration Committee of the Bank reviews and recommends the remuneration packages of key senior
management personnel of the Group (excluding Public Finance and its subsidiaries which had established their
own Remuneration Committee and adopted their own Remuneration Policy) in accordance with the authorities and
responsibilities as stipulated in its terms of reference to the Board of the Bank for approval.
The Remuneration Committee of the Bank also works closely with the Human Resources Committee, Audit Committee
and other dedicated committees and departments to (i) review if there are any material non-compliance issues in relation
to internal policy and statutory requirements and make adjustments to payments of remuneration whenever necessary,
and (ii) decide upon the appraisal system which fairly measures the performance of each key personnel, and make
changes to the system when necessary to meet the changing needs of the Bank.
Proposal of a remuneration review is submitted to the Chairman of the Board of the Bank by the Remuneration
Committee for consideration each year.
Regular compliance monitoring is imposed to review the management and operation of the remuneration system.
Human Resources Department continues to take initiatives on all human resources matters while Human Resources
Committee continues to function in accordance with its terms of reference.
Discussions and recommendations related to employees at managerial level made in the meetings of Human Resources
Committee are submitted to the Group Human Resources Committee of Public Bank, the ultimate holding company
of the Bank, and where appropriate, to the Remuneration Committee of the Bank for endorsement while discussions
and decisions related to non-managerial employees made in the meetings are normally noted in the Board Executive
Committee of the Bank.
The Remuneration Policy of the Bank GroupThe Bank adopted the Remuneration Policy in compliance with the Remuneration Guideline in December 2010. The
Remuneration Policy covers the Bank (including branches and representative offices of the Bank located outside
Hong Kong) and its subsidiaries which are subject to the HKMA’s consolidated supervision except Public Finance,
Public Financial Limited and Public Securities Limited (the “Bank Group”), which have their own remuneration policy.
The Remuneration Policy was initiated by the Human Resources Committee and approved by the Board. The Human
Resources Committee also reviews and keeps abreast of the legal and regulatory requirements from time to time, and
liaises with risk control units including risk management, financial management and compliance functions to strike a
balance among sufficient staff motivation, sound remuneration packages and prudent risk management. Any findings
and recommendations to be incorporated into the Remuneration Policy will be put forth to the Remuneration Committee
for consideration. Having discussed and agreed upon at the Remuneration Committee, the revisions to the Remuneration
Policy will be recommended to the Board for approval.
SUPPLEMENTARY FINANCIAL INFORMATION (UNAUDITED)
126
Disclosure of the Remuneration System (Continued)The Remuneration Policy of the Bank Group (Continued)The Bank’s Remuneration Policy encourages employee behavior that supports the Bank’s risk tolerance, risk
management framework and long-term financial soundness. The policy is established and implemented in line with
the objectives, business strategies and long-term goals of the Bank and formulated in a way that will not encourage
excessive risks taking by employees but allows the Bank to attract and retain employees with relevant skills, knowledge
and expertise to discharge their specific functions. The Bank has considered the risks, including market, credit,
liquidity and operational risks, when implementing the remuneration measures, which are closely monitored by various
management committees and working groups. The Bank considers and reviews the audit reports and various kinds
of performance reports to take account of these risks in the remuneration process. Audit reports cover information on
asset quality, credit risk management and operational risk management whilst performance reports state various kinds of
business performance indicators such as delinquent rate, net impairment ratio, customer deposit, business growth, etc.,
which are useful for identification of current and future risks. The employees’ performances in controlling these current
and future risks are linked with their remuneration rewards. The Board will take the overall performance of the Bank
Group, risk management, market trends, and other non-financial measures when deciding the performance bonus pool.
This will be adjusted as and when the Bank considers appropriate. There is no change of remuneration measures over
the past year.
Basically, the remuneration package consists of fixed and variable remuneration which are offered in cash. Fixed
remuneration refers to basic salary, the year end double pay, and other fixed income while variable remuneration refers
to discretionary bonus, sales commission and other variable income. The remuneration packages are determined by
taking into consideration the evaluation of the job’s responsibilities and contribution, the market pay levels for benchmark
positions, and employee’s performance. The level of remuneration and the proportion of variable remuneration to
fixed remuneration of senior management and key personnel are linked to their level of responsibility undertaken and
contribution to business performance and enhancements of efficiency and effectiveness of operations.
When the amount of variable remuneration payout exceeds a predetermined percentage or amount of the annual fixed
remuneration of the employee, a deferment period of 3 years will be imposed in order to align the incentive awards
to be granted to an individual employee with the long-term value creation and the time horizons of risk. The deferred
remuneration will be vested gradually over the 3-year deferment period and no faster than on a pro-rata basis. To
conform to the spirit of the Remuneration Guideline and not to undermine the risk management advantage by applying
deferment of variable remuneration, if there is any deferred remuneration, hedging exposures in respect of the unvested
portion of deferred remuneration by any trading, investment or other financial activities will be restricted.
Subject to the decision of the Remuneration Committee in accordance with the internal guidelines, the deferred
remuneration will be forfeited and/or clawed back when it is later established that the data on which the performance
measurement for a particular year was based is subsequently proven to have been manifestly misstated; or it is later
established that the employee concerned has committed fraud or other malfeasance, or violated any legislation, code
or internal control policies of the Bank Group; or there has been a significant downward restatement of the financial
performance of the Bank Group; or the employment of the employee is terminated.
The award of variable remuneration to the senior management, key personnel and risk taking employees is subject to the
aforesaid deferral mechanism which will be reviewed by the Remuneration Committee at least annually and subject to
change when necessary.
The remuneration of the employees within the risk control function, including those performing accounts, audit,
compliance and credit management functions, etc., is determined by the performance of individual employees and
is independent of the business they oversee. The performance factors of the appraisees in carrying out their core job
responsibilities under their respective job functions are assessed in the performance appraisals. Appropriate remuneration
will be recommended based on the results of the appraisals annually.
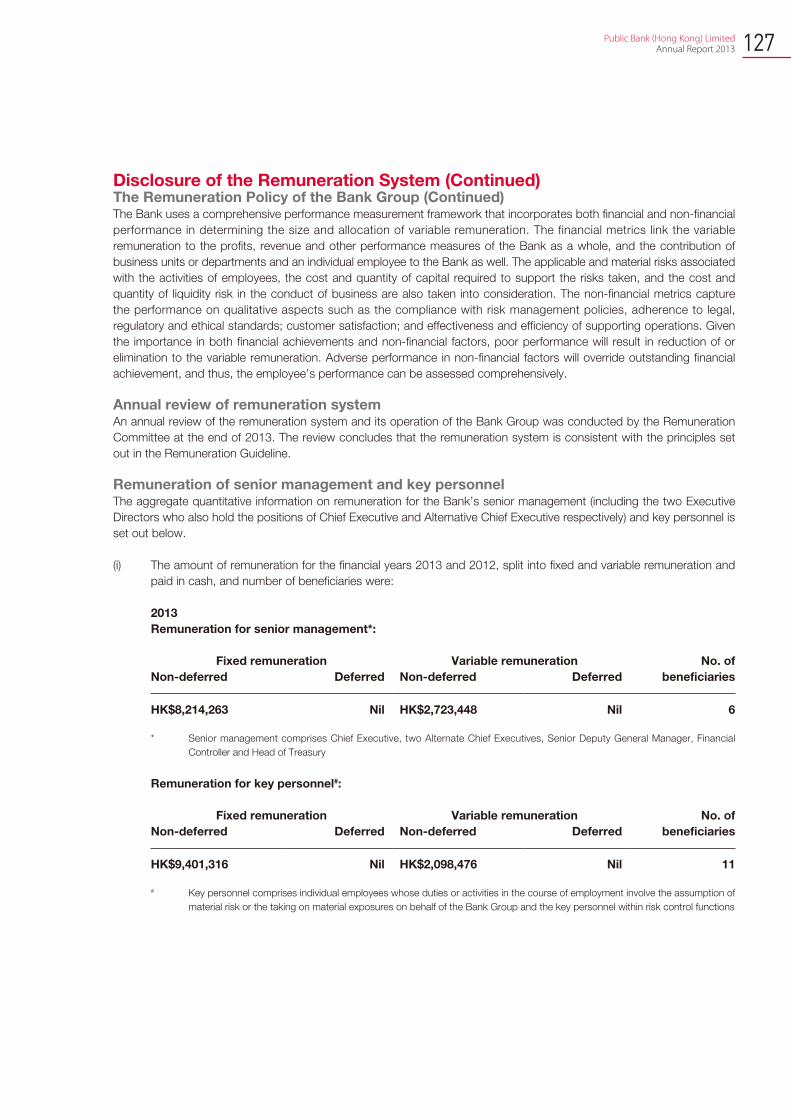
Public Bank (Hong Kong) Limited Annual Report 2013 127
Disclosure of the Remuneration System (Continued)The Remuneration Policy of the Bank Group (Continued)The Bank uses a comprehensive performance measurement framework that incorporates both financial and non-financial
performance in determining the size and allocation of variable remuneration. The financial metrics link the variable
remuneration to the profits, revenue and other performance measures of the Bank as a whole, and the contribution of
business units or departments and an individual employee to the Bank as well. The applicable and material risks associated
with the activities of employees, the cost and quantity of capital required to support the risks taken, and the cost and
quantity of liquidity risk in the conduct of business are also taken into consideration. The non-financial metrics capture
the performance on qualitative aspects such as the compliance with risk management policies, adherence to legal,
regulatory and ethical standards; customer satisfaction; and effectiveness and efficiency of supporting operations. Given
the importance in both financial achievements and non-financial factors, poor performance will result in reduction of or
elimination to the variable remuneration. Adverse performance in non-financial factors will override outstanding financial
achievement, and thus, the employee’s performance can be assessed comprehensively.
Annual review of remuneration systemAn annual review of the remuneration system and its operation of the Bank Group was conducted by the Remuneration
Committee at the end of 2013. The review concludes that the remuneration system is consistent with the principles set
out in the Remuneration Guideline.
Remuneration of senior management and key personnelThe aggregate quantitative information on remuneration for the Bank’s senior management (including the two Executive
Directors who also hold the positions of Chief Executive and Alternative Chief Executive respectively) and key personnel is
set out below.
(i) The amount of remuneration for the financial years 2013 and 2012, split into fixed and variable remuneration and
paid in cash, and number of beneficiaries were:
2013
Remuneration for senior management*:
Fixed remuneration Variable remuneration No. of
Non-deferred Deferred Non-deferred Deferred beneficiaries
HK$8,214,263 Nil HK$2,723,448 Nil 6
* Senior management comprises Chief Executive, two Alternate Chief Executives, Senior Deputy General Manager, Financial
Controller and Head of Treasury
Remuneration for key personnel#:
Fixed remuneration Variable remuneration No. of
Non-deferred Deferred Non-deferred Deferred beneficiaries
HK$9,401,316 Nil HK$2,098,476 Nil 11
# Key personnel comprises individual employees whose duties or activities in the course of employment involve the assumption of
material risk or the taking on material exposures on behalf of the Bank Group and the key personnel within risk control functions
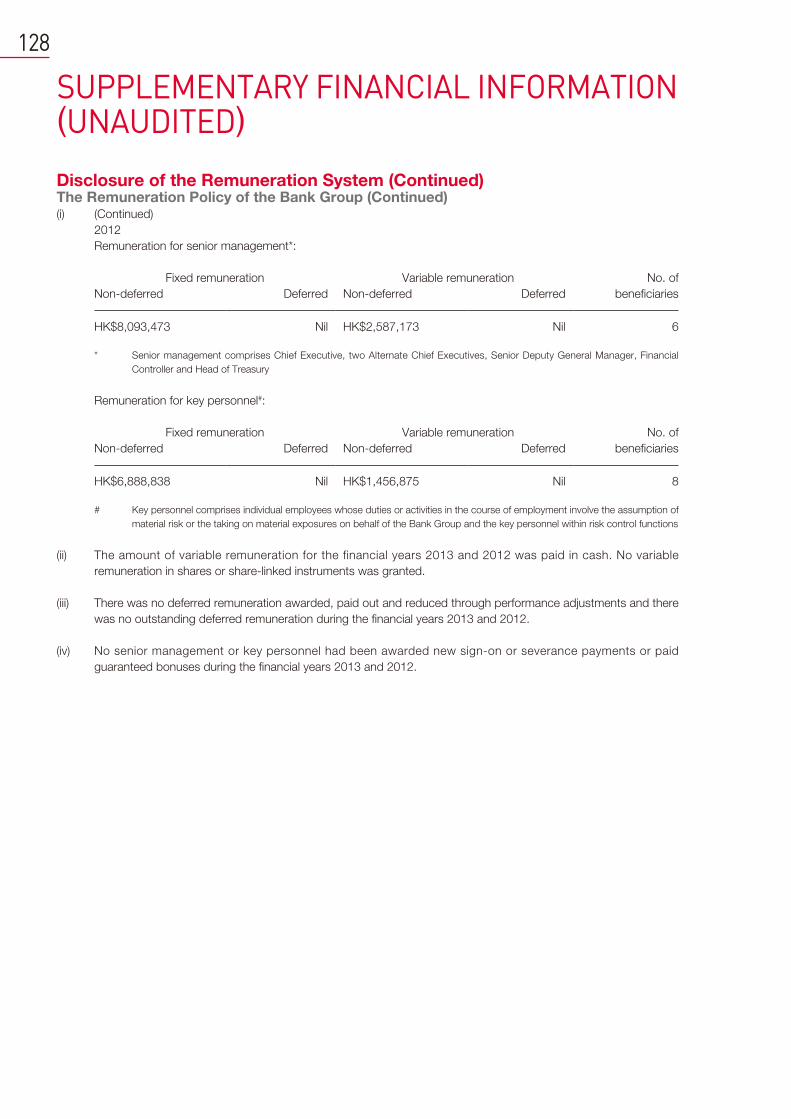
SUPPLEMENTARY FINANCIAL INFORMATION (UNAUDITED)
128
Disclosure of the Remuneration System (Continued)The Remuneration Policy of the Bank Group (Continued)(i) (Continued)
2012
Remuneration for senior management*:
Fixed remuneration Variable remuneration No. of
Non-deferred Deferred Non-deferred Deferred beneficiaries
HK$8,093,473 Nil HK$2,587,173 Nil 6
* Senior management comprises Chief Executive, two Alternate Chief Executives, Senior Deputy General Manager, Financial
Controller and Head of Treasury
Remuneration for key personnel#:
Fixed remuneration Variable remuneration No. of
Non-deferred Deferred Non-deferred Deferred beneficiaries
HK$6,888,838 Nil HK$1,456,875 Nil 8
# Key personnel comprises individual employees whose duties or activities in the course of employment involve the assumption of
material risk or the taking on material exposures on behalf of the Bank Group and the key personnel within risk control functions
(ii) The amount of variable remuneration for the financial years 2013 and 2012 was paid in cash. No variable
remuneration in shares or share-linked instruments was granted.
(iii) There was no deferred remuneration awarded, paid out and reduced through performance adjustments and there
was no outstanding deferred remuneration during the financial years 2013 and 2012.
(iv) No senior management or key personnel had been awarded new sign-on or severance payments or paid
guaranteed bonuses during the financial years 2013 and 2012.
Public Bank (Hong Kong) Limited Annual Report 2013 129
Corporate GovernanceThe Bank is committed to high standards of corporate governance and complies with the guidelines issued by the HKMA
in the SPM Module CG-1 on “Corporate Governance of Locally Incorporated Authorised Institutions” in material aspects.
To accomplish this, the Bank exercises corporate governance through the following Committees:
1. Board Executive CommitteeBoard Executive Committee consists of Executive and Non-executive Directors and is responsible for the
management of the businesses of the Bank in all aspects and the implementation of strategic business plans and
policies approved and formulated by the Board. The present members comprise Tan Sri Dato’ Sri Dr. Teh Hong
Piow (Chairman of Board Executive Committee), Tan Sri Dato’ Sri Tay Ah Lek, Mr. Quah Poh Keat, Dato’ Chang
Kat Kiam, Mr. Tan Yoke Kong and Mr. Chong Yam Kiang.
2. Risk Management CommitteeRisk Management Committee is responsible for overseeing the overall management of all risks covering market
risk management, liquidity risk management, credit risk management and operational risk management. It reviews
and approves risk management policies and risk tolerance limits, to assess adequacy of risk management
policies and framework in identifying, measuring, monitoring and controlling risk and the extent to which these are
operating effectively. It also conducts review of the compliance functions to ensure the resources are adequate
and independence of Compliance Department. The minutes of Risk Management Committee meetings are tabled
to the Board for noting and further action, where appropriate. The members of Risk Management Committee shall
be appointed by the Board from amongst the Non-executive Directors of the Bank and shall consist of not less
than three members. The present members comprise Tan Sri Datuk Seri Utama Thong Yaw Hong (Chairman of
Risk Management Committee), Tan Sri Dato’ Sri Tay Ah Lek, Mr. Quah Poh Keat, Dato’ Chang Kat Kiam and Mr.
Lee Chin Guan.
3. Audit CommitteeAudit Committee reviews internal control issues identified by Internal Audit Department, external auditors,
regulatory authorities and management, and evaluates the adequacy and effectiveness of the Group’s risk
management and internal control systems. It also conducts review of the internal audit functions with particular
emphasis on the scrope of audits, quality of internal audits and independence of Internal Audit Department. The
minutes of Audit Committee meetings are tabled to the Board for noting and further action, where appropriate.
The Chief Executive and Head of Internal Audit normally attend the meetings. The members of Audit Committee
shall be appointed by the Board from amongst the Non-executive Directors of the Bank and shall consist of not
less than three members. The present members comprise Tan Sri Datuk Seri Utama Thong Yaw Hong (Chairman
of Audit Committee), Tan Sri Dato’ Sri Tay Ah Lek, Mr. Quah Poh Keat and Mr. Lee Chin Guan.
4. Remuneration CommitteeRemuneration Committee is responsible for reviewing and recommending to the Board the overall remuneration
policy and remuneration packages of Directors, Chief Executive, senior management and key personnel, and the
remuneration policy applicable to all employees of the Bank Group. The members of Remuneration Committee
comprise Non-executive Directors appointed by the Board, and the majority of them shall be Independent Non-
executive Directors. The present members comprise Tan Sri Datuk Seri Utama Thong Yaw Hong (Chairman of
Remuneration Committee), Tan Sri Dato’ Sri Tay Ah Lek, Mr. Quah Poh Keat and Mr. Lee Chin Guan.
5. Management CommitteeManagement Committee is established by the Board to ensure the effectiveness of the daily operations and
that the operations are in accordance with the corporate objectives, strategies and the annual budget as well as
the policies and business directions that have been approved. It comprises the Chief Executive, Alternate Chief
Executive, Senior Deputy General Manager, Head of Treasury, Head of Operations, Head of Credit, Financial
Controller and Heads of Business Units.
6. Credit CommitteeCredit Committee is responsible for making decisions on applications for all types of credit facilities within its limits
set out in the Credit Policy and in particular, monitoring the lending portfolio for managing the overall credit risk of
the Bank. It comprises the Chief Executive, Alternate Chief Executive, Senior Deputy General Manager, Head of
Branch Banking, Head of Credit, Head of Credit Analysis and Credit Manager.
SUPPLEMENTARY FINANCIAL INFORMATION (UNAUDITED)
130
Corporate Governance (Continued)7. Assets and Liabilities Management Committee
Assets and Liabilities Management Committee reviews and assesses the risk profile and consolidated statement
of financial position structure of the Bank, sets out the objectives for the assets and liabilities management
function and implements relevant risk management strategy. This is monitored and managed within a framework
of approved policies and limits, and is reported regularly to the Risk Management Committee. Assets and
Liabilities Management Committee comprises the Chief Executive, two Alternate Chief Executives, Head of
Treasury, Financial Controller and Risk Manager.
8. Human Resources CommitteeHuman Resources Committee assists the Board in formulating and implementing human resources policies
including staff recruitment, promotion, career development, performance appraisal and remuneration package
of all staff. Human Resources Committee comprises the Chief Executive, two Alternate Chief Executives, Senior
Deputy General Manager and Head of Human Resources.
9. Information Technology Steering CommitteeInformation Technology Steering Committee is responsible for establishing policies and strategies for the
computerisation of the Bank, recommending to the Board on major acquisitions of computer hardware and
software, and monitoring the progress of the implementation of all information technology related projects.
Information Technology Steering Committee comprises the Chief Executive, Alternate Chief Executive, Heads
of Business Units, Head of Internal Audit, Head of Operations, Financial Controller and Head of Information
Technology.
10. Finance CommitteeFinance Committee assists the Board in the financial planning and budgeting process of the business of the
Bank and the review of the business performance, medium-term financial strategic business plan, statutory and
half-year accounts. Finance Committee comprises the Chief Executive, Alternate Chief Executive, Senior Deputy
General Manager, Heads of Business Units, Head of Credit and Financial Controller.
11. Operational Risk Management CommitteeOperational Risk Management Committee is responsible for the implementation of the operational risk
management framework approved by the Board, and the development of specific policies, processes and
procedures for managing operational risk in the material products, activities, processes and systems. It comprises
the Chief Executive, Alternate Chief Executive, Head of Information Technology, Head of Operations, Financial
Controller and Risk Manager.
12. Anti-money Laundering and Counter Terrorist Financing (“AML”) and Compliance CommitteeAML and Compliance Committee is responsible for overseeing Compliance Department to carry out compliance
functions, including prevention of money laundering and terrorist financing and providing guidance on compliance
related issues raised by Compliance Department or other units of the Bank. It comprises the Chief Executive, two
Alternate Chief Executives, Senior Deputy General Manager, Financial Controller and Head of Compliance.
13. Credit Risk Management CommitteeCredit Risk Management Committee is responsible for establishing the framework for identifying, measuring,
monitoring and controlling credit risk of the existing and new products, and approving credit risk management
policies and credit risk tolerable limits as and when necessary. It comprises the Chief Executive, two Alternate
Chief Executives, Financial Controller and Risk Manager.
14. Business Strategy Steering CommitteeBusiness Strategy Steering Committee is responsible for establishing effective business strategies to meet
corporate goals and objectives taking into account operating conditions in the market and formulating strategic
business plans to achieve growth and return, efficiency and competitive advantage in the financial industry.
It comprises the Chief Executive, two Alternate Chief Executives, Senior Deputy General Manager, Financial
Controller, Head of Treasury and Heads of Business Units.