Evolution of periodicity in periodical cicadas ......1 1 Evolution of periodicity in periodical...
16
1 Evolution of periodicity in periodical cicadas 1 Supplementary Information 2 3 Authors: Hiromu Ito 1 , Satoshi Kakishima 1 , Takashi Uehara 1,2 , Satoru Morita 3 , Takuya Koyama 4 , 4 Teiji Sota 4 , John R. Cooley 5 , Jin Yoshimura 1,3,6,7, * 5 6 1 Graduate School of Science and Technology, Shizuoka University, Hamamatsu, 432-8561, Japan 7 2 Nagoya College, Toyoake, Aichi Pref., 470-1193, Japan 8 3 Department of Mathematical and Systems Engineering, Shizuoka University, Hamamatsu, 432- 9 8561, Japan 10 4 Department of Zoology, Graduate School of Science, Kyoto University, Sakyo, Kyoto 606-8502, 11 Japan. 12 5 Department of Ecology and Evolutionary Biology, University of Connecticut, Storrs, CT 06268- 13 3043, USA 14 6 Department of Environmental and Forest Biology, State University of New York College of 15 Environmental Science and Forestry, Syracuse, NY 13210 USA 16 7 Marine Biosystems Research Center, Chiba University, Uchiura, Kamogawa, Chiba 299-5502, 17 Japan 18 19 Supplementary text 20 Description of the Individual Based Model for the evolution of periodicity in periodical 21 cicadas 22 23 Outlines: 24 Setup of individuals 25 Setup of yearly nymphal mortality 26 Simulation flow 27 Supplementary figures 28 29
Transcript of Evolution of periodicity in periodical cicadas ......1 1 Evolution of periodicity in periodical...
1
Evolution of periodicity in periodical cicadas 1
Supplementary Information 2
3
Authors: Hiromu Ito1, Satoshi Kakishima1, Takashi Uehara1,2, Satoru Morita3, Takuya Koyama4, 4
Teiji Sota4, John R. Cooley5, Jin Yoshimura1,3,6,7,* 5
6
1Graduate School of Science and Technology, Shizuoka University, Hamamatsu, 432-8561, Japan 7
2Nagoya College, Toyoake, Aichi Pref., 470-1193, Japan 8
3Department of Mathematical and Systems Engineering, Shizuoka University, Hamamatsu, 432-9
8561, Japan 10
4Department of Zoology, Graduate School of Science, Kyoto University, Sakyo, Kyoto 606-8502, 11
Japan. 12
5Department of Ecology and Evolutionary Biology, University of Connecticut, Storrs, CT 06268-13
3043, USA 14
6Department of Environmental and Forest Biology, State University of New York College of 15
Environmental Science and Forestry, Syracuse, NY 13210 USA 16
7Marine Biosystems Research Center, Chiba University, Uchiura, Kamogawa, Chiba 299-5502, 17
Japan 18
19
Supplementary text 20
Description of the Individual Based Model for the evolution of periodicity in periodical 21
cicadas 22
23
Outlines: 24
Setup of individuals 25
Setup of yearly nymphal mortality 26
Simulation flow 27
Supplementary figures 28
29

2
Setup of individuals 1
Each individual is associated with the following information (trait values): 2
1. Periodicity alleles 3
The locus for the determinant of maturation has two different alleles: a temperature (size)-dependent 4
allele (a) and a time-dependent (periodicity) allele (A). We assume that the periodicity allele (A) is 5
dominant and the non-periodicity allele (a) is recessive. Therefore, individuals with AA and Aa 6
genotypes emerge periodically, whereas those with aa genotypes emerge when their larval size 7
exceeds a certain threshold (mature size). The genotypes of the ancestral cicadas are aa, and those of 8
AA and Aa are periodical cicadas. We also evaluate the evolution of periodicity assuming that the 9
periodicity allele is recessive and the non-periodicity allele is dominant. Simulation runs begin with 10
all individuals having only temperature-dependent alleles; then, when the ancestral cicada population 11
reaches a low stable density (step t=1,000), bidirectional mutation at the emergence locus is 12
introduced at the rate of 0.001 per locus. We also test the case where the temperature-dependent 13
allele is dominant under varying mutation rates (0.001 to 0.01). 14
When we introduce periodicity alleles, τ-year period is introduced for τ=10-20. Within each 15
simulation, only a single τ-year periodicity is introduced. We tested 10- to 20-year periods separately. 16
The remaining year before emergence is also recorded for periodical cicadas. In the initial 17
conditions, all individuals are set to have non-periodicity alleles. We introduced mutation at t=1000 18
(year) when the steady-state densities are reached. For each allele, bidirectional mutation is 19
introduced at the birth of an individual at the rate of 0.001 from time step t=1,000 to the end of 20
simulation steps (a↔A). We also run the simulation assuming one mutation per individual, such that 21
no individual has a simultaneous double mutation (Fig. S11). 22
23
2. Age and virtual longevity 24
An egg has an age of zero years when it is deposited. Here, we assume that all non-periodical 25
nymphs die if they do not reach maturity before the introduced period length (τ year). We also 26
evaluate the effect of relaxing this condition by assuming that each individual nymph has the 27
maximum virtual longevity of 50 years (Agemax=50 years). In warm climates, all cicadas should have 28
emerged as adults or died before this age limit. However, in very cold climates, many nymphs never 29
reach the adult stage and die with this 50-year age limit (see Fig. S3). The age (Age) of non-30
periodical cicadas ranges from 0 to 50, whereas that of periodical cicadas ranges from 0 to τ (τ, 31
periodicity of emergence; 10≤τ≤20) because all periodical cicadas that reach maturity emerge as 32
adults. 33
34
Setup of yearly nymphal mortality 35
Yearly nymphal mortality is set following the Beverton-Holt model32. In this model, there are two 36
3
parameters, λ and k. The original settings are used for these two parameters (λ=1.005 and k=250: red 1
line) for most simulation runs (Fig. S2). Mortality may be affected by yearly temperatures, with 2
lower temperatures increasing nymphal mortality. Freezing temperatures will not only reduce the 3
root water flow available to the nymphs but also promote nymph desiccation, resulting in high 4
nymph mortality. Therefore, we also vary these parameters to determine their effects. We first test 5
various k values (k=200, 250, 300; supplementary Fig. S6). We assume that a cool environment has a 6
low k parameter value (=200). In contrast, a warm environment has a high k (=300). We also vary λ 7
(λ=1.003, 1.005, 1.007) (Fig. S6, S7). 8
9
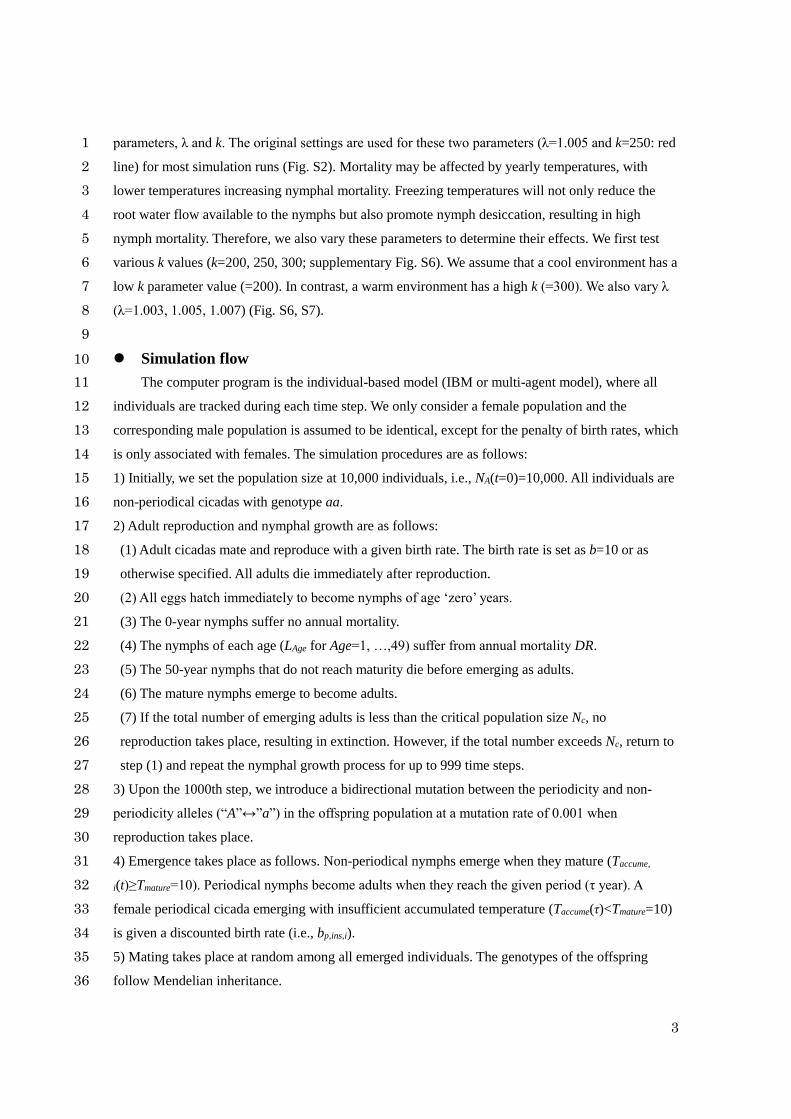
Simulation flow 10
The computer program is the individual-based model (IBM or multi-agent model), where all 11
individuals are tracked during each time step. We only consider a female population and the 12
corresponding male population is assumed to be identical, except for the penalty of birth rates, which 13
is only associated with females. The simulation procedures are as follows: 14
1) Initially, we set the population size at 10,000 individuals, i.e., NA(t=0)=10,000. All individuals are 15
non-periodical cicadas with genotype aa. 16
2) Adult reproduction and nymphal growth are as follows: 17
(1) Adult cicadas mate and reproduce with a given birth rate. The birth rate is set as b=10 or as 18
otherwise specified. All adults die immediately after reproduction. 19
(2) All eggs hatch immediately to become nymphs of age ‘zero’ years. 20
(3) The 0-year nymphs suffer no annual mortality. 21
(4) The nymphs of each age (LAge for Age=1, …,49) suffer from annual mortality DR. 22
(5) The 50-year nymphs that do not reach maturity die before emerging as adults. 23
(6) The mature nymphs emerge to become adults. 24
(7) If the total number of emerging adults is less than the critical population size Nc, no 25
reproduction takes place, resulting in extinction. However, if the total number exceeds Nc, return to 26
step (1) and repeat the nymphal growth process for up to 999 time steps. 27
3) Upon the 1000th step, we introduce a bidirectional mutation between the periodicity and non-28
periodicity alleles (“A”↔”a”) in the offspring population at a mutation rate of 0.001 when 29
reproduction takes place. 30
4) Emergence takes place as follows. Non-periodical nymphs emerge when they mature (Taccume, 31
i(t)≥Tmature=10). Periodical nymphs become adults when they reach the given period (τ year). A 32
female periodical cicada emerging with insufficient accumulated temperature (Taccume(τ)<Tmature=10) 33
is given a discounted birth rate (i.e., bp,ins,i). 34
5) Mating takes place at random among all emerged individuals. The genotypes of the offspring 35
follow Mendelian inheritance. 36
4
6) Repeat steps 2) to 5) for an additional 9,000 time steps until t=10,000 or otherwise specified. 1
Supplementary figures and legends 2
3
4
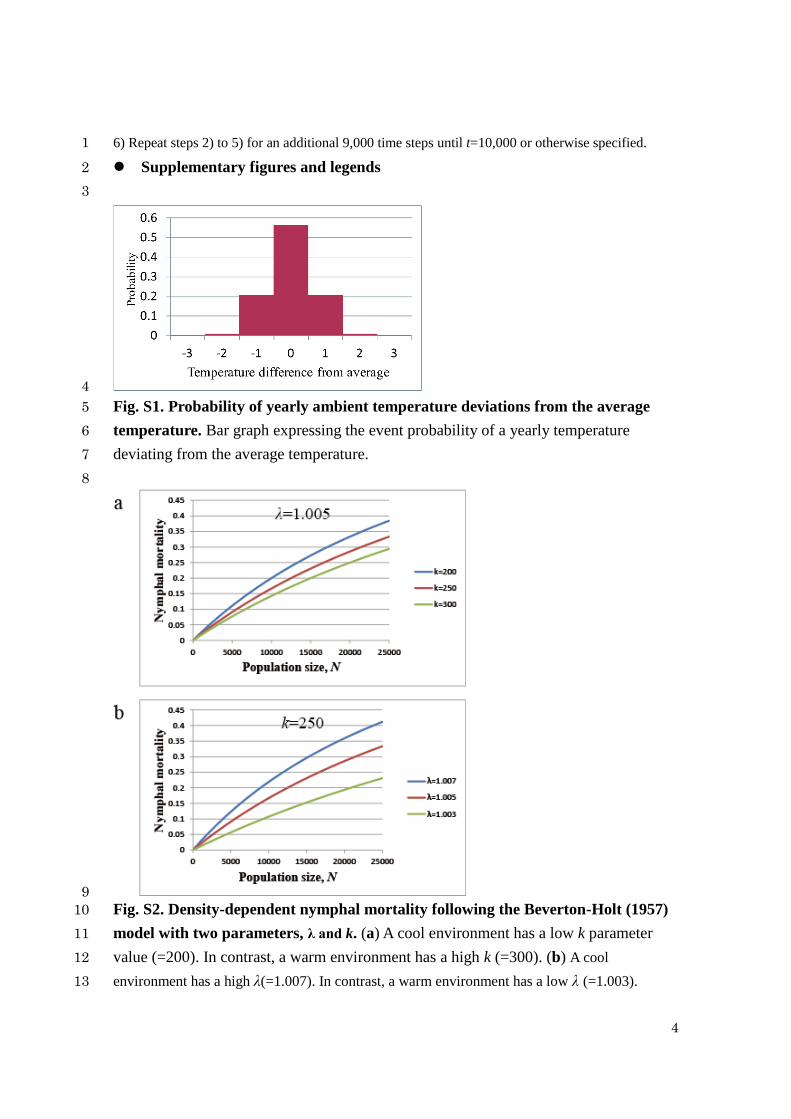
Fig. S1. Probability of yearly ambient temperature deviations from the average 5
temperature. Bar graph expressing the event probability of a yearly temperature 6
deviating from the average temperature. 7
8
9
Fig. S2. Density-dependent nymphal mortality following the Beverton-Holt (1957) 10
model with two parameters, λ and k. (a) A cool environment has a low k parameter 11
value (=200). In contrast, a warm environment has a high k (=300). (b) A cool 12
environment has a high λ(=1.007). In contrast, a warm environment has a low λ (=1.003). 13
5
1
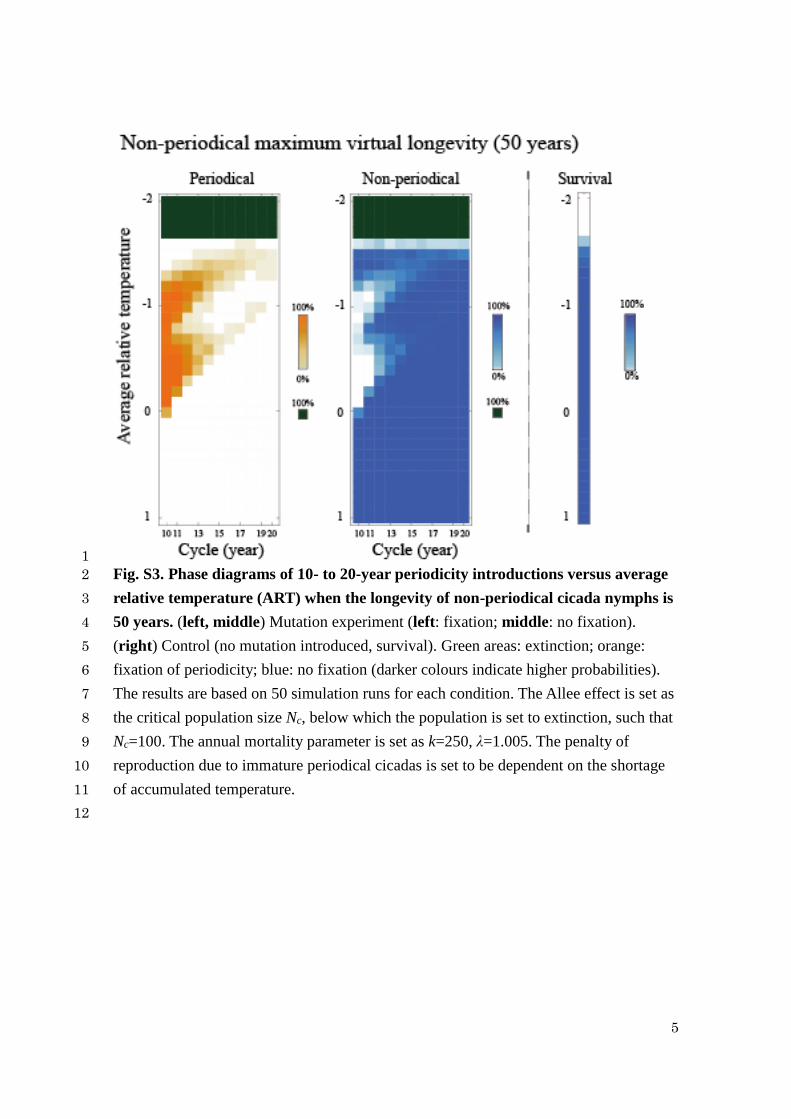
Fig. S3. Phase diagrams of 10- to 20-year periodicity introductions versus average 2
relative temperature (ART) when the longevity of non-periodical cicada nymphs is 3
50 years. (left, middle) Mutation experiment (left: fixation; middle: no fixation). 4
(right) Control (no mutation introduced, survival). Green areas: extinction; orange: 5
fixation of periodicity; blue: no fixation (darker colours indicate higher probabilities). 6
The results are based on 50 simulation runs for each condition. The Allee effect is set as 7
the critical population size Nc, below which the population is set to extinction, such that 8
Nc=100. The annual mortality parameter is set as k=250, λ=1.005. The penalty of 9
reproduction due to immature periodical cicadas is set to be dependent on the shortage 10
of accumulated temperature. 11
12
6
1
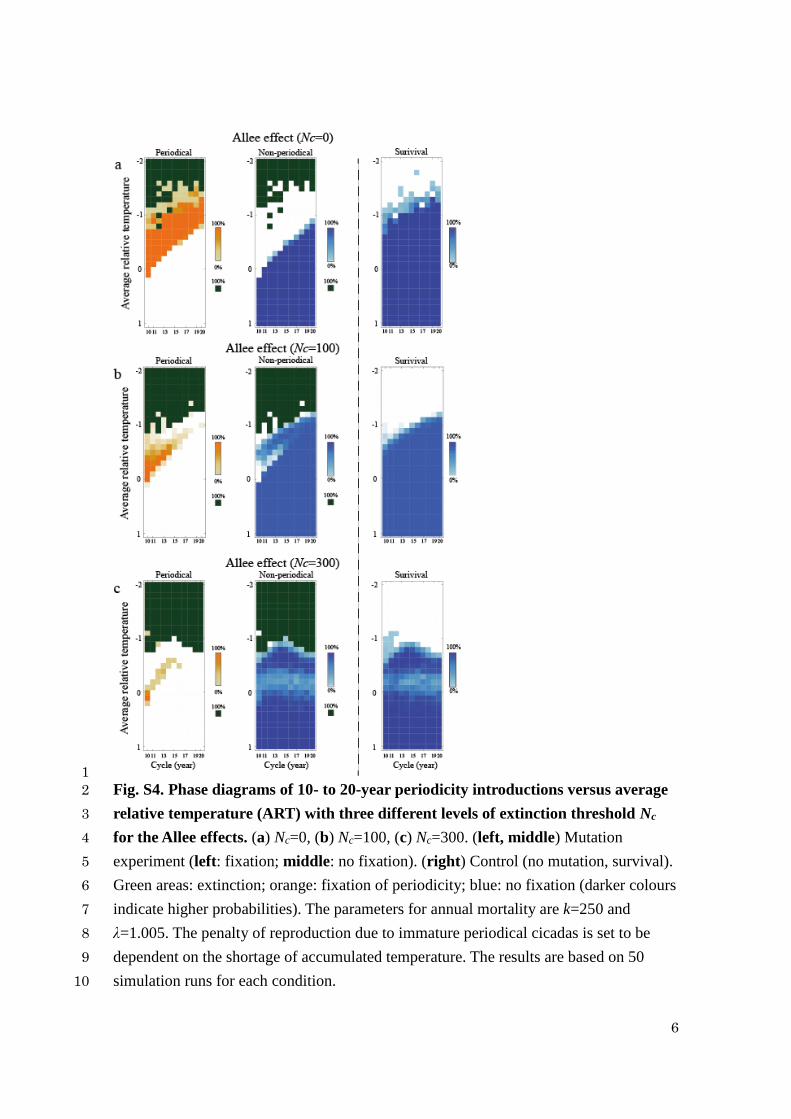
Fig. S4. Phase diagrams of 10- to 20-year periodicity introductions versus average 2
relative temperature (ART) with three different levels of extinction threshold Nc 3
for the Allee effects. (a) Nc=0, (b) Nc=100, (c) Nc=300. (left, middle) Mutation 4
experiment (left: fixation; middle: no fixation). (right) Control (no mutation, survival). 5
Green areas: extinction; orange: fixation of periodicity; blue: no fixation (darker colours 6
indicate higher probabilities). The parameters for annual mortality are k=250 and 7
λ=1.005. The penalty of reproduction due to immature periodical cicadas is set to be 8
dependent on the shortage of accumulated temperature. The results are based on 50 9
simulation runs for each condition. 10

7
1
Fig. S5. Phase diagrams of 10- to 20-year periodicity introductions versus average 2
relative temperature (ART) with varying degrees of extinction thresholds Nc for 3
the Allee effects. (a) Probability of the Allee effect (Nc), i.e., p(Nc=NA). If NA<100, p=1; 4
if 100≤NA≤ 200, p=- NA /100+2; and if NA>200, p=0. (b) (left, middle) Mutation 5
experiment (left: fixation; middle: no fixation). (right) Control (no mutation, survival). 6
Green areas: extinction; orange: fixation of periodicity; blue: no fixation (darker colours 7
indicate higher probabilities). The parameters for annual mortality are k=250 and 8
λ=1.005. The penalty of reproduction due to immature periodical cicadas is set to be 9
dependent on the shortage of accumulated temperature. The results are based on 50 10
simulation runs for each condition. 11
8
1
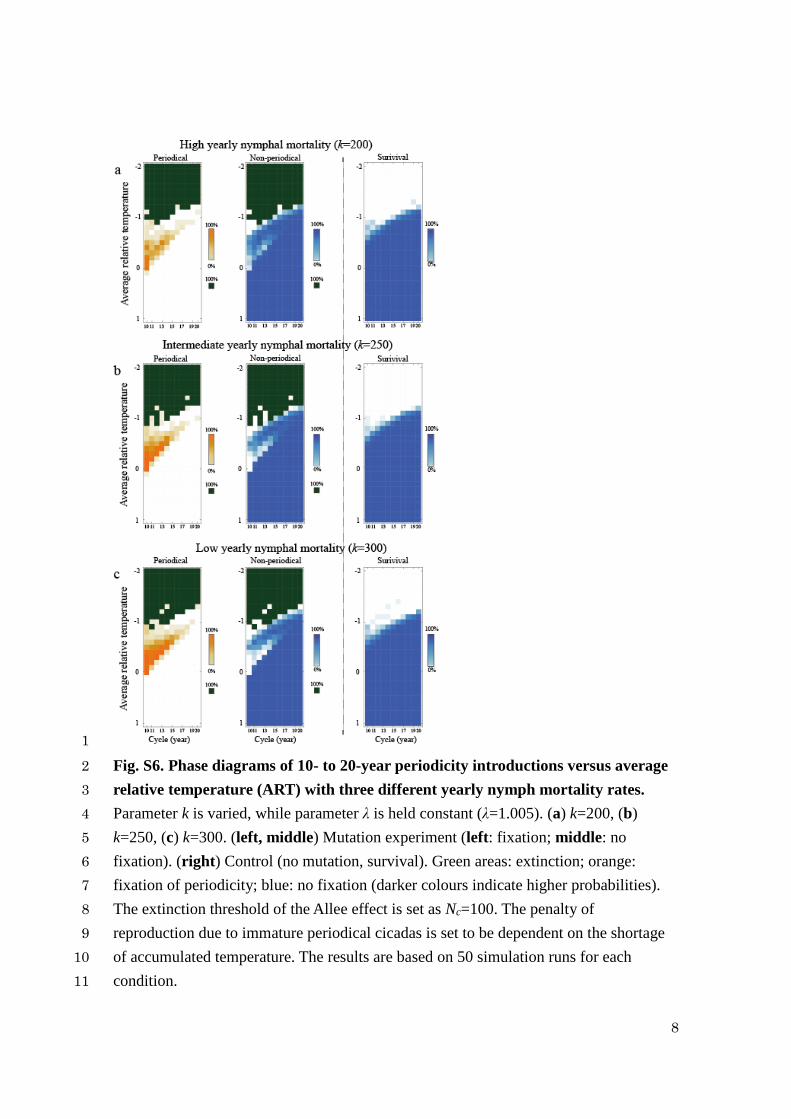
Fig. S6. Phase diagrams of 10- to 20-year periodicity introductions versus average 2
relative temperature (ART) with three different yearly nymph mortality rates. 3
Parameter k is varied, while parameter λ is held constant (λ=1.005). (a) k=200, (b) 4
k=250, (c) k=300. (left, middle) Mutation experiment (left: fixation; middle: no 5
fixation). (right) Control (no mutation, survival). Green areas: extinction; orange: 6
fixation of periodicity; blue: no fixation (darker colours indicate higher probabilities). 7
The extinction threshold of the Allee effect is set as Nc=100. The penalty of 8
reproduction due to immature periodical cicadas is set to be dependent on the shortage 9
of accumulated temperature. The results are based on 50 simulation runs for each 10
condition. 11

9
1
Fig. S7. Phase diagrams of 10- to 20-year periodicity introductions versus average 2
relative temperature (ART) with three different yearly nymph mortality rates. 3
Parameter λ is varied, while parameter k is held constant (k =250). (a)λ=1.007, (b) 4
λ=1.005, and (c) λ=1.003. (left, middle) Mutation experiment (left: fixation; middle: no 5
fixation). (right) Control (no mutation, survival). Green areas: extinction; orange: 6
fixation of periodicity; blue: no fixation (darker colours indicate higher probabilities). 7
The extinction threshold of the Allee effect is set as Nc=100. The penalty of 8
reproduction due to immature periodical cicadas is set to be dependent on the shortage 9
of accumulated temperature. The results are based on 50 simulation runs for each 10
condition. 11
10
1
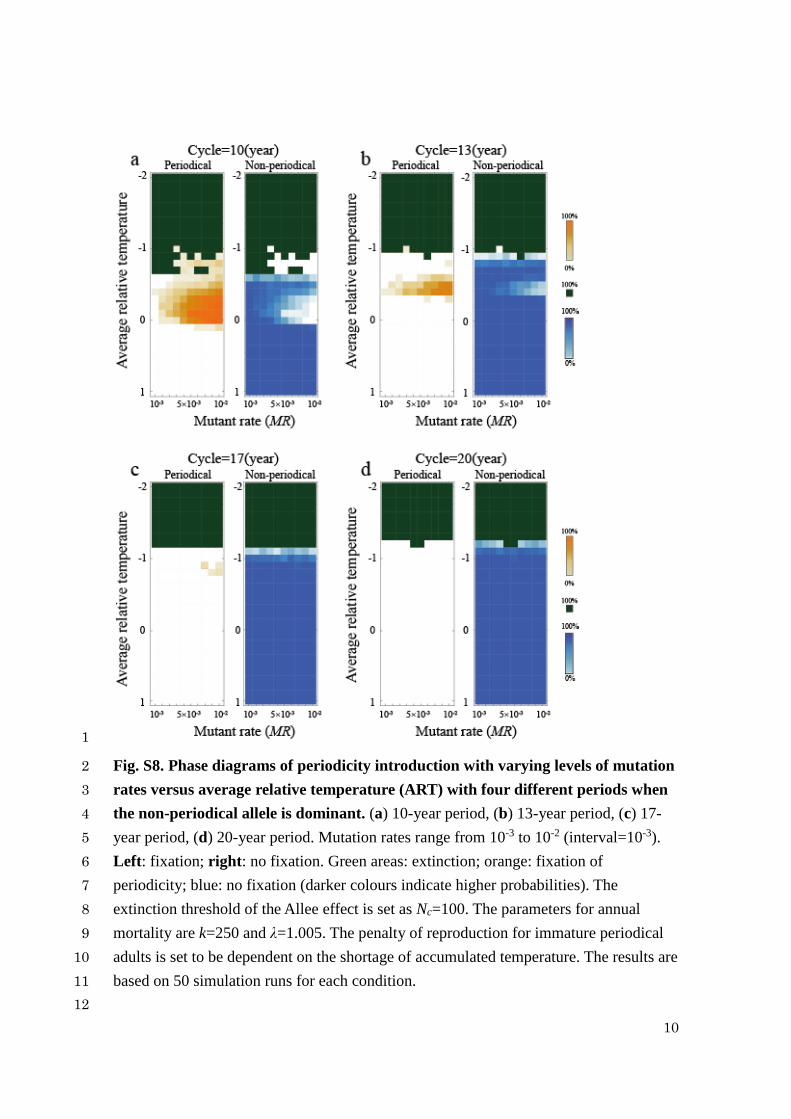
Fig. S8. Phase diagrams of periodicity introduction with varying levels of mutation 2
rates versus average relative temperature (ART) with four different periods when 3
the non-periodical allele is dominant. (a) 10-year period, (b) 13-year period, (c) 17-4
year period, (d) 20-year period. Mutation rates range from 10-3 to 10-2 (interval=10-3). 5
Left: fixation; right: no fixation. Green areas: extinction; orange: fixation of 6
periodicity; blue: no fixation (darker colours indicate higher probabilities). The 7
extinction threshold of the Allee effect is set as Nc=100. The parameters for annual 8
mortality are k=250 and λ=1.005. The penalty of reproduction for immature periodical 9
adults is set to be dependent on the shortage of accumulated temperature. The results are 10
based on 50 simulation runs for each condition. 11
12
11
1
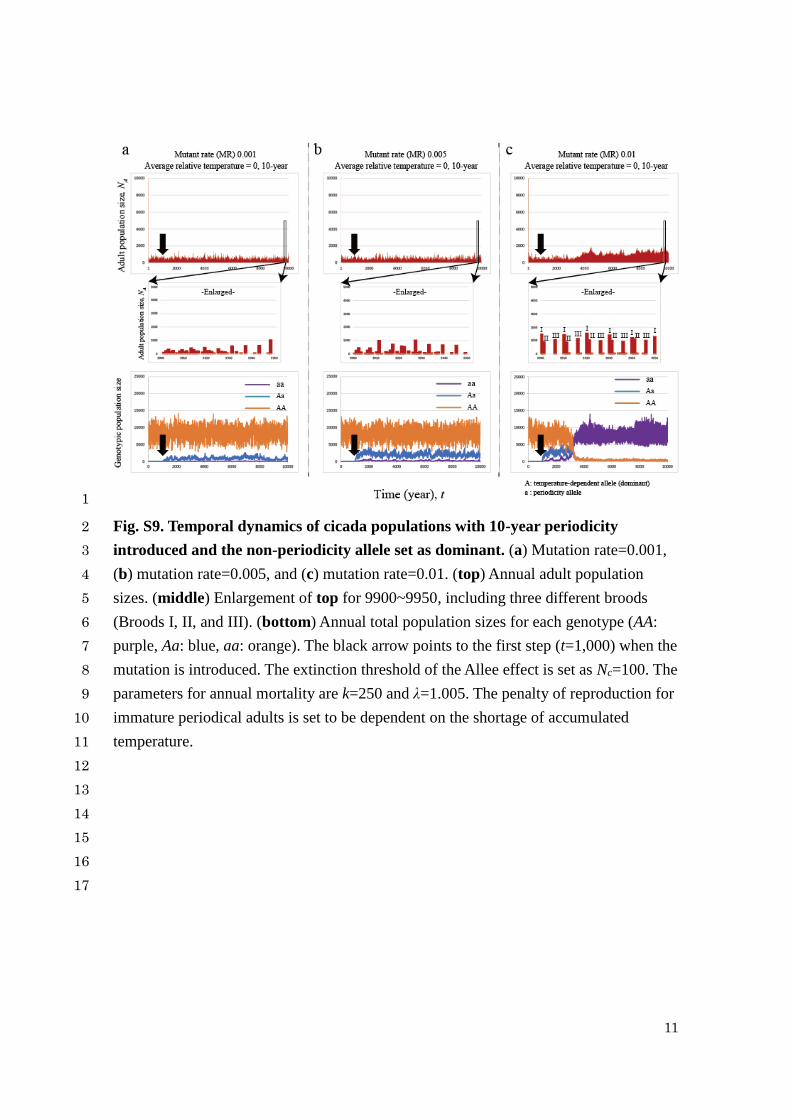
Fig. S9. Temporal dynamics of cicada populations with 10-year periodicity 2
introduced and the non-periodicity allele set as dominant. (a) Mutation rate=0.001, 3
(b) mutation rate=0.005, and (c) mutation rate=0.01. (top) Annual adult population 4
sizes. (middle) Enlargement of top for 9900~9950, including three different broods 5
(Broods I, II, and III). (bottom) Annual total population sizes for each genotype (AA: 6
purple, Aa: blue, aa: orange). The black arrow points to the first step (t=1,000) when the 7
mutation is introduced. The extinction threshold of the Allee effect is set as Nc=100. The 8
parameters for annual mortality are k=250 and λ=1.005. The penalty of reproduction for 9
immature periodical adults is set to be dependent on the shortage of accumulated 10
temperature. 11
12
13
14
15
16
17

12
1
Fig. S10. Phase diagrams of periodicity introduction with varying levels of 2
mutation rates versus average relative temperature (ART) with 10-year period 3
when the non-periodical allele is dominant. (a) The longevity of non-periodical 4
cicada nymphs is 50 years, (b) non-periodical cicadas automatically die if they do not 5
mature within a set period (same as Fig. S8a). Mutation rates range from 10-3 to 10-2 6
(interval=10-3). Left: fixation; right: no fixation. Green areas: extinction; orange: 7
fixation of periodicity; blue: no fixation (darker colours indicate higher probabilities). 8
The extinction threshold of the Allee effect is set as Nc=100. The parameters for annual 9
mortality are k=250 and λ=1.005. The penalty of reproduction for immature periodical 10
adults is set to be dependent on the shortage of accumulated temperature. The results are 11
based on 50 simulation runs for each condition. 12
13
14
15
16
13
1
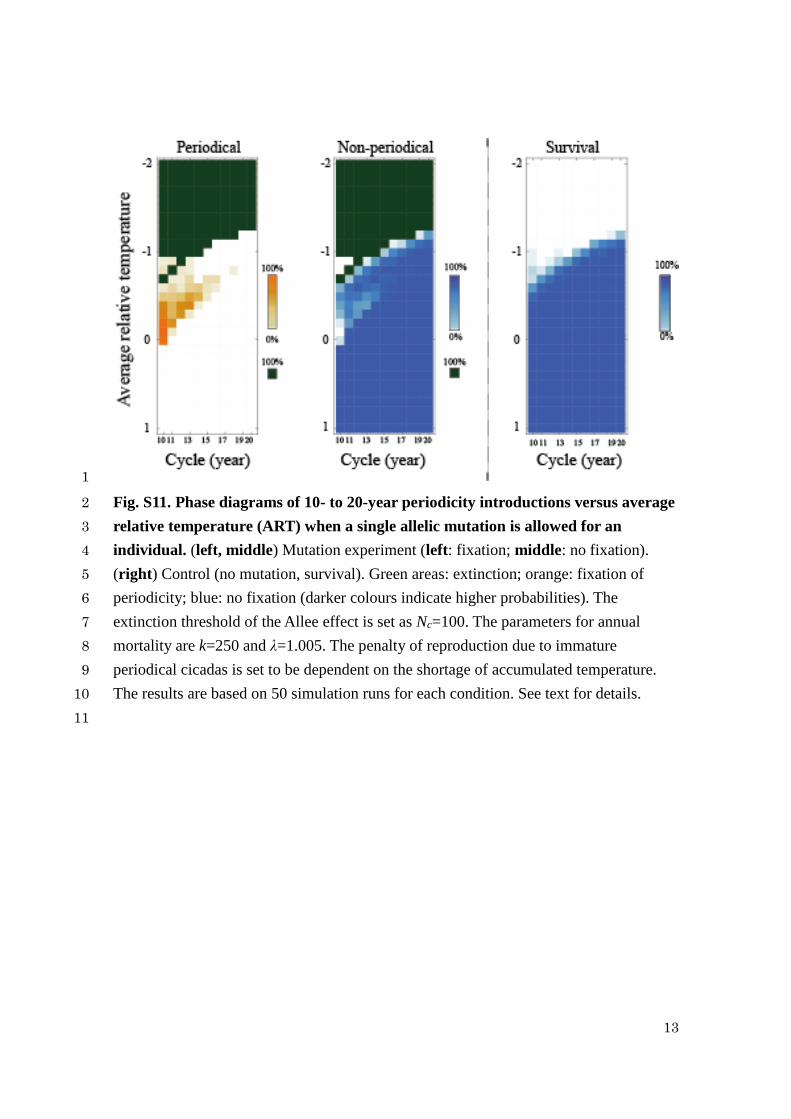
Fig. S11. Phase diagrams of 10- to 20-year periodicity introductions versus average 2
relative temperature (ART) when a single allelic mutation is allowed for an 3
individual. (left, middle) Mutation experiment (left: fixation; middle: no fixation). 4
(right) Control (no mutation, survival). Green areas: extinction; orange: fixation of 5
periodicity; blue: no fixation (darker colours indicate higher probabilities). The 6
extinction threshold of the Allee effect is set as Nc=100. The parameters for annual 7
mortality are k=250 and λ=1.005. The penalty of reproduction due to immature 8
periodical cicadas is set to be dependent on the shortage of accumulated temperature. 9
The results are based on 50 simulation runs for each condition. See text for details. 10
11

14
1
Fig. S12. (a, b) Phase diagrams of 10- to 20-year periodicity introductions versus 2
average relative temperature (ART) with variability in microhabitats. Microhabitat 3
variation follow a discretized and truncated normal distribution. (a) Low variability 4
(standard deviation=0.5) and (b) high variability (standard deviation=1.0). (c) Varying 5
variability (standard deviation=0.5-3.0). (left: fixation; right: no fixation). Green areas: 6
extinction; orange: fixation of periodicity; blue: no fixation (darker colours indicate 7
higher probabilities). The Allee effect is set as Nc=100. The parameters for annual 8
mortality are k=250 and λ=1.005. The penalty of reproduction for immature periodical 9
adults is set to be dependent on the shortage of accumulated temperature. The results are 10
based on 50 simulation runs for each condition. 11
12
15
1
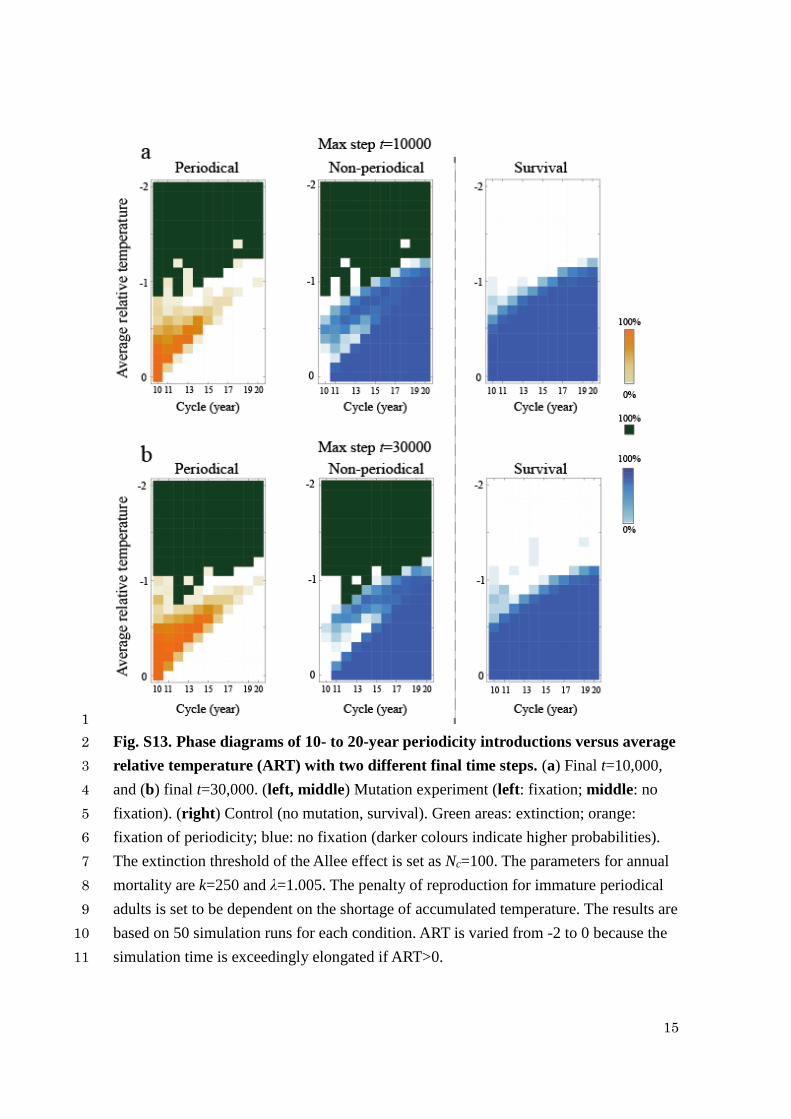
Fig. S13. Phase diagrams of 10- to 20-year periodicity introductions versus average 2
relative temperature (ART) with two different final time steps. (a) Final t=10,000, 3
and (b) final t=30,000. (left, middle) Mutation experiment (left: fixation; middle: no 4
fixation). (right) Control (no mutation, survival). Green areas: extinction; orange: 5
fixation of periodicity; blue: no fixation (darker colours indicate higher probabilities). 6
The extinction threshold of the Allee effect is set as Nc=100. The parameters for annual 7
mortality are k=250 and λ=1.005. The penalty of reproduction for immature periodical 8
adults is set to be dependent on the shortage of accumulated temperature. The results are 9
based on 50 simulation runs for each condition. ART is varied from -2 to 0 because the 10
simulation time is exceedingly elongated if ART>0. 11

16
1
Fig. S14. Phase diagrams of 10- to 20-year periodicity introductions versus average 2
relative temperature (ART) with/without yearly climate stochasticity and 3
individual microhabitat variations. (a) No climate stochasticity and no individual 4
variations, (b) no climate stochasticity but positive individual variations, (c) positive 5
climate stochasticity but no individual variations, and (d) positive climate stochasticity 6
and positive individual variations (same as Fig. 3). (left) Fixation, (right) no fixation. 7
Green areas: extinction; orange: fixation of periodicity; blue: no fixation (darker colours 8
indicate higher probabilities). The extinction threshold of the Allee effect is set as 9
Nc=100. The parameters for annual mortality are k=250 and λ=1.005. The penalty of 10
reproduction for immature periodical adults is set to be dependent on the shortage of 11
accumulated temperature. The results are based on 50 simulation runs for each 12
condition. Note that cycles (periods) correspond with the climatic conditions that evolve 13
with periodicity when there is no yearly climate stochasticity, e.g., during the 10-year 14
period in (a) and (b). Without individual microhabitat variations (a and c), the 15
extinction boundary is greatly extended towards the warm climate because all 16
individuals are very similar. 17