Evaluation of properties of crude oil and its fractions. · General Procedure for evaluation of...
10
2/16/2015 NPTEL :: Chemical Engineering Petroleum Refinery Engineering data:text/html;charset=utf8,%3Ctable%20width%3D%2280%25%22%20border%3D%220%22%20align%3D%22center%22%20cellpadding%3D%220%22%… 1/10 Evaluation of properties of crude oil and its fractions. General Procedure for evaluation of crude oil/ fractions 1. From the crude distillation data,plot TBP and gravity midpercent curves. 2. Select TBP cutpoints of products to be made from atmospheric and vacuum pipe stills. 3. From TBP and gravity curves, determine percentages and gravities of fractions. 4. Convert volumes percent to weight percents. 5. Determine weight of bottoms stream by difference.If the volume of bottom stream is taken from the TBP curve, then gravity is calculated from weight and volume. 6. For crude oils containing significant amounts of sulfur or nitrogen, it is also necessary to make sulfur and/or nitrogen balances around each unit. Example: Whole crude TBP Data (API Gravity 36.3) Table:2.2 Plot TBP, M.W , API AND Wt% CURVES FOR THE CRUDE oil Volume percent 5 10 20 30 40 50 60 TBP Temperature ( o F) 62 144 255 344 437 531 623 Volume percent 70 80 85 TBP Temperature ( o F) 717 819 897 CALCULATIONS SP.Gr.For whole crude = 141.5/ (131.5+ API) Sp. Gr. = 0.84 (for the crude oil) VABP for whole crude = (t 20 +t 50 +t 80 )/3 ==>VABP =[ ( 255+ 531+819)/3 ]= 535 o F TBP Slope =[ (t 70 t 10 )/ 60 ] = (717144)/60 = [9.6 o F/%] Correction Factor (from graph ) = 70 o F Mean Average Boiling Point ( MABP) = 535 70 = 465 o F Characterisation Factor Kw = 11.5 (Assumed constant) (From graph) Divide whole crude into various cuts Basis :100 Barrel of crude oil ( 1bbl= 42 US gallon, 1 US Gallon= 3.78 L) Basis 100 Barrel of crude oil( Weight of the crude = 100x0.843x 349.7=29500 Lb) (density of water = 349.7 lb/bbl) Table:2.3 [1,2] Boiling range (F) Cumulative vol.% VABP( F) MABP(F) API M.W Mid vol%
Transcript of Evaluation of properties of crude oil and its fractions. · General Procedure for evaluation of...

2/16/2015 NPTEL :: Chemical Engineering Petroleum Refinery Engineering
data:text/html;charset=utf8,%3Ctable%20width%3D%2280%25%22%20border%3D%220%22%20align%3D%22center%22%20cellpadding%3D%220%22%… 1/10
Evaluation of properties of crude oil and its fractions. General Procedure for evaluation of crude oil/ fractions1. From the crude distillation data,plot TBP and gravity midpercent curves.2. Select TBP cutpoints of products to be made from atmospheric and vacuum pipe stills.3. From TBP and gravity curves, determine percentages and gravities of fractions.4. Convert volumes percent to weight percents.5. Determine weight of bottoms stream by difference.If the volume of bottom stream is taken
from the TBP curve, then gravity is calculated from weight and volume.6. For crude oils containing significant amounts of sulfur or nitrogen, it is also necessary to make
sulfur and/or nitrogen balances around each unit.
Example: Whole crude TBP Data (API Gravity 36.3)
Table:2.2 Plot TBP, M.W , API AND Wt% CURVES FOR THE CRUDE oil
Volume percent 5 10 20 30 40 50 60
TBP Temperature (oF) 62 144 255 344 437 531 623
Volume percent 70 80 85
TBP Temperature (oF) 717 819 897
CALCULATIONS SP.Gr.For whole crude = 141.5/ (131.5+ API)Sp. Gr. = 0.84 (for the crude oil)VABP for whole crude = (t20+t50 + t 80)/3
==>VABP =[ ( 255+ 531+819)/3 ]= 535 oFTBP Slope =[ (t70 t10)/ 60 ]
= (717144)/60
= [9.6 oF/%]
Correction Factor (from graph ) = 70 oFMean Average Boiling Point ( MABP) = 535 70 = 465 oFCharacterisation Factor Kw = 11.5 (Assumed constant) (From graph)Divide whole crude into various cuts
Basis :100 Barrel of crude oil ( 1bbl= 42 US gallon, 1 US Gallon= 3.78 L)
Basis 100 Barrel of crude oil( Weight of the crude = 100x0.843x 349.7=29500 Lb)
(density of water = 349.7 lb/bbl)
Table:2.3[1,2]
Boiling range(F)
Cumulativevol.%
VABP(F) MABP(F) API M.W Mid
vol%
2/16/2015 NPTEL :: Chemical Engineering Petroleum Refinery Engineering
data:text/html;charset=utf8,%3Ctable%20width%3D%2280%25%22%20border%3D%220%22%20align%3D%22center%22%20cellpadding%3D%220%22%… 2/10
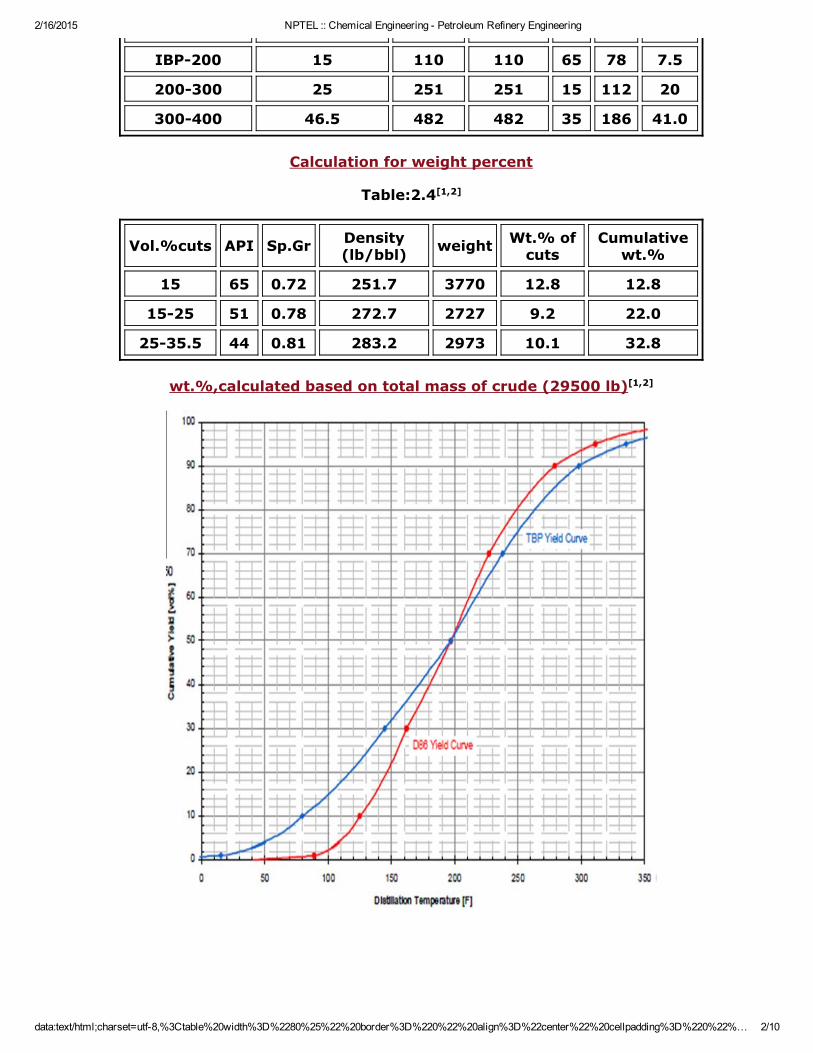
IBP200 15 110 110 65 78 7.5
200300 25 251 251 15 112 20
300400 46.5 482 482 35 186 41.0
Calculation for weight percent
Table:2.4[1,2]
Vol.%cuts API Sp.Gr Density(lb/bbl) weight Wt.% of
cutsCumulativewt.%
15 65 0.72 251.7 3770 12.8 12.8
1525 51 0.78 272.7 2727 9.2 22.0
2535.5 44 0.81 283.2 2973 10.1 32.8
wt.%,calculated based on total mass of crude (29500 lb)[1,2]

2/16/2015 NPTEL :: Chemical Engineering Petroleum Refinery Engineering
data:text/html;charset=utf8,%3Ctable%20width%3D%2280%25%22%20border%3D%220%22%20align%3D%22center%22%20cellpadding%3D%220%22%… 3/10
Fig:2.18 wt.%,calculated based on total mass of crude (29500 lb)[1,2]
Exercise
Complete the Table for other fractions (cuts).Plot API vs mid volume, Molecular weight vs MID Volume and weight percent vs mid volume forthese cuts.Calculate 50% ASTM and 50%EFV Boiling temperatures for each fraction and plot. Draw astmand EFV curves for the crude.
Fig:2.19
Crude Oil Assay Example1
2/16/2015 NPTEL :: Chemical Engineering Petroleum Refinery Engineering
data:text/html;charset=utf8,%3Ctable%20width%3D%2280%25%22%20border%3D%220%22%20align%3D%22center%22%20cellpadding%3D%220%22%… 4/10
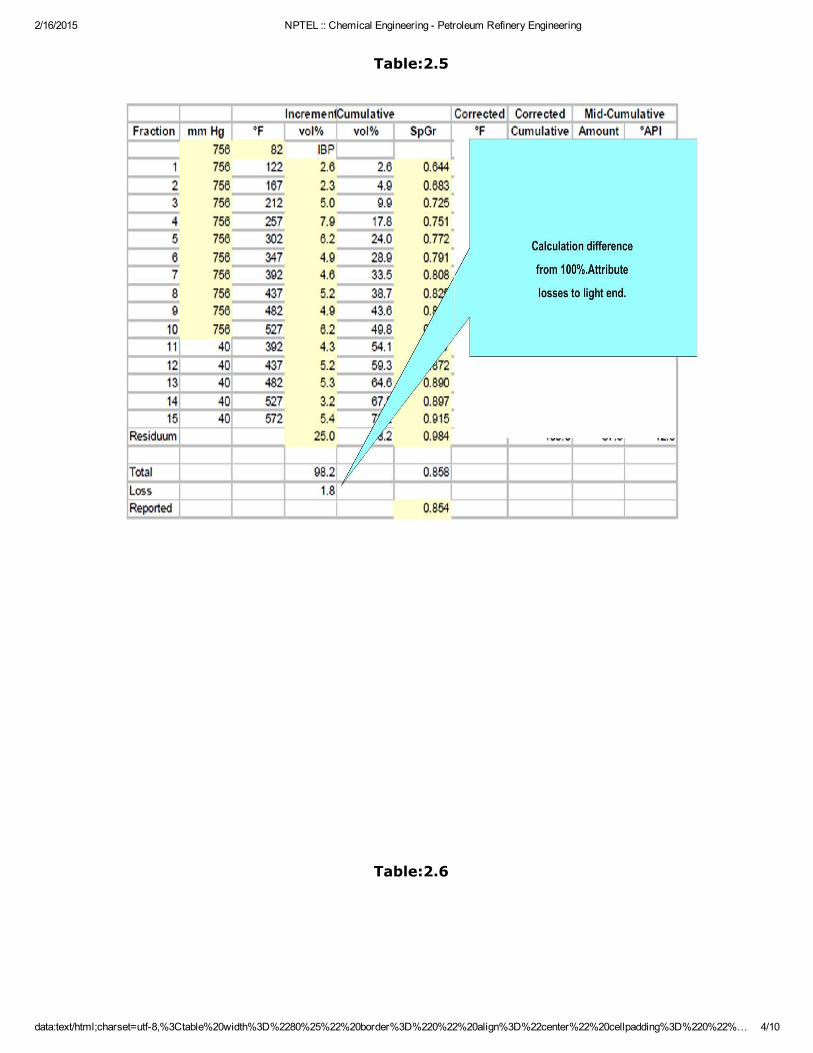
Table:2.5
Table:2.6

2/16/2015 NPTEL :: Chemical Engineering Petroleum Refinery Engineering
data:text/html;charset=utf8,%3Ctable%20width%3D%2280%25%22%20border%3D%220%22%20align%3D%22center%22%20cellpadding%3D%220%22%… 5/10
Table:2.7

2/16/2015 NPTEL :: Chemical Engineering Petroleum Refinery Engineering
data:text/html;charset=utf8,%3Ctable%20width%3D%2280%25%22%20border%3D%220%22%20align%3D%22center%22%20cellpadding%3D%220%22%… 6/10
50% Boiling Point on ASTM curve :can be calculated from the slope of TBP curve of acrude and its 50% B.P can be estimated
Fig:2.20
Fig:2.21 Different Slope and Interconversion
Table:2.8

2/16/2015 NPTEL :: Chemical Engineering Petroleum Refinery Engineering
data:text/html;charset=utf8,%3Ctable%20width%3D%2280%25%22%20border%3D%220%22%20align%3D%22center%22%20cellpadding%3D%220%22%… 7/10
2/16/2015 NPTEL :: Chemical Engineering Petroleum Refinery Engineering
data:text/html;charset=utf8,%3Ctable%20width%3D%2280%25%22%20border%3D%220%22%20align%3D%22center%22%20cellpadding%3D%220%22%… 8/10
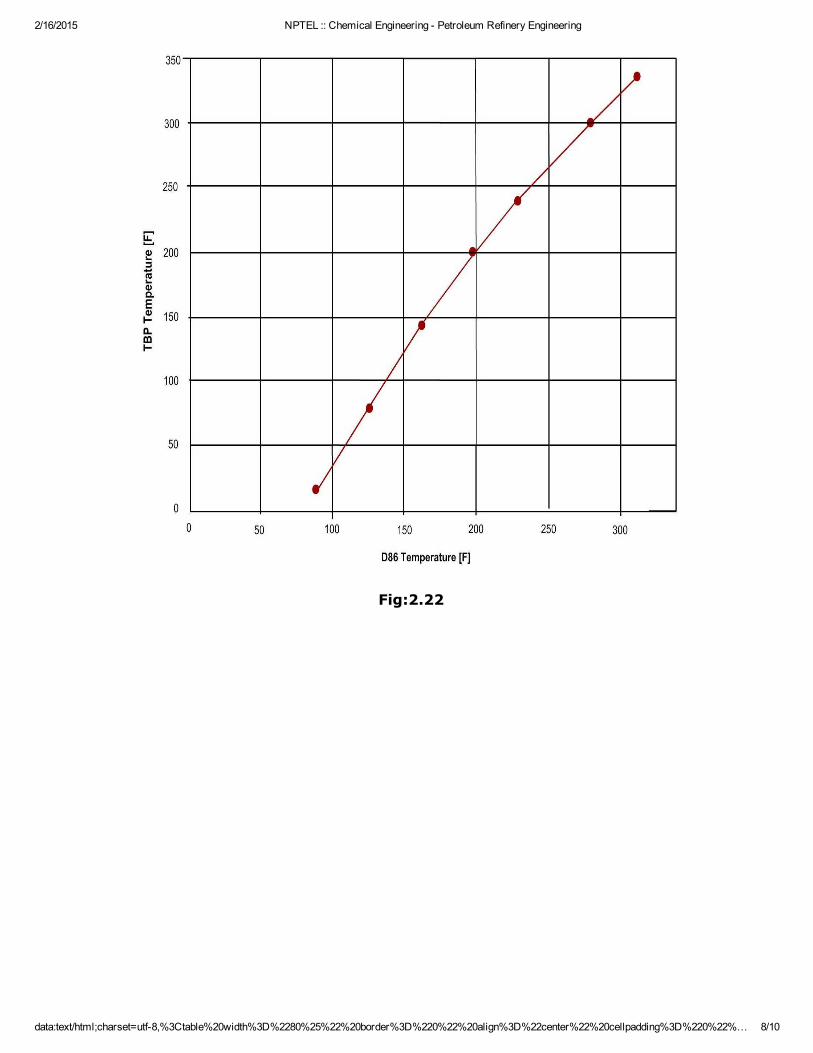
Fig:2.22

2/16/2015 NPTEL :: Chemical Engineering Petroleum Refinery Engineering
data:text/html;charset=utf8,%3Ctable%20width%3D%2280%25%22%20border%3D%220%22%20align%3D%22center%22%20cellpadding%3D%220%22%… 9/10
Fig:2.23
Linearized Distillation Yield Curves

2/16/2015 NPTEL :: Chemical Engineering Petroleum Refinery Engineering
data:text/html;charset=utf8,%3Ctable%20width%3D%2280%25%22%20border%3D%220%22%20align%3D%22center%22%20cellpadding%3D%220%22… 10/10
Fig:2.24 Linearized Distillation Yield Curves