
Evaluation of CT injection to RFP for performance ...
28
Evaluation of CT injection to RFP for performance improvement and reconnection studies A. Sanpei, T. Nagano, S. Nakanobo, R. Tsuboi, S. Kunita, M. Emori, H. Makizawa, H. Himura, N. Mizuguchi 1 , T. Akiyama 1 , T. Mizuuchi 2 , K.J. McCollam 3 , D.J. Den Hartog 3 , R. Paccagnella 4 S. Masamune US-Japan CT2016 Workshop, Aug 22-24, Irvine, CA Kyoto Institute of Technology, Kyoto 606-8585, Japan 1 NIFS, Toki 509-5292 , Japan 2 Inst. Adv. Energy, Kyoto University, Uji, Japan 3 University of Wisconsin-Madison, WI 53706, USA 4 Consorzio RFX, Padova 32157, Italy
Transcript of Evaluation of CT injection to RFP for performance ...

Evaluation of CT injection to RFP for
performance improvement and reconnection studies
A. Sanpei, T. Nagano, S. Nakanobo, R. Tsuboi, S. Kunita, M. Emori,
H. Makizawa, H. Himura, N. Mizuguchi1 , T. Akiyama1, T. Mizuuchi2,
K.J. McCollam3, D.J. Den Hartog3, R. Paccagnella4
S. Masamune
US-Japan CT2016 Workshop, Aug 22-24, Irvine, CA
Kyoto Institute of Technology, Kyoto 606-8585, Japan1 NIFS, Toki 509-5292 , Japan2 Inst. Adv. Energy, Kyoto University, Uji, Japan3 University of Wisconsin-Madison, WI 53706, USA4 Consorzio RFX, Padova 32157, Italy

Outline
Motivation of low-A RFP research
RELAX machine and its operational region
QSH state in RELAX with 3-D MHD simulations
MHD feedback control and performance improvement
Gas fueling and helicity injection for further
performance improvement
Relaxation and magnetic reconnection
Summary
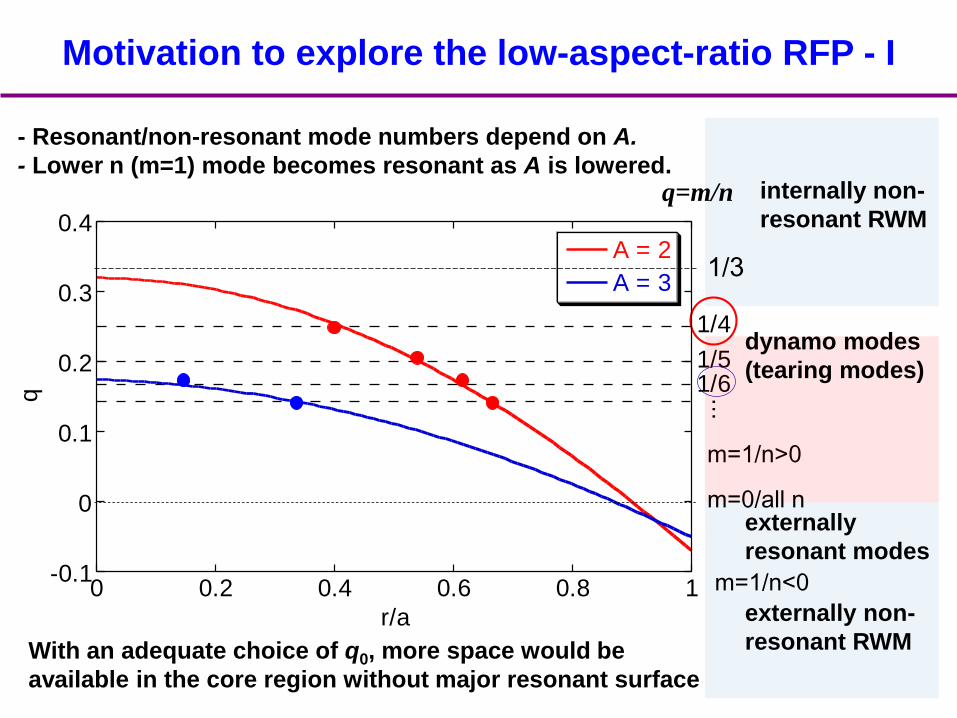
- Resonant/non-resonant mode numbers depend on A.
- Lower n (m=1) mode becomes resonant as A is lowered.
-0.1
0
0.1
0.2
0.3
0.4
0 0.2 0.4 0.6 0.8 1
A = 2
A = 3
q
r/a
1/4
1/51/6
...
q=m/n
1/3
internally non-
resonant RWM
externally
resonant modes
externally non-
resonant RWM
m=1/n>0
m=1/n<0
m=0/all n
dynamo modes
(tearing modes)
With an adequate choice of q0, more space would be
available in the core region without major resonant surface
Motivation to explore the low-aspect-ratio RFP - I

Peaked pressure profile with rather flat
temperature profile
Te(0)=300 eV, ne(0)=4.0x10¹⁹ m-3
at Ip=90 kA (nG~1.0)
poloidal beta =24%
=> bootstrap current fraction ~ 30%
Flat profiles for both pressure and
temperature
Te(0)=200 eV, ne(0)=3x10¹⁹ m-3
at Ip=95 kA
poloidal beta = 31%
=> bootstrap current fraction ~ 5%
Motivation to explore low-A RFP - II
Sizable bootstrap current could be expected in low-
A RFP (with very high-beta). (Shiina, 2005)
Estimate of the bootstrap current fraction with
equilibrium reconstruction using “RELAXFit” shows:
Bootstrap current fraction is sensitive to A and pressure profiles
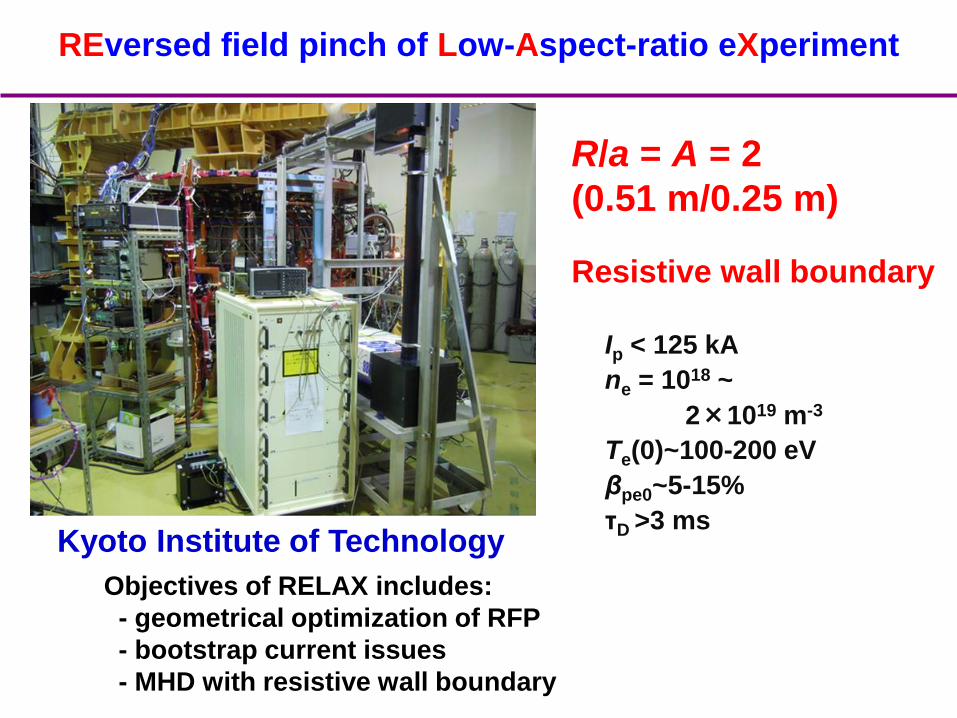
REversed field pinch of Low-Aspect-ratio eXperiment
R/a = A = 2
(0.51 m/0.25 m)
Resistive wall boundary
Kyoto Institute of Technology
Ip < 125 kA
ne = 1018 ~
2×10¹⁹ m-3
Te(0)~100-200 eV
βpe0~5-15%
τD >3 ms
Objectives of RELAX includes:
- geometrical optimization of RFP
- bootstrap current issues
- MHD with resistive wall boundary

BFM
Medium to high
aspect ratio RFP
Shallow reversal
In shallow reversal region,
Periodic Quasi-Single Helicity (QSH) or Helical Ohmic RFP state tends to be realized
In deep reversal, high-Θ region,
Amplitudes of resonant modes are suppressed with broad spectrum
SXR emission increases, indicating improved plasma performance
t
p )(
B
aB
t
t )(
B
aBF
(40kA<Ip<80kA)
(Ikezoe et al., PPCF 2012)
Wide operational range in (F, Θ) space is realized in RELAX
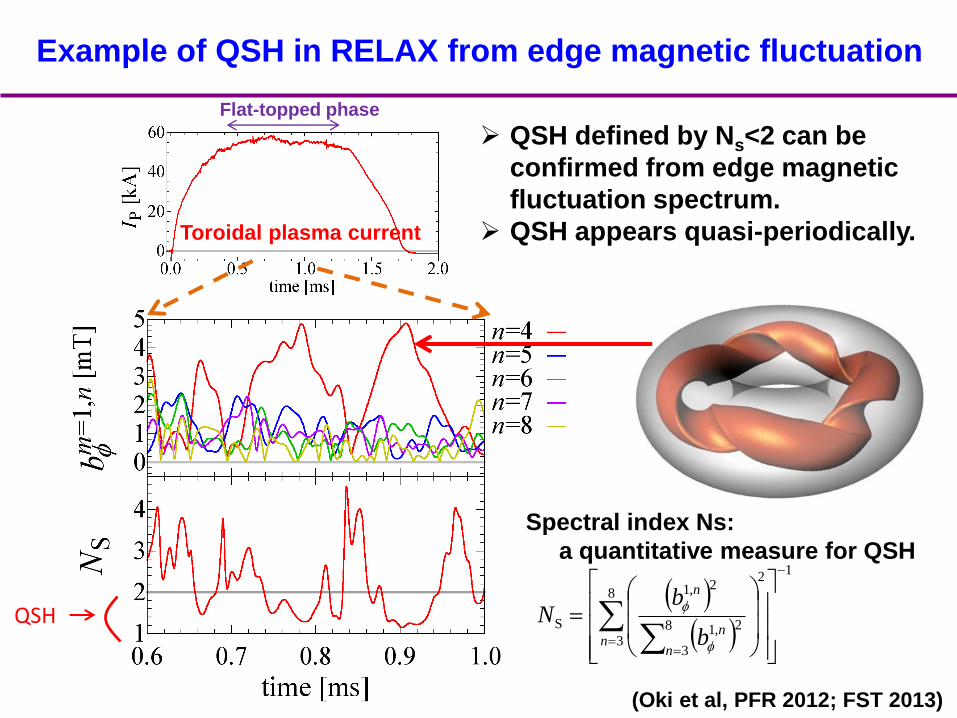
Example of QSH in RELAX from edge magnetic fluctuation
Toroidal plasma current
Flat-topped phase
QSH
QSH defined by Ns<2 can be
confirmed from edge magnetic
fluctuation spectrum.
QSH appears quasi-periodically.
1
8
3
2
8
3
2,1
2,1
S
nn
n
n
b
bN
Spectral index Ns:
a quantitative measure for QSH
(Oki et al, PFR 2012; FST 2013)

Comparison of the experimental and computed flux surfaces
Left: reconstructed magnetic surface shape using SXR imaging and CT
technique during QSH phase in RELAX. The major axis is to the left of the
cross section. Right: helical equi-pressure surface shape in 3-D MHD
simulation using the MIPS code. The helical states show good agreement.
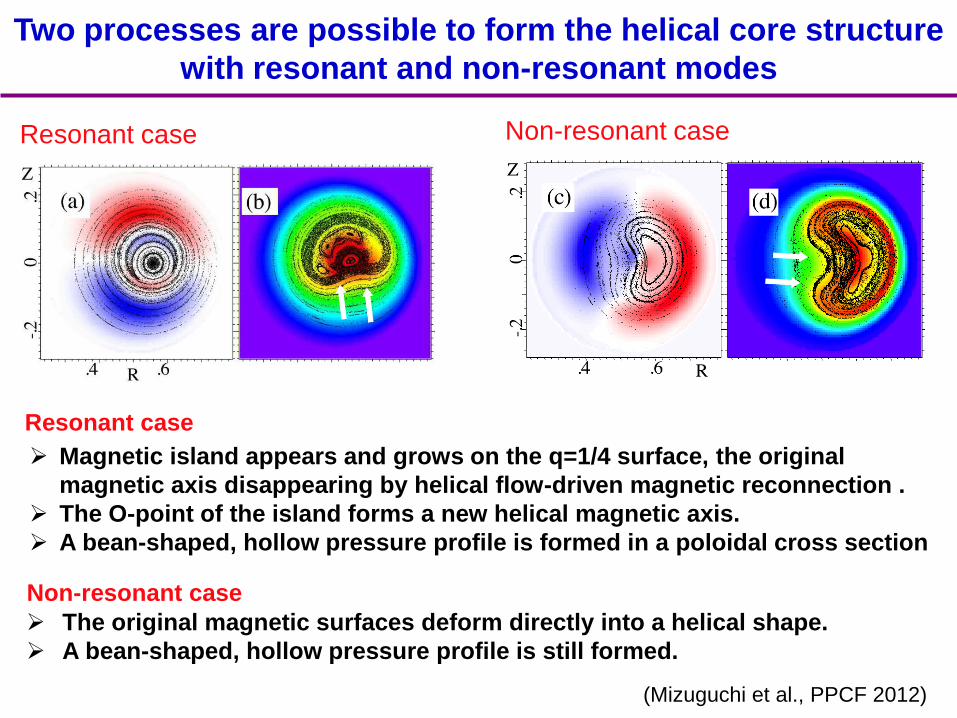
Two processes are possible to form the helical core structure
with resonant and non-resonant modes
Resonant case
Magnetic island appears and grows on the q=1/4 surface, the original
magnetic axis disappearing by helical flow-driven magnetic reconnection .
The O-point of the island forms a new helical magnetic axis.
A bean-shaped, hollow pressure profile is formed in a poloidal cross section
Non-resonant case
The original magnetic surfaces deform directly into a helical shape.
A bean-shaped, hollow pressure profile is still formed.
Resonant case
Non-resonant case
(Mizuguchi et al., PPCF 2012)

Wide operational range in (F, Θ) space is realized in RELAX
BFM
Shallow reversal
and non-reversed
region
Deep reversal
region
In shallow reversal region,
Quasi-periodic Quasi-Single Helicity (QSH) or Helical Ohmic RFP state tends to be realized
In deep reversal, high-Θ region,
Amplitudes of resonant modes are suppressed with broad spectrum
SXR emission increases, indicating improved plasma performance
t
p )(
B
aB
t
t )(
B
aBF
(40 kA < Ip < 80kA)
(Ikezoe et al., PPCF 2012)
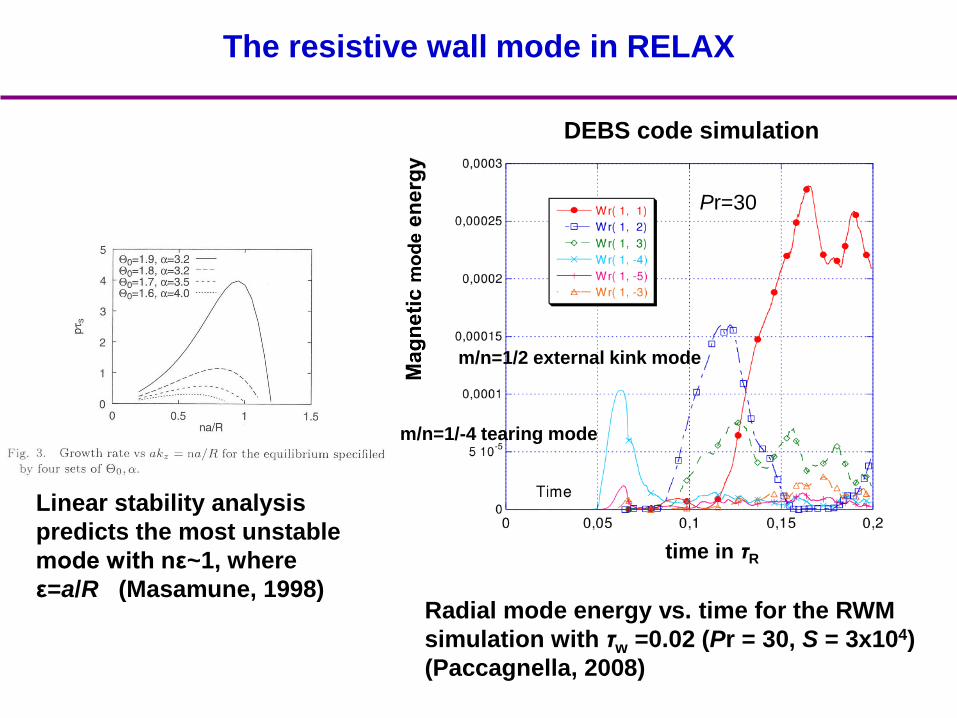
The resistive wall mode in RELAX
Radial mode energy vs. time for the RWM
simulation with τw =0.02 (Pr = 30, S = 3x10⁴)
(Paccagnella, 2008)
time in τR
Pr=30
m/n=1/2 external kink mode
m/n=1/-4 tearing mode
DEBS code simulation
Linear stability analysis
predicts the most unstable
mode with nε~1, where
ε=a/R (Masamune, 1998)

Saddle coil array for feedback control of MHD modes
• Feedback control of a single RWM
has been performed using 64 saddle
coils (4X16) covering the whole torus.
• The saddle coils are connected in
series to form m/n=1/2 helical
windings, with separate coils at two
poloidal gaps, for stabilization of the
most unstable RWM in RELAX.
4x16 saddle coil array
saddle coil connection for m/n=1/2
mode stabilization with separate
control at two poloidal gaps Diagram of the control power supply
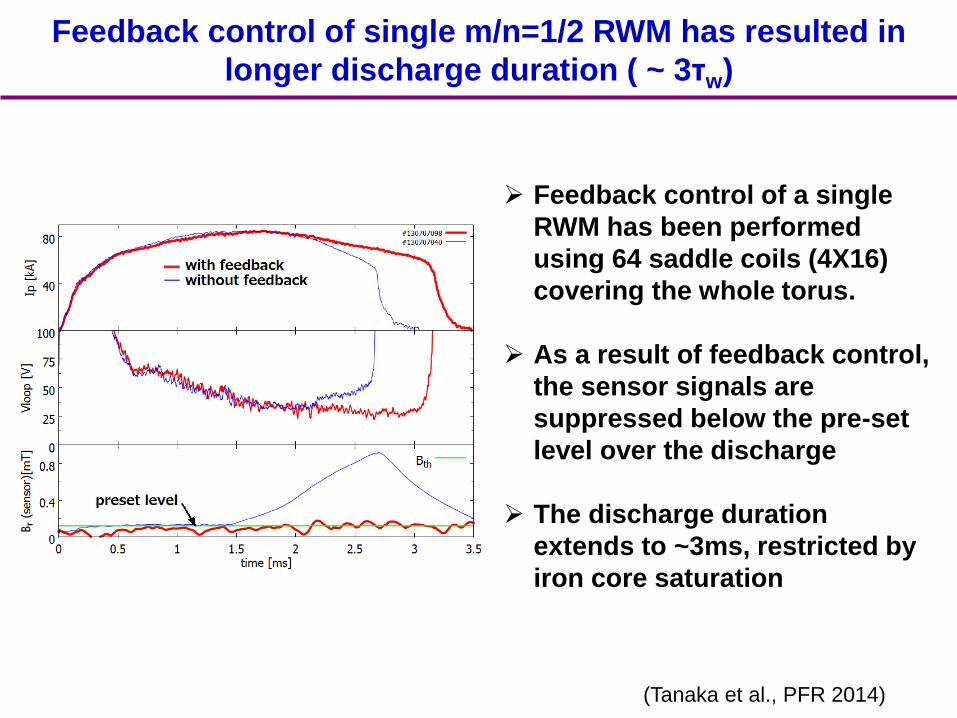
Feedback control of single m/n=1/2 RWM has resulted in
longer discharge duration ( ~ 3τw)
Feedback control of a single
RWM has been performed
using 64 saddle coils (4X16)
covering the whole torus.
As a result of feedback control,
the sensor signals are
suppressed below the pre-set
level over the discharge
The discharge duration
extends to ~3ms, restricted by
iron core saturation
(Tanaka et al., PFR 2014)

Poloidal currents at the insulated gaps produce
signals to the feedback sensor coils
Poloidal current flows in the
vessel and flanges when the
reversed toroidal field is
applied in the current rise
phase.
The poloidal current persists
because of the longer L/R time
of the flanges.
The resultant fields produce
signals to the feedback sensor
coils as m/n=1/2 component.

Independent control at the poloidal gaps
leads to further improvement
m/n=1/2 mode amplitude (outside the vessel) is lowered
particularly during the current rise phase.
In the three cases, the discharge duration is limited by the
saturation of iron core (~0.2 Vs).
w/o feedback control
w/o independent control
with independent control
⇒Signals from Br sine
and cosine coil array.
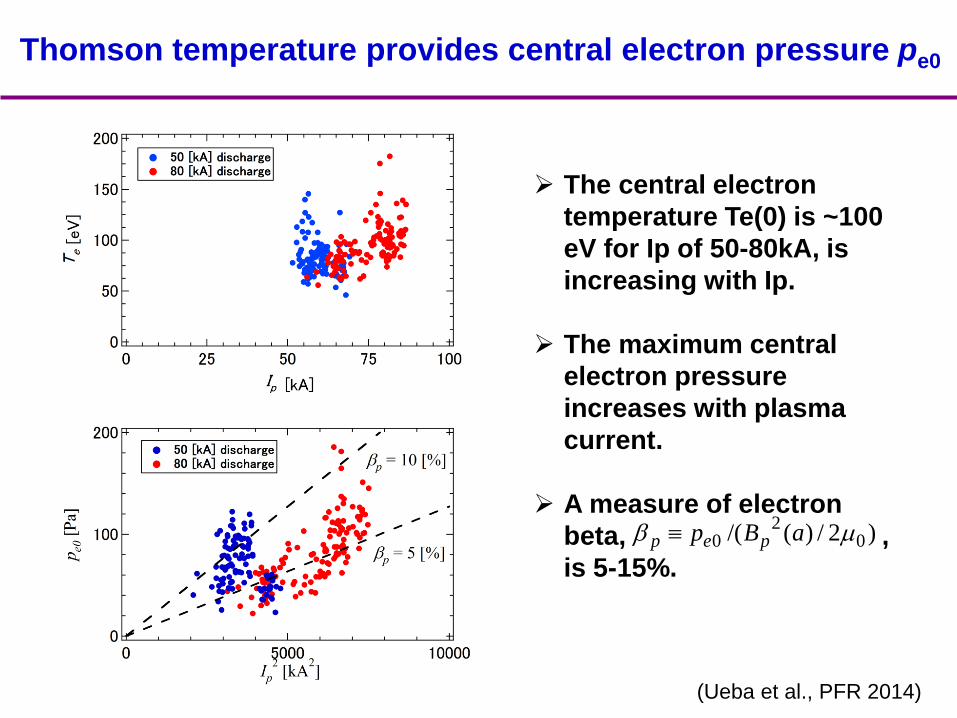
Thomson temperature provides central electron pressure pe0
The central electron
temperature Te(0) is ~100
eV for Ip of 50-80kA, is
increasing with Ip.
The maximum central
electron pressure
increases with plasma
current.
A measure of electron
beta, ,
is 5-15%.
)2/)(/( 02
0 aBp pep
(Ueba et al., PFR 2014)
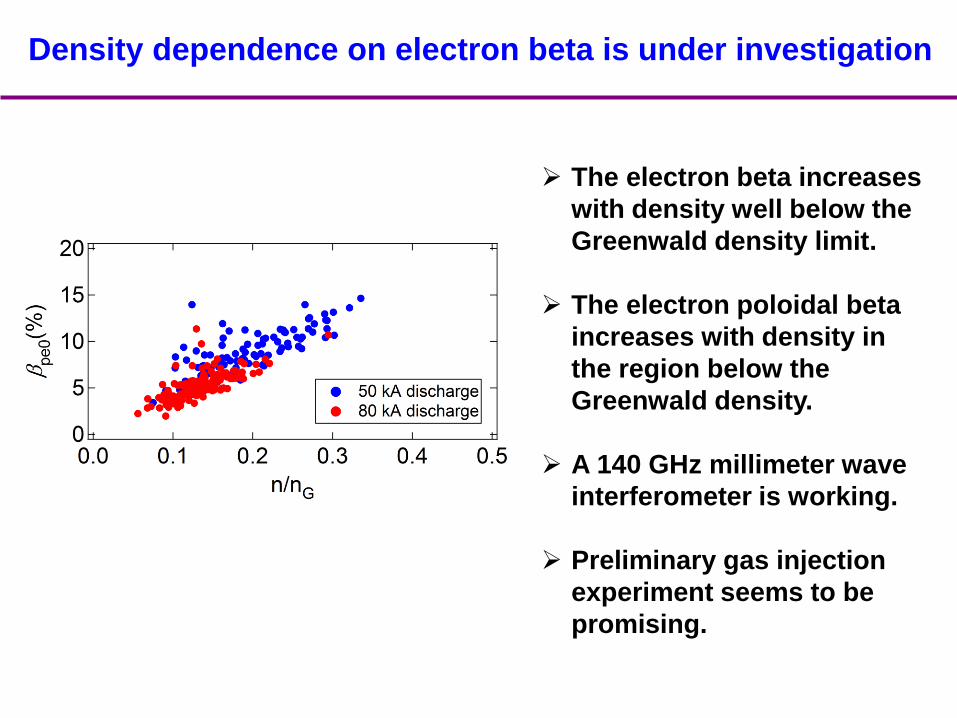
Density dependence on electron beta is under investigation
The electron beta increases
with density well below the
Greenwald density limit.
The electron poloidal beta
increases with density in
the region below the
Greenwald density.
A 140 GHz millimeter wave
interferometer is working.
Preliminary gas injection
experiment seems to be
promising.
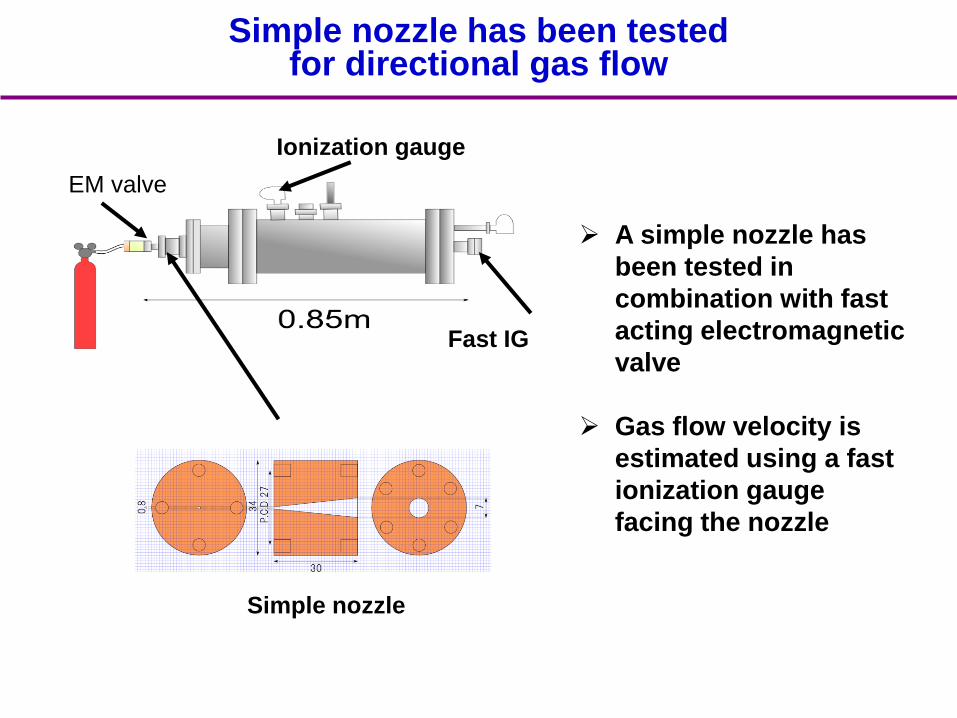
Simple nozzle has been testedfor directional gas flow
A simple nozzle has
been tested in
combination with fast
acting electromagnetic
valve
Gas flow velocity is
estimated using a fast
ionization gauge
facing the nozzle
EM valve
Simple nozzle
Fast IG
Ionization gauge
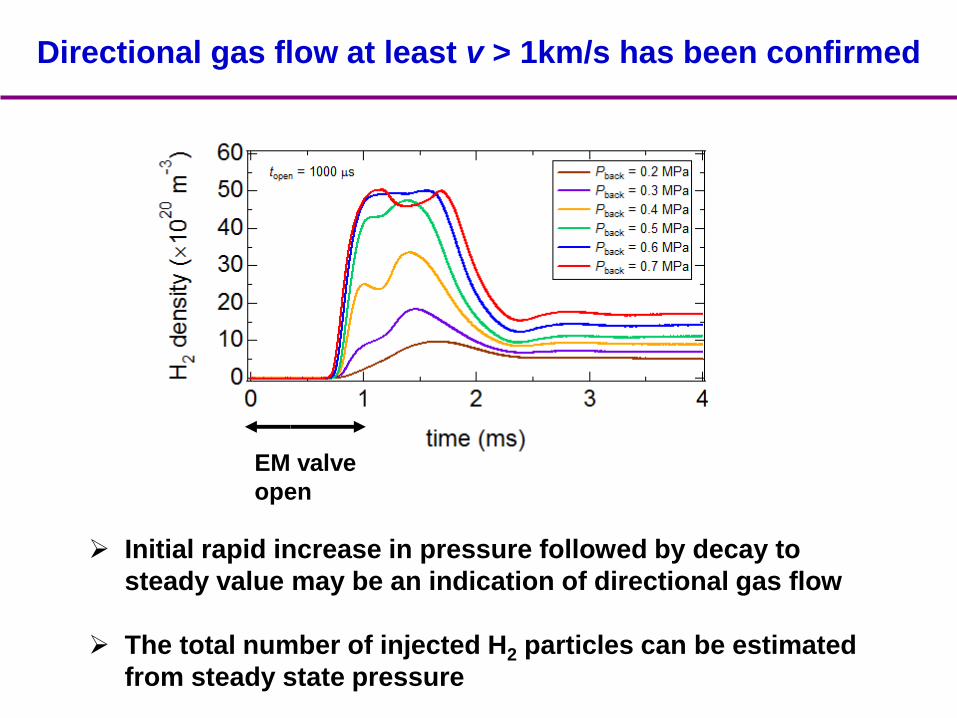
Directional gas flow at least v > 1km/s has been confirmed
EM valve
open
Initial rapid increase in pressure followed by decay to
steady value may be an indication of directional gas flow
The total number of injected H2 particles can be estimated
from steady state pressure

Magnetic helicty in a toroidal system
Magnetic helicity in RELAX plasma at Ip~100kA:
)(1.0
)(106 3
Wb
Wb
)(106 241 WbK

CT Injector for TPE-RX
CT Injector installed in TPE-RX
(vertical injection)
Dependence of CT velocity on Vgan
(Y. Kikuchi et al. , Univ. Hyogo)
CT Speed required for
injection to RELAX:~35 ㎞/s
The injector is transferred to RELAX
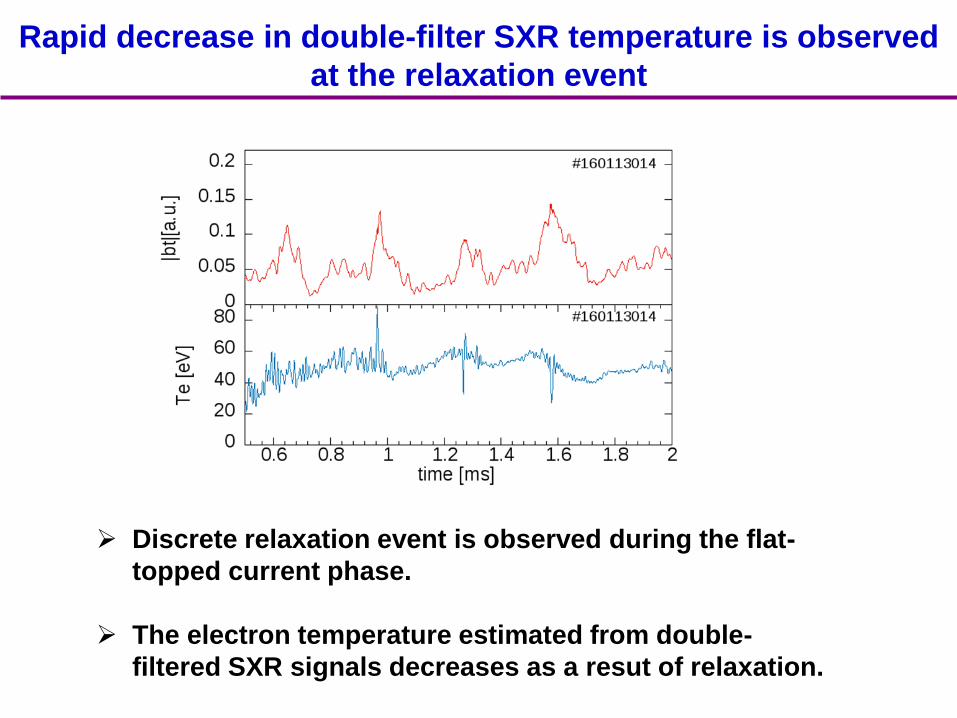
Rapid decrease in double-filter SXR temperature is observed
at the relaxation event
Discrete relaxation event is observed during the flat-
topped current phase.
The electron temperature estimated from double-
filtered SXR signals decreases as a resut of relaxation.
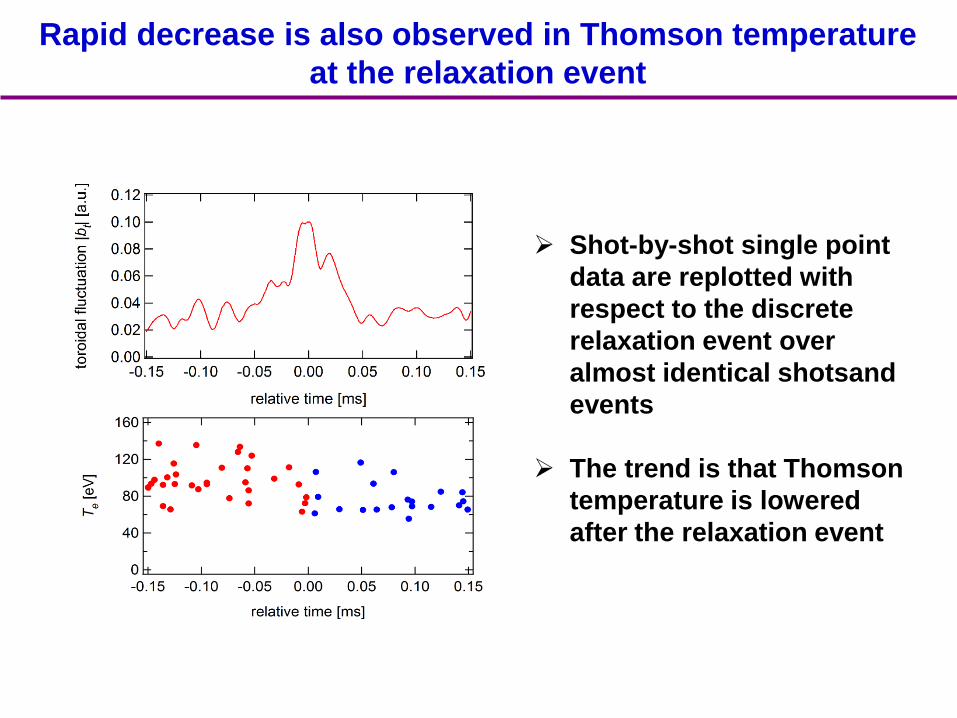
Rapid decrease is also observed in Thomson temperature
at the relaxation event
Shot-by-shot single point
data are replotted with
respect to the discrete
relaxation event over
almost identical shotsand
events
The trend is that Thomson
temperature is lowered
after the relaxation event
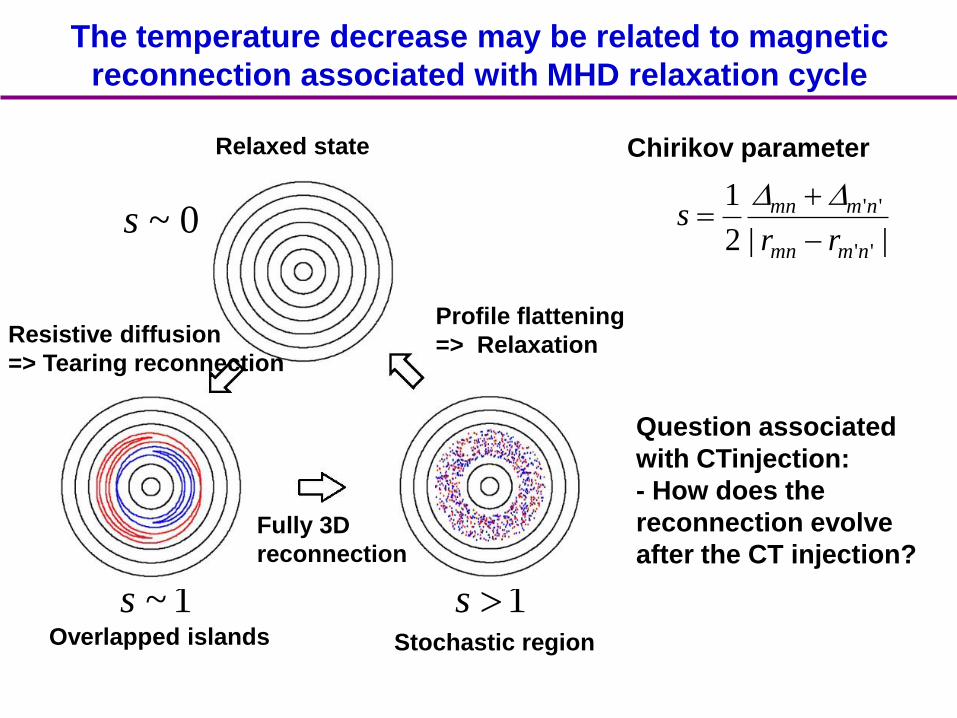
The temperature decrease may be related to magnetic
reconnection associated with MHD relaxation cycle
Chirikov parameter
||2
1
''
''
nmmn
nmmn
rrs
1~s 1s
0~s
Relaxed state
Resistive diffusion
=> Tearing reconnection
Overlapped islands Stochastic region
Profile flattening
=> Relaxation
Question associated
with CTinjection:
- How does the
reconnection evolve
after the CT injection?Fully 3D
reconnection
Summary
• As the performance of RELAX plasmas is improved, we are in a
good position to verify bootstrap current in a low-A RFP.
• Further efforts to obtain higher temperature and higher density
are in progress for high-beta plasmas with improved
performance.
- Electron temperature=>high current, PPCD?
- Electron density=>fast gas puffing.
• A scenario for achieving high performance QSH with good
controllability is required.
• Evaluation of CT injection (for helicity injection) in current rise
phase to save poloidal flux is in progress.

Thank you for your attention.

3-D MHD simulation study on formation process of
helical RFP state in low-A configuration
.
,
,
,
,)(3
4)1(
)1()(
),()(3
4
)2
(
),(
0
222
2
uω
Bj
jBuE
EB
u
uu
ωu
Bjuωu
u
t
j
ppt
p
pu
t
t
- nonlinear MHD
- resistive
- compressible
MHD solver:
MIPS : MHD Infrastructure for Plasma Simulation
(Y. Todo et al., Plasma Fusion Res. 5 (2010) S2062.)
4
5
108
101
52/1 10)(
80/
H
P
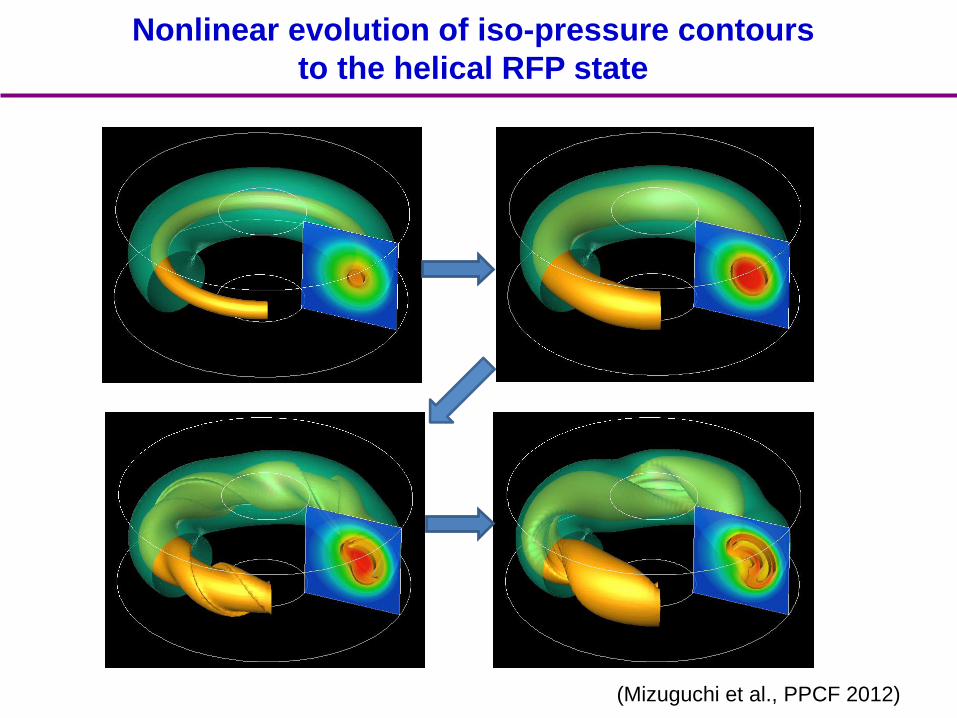
Nonlinear evolution of iso-pressure contours
to the helical RFP state
(Mizuguchi et al., PPCF 2012)