Evaluation of Colloidal Titration for the Determination of...
61
Evaluation of Colloidal Titration for the Determination of Surface Charge of Activated Sludge Flocs Master’s Thesis in the International Master’s Programme Applied Environmental Measurement Techniques SUDHA GARIKIPATI Department of Civil and Environmental Engineering Water Environment Technology CHALMERS UNIVERSITY OF TECHNOLOGY Göteborg, Sweden 2005 Master’s Thesis 2005:45
Transcript of Evaluation of Colloidal Titration for the Determination of...

Evaluation of Colloidal Titration for the Determination of Surface Charge of Activated Sludge Flocs Master’s Thesis in the International Master’s Programme Applied Environmental Measurement Techniques SUDHA GARIKIPATI Department of Civil and Environmental Engineering Water Environment Technology CHALMERS UNIVERSITY OF TECHNOLOGY Göteborg, Sweden 2005 Master’s Thesis 2005:45
1
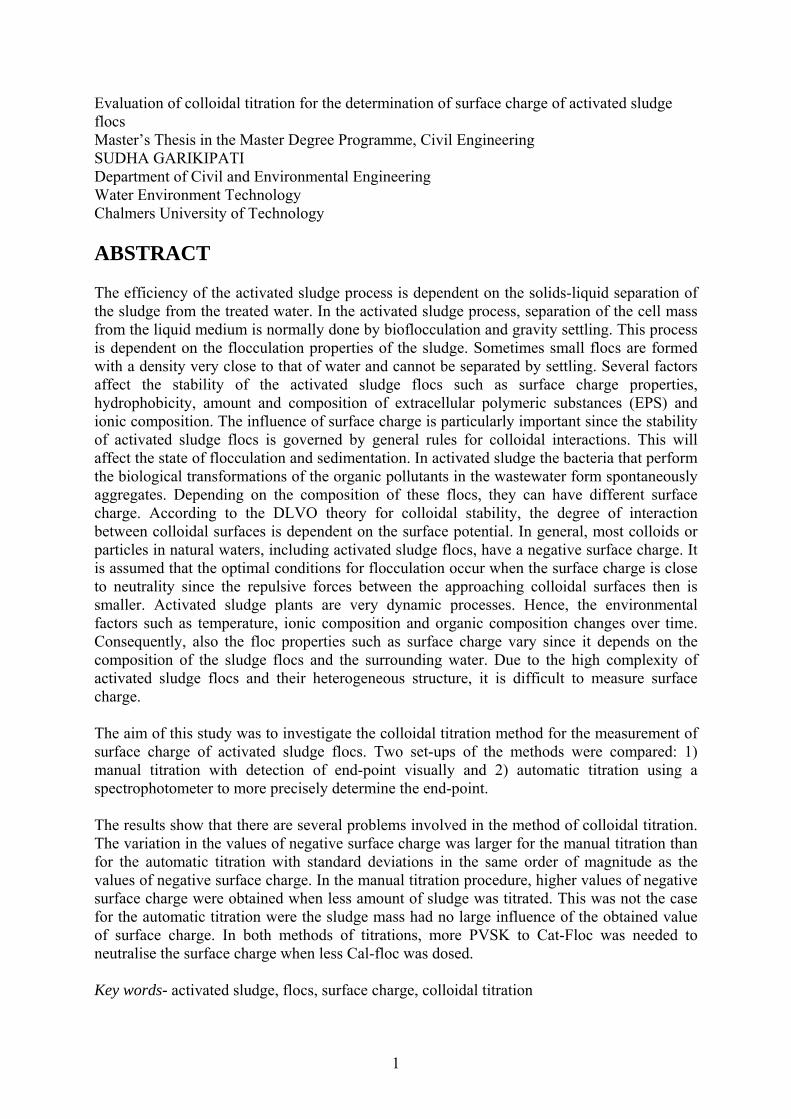
Evaluation of colloidal titration for the determination of surface charge of activated sludge flocs Master’s Thesis in the Master Degree Programme, Civil Engineering SUDHA GARIKIPATI Department of Civil and Environmental Engineering Water Environment Technology Chalmers University of Technology ABSTRACT The efficiency of the activated sludge process is dependent on the solids-liquid separation of the sludge from the treated water. In the activated sludge process, separation of the cell mass from the liquid medium is normally done by bioflocculation and gravity settling. This process is dependent on the flocculation properties of the sludge. Sometimes small flocs are formed with a density very close to that of water and cannot be separated by settling. Several factors affect the stability of the activated sludge flocs such as surface charge properties, hydrophobicity, amount and composition of extracellular polymeric substances (EPS) and ionic composition. The influence of surface charge is particularly important since the stability of activated sludge flocs is governed by general rules for colloidal interactions. This will affect the state of flocculation and sedimentation. In activated sludge the bacteria that perform the biological transformations of the organic pollutants in the wastewater form spontaneously aggregates. Depending on the composition of these flocs, they can have different surface charge. According to the DLVO theory for colloidal stability, the degree of interaction between colloidal surfaces is dependent on the surface potential. In general, most colloids or particles in natural waters, including activated sludge flocs, have a negative surface charge. It is assumed that the optimal conditions for flocculation occur when the surface charge is close to neutrality since the repulsive forces between the approaching colloidal surfaces then is smaller. Activated sludge plants are very dynamic processes. Hence, the environmental factors such as temperature, ionic composition and organic composition changes over time. Consequently, also the floc properties such as surface charge vary since it depends on the composition of the sludge flocs and the surrounding water. Due to the high complexity of activated sludge flocs and their heterogeneous structure, it is difficult to measure surface charge. The aim of this study was to investigate the colloidal titration method for the measurement of surface charge of activated sludge flocs. Two set-ups of the methods were compared: 1) manual titration with detection of end-point visually and 2) automatic titration using a spectrophotometer to more precisely determine the end-point. The results show that there are several problems involved in the method of colloidal titration. The variation in the values of negative surface charge was larger for the manual titration than for the automatic titration with standard deviations in the same order of magnitude as the values of negative surface charge. In the manual titration procedure, higher values of negative surface charge were obtained when less amount of sludge was titrated. This was not the case for the automatic titration were the sludge mass had no large influence of the obtained value of surface charge. In both methods of titrations, more PVSK to Cat-Floc was needed to neutralise the surface charge when less Cal-floc was dosed. Key words- activated sludge, flocs, surface charge, colloidal titration

2
ACKNOWLEDGEMENT My thesis work wouldn’t have been complete without the contribution of many people. First and foremost I would like to thank my supervisor Dr.Britt-Marie Wilén for her guidance throughout the project. Also I would like to thank Professor Greg Morrison and Dr.Ann-Margaret Strömvall for giving me an opportunity to study at the WET department at Chalmers University of Technology, Göteborg, Sweden. I would like to express my gratitude to Jesper and Mona at the WET laboratory for providing me an opportunity to conduct my experiments and were very helpful at all times. Also my friends at Chalmers and abroad who were very encouraging and helpful with their support at all times, when times were difficult for me. I would like to express my special thanks to Siva, Pallavi and Bharathi for being such good friends to me at all times. Last but not the least; words are not enough to thank my parents for their support mentally, financially and emotionally. Without their support I would have never been able to come to Chalmers and study here. This work is dedicated to them with all my love! Göteborg March 2005
3
TABLE OF CONTENTS ABSTRACT............................................................................................................................... 1 ACKNOWLEDGEMENT ......................................................................................................... 2 TABLE OF CONTENTS........................................................................................................... 3 GLOSSARY............................................................................................................................... 4 1. INTRODUCTION.................................................................................................................. 5
1.1 Background ................................................................................................................ 5 1.2 Aim................................................................................................................................... 6
2. LITERATURE REVIEW....................................................................................................... 7 2.1 The Activated sludge process........................................................................................... 7 2.2 Wastewater characteristics ............................................................................................... 9 2.3 Activated Sludge Flocs................................................................................................... 10 2.4 Flocculation of activated sludge..................................................................................... 11 2.5 Conceptual Floc Models................................................................................................. 12 2.6 Surface Charge ............................................................................................................... 16 2.7 Measurement of Surface Charge .................................................................................... 19 3.1 Sludge samples............................................................................................................... 21 3.2 Colloidal titration ........................................................................................................... 21
3.2.1 Manual titration ...................................................................................................... 22 3.2.2 Automatic titration .................................................................................................. 22
4. RESULTS AND DISCUSSION .......................................................................................... 25 4.1. Manual titration ............................................................................................................. 25 4.2. Automatic titration ........................................................................................................ 31
5. CONCLUSIONS.................................................................................................................. 37 6. REFERENCES..................................................................................................................... 39 Appendix for Manual Titrations............................................................................................... 43
4
GLOSSARY COD – Chemical Oxygen Demand DLVO theory – Derjaguin, Landau,Verwey and Overbeek theory SVI – Sludge Volume Index PVSK – Potassium Poly Vinyl Sulphate TB – Toludiene Blue
5
1. INTRODUCTION
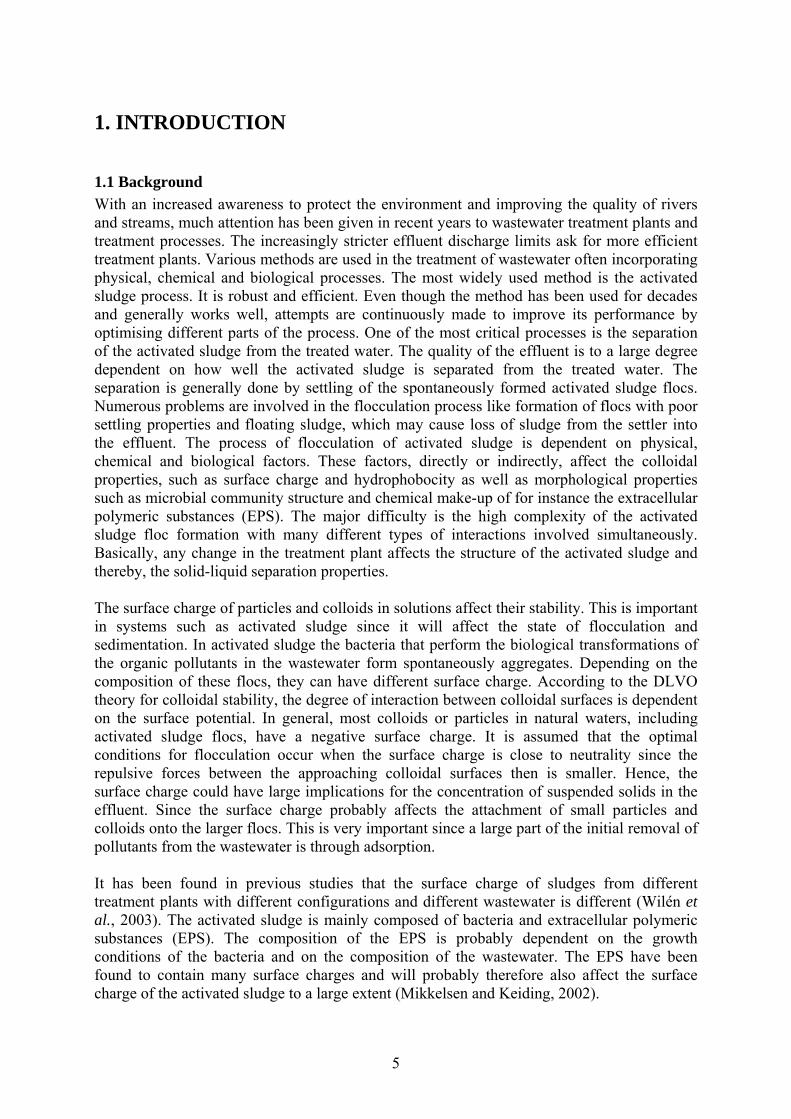
1.1 Background With an increased awareness to protect the environment and improving the quality of rivers and streams, much attention has been given in recent years to wastewater treatment plants and treatment processes. The increasingly stricter effluent discharge limits ask for more efficient treatment plants. Various methods are used in the treatment of wastewater often incorporating physical, chemical and biological processes. The most widely used method is the activated sludge process. It is robust and efficient. Even though the method has been used for decades and generally works well, attempts are continuously made to improve its performance by optimising different parts of the process. One of the most critical processes is the separation of the activated sludge from the treated water. The quality of the effluent is to a large degree dependent on how well the activated sludge is separated from the treated water. The separation is generally done by settling of the spontaneously formed activated sludge flocs. Numerous problems are involved in the flocculation process like formation of flocs with poor settling properties and floating sludge, which may cause loss of sludge from the settler into the effluent. The process of flocculation of activated sludge is dependent on physical, chemical and biological factors. These factors, directly or indirectly, affect the colloidal properties, such as surface charge and hydrophobocity as well as morphological properties such as microbial community structure and chemical make-up of for instance the extracellular polymeric substances (EPS). The major difficulty is the high complexity of the activated sludge floc formation with many different types of interactions involved simultaneously. Basically, any change in the treatment plant affects the structure of the activated sludge and thereby, the solid-liquid separation properties. The surface charge of particles and colloids in solutions affect their stability. This is important in systems such as activated sludge since it will affect the state of flocculation and sedimentation. In activated sludge the bacteria that perform the biological transformations of the organic pollutants in the wastewater form spontaneously aggregates. Depending on the composition of these flocs, they can have different surface charge. According to the DLVO theory for colloidal stability, the degree of interaction between colloidal surfaces is dependent on the surface potential. In general, most colloids or particles in natural waters, including activated sludge flocs, have a negative surface charge. It is assumed that the optimal conditions for flocculation occur when the surface charge is close to neutrality since the repulsive forces between the approaching colloidal surfaces then is smaller. Hence, the surface charge could have large implications for the concentration of suspended solids in the effluent. Since the surface charge probably affects the attachment of small particles and colloids onto the larger flocs. This is very important since a large part of the initial removal of pollutants from the wastewater is through adsorption. It has been found in previous studies that the surface charge of sludges from different treatment plants with different configurations and different wastewater is different (Wilén et al., 2003). The activated sludge is mainly composed of bacteria and extracellular polymeric substances (EPS). The composition of the EPS is probably dependent on the growth conditions of the bacteria and on the composition of the wastewater. The EPS have been found to contain many surface charges and will probably therefore also affect the surface charge of the activated sludge to a large extent (Mikkelsen and Keiding, 2002).
6
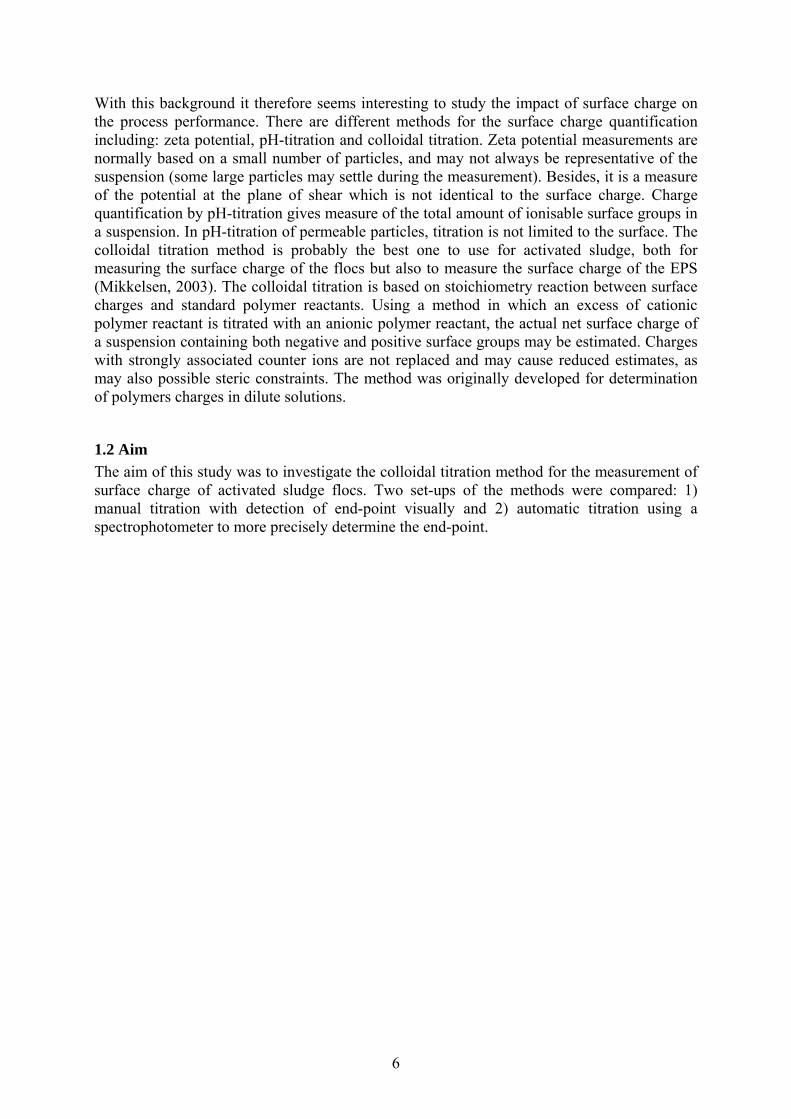
With this background it therefore seems interesting to study the impact of surface charge on the process performance. There are different methods for the surface charge quantification including: zeta potential, pH-titration and colloidal titration. Zeta potential measurements are normally based on a small number of particles, and may not always be representative of the suspension (some large particles may settle during the measurement). Besides, it is a measure of the potential at the plane of shear which is not identical to the surface charge. Charge quantification by pH-titration gives measure of the total amount of ionisable surface groups in a suspension. In pH-titration of permeable particles, titration is not limited to the surface. The colloidal titration method is probably the best one to use for activated sludge, both for measuring the surface charge of the flocs but also to measure the surface charge of the EPS (Mikkelsen, 2003). The colloidal titration is based on stoichiometry reaction between surface charges and standard polymer reactants. Using a method in which an excess of cationic polymer reactant is titrated with an anionic polymer reactant, the actual net surface charge of a suspension containing both negative and positive surface groups may be estimated. Charges with strongly associated counter ions are not replaced and may cause reduced estimates, as may also possible steric constraints. The method was originally developed for determination of polymers charges in dilute solutions.
1.2 Aim The aim of this study was to investigate the colloidal titration method for the measurement of surface charge of activated sludge flocs. Two set-ups of the methods were compared: 1) manual titration with detection of end-point visually and 2) automatic titration using a spectrophotometer to more precisely determine the end-point.
7
2. LITERATURE REVIEW
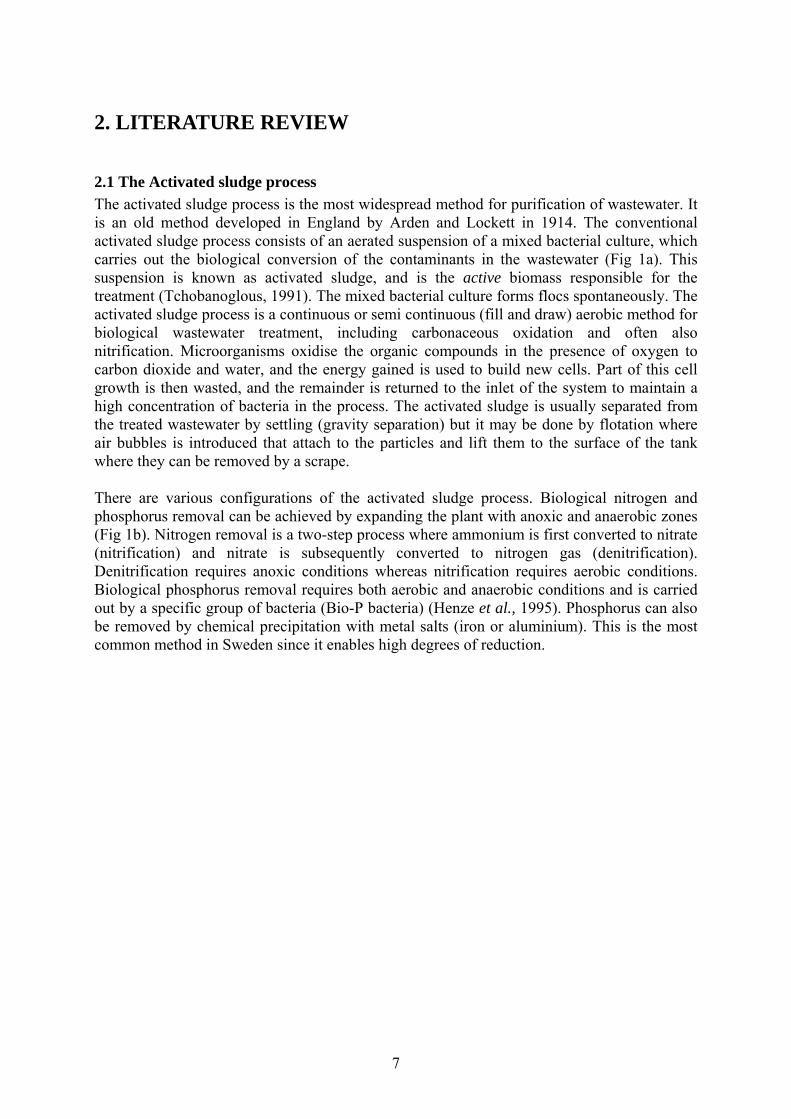
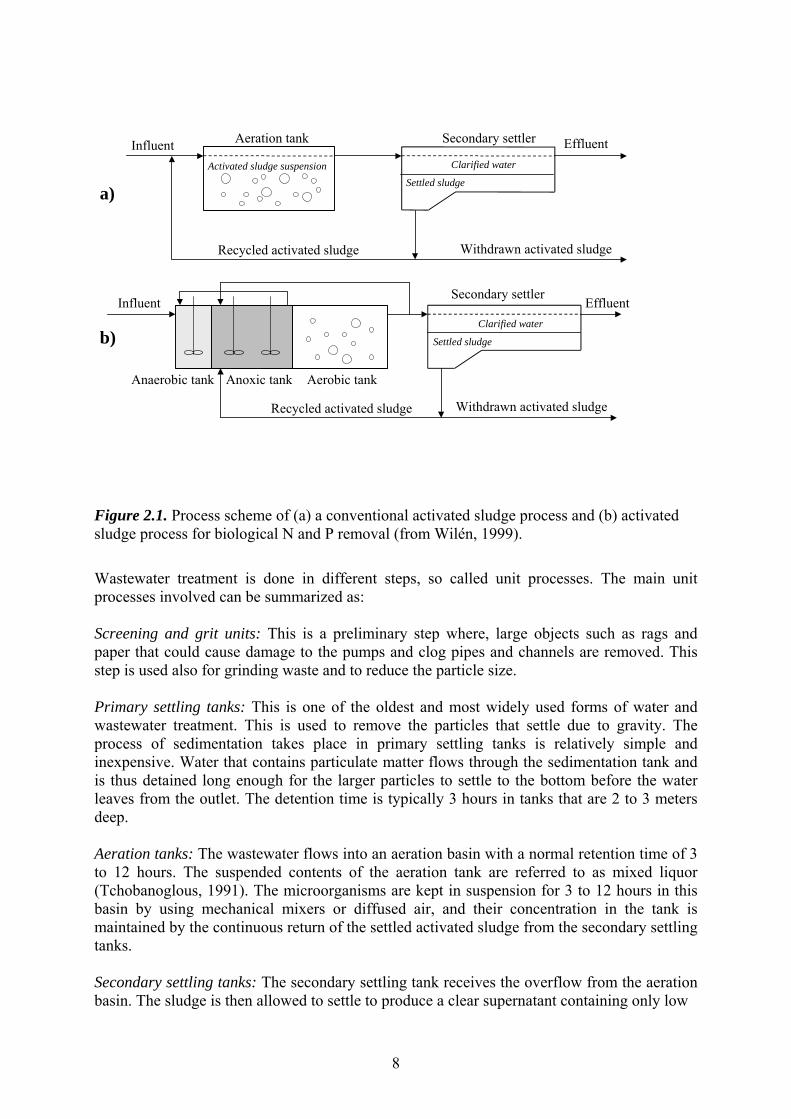
2.1 The Activated sludge process The activated sludge process is the most widespread method for purification of wastewater. It is an old method developed in England by Arden and Lockett in 1914. The conventional activated sludge process consists of an aerated suspension of a mixed bacterial culture, which carries out the biological conversion of the contaminants in the wastewater (Fig 1a). This suspension is known as activated sludge, and is the active biomass responsible for the treatment (Tchobanoglous, 1991). The mixed bacterial culture forms flocs spontaneously. The activated sludge process is a continuous or semi continuous (fill and draw) aerobic method for biological wastewater treatment, including carbonaceous oxidation and often also nitrification. Microorganisms oxidise the organic compounds in the presence of oxygen to carbon dioxide and water, and the energy gained is used to build new cells. Part of this cell growth is then wasted, and the remainder is returned to the inlet of the system to maintain a high concentration of bacteria in the process. The activated sludge is usually separated from the treated wastewater by settling (gravity separation) but it may be done by flotation where air bubbles is introduced that attach to the particles and lift them to the surface of the tank where they can be removed by a scrape. There are various configurations of the activated sludge process. Biological nitrogen and phosphorus removal can be achieved by expanding the plant with anoxic and anaerobic zones (Fig 1b). Nitrogen removal is a two-step process where ammonium is first converted to nitrate (nitrification) and nitrate is subsequently converted to nitrogen gas (denitrification). Denitrification requires anoxic conditions whereas nitrification requires aerobic conditions. Biological phosphorus removal requires both aerobic and anaerobic conditions and is carried out by a specific group of bacteria (Bio-P bacteria) (Henze et al., 1995). Phosphorus can also be removed by chemical precipitation with metal salts (iron or aluminium). This is the most common method in Sweden since it enables high degrees of reduction.
8
Aeration tank Secondary settler Effluent
Withdrawn activated sludgeRecycled activated sludge
InfluentActivated sludge suspension Clarified water
Settled sludge
Settled sludge
Clarified water
Secondary settler
Recycled activated sludge Withdrawn activated sludge
EffluentInfluent
Aerobic tankAnoxic tankAnaerobic tank
a)
b)
Figure 2.1. Process scheme of (a) a conventional activated sludge process and (b) activated sludge process for biological N and P removal (from Wilén, 1999).
Wastewater treatment is done in different steps, so called unit processes. The main unit processes involved can be summarized as: Screening and grit units: This is a preliminary step where, large objects such as rags and paper that could cause damage to the pumps and clog pipes and channels are removed. This step is used also for grinding waste and to reduce the particle size. Primary settling tanks: This is one of the oldest and most widely used forms of water and wastewater treatment. This is used to remove the particles that settle due to gravity. The process of sedimentation takes place in primary settling tanks is relatively simple and inexpensive. Water that contains particulate matter flows through the sedimentation tank and is thus detained long enough for the larger particles to settle to the bottom before the water leaves from the outlet. The detention time is typically 3 hours in tanks that are 2 to 3 meters deep. Aeration tanks: The wastewater flows into an aeration basin with a normal retention time of 3 to 12 hours. The suspended contents of the aeration tank are referred to as mixed liquor (Tchobanoglous, 1991). The microorganisms are kept in suspension for 3 to 12 hours in this basin by using mechanical mixers or diffused air, and their concentration in the tank is maintained by the continuous return of the settled activated sludge from the secondary settling tanks. Secondary settling tanks: The secondary settling tank receives the overflow from the aeration basin. The sludge is then allowed to settle to produce a clear supernatant containing only low
9
concentrations of suspended solids. The settled activated sludge is partly returned to the aeration basin on a continuous basis to maintain a desired concentration of microorganisms in the aeration basin. The other fraction is wasted as excessive sludge. The cleaned water (supernatant) of the settling tank flows over the weirs at the end of the tanks and is discharged to recipient. In some cases, the effluent is treated further to remove some remaining particles e.g. through filtration.
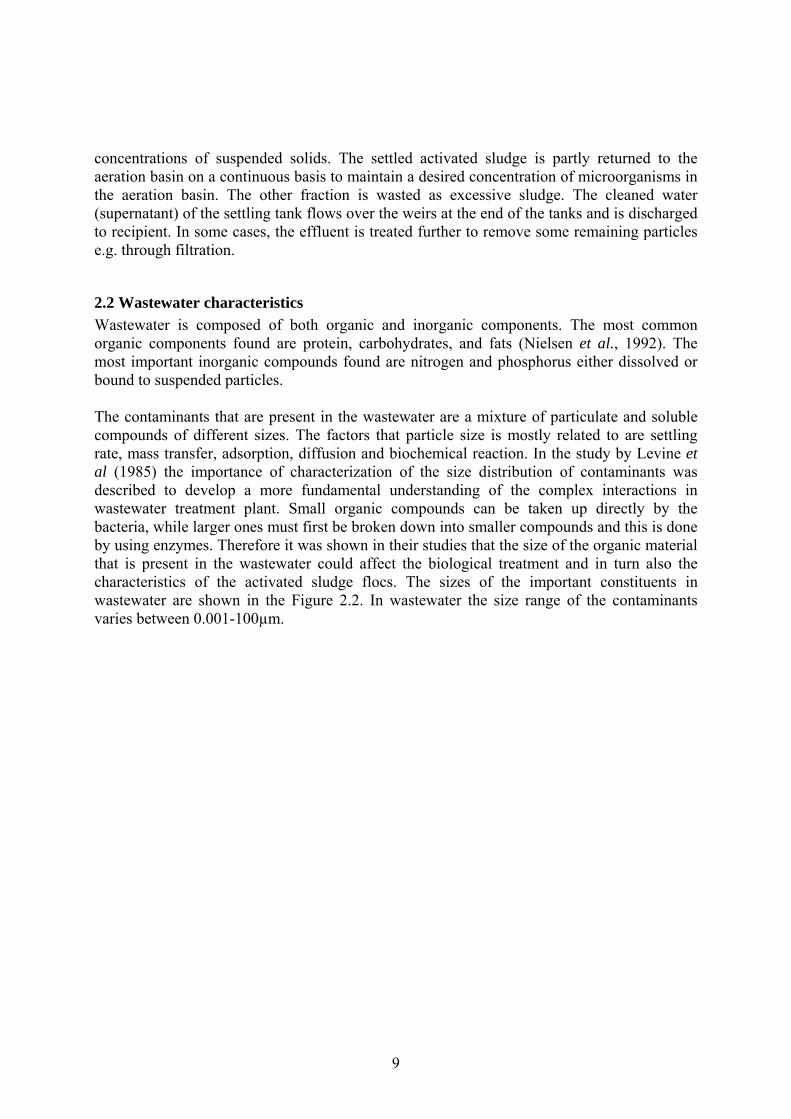
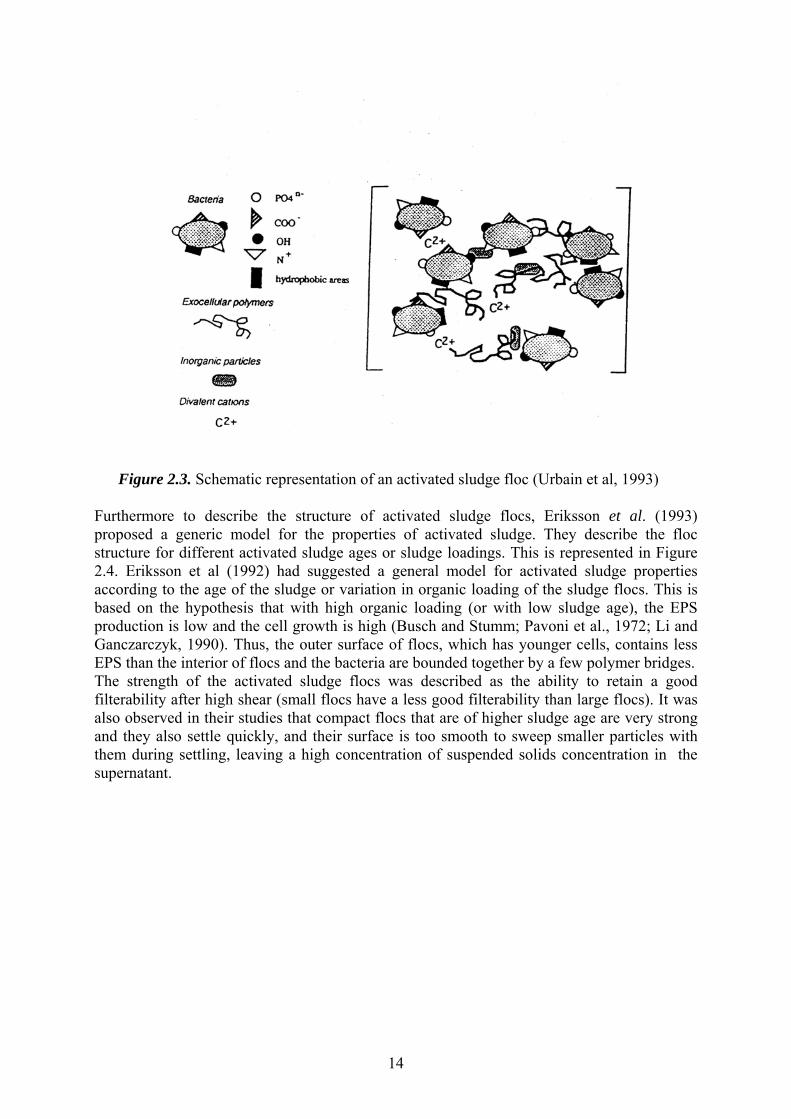
2.2 Wastewater characteristics Wastewater is composed of both organic and inorganic components. The most common organic components found are protein, carbohydrates, and fats (Nielsen et al., 1992). The most important inorganic compounds found are nitrogen and phosphorus either dissolved or bound to suspended particles. The contaminants that are present in the wastewater are a mixture of particulate and soluble compounds of different sizes. The factors that particle size is mostly related to are settling rate, mass transfer, adsorption, diffusion and biochemical reaction. In the study by Levine et al (1985) the importance of characterization of the size distribution of contaminants was described to develop a more fundamental understanding of the complex interactions in wastewater treatment plant. Small organic compounds can be taken up directly by the bacteria, while larger ones must first be broken down into smaller compounds and this is done by using enzymes. Therefore it was shown in their studies that the size of the organic material that is present in the wastewater could affect the biological treatment and in turn also the characteristics of the activated sludge flocs. The sizes of the important constituents in wastewater are shown in the Figure 2.2. In wastewater the size range of the contaminants varies between 0.001-100µm.

10
Figure 2.2. Typical organic constituents in settled municipal wastewater (from Levine et al, 1985).
2.3 Activated Sludge Flocs Separation of the activated sludge flocs In the activated sludge process, separation of the cell mass and the liquid medium is normally done by bioflocculation and gravity settling. The success of this procedure is dependent on the degree of biofloccluation and the physical characteristics of the activated sludge. Sometimes small flocs are formed with a density very close to that of water and cannot be separated by settling. For enhancing the flocculation, metal salts like aluminum sulphate are often added. When aluminum sulphate is added, aluminum hydroxide is formed onto which colloidal particles can adsorb and then aggregate with the activated sludge flocs. Synthetic polymers can also be added to improve flocculation. After separation, the organic material in the effluent is composed of the biological constituents as listed below (Tchobanoglous, 1991):
1) Soluble biodegradable organics (organics that have passed through the biological treatment, intermediate products from the microorganism’s metabolism and cellular components);
2) Suspended organic material (activated sludge flocs that were not separated in the
setting tank and colloidal material entering the treatment plant with the wastewater) and which were not removed in the process of biological treatment.
11
3) Non-biodegradable, inert organics, which is present in the incoming wastewater or by-products of biological degradation.
2.4 Flocculation of activated sludge Why do bacteria aggregate? It is seen that in natural aquatic systems microorganisms occur in the form of flocs or biofilms (Marshall, 1981). This is because it protects them from predators, toxic compounds, shear forces and enhance the nutrient supply. Various physico-chemical parameters influence the flocculation in fresh water, such as ionic strength, pH and amount of organic compounds, and the amount of bacteria is decisive. These bacteria colonize into particles, which in turn produce extra cellular polymers that contribute to the formation of dense aggregates. It has been observed that there is a close interaction between the microorganisms in flocs and biofilms that protects from predation and desiccation. In an activated sludge there are many factors that are involved in flocculation. It cannot be explained by any single mechanism. The role of cations in the process of flocculation It is a known fact that Calcium and Magnesium ions are the most important cations and they are most abundantly available in the natural aquatic systems. In previous research (Forster 1968; Steiner et al., 1976; Urbain et al., 1993) it has been found that the EPS, cell surfaces and inorganic particles (ex calcium phosphate, iron oxides) in the sludge have negatively charged groups, which have a high affinity for cations. Bruus et al (1992) had suggested that the divalent cations bridge negatively charged groups on alginate–like polysaccharides within the flocs. It is recognized from the studies by Zita and Hermansson (1994) that cations contribute to flocculation as they contribute to ionic strength, according to the DLVO theory. Keiding and Nielsen (1997) found that the removal of Ca+2 from the bulk water by an ion exchange resin led to a release of Ca+2 ions from the flocs and a desorption of macromolecules such as humic substances and single bacteria. The removal of Ca+2 with an ion exchange resin yielded a higher negative surface charge of the flocs without significantly changing the ionic strength. It is concluded from other studies (Bruus et al., 1992; Higgins and Novak, 1997) that high concentrations of monovalent cations can cause deflocculation, probably by means of an ion exchange process in which the monovalent ions, with much poorer flocculation properties than divalent cations. Polyvalent metal ions These are very important aids for the process of flocculation. Metal ions mainly interact with the extracellular polymeric substances in the activated sludge flocs. They have the capability to form bonds between carboxyl and amino groups in the exopolymers (Steiner et al., 1976; Eriksson et al., 1991). Composition of Activated Sludge Activated sludge is a complex mixture of different microorganisms (mainly different types of bacteria), dead cells and adsorbed particulate organic and inorganic material and extracellular polymeric substances (EPS) (Wilén, 1999). The EPS generally binds the floc properties together and contribute to the formation of dense colonies of bacteria within the floc (Snidaro et al., 1997). Still only relatively few bacterial species are determined. The population of microorganisms present depends on environmental factors such as composition of the wastewater and on the loading of the plant. There is competition between different
12
microorganisms for the available nutrients. The microorganisms that will dominate are mainly decided by the environmental conditions and the efficiency in adoption to the environmental conditions surrounding them. Bacteria are the most important microorganisms for the degradation of organic material in wastewater and they are predominant in terms of biomass and biochemical activity. The flocs contain approximately 30-40% inorganic matter and 60-70% organic matter. The organic fraction is composed of 50-60% EPS, 10-30% other organic matter and only 2-20% bacterial biomass (Frølund et al., 1996). The composition of the organic fraction can vary considerable depending on the wastewater composition and treatment plant design and operation. The dominating fractions are composed of proteins, humic substances and carbohydrates (e.g. Urbain et al., 1993; Frølund et al., 1994; Wilén et al., 2003). In another study conducted by Keiding and Neilsen (1997) it was observed that humic substances are absorbed onto the EPS matrix, thereby increasing the concentration in the sludge along with an increase in the sludge age. Extra cellular polymers The extra cellular polymeric substances (EPS) are often defined as polymeric compounds that are excreted by bacteria. They are believed to play an important role in the flocculation process of the activated sludge (Pavoni et al, 1972 Brown and Lester, 1980; Eriksson and Härdin, 1984). The EPS’s are divided into two categories: polymers in the bulk liquid and polymers that are attached to the cell surface or those that have been incorporated on to the flocs. The production of the polymers is dependent on the loading and operational conditions in the plant. The main constituents of these polymers are polysaccharides, proteins, humic acids and nucleic acids. In the study by Urbain et al. (1993) it was shown that the EPS’s are produced from the metabolism but also from the lysis of microorganisms (proteins, DNA, polysaccharides and lipids) as well as from the wastewater. EPS can be extracted from the activated sludge in different ways. It is far from a simple process. Many difficulties are encountered such as contamination of intracellular polymers as a result of cell lysis if strong extraction methods are applied. Various extraction techniques have been described like ultracentrifugation, sonication and chemical extraction and heat extraction (Forster, 1971; Brown and Lester, 1980; Novak and Haugan, 1981; Sanin and Vesilind, 1994).
2.5 Conceptual Floc Models The flocculation of activated sludge is a complex process and this is mainly because of the variety of bacteria and other components that are present. To be able to understand the mechanisms involved, various kinds of conceptual models have been proposed for the flocculation. The polymer-bridging model In this model (Busch and Stumm, 1968; Pavoni et al., 1972; Eriksson et al., 1992), it is suggested that the bacteria excrete EPS, which join the cells together by means of divalent cations such as Ca+2 and Mg+2. The EPS are compounds possessing high molecular weight that extend outward from the cell surface and can form bridges between several cells (steric interaction). Also the divalent cations that are present get binded electrostatically to the negatively charged functional groups to generate strong bridges between floc components.
13
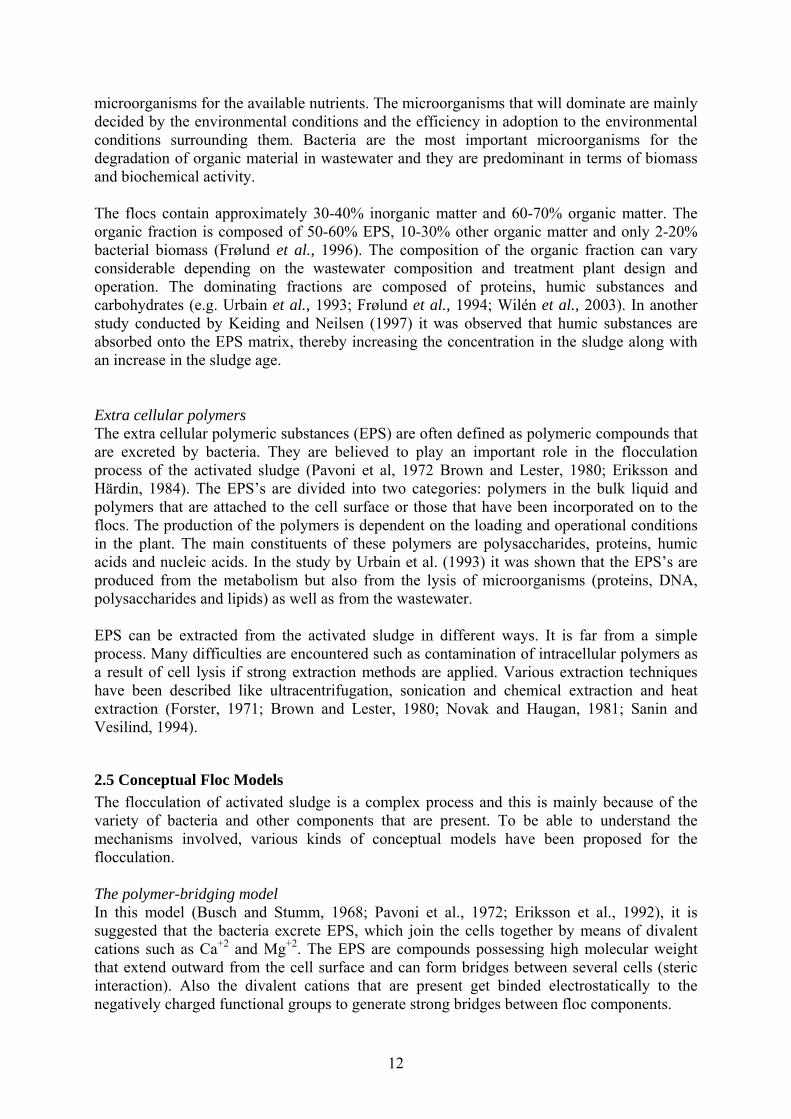
The filamentous backbone model In this model (Parker et al., 1971; Seizen et al., 1978) it is suggested that filamentous bacteria form a backbone onto which EPS producing bacteria can attach themselves. But, recent studies have shown that, the filaments are not believed to affect he attachment of other floc components to the flocs. It is believed nowadays that filamentous bacteria are not a prerequisite for flocculation. The colloidal interaction model This model is based on the view that the interactions between the floc components can be described by the DLVO theory for colloidal stability (Zita and Hermansson, 1994), developed by Deryagin and Landau (1941) and Verwey and Overbeek (1948). In this model, the degree of interaction depends on the surface potential and the thickness of the electrical double layers. It is known that the activated sludge flocs are negatively charged (Gregory, 1989). In the aquatic environments the negative surfaces are surrounded by oppositely charges ions, of which some are bound to the surfaces and others, are distributed in the diffused layer. This leads to repulsive electrostatic interaction between approaching surfaces. The most common interactions between colloids are the van der Waals attraction and electrical repulsion. Floc structure models The structure of the flocs is very heterogeneous (Li and Gancarczyk, 1990, Zartarian et al., 1994) and the size range can be wide as from a few microns up to 1000µm (Parker et al., 1971; Li and Ganczarczyk, 1991). There are many theories that describe the process of flocculation. The most generally accepted model is the polymer bridging model for the activated sludge flocs (Busch and Stumm, 1968, Pavoni et al., 1972). Another model that has been proposed is the filamentous backbone model (Sezgin et al., 1978). In both models that have been put forward, the surface charge is maintained by the exocellular polymers, but the forces that bind the polymers are different. In the polymer bridging model, it is suggested that the bacteria excrete EPS which join the cells together electrostatically by means of divalent ions such as Ca2+ and Mg2+. In the filamentous backbone model it is suggested that the filamentous bacteria that are present build a backbone onto which the exopolysaccharide producing microorganisms can be attached. In this way the particulate and colloidal material can attach to the activated floc surface. In Figure 2.3 a schematic drawing illustrates the polymer bridging model (Urbain et.al, 1993).
14
Figure 2.3. Schematic representation of an activated sludge floc (Urbain et al, 1993)
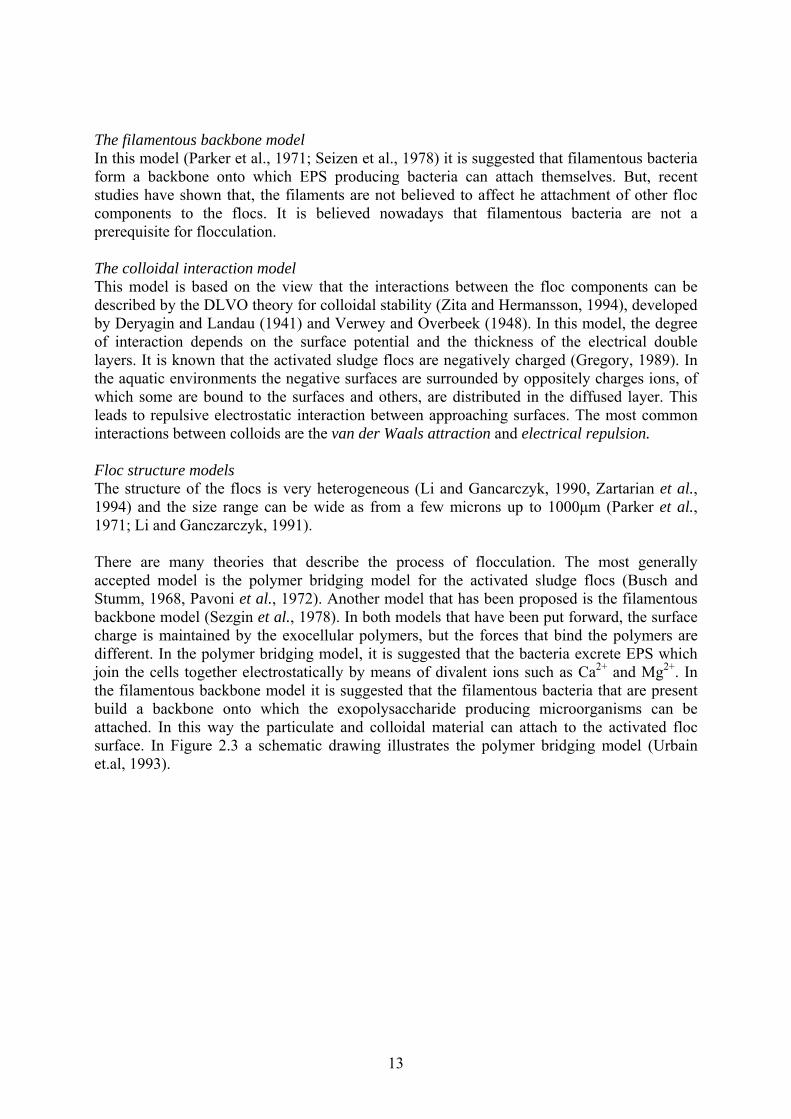
Furthermore to describe the structure of activated sludge flocs, Eriksson et al. (1993) proposed a generic model for the properties of activated sludge. They describe the floc structure for different activated sludge ages or sludge loadings. This is represented in Figure 2.4. Eriksson et al (1992) had suggested a general model for activated sludge properties according to the age of the sludge or variation in organic loading of the sludge flocs. This is based on the hypothesis that with high organic loading (or with low sludge age), the EPS production is low and the cell growth is high (Busch and Stumm; Pavoni et al., 1972; Li and Ganczarczyk, 1990). Thus, the outer surface of flocs, which has younger cells, contains less EPS than the interior of flocs and the bacteria are bounded together by a few polymer bridges. The strength of the activated sludge flocs was described as the ability to retain a good filterability after high shear (small flocs have a less good filterability than large flocs). It was also observed in their studies that compact flocs that are of higher sludge age are very strong and they also settle quickly, and their surface is too smooth to sweep smaller particles with them during settling, leaving a high concentration of suspended solids concentration in the supernatant.

15
Figure 2.4. A general model for flocs built by floc – forming activated sludge bacteria (Eriksson et al., 1992).
EPS are the main constituents of the organic fraction of the activated sludge flocs. They are believed to play a very vital role in the formation of flocs, hence a detailed overview is given about their structure and formation in the section followed. Other floc models Sanin and Vesilind (1996, 1999) had proposed a mechanism for the formation of flocs by building synthetic sludge flocs composed of polystyrene latex particles of a size similar to bacteria to simulate individual bacteria and alginate, a polysaccharide, to simulate microbial extra cellular polymers. Sometimes, collision between particles occurs, and the probability of the collision increases with the turbulence. This turbulence also gives the particles the necessary kinetic energy. If the kinetic energy is high enough, the probability of the flocculation increases (i.e. primary particles adhere to the existing flocs) in the primary minimum, according to the DLVO theory. Here the particles are held together very firmly in an irreversible manner. If the potential energy of the particles is too low to pass the energy barrier between them, a flocculation in the secondary minimum may occur (reversible flocculation). Flocculation of activated sludge has been explained by flocculation in the secondary minimum (Valin and Sutherland, 1982). This can be seen as deflocculation under turbulent conditions and flocculation at low shear levels. Hence the flocculation is reversible. Sludge never deflocculates completely; the bacterial colonies in the sludge are most likely irreversibly flocculated in the primary minimum, while the colonies themselves are more weakly flocculated to each other in the secondary minimum.
16
Structure of activated sludge flocs in relation to EPS composition In the studies by Li and Ganczarczyk (1990) the structure of activated sludge flocs larger than 100µm was studied by stabilizing them into a histological tissue. The samples were then cut into sections of 3 -6 µm. It was concluded that the structure of the flocs was not uniform and extracellular polymers and water were the main ingredients outside the cells within a floc. Jorand et al (1995) had studied the complex structure of the activated sludge flocs using four methods: microscopic observation in-situ and after staining, optimization of the floc dispersion by sonication (dispersion of cells by using an ultra sound generator) of bacterial strains, analysis of polymers released from sonication of sludges and floc size distribution after different sonication times. In the model that was proposed for microbial structure of the flocs, three types of aggregates exist in the flocs: (1) primary particles 2.5µm in size; (2) secondary particles (13µm) which are linked together by extra cellular polymers and forming (3) tertiary structures having a mean diameter of approximately 125 µm.
2.6 Surface Charge The size of the particles in wastewater and activated sludge are mainly of diameters less than 1mm. Colloids are defined as particles with a diameter of 1 nm or less. However, from a practical point of view, larger particles such as activated sludge flocs follow the general rules for colloidal stability. Also, the attachment of colloids to activated sludge flocs is an important process in the treatment plant to achieve high effluent quality and in this respect colloidal interactions are very important. Effective removal of these colloidal dispersions is greatly impacted by the electrokinetic properties on the surface of the colloids. Colloids cannot be removed from the suspension by using physical separation processes such as settling. They have very slow settling characteristics and Brownian movement is much more important for their movement (Shaw, 1992). Colloidal dispersions are stable in water, as they posses a large surface area relative to their weight. The colloids in the wastewater contribute to the major part of the pollution and they are the main cause of the turbidity in the water. Most colloidal particles in water are negatively charged as a result of differences in electrical potential between the water and the particle phases. This charge is due to an unequal distribution of ions over the particle surface and the surrounding solution. The charge on a colloidal particle can be controlled by modifying characteristics of the water which holds the particles in suspension. Modifications include changing the liquid's pH or changing the ionic species in solution. Another, more direct technique is to use surface-active agents, such as coagulants, that directly adsorb to the surface of the colloid and change its characteristics. The microorganisms that are present in the wastewater attain surface charge through ionization of the carboxyl and amino groups. They are negatively charged at high pH and at low pH they are positively charged, whereas at the isoelectric point they are neutrally charged (i.e. they have no charge). At higher pH in wastewater, the sludge flocs acquire a negative surface charge. When a particle is charged, the ions that are of opposite charge are attracted to its surface. The potential at which the cloud of oppositely charged ions are present in the form of a cloud is called the zeta potential. The zeta potential of solids in suspension is measured in terms of the electrophoretic mobility of the solids where the surface charge is related to the speed at which the colloidal particles move in the electric field (Wilén, 1995).
17
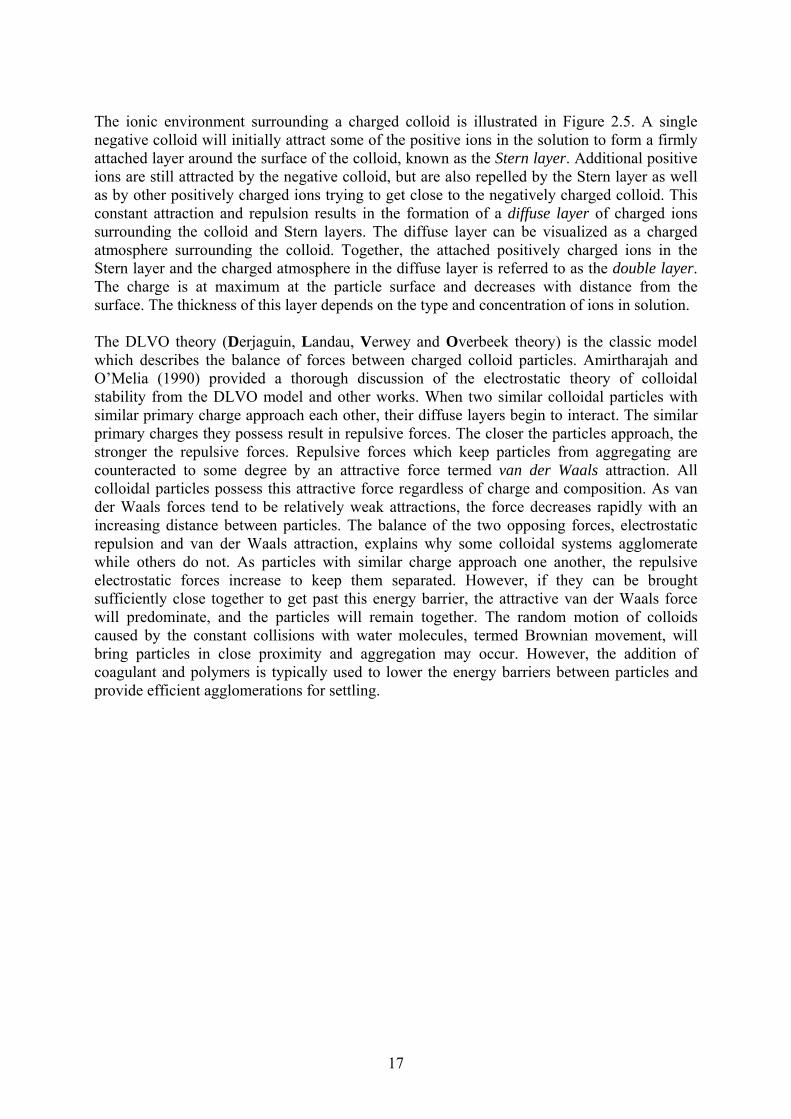
The ionic environment surrounding a charged colloid is illustrated in Figure 2.5. A single negative colloid will initially attract some of the positive ions in the solution to form a firmly attached layer around the surface of the colloid, known as the Stern layer. Additional positive ions are still attracted by the negative colloid, but are also repelled by the Stern layer as well as by other positively charged ions trying to get close to the negatively charged colloid. This constant attraction and repulsion results in the formation of a diffuse layer of charged ions surrounding the colloid and Stern layers. The diffuse layer can be visualized as a charged atmosphere surrounding the colloid. Together, the attached positively charged ions in the Stern layer and the charged atmosphere in the diffuse layer is referred to as the double layer. The charge is at maximum at the particle surface and decreases with distance from the surface. The thickness of this layer depends on the type and concentration of ions in solution. The DLVO theory (Derjaguin, Landau, Verwey and Overbeek theory) is the classic model which describes the balance of forces between charged colloid particles. Amirtharajah and O’Melia (1990) provided a thorough discussion of the electrostatic theory of colloidal stability from the DLVO model and other works. When two similar colloidal particles with similar primary charge approach each other, their diffuse layers begin to interact. The similar primary charges they possess result in repulsive forces. The closer the particles approach, the stronger the repulsive forces. Repulsive forces which keep particles from aggregating are counteracted to some degree by an attractive force termed van der Waals attraction. All colloidal particles possess this attractive force regardless of charge and composition. As van der Waals forces tend to be relatively weak attractions, the force decreases rapidly with an increasing distance between particles. The balance of the two opposing forces, electrostatic repulsion and van der Waals attraction, explains why some colloidal systems agglomerate while others do not. As particles with similar charge approach one another, the repulsive electrostatic forces increase to keep them separated. However, if they can be brought sufficiently close together to get past this energy barrier, the attractive van der Waals force will predominate, and the particles will remain together. The random motion of colloids caused by the constant collisions with water molecules, termed Brownian movement, will bring particles in close proximity and aggregation may occur. However, the addition of coagulant and polymers is typically used to lower the energy barriers between particles and provide efficient agglomerations for settling.
18
Figure 2.5. The distribution of ionic charges around a colloidal particle. Colloids are classified as hydrophobic (resistant to water bonding) or hydrophilic (affinity for water bonding). Hydrophilic colloids are stable because their attraction to water molecules will overcome the slight charge characteristic they possess. This attraction makes hydrophilic colloids difficult to remove from suspension. Examples of hydrophilic colloids include soaps and detergents, soluble starches, soluble proteins and blood serum. On the other hand, hydrophobic particles are dependent on electrical charge for their stability in suspension. The surface charge of activated sludge flocs has been found to affect their settling and compaction properties. Settling and compaction properties are measured in terms of sludge volume index (SVI) which is the volume occupied by 1 gram of sludge after 30 minutes settling and initial settling velocity. In 1968, Forester described about a linear relationship between the electrophoretic mobility and the SVI. This may be due to an excessive growth of the extracellular polymers that could probably increase the negative surface charge which could increase the SVI. The cells are bound together by the polymer chains, but they are held in an expanded state. Forester (1971) measured the isoelectric points and the pK values for the surfaces of activated sludge particles with different sludge volume indices at low ionic strength. The results that were obtained pointed out that the surfaces were of polysaccharide nature, with the most
19
important principal ionogenic monomer being glucuronic acid (pK= 3.2 which would make it fully ionized at the pH of activated sludge). A study of activated sludge’s from three wastewater treatment plants was carried out by Steiner at al (1976) to see if there was a relationship between the electrophoretic mobility (that is related to the surface charge) and the SVI. Their study revealed that there was a linear relationship between the electrophoretic mobility and the SVI but, with a variation in the proportionality constant for all the three different sludge’s. In 1985, studies conducted by Goodwin et al yielded similar results but there was no relationship between the zeta-potential and the SVI. The variation in the zeta potential was believed to be due to the nature of the surface polymers. Pavoni at al (1972) have shown that the surface charge is not an essential prerequisite for flocculation as polymers that are present are able to form bridges between cells either electrostatically or physically. This statement was confirmed by Chao and Keinath (1979), in their studies. They had measured the electrophoretic mobility for sludge flocs that were grown under various process loads (0.2 -2.6 gm COD/gm MLSS d -1) and this had not changed and the zeta potential was around -24.9 mV.
2.7 Measurement of Surface Charge There are several methods available to measure surface charge but all methods are associated with certain problems. When it comes to measuring surface charge of activated sludge flocs the main problem is the large heterogeneity of the flocs. The most common methods used for measuring surface charge activated sludge flocs are zeta-potential and colloidal titration, and pH titration. Zeta potential The Stern layer is considered to be rigidly attached to the colloid, while the diffuse layer is a dynamic layer of charged particles. The Nernst Potential is the measurement of voltage (in the order of millivolts) in the diffuse layer. The potential is a maximum at the Stern layer and drops exponentially through the diffuse layer. The zeta potential is the electrical potential representing the difference in voltage between the surface of the diffuse layer and the water. It is important to know the magnitude of the zeta potential, as it represents the strength of the repulsion between colloid particles and the distance which must be overcome to bring the particles together. The primary charge on a colloid cannot be measured directly. However, the zeta potential can be computed from measurements of particle movement within an electrical field (electrophoretic mobility). Therefore, the zeta potential, z, is defined by the equation:
z = 4πdq/D
where q = charge of the particle d = thickness of the zone of influence of the charge on the particle D = dielectric constant of the liquid
Zeta potential measurements can be made using a high-quality stereoscopic microscope to observe colloidal particles inside an electrophoresis cell (Zeta-Meter 1998). An electric field is created across the cell and charged particles move within the field. Their velocity and
20
direction are then related to the zeta potential. Measurements of zeta potential can give an indication of the effectiveness of added electrolytes in lowering the energy barrier between colloids, and can direct the optimization of coagulant dose in water treatment. The zeta potential is a measure of the potential at the plane of shear which is related but not identical to the surface potential. Colloidal titration The colloidal titration is based on stoichiometry between reaction between surface charges and standard polymer reactants (Morgan et al. 1990). Using a method in which an excess of cationic polymer reactant is titrated with an anionic polymer reactant, the actual net surface charge of a suspension containing both negative and positive surface groups may be estimated. Charges with strongly associated counter ions are not replaced and may cause reduced estimates, as may also possible steric constraints. The method was developed for determination of polymers charges in dilute solutions. pH titration In this it gives a measure of the total amount of ionisable groups in a suspension, i.e. for a typical acid titration , weak acid groups (which contribute to surface charge) and weak base groups (which do not). Surface charges related to strong acids are underestimated in some procedures (Mikkelsen, 2003). It is observed that in pH titrations a higher charge estimates is observed.
21
3. MATERIALS AND METHODS
3.1 Sludge samples The activated sludge samples were collected at the Rya wastewater treatment plant in Göteborg (Gryaab). The plant is designed for biological nitrogen removal using pre-denitrification in activated sludge and post-nitrification in trickling filters. The plant is operated at a sludge age of 2-4 days. After collection of the samples the sludge was immediately transferred to the laboratory which is situated 13 km from the treatment plant. The suspended solids were measured immediately after sampling to provide good results. The mixed liquor suspended solids concentration was 2-3 g/l. To measure the suspended solids, a 10ml sample was filtered and then it was dried for 2 hours in a pre-heated oven at a temperature of 105oC.
Suspended Solids (g/l) = (Final weight of filter paper - Initial weight of filter paper)/sample volume
3.2 Colloidal titration Colloidal titration is the most common method that is used to determine the charge density of dissolved and dispersed polyelectrolytes. It can also be used to measure the surface charge of activated sludge flocs (Morgan et al., 1990; Mikkelsen, 2003). This method is based on the change in colour of an indicator, used as an end point. The most commonly used indicator is a cationic blue dye, such as, toludiene blue, orthotoludiene blue, or methylene blue. In this process of titration a cationically charged blue dye reacts with an anionic polymer, such as potassium polyvinyl sulfate (PVSK), to form an anionic polymer Cat-floc complex. When the cationic polymer is added, a reaction occurs with the remaining anionic polymers and free sites on the anionic polymer that has already reacted with the cationic indicator. When the concentration of the cationic polymer increases, a substitution reaction between the dye –anionic polymer complex and extra polymer occurs. As a consequence, the dye is released from the complex and the colour of the system suddenly changes (which is known as the end point) (Yufeng Xu and Yulin Deng, 2003). When particles like activated sludge flocs are measured, an excess amount of Cat-floc is added. The Cat-floc reacts with the negative surface charges on the sludge flocs. When this reaction has finished, the anionic polymer (PVSK) that is titrated with starts to react with the excess Cat-floc. When all this Cat-floc has reacted with PVSK, the PVSK starts to react with the toluidine Blue and the colour changes from blue to pink. Colloidal titration using a dye as a detector is based on the following assumptions: (Yufeng Xu and Yulin Deng, 2003). 1. The cationic dye completely forms a complex with anionic polymer (no free dye in the
solution) before the end point. 2. The addition of cationic polymers will not substitute for cationic dye from the complex
before all the negative sites are neutralized. 3. The charge neutralization reactions between cationic and anionic polymers are
stoichiometric. 4. Extra cationic polymers will substitute for the dye molecules if there are no free negative
sites available for unbounded cationic polymers.

22
3.2.1 Manual titration Solutions
1. 0.25 g/l Cat-floc (polydiallyldimethylammmoniumchloride, medium molecular weight, Sigma)
2. 0.2027 g/l; 1.25 * 10-3N PVSK (Sigma) 3. 0.05 g/l Toludiene Blue (Sigma)
Procedure The titration was carried out at room temperature.
• Add 0.2-3ml sample to 200 ml deionised water • Place the suspension in a plastic jar, made of Teflon placed on a magnetic stirrer to
ensure a good mixing without damaging the floc structure.
• The pH was adjusted to 7.0.
• Add 1-15 ml of Catfloc solution. The appropriate volume had to be determined by testing the method. The mixture was allowed to mix for approximately 30s.
• 200µl toludiene blue was added to the jar. Toludiene blue was added as an indicator.
• The solution with the flocs was titrated with PVSK until the colour of the suspension changed from blue to pink/purple. The endpoint was determined by eye. The experiment was always made in triplicate.
• Exactly the same titration was made for a blank sample (the same volume of deionised water as for the sludge was added).
Calculation of surface charge was expressed as charge per gram of dried sludge:
Charge (equiv./g MLSS) = (A-B) * N(1000)) / V * MLSS) A= ml of PVSK added to the sample N= normality of PVSK B= ml of PVSK added to blank sample V= ml of sample used MLSS = suspended solids concentration of the sludge sample
3.2.2 Automatic titration The automatic set up was used as it is much more precise and makes it easier to detect the point of charge neutralization, i.e., where the toludiene blue colour changes from blue to pink. The same solutions as for the manual titration were used.
23
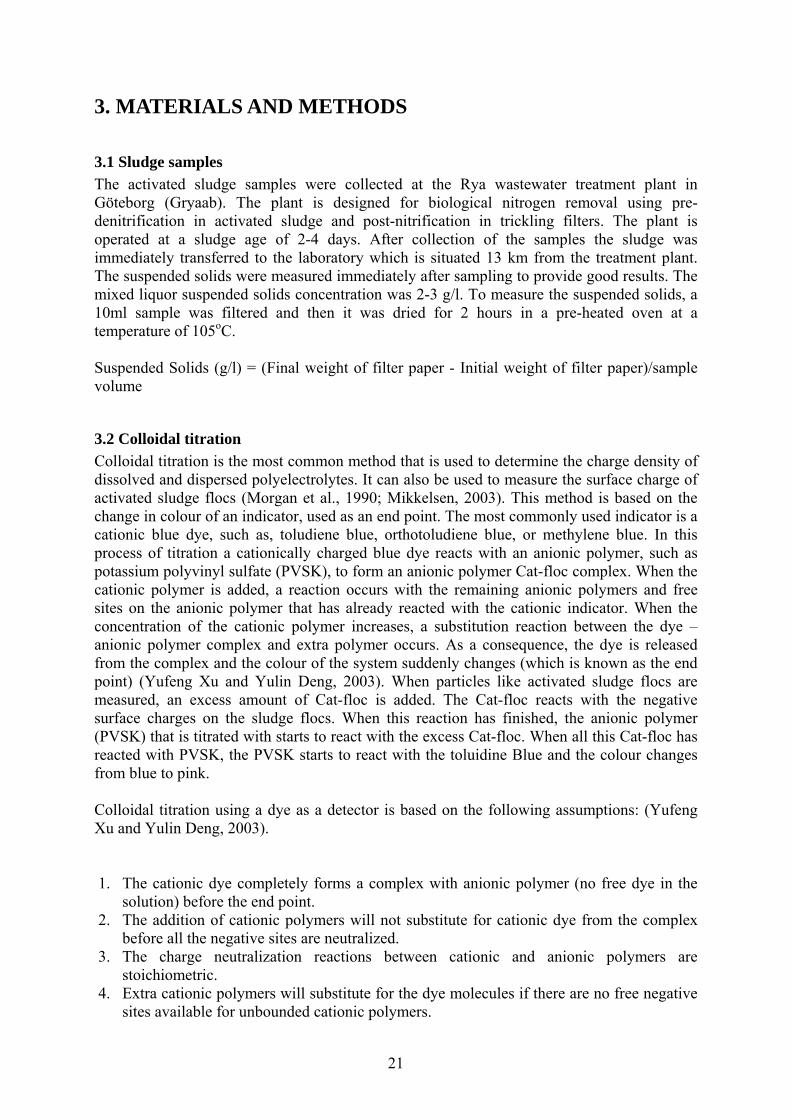
Preparation of the sample For the automatic titration the same principal method is used and the sample was prepared in a similar manner as for the manual titration but with some slight changes. The set-up is shown in Figure 3.1.
Set-up for colloidal titration
Baffled reactor(400 ml)
200 rpmSample plus Catfloc
Peristaltic pump
PVSK-solution
Spectrophotometer (620 nm)Effluent; peristaltic pump
TB-solution; peristaltic pump
Monitor continuously for 300 s
Abs
orba
nce
620
nm
Time (s)
Figure 3.1. Set-up for automatic colloidal titration.
The flow rates of the pumps were controlled before each experiment by using a stopwatch. The same pump (Heidoph pump drive 5001) but with two pump heads was used for the PVSK solution and the effluent flow. This was made possible by using two tubes with different inner diameters (0.8 and 1.8 mm). The pump was run at 40 rpm and the time taken to fill up to 10ml for the large tube (effluent) and the time taken to fill 5ml in the cylinder from the small tube (PVSK) was measured. This was repeatedly done in triplicate and an average was taken. This was done to see that the flow was maintained consistent in the tubes. Care was taken to see that all the tubes were cleaned with milliQ water so that there will not be any interferences in between different titrations. The wavelength in the spectrophotometer was set at 620nm, which is the absorbance for toludiene blue. 200ml deionised water was poured in a white Teflon beaker (same as used in the manual titration). This kind of beaker was used to get clear view of the change in the color and also to avoid interferences caused by interaction to the wall of the beaker. In the reaction chamber, for the blank suitable amount of MilliQ water was added. The tubings were connected to the spectrophotometer. Before starting a titration, the tubing leading from the reaction chamber to the spectrophotometer was filled with milliQ water and the spectrophotometer was set to zero absorbance at 620 nm. The pumps for the PVSK and toluidine blue solutions were started at the same time as the program for the titration cycle on the spectrophotometer. The time was set to between 5 to 10 minutes, varying according to the concentration of sample added. As the solution is mixed with the toluidine blue solution, the readings on the spectrophotometer

24
start to increase and at certain point of time, the value suddenly falls. This is considered the point where the colour of the solution is changed from blue to pink and is the end point of the titration. When the reaction time is completed, the data is saved onto a diskette. The data can then be converted to an excel format suitable for data processing. The endpoint was defined from the intercept of the two straight lines that fitted into the titration curve as shown in Figure 3.2.
Figure 3.2. Example of a titration curve obtained for automatic titration.
The surface charge (SC) of the sample was calculated with the following equation:
mrttSC sb ⋅−
=)(
Where SC is the surface charge (meq/g), tb and ts are the blank and sample titration endpoint times (s), r is the PVSK addition rate (meq/s) , and m is the sample mass (g).
0
0.2
0.4
0.6
0.8
1
1.2
1.4
1.6
0 50 100 150 200 250 300 350
Titration time (s)
Abs
orba
nce
(620
nm
)
End point titration time
25
4. RESULTS AND DISCUSSION
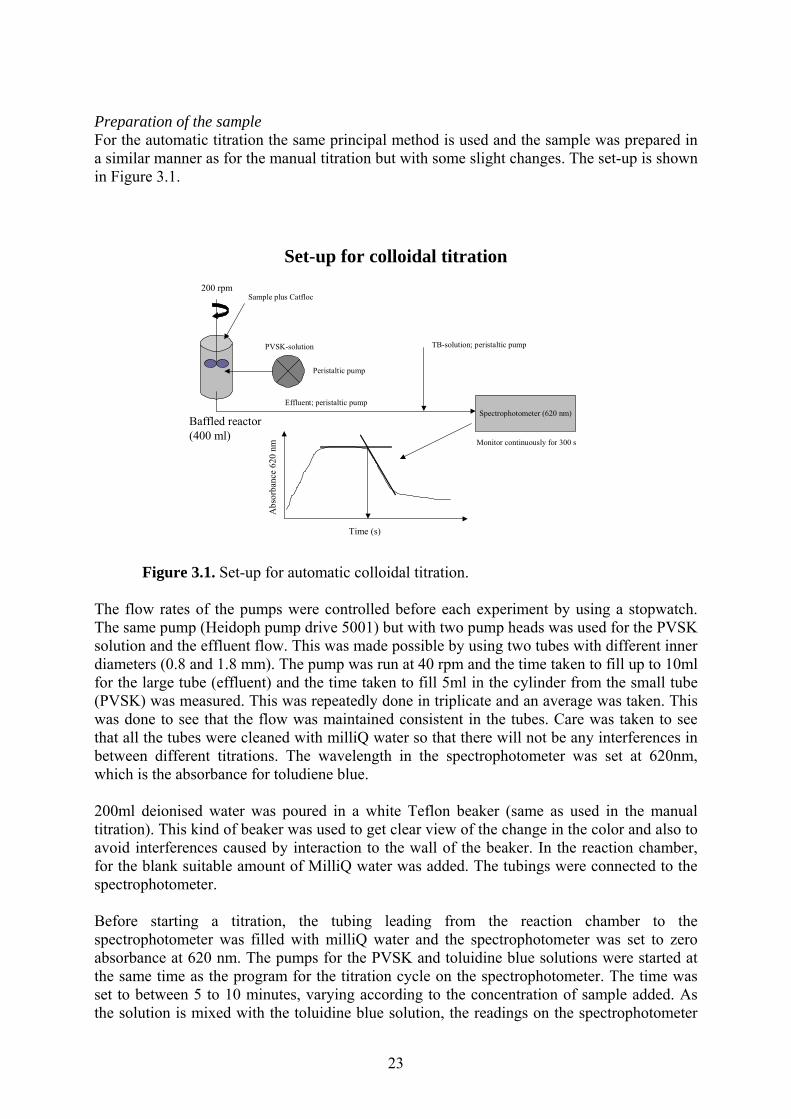
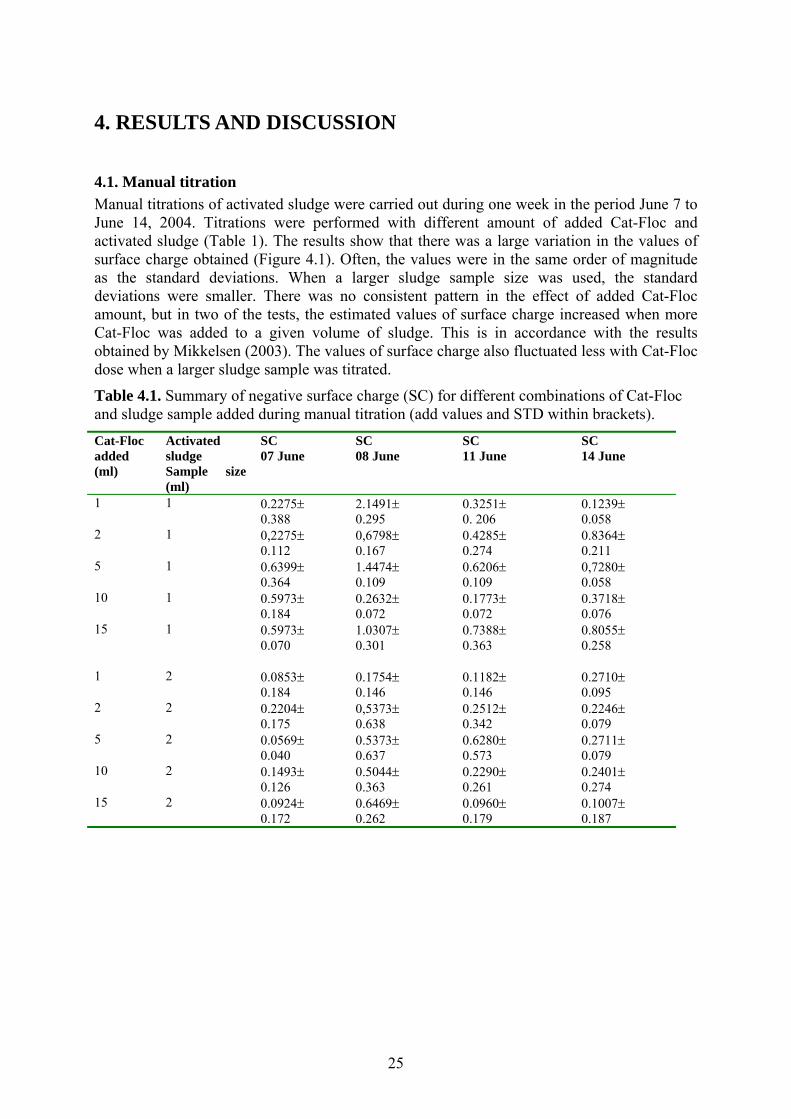
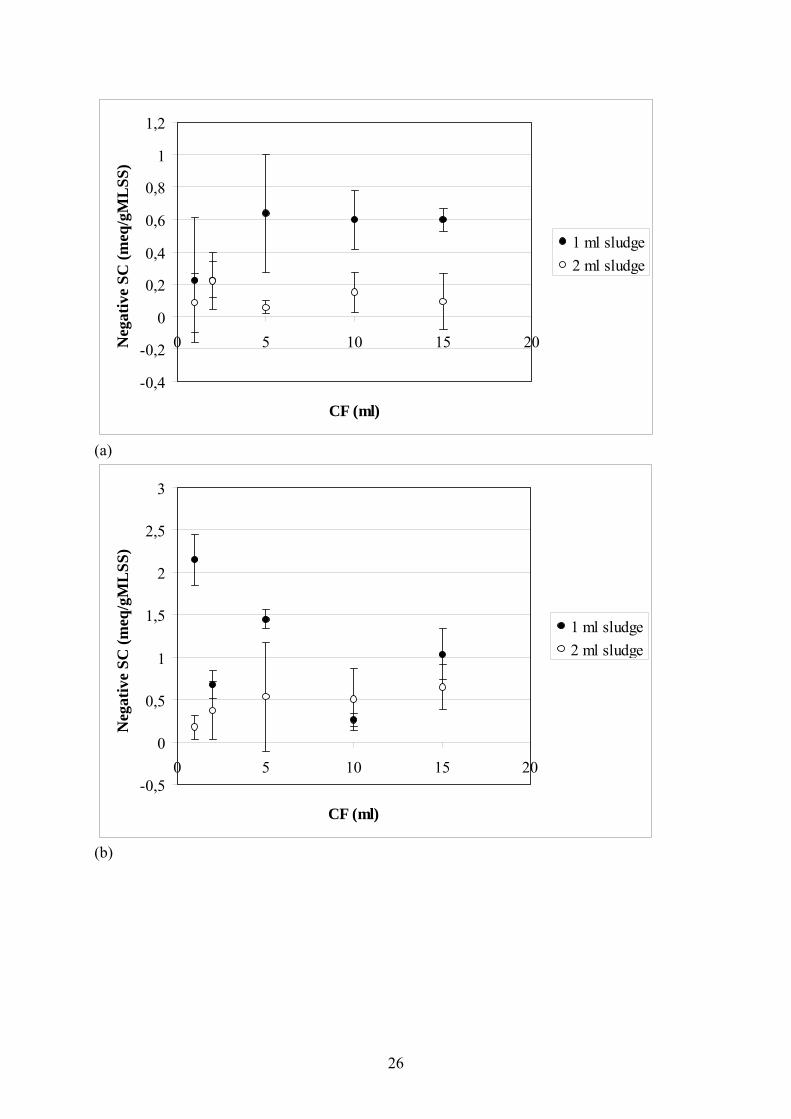
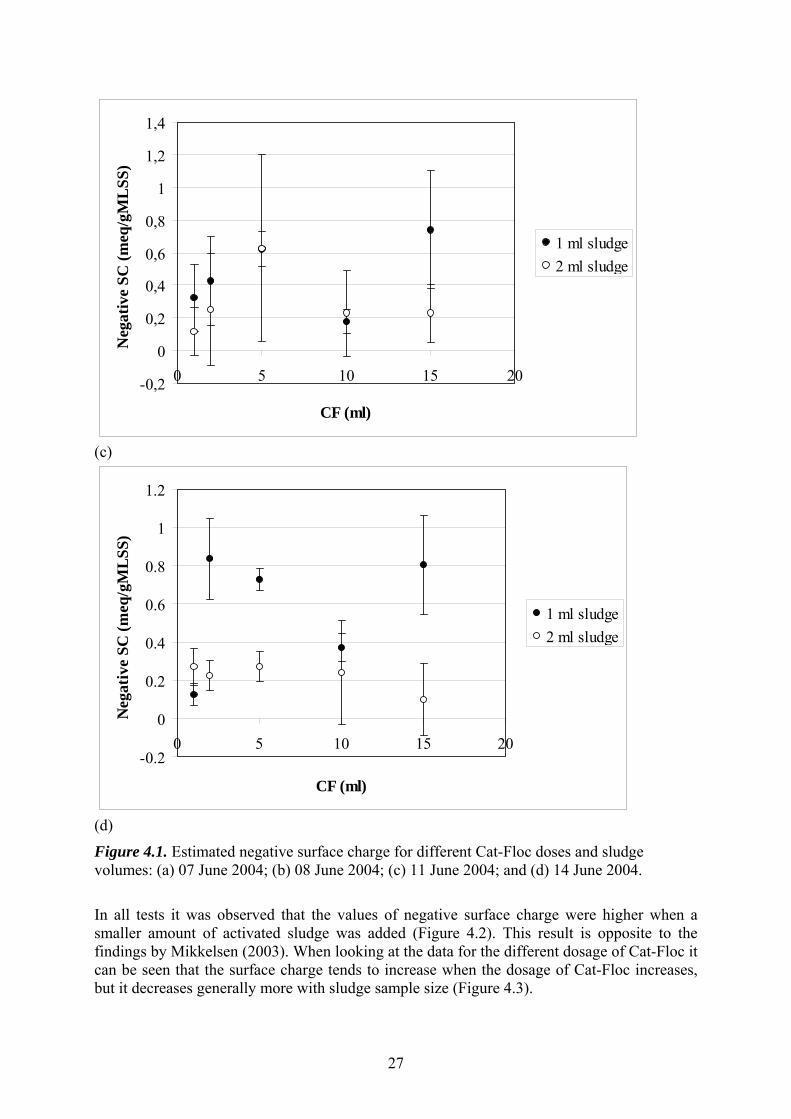
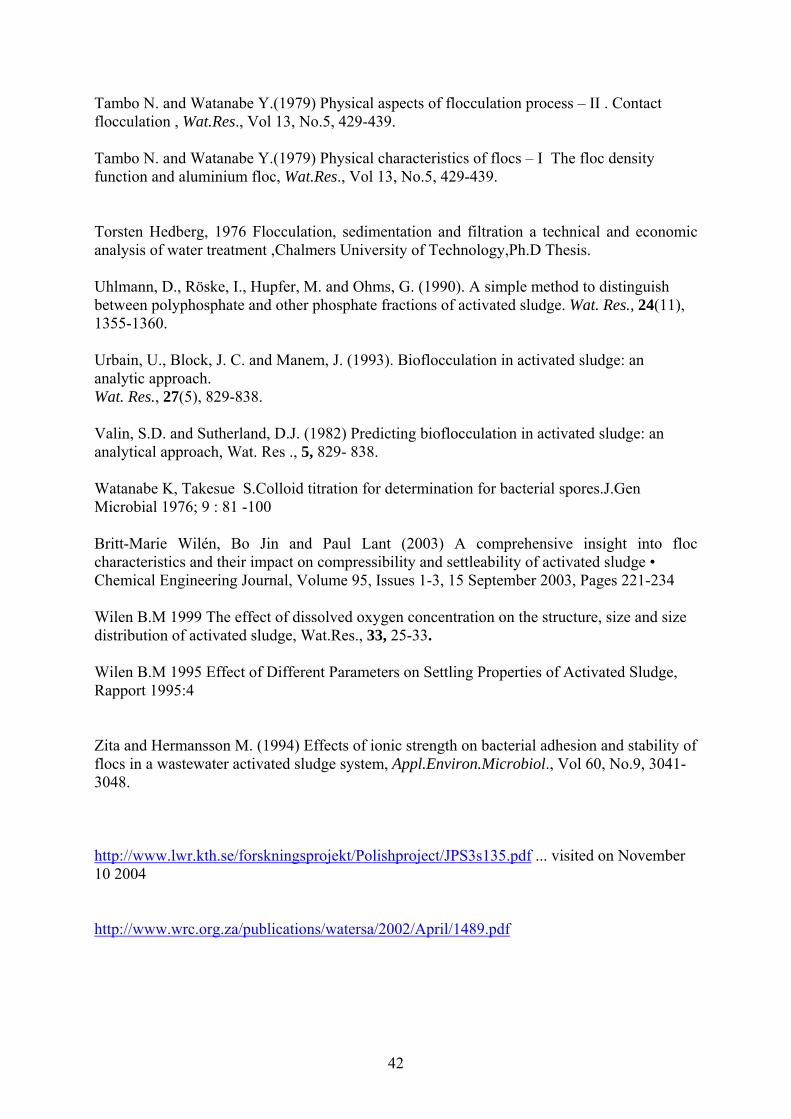
4.1. Manual titration Manual titrations of activated sludge were carried out during one week in the period June 7 to June 14, 2004. Titrations were performed with different amount of added Cat-Floc and activated sludge (Table 1). The results show that there was a large variation in the values of surface charge obtained (Figure 4.1). Often, the values were in the same order of magnitude as the standard deviations. When a larger sludge sample size was used, the standard deviations were smaller. There was no consistent pattern in the effect of added Cat-Floc amount, but in two of the tests, the estimated values of surface charge increased when more Cat-Floc was added to a given volume of sludge. This is in accordance with the results obtained by Mikkelsen (2003). The values of surface charge also fluctuated less with Cat-Floc dose when a larger sludge sample was titrated.
Table 4.1. Summary of negative surface charge (SC) for different combinations of Cat-Floc and sludge sample added during manual titration (add values and STD within brackets). Cat-Floc added (ml)
Activated sludge Sample size (ml)
SC 07 June
SC 08 June
SC 11 June
SC 14 June
1 1 0.2275± 0.388
2.1491± 0.295
0.3251± 0. 206
0.1239± 0.058
2 1 0,2275± 0.112
0,6798± 0.167
0.4285± 0.274
0.8364± 0.211
5 1 0.6399± 0.364
1.4474± 0.109
0.6206± 0.109
0,7280± 0.058
10 1 0.5973± 0.184
0.2632± 0.072
0.1773± 0.072
0.3718± 0.076
15 1 0.5973± 0.070
1.0307± 0.301
0.7388± 0.363
0.8055± 0.258
1 2 0.0853± 0.184
0.1754± 0.146
0.1182± 0.146
0.2710± 0.095
2 2 0.2204± 0.175
0,5373± 0.638
0.2512± 0.342
0.2246± 0.079
5 2 0.0569± 0.040
0.5373± 0.637
0.6280± 0.573
0.2711± 0.079
10 2 0.1493± 0.126
0.5044± 0.363
0.2290± 0.261
0.2401± 0.274
15 2 0.0924± 0.172
0.6469± 0.262
0.0960± 0.179
0.1007± 0.187
26
-0,4
-0,2
0
0,2
0,4
0,6
0,8
1
1,2
0 5 10 15 20
CF (ml)
Neg
ativ
e SC
(meq
/gM
LSS
)
1 ml sludge2 ml sludge
(a)
-0,5
0
0,5
1
1,5
2
2,5
3
0 5 10 15 20
CF (ml)
Neg
ativ
e SC
(meq
/gM
LSS
)
1 ml sludge2 ml sludge
(b)
27
-0,2
0
0,2
0,4
0,6
0,8
1
1,2
1,4
0 5 10 15 20
CF (ml)
Neg
ativ
e SC
(meq
/gM
LSS
)
1 ml sludge2 ml sludge
(c)
-0.2
0
0.2
0.4
0.6
0.8
1
1.2
0 5 10 15 20
CF (ml)
Neg
ativ
e SC
(meq
/gM
LSS)
1 ml sludge2 ml sludge
(d)
Figure 4.1. Estimated negative surface charge for different Cat-Floc doses and sludge volumes: (a) 07 June 2004; (b) 08 June 2004; (c) 11 June 2004; and (d) 14 June 2004.
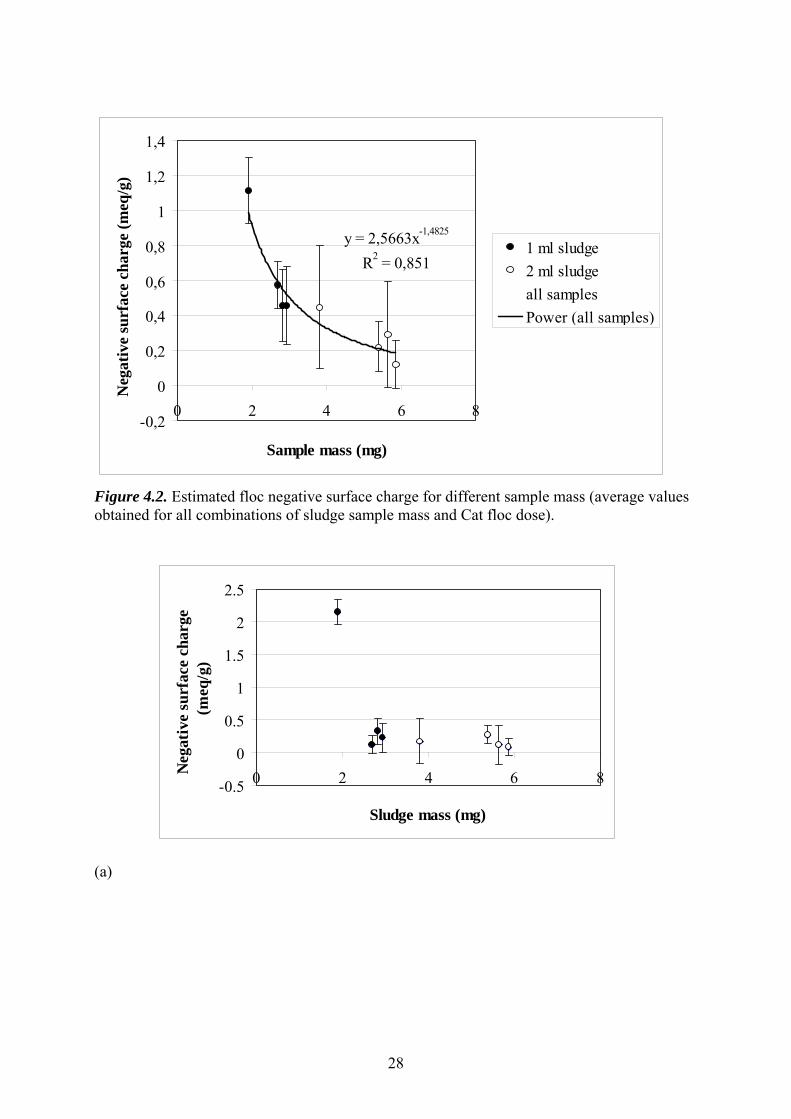
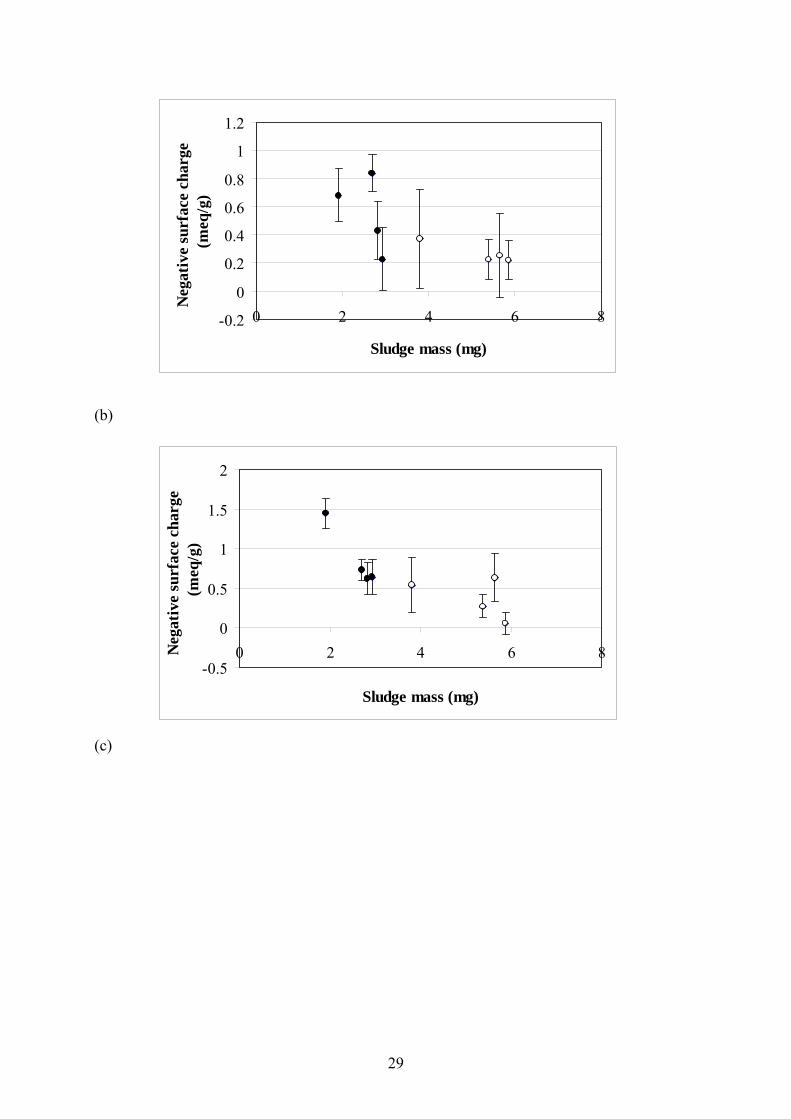
In all tests it was observed that the values of negative surface charge were higher when a smaller amount of activated sludge was added (Figure 4.2). This result is opposite to the findings by Mikkelsen (2003). When looking at the data for the different dosage of Cat-Floc it can be seen that the surface charge tends to increase when the dosage of Cat-Floc increases, but it decreases generally more with sludge sample size (Figure 4.3).
28
y = 2,5663x-1,4825
R2 = 0,851
-0,2
0
0,2
0,4
0,6
0,8
1
1,2
1,4
0 2 4 6 8
Sample mass (mg)
Neg
ativ
e su
rfac
e ch
arge
(meq
/g)
1 ml sludge2 ml sludgeall samplesPower (all samples)
Figure 4.2. Estimated floc negative surface charge for different sample mass (average values obtained for all combinations of sludge sample mass and Cat floc dose).
(a)
-0.5
0
0.5
1
1.5
2
2.5
0 2 4 6 8
Sludge mass (mg)
Neg
ativ
e su
rfac
e ch
arge
(m
eq/g
)
29
(b) (c)
-0.2
0
0.2
0.4
0.6
0.8
1
1.2
0 2 4 6 8
Sludge mass (mg)
Neg
ativ
e su
rfac
e ch
arge
(m
eq/g
)
-0.5
0
0.5
1
1.5
2
0 2 4 6 8
Sludge mass (mg)
Neg
ativ
e su
rfac
e ch
arge
(m
eq/g
)
30
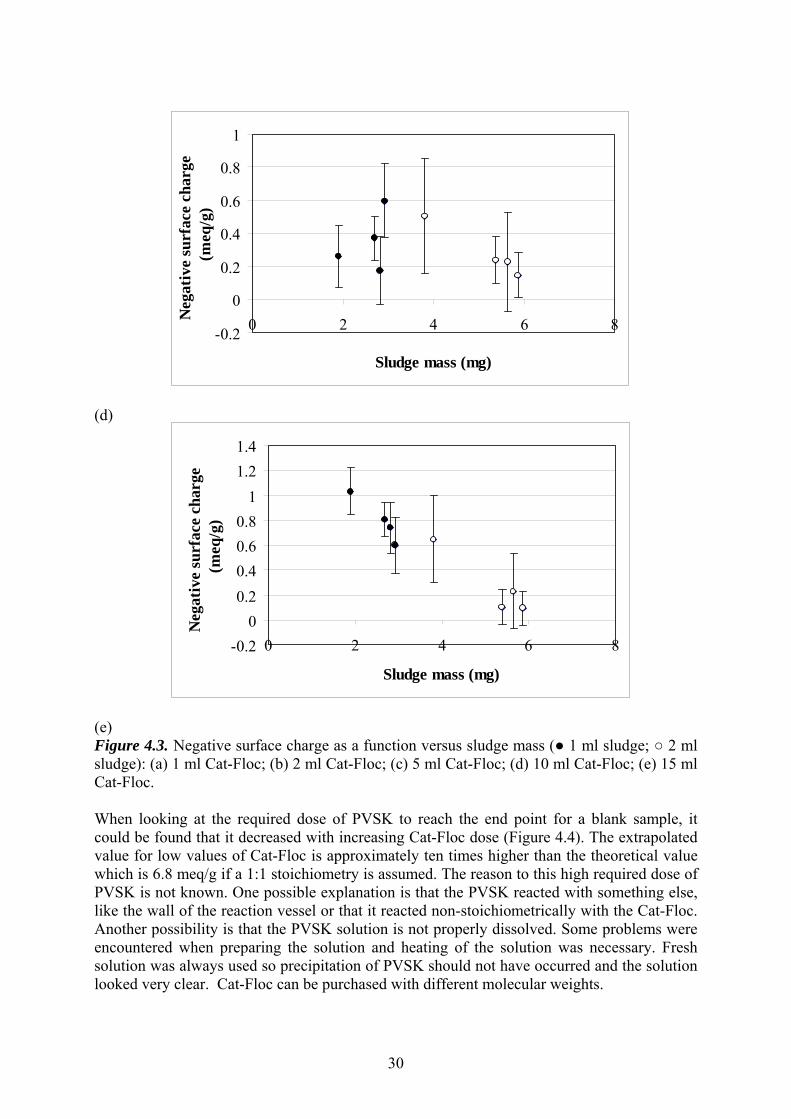
(d) (e) Figure 4.3. Negative surface charge as a function versus sludge mass (● 1 ml sludge; ○ 2 ml sludge): (a) 1 ml Cat-Floc; (b) 2 ml Cat-Floc; (c) 5 ml Cat-Floc; (d) 10 ml Cat-Floc; (e) 15 ml Cat-Floc. When looking at the required dose of PVSK to reach the end point for a blank sample, it could be found that it decreased with increasing Cat-Floc dose (Figure 4.4). The extrapolated value for low values of Cat-Floc is approximately ten times higher than the theoretical value which is 6.8 meq/g if a 1:1 stoichiometry is assumed. The reason to this high required dose of PVSK is not known. One possible explanation is that the PVSK reacted with something else, like the wall of the reaction vessel or that it reacted non-stoichiometrically with the Cat-Floc. Another possibility is that the PVSK solution is not properly dissolved. Some problems were encountered when preparing the solution and heating of the solution was necessary. Fresh solution was always used so precipitation of PVSK should not have occurred and the solution looked very clear. Cat-Floc can be purchased with different molecular weights.
-0.2
0
0.2
0.4
0.6
0.8
1
0 2 4 6 8
Sludge mass (mg)
Neg
ativ
e su
rfac
e ch
arge
(m
eq/g
)
-0.20
0.20.40.60.8
11.21.4
0 2 4 6 8
Sludge mass (mg)
Neg
ativ
e su
rfac
e ch
arge
(m
eq/g
)

31
Figure 4.4. PVSK dose required per gram of Cat-Floc to reach the end point of a blank titration for different amount of Cat-Floc added. When looking at the data it is clear that the standard deviations are often very large. This is due to the fact that the required volume of PVSK required for the sample compared to the blank is very similar; it only differs with a few ml (Appendix). In the manual titration procedure, the change in colour from blue to pink was done by eye and this method is not sensitive enough. This could further explain the large scatter in the data. It has been argued in the literature that colloidal titration is less suitable for characterization of bacterial suspensions since the obtained results are in the same order of magnitude as the standard deviation (Krekeler et al., 1989). In their report no information was given regarding the dose of polymer, which makes a direct comparison difficult.
4.2. Automatic titration Automatic titrations were made for three different Cat-Floc doses: 1, 2 and 5 ml with 1 and 2 ml sludge added. The results are summarized in Table 4.2. Table 4.2. Summary of negative surface charges (SC) obtained by automatic titration. Cat-Floc dose (ml)
Sludge sample size (ml)
SC-test 1 (meq/g)
SC-test 2 (meq/g)
1 1 2
6.2151±0.462 0.1787±0.013
9.3615±0.629
2 1 2
0.4880±0.117 0.6275±0
0.4183±0.128
5 1 2
0.1284±0.039 0.1307±0.092
0.1569±0.049
y = 67.846e-0.0675x
R2 = 0.8688
0102030405060708090
100
0 5 10 15 20
Cat-Floc dose (ml)
PVSK
add
ed/g
CF
(meq
/g)

32
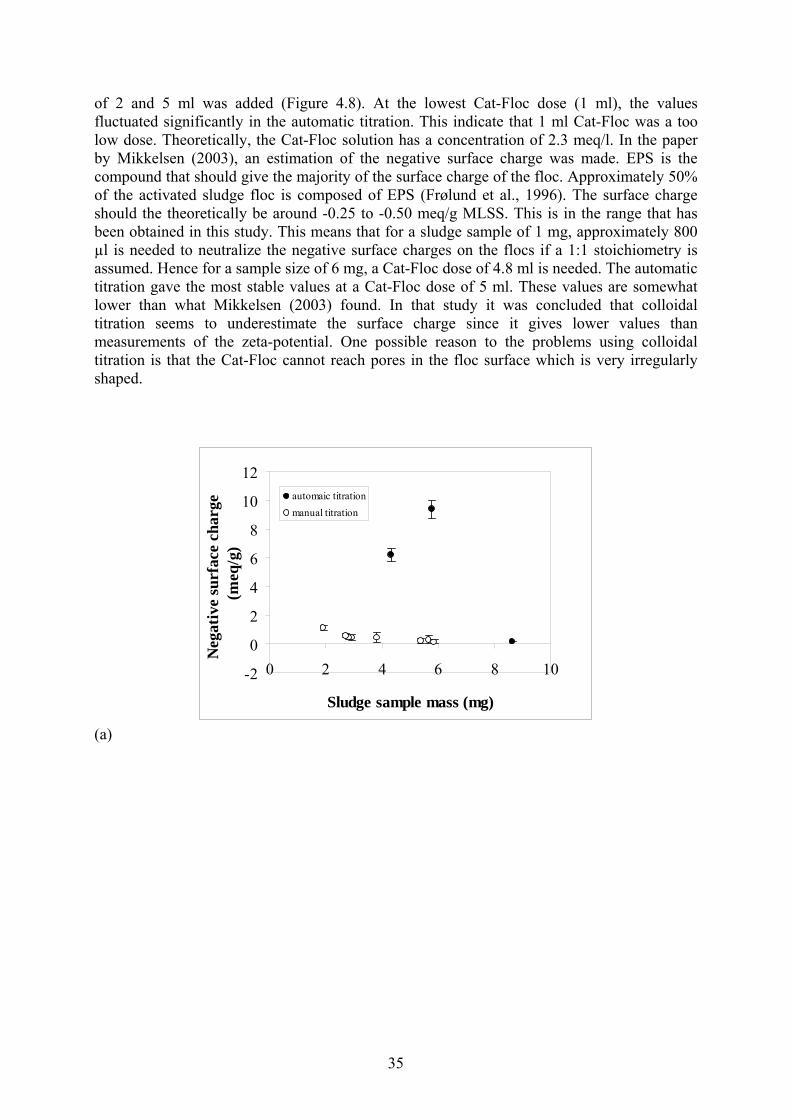
The results show that the values of negative surface charge decreased with Cat-Floc dose (Figure 4.5). This is opposite to what was found in the manual titration where most values of surface charge increased with increased Cat-Floc dose. Unrealistically high values of surface charge were obtained with a Cat-Floc dose of 1 ml which indicates that probably too little Cat-Floc was dosed.The most stable values were obtained for a higher Cat-Floc dose, i.e. 2-5 ml.
Figure 4.5. Negative surface charge in relation to Cat-Floc dose. The negative surface charge did not change so much with different sludge sample size used. For the lowest dose of Cat-Floc (1 ml), there was a large scatter in the data. For the higher Cat-Floc doses, the values of negative surface charge were relatively constant (Figure 4.6). (a)
0
2
4
6
8
10
12
0 1 2 3 4 5 6
CF (ml)
SC (m
eq/g
)
1 ml sludge-test 12 ml sludge-test 11 ml sludge-test 2
0
2
4
6
8
10
12
0 5 10
Sludge sample mass (mg)
Neg
ativ
e su
rfac
e ch
arge
(m
eq/g
)
test1-1 ml sludgetest1- 2 ml sludgetest2-1 ml sludge
33
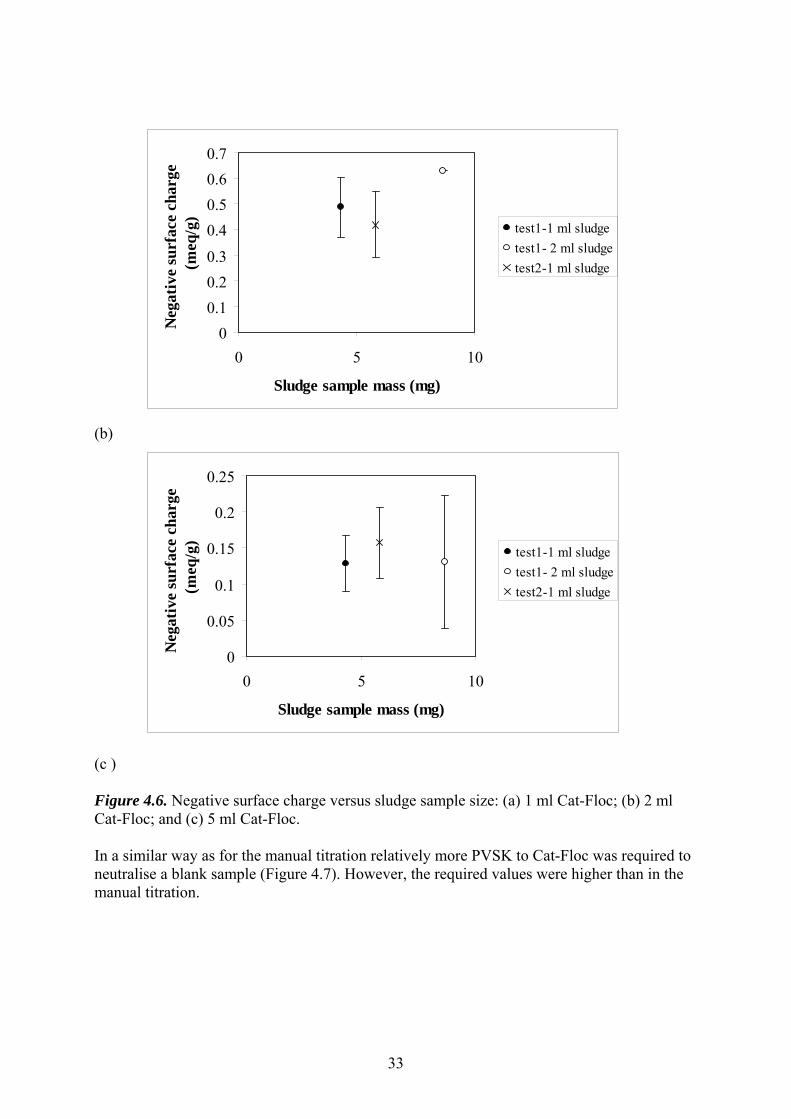
(b) (c ) Figure 4.6. Negative surface charge versus sludge sample size: (a) 1 ml Cat-Floc; (b) 2 ml Cat-Floc; and (c) 5 ml Cat-Floc. In a similar way as for the manual titration relatively more PVSK to Cat-Floc was required to neutralise a blank sample (Figure 4.7). However, the required values were higher than in the manual titration.
00.10.20.3
0.40.50.60.7
0 5 10
Sludge sample mass (mg)
Neg
ativ
e su
rfac
e ch
arge
(m
eq/g
)
test1-1 ml sludgetest1- 2 ml sludgetest2-1 ml sludge
0
0.05
0.1
0.15
0.2
0.25
0 5 10
Sludge sample mass (mg)
Neg
ativ
e su
rfac
e ch
arge
(m
eq/g
)
test1-1 ml sludgetest1- 2 ml sludgetest2-1 ml sludge
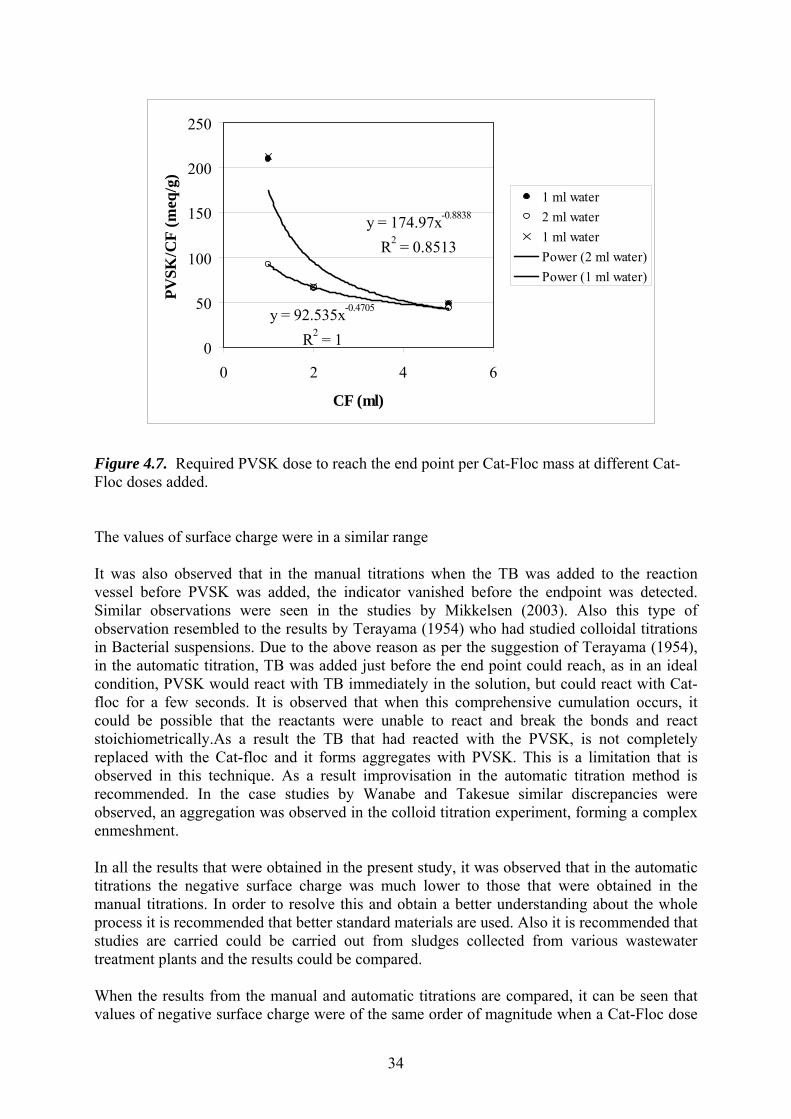
34
Figure 4.7. Required PVSK dose to reach the end point per Cat-Floc mass at different Cat-Floc doses added. The values of surface charge were in a similar range It was also observed that in the manual titrations when the TB was added to the reaction vessel before PVSK was added, the indicator vanished before the endpoint was detected. Similar observations were seen in the studies by Mikkelsen (2003). Also this type of observation resembled to the results by Terayama (1954) who had studied colloidal titrations in Bacterial suspensions. Due to the above reason as per the suggestion of Terayama (1954), in the automatic titration, TB was added just before the end point could reach, as in an ideal condition, PVSK would react with TB immediately in the solution, but could react with Cat-floc for a few seconds. It is observed that when this comprehensive cumulation occurs, it could be possible that the reactants were unable to react and break the bonds and react stoichiometrically.As a result the TB that had reacted with the PVSK, is not completely replaced with the Cat-floc and it forms aggregates with PVSK. This is a limitation that is observed in this technique. As a result improvisation in the automatic titration method is recommended. In the case studies by Wanabe and Takesue similar discrepancies were observed, an aggregation was observed in the colloid titration experiment, forming a complex enmeshment. In all the results that were obtained in the present study, it was observed that in the automatic titrations the negative surface charge was much lower to those that were obtained in the manual titrations. In order to resolve this and obtain a better understanding about the whole process it is recommended that better standard materials are used. Also it is recommended that studies are carried could be carried out from sludges collected from various wastewater treatment plants and the results could be compared. When the results from the manual and automatic titrations are compared, it can be seen that values of negative surface charge were of the same order of magnitude when a Cat-Floc dose
y = 92.535x-0.4705
R2 = 1
y = 174.97x-0.8838
R2 = 0.8513
0
50
100
150
200
250
0 2 4 6
CF (ml)
PVSK
/CF
(meq
/g)
1 ml water2 ml water1 ml waterPower (2 ml water)Power (1 ml water)
35
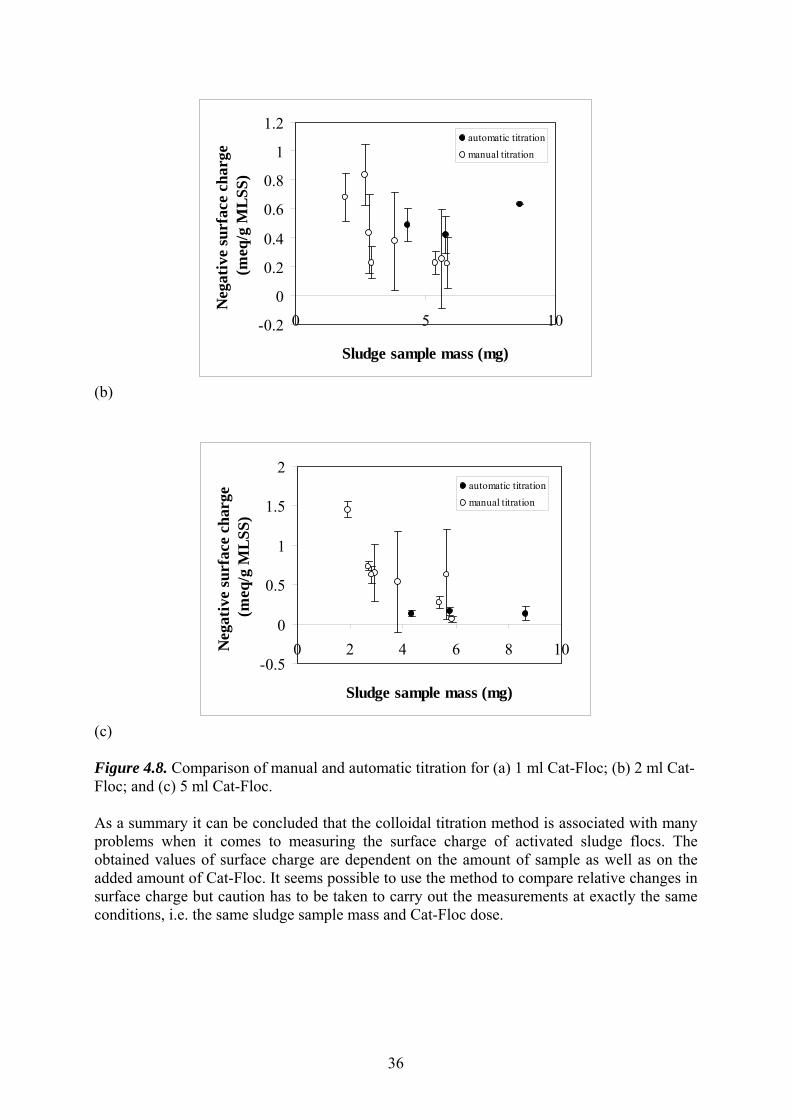
of 2 and 5 ml was added (Figure 4.8). At the lowest Cat-Floc dose (1 ml), the values fluctuated significantly in the automatic titration. This indicate that 1 ml Cat-Floc was a too low dose. Theoretically, the Cat-Floc solution has a concentration of 2.3 meq/l. In the paper by Mikkelsen (2003), an estimation of the negative surface charge was made. EPS is the compound that should give the majority of the surface charge of the floc. Approximately 50% of the activated sludge floc is composed of EPS (Frølund et al., 1996). The surface charge should the theoretically be around -0.25 to -0.50 meq/g MLSS. This is in the range that has been obtained in this study. This means that for a sludge sample of 1 mg, approximately 800 µl is needed to neutralize the negative surface charges on the flocs if a 1:1 stoichiometry is assumed. Hence for a sample size of 6 mg, a Cat-Floc dose of 4.8 ml is needed. The automatic titration gave the most stable values at a Cat-Floc dose of 5 ml. These values are somewhat lower than what Mikkelsen (2003) found. In that study it was concluded that colloidal titration seems to underestimate the surface charge since it gives lower values than measurements of the zeta-potential. One possible reason to the problems using colloidal titration is that the Cat-Floc cannot reach pores in the floc surface which is very irregularly shaped.
-2
0
2
4
6
8
10
12
0 2 4 6 8 10
Sludge sample mass (mg)
Neg
ativ
e su
rfac
e ch
arge
(m
eq/g
)
automaic titrationmanual titration
(a)
36
-0.2
0
0.2
0.4
0.6
0.8
1
1.2
0 5 10
Sludge sample mass (mg)
Neg
ativ
e su
rfac
e ch
arge
(m
eq/g
MLS
S)
automatic titrationmanual titration
(b)
-0.5
0
0.5
1
1.5
2
0 2 4 6 8 10
Sludge sample mass (mg)
Neg
ativ
e su
rfac
e ch
arge
(m
eq/g
MLS
S)
automatic titrationmanual titration
(c) Figure 4.8. Comparison of manual and automatic titration for (a) 1 ml Cat-Floc; (b) 2 ml Cat-Floc; and (c) 5 ml Cat-Floc. As a summary it can be concluded that the colloidal titration method is associated with many problems when it comes to measuring the surface charge of activated sludge flocs. The obtained values of surface charge are dependent on the amount of sample as well as on the added amount of Cat-Floc. It seems possible to use the method to compare relative changes in surface charge but caution has to be taken to carry out the measurements at exactly the same conditions, i.e. the same sludge sample mass and Cat-Floc dose.
37
5. CONCLUSIONS From the results obtained during the course of the study the conclusions could be drawn as follows:
• It was observed in the manual titration that there was a huge variation in the surface charge obtained and the standard deviation was often in the same order of magnitude as the values of surface charge. • In all the tests in the manual titration it was seen that values of negative charge were higher when a smaller amount of activated sludge was added. However, a larger sludge sample mass gave more stable values. • In the manual titration the values of negative surface charge were higher when a larger volume of Cat-Floc was added. • From the automatic titrations it was observed that the values of the negative surface charge decreased with the amount of Cat-Floc dosed. This is reverse to the observations from manual titrations. • There was no great degree of variation in the negative surface charge with sample size in the automatic titrations.

38
39
6. REFERENCES Amirtharajah and O’Melia CR (1990) Coagulation Processes: Destabilization, Mixing and Flocculation. In: AWWA, Water Quality and Treatment: a handbook Bruus, J.H., Nielsen, P.H and Keiding , K. (1992) On the stability of activated sludge flocs with implication to dewatering , Wat. Res., 26, 1597 – 1604. Busch P.L. and Stumm W. (1968) Chemical interactions in the aggregation of bacteria; Bioflocculation in wastewater, Envir.Sci.Tech., Vol 2, 49-53. Brown M.J. and Lester J.N. (1980) Comparison of bacterial extracellular polymer extraction methods , Appl.Env.Micr., 40 , No.2, 179-185. Chao and Keinath T.M. (1979) Influence of process loading intensity on sludge clarification and thickening characteristics, Wat.Res.,Vol.13,1213-1223. Deryagin and Landau (1941) and Verwey and Overbeek (1948). Erikkson L. and Härdin A-M. (1984) Settling properties of activated sludge related to floc structure , Wat . Sci.Tech., vol 16, 55 – 68. Erikkson L. and Alm B.(1992) Model system studies of formation and properties of flocs obtained with cationic polyelctolytes, in : Chemical water and wastetreatment II, Klute R. and Hahn H.H. (Eds.), Berlin Heidelberg, New York : Springer- verlag, Proc.5th Göthenburg symposium, 26-30 September ., 1992,Nizza Figueroa, L. A. and Silverstein, J. A. (1987). Ruthenium red adsorption method for measurement of extra cellular polysaccharides in sludge flocs. Biotech. Bioeng., 33, 941-947. Fitch, B. and Kos, P. (1976). Towards a more meaningful index of sludge quality. J. WPCF, 48, 1979-1987.Assoc., Washington DC, USA. Fredrich E ., Fredrich H ., Heinze W ., Jobst ., Richter H.- J and Hermel W .(1993) Progress in characterization of sludge particles , Wat.Sci.Tech., Vol 28, No .1, 145 -148 Froster, C.F. (1968) The surface of activated sludge particles in relation to their settling characteristics, Wat. Res., 2, 767 – 776. Frølund, B., Keiding, K. and Neilsen ,P.H. (1994) A comparative study of bioplymers from a conventional and an advanced activated sludge treatment plant, Wat.Sci.Tech., 29 , 137- 141. Frølund, B., Palmgren , R, Keiding, K. and Neilsen ,P.H. (1996) Extraction of extracellular polymers from activated sludge using a cation resin , Wat.Res., 30.1749-1758.
40
Ganczarczyk J. J., Zahid W.M. and Li D.-H.(1992) Physical stabilization and embedding of microbial aggregates for light microscopy studies , Wat.Res ., Vol..26, No 12, 1695-1699. Goodwin J.A.S. and Forster C.F. (1985) A further examination into the composition of actiavted sludge surface in relation to their settlement characteristics,Wat.Res., Vol.19,No.4,527-533. Henze M., Dupont, Grau P. and De la Sota A.. (1993) Rising sludge in secondary settlers due to denitrification, Wat. Res ., Vol 27, No 2, 231- 236. Higgins, M. and Novak, J.T. (1997 a) Dewatering and settling of activated sludges: The case for using cation analysis, Wat.Env.Res ., 69 225-232. Jorand F., Zartarian F., Thomas F., Block J. C., Bottero J. Y., Villemin G., Ca+2 in the flocculation of Kluyvera cryocrescens KA – 103, J. Ferm . Bioengng., Vol 69, 224 – 227. Levine A.D., Tchobanoglous G and Asano T. (1985) Characterization of the size distribution of contaminants in wastewater:treatment and reuse implications, J.WPCF, Vol 57, No 7, 805-816 Li and Ganczarczyk, J.J. (1990) Structure of activated sludge flocs, Biotech.Bioeng., 22, 789-792. Keiding, K. and Keinath , T.M (1997) Desorption of organic macromolecules from activated sludge: effect of ionic composition , Wat.Res., 31, 1665- 1672. Marshall, K.C. (1981) Bacterial adhesion in natural environments, in : Microbial adhesion to surfaces , Berkeley, R.C., Lynch, J.M., Melling J., Rutter P.R and Vincent B (eds.) Ellis Horwood , Chichester, UK, Chap 9. Metcalf.L and Eddy H.P. (1991) Wastewater Engineering, treatment disposal,use, McGraw-Hill Publishing Company Ltd. Mikkelsen, L., H (2003) Applications and limitations of the colloid titration method for measuring activated sludge surface charges, Wat.Res., Vol 37, 2458-2466
41
Morgan J.W., Forster C.F. and Evison L. (1990) A comparative study of the nature of biopolymers extracted from anaerobic and activated sludges, Wat. Res ., Vol 24, No 6, 743- 750. Nielsen P.H., Raunkjer K., Norsker N.H Na and Hvitved –Jacabsen T (1992). Transformation of wastewater in sewer systems – a review, Wat.Sci.Tech., Vol.25, 17-31 Novak L., Larrea L., Wanner J. and Jenkins D. (1971) Physical conditioning of sludge, J. WPCF ., Vol 43 , No . 9, 1817 – 1833. Novak L., Larrea ., Wanner J. and Garcia – Heras J.L . (1994) Non – filamentous activated sludge caused by Zooglea, Wat.Sci.Tech., Vol.27, No.8, 1339- 1346. Onabe F. Studies of interfacial phenomena using the colloid –titration method.I.Interpretation of the colloid-titration system (Poly – DMDAAC : PVSK) as the polyionic complex formation process.Mokkuzai Gakaschi 1982; 28 : 437 -444. Parker D.S., Kaufman W.J. and Jenkins D. (1971) Physical conditioning of activated sludge, J.WPCF., Vol 43, No.9, 1817-1833. Pavoni J.L., Tenney M.W. and Echelberger W.F., Jr. (1972) Bacterial exocellular polymers and biological flocculation, J.WPCF., Vol 44, No.3, 414 – 431. Sanin and Vesilind P.A. (1996, 1999) Effect of centrifugation on the removal of extracellular polymers and physical properties of activated sludge, IAWQ 17th Biennial International Conference , 24- 29 July , Budapest , Hungary , Wat.Sci.Tech., Vol 30, No 8, 117- 127. Seizen M., Jenkins D. and Parker D.S.(1978) A unified theory of filamentous sludge bulking , JWPCF., Vol 50, 362 – 381. Shaw.J.Duncan 1992 – Introduction to Colloid and Surface Chemistry, 4th Edition, Butterworth Heinemann Publications Snidaro,D., Zartarian , F., Jorand , F., Bottero, J.Y., Block, J.C and Manem. J. (1997) Characterization of activated sludge flocs. Steiner A.E., McLaren D.A. and Forester C.F. (1976) The nature of activated sludge flocs, Wat. Res., Vol 10, 25-30 Tambo N. and Hozumi H. (1979) Physical aspects of flocculation process – II. Contact flocculation , Wat.Res., Vol 13, No.5, 441-448.
42
Tambo N. and Watanabe Y.(1979) Physical aspects of flocculation process – II . Contact flocculation , Wat.Res., Vol 13, No.5, 429-439. Tambo N. and Watanabe Y.(1979) Physical characteristics of flocs – I The floc density function and aluminium floc, Wat.Res., Vol 13, No.5, 429-439. Torsten Hedberg, 1976 Flocculation, sedimentation and filtration a technical and economic analysis of water treatment ,Chalmers University of Technology,Ph.D Thesis. Uhlmann, D., Röske, I., Hupfer, M. and Ohms, G. (1990). A simple method to distinguish between polyphosphate and other phosphate fractions of activated sludge. Wat. Res., 24(11), 1355-1360. Urbain, U., Block, J. C. and Manem, J. (1993). Bioflocculation in activated sludge: an analytic approach. Wat. Res., 27(5), 829-838. Valin, S.D. and Sutherland, D.J. (1982) Predicting bioflocculation in activated sludge: an analytical approach, Wat. Res ., 5, 829- 838. Watanabe K, Takesue S.Colloid titration for determination for bacterial spores.J.Gen Microbial 1976; 9 : 81 -100 Britt-Marie Wilén, Bo Jin and Paul Lant (2003) A comprehensive insight into floc characteristics and their impact on compressibility and settleability of activated sludge • Chemical Engineering Journal, Volume 95, Issues 1-3, 15 September 2003, Pages 221-234 Wilen B.M 1999 The effect of dissolved oxygen concentration on the structure, size and size distribution of activated sludge, Wat.Res., 33, 25-33. Wilen B.M 1995 Effect of Different Parameters on Settling Properties of Activated Sludge, Rapport 1995:4 Zita and Hermansson M. (1994) Effects of ionic strength on bacterial adhesion and stability of flocs in a wastewater activated sludge system, Appl.Environ.Microbiol., Vol 60, No.9, 3041- 3048. http://www.lwr.kth.se/forskningsprojekt/Polishproject/JPS3s135.pdf ... visited on November 10 2004 http://www.wrc.org.za/publications/watersa/2002/April/1489.pdf
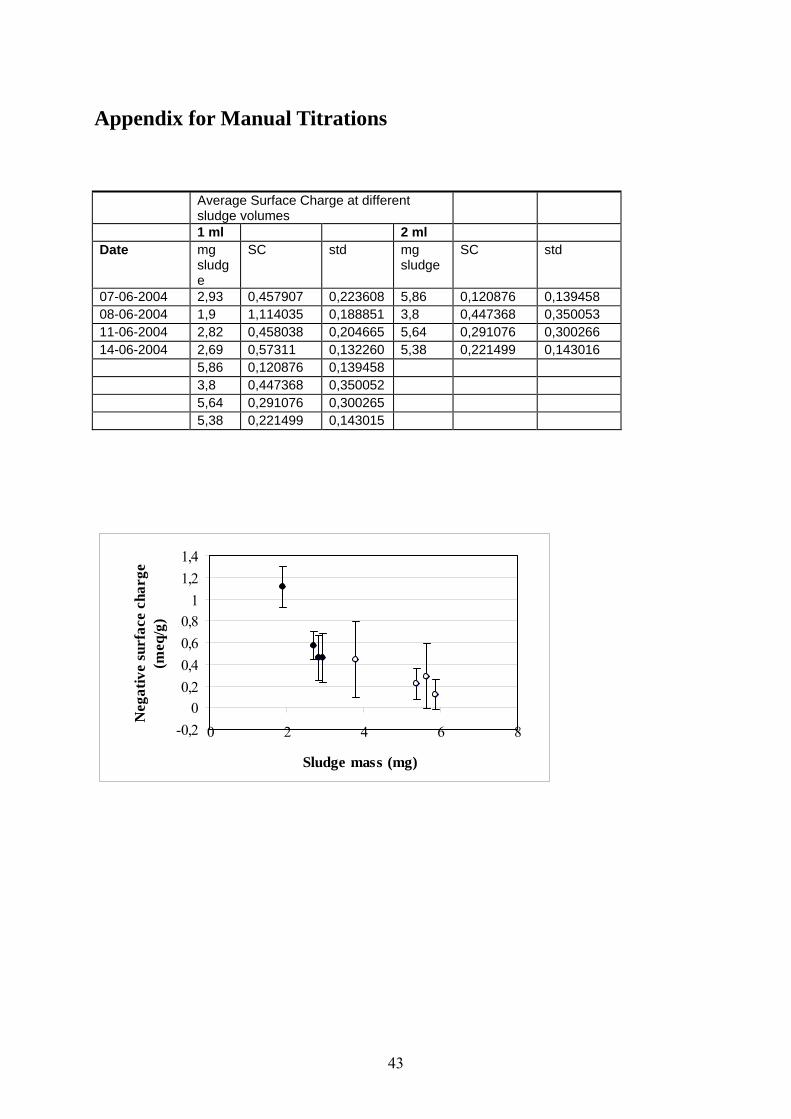
43
Appendix for Manual Titrations
Average Surface Charge at different
sludge volumes
1 ml 2 ml Date mg
sludge
SC std mg sludge
SC std
07-06-2004 2,93 0,457907 0,223608 5,86 0,120876 0,139458 08-06-2004 1,9 1,114035 0,188851 3,8 0,447368 0,350053 11-06-2004 2,82 0,458038 0,204665 5,64 0,291076 0,300266 14-06-2004 2,69 0,57311 0,132260 5,38 0,221499 0,143016 5,86 0,120876 0,139458 3,8 0,447368 0,350052 5,64 0,291076 0,300265 5,38 0,221499 0,143015
-0,20
0,20,40,60,8
11,21,4
0 2 4 6 8
Sludge mass (mg)
Neg
ativ
e su
rfac
e ch
arge
(m
eq/g
)
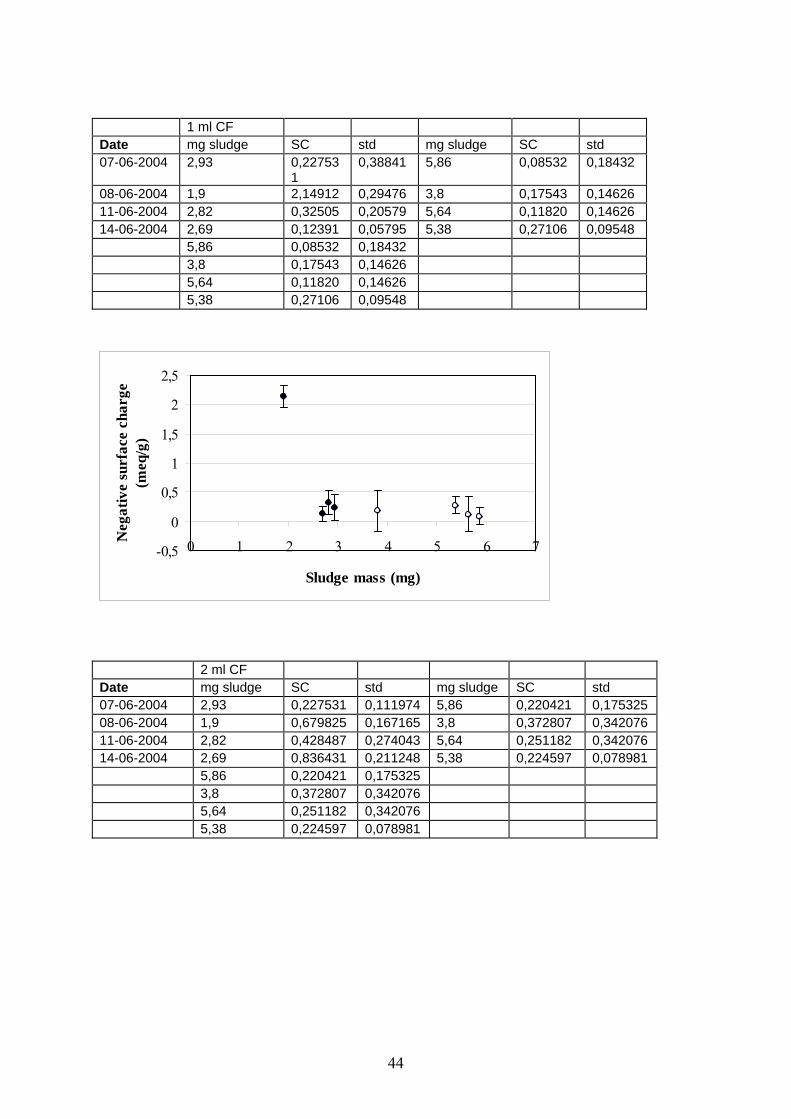
44
1 ml CF Date mg sludge SC std mg sludge SC std 07-06-2004 2,93 0,22753
1 0,38841 5,86 0,08532 0,18432
08-06-2004 1,9 2,14912 0,29476 3,8 0,17543 0,14626 11-06-2004 2,82 0,32505 0,20579 5,64 0,11820 0,14626 14-06-2004 2,69 0,12391 0,05795 5,38 0,27106 0,09548 5,86 0,08532 0,18432 3,8 0,17543 0,14626 5,64 0,11820 0,14626 5,38 0,27106 0,09548
-0,5
0
0,5
1
1,5
2
2,5
0 1 2 3 4 5 6 7
Sludge mass (mg)
Neg
ativ
e su
rfac
e ch
arge
(m
eq/g
)
2 ml CF Date mg sludge SC std mg sludge SC std 07-06-2004 2,93 0,227531 0,111974 5,86 0,220421 0,175325 08-06-2004 1,9 0,679825 0,167165 3,8 0,372807 0,342076 11-06-2004 2,82 0,428487 0,274043 5,64 0,251182 0,342076 14-06-2004 2,69 0,836431 0,211248 5,38 0,224597 0,078981 5,86 0,220421 0,175325 3,8 0,372807 0,342076 5,64 0,251182 0,342076 5,38 0,224597 0,078981

45
-0,2
0
0,2
0,4
0,6
0,8
1
1,2
0 1 2 3 4 5 6 7
Sludge mass (mg)
Neg
ativ
e su
rfac
e ch
arge
(m
eq/g
)
5 ml CF Date mg sludge SC std mg sludge SC std 07-06-2004 2,93 0,639932 0,363672 5,86 0,056883 0,040222 08-06-2004 1,9 1,447368 0,108577 3,8 0,537281 0,637572 11-06-2004 2,82 0,620567 0,108577 5,64 0,627955 0,572631 14-06-2004 2,69 0,728005 0,057956 5,38 0,271066 0,078981 5,86 0,056883 0,040222 3,8 0,537281 0,637572 5,64 0,627955 0,572631 5,38 0,271066 0,078981
-0,5
0
0,5
1
1,5
2
0 1 2 3 4 5 6 7
Sludge mass (mg)
Neg
ativ
e su
rfac
e ch
arge
(m
eq/g
)
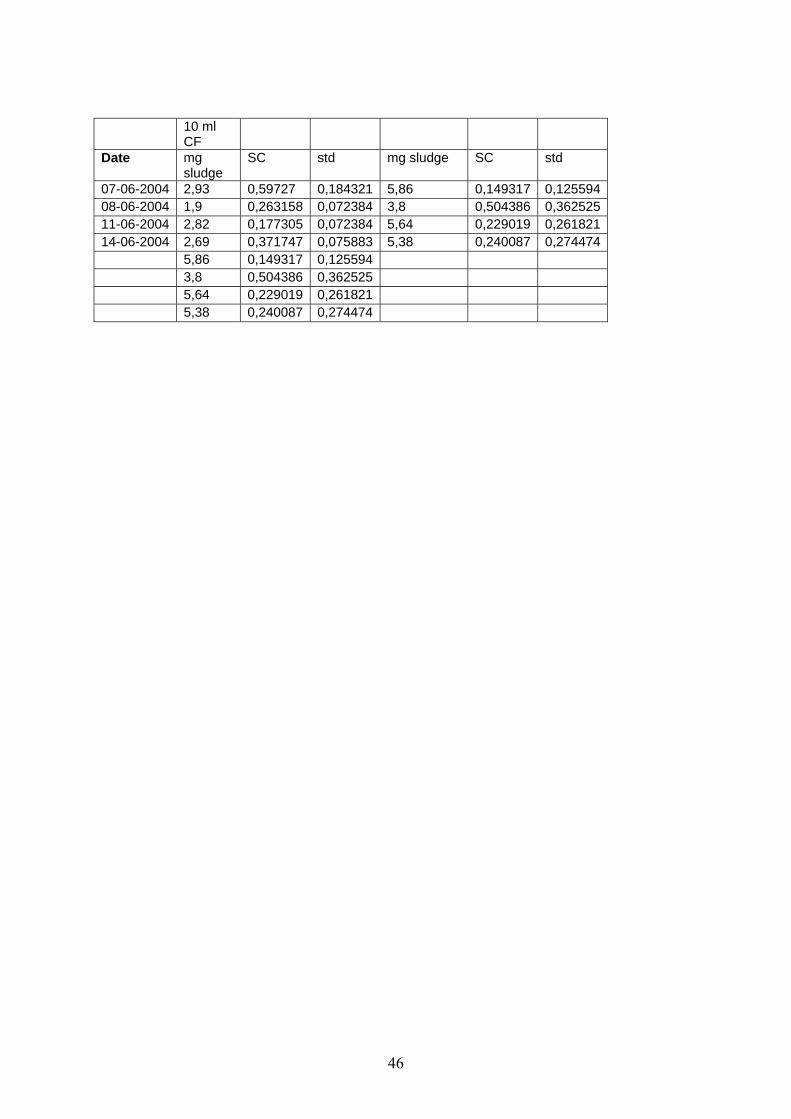
46
10 ml
CF
Date mg sludge
SC std mg sludge SC std
07-06-2004 2,93 0,59727 0,184321 5,86 0,149317 0,125594 08-06-2004 1,9 0,263158 0,072384 3,8 0,504386 0,362525 11-06-2004 2,82 0,177305 0,072384 5,64 0,229019 0,261821 14-06-2004 2,69 0,371747 0,075883 5,38 0,240087 0,274474 5,86 0,149317 0,125594 3,8 0,504386 0,362525 5,64 0,229019 0,261821 5,38 0,240087 0,274474
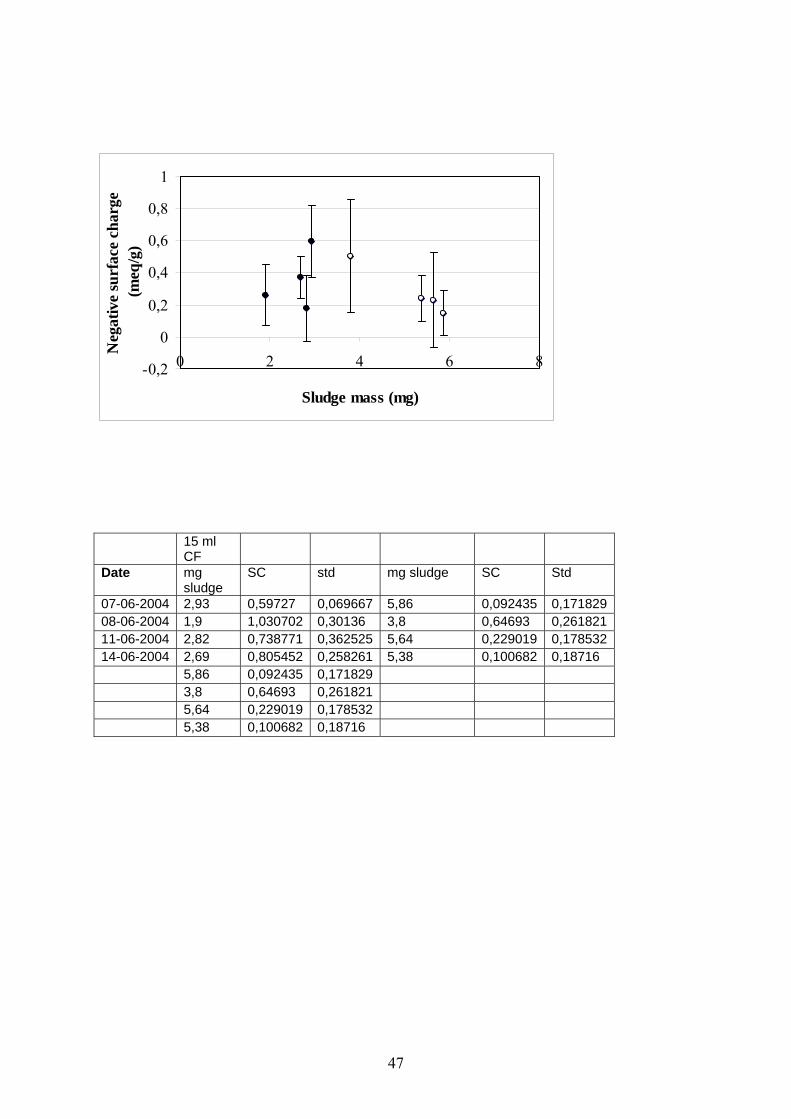
47
-0,2
0
0,2
0,4
0,6
0,8
1
0 2 4 6 8
Sludge mass (mg)
Neg
ativ
e su
rfac
e ch
arge
(m
eq/g
)
15 ml
CF
Date mg sludge
SC std mg sludge SC Std
07-06-2004 2,93 0,59727 0,069667 5,86 0,092435 0,171829 08-06-2004 1,9 1,030702 0,30136 3,8 0,64693 0,261821 11-06-2004 2,82 0,738771 0,362525 5,64 0,229019 0,178532 14-06-2004 2,69 0,805452 0,258261 5,38 0,100682 0,18716 5,86 0,092435 0,171829 3,8 0,64693 0,261821 5,64 0,229019 0,178532 5,38 0,100682 0,18716
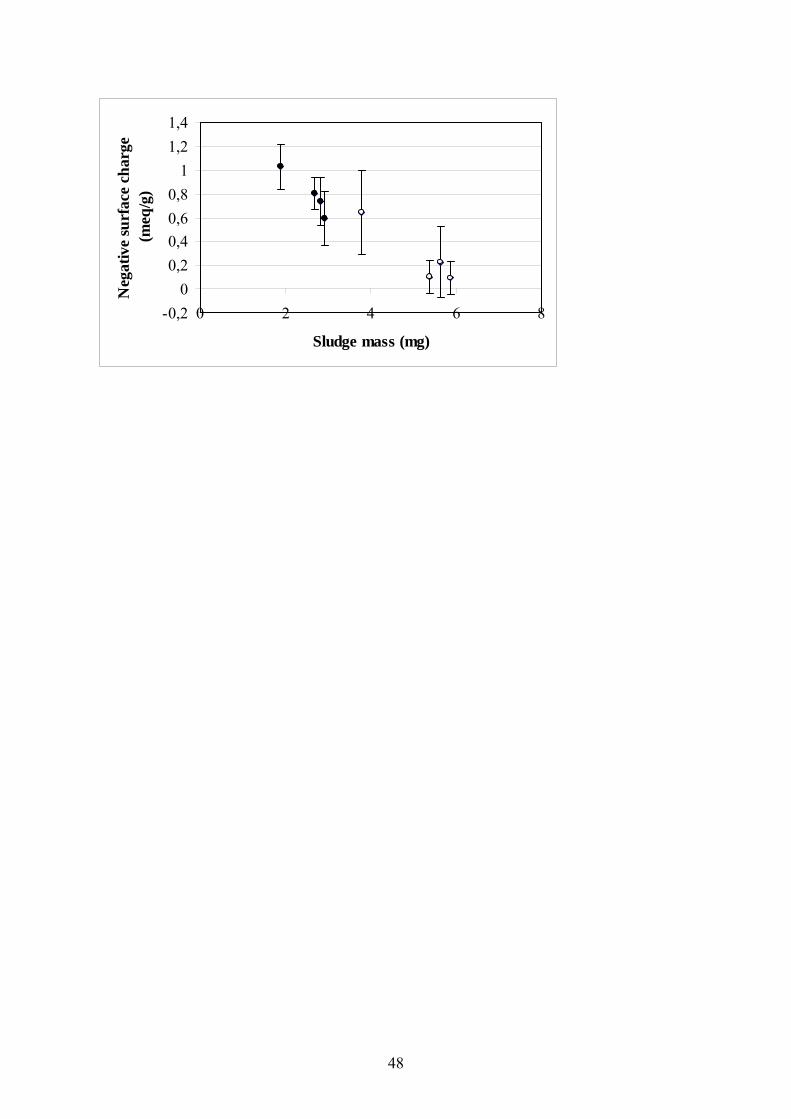
48
-0,20
0,20,40,60,8
11,21,4
0 2 4 6 8
Sludge mass (mg)
Neg
ativ
e su
rfac
e ch
arge
(m
eq/g
)

49
Appendix for Automatic Titration
0
0,2
0,4
0,6
0,8
1
1,2
1,4
1,6
0 50 100 150 200 250 300 350
Titration time (s)
Abs
orba
nce
(620
nm
)
End point titration time
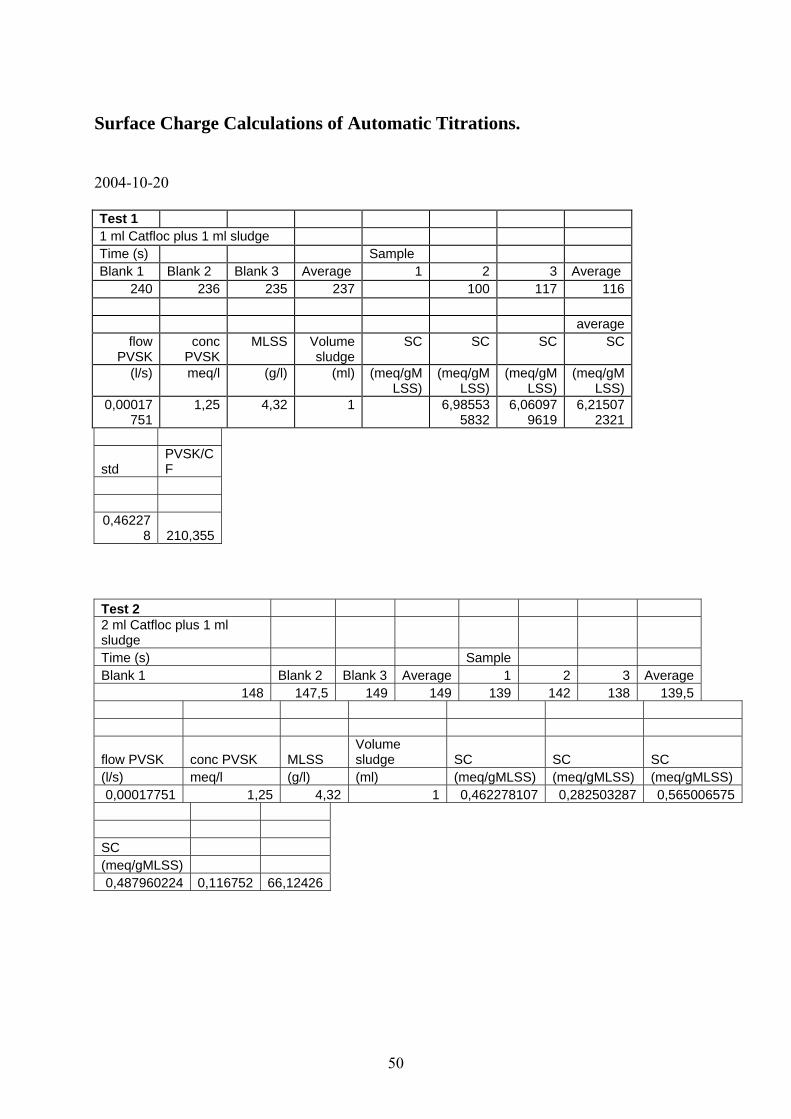
50
Surface Charge Calculations of Automatic Titrations. 2004-10-20 Test 1 1 ml Catfloc plus 1 ml sludge Time (s) Sample Blank 1 Blank 2 Blank 3 Average 1 2 3 Average
240 236 235 237 100 117 116 average
flow PVSK
conc PVSK
MLSS Volume sludge
SC SC SC SC
(l/s) meq/l (g/l) (ml) (meq/gMLSS)
(meq/gMLSS)
(meq/gMLSS)
(meq/gMLSS)
0,00017751
1,25 4,32 1 6,985535832
6,060979619
6,215072321
std PVSK/CF
0,46227
8 210,355 Test 2 2 ml Catfloc plus 1 ml sludge Time (s) Sample Blank 1 Blank 2 Blank 3 Average 1 2 3 Average
148 147,5 149 149 139 142 138 139,5
flow PVSK conc PVSK MLSS Volume sludge SC SC SC
(l/s) meq/l (g/l) (ml) (meq/gMLSS) (meq/gMLSS) (meq/gMLSS) 0,00017751 1,25 4,32 1 0,462278107 0,282503287 0,565006575
SC (meq/gMLSS) 0,487960224 0,116752 66,12426

51
continued.. Test 3 5 ml Catfloc plus 1 ml sludge Time (s) Sample
Blank 1 Blank 2 Blank 3 Average 1 2 3 Average
268,5 268 297 269 268 266 280,5 266,5
(exclude sample 2)
flow PVSK conc PVSK MLSS Volume sludge SC SC SC
(l/s) meq/l (g/l) (ml) (meq/gMLSS) (meq/gMLSS) (meq/gMLSS) 0,00017751 1,25 4,32 1 0,025682117 0,102728468
SC (meq/gMLSS) 0,128410585 0,038523 47,75148
2004-10-21 Test 1 1 ml Catfloc plus 2 ml sludge Time (s) Sample Blank 1 Blank 2 Blank 3 Average 1 2 3 Average
105 101 101 102,3333 95 96 95,5
flow PVSK conc PVSK MLSS Volume sludge SC SC SC
(l/s) meq/l (g/l) (ml) (meq/gMLSS) (meq/gMLSS) (meq/gMLSS) 0,00018072 1,25 4,32 2 0,15687751 0,130731258
SC (meq/gMLSS) 0,178666053 0,013073 92,46988
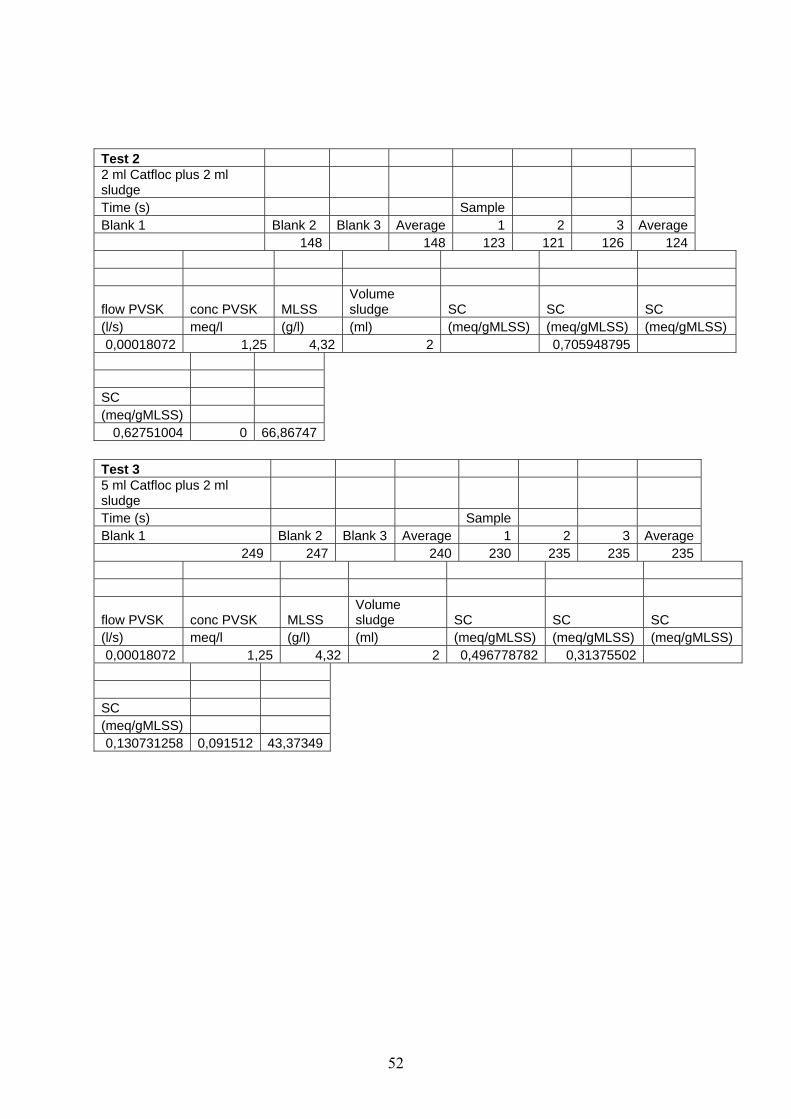
52
Test 2 2 ml Catfloc plus 2 ml sludge Time (s) Sample Blank 1 Blank 2 Blank 3 Average 1 2 3 Average 148 148 123 121 126 124
flow PVSK conc PVSK MLSS Volume sludge SC SC SC
(l/s) meq/l (g/l) (ml) (meq/gMLSS) (meq/gMLSS) (meq/gMLSS) 0,00018072 1,25 4,32 2 0,705948795
SC (meq/gMLSS)
0,62751004 0 66,86747 Test 3 5 ml Catfloc plus 2 ml sludge Time (s) Sample Blank 1 Blank 2 Blank 3 Average 1 2 3 Average
249 247 240 230 235 235 235
flow PVSK conc PVSK MLSS Volume sludge SC SC SC
(l/s) meq/l (g/l) (ml) (meq/gMLSS) (meq/gMLSS) (meq/gMLSS) 0,00018072 1,25 4,32 2 0,496778782 0,31375502
SC (meq/gMLSS) 0,130731258 0,091512 43,37349
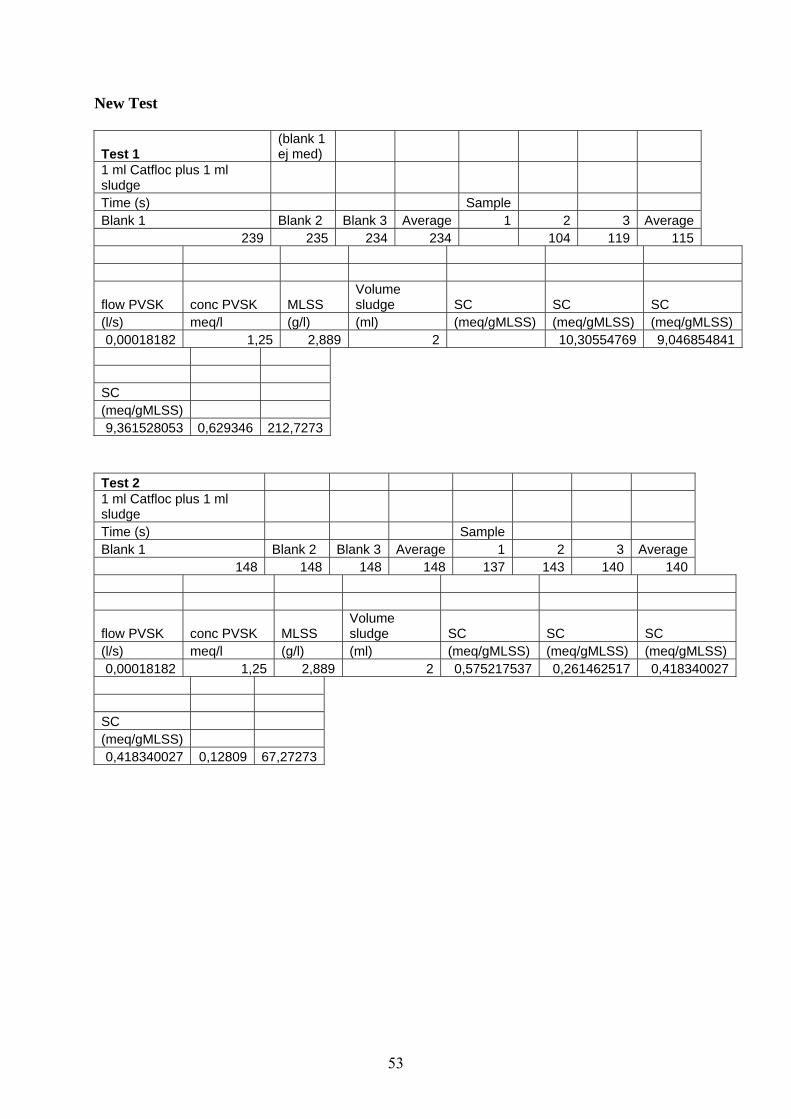
53
New Test
Test 1 (blank 1 ej med)
1 ml Catfloc plus 1 ml sludge Time (s) Sample Blank 1 Blank 2 Blank 3 Average 1 2 3 Average
239 235 234 234 104 119 115
flow PVSK conc PVSK MLSS Volume sludge SC SC SC
(l/s) meq/l (g/l) (ml) (meq/gMLSS) (meq/gMLSS) (meq/gMLSS) 0,00018182 1,25 2,889 2 10,30554769 9,046854841
SC (meq/gMLSS) 9,361528053 0,629346 212,7273
Test 2 1 ml Catfloc plus 1 ml sludge Time (s) Sample Blank 1 Blank 2 Blank 3 Average 1 2 3 Average
148 148 148 148 137 143 140 140
flow PVSK conc PVSK MLSS Volume sludge SC SC SC
(l/s) meq/l (g/l) (ml) (meq/gMLSS) (meq/gMLSS) (meq/gMLSS) 0,00018182 1,25 2,889 2 0,575217537 0,261462517 0,418340027
SC (meq/gMLSS) 0,418340027 0,12809 67,27273
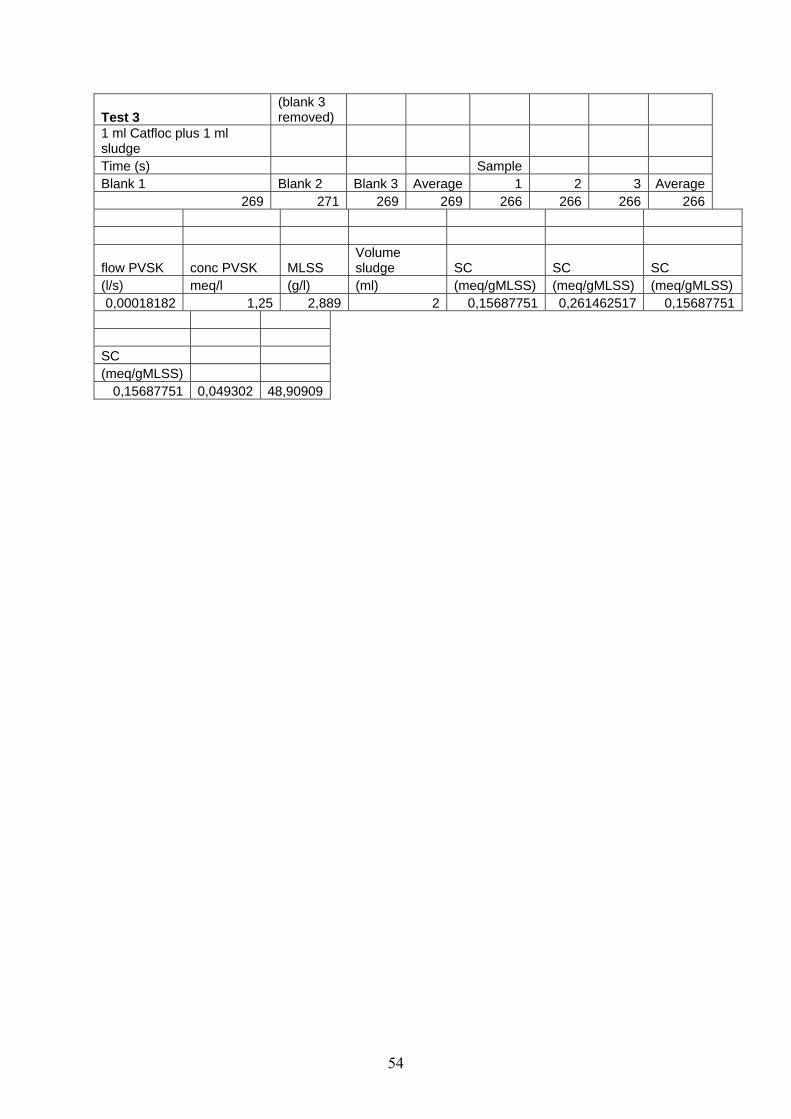
54
Test 3 (blank 3 removed)
1 ml Catfloc plus 1 ml sludge Time (s) Sample Blank 1 Blank 2 Blank 3 Average 1 2 3 Average
269 271 269 269 266 266 266 266
flow PVSK conc PVSK MLSS Volume sludge SC SC SC
(l/s) meq/l (g/l) (ml) (meq/gMLSS) (meq/gMLSS) (meq/gMLSS) 0,00018182 1,25 2,889 2 0,15687751 0,261462517 0,15687751
SC (meq/gMLSS)
0,15687751 0,049302 48,90909

55
Flow Data Values Flow values in both the large and small tubes on 2004-10-14
Large tube (10 ml) Small tube (5 ml) Flow
(l/s) ml/min
S.No Time(s) S.No Time(s) large small large small 1 56 1 22 2 57 2 23 3 56 3 21
Avg 56,33333
Avg 22 0,000178
0,000227
10,65089
13,63636
Flow values in both the large and small tubes on 2004-10-20
Large tube (10 ml) Small tube (5 ml) S.No Time(s) S.No Time(s)
1 55 1 24 2 56 2 22 3 55 3 23
avg 55,33333
avg 23 0,000181
0,000217
10,84337
13,04348
Flow values in both the large and small tubes on 2004-10-21
Large tube (10 ml) Small tube (5 ml) S.No Time(s) S.No Time(s)
1 54 1 24 2 56 2 23 3 55 3 24
Avg 55 Avg 23,66666667 0,000182
0,000211
10,90909
12,67606
0,00018

56
Summary of the results test 1 CF sludge MLSS sludge mass SC std PVSK/CF (meq/l) (ml) (g/l) (g) (meq/gMLSS) (meq/g)
1 1 4,32 0,00432 6,21507232 0,462278 210,3550296 2 1 4,32 0,00432 0,48796022 0,116752 66,12426036 5 1 4,32 0,00432 0,12841059 0,038523 47,75147929
0
2
4
6
8
10
12
0 1 2 3 4 5 6
CF (ml)
SC (m
eq/g
)
1 ml sludge-test 12 ml sludge-test 11 ml sludge-test 2
y = 92,535x-0,4705
R2 = 1
y = 174,97x-0,8838
R2 = 0,8513
0
50
100
150
200
250
0 2 4 6
CF (ml)
PVSK
/CF
(meq
/g)
1 ml water2 ml water1 ml waterPower (2 ml water)Power (1 ml water)
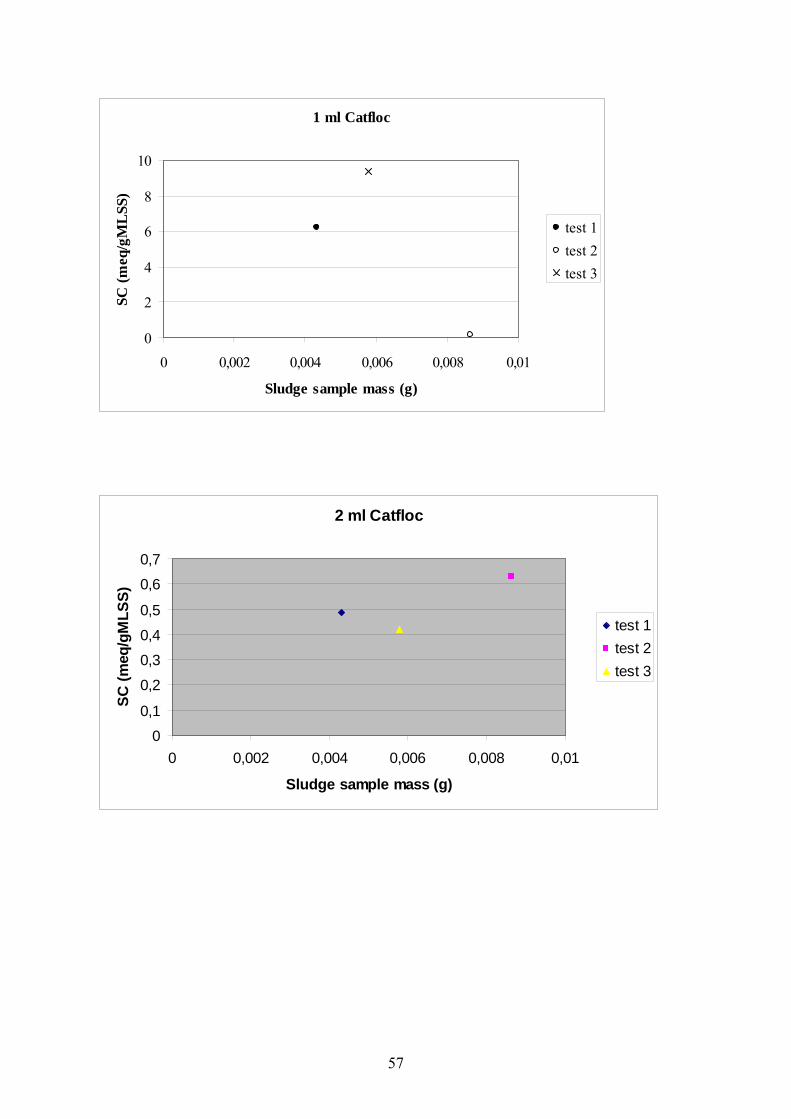
57
1 ml Catfloc
0
2
4
6
8
10
0 0,002 0,004 0,006 0,008 0,01
Sludge sample mass (g)
SC (m
eq/g
ML
SS)
test 1test 2test 3
2 ml Catfloc
0
0,1
0,2
0,3
0,4
0,5
0,6
0,7
0 0,002 0,004 0,006 0,008 0,01
Sludge sample mass (g)
SC (m
eq/g
MLS
S)
test 1test 2test 3
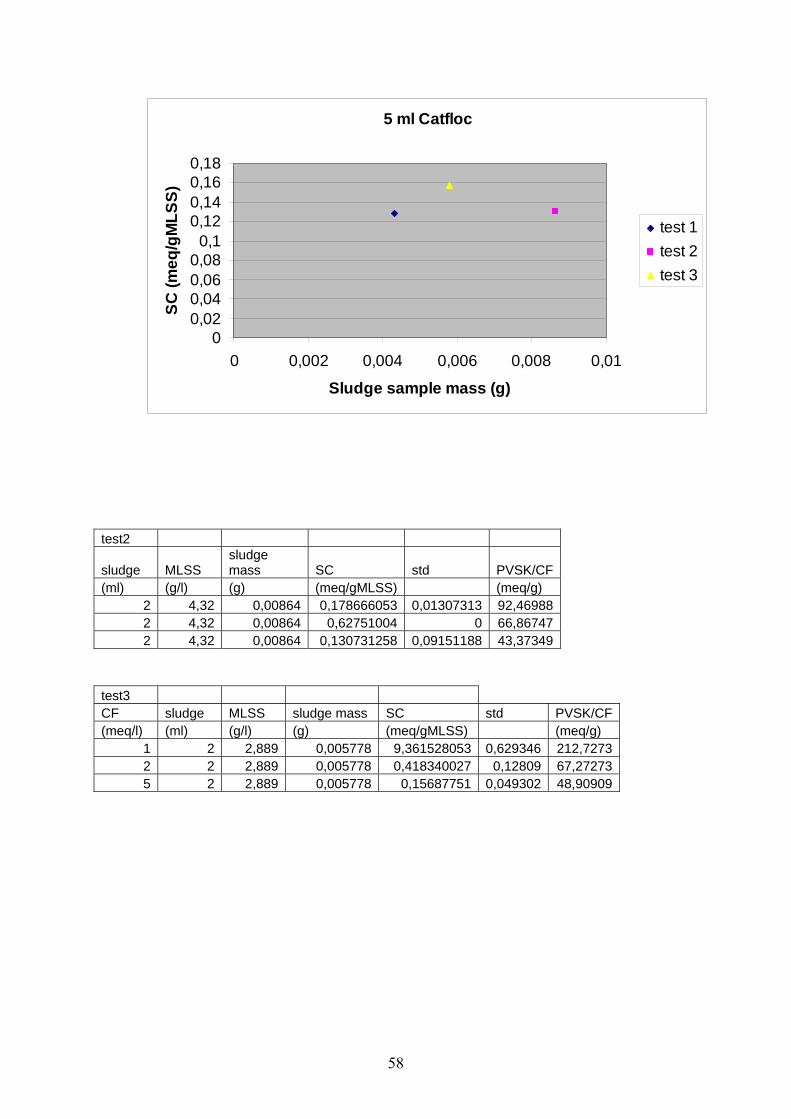
58
5 ml Catfloc
00,020,040,060,08
0,10,120,140,160,18
0 0,002 0,004 0,006 0,008 0,01
Sludge sample mass (g)
SC (m
eq/g
MLS
S)
test 1test 2test 3
test2
sludge MLSS sludge mass SC std PVSK/CF
(ml) (g/l) (g) (meq/gMLSS) (meq/g) 2 4,32 0,00864 0,178666053 0,01307313 92,469882 4,32 0,00864 0,62751004 0 66,867472 4,32 0,00864 0,130731258 0,09151188 43,37349
test3 CF sludge MLSS sludge mass SC std PVSK/CF (meq/l) (ml) (g/l) (g) (meq/gMLSS) (meq/g)
1 2 2,889 0,005778 9,361528053 0,629346 212,7273 2 2 2,889 0,005778 0,418340027 0,12809 67,27273 5 2 2,889 0,005778 0,15687751 0,049302 48,90909
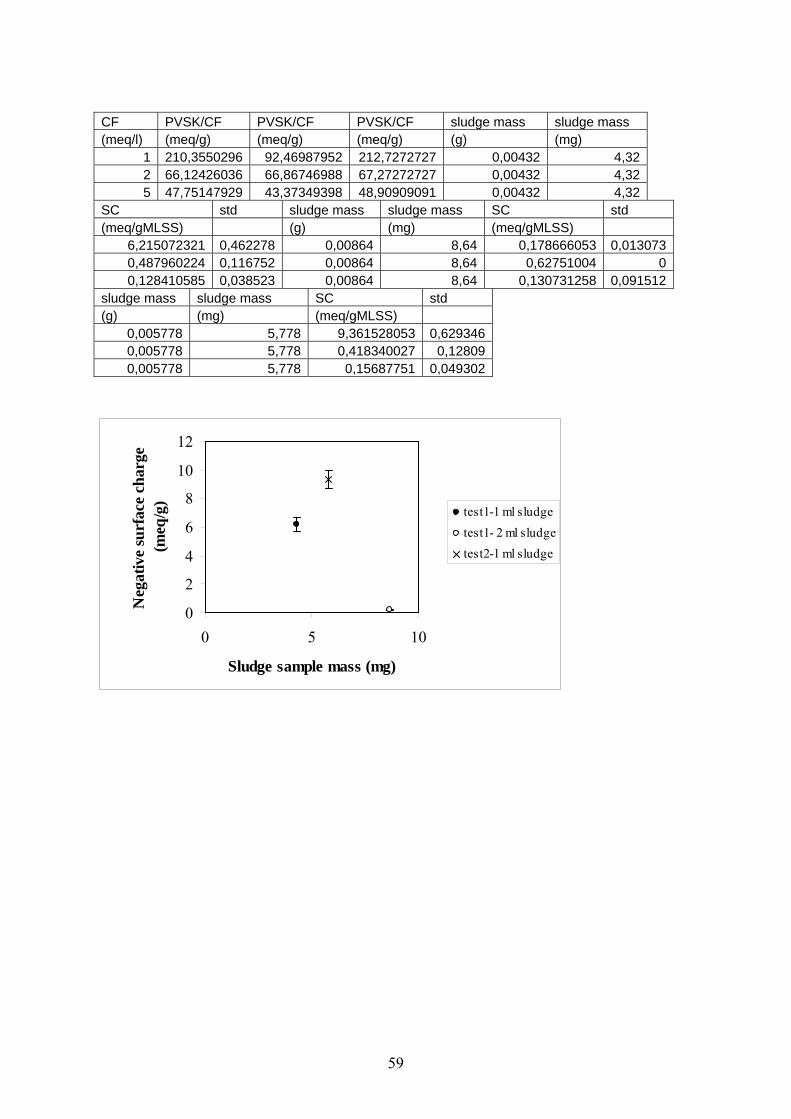
59
CF PVSK/CF PVSK/CF PVSK/CF sludge mass sludge mass (meq/l) (meq/g) (meq/g) (meq/g) (g) (mg)
1 210,3550296 92,46987952 212,7272727 0,00432 4,32 2 66,12426036 66,86746988 67,27272727 0,00432 4,32 5 47,75147929 43,37349398 48,90909091 0,00432 4,32
SC std sludge mass sludge mass SC std (meq/gMLSS) (g) (mg) (meq/gMLSS)
6,215072321 0,462278 0,00864 8,64 0,178666053 0,0130730,487960224 0,116752 0,00864 8,64 0,62751004 00,128410585 0,038523 0,00864 8,64 0,130731258 0,091512
sludge mass sludge mass SC std (g) (mg) (meq/gMLSS)
0,005778 5,778 9,361528053 0,6293460,005778 5,778 0,418340027 0,128090,005778 5,778 0,15687751 0,049302
0
2
4
6
8
10
12
0 5 10
Sludge sample mass (mg)
Neg
ativ
e su
rfac
e ch
arge
(m
eq/g
)
test1-1 ml sludgetest1- 2 ml sludgetest2-1 ml sludge
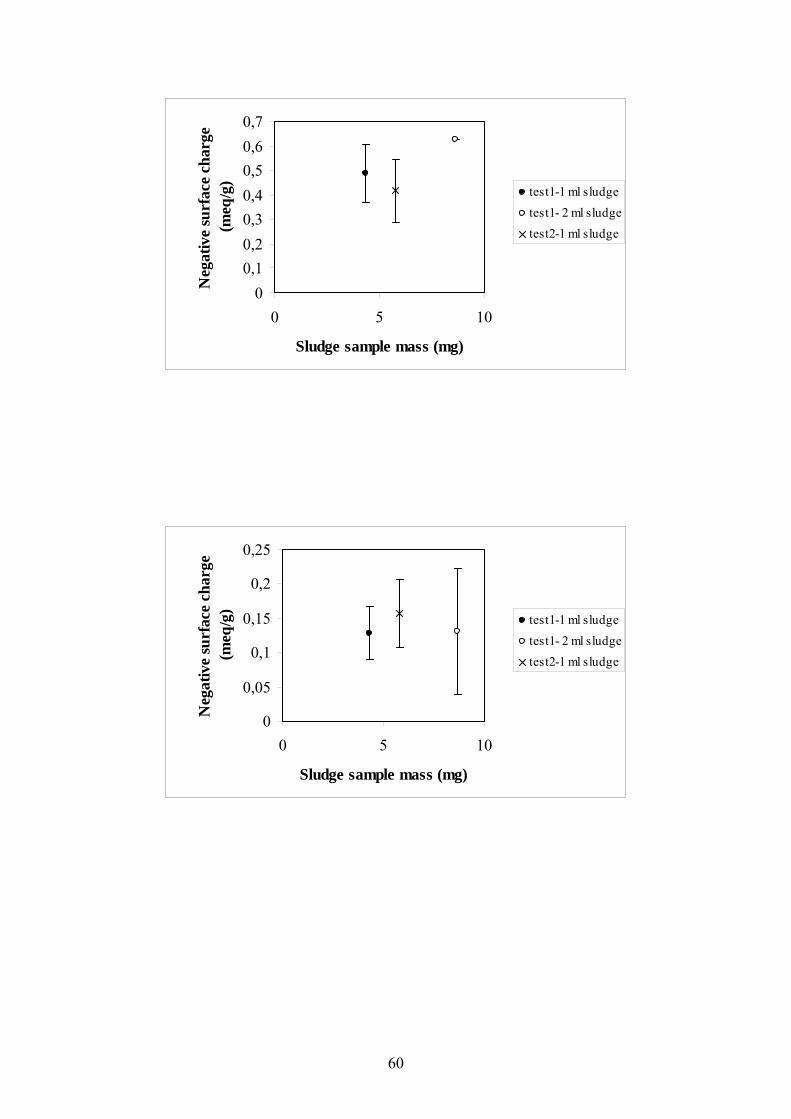
60
00,10,20,30,40,50,60,7
0 5 10
Sludge sample mass (mg)
Neg
ativ
e su
rfac
e ch
arge
(m
eq/g
)
test1-1 ml sludgetest1- 2 ml sludgetest2-1 ml sludge
0
0,05
0,1
0,15
0,2
0,25
0 5 10
Sludge sample mass (mg)
Neg
ativ
e su
rfac
e ch
arge
(m
eq/g
)
test1-1 ml sludgetest1- 2 ml sludgetest2-1 ml sludge