
Evaluating Cathode Catalysts in the Polymer Electrolyte ...12197/FULLTEXT01.pdf · Evaluating...
62
Evaluating Cathode Catalysts in the Polymer Electrolyte Fuel Cell Henrik Ekström Doctoral Thesis Applied Electrochemistry, School of Chemical Science and Engineering, Kungliga Tekniska Högskolan, Stockholm, 2007 Akademisk avhandling som med tillstånd av Kungliga Tekniska Högskolan i Stockholm, framlägges till offentlig granskning för avläggande av teknologie doktorsexamen måndagen den 11:e juni 2007, kl. 13.00 i sal D2, Lindstedtsvägen 5, Entréplan
Transcript of Evaluating Cathode Catalysts in the Polymer Electrolyte ...12197/FULLTEXT01.pdf · Evaluating...
Evaluating Cathode Catalysts in thePolymer Electrolyte Fuel Cell
Henrik Ekström
Doctoral Thesis
Applied Electrochemistry, School of Chemical Science and Engineering,Kungliga Tekniska Högskolan, Stockholm, 2007
Akademisk avhandling som med tillstånd av Kungliga TekniskaHögskolan i Stockholm, framlägges till offentlig granskning för avläggande
av teknologie doktorsexamen måndagen den 11:e juni 2007, kl. 13.00 i salD2, Lindstedtsvägen 5, Entréplan

ii
All rights reserved© Henrik Ekström 2007
Printed in SwedenUniversitetsservice US-AB, Stockholm, 2007
TRITA-CHE-Report 2007:39ISSN 1654-1081ISBN 978-91-7178-714-9
Abstract
The polymer electrolyte membrane fuel cell (PEMFC) converts the chemical energyof hydrogen and oxygen (air) into usable electrical energy. At the cathode (the posi-tive electrode), a considerable amount of platinum is generally required to catalysethe sluggish oxygen reduction reaction (ORR). This has implications regarding thecost in high-power applications, and for making a broad commercialisation of thePEMFC technology possible, it would be desirable to lower the amount of Pt usedto catalyse the ORR.
In this thesis a number of techniques are described that have been developed inorder to investigate catalytic activity at the cathode of the PEMFC. These method-ologies resemble traditional three-electrode research in liquid electrolytes, includ-ing cyclic voltammetry in inert gas, but with the advantage of performing the ex-periments in the true PEMFC environment.
From the porous electrode studies it was seen that it is possible to reach massactivities close to 0.2 gPt/kW at potentials above 0.65 V at 60 ◦C, but that the massactivities may become considerably lower when raising the temperature to 80 ◦Cand changing the measurement methodology regarding potential cycling limits andelectrode manufacturing.
The model electrode studies rendered some interesting results regarding theORR at the Pt/Nafion interface. Using a novel measurement setup for measuring oncatalysed planar glassy carbon disks, it was seen that humidity has a considerableeffect on the ORR kinetics of Pt. The Tafel slopes become steeper and the activitydecreases when the humidity level of the inlet gases decreases. Since no change inthe the electrochemical area of the Pt/Nafion interface could be seen, these kineticphenomena were ascribed to a lowered Pt oxide coverage at the lower humiditylevel, in combination with a lower proton activity.
Using bi-layered nm-thick model electrodes deposited directly on Nafion mem-branes, the behaviour of TiO2 and other metal oxides in combination with Pt inthe PEMFC environment was investigated. Kinetically, no intrinsic effect could beseen for the model electrodes when adding a metal oxide, but compared to porouselectrodes, the surface (specific) activity of a 3 nm film of Pt deposited on Nafionseems to be higher than for a porous electrode using ∼4 nm Pt grains deposited ona carbon support. Comparing the cyclic voltammograms in N2, this higher activitycould be ascribed to less Pt oxide formation, possibly due to a particle size effect.
For these bi-layered films it was also seen that TiO2 may operate as a proton-conducting electrolyte in the PEMFC.
Keywords: fuel cell, humidity, model electrodes, Nafion, oxygen reduction, PEMFC,platinum, polymer electrolyte, thin film evaporation, titanium oxide
iii
Sammanfattning
I polymerelektrolytbränslecellen (PEMFC) omvandlas den kemiska energin hos vät-gas och syrgas (luft) direkt till användbar elektrisk energi. På katoden (den positivaelektroden) krävs betydande mängder platina för att katalysera den tröga syrere-duktionsreaktionen (ORR). Detta inverkar på kostnaden för högeffektsapplikatio-ner, och för att göra en bred kommersialisering av PEMFC-teknologin möjlig skulledet vara önskvärt att minska den Pt-mängd som används för att katalysera ORR.
I denna avhandling beskrivs ett antal tekniker som utvecklats för att under-söka katalytisk aktivitet på katoden i PEMFC. Metodiken liknar traditionella tre-elektrodexperiment i vätskeformig elektrolyt, med cyklisk voltammetri i inert gas,men med fördelen att försöken utförs i den riktiga PEMFC-miljön.
I försök med porösa elektroder visades att det är möjligt att nå massaktiviteternära 0.2 gPt/kW för potentialer över 0.65 V vid 60 ◦C, men massaktiviteterna kanbli betydligt lägre om temperaturen höjs till 80 ◦C, och om potentialsvepgränseroch elektrodentillverkningsmetod ändras.
Försök med modellelektroder resulterade i intressanta resultat rörande ORR igränsskiktet Pt/Nafion. Genom att använda en ny metodik för att mäta på ka-talyserade plana elektroder av vitröst kol (glassy carbon), var det möjligt att seatt gasernas fuktighet har en betydande inverkan på ORR-kinetiken hos Pt. Tafel-lutningarna blir brantare och aktiviteten minskar när inloppsgasernas fuktighets-grad minskar. Eftersom den elektrokemiska arean hos Pt/Nafion-gränsskiktet in-te ändrades, ansågs dessa kinetiska effekter bero på en lägre täckningsgrad av Pt-oxider vid lägre fuktigheter, i kombination med lägre protonaktivitet.
Genom att använda Nafionmembran belagda med nm-tjocka tvåskiktsmodell-elektroder undersöktes hur Pt i kombination med TiO2 och andra metalloxider ver-kar i PEMFC-miljön. Kinetiskt sett hade tillsatsen av metalloxider ingen inre påver-kan på aktiviteten, men vid jämförelse med porösa elektroder tycks den specifikaytaktiviteten vara högre hos en 3 nm film av Pt på Nafion än för en porös elektrodbaserad på ∼4 nm Pt-korn belagda på ett kolbärarmaterial. Jämför man de cyklis-ka voltammogrammen i N2, kan den högre aktiviteten tillskrivas en lägre grad avPt-oxidbildning, vilket i sin tur kan bero på en storlekseffekt hos Pt-partiklarna.
Försöken med dessa tvåskiktselektroder visade också att TiO2 kan verka somprotonledande elektrolyt i PEMFC.
Nyckelord: bränslecell, fuktighet, modellelektroder, Nafion, PEMFC, platina, poly-merelektrolyt, syrereduktion, tunnfilmsförångning, titanoxid
iv
List of Papers
This thesis is based on the following papers:
Paper 1 Alternative catalysts and carbon support material for PEMFC K. Wik-ander, H. Ekström, A.E.C. Palmqvist, A. Lundblad, K. Holmberg andG. Lindbergh Fuel Cells 06 (2006) 21–25
Paper 2 On the influence of Pt particle size on PEMFC cathode performance K.Wikander, H. Ekström, A.E.C. Palmqvist and G. Lindbergh Electro-chimica Acta (2007) doi:10.1016/j.electacta.2007.04.106
Paper 3 On the activity and stability of Sr3NiPtO6 and Sr3CuPtO6 as electro-catalysts for the oxygen reduction reaction in a polymer electrolyte fuel cellP. Kjellin, H. Ekström, G. Lindbergh and A.E.C. Palmqvist Journal ofPower Sources 168 (2007) 346-350
Paper 4 A Novel Approach for Measuring Catalytic Activity of Planar Model Cat-alysts in the Polymer Electrolyte Fuel Cell Environment H. Ekström, P. Ha-narp, M. Gustavsson, E. Fridell, A. Lundblad and G. Lindbergh Jour-nal of The Electrochemical Society 153 (2006) A724–A730
Paper 5 Thin film Pt/TiO2 catalysts for the polymer electrolyte fuel cell M. Gus-tavsson, H. Ekström, P. Hanarp, L. Eurenius, G. Lindbergh, E. Olssonand B. Kasemo Journal of Power Sources 163 (2007) 671–678
Paper 6 Nanometer-thick films of titanium oxide acting as electrolyte in the poly-mer electrolyte fuel cell H. Ekström, B. Wickman, M. Gustavsson, P. Ha-narp, L. Eurenius, E. Olsson and G. Lindbergh Electrochimica Acta 52(2007) 4239–4245
In general, all manufacturing and non-electrochemical characterisation ofthe catalyst materials were performed by co-writers of these papers, ratherthan by the author of this thesis. Therefore the thesis has its focus on theplanning, performing and evaluation of the electrochemical measurementsof the above papers. The modelling work in Paper 4 was also done by theauthor.
v

vi LIST OF PAPERS
The following publications, containing contributions from the author, are notincluded in this thesis, but were also published/compiled during the thesiswork:
Reduced two-dimensional one-phase model for analysis of the anode of a DMFC E.Birgersson, J. Nordlund, H. Ekström, M. Vynnycky and G. Lindbergh Jour-nal of The Electrochemical Society 150 (2003) A1368–A1376
Evaluation of a sulfophenylated polysulfone membrane in a fuel cell at 60 to 110 ◦CH. Ekström, B. Lafitte, A. Lundblad, P. Jannasch and G. Lindbergh SolidState Ionics (2007) doi:10.1016/j.ssi.2007.04.002

Acknowledgements
First I would like to thank Professor Göran Lindbergh and Dr. Anders Lund-blad for supervising me, and the Swedish Foundation for EnvironmentalResearch (MISTRA) as well as Autobrane (a part of the 6th Framework Pro-gramme of the European Union) for financial support.
Further it can not be stressed enough that none of this work would havebeen possible without the contribution of my colleagues at Chalmers — PerHanarp, Kjell Wikander, Marie Gustavsson, Björn Wickman and Per Kjellin,who patiently have been providing me with catalytic materials to investigatethroughout this work. Thank you.
Other major scientific contributions that need to acknowledged are thework of the Mistra Phase 1 people: Peter Gode, Frédéric Jaouen, and JariIhonen, and the hints, tricks and tips from Dan Petterson that saved me avast amount of time. At this point I also thank my diploma worker GokulRamamurthy, who participated in the the early development of the pipettemethod.
In continuation I would like to thank all my other colleagues at AppliedElectrochemistry during the years for providing a nice social atmosphereand a good working environment. For contributing to the advent of thethesis some of you deserve some extra recognition: Mårten, for sharing officewith me and giving theoretical support in times of doubt, Sophie, for sharingbench and distress in the lab, Linda, for cheering me up, and Andreas forcoaching.
Finally, I would also express my gratitude for the emotional support fromfriends and family throughout the years. Thank you all.
vii

viii ACKNOWLEDGEMENTS
Contents
Abstract iii
List of Papers v
Acknowledgements vii
1 Introduction 1
2 Theoretical Background 32.1 The polymer electrolyte fuel cell . . . . . . . . . . . . . . . . . 32.2 Platinum in acid media . . . . . . . . . . . . . . . . . . . . . . . 5
2.2.1 Fundamentals . . . . . . . . . . . . . . . . . . . . . . . . 52.2.2 Platinum electrochemistry . . . . . . . . . . . . . . . . . 72.2.3 Stability and corrosion of platinum . . . . . . . . . . . . 8
2.3 Carbon as support material in the PEMFC . . . . . . . . . . . . 82.3.1 Fundamentals . . . . . . . . . . . . . . . . . . . . . . . . 82.3.2 Carbon electrochemistry . . . . . . . . . . . . . . . . . . 92.3.3 Stability and corrosion of carbon supports . . . . . . . 10
2.4 The electrochemical ORR in the PEMFC . . . . . . . . . . . . . 102.4.1 The ORR on platinum in acid . . . . . . . . . . . . . . . 112.4.2 Alternative catalysts for the ORR . . . . . . . . . . . . . 15
2.5 Experimental considerations . . . . . . . . . . . . . . . . . . . . 162.5.1 Choice of potentials . . . . . . . . . . . . . . . . . . . . 162.5.2 Reference electrodes . . . . . . . . . . . . . . . . . . . . 17
3 Experimental 193.1 Porous electrode studies . . . . . . . . . . . . . . . . . . . . . . 19
3.1.1 The spraying method . . . . . . . . . . . . . . . . . . . 203.1.2 The pipette method . . . . . . . . . . . . . . . . . . . . . 21
3.2 Model electrode studies . . . . . . . . . . . . . . . . . . . . . . 223.2.1 Why model electrodes? . . . . . . . . . . . . . . . . . . 223.2.2 Planar model electrodes on glassy carbon disks . . . . 233.2.3 Thin films on Nafion membranes . . . . . . . . . . . . . 26
3.3 Lowering hydrogen permeation . . . . . . . . . . . . . . . . . . 273.3.1 Using diluted hydrogen . . . . . . . . . . . . . . . . . . 273.3.2 Double membrane H2/O2 filter . . . . . . . . . . . . . . 28
ix

x CONTENTS
4 Results and Discussion 314.1 Catalyst evaluation in porous electrodes . . . . . . . . . . . . . 31
4.1.1 Various Pt/Vulcan catalysts and a novel support . . . . 314.1.2 Pt/C catalysts by the Phase Transfer Method . . . . . . 324.1.3 Pt oxides on Vulcan . . . . . . . . . . . . . . . . . . . . . 33
4.2 Model catalysts on glassy carbon . . . . . . . . . . . . . . . . . 334.3 Thin film model catalysts — ion conducting TiO2 . . . . . . . . 344.4 Mass and specific activities of platinum . . . . . . . . . . . . . 37
4.4.1 Porous vs model electrodes . . . . . . . . . . . . . . . . 374.4.2 Pt-usage demands in the PEMFC . . . . . . . . . . . . . 40
5 Conclusions 43
List of Symbols and Constants 45
Bibliography 47

List of Figures
2.1 Operating principle of the PEMFC . . . . . . . . . . . . . . . . 42.2 Catalyst-support particle . . . . . . . . . . . . . . . . . . . . . . 62.3 Cyclic voltammogram in N2 of Pt . . . . . . . . . . . . . . . . . 72.4 Cyclic voltammogram in N2 of Carbon . . . . . . . . . . . . . . 9
3.1 Experimental fuel cell used for the experiments . . . . . . . . . 203.2 Thermal evaporation . . . . . . . . . . . . . . . . . . . . . . . . 243.3 Colloidal lithography . . . . . . . . . . . . . . . . . . . . . . . . 253.4 Experimental setup for the planar model electrode studies . . 263.5 Measurement setup for thin films on Nafion membranes . . . 263.6 The double membrane H2/O2 filter . . . . . . . . . . . . . . . . 29
4.1 Polarisation curves for ORR of Pt, Ir, Au and TiOx . . . . . . . 354.2 CVs in N2 and ORR curves of bi-layered films . . . . . . . . . 364.3 ORR activity comparison between porous and model electrodes 384.4 CV comparison between a porous and a model electrode . . . 39
xi

xii LIST OF FIGURES
Chapter 1
Introduction
Fuel cells are excellent devices for converting chemical energy into usefulelectricity. In principle, no moving parts are needed and the theoretical con-version efficiency is far higher than any practical combustion process basedon the Carnot cycle.
There are several fuel cell technologies available, the choice of electrolytebeing the governing design factor. High temperature fuel cells, e.g. moltencarbonate and solid oxide fuel cells, which operate at temperatures between600 ◦C and 1000 ◦C are generally considered for stationary power genera-tion, for instance replacing gas turbines for producing electricity from nat-ural gas. The high operating temperature, however, results in long start-uptimes and therefore lower temperatures are desired for mobile (laptops andmobile phones) and traction (cars and trucks) applications.
The most viable low temperature fuel cell technology today is perhapsthe polymer electrolyte membrane fuel cell (PEMFC). The technology is al-ready partly on its road to commercialisation, with a vast spectrum of op-erating systems and demonstration projects going on globally: submarines,space shuttles, backup power for mobile phone stations, cars and city buses,as well as smaller portable systems providing power for laptops and mobilephones, just to mention a few. These show that the polymer fuel cell may besuccessfully implemented for electric power generation in various applica-tions. In fact, for space shuttles, submarines and backup power for mobilephone stations, the PEMFC technology is already a commercial product, al-beit the systems produced are in small series. However, for most other appli-cations there are still a few obstacles yet to be overcome before a broad com-mercialisation will be possible. This is mainly due to the fact that the cost ofa fuel cell system, compared to other alternatives such as batteries or smalldiesel-electric generators, is too high today by around roughly one order ofmagnitude. The system cost will indeed be lowered by mass production, butfor at least two of the components, the polymer electrolyte membrane andthe catalyst used for oxygen reduction, also scientific breakthroughs mayhave to be necessary.
The relatively low temperatures of the PEMFC today, generally below100 ◦C, result in expensive catalysts having to be used in order to increasethe rate of the chemical reactions, especially the oxygen reduction reaction
1
2 CHAPTER 1. INTRODUCTION
(ORR) on the cathode, where large amounts of platinum need to be used.Much effort has been put into decreasing the platinum amount in the elec-trode, but current projections still indicate up to around 10.000 SEK (€1000)of platinum cost in the fuel cell system of an ordinary car. Even with otherelectrolyte materials, that allow operation up to 200 ◦C, platinum or alloyscontaining platinum, is still the only really viable oxygen reduction cata-lyst known today in acid media. Considerable research has been made onoxygen reduction on various materials, but there are still vast areas to be ex-plored, both in terms of finding more active catalysts, as well as deepeningthe understanding of the oxygen reduction reaction within the polymer fuelcell.
This thesis concerns evaluating catalysts and catalytic activity for theORR in the PEMFC, and a toolbox of methods has been developed to mea-sure and evaluate electrocatalytic behaviour of catalysts of various mor-phologies. Both model electrodes and “real” porous electrodes have beeninvestigated, always with the aim to perform the measurements in an envi-ronment as close to real fuel cell running conditions as possible. The mainfocus is generally on the catalyst/ionomer interface, and therefore the ef-fort has been to perform the work in such a way so that any “macro” effectssuch as the porous structure of electrodes, the polymer membrane, watermanagement and thermal gradient effects etc. may be excluded.
The work was performed at Applied Electrochemistry, School of Chemi-cal Science and Engineering, KTH (the Royal Institute of Technology), Stock-holm, Sweden, during the period February 2003 to May 2007. Nearly allof the work was done in close collaboration with two groups at ChalmersUniversity of Technology, Gothenburg, Sweden: Teknisk Ytkemi (TYK) andKompetenscentrum för Katalys (KCK).
Chapter 2
Theoretical Background
2.1 The polymer electrolyte fuel cell
The polymer electrolyte membrane fuel cell (PEMFC) converts hydrogenand oxygen (or air) to electricity, heat and water. There are also variantsof PEMFCs using a hydrocarbon instead of hydrogen as fuel, for instancethe direct methanol fuel cell (DMFC), but they are not treated further in thisthesis. The overall chemical reaction of the PEMFC is
H2(g) +12
O2(g) → H2O(l) (2.1)
∆G for this reaction at standard conditions is −237 kJ/mol, rendering astandard cell voltage for the reaction of 1.23 V at 25 ◦C. ∆H for the reaction is−286 kJ/mol and this means the highest possible conversion efficiency of aPEMFC is ∆G/∆H = 83 % at standard conditions. However, for various rea-sons, among which the sluggish oxygen reduction reaction (ORR) is a majorcontributor, efficiencies above 60 % are rarely observed in an operating cell.
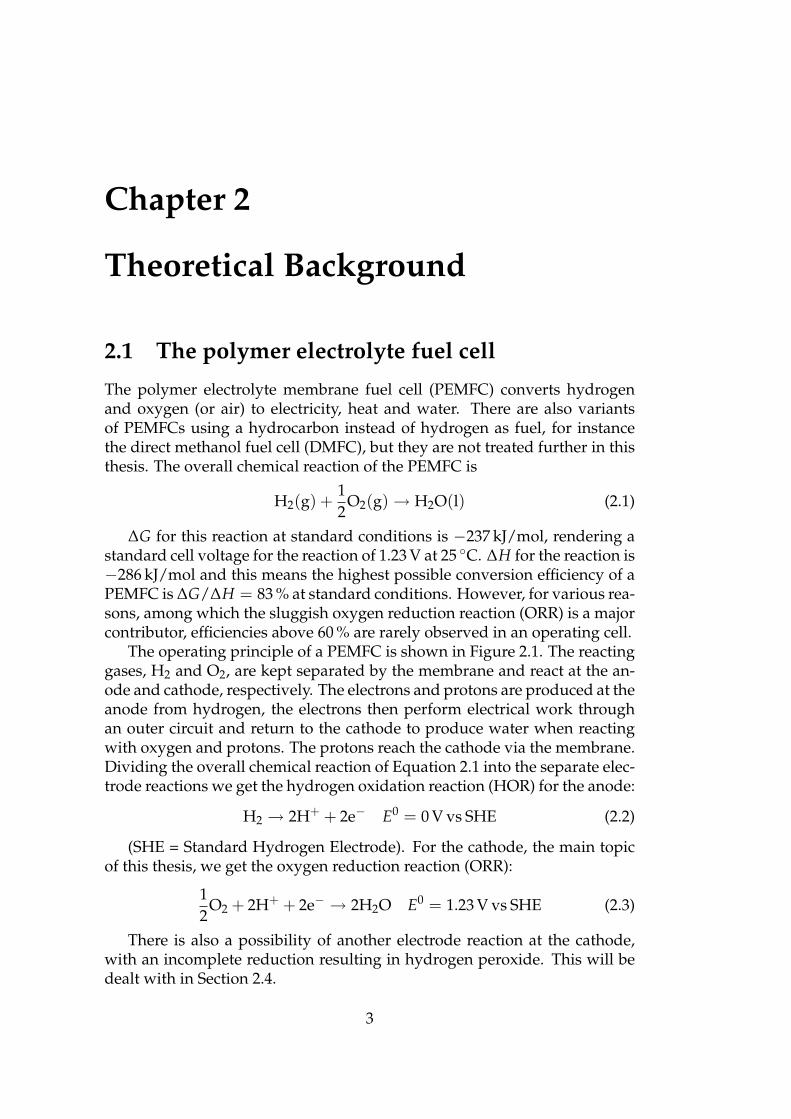
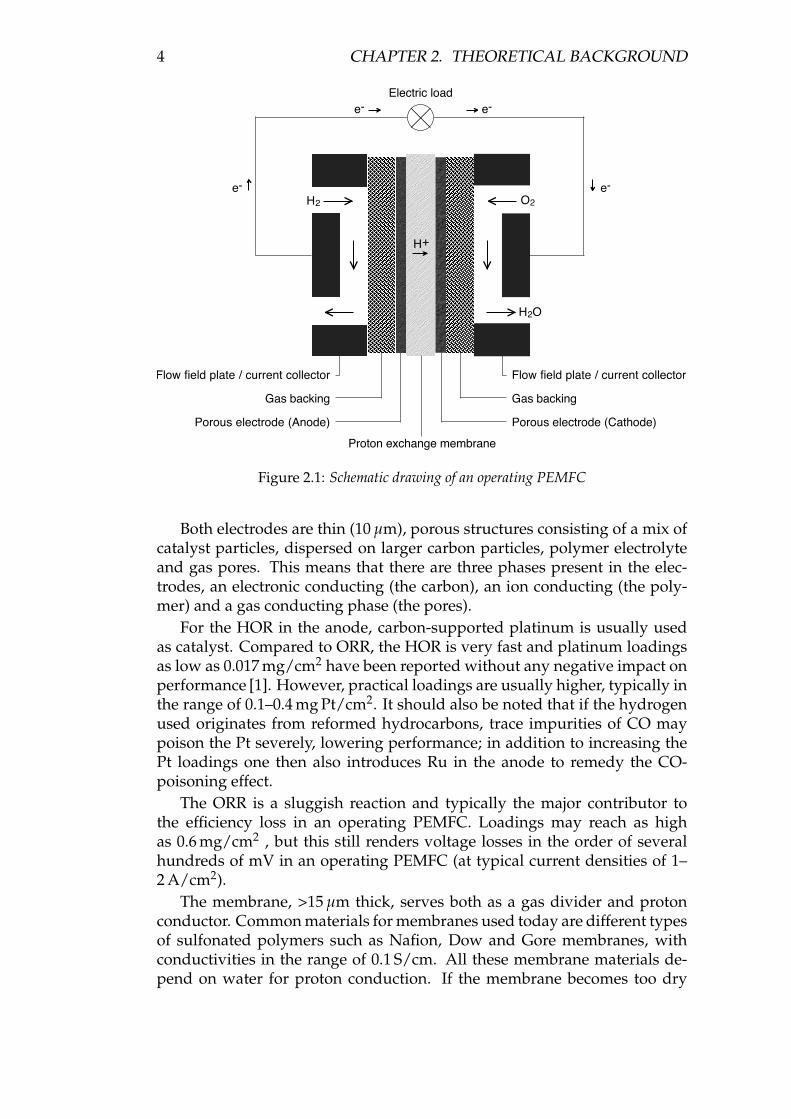
The operating principle of a PEMFC is shown in Figure 2.1. The reactinggases, H2 and O2, are kept separated by the membrane and react at the an-ode and cathode, respectively. The electrons and protons are produced at theanode from hydrogen, the electrons then perform electrical work throughan outer circuit and return to the cathode to produce water when reactingwith oxygen and protons. The protons reach the cathode via the membrane.Dividing the overall chemical reaction of Equation 2.1 into the separate elec-trode reactions we get the hydrogen oxidation reaction (HOR) for the anode:
H2 → 2H+ + 2e− E0 = 0 V vs SHE (2.2)
(SHE = Standard Hydrogen Electrode). For the cathode, the main topicof this thesis, we get the oxygen reduction reaction (ORR):
12
O2 + 2H+ + 2e− → 2H2O E0 = 1.23 V vs SHE (2.3)
There is also a possibility of another electrode reaction at the cathode,with an incomplete reduction resulting in hydrogen peroxide. This will bedealt with in Section 2.4.
3
4 CHAPTER 2. THEORETICAL BACKGROUND
H2
H2O
O2
Electric load
Flow field plate / current collector
Gas backing
Porous electrode (Anode)Proton exchange membrane
e- e-
e- e-
Flow field plate / current collector
Gas backing
Porous electrode (Cathode)
H+
Figure 2.1: Schematic drawing of an operating PEMFC
Both electrodes are thin (10 µm), porous structures consisting of a mix ofcatalyst particles, dispersed on larger carbon particles, polymer electrolyteand gas pores. This means that there are three phases present in the elec-trodes, an electronic conducting (the carbon), an ion conducting (the poly-mer) and a gas conducting phase (the pores).
For the HOR in the anode, carbon-supported platinum is usually usedas catalyst. Compared to ORR, the HOR is very fast and platinum loadingsas low as 0.017 mg/cm2 have been reported without any negative impact onperformance [1]. However, practical loadings are usually higher, typically inthe range of 0.1–0.4 mg Pt/cm2. It should also be noted that if the hydrogenused originates from reformed hydrocarbons, trace impurities of CO maypoison the Pt severely, lowering performance; in addition to increasing thePt loadings one then also introduces Ru in the anode to remedy the CO-poisoning effect.
The ORR is a sluggish reaction and typically the major contributor tothe efficiency loss in an operating PEMFC. Loadings may reach as highas 0.6 mg/cm2 , but this still renders voltage losses in the order of severalhundreds of mV in an operating PEMFC (at typical current densities of 1–2 A/cm2).
The membrane, >15 µm thick, serves both as a gas divider and protonconductor. Common materials for membranes used today are different typesof sulfonated polymers such as Nafion, Dow and Gore membranes, withconductivities in the range of 0.1 S/cm. All these membrane materials de-pend on water for proton conduction. If the membrane becomes too dry
2.2. PLATINUM IN ACID MEDIA 5
the resistance increases, resulting in low energy efficiency. This means thehumidity of the gases in the cell must be relatively high. It may howevernot be too high, since water is also produced in the cell, and insufficienttransport of water away from the electrodes and gas backings will causeflooding, and in the end result in lowered performance. Another effect ofthe humidification need is that the operating temperature is limited to theboiling point of water, at higher temperatures the membranes dry out. Thisrelatively low operating temperature, 40–80 ◦C, poses cooling problems insome applications (e.g. increases the size of the radiator in a car), for which amore suitable operating temperature would perhaps be around 150–200 ◦C,and the high demands on water management increases the overall systemcost. Also, turning on and off the fuel cell at freezing temperatures (i.e. ina car during winter time in Sweden) puts extra demands on water manage-ment. If a new ion-conducting material could be found, operating withoutthe need for humid conditions, a big step would be taken towards fuel cellcommercialisation.
The membrane together with the two attached electrodes is called themembrane-electrode-assembly (MEA). Outside the MEA, to collect the cur-rent produced, and to provide transport for the reacting species and heat,layers (>200 µm) of porous carbon material are placed. The term “gas diffu-sion layer” (GDL) is frequently used but is somewhat deceiving since liquidwater will also have to be transported here if the current densities becomehigh enough. The term gas backing will be used henceforth in this work.
Finally the MEA and gas backings are clamped between current collec-tors of an electron-conducting material, steel or graphite. At the surface ofthe current collectors there are also channels, with widths in the mm range,to provide transport of reacting species. For larger systems several fuel cellsare placed in series into a fuel cell stack, in which the current collectors aremade into mm-thin plates, with gas channels on both sides. Since one plateserves as current collector at both the anode and the cathode of two differentcells these plates are called bi-polar plates.
Even though the MEA is the most important component of a PEMFC,both the gas backings and the design of the gas channels are crucial for theoperation of the fuel cell, especially at higher current densities. It should alsobe noted that it is not the material characteristics of the different componentsthemselves, but rather the interplay between electrode structure, activity ofthe catalysts and polymer conductivity, as well as water and thermal trans-port of the gas backing and cell house, that govern the final performance ofthe system.
2.2 Platinum in acid media
2.2.1 Fundamentals
Platinum, atomic number 78, is a precious metal, roughly three times moreexpensive than gold. Not only the high price, normally fluctuating around
6 CHAPTER 2. THEORETICAL BACKGROUND
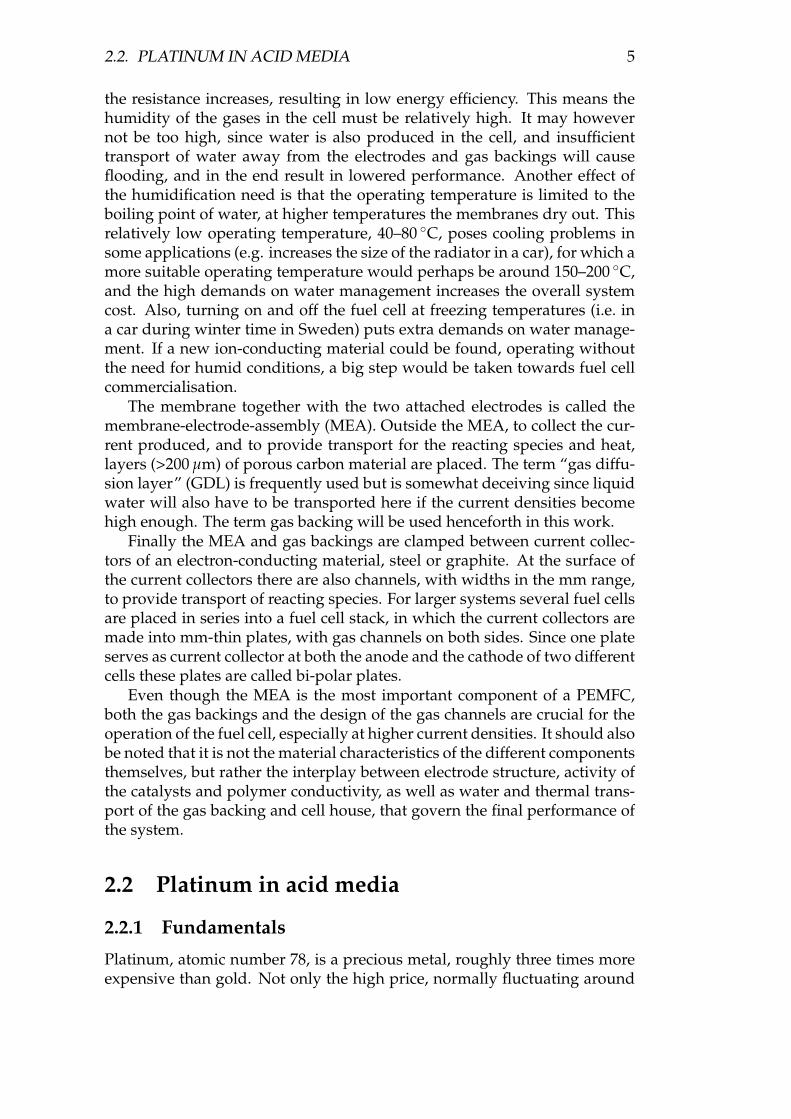
Figure 2.2: Left: TEM picture of commercial ETEK 10 % Pt dispersed on Vulcan XC72(Provided by Kjell Wikander, TYK, Chalmers). Right: Schematic picture of a catalyst-support particle.
or above 1000 USD per troy ounce (€25 per gram), is an issue, but also thesupply of the precious metal, since the total amount of platinum availableon earth may end up being a limiting factor for broad commercialisation offuel cell vehicles. An often cited figure and goal for the maximum platinumusage for fuel cell in vehicles is 0.2 g Pt/kW at 0.65 V cell voltage [2]. Still,only the platinum in a PEMFC system producing 100 kW, the power typi-cally needed for a car, would then cost €500, and for commercial MEAs oftoday the Pt usage is several times higher!
Platinum bulk metal forms a face-centred-cubic (fcc) crystal structure, re-sulting in surfaces generally based on the 110, 100 or 111 crystal planes, allwith somewhat different electrochemical behaviour. The electrocatalytic re-actions take place on the available surface of platinum, and one generallyaims for the largest surface-to-mass ratio possible. This is done by synthe-sising small particles in the single nm-range and then dispersing them ontolarger carbon support particles. In this way large surface areas are achieved.For instance, given the density of 21.3 g/cm3 for bulk platinum, 3 nm spher-ical particles have a theoretical mass specific area of 47 m2/g. To maximisethe area one would like to have as small Pt particles as possible, but stabilityconstraints and synthesis methods usually limit the size to a few nanome-ters. In addition, a smaller particle size is not always beneficial for the cat-alytic mass activity since other effects such as different lattice constants atsmaller sizes, edge effects or different governing crystal planes for smallerparticles may lower the activity when decreasing the size of the catalystparticles. A TEM (transmission electron microscopy) picture together withschematic drawing of nm-platinum grains dispersed on a carbon-supportparticle is shown in Figure 2.2.
2.2. PLATINUM IN ACID MEDIA 7
0 0.2 0.4 0.6 0.8 1 1.2
−3
−2
−1
0
1
2
3
x 10−4
Potential vs. RHE [V]
Cur
rent
den
sity
[Acm
−2 ]
H desorption Pt−oxide formation
Pt−oxidereduction H adsorption
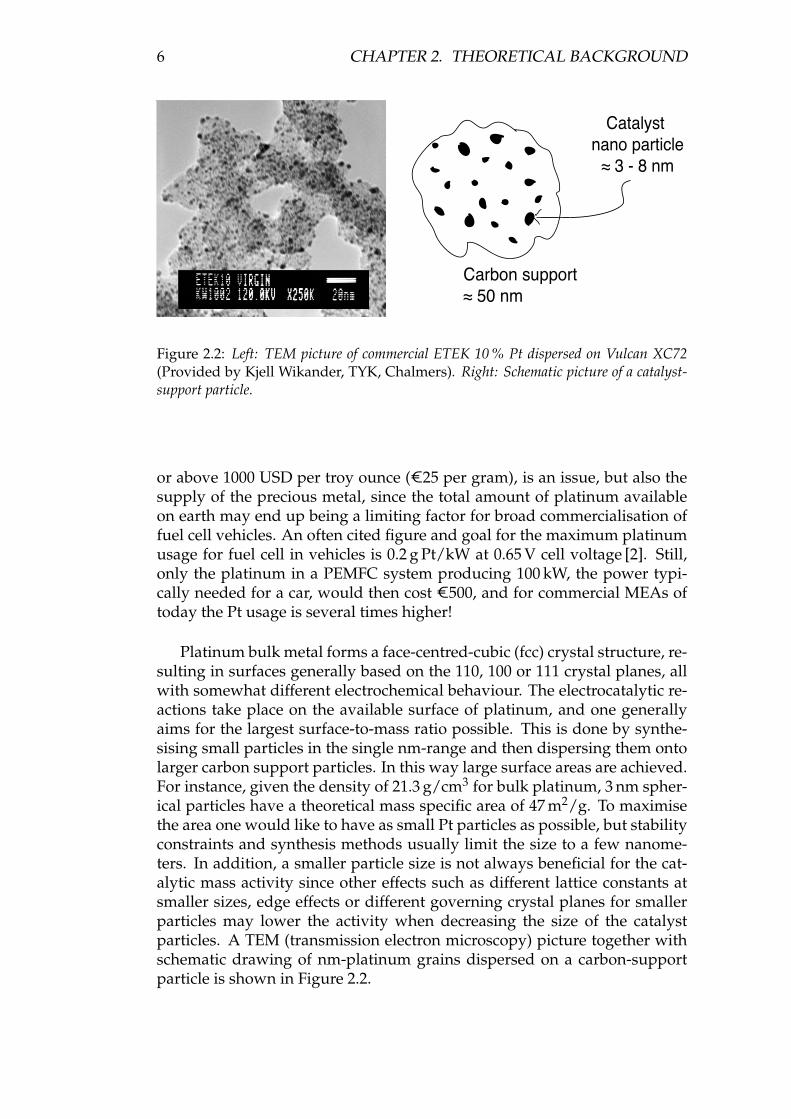
Figure 2.3: Cyclic voltammogram in nitrogen for a polycristalline Pt film in a PEFC. 100 %RH, 60 ◦C (Data from Paper 4, Figure 4)
2.2.2 Platinum electrochemistry
Even though platinum is considered a noble metal it is not at all inert inthe voltage window of an operating fuel cell. This is due to the interac-tion with water, something that is readily seen by performing cyclic voltam-metry in an inert atmosphere, for an example cf. Figure 2.3. Below 0.4 Vvs RHE (the reversible hydrogen electrode) various hydrogen adsorption-desorption peaks appear, the peak positions somewhat depending on thegoverning crystal plane. The integrated peak charges may be used to assessthe electrochemically active platinum surface, since a fully covering mono-layer is supposed to correspond a charge of 210 µC/cm2 for a poly-crystal-line Pt surface [3].
At potentials above 0.8 V platinum is oxidised. Several different types ofoxides and multi-layered oxide films may be produced depending on sweepconditions [4]. Generally one may write:
Pt + xH2O → Pt-OxHy + (2x− y)H+ + (2x− y)e− (2.4)
It has also been shown by non-electrochemical methods that the creation andremoval of these oxide films may cause structural changes of the platinumcrystal close to the surface, and that there are hysteresis effects present re-garding the structural changes when performing cyclic voltammetry [5]. Theoxidation of platinum will normally create a mixed potential at oxygen/plat-inum electrodes in the presence of water, making it troublesome to experi-mentally observe the reversible potential for oxygen reduction in practicalsystems [6].
8 CHAPTER 2. THEORETICAL BACKGROUND
2.2.3 Stability and corrosion of platinum
Sadly, platinum is not as stable as one may wish for a guaranteed goodlong-term stability of the PEMFC. Depending on operating environment andpotential it may be dissolved into the electrolyte, either through a two- orfour-electron reaction scheme [7]. In general, the dissolution of platinum isbelieved to occur through several oxidation-reduction steps involving plat-inum oxides, and the corrosion rate depends both on potential limits andsweep rates when performing potential cycling [7][8]. For the two-electronreaction pathway, being more prominent during slow cathodic scans, thefollowing two steps have been proposed [7]:
Pt + 2H2O → PtO2 + 4H+ + 4e− (2.5)
followed byPtO2 + 4H+ + 2e− → Pt2+ + 2H2O (2.6)
The solubility of 3 nm platinum particles in 0.5 M sulphuric acid at 80 ◦Chas been measured to be 0.1 µM at 0.9 V and 1.5 µM at 1.1 V, i.e. the solubil-ity increases with potential and similar, but somewhat higher, solubilities athigher temperatures have also been reported for platinum foils [9].
The dissolved Pt-ions may precipitate at other places in the electrodegiving rise to Oswald ripening, which may be an explanation of why sin-tering, in the form of Pt-particle growth resulting in lowered surface area,is frequently reported for PEMFC cathodes [10]. Two other explanations ofthe sintering phenomenom have also been put forward: (i) migrating andcoalescing Pt nanoparticles on the carbon support surface [11], and (ii) de-composition of the carbon support narrowing the distance between the Ptparticles (cf. Section 2.3.3) during PEMFC operation [12], or a combinationof all these phenomena.
For good catalyst stability typically potentials above 0.9 V during longtimes should be avoided, as well as multiple cycling between lower operat-ing potentials and this level. For practical PEMFC systems this means thatthe number of starts and stops will have an impact on the system life time,and that some kind of load-levelling (e.g. hybridisation with a battery sys-tem) may be preferable depending on the application. However, the stabilityhas been reported to be improved by alloying Pt with a transition metal suchas Cr, Ni, Co [13].
2.3 Carbon as support material in the PEMFC
2.3.1 Fundamentals
Carbon is used as a catalyst support, in both the anode and cathode, to formthe porous structure of the electrodes and to conduct electrons and heat. Acommon choice of catalyst support material is Vulcan XC-72 (Cabot, BETspecific surface 235 m2/g), but there are many other carbon supports avail-able. Important features are the specific surface, resistance to corrosion, the
2.3. CARBON AS SUPPORT MATERIAL IN THE PEMFC 9
0 0.2 0.4 0.6 0.8 1 1.2�6
�4
�2
0
2
4
6 x 10-�3
Potential vs. RHE [V]
Cur
rent
den
sity
[A/m
g Vu
lcan
]
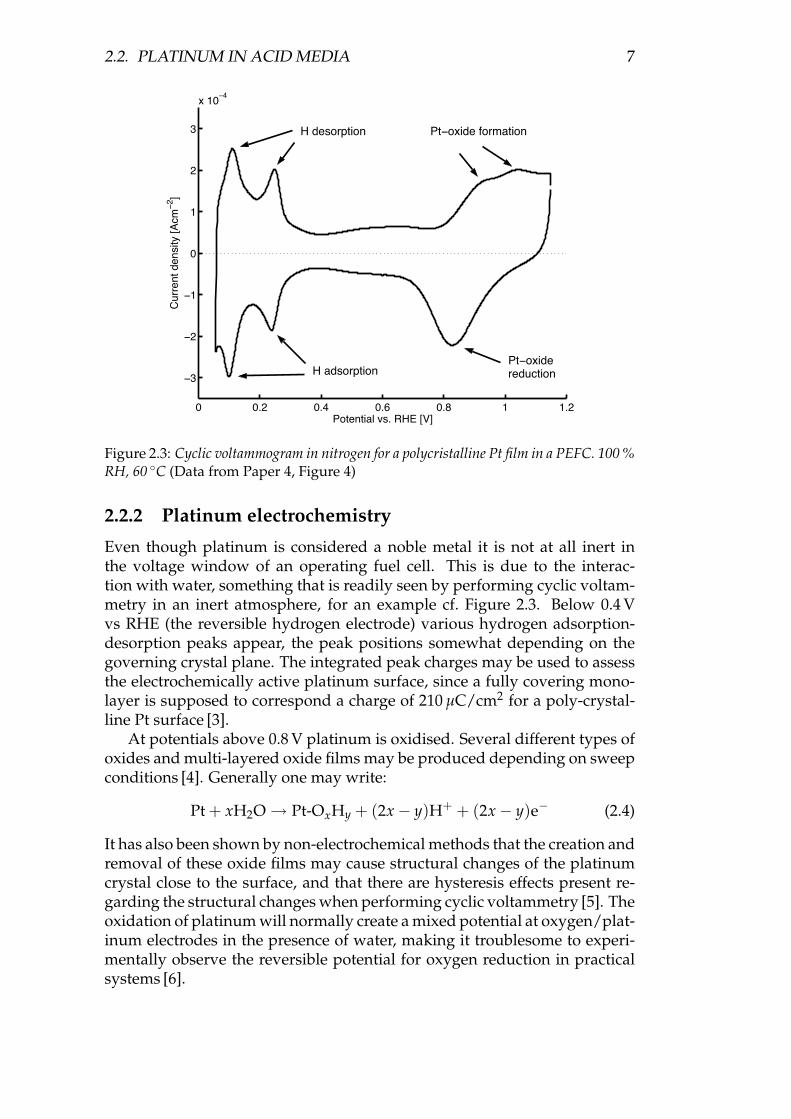
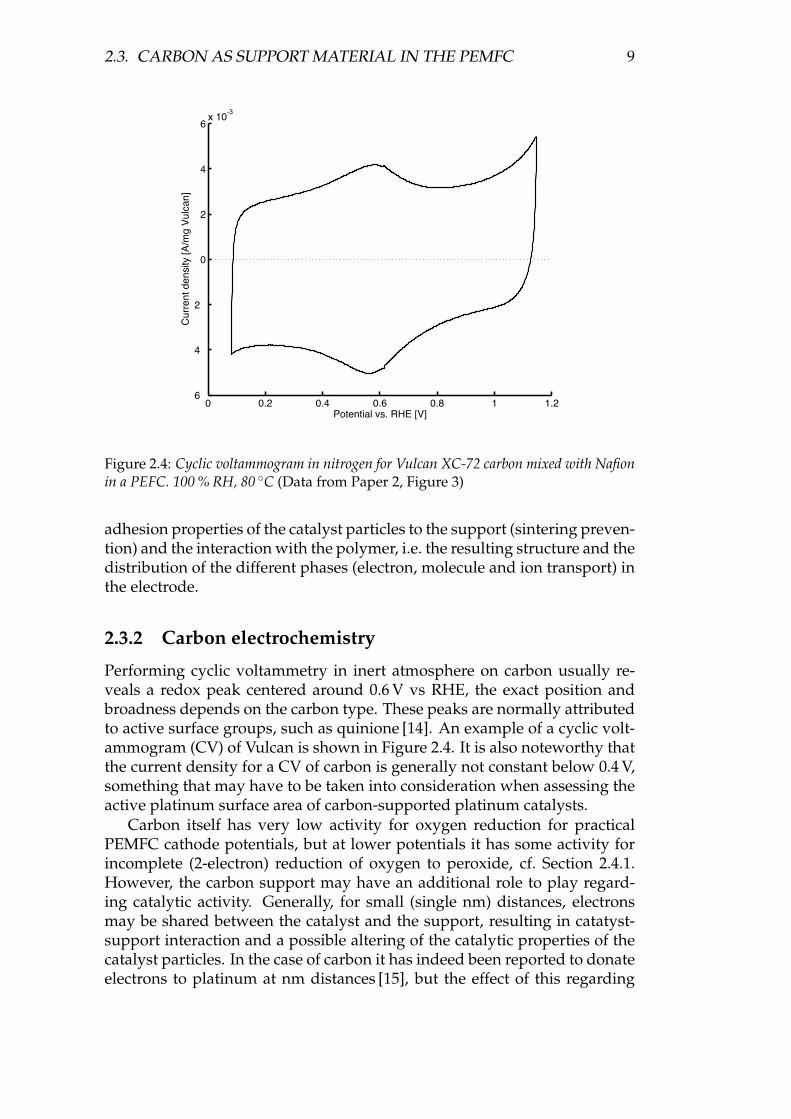
Figure 2.4: Cyclic voltammogram in nitrogen for Vulcan XC-72 carbon mixed with Nafionin a PEFC. 100 % RH, 80 ◦C (Data from Paper 2, Figure 3)
adhesion properties of the catalyst particles to the support (sintering preven-tion) and the interaction with the polymer, i.e. the resulting structure and thedistribution of the different phases (electron, molecule and ion transport) inthe electrode.
2.3.2 Carbon electrochemistry
Performing cyclic voltammetry in inert atmosphere on carbon usually re-veals a redox peak centered around 0.6 V vs RHE, the exact position andbroadness depends on the carbon type. These peaks are normally attributedto active surface groups, such as quinione [14]. An example of a cyclic volt-ammogram (CV) of Vulcan is shown in Figure 2.4. It is also noteworthy thatthe current density for a CV of carbon is generally not constant below 0.4 V,something that may have to be taken into consideration when assessing theactive platinum surface area of carbon-supported platinum catalysts.
Carbon itself has very low activity for oxygen reduction for practicalPEMFC cathode potentials, but at lower potentials it has some activity forincomplete (2-electron) reduction of oxygen to peroxide, cf. Section 2.4.1.However, the carbon support may have an additional role to play regard-ing catalytic activity. Generally, for small (single nm) distances, electronsmay be shared between the catalyst and the support, resulting in catatyst-support interaction and a possible altering of the catalytic properties of thecatalyst particles. In the case of carbon it has indeed been reported to donateelectrons to platinum at nm distances [15], but the effect of this regarding
10 CHAPTER 2. THEORETICAL BACKGROUND
catalytic activity for ORR has been hard to quantify.
2.3.3 Stability and corrosion of carbon supports
Carbon is not thermodynamically stable at higher potentials in the fuel cellenvironment, something that may be problematic for long-time durabilityof the electrodes. Typically one may generalise the complete electrochemicaloxidation of carbon as
C + 2H2O → CO2 + 4H+ + 4e− E0 = 0.207 V vs SHE (2.7)
The rate of corrosion is however usually slow, but at high potentials(above 0.9 V vs RHE) CO2 evolution is readily measurable, especially at el-evated temperatures. It has also been reported that platinum catalyses thecarbon oxidation [16]. Further, it has been shown that the carbon corrosionrate increases with the level of humidification, and that the surface chem-istry of the carbon support influences the rate, since graphitised carbonsgenerally show greater stability [17].
Due to the effects of carbon corrosion on long-term performance of thePEMFC there is currently much effort put into research on catalyst supports,primarily on carbon, but also on alternative materials. An example is theMagneli phases (titanium sub-oxides, trade name Ebonex), that have beenreported to work as platinum support material in oxygen-reducing elec-trodes in acid environment [18].
2.4 The electrochemical reduction reaction of oxy-gen in the PEMFC
We now start to address the oxygen reduction reaction (ORR) more pro-foundly. Rewriting Reaction 2.3 for a single oxygen molecule one gets
O2 + 4H+ + 4e− → H2O (2.8)
This is a four-electron reaction, including the transfer of four protons and thecleavage of an O-O bond. The equilibrium potential depends on tempera-ture and the activity of the reacting species according to the Nernst equation:
Eeq = 1.23 +RT4F
lnaO2 a4
H+
aH2O(2.9)
Among all the possible intermediates that may be produced on the pathtowards a complete 4-electron reduction, one, hydrogen peroxide, is a stablecompound that may be produced in some cases, depending on catalyst, po-tential and environment. The incomplete 2-electron reduction to hydrogenperoxide is written as
O2 + 2H+ + 2e− → H2O2 E0 = 0.68 V vs SHE (2.10)
2.4. THE ELECTROCHEMICAL ORR IN THE PEMFC 11
The hydrogen peroxide produced by this reaction may later be reducedto water by the following reaction
H2O2 + 2H+ + 2e− → H2O E0 = 1.77 V vs SHE (2.11)
When measuring activity for the ORR one typically records E vs I data bycyclic voltammetry, or by keeping either potential or current constant duringconstant steps in time while recording the other (“stair-step” methods). Thedata is then plotted E vs I or E vs log I in what is generally called polarisationplots.
The reason for sometimes plotting E vs log I is that straight lines, gener-ally called Tafel lines or Tafel slopes, may be observed in some parts of theplots (Tafel lines are often observed in electrochemical polarisation plots, atleast for small potential windows of a few hundred mV).
Tafel lines have a theoretical base stemming from the Butler-Volmer (BV)equation which expresses the current variation with overpotential accordingto
i = i0
[exp
(αaFη
RT
)− exp
(−αcFη
RT
)](2.12)
At high absolute values of the overpotentials (�25 mV), one of the termsabove becomes small enough to be neglected, and the equation may be ap-proximated by a straight line in the E-log I plot, a Tafel line. The BV equa-tion was originally derived for single electron outer-sphere reactions, i.e. notmulti-electron reactions with internal bond splittings. An observed Tafel linehowever may be an indication of one of the electrochemical steps being ratedetermining, and that this rate-determining step (rds) is governed by the BVequation.
2.4.1 The ORR on platinum in acid
Extensive research has been made on the oxygen reduction kinetics duringthe last forty years, and since Pt for long was the most active catalyst known,most work has been dedicated to this catalyst. Prior to the invention of thePEMFC, the phosphoric acid fuel cell (PAFC) gained much interest, and withthis application in mind, much work has been done in liquid electrolytes,typically H2SO4, H3PO4 and HClO4.
It is difficult to review results on ORR in the literature; there is vastamount of papers published during the past 15 years, and many results arehard to compare due to differences in experimental techniques, sometimesseemingly similar experiments report contradictory results. Also, due tolack of experimental details, it may be hard to decide what curves to com-pare, since hysteresis (i.e. when one records different currents dependingon sweep direction, even though the sweep rate is slow enough to minimisecapacitive effects) is often found when recording polarisation curves on plat-inum. This is due to the changing coverage of platinum oxide with potentialand possible build-up of peroxide concentrations [19] or contamination onthe surface by trace organic impurities present in the electrolyte.
12 CHAPTER 2. THEORETICAL BACKGROUND
Studies on bulk platinum in liquid electrolytes normally report two dif-ferent Tafel slope regions, one lower slope (around 60 mV/decade) at lowcurrent densities/high potentials, and one steeper, close to doubled, Tafelslope for higher current densities/low potentials. The lower slope has beenascribed to ORR on a platinum oxide-covered surface, and the steeper slopeto ORR on “bare” platinum [19].
Pt size and surface structure dependence
Differences in oxygen reduction activity for the different crystal facets ofthe Pt bulk crystal has been studied in liquid electrolytes. The results aresomewhat orthogonal, Kadiri et al. [20] reported no differences in HClO4whereas Markovic [21] has reported the activity to decrease in the sequence(011) > (111) > (100) in HClO4. The differences may be explained by the dif-ferent cycling protocols used: Kadiri’s activity was measured after 1 minuteat 1.0 V vs SHE, i.e. on oxidised platinum, whereas Markovic used a proto-col that reduced the platinum crystal (while evolving hydrogen), starting thesweep from a clean Pt surface. For other liquid electrolytes than HClO4 it isreadily seen that adsorption of the anion of the acid is lowering the activ-ity for oxygen reduction, and that the effect is different for different crystalsurfaces [20][22].
Regarding differences in activity between terrace and step sites in tran-sition regions between different facets Maciá et al. could not see the higheractivity that one would expect considering a stronger O2 adsorption in ultra-high vacuum (UHV), and proposed that the step sites are less active due tostronger anion (and also OH) adsorption on these sites [23].
The specific (surface) activity for ORR on Pt has been shown to decreasewhen decreasing the particle size, and this typically results in optimum massactivities for particle sizes between 2 and 4 nm [24]. This particle size effecthas both been attributed to a different fraction of the varied crystal planeswhen lowering the particle size [25], as well as being linked to the loweractivity of atoms at the edges and corners, in turn related to the above-mentioned lower activity of step sites [23] (Geometrically, the relative num-ber of atoms at corner and edges at the surface increases as the particle sizedecreases).
ORR Dependence on activities of reacting species and operating condi-tions
Reaction orders, i.e. how the reaction rate changes in an electrochemical re-action, may be defined in two different ways. Either by keeping the electrodeor the overpotential fixed. In the following the first definition will be used,i.e. the reaction order when changing the partial pressure Px of species x isdefined as
m =(
d logid logPx
)E
(2.13)
2.4. THE ELECTROCHEMICAL ORR IN THE PEMFC 13
Using the other reaction order definition, m = (d logI/d logPx)η, i.e. at aconstant overpotential, usually renders lower reaction orders than m definedby Equation 2.13.
In both Nafion (in equilibrium with H2SO4) [24] as well as liquid electro-lytes [26], one typically sees an ORR activity dependence on proton activity.The reaction order has been found to be around 1.5 for low current densitiesand around 1 for higher currents, the change in reaction order at low cur-rent densities is supposed to be due to changes in Pt-oxide coverage, ratherthan an altered intrinsic activity [26]. However, comparing activities in nor-mal and deuterated phosphoric acid indicated little impact on activity forthe heavier hydrogen isotopes, something that should imply that hydrogenatoms are presumably not involved in the rate-determining step for ORR onplatinum [27].
Regarding the dependence on oxygen activity, Parthasarathy et al. [28]and Beattie et al. [29] reported, for platinum microelectrodes in Nafion, oxy-gen reaction orders close to one, and similar results have been reported forliquid electrolytes [21]. For real fuel cell MEAs the reaction order may besomewhat lower than one [30][31]. The reaction order also decreases some-what at lower humidities [30]. The reaction order being lower than one in-dicates that there may be other adsorption processes competing with oxy-gen adsorption on the oxygen surface. For example, in TFMSA (trifluoro-methanesulfonic acid, liquid electrolyte), Ross et al. found deviations fromreaction order one to be due to impurities [32].
Due to the fact that the oxide coverage on the platinum surface stemsfrom the interaction with water one would expect the water activity, i.e. rel-ative humidity of the incoming gases in a PEMFC, to have an impact onthe ORR activity, since this should alter the surface of the catalyst. Murthiet al. [33] studied the impact of water activity on the ORR for two differentconcentrations of TFMSA: lowering the water activity increased the ORRactivity and showed one single steep Tafel slope around 120 mV/decade forplatinum nano-particles on carbon supports. The better ORR activity wasascribed to lower coverage of OH species at lower water activities. How-ever, in real fuel cell experiments, it is common to see lower kinetic ORRactivity at lower relative humidities [34][30]. Possibly, this could be due toan altered proton activity in the electrolyte at changed humidity conditions,but it could also be connected to the lower permeability of oxygen in theNafion electrolyte at lower humidities [35].
When it comes to ORR activity dependence on temperature, there doesnot seem to be a clear picture in literature, probably due to the challengingtask of distinguishing purely kinetic effects among all other effects such asvarying species activities, adsorption effects, mass transport, solubility, pro-ton activity etc. when varying temperature. Typically, no dramatic effectsare seen in the ORR currents measured in Nafion in the temperature inter-val between 303 and 343 K, although small changes in the Tafel slopes maybe observed, and these in turn render changes in the interpolated exchangecurrent densities [29].
14 CHAPTER 2. THEORETICAL BACKGROUND
Intermediates
Using rotating ring-disc electrodes the production of the possible interme-diate hydrogen peroxide may be monitored in liquid electrolytes. Generallyit seems that the hydrogen peroxide is only detected at potentials far lowerthan any viable operating PEMFC cathode potential. Typically, hydrogenperoxide starts to be detected at potentials lower than 0.4 V, where hydrogenis started to be adsorbed [36]; Markovic et al. [22] proposed that the changeof mechanism or pathway for oxygen reduction is due to the inability ofthe oxygen molecules to adsorb onto the hydrogen-covered surface, thus in-hibiting the splitting of the oxygen-oxygen bond. However, Murthi et al. [33]reported peroxide formation in TFMSA already at potentials as high as 0.6 V,i.e. not in the hydrogen-adsorption region, indicating that peroxide indeedmay be an intermediate in the general pathway for oxygen reduction.
The superoxide ion (O−2 ) was recently detected by Shao et al. [37] by us-
ing surface-enhanced infrared reflection absorption spectroscopy with at-tenuated total reflection (ATR-SEIRAS). Even though this was done in basicelectrolyte at pH=11 the authors propose, supported by results from densityfunctional theory (DFT) calculations, that the same result is to be expectedin any aqueous electrolyte. The first electrochemical step, and possibly therate-determinng one, could therefore be
O2 + 2M + e− → O−2ad
(2.14)
(The 2M being two free, adjacent, sites on the platinum surface). The authorscould, however, not detect O−
2 in HClO4, but they proposed this was due toa much faster protonation of the O−
2 ion in protonic media.But, since the reaction order of H+ has been shown to be one, the follow-
ing rds has also been suggested (the Damjanovic mechanism [38]):
O2ad + H+ + e− → HO2ad (2.15)
Intermediates of this type however seem to be hard to detect experi-mentally. Using electrochemical impedance spectroscopy, adsorbed specieshave been seen, indicating a second electrochemical step [24] for platinumin Nafion, but the exact nature of these adsorbed species is yet to be deter-mined.
Quantifying the ORR kinetics on Pt
For moderate overpotentials, for which hydrogen peroxide and a possiblechange in mechansim have not been observed, the above knowledge aboutoxygen reduction is perhaps best condensed into the following equation [39]
i = K1[O2](1−Θad)xexp(−βFE
RT
)exp
(−γrΘad
RT
)(2.16)
This expression, assuming the addition of the first electron to O2ad to bethe rds, also includes the inhibiting effect of the coverage, Θad, of OH and
2.4. THE ELECTROCHEMICAL ORR IN THE PEMFC 15
other species on Pt; x is either 1 or 2 depending on the site requirements ofthe adsorbates, r is the rate of change of the “apparent” standard free en-ergy of adsorption with the surface coverage of adsorbing species, β andγ are symmetry factors, assumed to be close to 1/2. It should be notedthat the coverage itself depends on potential. Even though the expressionabove looks complicated enough, one may argue that higher order termsmay probably have to be added to the Butler-Volmer factor, since the electro-chemical reaction takes place so far from the reversible potential [40]. Also,since the possible dependence on the proton activity is not included, a factor[H+] may be added, resulting in:
i = K2[O2][H+](1−Θad)xexp(−βFE
RT− γrΘad
RT+O
(E2
))(2.17)
Finally, it should be noted that most of the results reviewed on ORR herewere made on different kinds of Pt model systems; when moving to thecomplex world of the PEMFC cathode additional effects may come into play.Typically the surface will be a mix of different crystal planes, with transitionregions and “defects” between them, and the already-mentioned Pt-size ef-fect will result in different kinetics of particles of different grain size. Thereare also possible effects from the interaction with the support material. Inaddition, effects of cross permeation of gases through the membrane, un-even species and heat transport, and corrosion of platinum and the carbonsupport, may also have impact on the polarisation behaviour of the PEMFCcathode.
2.4.2 Alternative catalysts for the ORR
Due to the high price/low activity ratio of platinum for the ORR much ef-fort is continuously put into finding other catalyst candidates, the literatureis vast and swiftly expanding. Two recent reviews by Gasteiger [2] and An-tolini [13] cover much of the latest activities on the perhaps most promisingalternative – platinum alloys.
By alloying platinum with a transition metal such as Cr, Ni or Co, ac-tivity gains have been reported both in single crystal plane half-cell studiesand in running fuel cells with “real” porous electrodes. A number of dif-ferent explanations for the increased activity have been proposed, includingdecreased nearest neighbour Pt-Pt distance on the surface, surface roughen-ing and various effects resulting in decreased OHad coverage. In phosphoricacid cells (PAFCs) these catalysts typically increase the mass activity for ORRof platinum by 2–3 times, and PAFC power plants of today use ternary Pt-alloys. Similar gains have been seen in PEMFCs as well. However, leachingof the non-noble metal atoms has been identified as a problem for this typeof catalysts; the leached metal ions may not only cause structural changes tothe catalyst but may also poison the electrolyte. The latter phenomenon maybe more severe for the PEMFC where the number of H+ in the electrolyte isless than a tenth compared to PAFCs. Nevertheless, Pt-alloys are believed
16 CHAPTER 2. THEORETICAL BACKGROUND
to be a feasible path towards the needed 4-fold increase in mass activity forbroad fuel cell commercialisation.
Apart from the platinum alloys there are numerous literature findingsof other catalysts showing promising activity for ORR, but none superior toplatinum, and commonly with low stability in the harsh PEMFC cathode en-vironment. Many alternative catalysts are noble metal based, but there arealso non-noble metal examples [41]. Among these, the most prominent is aninteresting group of catalysts obtained when heat treating a transition metalcomplex on carbon in a nitrogen-containing atmosphere. These complexes,“organic macrocycles”, with a catalytic site resembling the active centre ofhemoglobin, contain no noble metal. However, the lower activity (per vol-ume) than for Pt will demand thicker electrodes, in turn imposing mass-transport issues. Therefore, apart from suffering from low durability, the ac-tivity still needs to be increased by at least one order of magnitude to makethis approach feasible.
2.5 Some experimental considerations when eval-uating ORR in the PEMFC
2.5.1 Choice of potentials
Looking at what is known about platinum and the PEMFC cathode one maynow close this chapter by proposing some general guidelines for the choiceof potentials for catalyst evaluation in the PEMFC. Even though platinum-based catalysts are generally in mind here, the following should be applica-ble to other catalysts as well.
As already mentioned, both carbon supports and platinum may corrodeat high potentials, especially above 1.0 V, and one should therefore avoidnumerous cycling or long potential holds above this potential, unless it isdesired to study corrosion stability explicitly. However, organic (and other)“impurities” may also be oxidised and removed at high potentials, result-ing in a “cleaner” surface with higher ORR activity, and more well-resolvedpeaks when performing cyclic voltammetry in inert gas. It is therefore hardto state any exact potential limit, it will depend on the purpose of the exper-iment.
For the lower potential limit, no corrosion is assumed to occur electro-chemically, but if going below 0 V in hydrogen or inert gas, hydrogen evo-lution will occur which may result in mechanical corrosion of the catalyst(e.g. a platinum film could be loosened from a surface by the hydrogen bub-bles). However, also hydrogen evolution may result in “activation” of thesamples by removing impurities on the surface. If oxygen is present too lowpotentials may result in peroxide formation, which in turn may corrode theelectrode or the polymer electrolyte.
It should also be pointed out that, when evaluating ORR activity andcomparing different samples, the open circuit potential (OCP) of the whole
2.5. EXPERIMENTAL CONSIDERATIONS 17
fuel cell is generally not a good starting potential for catalyst evaluation. Thisis due to the fact that the OCP is dependent on several different factors suchas hydrogen permeation and the amount of catalyst loading in the electrode,and it will vary between different electrodes. Since platinum is covered tovarious degrees by adsorbed OH-species in the potential window of typi-cal OCPs (0.95-1.05 V), this will result in an ill-defined starting state of thesurface before the potential sweep.
In some of the work in this thesis the samples were “activated” by fastcycling between 0.05 and 1.15 V in inert gas, as well as cycling in hydro-gen below 0 V. After this, the ORR evaluation was made in a smaller po-tential window in several cycles at slower sweep rates, typically between1 and 0.5 V. The fast cycling between 0.05 and 1.15 V in inert gas (nitrogen)also provided cyclic voltammograms with hydrogen adsoprtion/desorptionpeaks for platinum surface evaluation.
2.5.2 Reference electrodes
Reference electrodes in fuel cells are a complicated matter since the solidelectrolyte and the need for humidification pose constraints on how the cellmay be designed. The simplest solution is to use the anode (counter elec-trode) also as reference electrode and assume that it is not polarised at all(since the hydrogen/platinum electrode is very fast). This is acceptable if thecurrent densities are fairly low (<50 mA/cm2), but for higher current densi-ties some other solution is needed to get a true reference potential. However,if one only wishes to benchmark catalysts against each other it may sufficeto use the same type of anode (typically a commercial one), and assume thatthe anode is similarly polarised in all experiments.
Placing an additional platinum electrode in the same compartment as theanode will provide a non-polarised hydrogen electrode reference, but thenproblems may occur with uneven potential distribution in the membrane,making correction for the IR-drop troublesome. Problems may also arisewhen studying transient behaviour (impedance spectroscopy or fast cyclicvoltammetry) [42].
In this thesis the counter electrode was used as reference electrode for allexperiments.

18 CHAPTER 2. THEORETICAL BACKGROUND
Chapter 3
Experimental work anddevelopment of techniques
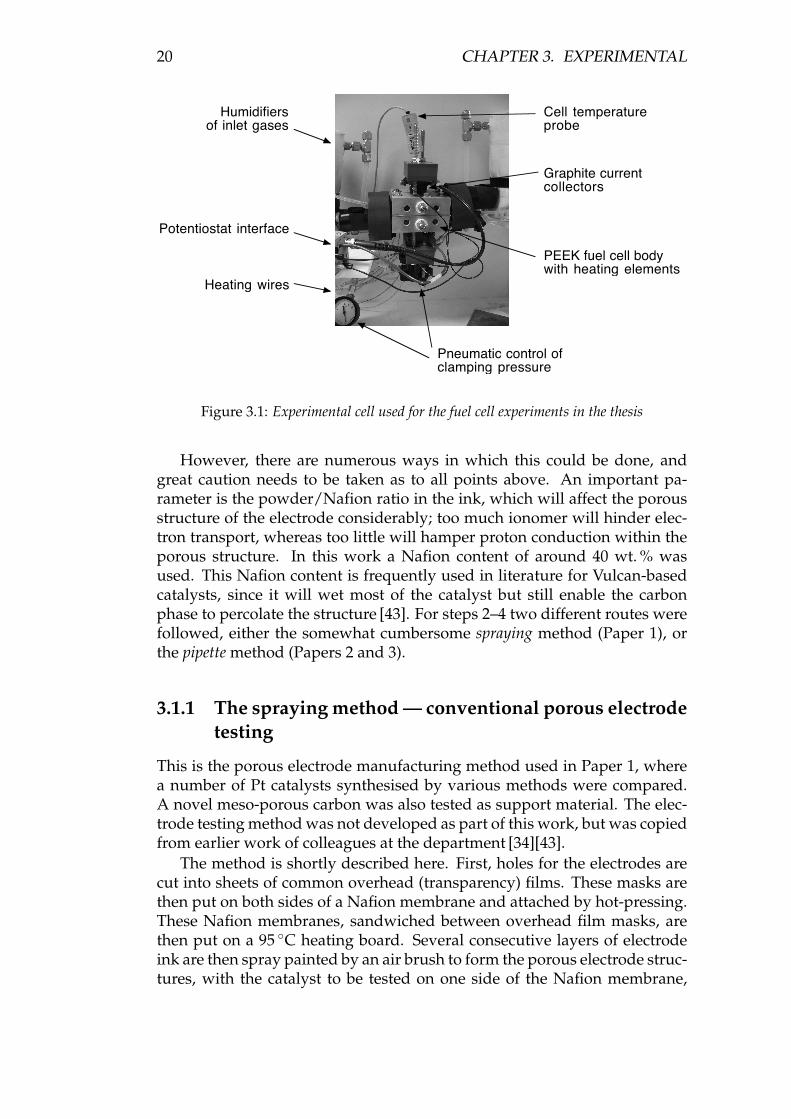
All fuel cell experiments for this thesis were made using the same labora-tory fuel cell, developed in-house prior to this work. The experimental cellis shown in Figure 3.1. The experimental work and results presented are allbased on catalysts produced by two different groups, Teknisk Ytkemi (TYK)and Kompetenscentrum för Katalys (KCK). Papers 1–3 deal with samplesfrom TYK, these catalysts were synthesised using wet-chemistry methods(such as microemulsion etc.), resulting in carbon-supported catalysts, suit-able for porous electrode testing. The samples from KCK, however, coveredin Papers 4–6, were made using physical deposition methods, resulting inthin film model electrodes. The description of the experimental work of thethesis is hence divided into two main categories: porous and model elec-trode testing. At the end of this chapter also two different ways to lower theimpact of hydrogen permeation through the membrane are described.
3.1 Porous electrode studies
The recipe for producing a porous PEMFC electrode from a catalyst powderis quite simple:
1. Mix (magnetic stirring and ultra sound) the catalytic powder with theionomer solution (e.g. 5 wt. % Nafion dissolved in various solvents) toform an electrode “ink”.
2. Apply a well-defined amount of the ink rendering a known electrodeloading, either directly onto the membrane, or to some other flat sur-face (and hot-press it in a later step to attach the electrode layer to themembrane).
3. Let it dry, the remaining catalyst/carbon powder thus forming a poro-us structure.
4. Apply a counter and reference electrode to the membrane and evaluatethe catalytic activity in the fuel cell.
19
20 CHAPTER 3. EXPERIMENTAL
Humidifiersof inlet gases
Cell temperatureprobe
Pneumatic control of clamping pressure
Graphite current collectors
PEEK fuel cell body with heating elements
Potentiostat interface
Heating wires
Figure 3.1: Experimental cell used for the fuel cell experiments in the thesis
However, there are numerous ways in which this could be done, andgreat caution needs to be taken as to all points above. An important pa-rameter is the powder/Nafion ratio in the ink, which will affect the porousstructure of the electrode considerably; too much ionomer will hinder elec-tron transport, whereas too little will hamper proton conduction within theporous structure. In this work a Nafion content of around 40 wt. % wasused. This Nafion content is frequently used in literature for Vulcan-basedcatalysts, since it will wet most of the catalyst but still enable the carbonphase to percolate the structure [43]. For steps 2–4 two different routes werefollowed, either the somewhat cumbersome spraying method (Paper 1), orthe pipette method (Papers 2 and 3).
3.1.1 The spraying method — conventional porous electrodetesting
This is the porous electrode manufacturing method used in Paper 1, wherea number of Pt catalysts synthesised by various methods were compared.A novel meso-porous carbon was also tested as support material. The elec-trode testing method was not developed as part of this work, but was copiedfrom earlier work of colleagues at the department [34][43].
The method is shortly described here. First, holes for the electrodes arecut into sheets of common overhead (transparency) films. These masks arethen put on both sides of a Nafion membrane and attached by hot-pressing.These Nafion membranes, sandwiched between overhead film masks, arethen put on a 95 ◦C heating board. Several consecutive layers of electrodeink are then spray painted by an air brush to form the porous electrode struc-tures, with the catalyst to be tested on one side of the Nafion membrane,
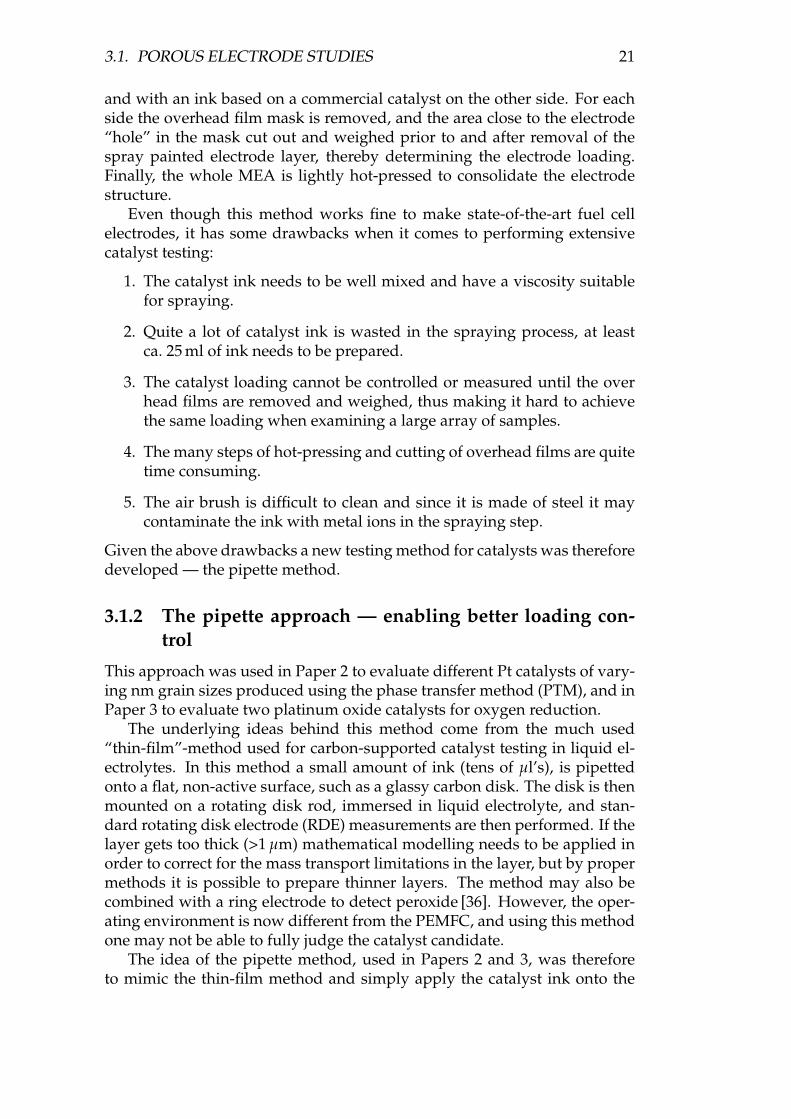
3.1. POROUS ELECTRODE STUDIES 21
and with an ink based on a commercial catalyst on the other side. For eachside the overhead film mask is removed, and the area close to the electrode“hole” in the mask cut out and weighed prior to and after removal of thespray painted electrode layer, thereby determining the electrode loading.Finally, the whole MEA is lightly hot-pressed to consolidate the electrodestructure.
Even though this method works fine to make state-of-the-art fuel cellelectrodes, it has some drawbacks when it comes to performing extensivecatalyst testing:
1. The catalyst ink needs to be well mixed and have a viscosity suitablefor spraying.
2. Quite a lot of catalyst ink is wasted in the spraying process, at leastca. 25 ml of ink needs to be prepared.
3. The catalyst loading cannot be controlled or measured until the overhead films are removed and weighed, thus making it hard to achievethe same loading when examining a large array of samples.
4. The many steps of hot-pressing and cutting of overhead films are quitetime consuming.
5. The air brush is difficult to clean and since it is made of steel it maycontaminate the ink with metal ions in the spraying step.
Given the above drawbacks a new testing method for catalysts was thereforedeveloped — the pipette method.
3.1.2 The pipette approach — enabling better loading con-trol
This approach was used in Paper 2 to evaluate different Pt catalysts of vary-ing nm grain sizes produced using the phase transfer method (PTM), and inPaper 3 to evaluate two platinum oxide catalysts for oxygen reduction.
The underlying ideas behind this method come from the much used“thin-film”-method used for carbon-supported catalyst testing in liquid el-ectrolytes. In this method a small amount of ink (tens of µl’s), is pipettedonto a flat, non-active surface, such as a glassy carbon disk. The disk is thenmounted on a rotating disk rod, immersed in liquid electrolyte, and stan-dard rotating disk electrode (RDE) measurements are then performed. If thelayer gets too thick (>1 µm) mathematical modelling needs to be applied inorder to correct for the mass transport limitations in the layer, but by propermethods it is possible to prepare thinner layers. The method may also becombined with a ring electrode to detect peroxide [36]. However, the oper-ating environment is now different from the PEMFC, and using this methodone may not be able to fully judge the catalyst candidate.
The idea of the pipette method, used in Papers 2 and 3, was thereforeto mimic the thin-film method and simply apply the catalyst ink onto the
22 CHAPTER 3. EXPERIMENTAL
membrane by pipetting rather than spraying, thereby avoiding most of theflaws of the latter application method. Control of loading is now made viathe amount of pipetted ink. Control samples of the same volume are alsopipetted, at the same time, onto a different substrate. After drying these areweighed in order to avoid possible errors in loading due to changes in inkdensity caused by solvent evaporation etc. Also, for convenience and repro-ducibility a commercial counter/reference electrode is hot pressed onto theother side of the membrane. To summarise the pipette method:
1. Prepare ink as in the spraying method.
2. Put membranes on a 95 ◦C heating board.
3. Pipette a small amount, a “dot”, of ink directly onto the membrane,and, at the same time, pipette the same volume to control “dots” onsmall, pre-weighed, pieces of overhead film.
4. Let dry for 15 min.
5. Weigh the control samples and assume the that the loading of the elec-trodes on the membranes is the same.
6. Hot press commercial counter/reference electrodes to the other side(covering the whole dot area).
There are, however, some possible pit falls using this approach. Com-pared to the spraying method, the electrode will now probably have a lessuniform constitution, and therefore evaluation and comparison between dif-ferent samples at higher current densities will be hazardous since mass-transport limitations will depend very much on how the electrode “dot” wasdropped and smeared out from the pipette to the membrane, something thatwill vary between all samples. Also, the correction for the IR-drop may betroublesome if the current density distribution is not homogeneous in theelectrode. However, for lower current densities at higher potentials theseissues are of less importance.
3.2 Model electrode studies
3.2.1 Why model electrodes?
Porous electrodes have some drawbacks when it comes to catalyst testing.Firstly, as already mentioned, porous electrodes have a complex morphol-ogy, where transport of reaction species, electrons and heat, need to be pro-vided for all catalytic sites; how this works is of crucial importance for theactivity of the electrode. When testing a new catalyst deposited on a carbonsupport in a porous electrode, one usually uses the same recipe for the elec-trode ink as is known to work for a commercial catalyst, and an activity com-parison is made using the commercial catalyst as benchmark. If the same
3.2. MODEL ELECTRODE STUDIES 23
carbon support is used, and there is no reason to suspect that the synthesismethod has altered the surface behaviour of the support to a large extent,this may be acceptable. However, one should always remember that theelectrode ink composition and electrode manufacturing process may haveto be optimised also for the new catalyst, otherwise one may risk ruling outactive catalysts due to bad electrode structure, not due to low catalytic ac-tivity. Optimising the ink recipe is not only a tedious task, it will also needconsiderable amounts of catalytic material to be synthesised.
Secondly, porous electrodes are heterogeneous structures, implying thata homogeneous potential and mass transport distribution may never be as-sured, making more fundamental catalytic studies hard to perform. There-fore such kinds of experiments are usually carried out using bulk metals,either as rotating disk electrodes in liquid electrolytes or micro electrodesmade from cut metal wires. However, since operating fuel cell catalysts arelikely to be in the size of nm grains in order to increase the surface-to-mass-ratio, bulk catalyst research may miss important features that may occurwhen reducing the particle size to the nm domain, and, in the case of microelectrodes, one may also be limited to the materials that may be forged intoµm wires. Also, as mentioned before, liquid electrolyte experiments do notprovide the same operating environment as in the PEMFC.
A third problem of traditional carbon-supported catalyst testing is alsothat the local morphology regarding catalyst composition, grain size, par-ticle-to-particle distance will vary depending on the synthesis method, thusmaking it hard to compare catalytic behaviour when wanting to vary onlyone of these parameters.
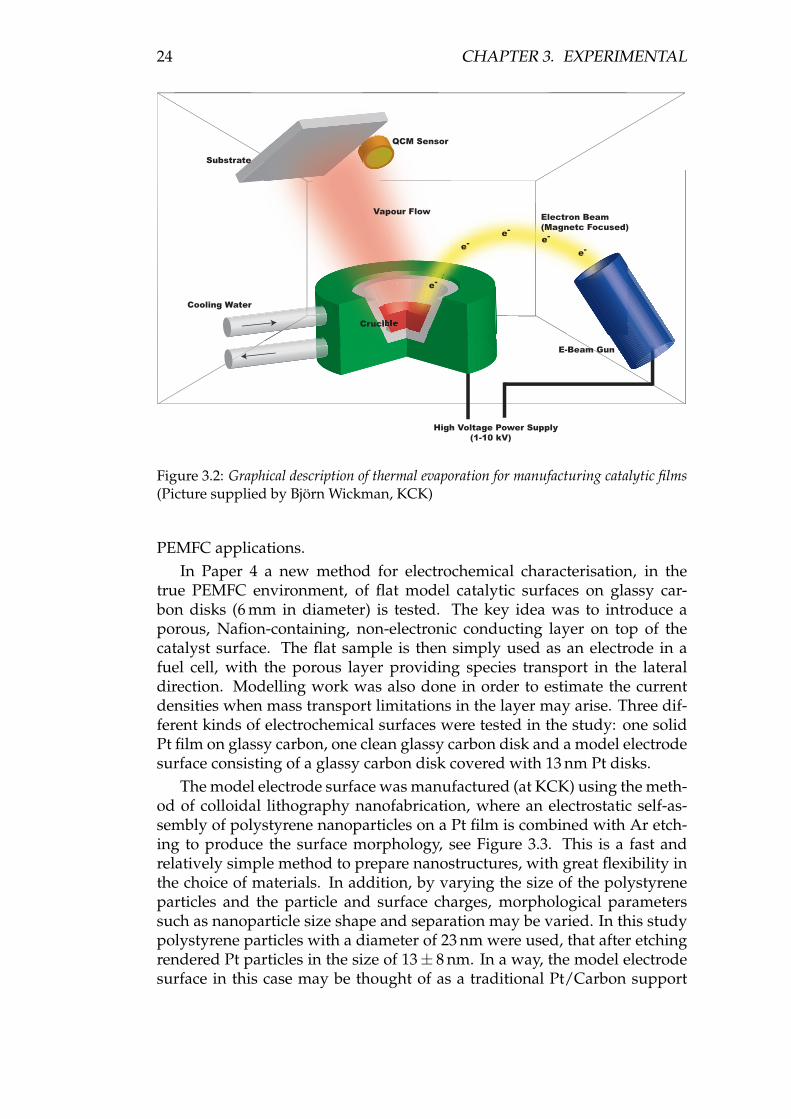
Given the above drawbacks of both porous electrode testing and tradi-tional bulk metal model electrode testing, a number of nm model electrodetesting methodologies were developed in this thesis work. All model elec-trode samples in the following were made by KCK, using the physical de-position method of thermal evaporation. For a short description of thermalevaporation, please cf. Figure 3.2
3.2.2 Planar model electrodes on glassy carbon disks
Planar, mechanically rigid and thermally stable electron-conducting supportmaterials, such as glassy carbon, are convenient to use when it comes tomodel catalyst manufacturing, since the mentioned properties allow muchflexibility regarding manufacturing techniques (e.g. thermal evaporation,sputtering etc. in combination with lithographic techniques) and post man-ufacturing characterisation (such as atomic force microscopy — AFM, scan-ning tunneling microscopy — STM, scanning electron microscopy — SEMetc.). However, the flat surface is challenging to characterise electrochemi-cally in the PEMFC environment. Traditionally, these flat model electrodes(on the mm scale) are characterised in “half cells”, using rotating disk elec-trodes (RDE) in liquid electrolytes, posing constraints if wanting to investi-gate catalytic behaviour at elevated temperatures or lowered humidity for
24 CHAPTER 3. EXPERIMENTAL
Electron Beam(Magnetc Focused)
Vapour Flow
e-e-
e-
e-
e-
Substrate
QCM Sensor
Cooling Water
Crucible
High Voltage Power Supply (1-10 kV)
E-Beam Gun
Figure 3.2: Graphical description of thermal evaporation for manufacturing catalytic films(Picture supplied by Björn Wickman, KCK)
PEMFC applications.In Paper 4 a new method for electrochemical characterisation, in the
true PEMFC environment, of flat model catalytic surfaces on glassy car-bon disks (6 mm in diameter) is tested. The key idea was to introduce aporous, Nafion-containing, non-electronic conducting layer on top of thecatalyst surface. The flat sample is then simply used as an electrode in afuel cell, with the porous layer providing species transport in the lateraldirection. Modelling work was also done in order to estimate the currentdensities when mass transport limitations in the layer may arise. Three dif-ferent kinds of electrochemical surfaces were tested in the study: one solidPt film on glassy carbon, one clean glassy carbon disk and a model electrodesurface consisting of a glassy carbon disk covered with 13 nm Pt disks.
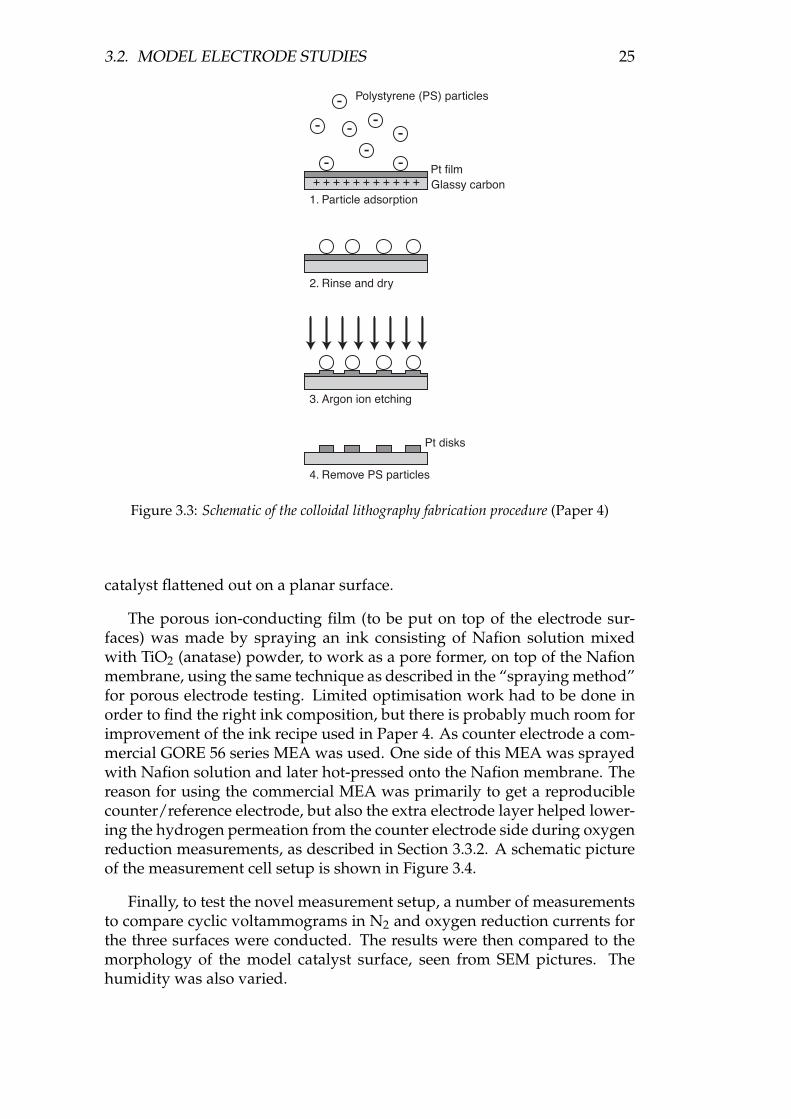
The model electrode surface was manufactured (at KCK) using the meth-od of colloidal lithography nanofabrication, where an electrostatic self-as-sembly of polystyrene nanoparticles on a Pt film is combined with Ar etch-ing to produce the surface morphology, see Figure 3.3. This is a fast andrelatively simple method to prepare nanostructures, with great flexibility inthe choice of materials. In addition, by varying the size of the polystyreneparticles and the particle and surface charges, morphological parameterssuch as nanoparticle size shape and separation may be varied. In this studypolystyrene particles with a diameter of 23 nm were used, that after etchingrendered Pt particles in the size of 13± 8 nm. In a way, the model electrodesurface in this case may be thought of as a traditional Pt/Carbon support
3.2. MODEL ELECTRODE STUDIES 25
+ + + + + + + + + + +
-
-
-
- -
-
-
-
1. Particle adsorption
2. Rinse and dry
3. Argon ion etching
4. Remove PS particles
Pt disks
Pt film
Polystyrene (PS) particles
Glassy carbon
Figure 3.3: Schematic of the colloidal lithography fabrication procedure (Paper 4)
catalyst flattened out on a planar surface.
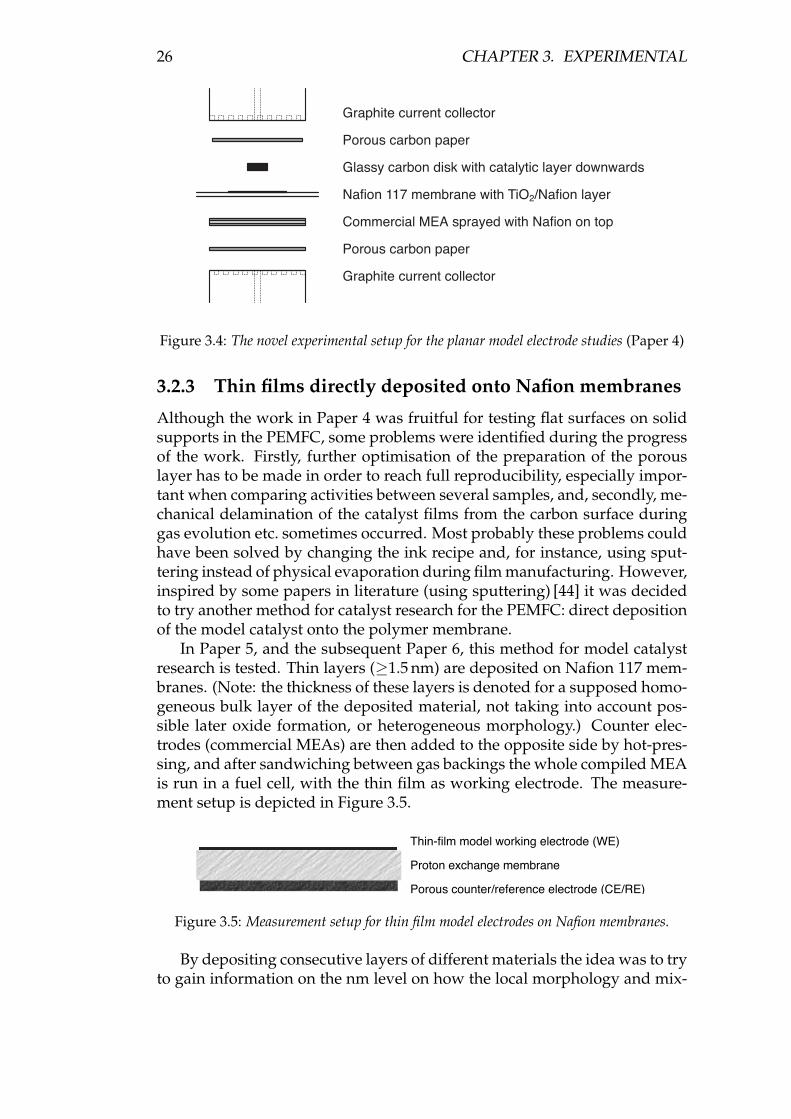
The porous ion-conducting film (to be put on top of the electrode sur-faces) was made by spraying an ink consisting of Nafion solution mixedwith TiO2 (anatase) powder, to work as a pore former, on top of the Nafionmembrane, using the same technique as described in the “spraying method”for porous electrode testing. Limited optimisation work had to be done inorder to find the right ink composition, but there is probably much room forimprovement of the ink recipe used in Paper 4. As counter electrode a com-mercial GORE 56 series MEA was used. One side of this MEA was sprayedwith Nafion solution and later hot-pressed onto the Nafion membrane. Thereason for using the commercial MEA was primarily to get a reproduciblecounter/reference electrode, but also the extra electrode layer helped lower-ing the hydrogen permeation from the counter electrode side during oxygenreduction measurements, as described in Section 3.3.2. A schematic pictureof the measurement cell setup is shown in Figure 3.4.
Finally, to test the novel measurement setup, a number of measurementsto compare cyclic voltammograms in N2 and oxygen reduction currents forthe three surfaces were conducted. The results were then compared to themorphology of the model catalyst surface, seen from SEM pictures. Thehumidity was also varied.
26 CHAPTER 3. EXPERIMENTAL
Graphite current collector
Porous carbon paper
Glassy carbon disk with catalytic layer downwards
Nafion 117 membrane with TiO2/Nafion layer
Commercial MEA sprayed with Nafion on top
Porous carbon paper
Graphite current collector
Figure 3.4: The novel experimental setup for the planar model electrode studies (Paper 4)
3.2.3 Thin films directly deposited onto Nafion membranes
Although the work in Paper 4 was fruitful for testing flat surfaces on solidsupports in the PEMFC, some problems were identified during the progressof the work. Firstly, further optimisation of the preparation of the porouslayer has to be made in order to reach full reproducibility, especially impor-tant when comparing activities between several samples, and, secondly, me-chanical delamination of the catalyst films from the carbon surface duringgas evolution etc. sometimes occurred. Most probably these problems couldhave been solved by changing the ink recipe and, for instance, using sput-tering instead of physical evaporation during film manufacturing. However,inspired by some papers in literature (using sputtering) [44] it was decidedto try another method for catalyst research for the PEMFC: direct depositionof the model catalyst onto the polymer membrane.
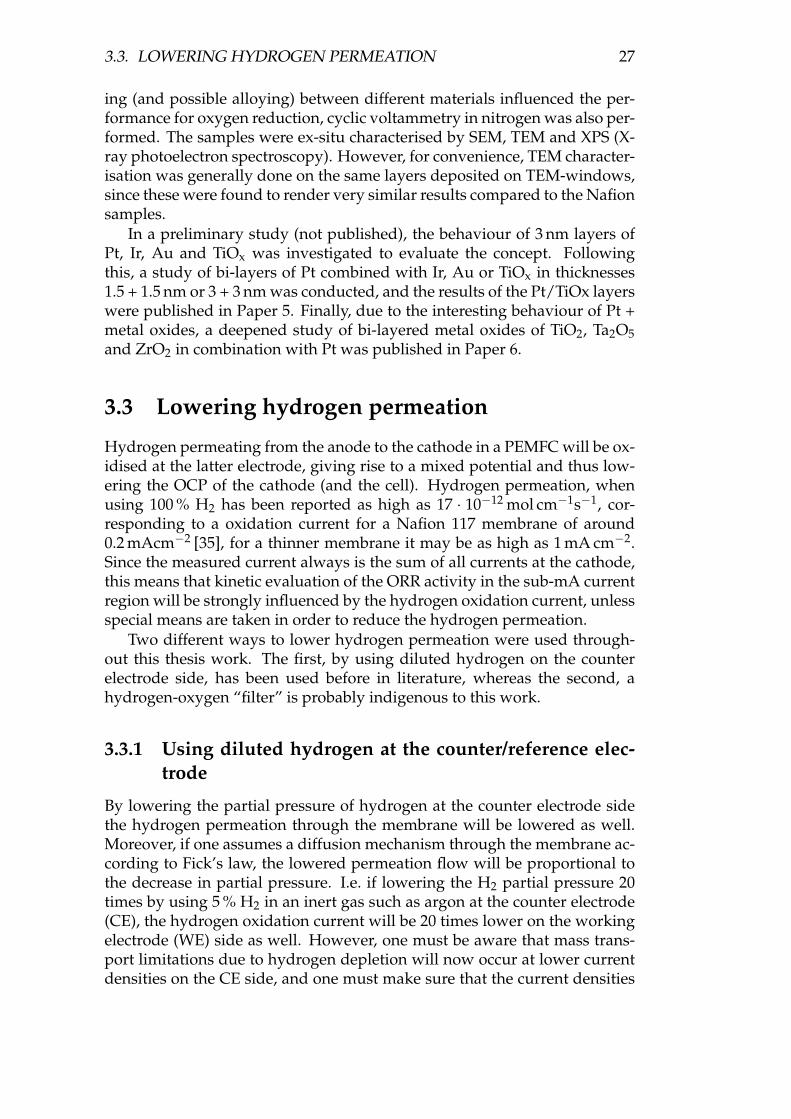
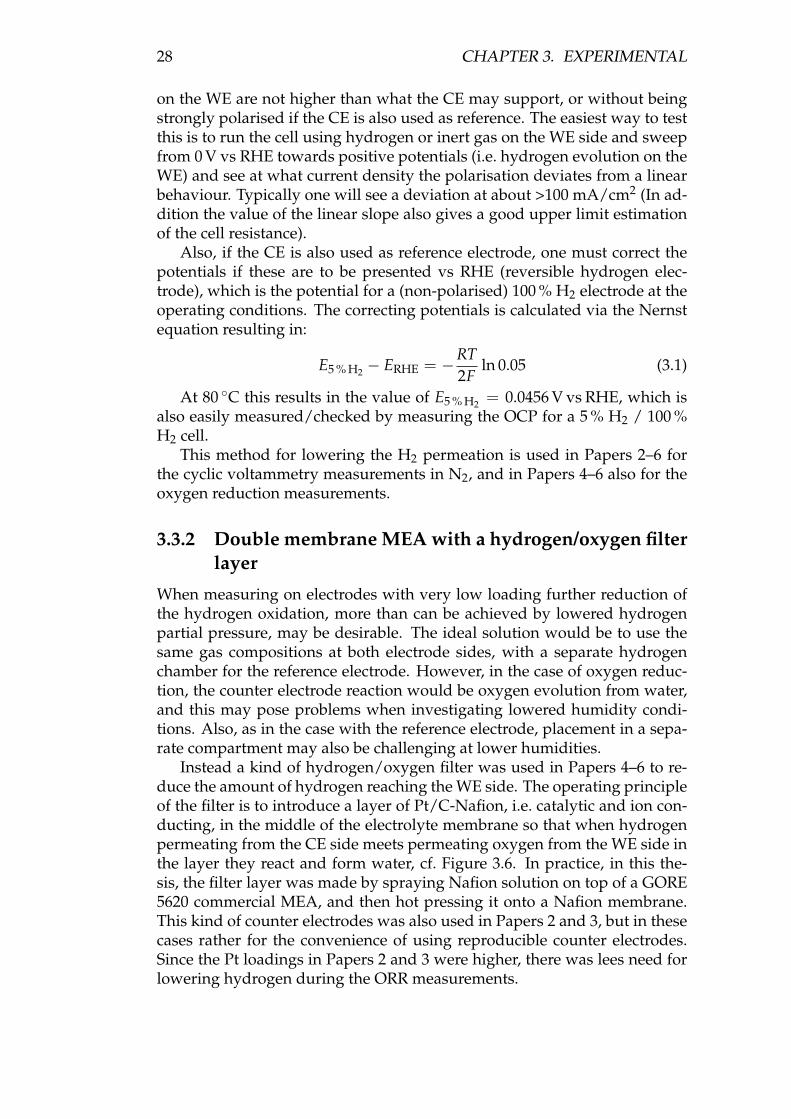
In Paper 5, and the subsequent Paper 6, this method for model catalystresearch is tested. Thin layers (≥1.5 nm) are deposited on Nafion 117 mem-branes. (Note: the thickness of these layers is denoted for a supposed homo-geneous bulk layer of the deposited material, not taking into account pos-sible later oxide formation, or heterogeneous morphology.) Counter elec-trodes (commercial MEAs) are then added to the opposite side by hot-pres-sing, and after sandwiching between gas backings the whole compiled MEAis run in a fuel cell, with the thin film as working electrode. The measure-ment setup is depicted in Figure 3.5.
Thin-film model working electrode (WE)
Proton exchange membrane
Porous counter/reference electrode (CE/RE)
Figure 3.5: Measurement setup for thin film model electrodes on Nafion membranes.
By depositing consecutive layers of different materials the idea was to tryto gain information on the nm level on how the local morphology and mix-
3.3. LOWERING HYDROGEN PERMEATION 27
ing (and possible alloying) between different materials influenced the per-formance for oxygen reduction, cyclic voltammetry in nitrogen was also per-formed. The samples were ex-situ characterised by SEM, TEM and XPS (X-ray photoelectron spectroscopy). However, for convenience, TEM character-isation was generally done on the same layers deposited on TEM-windows,since these were found to render very similar results compared to the Nafionsamples.
In a preliminary study (not published), the behaviour of 3 nm layers ofPt, Ir, Au and TiOx was investigated to evaluate the concept. Followingthis, a study of bi-layers of Pt combined with Ir, Au or TiOx in thicknesses1.5 + 1.5 nm or 3 + 3 nm was conducted, and the results of the Pt/TiOx layerswere published in Paper 5. Finally, due to the interesting behaviour of Pt +metal oxides, a deepened study of bi-layered metal oxides of TiO2, Ta2O5and ZrO2 in combination with Pt was published in Paper 6.
3.3 Lowering hydrogen permeation
Hydrogen permeating from the anode to the cathode in a PEMFC will be ox-idised at the latter electrode, giving rise to a mixed potential and thus low-ering the OCP of the cathode (and the cell). Hydrogen permeation, whenusing 100 % H2 has been reported as high as 17 · 10−12 mol cm−1s−1, cor-responding to a oxidation current for a Nafion 117 membrane of around0.2 mAcm−2 [35], for a thinner membrane it may be as high as 1 mA cm−2.Since the measured current always is the sum of all currents at the cathode,this means that kinetic evaluation of the ORR activity in the sub-mA currentregion will be strongly influenced by the hydrogen oxidation current, unlessspecial means are taken in order to reduce the hydrogen permeation.
Two different ways to lower hydrogen permeation were used through-out this thesis work. The first, by using diluted hydrogen on the counterelectrode side, has been used before in literature, whereas the second, ahydrogen-oxygen “filter” is probably indigenous to this work.
3.3.1 Using diluted hydrogen at the counter/reference elec-trode
By lowering the partial pressure of hydrogen at the counter electrode sidethe hydrogen permeation through the membrane will be lowered as well.Moreover, if one assumes a diffusion mechanism through the membrane ac-cording to Fick’s law, the lowered permeation flow will be proportional tothe decrease in partial pressure. I.e. if lowering the H2 partial pressure 20times by using 5 % H2 in an inert gas such as argon at the counter electrode(CE), the hydrogen oxidation current will be 20 times lower on the workingelectrode (WE) side as well. However, one must be aware that mass trans-port limitations due to hydrogen depletion will now occur at lower currentdensities on the CE side, and one must make sure that the current densities
28 CHAPTER 3. EXPERIMENTAL
on the WE are not higher than what the CE may support, or without beingstrongly polarised if the CE is also used as reference. The easiest way to testthis is to run the cell using hydrogen or inert gas on the WE side and sweepfrom 0 V vs RHE towards positive potentials (i.e. hydrogen evolution on theWE) and see at what current density the polarisation deviates from a linearbehaviour. Typically one will see a deviation at about >100 mA/cm2 (In ad-dition the value of the linear slope also gives a good upper limit estimationof the cell resistance).
Also, if the CE is also used as reference electrode, one must correct thepotentials if these are to be presented vs RHE (reversible hydrogen elec-trode), which is the potential for a (non-polarised) 100 % H2 electrode at theoperating conditions. The correcting potentials is calculated via the Nernstequation resulting in:
E5 % H2 − ERHE = −RT2F
ln 0.05 (3.1)
At 80 ◦C this results in the value of E5 % H2 = 0.0456 V vs RHE, which isalso easily measured/checked by measuring the OCP for a 5 % H2 / 100 %H2 cell.
This method for lowering the H2 permeation is used in Papers 2–6 forthe cyclic voltammetry measurements in N2, and in Papers 4–6 also for theoxygen reduction measurements.
3.3.2 Double membrane MEA with a hydrogen/oxygen filterlayer
When measuring on electrodes with very low loading further reduction ofthe hydrogen oxidation, more than can be achieved by lowered hydrogenpartial pressure, may be desirable. The ideal solution would be to use thesame gas compositions at both electrode sides, with a separate hydrogenchamber for the reference electrode. However, in the case of oxygen reduc-tion, the counter electrode reaction would be oxygen evolution from water,and this may pose problems when investigating lowered humidity condi-tions. Also, as in the case with the reference electrode, placement in a sepa-rate compartment may also be challenging at lower humidities.
Instead a kind of hydrogen/oxygen filter was used in Papers 4–6 to re-duce the amount of hydrogen reaching the WE side. The operating principleof the filter is to introduce a layer of Pt/C-Nafion, i.e. catalytic and ion con-ducting, in the middle of the electrolyte membrane so that when hydrogenpermeating from the CE side meets permeating oxygen from the WE side inthe layer they react and form water, cf. Figure 3.6. In practice, in this the-sis, the filter layer was made by spraying Nafion solution on top of a GORE5620 commercial MEA, and then hot pressing it onto a Nafion membrane.This kind of counter electrodes was also used in Papers 2 and 3, but in thesecases rather for the convenience of using reproducible counter electrodes.Since the Pt loadings in Papers 2 and 3 were higher, there was lees need forlowering hydrogen during the ORR measurements.
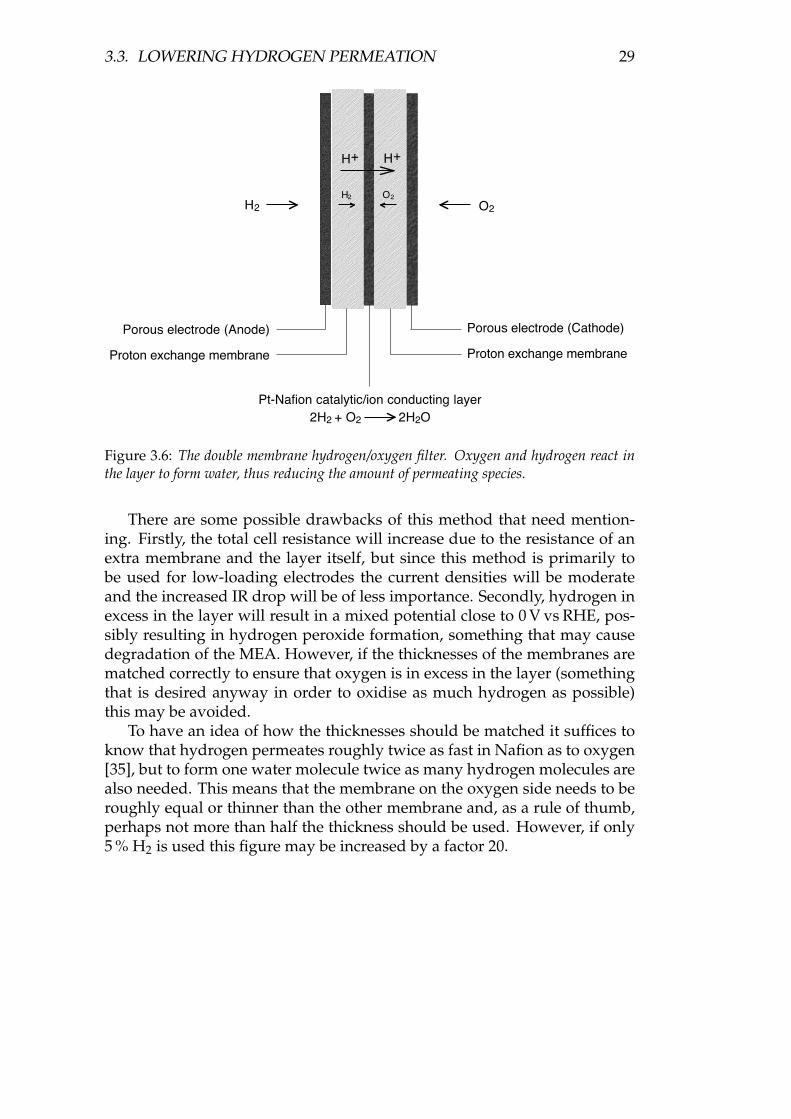
3.3. LOWERING HYDROGEN PERMEATION 29
Pt-Nafion catalytic/ion conducting layer2H2 + O2 2H2O
H2 O2
Porous electrode (Anode)
Proton exchange membrane
Porous electrode (Cathode)
Proton exchange membrane
H+
H2 O2
H+
Figure 3.6: The double membrane hydrogen/oxygen filter. Oxygen and hydrogen react inthe layer to form water, thus reducing the amount of permeating species.
There are some possible drawbacks of this method that need mention-ing. Firstly, the total cell resistance will increase due to the resistance of anextra membrane and the layer itself, but since this method is primarily tobe used for low-loading electrodes the current densities will be moderateand the increased IR drop will be of less importance. Secondly, hydrogen inexcess in the layer will result in a mixed potential close to 0 V vs RHE, pos-sibly resulting in hydrogen peroxide formation, something that may causedegradation of the MEA. However, if the thicknesses of the membranes arematched correctly to ensure that oxygen is in excess in the layer (somethingthat is desired anyway in order to oxidise as much hydrogen as possible)this may be avoided.
To have an idea of how the thicknesses should be matched it suffices toknow that hydrogen permeates roughly twice as fast in Nafion as to oxygen[35], but to form one water molecule twice as many hydrogen molecules arealso needed. This means that the membrane on the oxygen side needs to beroughly equal or thinner than the other membrane and, as a rule of thumb,perhaps not more than half the thickness should be used. However, if only5 % H2 is used this figure may be increased by a factor 20.

30 CHAPTER 3. EXPERIMENTAL
Chapter 4
Results and Discussion
4.1 Catalyst evaluation in porous electrodes
4.1.1 Various Pt/Vulcan catalysts and a novel support
In Paper 1 the fuel cell performance of a number of different Pt catalysts wastested. The Pt catalyst particles were synthesised by two different methods,either microemulsion or direct impregnation. The carbon support was gen-erally Vulcan, but also a novel mesoporous carbon support was evaluated.All electrodes were made using the spraying method. In short, the followingconclusions could be drawn:
• Using two different synthesis methods it was indeed possible to reachlevels similar, and superior, to the performance of a commercial cata-lyst.
• The best catalyst, synthesised by the microemulsion method, reached0.21 gPt/kW. A deepened discussion on this figure, comparing with theresults of Paper 3 is to be found in Section 4.4.
• The microemulsion produced catalysts with higher activity than thedirect emulsion method, something that was to be expected since theformer is supposed to result in smaller catalyst particles (with a higherspecific surface area) of a more homogeneous size distribution.
• Using the same synthesis method for the catalyst, but depositing onthe mesoporous carbon support, gave much lower performance.
• The mesoporous carbon support showed not only much lower perfor-mance, but also much higher cell resistance.
Due to the lack of cyclic voltammetry measurements in inert gas and post-testing morphological characterisation, deeper conclusions from the studywere not possible to draw. The polarisation plots had somewhat differentlocal Tafel slopes for different samples, something that could be due to fun-damental differences between the catalysts. However, it has to be mentioned
31
32 CHAPTER 4. RESULTS AND DISCUSSION
that the lower sweep limit depended on current rather than potential, result-ing in different potential sweep windows for the samples. Also, the open cir-cuit time before starting the sweeps at 1.05 V was not rigorously controlledeither, something that may have resulted in different Pt-oxide coverages atthe start of the sweeps.
The inferior performance of the mesoporous carbon support is hard tocomment on further since the ink recipe was not optimised in any way forthis catalyst. The large cell resistance indicates possible bad percolation of ei-ther the Nafion or the carbon phase within the electrode structure. However,it seems less likely that the ten-fold lower mass activity could be remediedby ink optimisation only, this may simply not be a good catalyst supportmaterial.
4.1.2 Pt/C catalysts by the Phase Transfer Method
Using the experience from Paper 1 the catalyst testing methodology wasimproved to include cyclic voltammetry in inert gas and post-testing mor-phological evaluation. Therefore Paper 2 presents, from an electrochemicalpoint of view, a more rigorous investigation of a new set of catalysts. In ad-dition the pipette method was used for electrode preparation, and the celltemperature was raised to 80 ◦C. A number of different Pt/Vulcan catalysts,synthesised by the Phase Transfer Method (PTM), were tested. The initialidea was to try to see differences in catalytic activity depending on the cat-alyst particle size, since the initial TEM characterisation of these catalystsshowed different mean particle sizes, with quite homogeneous size distri-butions. However, after performing the electrochemical measurements andthe post testing TEM characterisation of the electrodes, the following con-clusions could be drawn:
• All samples showed, normalised as to Pt mass, almost identical activityfor oxygen reduction, with identical Tafel slopes in the whole potentialwindow.
• All samples (except one) had similar (∼30 m2/gPt) electrochemical sur-face areas, evaluated from the CVs in N2.
• Post testing TEM pictures showed that all particles had grown to sim-ilar particle sizes (within the same error margins) .
Even though it was not possible to study the size dependence on ORR due tothe particle growth, the study showed that the pipette method, and that themethodology as a whole, including cyclic voltammetry in N2, was workingfor Pt/C catalyst evaluation. It was also quite astonishing to discover thatthe sintering of the sub-3 nm Pt particles occurred so swiftly, in only a fewhours time without extensive cycling above 1 V vs RHE. Increasing the ad-hesion of the Pt particles to the carbon support could possibly increase thecorrosion resistance.
4.2. MODEL CATALYSTS ON GLASSY CARBON 33
4.1.3 Pt oxides on Vulcan
In Paper 3 the same methodology as in Paper 2 was used to evaluate theactivity of two Pt-oxide samples: Sr3NiPtO6 and Sr3CuPtO6, deposited onVulcan. Promisingly high activity for the ORR had been reported previ-ously for Sr3NiPtO6 in H2SO4 at room temperature, and the main purposeof the study was to confirm the activity of this catalyst also in the PEMFC.Once again a commercial Pt/C catalyst was used to benchmark the novelcatalysts, to summarise the results:
• The CVs in N2 of the oxides resembled to a large extent those of purePt/C, in the case of Sr3NiPtO6, the CV could be interpreted as Pt/Cwith one tenth of the Pt area of the commercial benchmark, when nor-malised to Pt mass. For the Sr3CuPtO6 sample the H peaks were toosmall to be evaluated.
• The oxygen reduction polarisation plots showed about one tenth ofthe mass activity of Pt for Sr3NiPtO6 compared to Pt/C. For Sr3NiPtO6currents were much lower.
• Post-testing characterisation by XRD (X-ray diffraction) of the elec-trodes showed that both samples had disintegrated to Pt/C during thefuel cell experiments.
I.e., in short, the samples showed some activity, but it was all due to purePt, stemming from the decomposed Pt-oxides. However, the robustness ofthe methodology was once again demonstrated. The study also is a goodexample of why real fuel cell experiments, in combination with post-testingcharacterisation methods, are important when performing PEMFC catalystresearch.
4.2 Evaluation of model catalysts on glassy carbon
Using the novel cell setup for planar electrode evaluation, the electrocat-alytic properties of a homogeneous Pt film and nm Pt disks on glassy carbonwere evaluated and compared in Paper 4. The prime result was the demon-stration of the measurement setup itself — comparing the electrochemicaldata of the catalysts regarding activity and active area they correspond wellto ex-situ morphological data. However, some interesting features werefound:
• The electrochemically active area of the Pt/Nafion interface seems notto be altered when varying the humidity, something that one mighthave believed, since the hydrophilic, proton-conducting regions of theNafion membrane surface have been found to increase with humidityin other studies.
• The (local) Tafel slope of the oxygen reduction curves increases whenthe humidity is lowered, and the activity goes down.
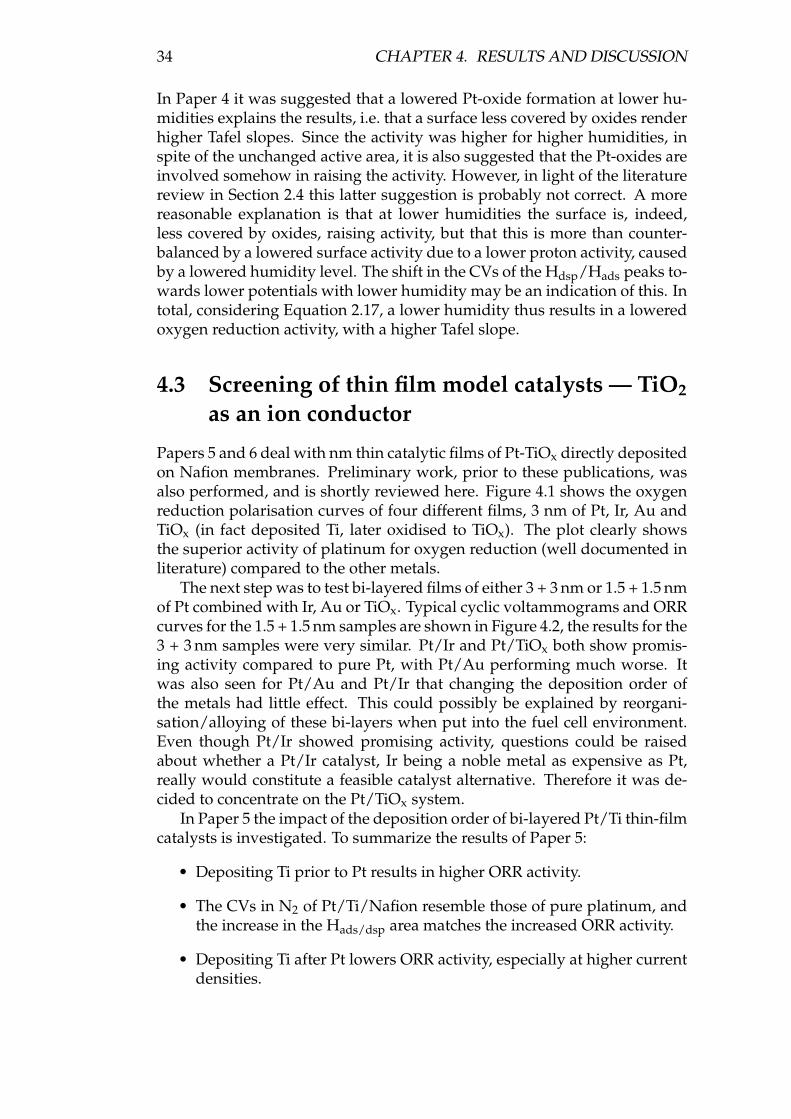
34 CHAPTER 4. RESULTS AND DISCUSSION
In Paper 4 it was suggested that a lowered Pt-oxide formation at lower hu-midities explains the results, i.e. that a surface less covered by oxides renderhigher Tafel slopes. Since the activity was higher for higher humidities, inspite of the unchanged active area, it is also suggested that the Pt-oxides areinvolved somehow in raising the activity. However, in light of the literaturereview in Section 2.4 this latter suggestion is probably not correct. A morereasonable explanation is that at lower humidities the surface is, indeed,less covered by oxides, raising activity, but that this is more than counter-balanced by a lowered surface activity due to a lower proton activity, causedby a lowered humidity level. The shift in the CVs of the Hdsp/Hads peaks to-wards lower potentials with lower humidity may be an indication of this. Intotal, considering Equation 2.17, a lower humidity thus results in a loweredoxygen reduction activity, with a higher Tafel slope.
4.3 Screening of thin film model catalysts — TiO2
as an ion conductor
Papers 5 and 6 deal with nm thin catalytic films of Pt-TiOx directly depositedon Nafion membranes. Preliminary work, prior to these publications, wasalso performed, and is shortly reviewed here. Figure 4.1 shows the oxygenreduction polarisation curves of four different films, 3 nm of Pt, Ir, Au andTiOx (in fact deposited Ti, later oxidised to TiOx). The plot clearly showsthe superior activity of platinum for oxygen reduction (well documented inliterature) compared to the other metals.
The next step was to test bi-layered films of either 3 + 3 nm or 1.5 + 1.5 nmof Pt combined with Ir, Au or TiOx. Typical cyclic voltammograms and ORRcurves for the 1.5 + 1.5 nm samples are shown in Figure 4.2, the results for the3 + 3 nm samples were very similar. Pt/Ir and Pt/TiOx both show promis-ing activity compared to pure Pt, with Pt/Au performing much worse. Itwas also seen for Pt/Au and Pt/Ir that changing the deposition order ofthe metals had little effect. This could possibly be explained by reorgani-sation/alloying of these bi-layers when put into the fuel cell environment.Even though Pt/Ir showed promising activity, questions could be raisedabout whether a Pt/Ir catalyst, Ir being a noble metal as expensive as Pt,really would constitute a feasible catalyst alternative. Therefore it was de-cided to concentrate on the Pt/TiOx system.
In Paper 5 the impact of the deposition order of bi-layered Pt/Ti thin-filmcatalysts is investigated. To summarize the results of Paper 5:
• Depositing Ti prior to Pt results in higher ORR activity.
• The CVs in N2 of Pt/Ti/Nafion resemble those of pure platinum, andthe increase in the Hads/dsp area matches the increased ORR activity.
• Depositing Ti after Pt lowers ORR activity, especially at higher currentdensities.
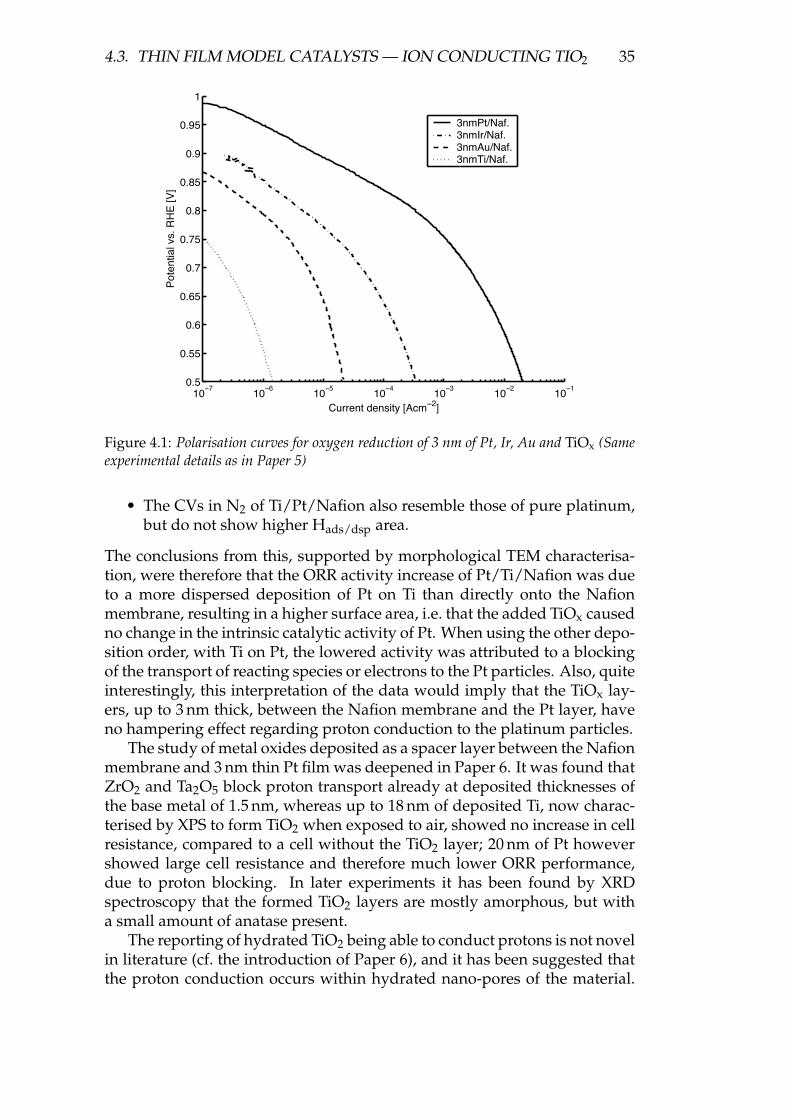
4.3. THIN FILM MODEL CATALYSTS — ION CONDUCTING TIO2 35
10−7
10−6
10−5
10−4
10−3
10−2
10−1
0.5
0.55
0.6
0.65
0.7
0.75
0.8
0.85
0.9
0.95
1
Pot
entia
l vs.
RH
E [V
]
Current density [Acm−2]
3nmPt/Naf.3nmIr/Naf.3nmAu/Naf.3nmTi/Naf.
Figure 4.1: Polarisation curves for oxygen reduction of 3 nm of Pt, Ir, Au and TiOx (Sameexperimental details as in Paper 5)
• The CVs in N2 of Ti/Pt/Nafion also resemble those of pure platinum,but do not show higher Hads/dsp area.
The conclusions from this, supported by morphological TEM characterisa-tion, were therefore that the ORR activity increase of Pt/Ti/Nafion was dueto a more dispersed deposition of Pt on Ti than directly onto the Nafionmembrane, resulting in a higher surface area, i.e. that the added TiOx causedno change in the intrinsic catalytic activity of Pt. When using the other depo-sition order, with Ti on Pt, the lowered activity was attributed to a blockingof the transport of reacting species or electrons to the Pt particles. Also, quiteinterestingly, this interpretation of the data would imply that the TiOx lay-ers, up to 3 nm thick, between the Nafion membrane and the Pt layer, haveno hampering effect regarding proton conduction to the platinum particles.
The study of metal oxides deposited as a spacer layer between the Nafionmembrane and 3 nm thin Pt film was deepened in Paper 6. It was found thatZrO2 and Ta2O5 block proton transport already at deposited thicknesses ofthe base metal of 1.5 nm, whereas up to 18 nm of deposited Ti, now charac-terised by XPS to form TiO2 when exposed to air, showed no increase in cellresistance, compared to a cell without the TiO2 layer; 20 nm of Pt howevershowed large cell resistance and therefore much lower ORR performance,due to proton blocking. In later experiments it has been found by XRDspectroscopy that the formed TiO2 layers are mostly amorphous, but witha small amount of anatase present.
The reporting of hydrated TiO2 being able to conduct protons is not novelin literature (cf. the introduction of Paper 6), and it has been suggested thatthe proton conduction occurs within hydrated nano-pores of the material.
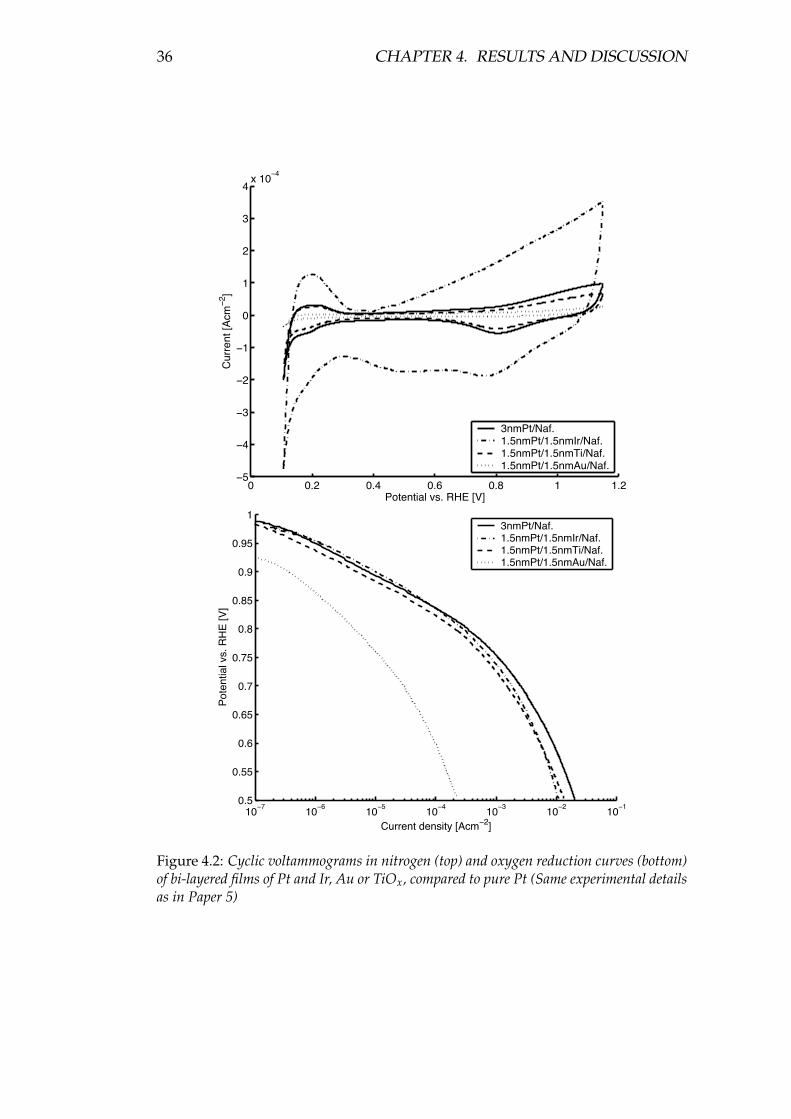
36 CHAPTER 4. RESULTS AND DISCUSSION
0 0.2 0.4 0.6 0.8 1 1.2−5
−4
−3
−2
−1
0
1
2
3
4x 10
−4
Potential vs. RHE [V]
Cur
rent
[Acm
−2 ]
3nmPt/Naf.1.5nmPt/1.5nmIr/Naf.1.5nmPt/1.5nmTi/Naf.1.5nmPt/1.5nmAu/Naf.
10−7
10−6
10−5
10−4
10−3
10−2
10−1
0.5
0.55
0.6
0.65
0.7
0.75
0.8
0.85
0.9
0.95
1
Pot
entia
l vs.
RH
E [V
]
Current density [Acm−2]
3nmPt/Naf.1.5nmPt/1.5nmIr/Naf.1.5nmPt/1.5nmTi/Naf.1.5nmPt/1.5nmAu/Naf.
Figure 4.2: Cyclic voltammograms in nitrogen (top) and oxygen reduction curves (bottom)of bi-layered films of Pt and Ir, Au or TiOx, compared to pure Pt (Same experimental detailsas in Paper 5)
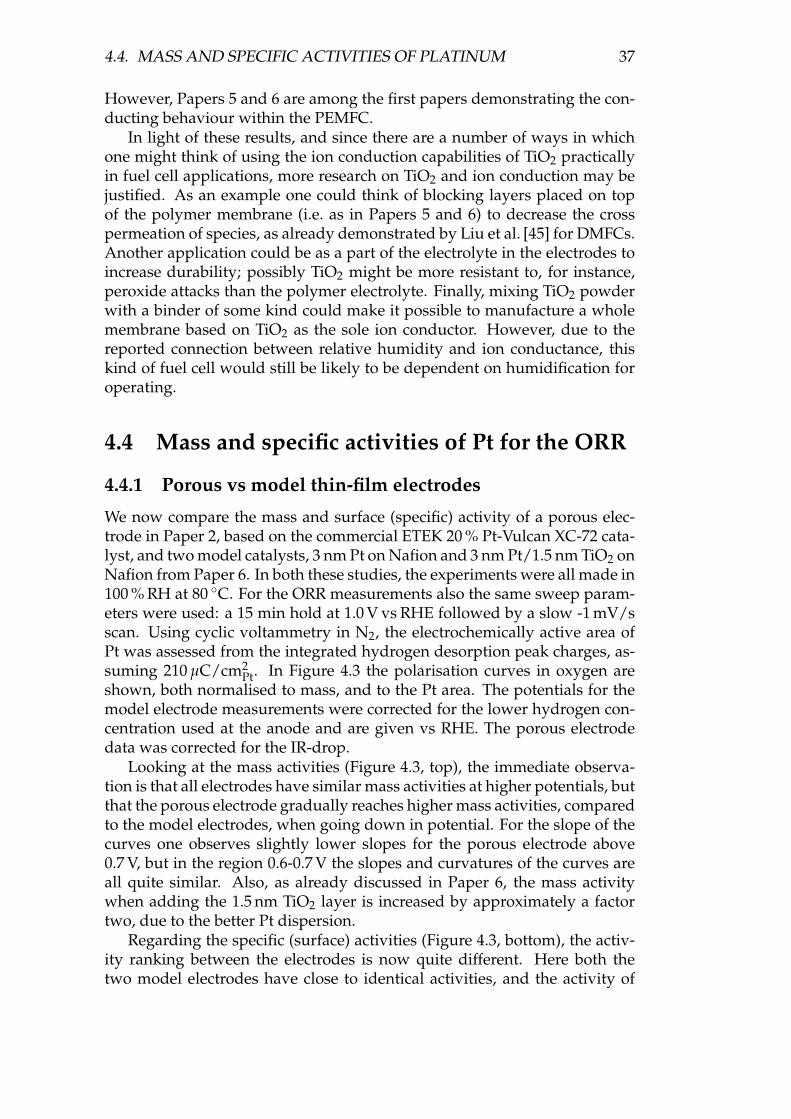
4.4. MASS AND SPECIFIC ACTIVITIES OF PLATINUM 37
However, Papers 5 and 6 are among the first papers demonstrating the con-ducting behaviour within the PEMFC.
In light of these results, and since there are a number of ways in whichone might think of using the ion conduction capabilities of TiO2 practicallyin fuel cell applications, more research on TiO2 and ion conduction may bejustified. As an example one could think of blocking layers placed on topof the polymer membrane (i.e. as in Papers 5 and 6) to decrease the crosspermeation of species, as already demonstrated by Liu et al. [45] for DMFCs.Another application could be as a part of the electrolyte in the electrodes toincrease durability; possibly TiO2 might be more resistant to, for instance,peroxide attacks than the polymer electrolyte. Finally, mixing TiO2 powderwith a binder of some kind could make it possible to manufacture a wholemembrane based on TiO2 as the sole ion conductor. However, due to thereported connection between relative humidity and ion conductance, thiskind of fuel cell would still be likely to be dependent on humidification foroperating.
4.4 Mass and specific activities of Pt for the ORR
4.4.1 Porous vs model thin-film electrodes
We now compare the mass and surface (specific) activity of a porous elec-trode in Paper 2, based on the commercial ETEK 20 % Pt-Vulcan XC-72 cata-lyst, and two model catalysts, 3 nm Pt on Nafion and 3 nm Pt/1.5 nm TiO2 onNafion from Paper 6. In both these studies, the experiments were all made in100 % RH at 80 ◦C. For the ORR measurements also the same sweep param-eters were used: a 15 min hold at 1.0 V vs RHE followed by a slow -1 mV/sscan. Using cyclic voltammetry in N2, the electrochemically active area ofPt was assessed from the integrated hydrogen desorption peak charges, as-suming 210 µC/cm2
Pt. In Figure 4.3 the polarisation curves in oxygen areshown, both normalised to mass, and to the Pt area. The potentials for themodel electrode measurements were corrected for the lower hydrogen con-centration used at the anode and are given vs RHE. The porous electrodedata was corrected for the IR-drop.
Looking at the mass activities (Figure 4.3, top), the immediate observa-tion is that all electrodes have similar mass activities at higher potentials, butthat the porous electrode gradually reaches higher mass activities, comparedto the model electrodes, when going down in potential. For the slope of thecurves one observes slightly lower slopes for the porous electrode above0.7 V, but in the region 0.6-0.7 V the slopes and curvatures of the curves areall quite similar. Also, as already discussed in Paper 6, the mass activitywhen adding the 1.5 nm TiO2 layer is increased by approximately a factortwo, due to the better Pt dispersion.
Regarding the specific (surface) activities (Figure 4.3, bottom), the activ-ity ranking between the electrodes is now quite different. Here both thetwo model electrodes have close to identical activities, and the activity of
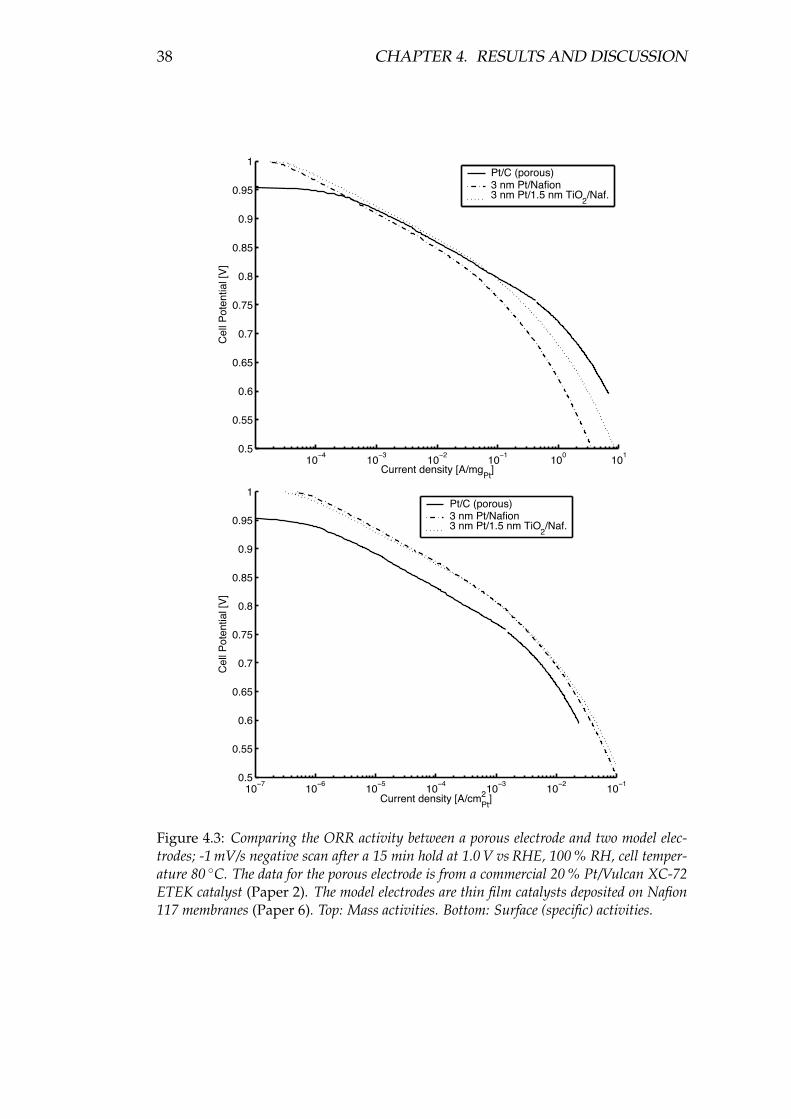
38 CHAPTER 4. RESULTS AND DISCUSSION
10−4
10−3
10−2
10−1
100
101
0.5
0.55
0.6
0.65
0.7
0.75
0.8
0.85
0.9
0.95
1
Cel
l Pot
entia
l [V
]
Current density [A/mgPt
]
Pt/C (porous)3 nm Pt/Nafion3 nm Pt/1.5 nm TiO
2/Naf.
10−7
10−6
10−5
10−4
10−3
10−2
10−1
0.5
0.55
0.6
0.65
0.7
0.75
0.8
0.85
0.9
0.95
1
Cel
l Pot
entia
l [V
]
Current density [A/cm2Pt
]
Pt/C (porous)3 nm Pt/Nafion3 nm Pt/1.5 nm TiO
2/Naf.
Figure 4.3: Comparing the ORR activity between a porous electrode and two model elec-trodes; -1 mV/s negative scan after a 15 min hold at 1.0 V vs RHE, 100 % RH, cell temper-ature 80 ◦C. The data for the porous electrode is from a commercial 20 % Pt/Vulcan XC-72ETEK catalyst (Paper 2). The model electrodes are thin film catalysts deposited on Nafion117 membranes (Paper 6). Top: Mass activities. Bottom: Surface (specific) activities.
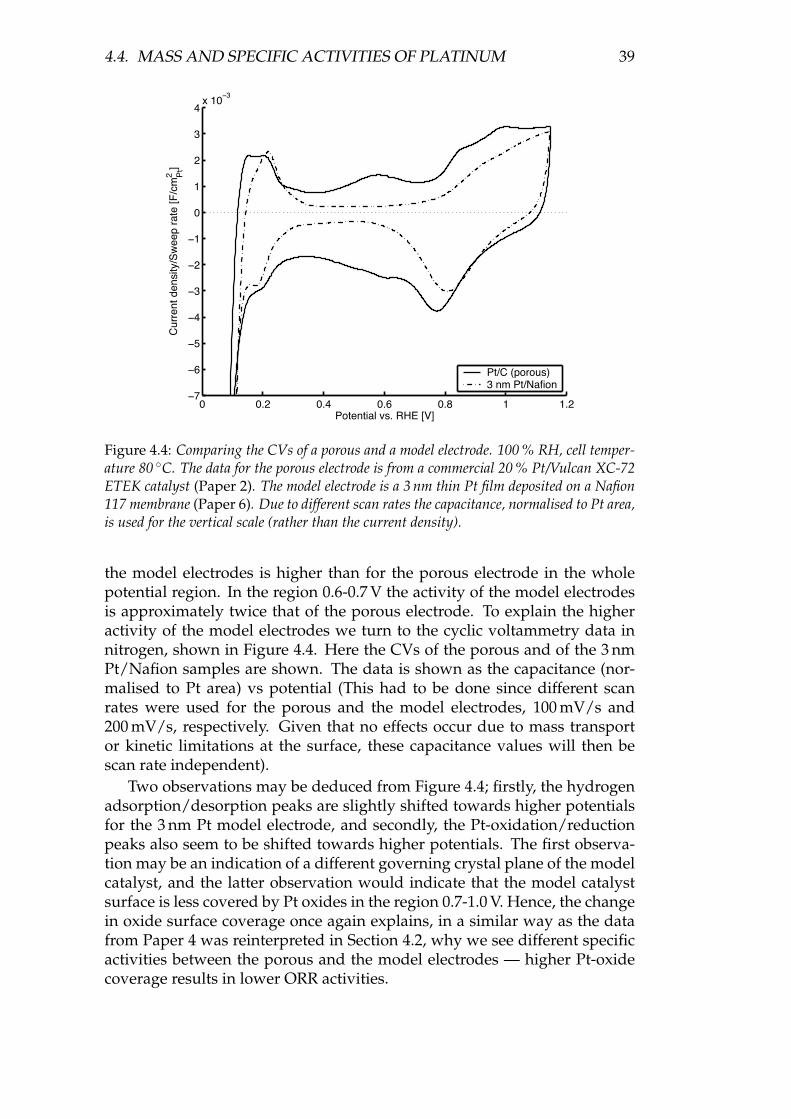
4.4. MASS AND SPECIFIC ACTIVITIES OF PLATINUM 39
0 0.2 0.4 0.6 0.8 1 1.2−7
−6
−5
−4
−3
−2
−1
0
1
2
3
4x 10
−3
Potential vs. RHE [V]
Cur
rent
den
sity
/Sw
eep
rate
[F/c
m2 P
t]
Pt/C (porous)3 nm Pt/Nafion
Figure 4.4: Comparing the CVs of a porous and a model electrode. 100 % RH, cell temper-ature 80 ◦C. The data for the porous electrode is from a commercial 20 % Pt/Vulcan XC-72ETEK catalyst (Paper 2). The model electrode is a 3 nm thin Pt film deposited on a Nafion117 membrane (Paper 6). Due to different scan rates the capacitance, normalised to Pt area,is used for the vertical scale (rather than the current density).
the model electrodes is higher than for the porous electrode in the wholepotential region. In the region 0.6-0.7 V the activity of the model electrodesis approximately twice that of the porous electrode. To explain the higheractivity of the model electrodes we turn to the cyclic voltammetry data innitrogen, shown in Figure 4.4. Here the CVs of the porous and of the 3 nmPt/Nafion samples are shown. The data is shown as the capacitance (nor-malised to Pt area) vs potential (This had to be done since different scanrates were used for the porous and the model electrodes, 100 mV/s and200 mV/s, respectively. Given that no effects occur due to mass transportor kinetic limitations at the surface, these capacitance values will then bescan rate independent).
Two observations may be deduced from Figure 4.4; firstly, the hydrogenadsorption/desorption peaks are slightly shifted towards higher potentialsfor the 3 nm Pt model electrode, and secondly, the Pt-oxidation/reductionpeaks also seem to be shifted towards higher potentials. The first observa-tion may be an indication of a different governing crystal plane of the modelcatalyst, and the latter observation would indicate that the model catalystsurface is less covered by Pt oxides in the region 0.7-1.0 V. Hence, the changein oxide surface coverage once again explains, in a similar way as the datafrom Paper 4 was reinterpreted in Section 4.2, why we see different specificactivities between the porous and the model electrodes — higher Pt-oxidecoverage results in lower ORR activities.
40 CHAPTER 4. RESULTS AND DISCUSSION
The reason for the change in Pt-oxide formation and a possibly differ-ent governing crystal plane are probably due to morphological differencesbetween the samples, the Pt catalyst in the porous electrode is shaped into∼4 nm sized crystallites (Paper 2), whereas, according to the TEM character-isation in Paper 6, the Pt catalyst in the 3 nm model electrode are more tobe seen as (roughly) 5-10 nm “flakes”, 3 nm thick, (at least prior to the elec-trochemical measurements). As mentioned in Section 2.4, larger Pt particlesare known to show higher specific activity.
Regarding the similar curvature of the Tafel plots in the region 0.6-0.7 V(Figure 4.3) observed for all electrodes, these may be interpreted as the “real”kinetics of an essentially bare platinum surface in each case, i.e. assumingΘad to be close to zero in Equation 2.17. The bend of the curve could how-ever also be interpreted as an onset where mass transport limitations start tooccur, even though the geometric current densities differ by more than oneorder of magnitude between the two electrode types. However, even in thiscase it is unlikely that it would be possible to construct an electrode structurewith much better mass transport properties than those of the model elec-trodes. Hence it should be possible to use these observed current densitiesas a measure for an upper boundary for the catalytic activity of nm sized Ptparticles for ORR in the 0.6-0.7 V region, since specific currents higher thanthis will be hard to surpass using catalysts based on solely Pt.
4.4.2 Pt-usage demands for the ORR in the PEMFC – Howmuch is needed?
As mentioned in Section 2.2.1, a frequently mentioned goal for the platinumusage in fuel cell vehicles is 0.2 gPt/kW at 0.65 V cell voltage [2]. The exactfigure may of course be discussed, but a Pt usage much higher than thiswill definitely be problematic for the introduction of the PEMFC technologyin vehicle traction applications. Comparing with our results we see thatthe mass activity for the porous electrodes in Figure 4.3 (and Paper 2) isfound to be 3.4 A/mgPt at 0.65 V, which corresponds to 0.45 gPt/kW. Thismeans that even though not assuming any other energy losses but the ORRkinetics, and no Pt usage at the anode, it would still be desirable to morethan double the mass activity of the catalysts of Paper 2. Since we observedan almost doubled specific activity for the model catalyst in Figure 4.3 ajustified question is: Could the cited Pt usage goal for traction PEMFCs bereached using these more active model catalyst surfaces instead?
To answer that question we start by making the calculation looking atthe surface activity. The specific activity of the 3 nm Pt/Nafion sample is0.02 A/cm2
Pt at 0.65 V. To then meet the Pt usage goal this figure implies thatthe surface area of such a Pt catalyst needs to reach almost 40 m2/gPt, whichwould correspond to 3.5 nm spherical Pt particles (assuming the bulk den-sity of Pt of 21.3 g/cm3) with a 100 % wetting of the catalyst surface by theelectrolyte. However, a grain size of 3.5 nm for the Pt crystallites is smallerthan the Pt-grain size found in Paper 2, which was already found to have
4.4. MASS AND SPECIFIC ACTIVITIES OF PLATINUM 41
lower specific activity than the model catalyst. A catalyst with an even lowergrain size may render even lower specific activities, due to the particle sizeeffect. I.e. the answer to the question is: Not likely (unless the inner core ofthe particles are made of something else than platinum).
It should be stressed, however, that making extrapolations of this kindtowards smaller nm-shaped particles may be hazardous. As an example itsuffices to mention Paper 1, where actually a higher mass activity is foundfor the same ETEK catalyst than in Paper 2, and for the best catalyst (KAT04)0.21 gPt/kW is reached. The less accurate control of the actual loading dur-ing the electrode manufacturing process (spray painting instead of pipet-ting) could be a reason for this, underestimating the actual loading, anotherreason could be the slightly higher humidification saturation in Paper 1 – acell temperature of 60 ◦C with a humidification temperature of 65 ◦C com-pared to 80 ◦C and 81 ◦C, respectively, in Paper 2 (The level of humidifi-cation has a strong influence on the ORR kinetics, as seen in, for instance,Paper 4.). However, the lower operating temperature, 60 ◦C, and the lessharsh testing protocol, avoiding potential cycling above 1 V vs RHE, are alsolikely to result in less sintering of the particles in the electrochemical envi-ronment, rendering smaller particles and larger surface area during the ORRexperiments. But, as mentioned before, the lack of post-characterisation andsurface assessment data in Paper 1 make further conclusions regarding par-ticle morphology hard to draw from this study; more experiments would beneeded in order to determine the true cause of the different mass activities.One observation however, is that in Paper 2 no large changes in areas forthe Hads/Hdsp peaks occurred when performing the first round of 50 cyclicvoltammetry scans in N2 before the ORR measurements, but when compar-ing with CVs after the ORR measurements the surface areas seemed to havedecreased slightly. Since (roughly) the same potential region was used forthe ORR measurements in both Paper 1 and Paper 2, this indicates that ifthe lowered mass activity were due to a more severe Pt-particle sinteringthis may have been caused rather by the higher temperature than the poten-tial cycling.
One may always argue regarding what testing protocol to use when test-ing catalysts. The goal of Paper 1 was to test a number of depositing tech-niques in order to see whether we could match the activity of a commercialcatalyst, hence the testing protocol was kept simple using only slow scanvoltammetry in oxygen below the OCP. In Paper 2 the initial goal was toinvestigate possible size effects of Pt/C catalysts, and for this CV data in ni-trogen was necessary. In addition, the increased number of potential cyclesin Paper 2 could render a better prediction regarding the long-term perfor-mance of the catalysts, simulating an elevated number of starts and stops.The higher temperature of 80 ◦C is also a more likely operating temperaturefor a fuel cell in transport applications.
In conclusion, the above discussion indicates that reaching the exact fig-ure for the platinum usage target of 0.2 gPt/kW at 0.65 V for Nafion-basedsystems at 100 % RH, using pure nm-shaped platinum catalysts solely, will

42 CHAPTER 4. RESULTS AND DISCUSSION
be challenging. At 60 ◦C the goal may be within reach regarding initialperformance, but for long-term performance, including an elevated num-ber of starts and stops, it may be harder to achieve, especially at highertemperatures. However, it is possible that higher platinum loadings in therange of 0.5 gPt/kW could be acceptable for transport applications with highdemands regarding lower particle emissions, noise and fuel consumption(taxis could be one example). Also, there is a vast amount of literature on Pt-alloys, such as Pt-Co and Pt-Ni, reporting to render mass activity increases ofPt in the range of 2-3 times (cf. Section 2.4.2). Given that low Pt-mass MEAsare also proven to be durable during long-term operation, mass productionof hydrogen fuelled PEMFC vehicles may one day become a reality.
Chapter 5
Conclusions
Within the scope of this thesis a number of techniques have been developedin order to investigate catalytic activity at the cathode of the PEMFC. It hasbeen demonstrated how both carbon-supported catalysts, as well as modelcatalysts on planar surfaces or directly deposited on Nafion membranes,may be evaluated directly in the PEMFC environment.
In the porous electrode studies it was seen that different mass activitiesmay arise in the PEMFC for different operating conditions, even though thesame catalyst is used. For 60 ◦C and over-saturated humidity conditions,mass activities close to 0.2 gPt/kW at potentials above 0.65 V were seen inPaper 1, whereas less than half that activity could be seen at 80 ◦C in Paper 2,even for the same commercial benchmark catalyst. A conclusion from thisis that one should be very careful when comparing mass activities from dif-ferent studies in literature, especially when operating conditions and mea-surement protocols differ. It also clearly justifies catalyst research in the trueoperating PEMFC environment, since it seems that making interpolationsfrom activity measurements at lower temperatures may be very hazardous.Paper 3 stands as an example of this, the decomposition of the promisingSr3NiPtO6 was not reported in the literature that originally motivated thisstudy.
In continuation it has also been shown that fundamental catalyst researchusing model electrodes in the PEMFC environment is motivated and maygive valuable insights into the ORR in the PEMFC. The results of Paper 4,where it was seen, using planar model electrodes on glassy carbon, that thehumidity has a considerable effect on the ORR kinetics, is one such exam-ple. Even though the kinetic effect found, i.e. that the Tafel slopes becomesteeper and the activity decreases when the humidity level of the inlet gasesdecreases, had been reported previously in literature, Paper 4 showed thatthe lower activity was not due to a considerable change in the active Pt sur-face area.
Depositing nm-thick films directly on polymer electrolyte membranesturned out to constitute an interesting model system for fuel cell research.Using bi-layered nm-thick model electrodes deposited directly on Nafion,the behaviour of TiO2 and other metal oxides in combination with Pt in thePEMFC environment was investigated in Papers 5 and 6. Interestingly TiO2
43

44 CHAPTER 5. CONCLUSIONS
was shown to conduct protons at a thickness of up to 18 nm of the orig-inally deposited Ti film, whereas using Zr and Ta as base metals blockedproton transport, also thicker layers of Pt (20 nm) rendered a high cell resis-tance. Kinetically however, no intrinsic effect could be seen for the modelelectrodes when adding TiO2.
Finally, comparing the specific (surface) activities, at the same experi-mental conditions, it was seen that the model electrodes directly depositedon Nafion in Paper 6 show higher surface activities than the porous elec-trodes in Paper 2. However, this higher surface activity did not also implyhigher mass activities. The higher specific activity was ascribed to less Pt-oxide formation for the model electrode seen by cyclic voltammetry in inertgas, in turn possibly linked to the Pt-particle morphology and the particle-size effect, i.e. that larger Pt particles generally show higher surface activi-ties.
In conclusion, throughout this work, cyclic voltammetry measurementsin inert gas within the PEMFC, preferably combined with ex-situ character-isation, has been shown to be an indispensable tool for interpreting oxygenreduction activities.

List of Symbols and Constants
Symbol Unit Description[X] mol/dm3 Concentration of species Xax - Activity of species XE V Pontential versus SHE, if nothing else statedi A/m2 Current densityi0 A/m2 Exchange current densityKi (dep. on eq.) Chemical rate constant of a reaction im - Reaction orderPx Pa Partial pressure of species XT K Temperatureαa - Symmetry factor - anodic directionαc - Symmetry factor - cathodic direction
∆G kJ/mol Change in Gibbs free energy of a reaction∆H kJ/mol Change in enthalpy of a reactionη V Overpotential
Θx - Surface coverage of species X
Table 1: Mathematical symbols used throughout the thesis
Constant Value Unit DescriptionR 8.31 J/mol K Molar gas constantF 96485 C/mol Faraday’s constant
Table 2: Symbols for constants used throughout the thesis
45

46 LIST OF SYMBOLS AND CONSTANTS

Bibliography
[1] N. Cunningham, E. Irissou, M. Lefevre, M. C. Denis, D. Guay and J. P. Do-delet. PEMFC anode with very low Pt loadings using pulsed laser deposition.Electrochemical and Solid State Letters, 6(7):A125–A128, 2003.
[2] H. A. Gasteiger, S. S. Kocha, B. Sompalli and F. T. Wagner. Activity benchmarksand requirements for Pt, Pt-alloy and non-Pt oxygen reduction catalysts forPEMFCs. Applied Catalysis B: Environmental, 56(1-2):9–35, 2005.
[3] E. Yeager, J. O’M Bockris, B. E. Conway and S. Sarangapani. ComprehensiveTreatise of Electrochemistry, volume 9, page 24. Plenum Press, New York, 1984.
[4] G. Tremiliosi-Filho, G. Jerkiewicz and B. E. Conway. Characterisation and sig-nificance of the sequence of stages of oxide film formation at platinum gener-ated by strong anodic polarisation. Langmuir, 8:658–667, 1992.
[5] H. Yoshitake, T. Mochizuki, O. Yamazaki and K. Ota. Study of the densityof the d-state and structure transformation of Pt fine particles dispersed oncarbon electrodes by in situ x-ray absorption spectroscopy. Journal of Electroan-alytical Chemistry, 361:229–237, 1993.
[6] James P. Hoare. The kinetics of platinum-oxygen local cells. Journal of theElectrochemical Society, 132(2):301–305, 1985.
[7] S. Mitsushima, S. Kawahara, K. Ota and N. Kamiya. Comsumption rate of Ptunder potential cycling. Journal of the Electrochemical Society, 154(2):B153–B158,2007.
[8] C. H. Paik, G. S. Saloka and G. W. Graham. Influence of cyclic operation onPEM fuel cell catalyst. Electrochemical and Solid State Letters, 10(2):B39–B42,2007.
[9] P. J. Ferreira, G. J. la O’, Y. Shao-Horn, D. Morgan, R. Makharia, S. Kocha,and H.A. Gasteiger. Instability of Pt/C electrocatalysts in proton exchangemembrane fuel cells - a mechanistic investigation. Journal of the ElectrochemicalSociety, 152(11):A2256–A2271, 2005.
[10] S. Mukerjee and S. Srinivasan. Handbook of Fuel Cells - Fundamentals, Technologyand Applications, Vol. 2, Electrocatalysis. John Wiley and Sons, New York, 2003.
[11] J. A. S. Bett, K. Kinoshita and P. Stonehart. Crystallite growth of platinumdispersed on carbon-black - 2 - effect of liquid environment. Journal of Catalysis,41(1):124–133, 1976.
47
48 BIBLIOGRAPHY
[12] M. S. Wilson, F. H. Garzon, K. E. Sickafus and S. Gottesfeld. Surface-area lossof supported platinum in polymer electrolyte fuel cells. Journal of the Electro-chemical Society, 140(10):2872–2877, 1993.
[13] E. Antolini, J. R. C. Salgado and E. R Gonzalez. The stability of Pt–M (M=first row transition metal) alloy catalysts and its effect on the activity in lowtemperature fuel cells - a literature review and tests on a Pt–Co catalyst. Journalof Power Sources, 160:957–968, 2006.
[14] K. Kinoshita. CARBON - Electrochemical and Physicochemical Properties. JohnWiley and Sons, New York, 1988.
[15] S. Mukerjee. Particle size and structural effects in platinum electrocatalysis.Journal of Applied Electrochemistry, 20:537–548, 1990.
[16] L. M. Roen, C. H. Palk and T. D. Jarvi. Electrocatalytic corrosion of carbonsupport in PEMFC cathodes. Electrochemical and Solid State Letters, 7(1):A19–A22, 2004.
[17] D. A. Stevens, M. T. Hicks, G. M. Haugen and J. R. Dahn. Ex situ and insitu stability studies of PEMFC catalysts. Journal of the Electrochemical Society,152(12):A2309–2315, 2005.
[18] Lj. M. Vracar, S. Lj. Gojkovic, N. R. Elezovic, V. R. Radmilovic, M. M. Jaksic andN. V. Krstajic. Magneli phase titanium oxides as catalyst support - electrochem-ical behavior of Ebonex/Pt catalyst. Journal of New Materials for ElectrochemicalSystems, 9(2):99–106, 2006.
[19] James P. Hoare. The Electrochemistry of Oxygen. John Wiley and Sons, NewYork, 1968.
[20] F. el Kadiri, R. Faure and R. Durand. Electrochemical reduction of molecu-lar oxygen on platinum single crystals. Journal of Electroanalytical Chemistry,301:177–187, 1991.
[21] N. M. Markovic, R. R. Adzic, B. D. Cahan and E. B. Yeager. Structural effectsin electrocatalysis: oxygen reduction on platinum low index single-crystal sur-faces in perchloric acid solutions. Journal of Electroanalytical Chemistry, 377:249–259, 1994.
[22] N. M. Markovic, H. A. Gasteiger and P. N. Ross. Oxygen reduction on plat-inum low-index sindex-crystal surfaces in sulfuric acid solution: Rotating-Pt(hkl) disk studies. Journal of Physical Chemistry, 99(11):3411–3415, 1995.
[23] M. D. Maciá, J. M. Campiña, E. Herrero and J. M. Feliu. On the kinetics ofoxygen reduction on platinum stepped surfaces in acidic media. Journal ofElectroanalytical Chemistry, 564:141–150, 2004.
[24] O. Antoine, Y. Bultel and R. Durand. Oxygen reduction reaction kinetics andmechansim on platinum nanoparticles inside Nafion. Journal of ElectroanalyticalChemistry, 499:85–94, 2001.
[25] K. Kinoshita. Particle size effects for oxygen reduction on highly dispersedplatinum in acid electrolytes. Journal of the Electrochemical Society, 137(3):845,1990.
BIBLIOGRAPHY 49
[26] D. B. Sepa, M. V. Vojnovic and A. Damjanovic. Reaction intermediates as a con-trolling factor in the kinetics and mechanism of oxygen reduction at platinumelectrodes. Electrochimica Acta, 26(6):781–793, 1981.
[27] M. M. Ghoneim, S. Clouser and E. Yeager. Oxygen reduction kinetics in deuter-ated phosphoric acid. Journal of the Electrochemical Society, 132(5):1160–1162,1985.
[28] A. Parthasarathy, S. Srinivasan and A. J. Appleby. Pressure dependence ofthe oxygen reduction reaction at the platinum microelectrode/Nafion inter-face: Electrode kinetics and mass transport. Journal of the Electrochemical Society,139(10):2856–2862, 1992.
[29] P. D. Beattie, V. I. Basura and S. Holdcroft. Temperature and pressure depen-dence of O2 reduction at Pt-Nafion 117 and Pt-BAM 407 interfaces. Journal ofElectroanalytical Chemistry, 468:180–182, 1999.
[30] H. Xu, Y. Song, H. R. Kunz and J. M. Fentona. Effect of elevated temperatureand reduced relative humidity on ORR kinetics for PEM fuel cells. Journal ofthe Electrochemical Society, 152(9):A1828–A1836, 2005.
[31] K. C. Neyerlin, W. Gu, J. Jorne and H. A. Gasteiger. Determination of catalystunique parameters for the oxygen reduction reaction in a PEMFC. Journal ofthe Electrochemical Society, 153(10):A1955–A1963, 2006.
[32] P. N. Ross, E. J. Cairns, K. Striebel, F. McLarnon and P. C. Andricacos. The reac-tion order for oxygen reduction in TFMSA on Pt. Electrochimica Acta, 32(2):355–355, 1987.
[33] V. S. Murthi, R. C. Urian and S. Mukerjee. Oxygen reduction kinetics in lowand medium temperature environment: Correlation of water activation andsurface properties in supported Pt and Pt alloy electrocatalysts. Journal of Phys-ical Chemistry B, 108:11011–11023, 2004.
[34] J. Ihonen, F. Jaouen, G. Lindbergh, A. Lundblad and G. Sundholm. Investiga-tion of mass-transport limitations in the solid polymer fuel cell cathode. Journalof the Electrochemical Society, 149(4):A448–A454, 2002.
[35] P. Gode, G. Lindbergh and G. Sundholm. In-situ measurements of gas per-meability in fuel cell membranes using a cylindrical microelectrode. Journal ofElectroanalytical Chemistry, 518:115–122, 2002.
[36] U. A. Paulus, T. J. Schmidt, H. A. Gasteiger and R. J. Behm. Oxygen reductionon a high-surface area Pt/Vulcan carbon catalyst: a thin-film rotating ring-diskelectrode study. Journal of Electroanalytical Chemistry, 495:134–145, 2001.
[37] M. Shao, P. Liu and R. Adzic. Superoxide anion is the intermediate in the oxy-gen reduction reaction on platinum electrodes. Journal of the American ChemicalSociety, 128:7408–7409, 2006.
[38] A. Damjanovic and V. Brusic. Electrode kinetics of oxygen reduction on oxide-free platinum electrodes. Electrochimica Acta, 12:615–628, 1967.
[39] N. M. Markovic and P. N. Ross. Surface science of model fuel cell electrocatal-ysis. Surface Science Reports, 45:117–229, 2002.

50 BIBLIOGRAPHY
[40] W. Schmickler. Interfacial Electrochemistry. Oxford University Press, New York,1996.
[41] B. Wang. Recent development of non-platinum catalysts for oxygen reductionreaction. Journal of Power Sources, 152:1–15, 2005.
[42] S. B. Adler. Reference electrode placement in thin solid electrolytes. Journal ofthe Electrochemical Society, 149(5):E166–E172, 2002.
[43] P. Gode, F. Jaouen, G. Lindbergh, A. Lundblad and G. Sundholm. Influenceof the composition on the structure and electrochemical characteristics of thePEFC cathode. Electrochimica Acta, 48:4175–4187, 2003.
[44] R. O’Hayre and F. B. Prinz. The air/platinum/Nafion triple-phase boundary:Characteristics, scaling and implication for fuel cells. Journal of the Electrochem-ical Society, 151:A756–A762, 2004.
[45] Z. Liu, B. Guo, J. Huang, L. Hong, M. Han and L. Gan. Nano-TiO2-coatedpolymer electrolyte membranes for direct methanol fuel cells. Journal of PowerSources, 157:207–211, 2006.

![fluid & electrolyte therapy 2[1].ppt FluidBasic Fluid--Electrolyte Electrolyte Disorder & Therapy ศ.พญ. สณ รตน คงเสร พงศ ภาคว ชาว สญญ](https://static.fdocument.pub/doc/165x107/5af198a37f8b9ac2468f85d0/fluid-electrolyte-therapy-21-fluidbasic-fluid-electrolyte-electrolyte-disorder.jpg)