European Economic Sustainability Index - EPC · The European Economic Sustainability Index is a...
27
EUROPE’S POLITICAL ECONOMY PROGRAMME ISSN 1782-494X European Economic Sustainability Index June 2010 By Fabian Zuleeg
Transcript of European Economic Sustainability Index - EPC · The European Economic Sustainability Index is a...

EUROPE’S POLITICAL ECONOMYPROGRAMMEISSN 1782-494X
European Economic Sustainability Index
June 2010
By Fabian Zuleeg
4
The EPC’s Programme on Europe’s Political Economy
Taking the steps needed to make the EU a world leader in today’s globalisedeconomy and ensure the sustainability of the European economic and socialmodels form the core of this programme’s activities.
Europe’s ability to create wealth on a sustained and sustainable basis, while at thesame time ensuring employment growth, equitable income distribution and theefficient provision of public services, will depend on the necessary reforms beingintroduced to respond to the challenges of globalisation, the ageing of Europe’spopulation and climate change.
The Lisbon Agenda has provided a good starting point, but Europe needs to looknow at reinvigorating this process to achieve its goal of becoming the world’s mostcompetitive economy.
This programme addresses these issues through a number of fora and task forces. Itengages in, and stimulates, debate on economic policy in general and focuses onspecific issues such as the internal market, innovation, better regulation, energy andlifestyle risks. It also works with other programmes on cross-cutting issues such asthe economic integration of migrants, the EU budget and the Union’s relations withAfrica and Asia.
For details of the EPC’s activities under this programme, please visit our website:www.epc.eu
5
Table of Contents
Executive summary 6
Introduction 8
The EESI for 2010 10
Past performance – the EESI 2007 13
Policy implications 15
Next steps 16
Annexes 17
Endnotes 29
About the author
Fabian Zuleeg is the Chief Economist at the European Policy Centre.
Executive summary
In light of the unprecedented turmoil in the euro-zone and the uncertainty over what the future holds, it isimportant to not only understand the current pressures on public finances but also the medium- to long-termfactors which will affect the economic stability and sustainability of EU countries in future. The long-termcompetitiveness of European economies, their governance and their ability to carry out structural reforms tocope with long-term challenges will all influence whether countries have a sustainable economy in the longrun. This will also determine the success or failure of the euro.
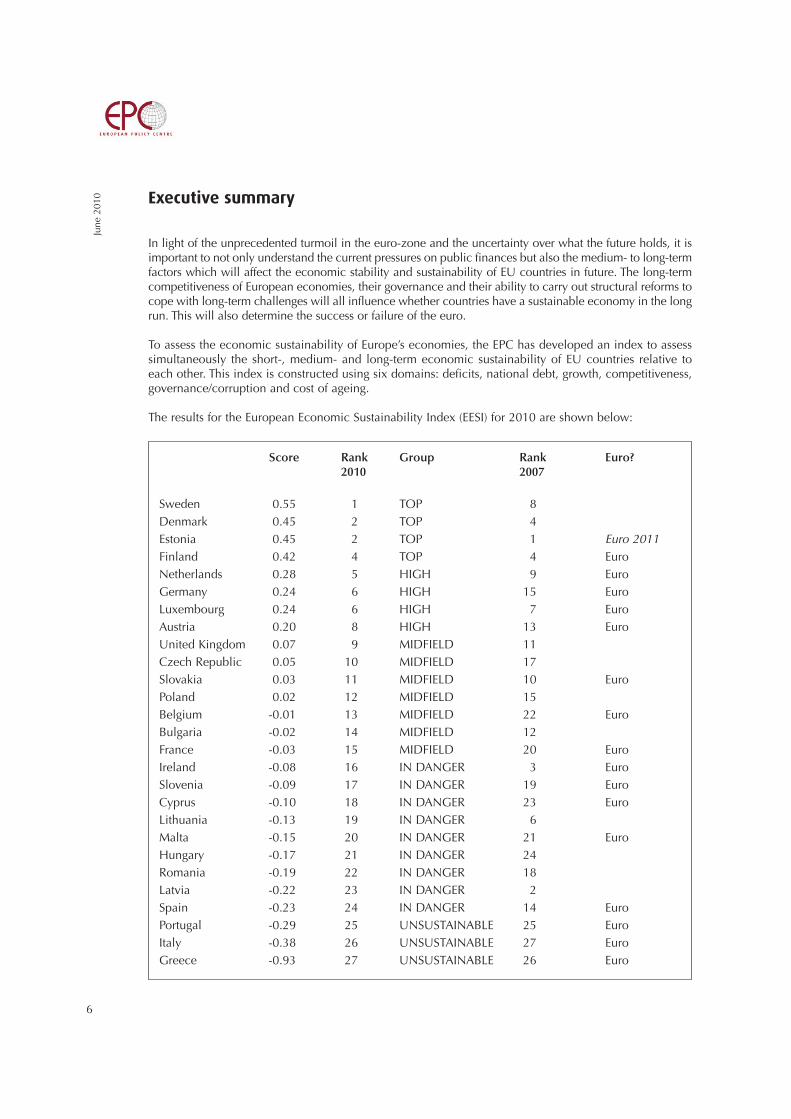
To assess the economic sustainability of Europe’s economies, the EPC has developed an index to assesssimultaneously the short-, medium- and long-term economic sustainability of EU countries relative toeach other. This index is constructed using six domains: deficits, national debt, growth, competitiveness,governance/corruption and cost of ageing.
The results for the European Economic Sustainability Index (EESI) for 2010 are shown below:
June
201
0
6
Score Rank Group Rank Euro?2010 2007
Sweden 0.55 1 TOP 8Denmark 0.45 2 TOP 4Estonia 0.45 2 TOP 1 Euro 2011Finland 0.42 4 TOP 4 EuroNetherlands 0.28 5 HIGH 9 EuroGermany 0.24 6 HIGH 15 EuroLuxembourg 0.24 6 HIGH 7 EuroAustria 0.20 8 HIGH 13 EuroUnited Kingdom 0.07 9 MIDFIELD 11Czech Republic 0.05 10 MIDFIELD 17Slovakia 0.03 11 MIDFIELD 10 EuroPoland 0.02 12 MIDFIELD 15Belgium -0.01 13 MIDFIELD 22 EuroBulgaria -0.02 14 MIDFIELD 12France -0.03 15 MIDFIELD 20 EuroIreland -0.08 16 IN DANGER 3 EuroSlovenia -0.09 17 IN DANGER 19 EuroCyprus -0.10 18 IN DANGER 23 EuroLithuania -0.13 19 IN DANGER 6Malta -0.15 20 IN DANGER 21 EuroHungary -0.17 21 IN DANGER 24Romania -0.19 22 IN DANGER 18Latvia -0.22 23 IN DANGER 2Spain -0.23 24 IN DANGER 14 EuroPortugal -0.29 25 UNSUSTAINABLE 25 EuroItaly -0.38 26 UNSUSTAINABLE 27 EuroGreece -0.93 27 UNSUSTAINABLE 26 Euro
June
201
0
7
At the top of the ranking are the Scandinavian EU Member States with Estonia as the only New MemberState (NMS) in the top group. Northern/central European countries also perform well.
Greece not only comes out bottom, it actually is very close to being the worst performing economy acrossall six domains of the index. Italy also has significant long-term economic sustainability problems andPortugal is also performing badly. Spain is clearly under threat. As is Ireland, but it is doing significantlybetter than the lowest performers.
While outperforming the problem countries of the euro-zone, the NMSs which have required IMF/EUassistance, Hungary, Latvia and Romania, also cluster at the bottom of the ranking.
There appears to be no clear relationship between euro-zone membership and the position in the EESI,indicating that long-term underlying structural factors are more important. While this does not allow afinal assessment of the Stability and Growth Pact, it certainly indicates that the SGP is no guarantor forgood public finances or long-term growth performance.
In comparison to 2007, the Scandinavian countries, countries such as Germany, the Netherlands andAustria, as well as France and Belgium, have all improved relatively, whereas Latvia, Lithuania, Irelandand Spain all lost ground.
The implications of the index are clear: structural reform is necessary in many countries if we wish to avoidfuture crises. In particular, Greece and Italy, as well as Spain, Portugal and the NMS which have receivedEU/IMF assistance, Hungary, Latvia and Romania, must carry out reforms which do not only improve publicfinance, but which also improve governance, competitiveness and productivity and deal effectively withlong-term challenges. Labour market and pension reform, reform of the delivery of public services,improving the business environment and investing in future growth must all play a significant role.
The EPC intends to review the EESI regularly, every Spring when the new Commission forecast is publishedand potentially also when new data becomes available or in light of significant political developments suchas, for example, enlargement or changes to euro-zone membership. This will provide a tool which enablescommentators to chart how economic sustainability develops within the EU over the coming years.
June
201
0
8
Introduction
Europe, and the euro-zone in particular, is living through an unprecedented public finance crisis whichhas led to a currency crisis, with the euro under substantial pressure.
In the euro-zone crisis, much of the focus of markets and commentators has been on public finances.Those euro-zone countries with the highest deficits coupled with high national debt rates have beenparticularly under pressure: Greece and Portugal. Spain and Ireland have also come under pressure, dueto high deficits, but their debt levels started from a much lower level. All of these countries also now sharerelatively low growth rates. Countries with high debt levels but relatively low deficits, such as Belgiumand Italy, have largely escaped attention.
Outside the euro-zone, the countries which have been in difficulties tend to be driven by country-specificfactors: external imbalances featured in all countries but economic mismanagement in Hungary (and as a result the highest debt level among the New Member States), the bursting of a speculative property bubble and a very large deficit in Latvia and concerns over governance in Romania added to the concerns.
So far markets, commentators and policy-makers have focused on the short-term, in particular on thedeficits, low growth rates and the burgeoning public debt, while the medium- to long-term factors beyondgovernment debt which will affect the economic stability and sustainability of EU countries in future havereceived relatively little attention. The long-term competitiveness of European economies, theirgovernance and their ability to carry out structural reforms to cope with long-term challenges such asageing will all influence whether countries have a sustainable economy in the long run.
To help in the assessment of Europe’s prospects, the EPC has developed a European EconomicSustainability Index (EESI).1
The European Economic Sustainability Index
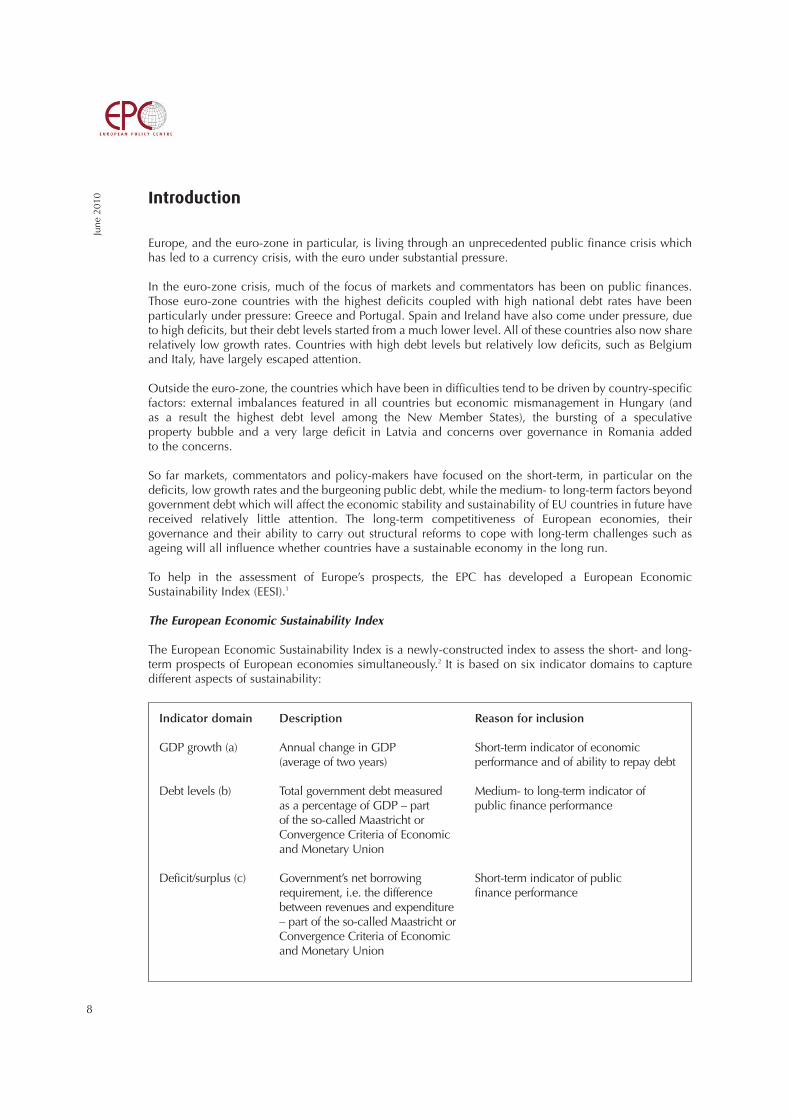
The European Economic Sustainability Index is a newly-constructed index to assess the short- and long-term prospects of European economies simultaneously.2 It is based on six indicator domains to capturedifferent aspects of sustainability:
Indicator domain Description Reason for inclusion
GDP growth (a) Annual change in GDP Short-term indicator of economic (average of two years) performance and of ability to repay debt
Debt levels (b) Total government debt measured Medium- to long-term indicator ofas a percentage of GDP – part public finance performanceof the so-called Maastricht or Convergence Criteria of Economicand Monetary Union
Deficit/surplus (c) Government’s net borrowing Short-term indicator of public requirement, i.e. the difference finance performancebetween revenues and expenditure– part of the so-called Maastricht orConvergence Criteria of Economic and Monetary Union
June
201
0
9
These indicators have been chosen to reflect a balance between short-, medium- and long-term pressureson economic sustainability. They have to be available in all EU Member States and ideally are updatedregularly. They also have to enable a clear ranking i.e. there has to be a clearly identifiable performancescale which enables a ranking from high performance to low performance.3 The choice of indicators isdiscussed in more detail in Annex A.
A country’s relative position to all other EU countries is constructed by summing a relative (unweighted)4
score across all six domains. A relative score can only meaningfully measure distance from each other. Thismeans that there is no possibility of comparing these scores to non-EU countries which have not beenincluded in the index in the first place. The index also does not provide an absolute assessment of theeconomic sustainability of Europe – rather it assesses where EU countries stand in relation to each other.
This provides a score which allows all EU countries to be ranked according to their long-term economicsustainability, and provides a benchmark to understand the underlying position of each country withinthe context of a fast-changing economic environment and significant policy changes.
Global Competitive A composite indicator, capturing Long-term index of competitiveness Index (World microeconomic and macro- and future growth potentialEconomic Forum) (d) economic foundations of
competitiveness, defined “as the set of institutions, policies, and factors that determine the level of productivity of a country. The level of productivity, in turn, sets the sustainable level of prosperity that can be earned by an economy (e)
Corruption “Measures the perceived level of Underlying index of governance/rule Perception Index (f) public-sector corruption in 180 of law and proxy for public (Transparency countries and territories around sector efficiencyInternational) the world. The CPI is a “survey of
surveys”, based on 13 different expert and business surveys” (g)
Future cost of ageing Long-term expenditure projections Very long-term indicator of publiccovering pensions, health care, public finance pressure and proxy long-term care, education and for structural reformunemployment transfers for all Member States (h)
Sources:
(a) http://ec.europa.eu/economy_finance/publications/european_economy/forecasts_en.htm(b) Ibid.(c) Ibid.(d) www.weforum.org/en/initiatives/gcp/Global%20Competitiveness%20Report/index.htm(e) www.weforum.org/en/initiatives/gcp/Global%20Competitiveness%20Report/index.htm (f) www.transparency.org/policy_research/surveys_indices/cpi/2009/cpi_2009_table(g) www.transparency.org/policy_research/surveys_indices/cpi/2009 (h) http://europa.eu/epc/pdf/2009_ageing_report.pdf

June
201
0
10
The EESI for 2010
The EESI has been constructed to take long-term indicators into account. The results for the EESI for 2010are shown below5:
By taking into account the long-term sustainability of European economies, there is a clear pointer of whythe Greek economy is in trouble. Greece not only comes out at the bottom, it actually is very close tobeing the worst performing economy across all six domains (with -1 the lowest possible score).
Portugal is also in trouble. Spain is also clearly under threat and so is Ireland, but it is placed significantlyhigher among the EU countries. Clearly, Italy has significant long-term economic sustainability problems,with only Greece performing worse. Greece, Portugal and Italy all struggle with economic sustainabilityand so does, to a slightly lesser extent, Spain, whereas Ireland does a little better than this group. Theworst performing euro-zone country outside this bottom group is Malta.
Score Rank Group Rank Euro?2010 2007
Sweden 0.55 1 TOP 8Denmark 0.45 2 TOP 4Estonia 0.45 2 TOP 1 Euro 2011Finland 0.42 4 TOP 4 EuroNetherlands 0.28 5 HIGH 9 EuroGermany 0.24 6 HIGH 15 EuroLuxembourg 0.24 6 HIGH 7 EuroAustria 0.20 8 HIGH 13 EuroUnited Kingdom 0.07 9 MIDFIELD 11Czech Republic 0.05 10 MIDFIELD 17Slovakia 0.03 11 MIDFIELD 10 EuroPoland 0.02 12 MIDFIELD 15Belgium -0.01 13 MIDFIELD 22 EuroBulgaria -0.02 14 MIDFIELD 12France -0.03 15 MIDFIELD 20 EuroIreland -0.08 16 IN DANGER 3 EuroSlovenia -0.09 17 IN DANGER 19 EuroCyprus -0.10 18 IN DANGER 23 EuroLithuania -0.13 19 IN DANGER 6Malta -0.15 20 IN DANGER 21 EuroHungary -0.17 21 IN DANGER 24Romania -0.19 22 IN DANGER 18Latvia -0.22 23 IN DANGER 2Spain -0.23 24 IN DANGER 14 EuroPortugal -0.29 25 UNSUSTAINABLE 25 EuroItaly -0.38 26 UNSUSTAINABLE 27 EuroGreece -0.93 27 UNSUSTAINABLE 26 Euro

June
201
0
11
While outperforming the problem countries of the euro-zone, the NMS which have required IMF/EUassistance: Hungary, Latvia and Romania, also cluster at the bottom of the ranking, with Lithuania onlyperforming marginally better.
At the top of the ranking are the Scandinavian EU Member States, Sweden, Denmark and Finland, withEstonia as the only NMS in the top group. The northern/central European countries, Germany,Netherlands, Luxembourg and Austria, also perform well.
The middle part of the ranking is a mixture between old and new Member States. The UK, Belgium,France and Poland are in the upper midfield, with Ireland in the lower midfield. The cases of the UK,Ireland and Belgium show that despite high deficits (UK, Ireland) or high debts (Belgium) countries canstill remain clear of the crisis if there are sufficient factors supporting long-term economic sustainability.
Euro-member states are present throughout the ranking. While they are prominent at the bottom of theranking, they are also represented near the top. Overall, there appears to be no clear relationship betweeneuro membership and the position in the EESI, indicating that long-term underlying structural factors aremore important. This could also indicate that the Stability and Growth Pact (SGP) is not a sufficient driverfor either public finance discipline or long-term economic development. But it might also indicate thatcountries relax their efforts in these policy areas once they have become euro-zone members and that theSGP works to encourage countries outside the euro-zone to match euro-zone members’ efforts to ensurefuture membership. What it certainly indicates is that the SGP is no guarantor for good public finances orlong-term growth performance.
Performance in the six domains
Below is a short description of the ranking of countries in each domain.6
Growth: As in most domains, Greece is at the bottom of growth performance over the two years withLatvia and Spain also performing badly. Slovakia and Poland have high growth rates, followed by Estonia.
Net borrowing (deficit): Ireland has the highest deficit over the two years, followed by the UK. Greece,Spain and Latvia also perform badly. Top performer is Sweden, followed by Estonia and Bulgaria.
Gross debt: Greece performs worse, followed by Italy and Belgium. Estonia performs best, followed byBulgaria and Luxembourg.
World Competitiveness Index: Bulgaria is ranked lowest, followed by Greece, Latvia and Romania. Thetop is dominated by the Scandinavians: Sweden, Denmark and Finland.
Corruption Perception Index: Greece, Romania and Bulgaria are jointly at the bottom, followed by Italy.The Scandinavians (Sweden, Denmark and Finland), as well as the Netherlands, perform well.
Cost of ageing: Luxembourg is the worst performer, with Greece only very marginally better. Sloveniaalso performs badly. At the top are Latvia, Estonia and Poland.
This brief analysis of the ranking of countries in each domain demonstrates that there is significantvariation in the placement of countries in each domain. This makes a composite index valuable as it cangenuinely reveal something about the overall position of countries, rather than being dominated by theresults in a particular domain or by similarities between the domains.
Weights of different domains
The results above are based on an equal weighting between the six domains. What happens if differentweights are chosen for different domains?
June
201
0
12
Choosing the right weights in a composite indicator is a contestable exercise as it is not clear what criteriashould be used to make such a choice. For this reason, sensitivity testing can show whether choosingparticular weights adds to the overall performance of the index or not.
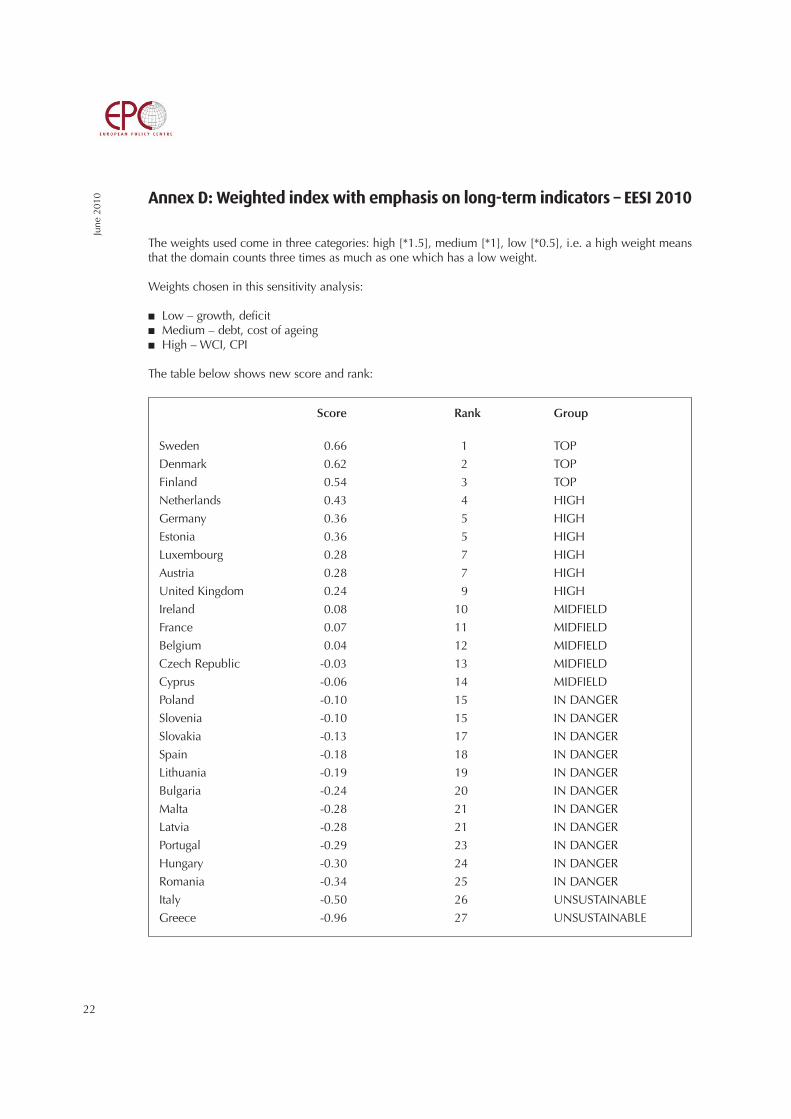
If more weight is given to the long-term indicators (CPI, WCI) with less weight on the short term (deficitand growth), with debt and cost of ageing in between7, little changes at the top and bottom. TheScandinavians stay at the top, while Italy and Greece remain at the bottom. The most distinct trend is thatthe NMS perform worse across the board. Countries such as Spain and Ireland, and to some extentPortugal, move up in the rankings.
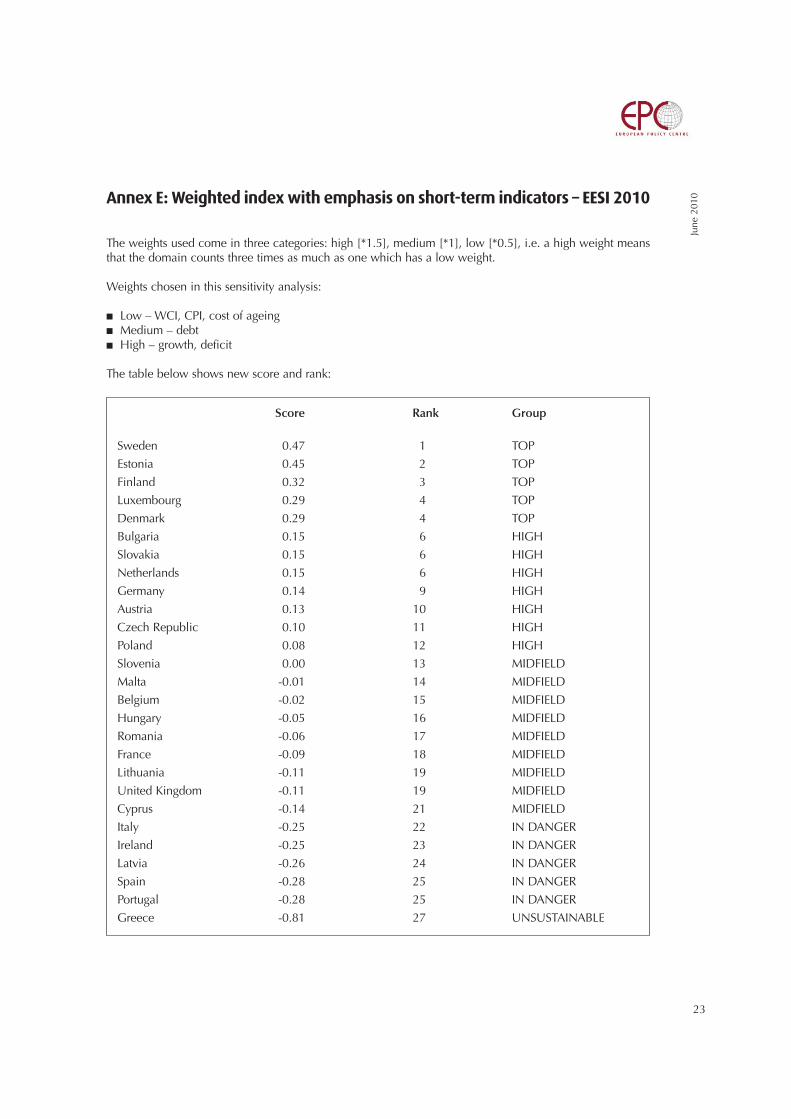
If less weight is given to the long-term indicators (CPI, WCI, cost of ageing) with more weight on the shortterm (deficit and growth), with debt in between8, the Scandinavians remain in the top part of the ranking,while Greece remains at the bottom. Countries such as the UK, Spain and Ireland move down the chart,while countries such as Slovakia, Bulgaria and Italy would improve their ranking.
The current focus of commentators and markets has been almost exclusively on short- to medium-termindicators – deficit, debt and growth. If an index is constructed using only these indicators9, the rankingis clearly skewed towards the NMS: countries such as Bulgaria, Slovakia and the Czech Republic performmuch better. At the bottom, Ireland and the UK are now performing badly with countries such as Belgiumand France also in danger.
The sensitivity testing with different weights, which has been summarised above, has demonstrated thatthere is a certain degree of consistency across different weights chosen but that greater emphasis on thelong-term indicators tends to disadvantage NMS, while greater emphasis on short-term indicatorsdisadvantages countries which have the potential to achieve long-term economic sustainability despiteshort-term problems. The analysis of performance in each domain has demonstrated that each domaincontributes a different distribution of Member States, showing that inclusion of that domain addsadditional useful information into the overall index.
Putting the weight on short-term indicators does not take sufficient account of the long-term sustainabilitypressures which are the focus of this index. But putting the weight on the long-term indicators wouldunderestimate the importance of short-term imbalances. For these reasons, the future EESI will use equalweights across the domains.10
June
201
0
13
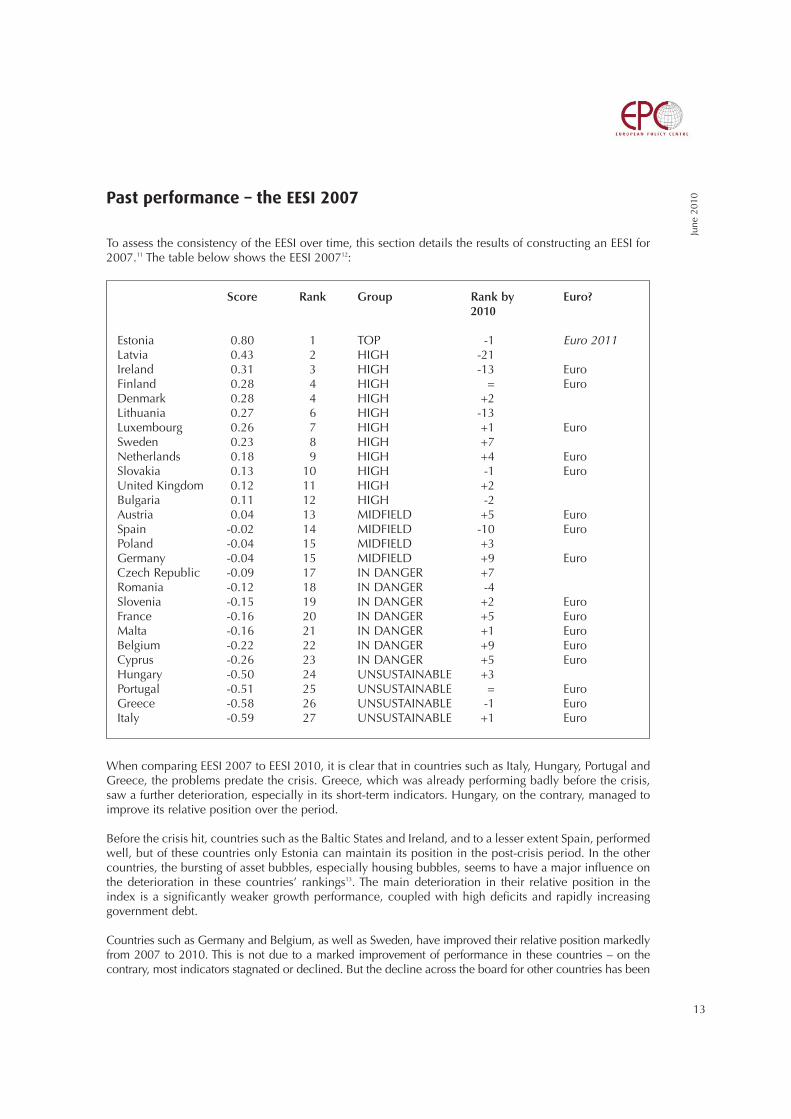
Past performance – the EESI 2007
To assess the consistency of the EESI over time, this section details the results of constructing an EESI for2007.11 The table below shows the EESI 200712:
When comparing EESI 2007 to EESI 2010, it is clear that in countries such as Italy, Hungary, Portugal andGreece, the problems predate the crisis. Greece, which was already performing badly before the crisis,saw a further deterioration, especially in its short-term indicators. Hungary, on the contrary, managed toimprove its relative position over the period.
Before the crisis hit, countries such as the Baltic States and Ireland, and to a lesser extent Spain, performedwell, but of these countries only Estonia can maintain its position in the post-crisis period. In the othercountries, the bursting of asset bubbles, especially housing bubbles, seems to have a major influence onthe deterioration in these countries’ rankings13. The main deterioration in their relative position in theindex is a significantly weaker growth performance, coupled with high deficits and rapidly increasinggovernment debt.
Countries such as Germany and Belgium, as well as Sweden, have improved their relative position markedlyfrom 2007 to 2010. This is not due to a marked improvement of performance in these countries – on thecontrary, most indicators stagnated or declined. But the decline across the board for other countries has been
Score Rank Group Rank by Euro?2010
Estonia 0.80 1 TOP -1 Euro 2011Latvia 0.43 2 HIGH -21Ireland 0.31 3 HIGH -13 EuroFinland 0.28 4 HIGH = EuroDenmark 0.28 4 HIGH +2Lithuania 0.27 6 HIGH -13Luxembourg 0.26 7 HIGH +1 EuroSweden 0.23 8 HIGH +7Netherlands 0.18 9 HIGH +4 EuroSlovakia 0.13 10 HIGH -1 EuroUnited Kingdom 0.12 11 HIGH +2Bulgaria 0.11 12 HIGH -2Austria 0.04 13 MIDFIELD +5 EuroSpain -0.02 14 MIDFIELD -10 EuroPoland -0.04 15 MIDFIELD +3Germany -0.04 15 MIDFIELD +9 EuroCzech Republic -0.09 17 IN DANGER +7Romania -0.12 18 IN DANGER -4Slovenia -0.15 19 IN DANGER +2 EuroFrance -0.16 20 IN DANGER +5 EuroMalta -0.16 21 IN DANGER +1 EuroBelgium -0.22 22 IN DANGER +9 EuroCyprus -0.26 23 IN DANGER +5 EuroHungary -0.50 24 UNSUSTAINABLE +3Portugal -0.51 25 UNSUSTAINABLE = EuroGreece -0.58 26 UNSUSTAINABLE -1 EuroItaly -0.59 27 UNSUSTAINABLE +1 Euro
June
201
0
14
even more marked. In other words, the improved ranking is relative, in the context of an overall deteriorationof the economic environment.
Annexes I & J show the results of sensitivity testing for the EESI 2007 index. The results are broadlyconsistent with sensitivity testing for 2010: an emphasis on long-term indicators disadvantages the NMS,while an emphasis on short-term indicators disadvantages countries which have the potential to achievelong-term economic sustainability despite short-term problems.
Overall, the results indicate that the index works well to highlight some of the long-term underlying issuesbut it cannot identify a priori which countries will experience a marked deterioration in economicperformance. Rather than identifying what countries might perform well or less well in the short term, theEESI is best suited to identifying the countries with long-term structural problems.
June
201
0
15
Policy implications
The EESI provides an opportunity to reflect on, and assess, Europe’s economies more objectively, from alonger term perspective. This is the main function of the index: to indicate where currently economicsustainability is threatened, implying that policy change is needed to reach a more sustainable path.
It is clear from the EESI why Greece is in trouble: it clearly shows that Greece is a special case, being in a farworse position, both in short-term and long-term indicators, than any other country. Italy initially escaped theattention of financial markets due to its relatively low deficit but as markets and policy-makers are increasinglyfocusing on longer term indicators, Italy has also come into focus. Portugal also clearly has long-termunderlying structural problems, with Spain in a marginally better position. Countries such as the UK andIreland, with significant short-term public finance difficulties, or Belgium, with a high level of debt, have betterlong-term prospects and their public finances and economies are, for this reason, more sustainable.
The implications of the index are clear: structural reform is necessary in many countries if we wish to avoidfuture crises. In particular, Greece and Italy, as well as Spain, Portugal and the NMS which have receivedEU/IMF assistance: Hungary, Latvia and Romania, must carry out reforms which do not only improve publicfinances, but also improve governance, competitiveness and productivity and deal effectively with long-termchallenges. Labour market and pension reform, reform of the delivery of public services, improving thebusiness environment and investing in future growth must all play a significant role.
Here, there is potentially a significant role for the EU and also the IMF. Even the countries which arefacing acute public finance difficulties must be allowed the space and investment to transform theireconomy to foster future growth. This might in some cases involve a discussion on rescheduling or evencancelling some of the debt in return for the right kind of investment commitments. The EU can also gofurther: its growth strategy and available EU funding must aim to help these countries to invest in thefuture and to carry out the necessary structural reforms.
This is a considerable challenge in the current environment, especially for those countries already incrisis. Here, the emphasis is now on austerity measures to get public finances under control in the shortterm. Providing further support is also deeply unpopular in some of the countries which have tounderwrite such policies, most notably in Germany. But without the long-term perspective, this will onlyaggravate the future growth crisis, leading to further public finance problems.
Without a more positive, forward-looking policy it will be difficult to keep EU citizens on board both inthe Member States which need support, and in those able to provide it. Practised solidarity will not onlyprovide a more positive perspective for those living in economies which are in crisis, it is also in the long-term interest of the economically-stronger Member States, given the interdependent nature of theEuropean economy.
In the absence of joint action, if certain countries are allowed to deteriorate further, Europe will face lowgrowth and further crisis in future. This might mean that the whole European project will be under threat,with immeasurable impacts on future generations of Europeans.

June
201
0
16
Next steps
The EPC intends to update the EESI each Spring after the Spring forecast of the European Commission ispublished. At certain significant points in time, when new data becomes available or with the accessionof a new Member State, the index might also be updated.
This will provide a long-term tool to assess the economic sustainability of Europe’s economies. It willmaintain a focus on these issues even after the immediate crisis has passed, ensuring that the long-termreform agenda does not become marginalised.
The intention is also to hold a mirror to many European governments. In line with the benchmarkingapproach in Europe 2020, this ‘naming and shaming’ is intended to prompt action from governmentswhich are avoiding the necessary structural reforms. At the same time, the EESI also points to the need tofocus across Europe on structural reform and investment into future growth and to have a more effectiveframework which delivers practical solidarity: higher growth rates across the EU.
If the EESI can make a small contribution to ensuring that European governments pay more attention to theeconomic legacy we are creating for future generations of Europeans across all EU Member States – both interms of the debt legacy but also in terms of equipping Europeans with the means to drive upward economicgrowth and to safeguard Europe's economic and social model – it will have fulfilled its objective.
June
201
0
17
Annex A: Technical Annex – EESI 2010
Composite indicators (which summarise a number of other indicators into a single number) have significantadvantages and disadvantages. As a result, they will always be controversial. As statistician Andrea Saltellihas noted: “[…] it is hard to imagine that the debate on the use of composite indicators will ever be settled[…] official statisticians may tend to resent composite indicators, whereby a lot of work in data collectionand editing is “wasted” or “hidden” behind a single number of dubious significance. On the other hand, thetemptation of stakeholders and practitioners to summarise complex and sometime elusive processes (e.g.sustainability, single market policy, etc.) into a single figure to benchmark country performance for policyconsumption seems likewise irresistible.”14
To enable this benchmarking between countries in the field of economic sustainability, the EESI is acomposite indicator which combines six domains: National debt, deficits, economic growth,competitiveness, corruption/governance and cost of ageing. This enables the construction of a single score which simultaneously puts each EU country’s short- and long-term economic sustainability inrelative context to each other. It incorporates forecasts and projections wherever possible to enable anassessment of future and long-term performance.
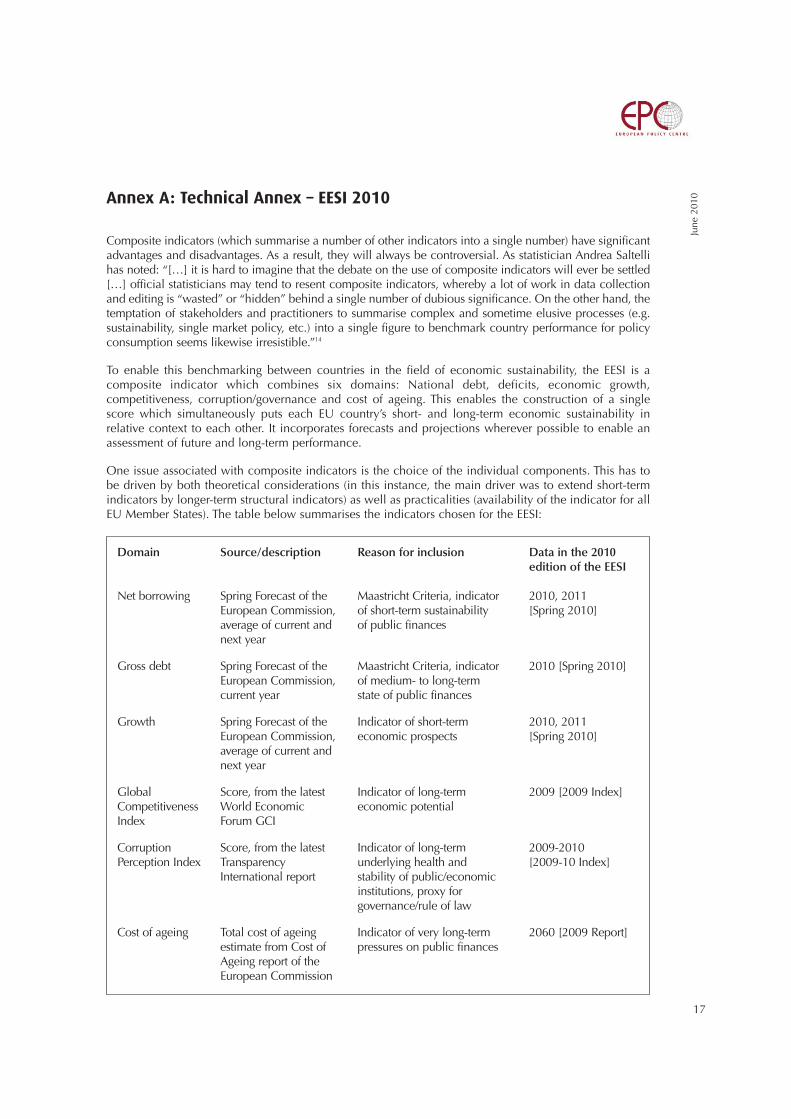
One issue associated with composite indicators is the choice of the individual components. This has tobe driven by both theoretical considerations (in this instance, the main driver was to extend short-termindicators by longer-term structural indicators) as well as practicalities (availability of the indicator for allEU Member States). The table below summarises the indicators chosen for the EESI:
Domain Source/description Reason for inclusion Data in the 2010 edition of the EESI
Net borrowing Spring Forecast of the Maastricht Criteria, indicator 2010, 2011European Commission, of short-term sustainability [Spring 2010]average of current and of public financesnext year
Gross debt Spring Forecast of the Maastricht Criteria, indicator 2010 [Spring 2010]European Commission, of medium- to long-termcurrent year state of public finances
Growth Spring Forecast of the Indicator of short-term 2010, 2011 European Commission, economic prospects [Spring 2010]average of current and next year
Global Score, from the latest Indicator of long-term 2009 [2009 Index]Competitiveness World Economic economic potentialIndex Forum GCI
Corruption Score, from the latest Indicator of long-term 2009-2010Perception Index Transparency underlying health and [2009-10 Index]
International report stability of public/economicinstitutions, proxy for governance/rule of law
Cost of ageing Total cost of ageing Indicator of very long-term 2060 [2009 Report]estimate from Cost of pressures on public financesAgeing report of the European Commission
June
201
0
18
Ideally, all these indicators would be available and updated on a regular basis. If they were all to beupdated at the same time, it would also help to construct the composite indicator. However, the data forthe long-term structural indicators is not available at the same time and frequency as the short- tomedium-term indicators. The short- and medium-term indicators (growth, deficits, debt) are all availablefrom the Commission’s Spring and Autumn forecasts. The Corruption Perception Index (CPI) and GlobalCompetitiveness Index (GCI) are updated on an annual basis.
The Cost of Ageing is only available intermittently (the 2006 and 2009 reports were used for this reportand it is currently unclear when the next one will be produced). However, as the Cost of Ageingincorporates both the pressure from demographics and can act as a proxy for structural reforms, it hasbeen included. If no new data becomes available in the near future, it might need to be replaced, forexample by unemployment and projections of dependency ratios.
One key question in a composite indicator is whether the individual domains are independent of eachother or whether there is significant overlap, i.e. whether particular domains measure broadly the samething (in which case, there is no additional information revealed by including an additional domain andit results in particular data receiving implicitly a higher weight). In this case, all domains reveal differentrankings, suggesting that they measure different developments. Potentially, there is some direct overlapbetween the CPI and the GCI as well as the debt/deficit domains, as the GCI covers corruption andgovernance, as well as debt/deficits (as part of the macroeconomic stability criterion). However, theseelements are only a small component of the total GCI.
For any composite indicator, there is a balance to be struck between the number of indicators with a toohigh number adding complexity and reducing focus. The index focuses on public finances rather thanlooking at the overall net indebtedness of an economy (private and public debt). This is in part due to theavailability of data and in part reflects the focus on Economic and Monetary Union, specifically the publicfinance convergence criteria.
Arguably other indicators should also have been included, for example inflation, trade or balance ofpayment balances, savings rates or the overall degree of external indebtedness. However, not only is data on all of these not always readily available but there is also ambiguity: no single direction is ‘good’ or ‘bad’. For example, for inflation some level of low but positive inflation is seen as the bestposition for countries. Inclusion of these indicators would thus require a judgment of the ‘ideal’ ratewhich is best avoided.
It could also be argued that sustainability should include social and environmental indicators. Whilethese dimensions are very important, they are not the main focus of this composite indicator and for thatreason they have been excluded.
The final composite indicator (i.e. the EESI) is a relative indicator – it shows the position of a country in thecontext of the other 26 EU Member States. To determine relative position, the methodology uses two steps:
� Normalisation – the lowest outcome set to 0 in each domain and all other scores are subject to an equal adjustment to (e.g. if lowest score is -1, 1 is added to all scores);
� Distance from mean – the percentage distance from the arithmetic mean of all EU Member States (NB: notfrom the EU average, as this is a weighted average, dependent on size of each country) is then constructedfor each domain (the country score is divided by the arithmetic mean and one is subtracted – the lowest possible score is thus -1).
To determine the overall position, the sum of all domains is divided by 6.
Choosing weights for each indicator is probably the biggest challenge for composite indicators. The final stepdetailed above shows that all domains are equally weighted in the EESI. The paper describes in more detailwhy equal weighting has been chosen and the sensitivity tests which have been used.
June
201
0
19
Finally, all countries are then grouped into five categories: top, high, midfield, in danger and unsustainable.This is a subjective grouping, based on the distribution of the EESI score. As a subjective assessment, it onlyserves to illustrate a broad grouping of these countries for descriptive purposes and should not bemisunderstood as a credit rating.
June
201
0
20
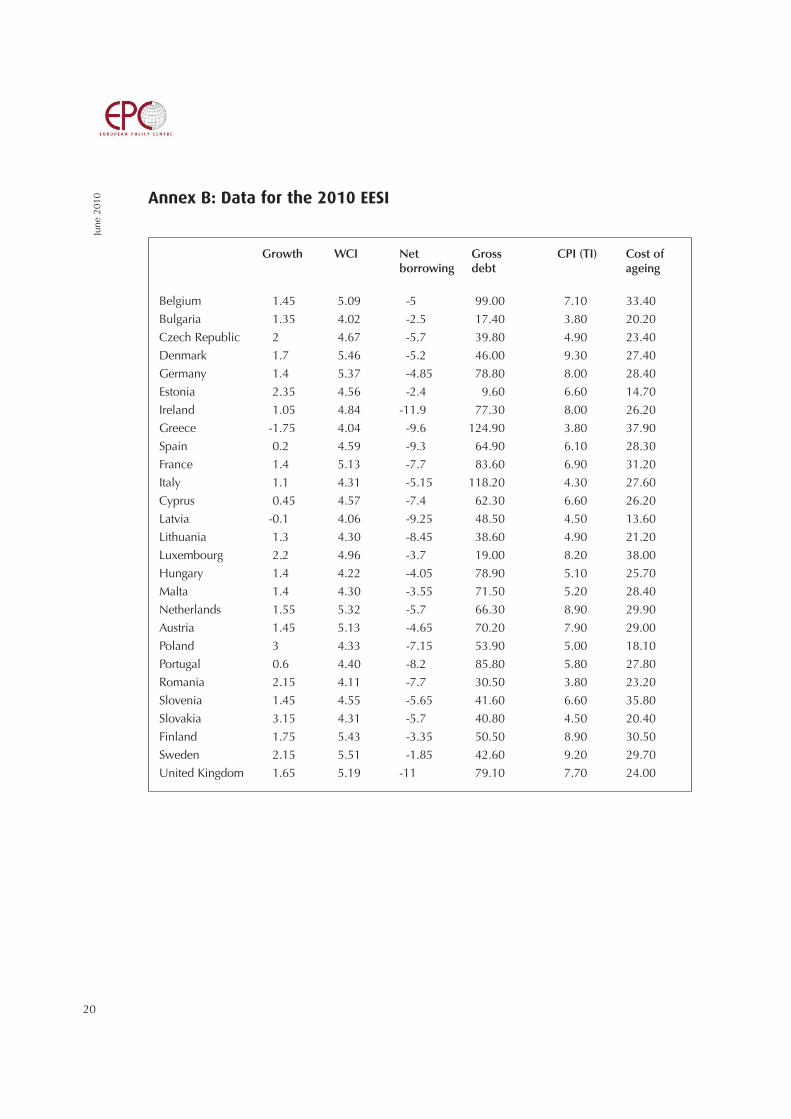
Annex B: Data for the 2010 EESI
Growth WCI Net Gross CPI (TI) Cost ofborrowing debt ageing
Belgium 1.45 5.09 -5 99.00 7.10 33.40
Bulgaria 1.35 4.02 -2.5 17.40 3.80 20.20
Czech Republic 2 4.67 -5.7 39.80 4.90 23.40
Denmark 1.7 5.46 -5.2 46.00 9.30 27.40
Germany 1.4 5.37 -4.85 78.80 8.00 28.40
Estonia 2.35 4.56 -2.4 9.60 6.60 14.70
Ireland 1.05 4.84 -11.9 77.30 8.00 26.20
Greece -1.75 4.04 -9.6 124.90 3.80 37.90
Spain 0.2 4.59 -9.3 64.90 6.10 28.30
France 1.4 5.13 -7.7 83.60 6.90 31.20
Italy 1.1 4.31 -5.15 118.20 4.30 27.60
Cyprus 0.45 4.57 -7.4 62.30 6.60 26.20
Latvia -0.1 4.06 -9.25 48.50 4.50 13.60
Lithuania 1.3 4.30 -8.45 38.60 4.90 21.20
Luxembourg 2.2 4.96 -3.7 19.00 8.20 38.00
Hungary 1.4 4.22 -4.05 78.90 5.10 25.70
Malta 1.4 4.30 -3.55 71.50 5.20 28.40
Netherlands 1.55 5.32 -5.7 66.30 8.90 29.90
Austria 1.45 5.13 -4.65 70.20 7.90 29.00
Poland 3 4.33 -7.15 53.90 5.00 18.10
Portugal 0.6 4.40 -8.2 85.80 5.80 27.80
Romania 2.15 4.11 -7.7 30.50 3.80 23.20
Slovenia 1.45 4.55 -5.65 41.60 6.60 35.80
Slovakia 3.15 4.31 -5.7 40.80 4.50 20.40
Finland 1.75 5.43 -3.35 50.50 8.90 30.50
Sweden 2.15 5.51 -1.85 42.60 9.20 29.70
United Kingdom 1.65 5.19 -11 79.10 7.70 24.00
June
201
0
21
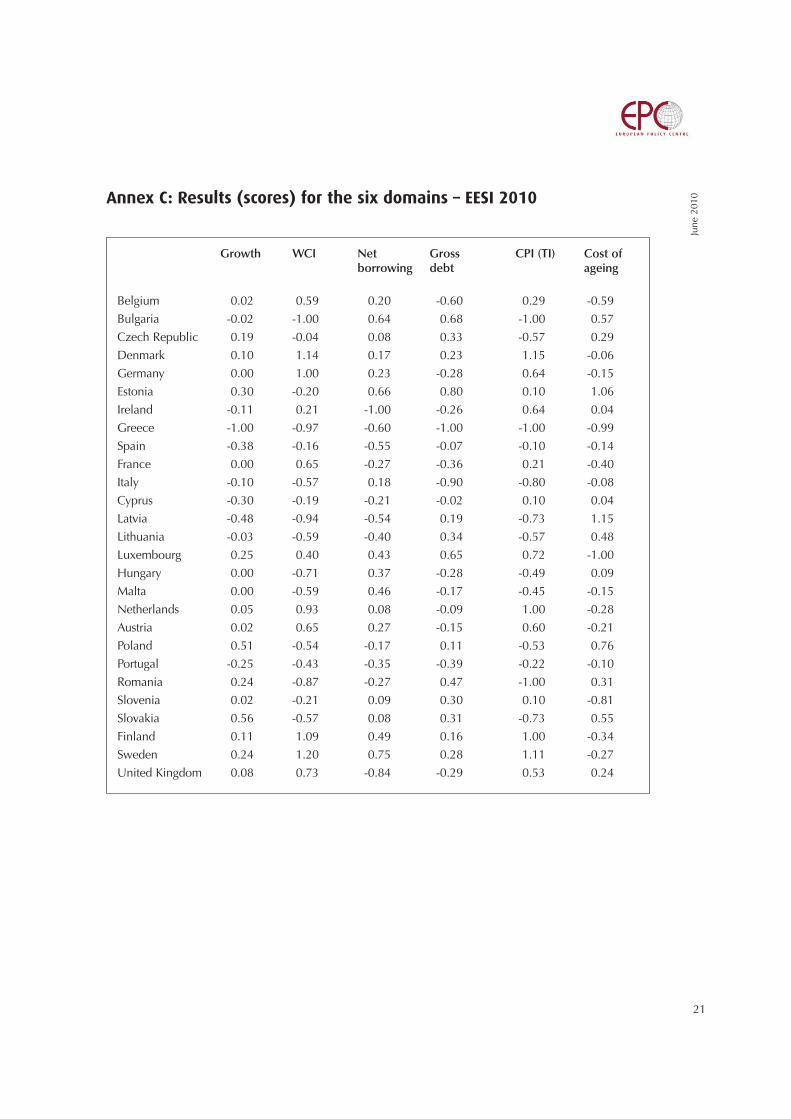
Annex C: Results (scores) for the six domains – EESI 2010
Growth WCI Net Gross CPI (TI) Cost ofborrowing debt ageing
Belgium 0.02 0.59 0.20 -0.60 0.29 -0.59
Bulgaria -0.02 -1.00 0.64 0.68 -1.00 0.57
Czech Republic 0.19 -0.04 0.08 0.33 -0.57 0.29
Denmark 0.10 1.14 0.17 0.23 1.15 -0.06
Germany 0.00 1.00 0.23 -0.28 0.64 -0.15
Estonia 0.30 -0.20 0.66 0.80 0.10 1.06
Ireland -0.11 0.21 -1.00 -0.26 0.64 0.04
Greece -1.00 -0.97 -0.60 -1.00 -1.00 -0.99
Spain -0.38 -0.16 -0.55 -0.07 -0.10 -0.14
France 0.00 0.65 -0.27 -0.36 0.21 -0.40
Italy -0.10 -0.57 0.18 -0.90 -0.80 -0.08
Cyprus -0.30 -0.19 -0.21 -0.02 0.10 0.04
Latvia -0.48 -0.94 -0.54 0.19 -0.73 1.15
Lithuania -0.03 -0.59 -0.40 0.34 -0.57 0.48
Luxembourg 0.25 0.40 0.43 0.65 0.72 -1.00
Hungary 0.00 -0.71 0.37 -0.28 -0.49 0.09
Malta 0.00 -0.59 0.46 -0.17 -0.45 -0.15
Netherlands 0.05 0.93 0.08 -0.09 1.00 -0.28
Austria 0.02 0.65 0.27 -0.15 0.60 -0.21
Poland 0.51 -0.54 -0.17 0.11 -0.53 0.76
Portugal -0.25 -0.43 -0.35 -0.39 -0.22 -0.10
Romania 0.24 -0.87 -0.27 0.47 -1.00 0.31
Slovenia 0.02 -0.21 0.09 0.30 0.10 -0.81
Slovakia 0.56 -0.57 0.08 0.31 -0.73 0.55
Finland 0.11 1.09 0.49 0.16 1.00 -0.34
Sweden 0.24 1.20 0.75 0.28 1.11 -0.27
United Kingdom 0.08 0.73 -0.84 -0.29 0.53 0.24
June
201
0
22
Annex D: Weighted index with emphasis on long-term indicators – EESI 2010
The weights used come in three categories: high [*1.5], medium [*1], low [*0.5], i.e. a high weight meansthat the domain counts three times as much as one which has a low weight.
Weights chosen in this sensitivity analysis:
� Low – growth, deficit� Medium – debt, cost of ageing� High – WCI, CPI
The table below shows new score and rank:
Score Rank Group
Sweden 0.66 1 TOP
Denmark 0.62 2 TOP
Finland 0.54 3 TOP
Netherlands 0.43 4 HIGH
Germany 0.36 5 HIGH
Estonia 0.36 5 HIGH
Luxembourg 0.28 7 HIGH
Austria 0.28 7 HIGH
United Kingdom 0.24 9 HIGH
Ireland 0.08 10 MIDFIELD
France 0.07 11 MIDFIELD
Belgium 0.04 12 MIDFIELD
Czech Republic -0.03 13 MIDFIELD
Cyprus -0.06 14 MIDFIELD
Poland -0.10 15 IN DANGER
Slovenia -0.10 15 IN DANGER
Slovakia -0.13 17 IN DANGER
Spain -0.18 18 IN DANGER
Lithuania -0.19 19 IN DANGER
Bulgaria -0.24 20 IN DANGER
Malta -0.28 21 IN DANGER
Latvia -0.28 21 IN DANGER
Portugal -0.29 23 IN DANGER
Hungary -0.30 24 IN DANGER
Romania -0.34 25 IN DANGER
Italy -0.50 26 UNSUSTAINABLE
Greece -0.96 27 UNSUSTAINABLE
June
201
0
23
Annex E: Weighted index with emphasis on short-term indicators – EESI 2010
The weights used come in three categories: high [*1.5], medium [*1], low [*0.5], i.e. a high weight meansthat the domain counts three times as much as one which has a low weight.
Weights chosen in this sensitivity analysis:
� Low – WCI, CPI, cost of ageing� Medium – debt� High – growth, deficit
The table below shows new score and rank:
Score Rank Group
Sweden 0.47 1 TOP
Estonia 0.45 2 TOP
Finland 0.32 3 TOP
Luxembourg 0.29 4 TOP
Denmark 0.29 4 TOP
Bulgaria 0.15 6 HIGH
Slovakia 0.15 6 HIGH
Netherlands 0.15 6 HIGH
Germany 0.14 9 HIGH
Austria 0.13 10 HIGH
Czech Republic 0.10 11 HIGH
Poland 0.08 12 HIGH
Slovenia 0.00 13 MIDFIELD
Malta -0.01 14 MIDFIELD
Belgium -0.02 15 MIDFIELD
Hungary -0.05 16 MIDFIELD
Romania -0.06 17 MIDFIELD
France -0.09 18 MIDFIELD
Lithuania -0.11 19 MIDFIELD
United Kingdom -0.11 19 MIDFIELD
Cyprus -0.14 21 MIDFIELD
Italy -0.25 22 IN DANGER
Ireland -0.25 23 IN DANGER
Latvia -0.26 24 IN DANGER
Spain -0.28 25 IN DANGER
Portugal -0.28 25 IN DANGER
Greece -0.81 27 UNSUSTAINABLE
June
201
0
24
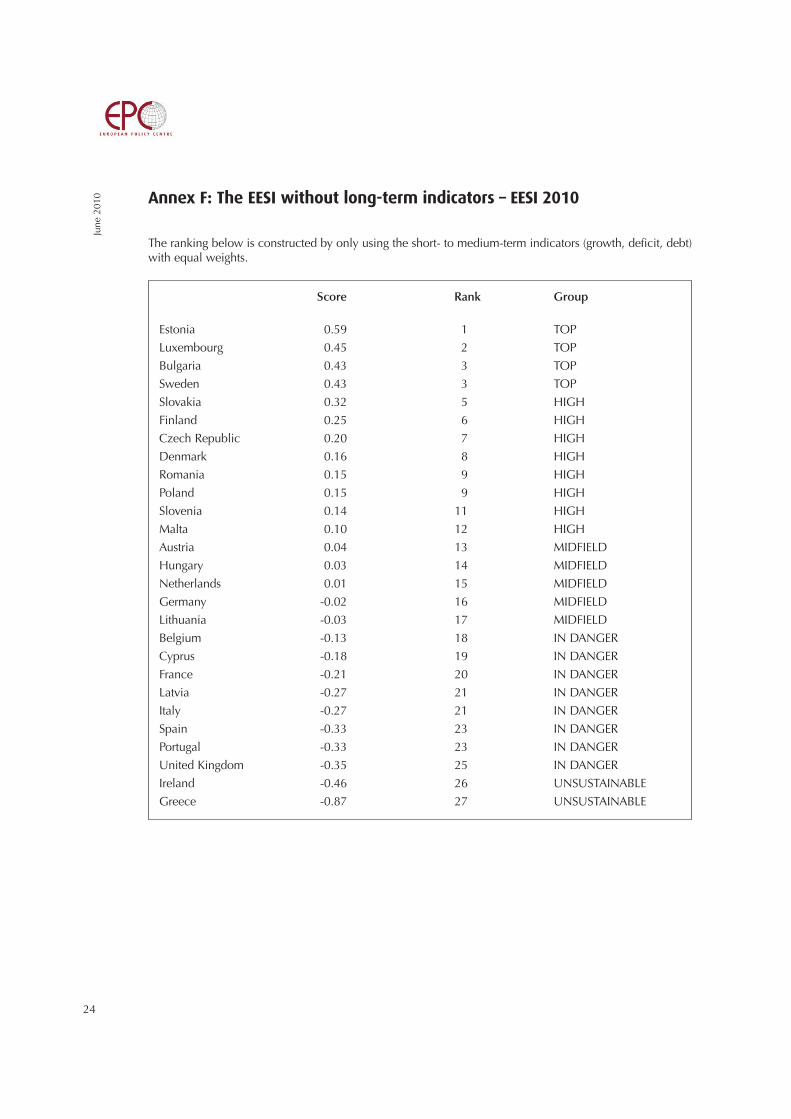
Annex F: The EESI without long-term indicators – EESI 2010
The ranking below is constructed by only using the short- to medium-term indicators (growth, deficit, debt)with equal weights.
Score Rank Group
Estonia 0.59 1 TOP
Luxembourg 0.45 2 TOP
Bulgaria 0.43 3 TOP
Sweden 0.43 3 TOP
Slovakia 0.32 5 HIGH
Finland 0.25 6 HIGH
Czech Republic 0.20 7 HIGH
Denmark 0.16 8 HIGH
Romania 0.15 9 HIGH
Poland 0.15 9 HIGH
Slovenia 0.14 11 HIGH
Malta 0.10 12 HIGH
Austria 0.04 13 MIDFIELD
Hungary 0.03 14 MIDFIELD
Netherlands 0.01 15 MIDFIELD
Germany -0.02 16 MIDFIELD
Lithuania -0.03 17 MIDFIELD
Belgium -0.13 18 IN DANGER
Cyprus -0.18 19 IN DANGER
France -0.21 20 IN DANGER
Latvia -0.27 21 IN DANGER
Italy -0.27 21 IN DANGER
Spain -0.33 23 IN DANGER
Portugal -0.33 23 IN DANGER
United Kingdom -0.35 25 IN DANGER
Ireland -0.46 26 UNSUSTAINABLE
Greece -0.87 27 UNSUSTAINABLE

June
201
0
25
Annex G: Technical annex for EESI 2007
For comparison purposes, an EESI for 2007 was constructed. The table below details the sources of data:
Domain Source/Description Data in the 2007 edition of the EESI
Net borrowing Spring Forecast of the 2007, 2008 [Spring 2007]European Commission, average of current and next year
Gross debt Spring Forecast of the 2007 [Spring 2007]European Commission, current year
Growth Spring Forecast of the 2007, 2008 [Spring 2007]European Commission, average of current and next year
Global Score, from the latest World 2006 [2006-07 Index]Competitiveness Economic ForumIndex
Corruption Score, from the latest 2006 [2006 Index]Perception Transparency International reportIndex
Cost of ageing Total cost of ageing estimate 2050 [2006 Report]from Cost of Ageing Report of the European Commission (1)
Source:
(1) Please note that the original Cost of Ageing data excluded an important component (pension costs) from Greece. For thisreason, Greek data was added in from a subsequent estimate.
(Source: http://ec.europa.eu/economy_finance/publications/publication16034_en.pdf).Romanian and Bulgarian data were not available in 2006 so the data from 2009 were used.
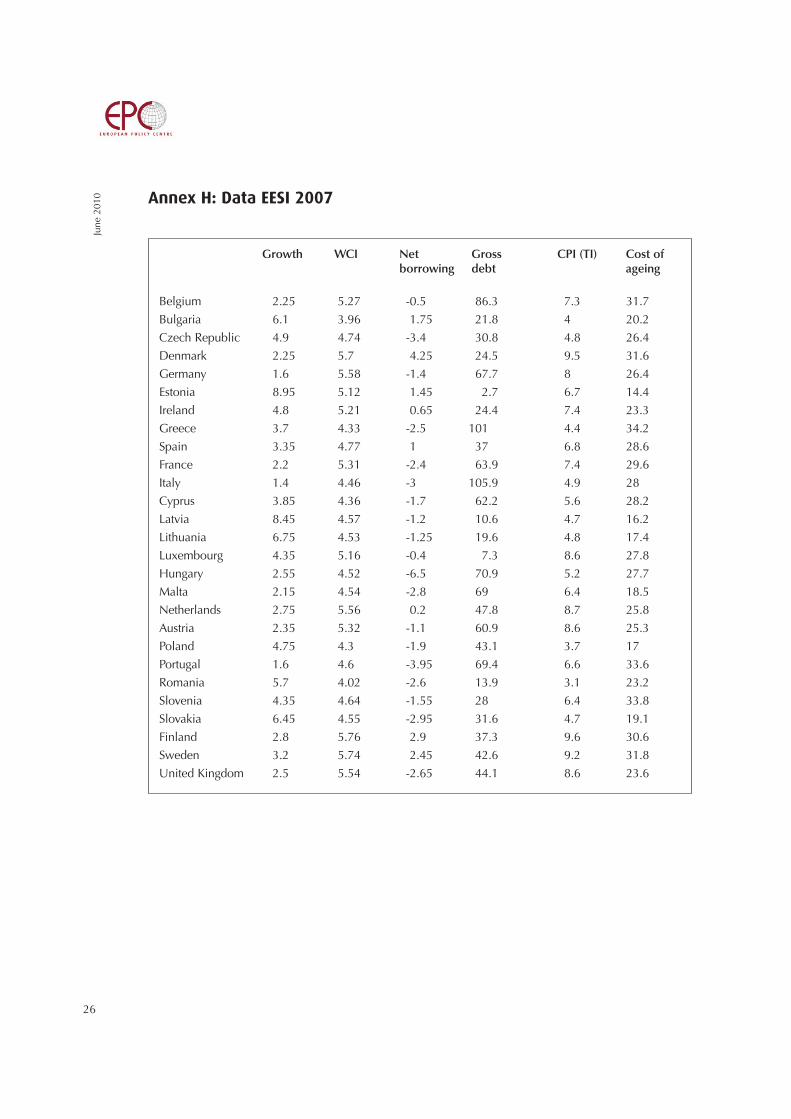
Annex H: Data EESI 2007
June
201
0
26
Growth WCI Net Gross CPI (TI) Cost ofborrowing debt ageing
Belgium 2.25 5.27 -0.5 86.3 7.3 31.7
Bulgaria 6.1 3.96 1.75 21.8 4 20.2
Czech Republic 4.9 4.74 -3.4 30.8 4.8 26.4
Denmark 2.25 5.7 4.25 24.5 9.5 31.6
Germany 1.6 5.58 -1.4 67.7 8 26.4
Estonia 8.95 5.12 1.45 2.7 6.7 14.4
Ireland 4.8 5.21 0.65 24.4 7.4 23.3
Greece 3.7 4.33 -2.5 101 4.4 34.2
Spain 3.35 4.77 1 37 6.8 28.6
France 2.2 5.31 -2.4 63.9 7.4 29.6
Italy 1.4 4.46 -3 105.9 4.9 28
Cyprus 3.85 4.36 -1.7 62.2 5.6 28.2
Latvia 8.45 4.57 -1.2 10.6 4.7 16.2
Lithuania 6.75 4.53 -1.25 19.6 4.8 17.4
Luxembourg 4.35 5.16 -0.4 7.3 8.6 27.8
Hungary 2.55 4.52 -6.5 70.9 5.2 27.7
Malta 2.15 4.54 -2.8 69 6.4 18.5
Netherlands 2.75 5.56 0.2 47.8 8.7 25.8
Austria 2.35 5.32 -1.1 60.9 8.6 25.3
Poland 4.75 4.3 -1.9 43.1 3.7 17
Portugal 1.6 4.6 -3.95 69.4 6.6 33.6
Romania 5.7 4.02 -2.6 13.9 3.1 23.2
Slovenia 4.35 4.64 -1.55 28 6.4 33.8
Slovakia 6.45 4.55 -2.95 31.6 4.7 19.1
Finland 2.8 5.76 2.9 37.3 9.6 30.6
Sweden 3.2 5.74 2.45 42.6 9.2 31.8
United Kingdom 2.5 5.54 -2.65 44.1 8.6 23.6
June
201
0
27
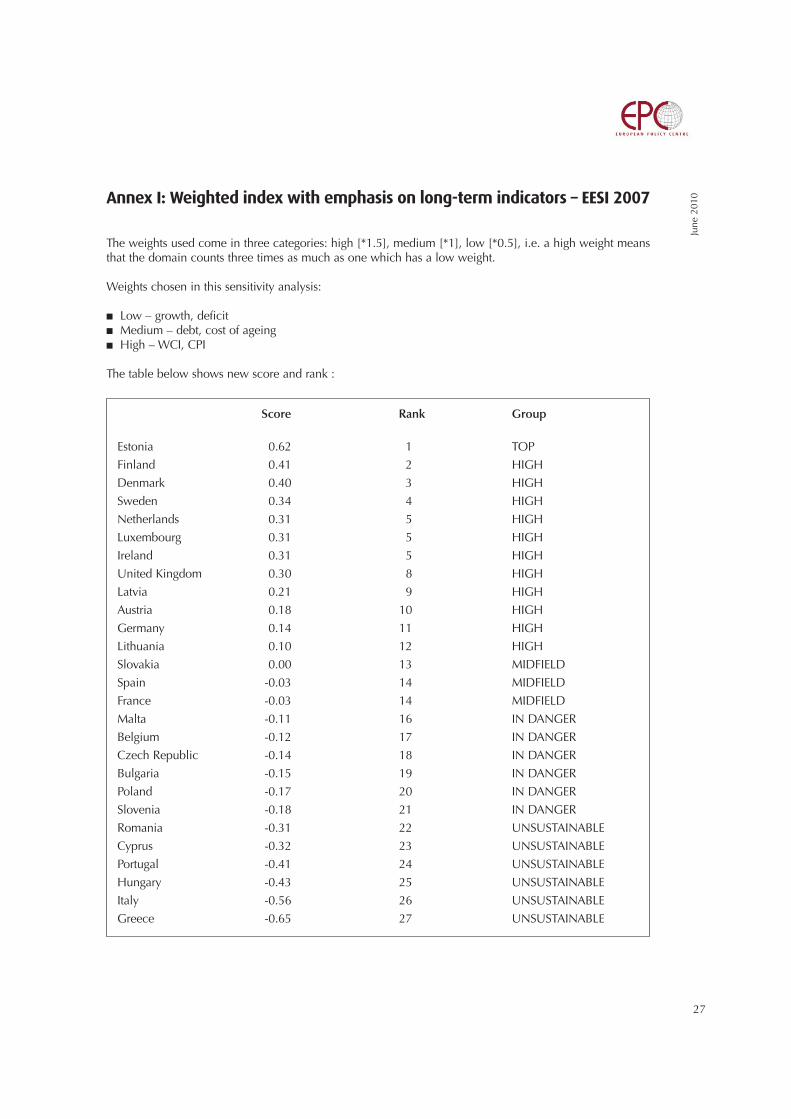
Annex I: Weighted index with emphasis on long-term indicators – EESI 2007
The weights used come in three categories: high [*1.5], medium [*1], low [*0.5], i.e. a high weight meansthat the domain counts three times as much as one which has a low weight.
Weights chosen in this sensitivity analysis:
� Low – growth, deficit� Medium – debt, cost of ageing� High – WCI, CPI
The table below shows new score and rank :
Score Rank Group
Estonia 0.62 1 TOP
Finland 0.41 2 HIGH
Denmark 0.40 3 HIGH
Sweden 0.34 4 HIGH
Netherlands 0.31 5 HIGH
Luxembourg 0.31 5 HIGH
Ireland 0.31 5 HIGH
United Kingdom 0.30 8 HIGH
Latvia 0.21 9 HIGH
Austria 0.18 10 HIGH
Germany 0.14 11 HIGH
Lithuania 0.10 12 HIGH
Slovakia 0.00 13 MIDFIELD
Spain -0.03 14 MIDFIELD
France -0.03 14 MIDFIELD
Malta -0.11 16 IN DANGER
Belgium -0.12 17 IN DANGER
Czech Republic -0.14 18 IN DANGER
Bulgaria -0.15 19 IN DANGER
Poland -0.17 20 IN DANGER
Slovenia -0.18 21 IN DANGER
Romania -0.31 22 UNSUSTAINABLE
Cyprus -0.32 23 UNSUSTAINABLE
Portugal -0.41 24 UNSUSTAINABLE
Hungary -0.43 25 UNSUSTAINABLE
Italy -0.56 26 UNSUSTAINABLE
Greece -0.65 27 UNSUSTAINABLE
June
201
0
28
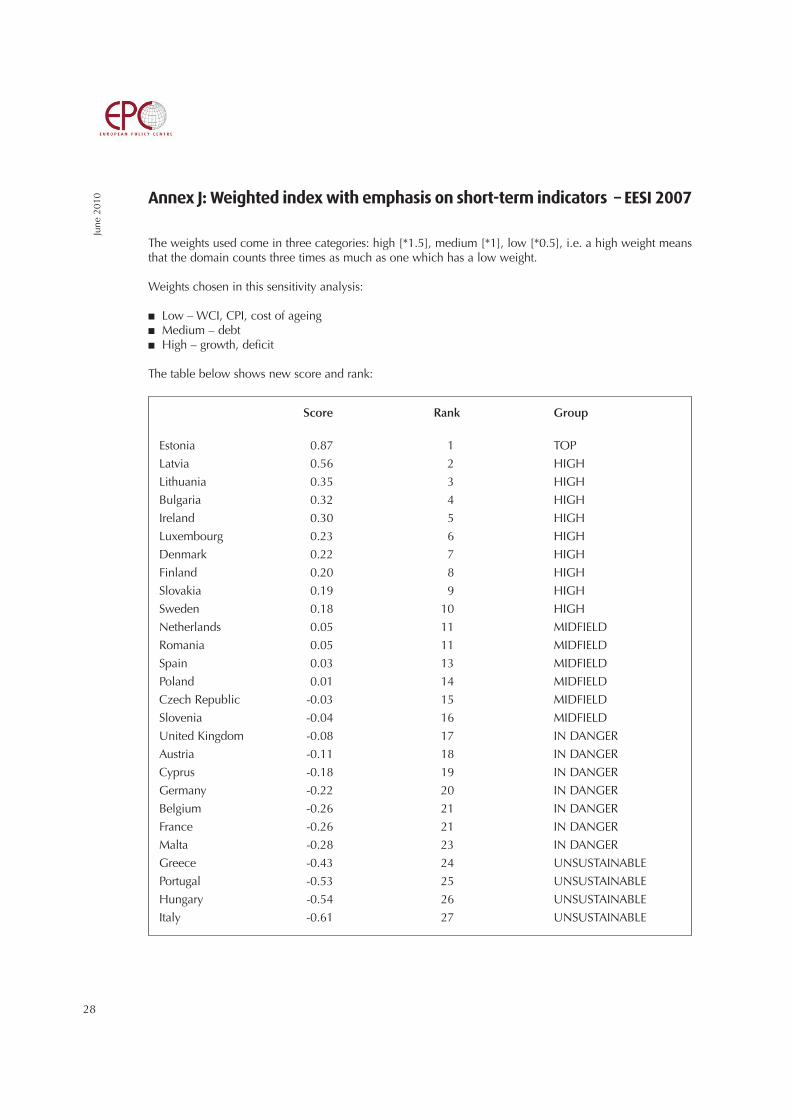
Annex J: Weighted index with emphasis on short-term indicators – EESI 2007
The weights used come in three categories: high [*1.5], medium [*1], low [*0.5], i.e. a high weight meansthat the domain counts three times as much as one which has a low weight.
Weights chosen in this sensitivity analysis:
� Low – WCI, CPI, cost of ageing� Medium – debt� High – growth, deficit
The table below shows new score and rank:
Score Rank Group
Estonia 0.87 1 TOP
Latvia 0.56 2 HIGH
Lithuania 0.35 3 HIGH
Bulgaria 0.32 4 HIGH
Ireland 0.30 5 HIGH
Luxembourg 0.23 6 HIGH
Denmark 0.22 7 HIGH
Finland 0.20 8 HIGH
Slovakia 0.19 9 HIGH
Sweden 0.18 10 HIGH
Netherlands 0.05 11 MIDFIELD
Romania 0.05 11 MIDFIELD
Spain 0.03 13 MIDFIELD
Poland 0.01 14 MIDFIELD
Czech Republic -0.03 15 MIDFIELD
Slovenia -0.04 16 MIDFIELD
United Kingdom -0.08 17 IN DANGER
Austria -0.11 18 IN DANGER
Cyprus -0.18 19 IN DANGER
Germany -0.22 20 IN DANGER
Belgium -0.26 21 IN DANGER
France -0.26 21 IN DANGER
Malta -0.28 23 IN DANGER
Greece -0.43 24 UNSUSTAINABLE
Portugal -0.53 25 UNSUSTAINABLE
Hungary -0.54 26 UNSUSTAINABLE
Italy -0.61 27 UNSUSTAINABLE
Endnotes
1. The initial suggestion for the development of such an index has come from Hans Martens, Chief Executive of the European Policy Centre. The Index has been constructed by Fabian Zuleeg, Chief Economist, European Policy Centre.
2. Annex A sets out the technical details of how this composite index is constructed.3. For a number of economic indicators it is not clear whether a higher or lower value is positive or negative. For example, it is unlikely
that zero inflation is an ideal point, but it is not clear where this ideal point should lie and whether negative inflation (deflation) shouldbe judged the same way as inflation.
4. The reason why an unweighted score has been chosen is explored later on in this paper which also assesses the sensitivity of the EESIfor different weights.
5. The underlying data is shown in Annex B.6. The detailed data can be found in Annex C.7. The weighting and the resulting ranking are detailed in Annex D.8. The weighting and the resulting ranking are detailed in Annex E.9. The resulting ranking is detailed in Annex F.
10. Choosing weights (or no weights) is in the end a subjective exercise. However, in the view of the author, the sensitivity testing and theoverall performance of the index provide sufficient reasons to err on the side of simplicity and the use of unweighted domains.
11. Annex G details the data used for the EESI 2007 as well as methodological issues.12. Annex H shows the underlying data for EESI 2007.13. It would be useful to include an indicator which could measure the over-valuation of asset markets in the index, but there is currently
no common or agreed indicator. In addition, it is unclear which market would be most appropriate (e.g. property, stocks, etc.).14. Andrea Saltelli, JRC. http://composite-indicators.jrc.ec.europa.eu/
June
201
0
29