Etude solvabilite II
17
© 2015 KPMG LLP, a UK limited liability partnership and a member firm of the KPMG network of independent member firms affiliated with KPMG International Cooperative (“KPMG International”), a Swiss entity. All rights reserved. Survey report November 2015 kpmg.co.uk
-
Upload
groupe-sfc-cabinet-dexpertise-comptable -
Category
Business
-
view
586 -
download
0
Transcript of Etude solvabilite II

0 SOLVENCY II EXPOSED
© 2015 KPMG LLP, a UK limited liability partnership and a member firm of the KPMG network of independent member firms affiliated with KPMG International
Cooperative (“KPMG International”), a Swiss entity. All rights reserved.
Survey report
November 2015
kpmg.co.uk

01 Introduction 2
02 Executive Summary 3
03 Solvency II Public Disclosure 4
04 Changes to Financial Framework 10
05 KPMG Contacts 15
Contents

2 SOLVENCY II EXPOSED
© 2015 KPMG LLP, a UK limited liability partnership and a member firm of the KPMG network of independent member firms affiliated with KPMG International
Cooperative (“KPMG International”), a Swiss entity. All rights reserved.
SOLVENCY II EXPOSED
Introduction
WITH SOLVENCY II (“SII”) FAST APPROACHING AND UNCERTAINTY STILL LOOMING, FIRMS ARE LOOKING TO AVOID SURPRISING INVESTORS BY CAREFULLY PULLING BACK THE VEIL ON THEIR POSITION BEFORE SII GOES LIVE. THE CHALLENGE REMAINS FOR FIRMS AS TO HOW AND WHAT THEY WILL COMMUNICATE WITH INVESTORS ONCE WE ARE IN A SII WORLD.
16 EUROPEAN INSURANCE GROUPS ACROSS UK, FRANCE, GERMANY, ITALY AND SWITZERLAND HAVE PARTICIPATED IN THE 2015 KPMG DISCLOSURES SURVEY WHICH SEEKS TO PROVIDE INSIGHTS ON THESE CHALLENGES AND BUILD UPON WHAT WE LEARNT FROM OUR 2014 SURVEY.
This survey is a continuation of the KPMG disclosures survey conducted in 2014. The survey builds on last year’s survey
and covers the following areas:
■ SII disclosures prior to and post SII implementation.
■ Cash disclosures and IFRS.
■ Embedded Value (EV) and New Business disclosures.
■ Economic Capital (EC) and Risk Adjusted Performance Metrics (RAPM).
16 leading European insurance groups across UK, France, Germany, Italy and Switzerland completed the survey in
September 2015. The participants who have agreed to be named are: AEGON, Allianz, Aviva, Generali, Legal & General,
Lloyds Banking Group, Munich Re, Old Mutual, Phoenix, Prudential, Standard Life and Zurich.
For data protection and commercial confidentiality reasons, individual responses have been treated with the strictest
confidence. The results published are in aggregate format only.
We would like to point out that the information contained in this report is of a general nature and it is not intended to
address the circumstances of any particular individual or entity.
Although we have tried to provide timely and accurate information we cannot guarantee that this information was
accurate at the date it was received or that it will continue to be accurate in the future. Indeed, as firms continue to
evolve their thinking on the subject, we would expect their views to evolve as well.
No one should act on any information contained in this report without appropriate professional advice and a thorough
examination of their particular situation.
SII is just round the corner and firms are developing their thinking on their approach to public reporting in this new
environment. Our aim is to provide insights on the implications of SII on the public reporting that European quoted
insurance companies will produce for investors.
In particular, the analysis covers what firms intend to disclose for SII prior to and after formal SII reporting begins and the
changes firms expect to make to their financial framework in light of SII.
SOLVENCY II EXPOSED 3
© 2015 KPMG LLP, a UK limited liability partnership and a member firm of the KPMG network of independent member firms affiliated with KPMG International
Cooperative (“KPMG International”), a Swiss entity. All rights reserved.
SOLVENCY II EXPOSED
Executive summary
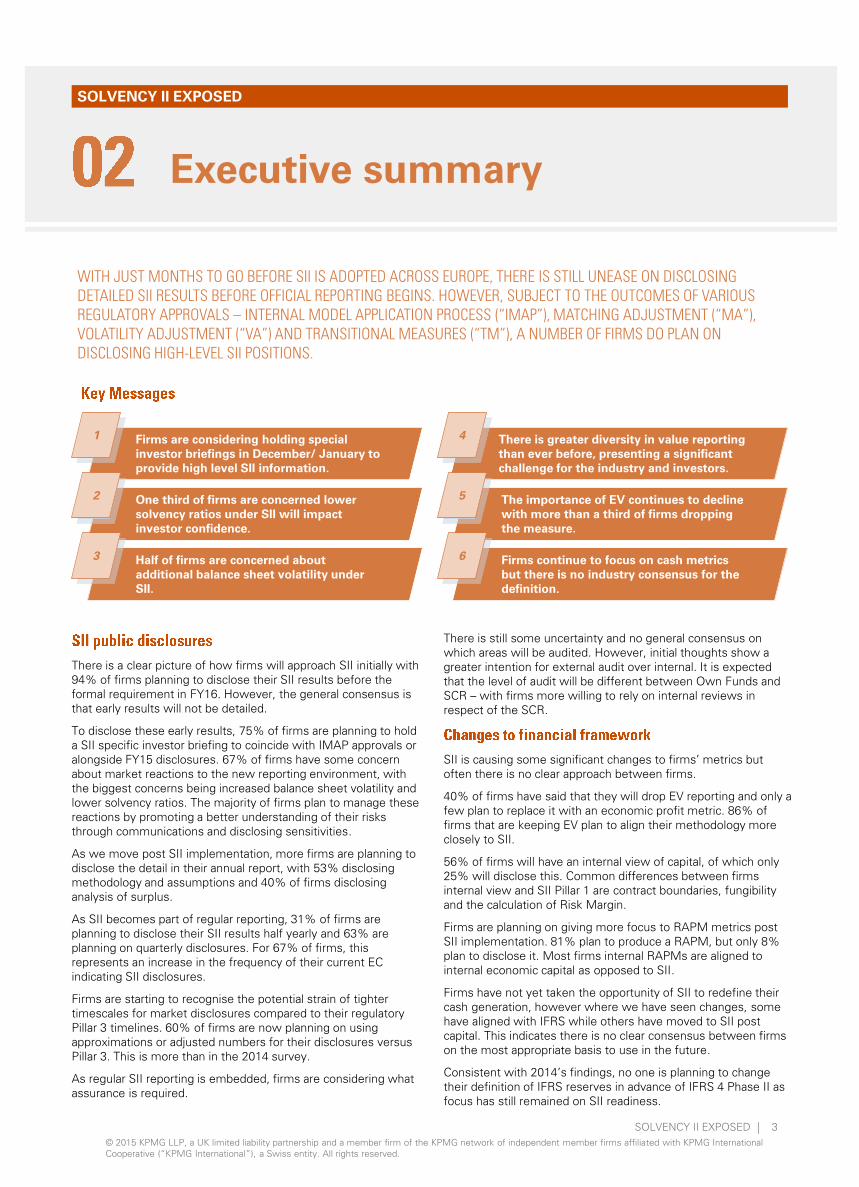
WITH JUST MONTHS TO GO BEFORE SII IS ADOPTED ACROSS EUROPE, THERE IS STILL UNEASE ON DISCLOSING DETAILED SII RESULTS BEFORE OFFICIAL REPORTING BEGINS. HOWEVER, SUBJECT TO THE OUTCOMES OF VARIOUS REGULATORY APPROVALS – INTERNAL MODEL APPLICATION PROCESS (“IMAP”), MATCHING ADJUSTMENT (“MA”), VOLATILITY ADJUSTMENT (“VA”) AND TRANSITIONAL MEASURES (“TM”), A NUMBER OF FIRMS DO PLAN ON DISCLOSING HIGH-LEVEL SII POSITIONS.
There is a clear picture of how firms will approach SII initially with
94% of firms planning to disclose their SII results before the
formal requirement in FY16. However, the general consensus is
that early results will not be detailed.
To disclose these early results, 75% of firms are planning to hold
a SII specific investor briefing to coincide with IMAP approvals or
alongside FY15 disclosures. 67% of firms have some concern
about market reactions to the new reporting environment, with
the biggest concerns being increased balance sheet volatility and
lower solvency ratios. The majority of firms plan to manage these
reactions by promoting a better understanding of their risks
through communications and disclosing sensitivities.
As we move post SII implementation, more firms are planning to
disclose the detail in their annual report, with 53% disclosing
methodology and assumptions and 40% of firms disclosing
analysis of surplus.
As SII becomes part of regular reporting, 31% of firms are
planning to disclose their SII results half yearly and 63% are
planning on quarterly disclosures. For 67% of firms, this
represents an increase in the frequency of their current EC
indicating SII disclosures.
Firms are starting to recognise the potential strain of tighter
timescales for market disclosures compared to their regulatory
Pillar 3 timelines. 60% of firms are now planning on using
approximations or adjusted numbers for their disclosures versus
Pillar 3. This is more than in the 2014 survey.
As regular SII reporting is embedded, firms are considering what
assurance is required.
There is still some uncertainty and no general consensus on
which areas will be audited. However, initial thoughts show a
greater intention for external audit over internal. It is expected
that the level of audit will be different between Own Funds and
SCR – with firms more willing to rely on internal reviews in
respect of the SCR.
SII is causing some significant changes to firms’ metrics but
often there is no clear approach between firms.
40% of firms have said that they will drop EV reporting and only a
few plan to replace it with an economic profit metric. 86% of
firms that are keeping EV plan to align their methodology more
closely to SII.
56% of firms will have an internal view of capital, of which only
25% will disclose this. Common differences between firms
internal view and SII Pillar 1 are contract boundaries, fungibility
and the calculation of Risk Margin.
Firms are planning on giving more focus to RAPM metrics post
SII implementation. 81% plan to produce a RAPM, but only 8%
plan to disclose it. Most firms internal RAPMs are aligned to
internal economic capital as opposed to SII.
Firms have not yet taken the opportunity of SII to redefine their
cash generation, however where we have seen changes, some
have aligned with IFRS while others have moved to SII post
capital. This indicates there is no clear consensus between firms
on the most appropriate basis to use in the future.
Consistent with 2014’s findings, no one is planning to change
their definition of IFRS reserves in advance of IFRS 4 Phase II as
focus has still remained on SII readiness.
Firms are considering holding special
investor briefings in December/ January to
provide high level SII information.
1There is greater diversity in value reporting
than ever before, presenting a significant
challenge for the industry and investors.
4
One third of firms are concerned lower
solvency ratios under SII will impact
investor confidence.
2The importance of EV continues to decline
with more than a third of firms dropping
the measure.
5
Half of firms are concerned about
additional balance sheet volatility under
SII.
3Firms continue to focus on cash metrics
but there is no industry consensus for the
definition.
6
4 SOLVENCY II EXPOSED
© 2015 KPMG LLP, a UK limited liability partnership and a member firm of the KPMG network of independent member firms affiliated with KPMG International
Cooperative (“KPMG International”), a Swiss entity. All rights reserved.
SOLVENCY II EXPOSED
Solvency II public disclosures
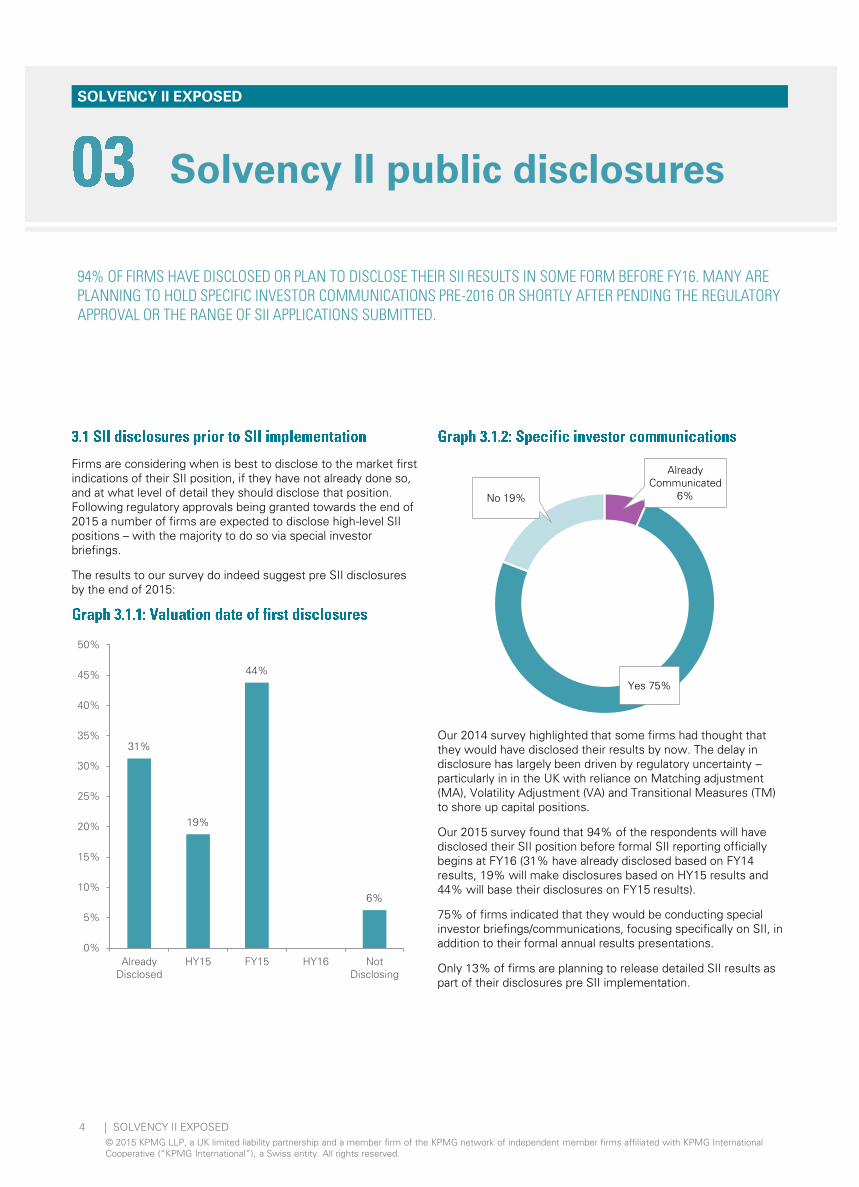
94% OF FIRMS HAVE DISCLOSED OR PLAN TO DISCLOSE THEIR SII RESULTS IN SOME FORM BEFORE FY16. MANY ARE PLANNING TO HOLD SPECIFIC INVESTOR COMMUNICATIONS PRE-2016 OR SHORTLY AFTER PENDING THE REGULATORY APPROVAL OR THE RANGE OF SII APPLICATIONS SUBMITTED.
Firms are considering when is best to disclose to the market first
indications of their SII position, if they have not already done so,
and at what level of detail they should disclose that position.
Following regulatory approvals being granted towards the end of
2015 a number of firms are expected to disclose high-level SII
positions – with the majority to do so via special investor
briefings.
The results to our survey do indeed suggest pre SII disclosures
by the end of 2015:
31%
19%
44%
6%
0%
5%
10%
15%
20%
25%
30%
35%
40%
45%
50%
Already
Disclosed
HY15 FY15 HY16 Not
Disclosing
Already
Communicated
6%
Yes 75%
No 19%
Our 2014 survey highlighted that some firms had thought that
they would have disclosed their results by now. The delay in
disclosure has largely been driven by regulatory uncertainty –
particularly in in the UK with reliance on Matching adjustment
(MA), Volatility Adjustment (VA) and Transitional Measures (TM)
to shore up capital positions.
Our 2015 survey found that 94% of the respondents will have
disclosed their SII position before formal SII reporting officially
begins at FY16 (31% have already disclosed based on FY14
results, 19% will make disclosures based on HY15 results and
44% will base their disclosures on FY15 results).
75% of firms indicated that they would be conducting special
investor briefings/communications, focusing specifically on SII, in
addition to their formal annual results presentations.
Only 13% of firms are planning to release detailed SII results as
part of their disclosures pre SII implementation.

SOLVENCY II EXPOSED 5
© 2015 KPMG LLP, a UK limited liability partnership and a member firm of the KPMG network of independent member firms affiliated with KPMG International
Cooperative (“KPMG International”), a Swiss entity. All rights reserved.
SOLVENCY II EXPOSED
Last year firms were approaching the disclosure of SII results pre
FY16 on a ‘minimum expectations’ basis with the focus on own
funds, SCR and surplus pre and post SII implementation. Firms’
views were driven by what had been disclosed in estimated
results to date. While this remains true to some extent for 2015,
firms now have a much clearer picture of what they will be
disclosing before SII implementation.
There is still uncertainty around what analysis will accompany
disclosed results for FY16 and beyond. While some firms
indicated they were still considering the area, most firms now
have a clearer idea of what they expect to produce even if there
isn’t yet consensus across the industry.
The results below show us what firms are currently thinking in
2015 about what SII metrics they will disclose pre and post
implementation in 2016:
Solvency II public disclosures
AROUND HALF OF FIRMS WILL INCLUDE SII NUMBERS IN THEIR ANNUAL REPORT BEFORE OFFICIAL REPORTING BEGINS, SUPPORTED HIGH LEVEL COMMENTARY. ALMOST ALL FIRMS PLAN TO DISCLOSE SOLVENCY RATIOS BUT OTHERWISE THERE ISN’T A CLEAR CONSENSUS ON WHAT ANALYSIS SHOULD BE INCLUDED AS PART OF EARLY DISCLOSURE OR AS PART OF ONGOING ANNUAL REPORTS.
It has become clear from this year’s survey that the SII metric
used across the industry will be the solvency ratio. There is then
a split with some firms expecting to provide limited additional
information and others who will provide much more detail
including own funds (73%), SCR (73%) and surplus (67%) and
supporting analysis.
Initially a majority of firms plan to include reconciliations to other
metrics and sensitivities to help inform investors. Post SII, more
than half of Internal Model firms plan to improve understanding
by including more commentary on drivers, an analysis of surplus
and more details about the methodology and assumptions.
Generally Internal Model firms are planning to include more of the
items listed above than Standard Formula firms.
100%
73%
73%
73%
67%
67%
67%
53%
40%
40%
33%
13%
7%
13%
0% 10% 20% 30% 40% 50% 60% 70% 80% 90% 100%
Solvency ratios
Own Funds
SCR
Sensitivities / scenarios
Surplus (i.e.Own Funds minus SCR)
Reconciliation to other reporting metrics
Commentary on results underlying drivers
Methodology and assumptions
Analysis of surplus
Diversification benefit
P&L statement
Balance Sheet
Future outlook
Projections
Other
Before FY16
FY16 Onwards

6 SOLVENCY II EXPOSED
© 2015 KPMG LLP, a UK limited liability partnership and a member firm of the KPMG network of independent member firms affiliated with KPMG International
Cooperative (“KPMG International”), a Swiss entity. All rights reserved.
SOLVENCY II EXPOSED
Firms will have to consider on which capital basis they will
manage their business and which solvency ratios they plan to
disclose. We have already seen that the SII Pillar 1 coverage ratio
has contributed to the rationale behind some recent corporate
actions such as planned mergers and capital raising or
optimisation initiatives. Firms will also have to consider to what
level of granularity they want to disclose their results.
Our results below suggest that the SII Pillar 1 coverage ratio will
remain the popular focus post SII and that disclosures will mainly
be at a Group level:
Solvency II public disclosures
LOOKING FORWARD FIRMS ARE MOVING TO PLACE GREATER EMPHASIS ON THEIR SII PILLAR 1 SOLVENCY RATIO IN MANAGING THEIR BUSINESS. FEW FIRMS ARE PLANNING TO DISCLOSE SII RESULTS AT ANYTHING OTHER THAN A GROUP LEVEL.
87% of firms indicated that the SII Pillar 1 solvency ratio would
receive the most focus post SII implementation, with 67% of
those firms also planning to disclose an associated target ratio.
7% of firms said that they would focus managing their business
using EC and 13% of firms said they would disclose both SII Pillar
1 and EC target ratios.
The firms who selected other suggested that they will be
focusing on SII Pillar 1 surplus rather than target ratios.
The expected level of granularity of SII disclosures is similar to
the results of the 2014 survey with all firms disclosing at a group
level but few firms planning to disclose results at a more granular
level.
SII Pillar 1
87%
Economic
Capital
6%
Other
7%
79%
7% 7% 7%
100%
29%
14%
7%
0%
20%
40%
60%
80%
100%
Group Region Country MU LOB
Pre SII Post SII

SOLVENCY II EXPOSED 7
© 2015 KPMG LLP, a UK limited liability partnership and a member firm of the KPMG network of independent member firms affiliated with KPMG International
Cooperative (“KPMG International”), a Swiss entity. All rights reserved.
SOLVENCY II EXPOSED
IT APPEARS THAT SII WILL DRIVE INCREASED FREQUENCY OF PUBLIC DISCLOSURES WITH 94% OF FIRMS PLANNING TO DISCLOSE SII RESULTS EITHER HALF YEARLY OR QUARTERLY. JUST OVER HALF OF FIRMS WILL DISCLOSE SII RESULTS IN THEIR FINANCIAL REPORTS ON AN APPROXIMATE BASIS.
31% of companies intend to disclose their SII results half yearly with 63% quarterly and 6% annually. Of those already disclosing EC
or SII, the change for 67% represents an increase in the frequency of their disclosures.
One company indicated they will disclose estimates quarterly and full results half yearly.
Just as last year, no companies indicated that they will be extending reporting timetables to cope with the additional reporting for
FY15. 40% indicated that the same process and numbers would be used to produce Pillar 3 reporting and public disclosures. 60%
indicated that the numbers may differ between disclosures and Pillar 3 reporting due to either approximations or adjustments. We
have seen that some of the firms who participated in both the 2014 and 2015 survey shift their plans towards using more
approximations. This could be reflecting the reality of timely reporting pressures that firms are starting to realise and appreciate in
practice.
There was a mixed response from firms on their plans if they do not receive Internal Model approval in December. 39% will disclose
Standard Formula results, 33% would focus on their EC measure, 17% would use an unapproved internal model, 11% indicated other
options.
Solvency II public disclosures
2016 presents a squeeze on insurers reporting resources as they continue to report under previous regulatory regimes alongside SII.
For some this will be a move to more frequent reporting with shorter timescales leading companies to seek efficiencies where they
exist.
The results to the survey below do suggest a move to more frequent disclosures and use of approximations to cope with the shorter
timescales:
Quarterly
63%
Half yearly
31%
Annually
6%
Same process and
same numbers
will be used 40%
Approximation
for early delivery
33%
Same process used
but P3 results may
differ 27%

8 SOLVENCY II EXPOSED
© 2015 KPMG LLP, a UK limited liability partnership and a member firm of the KPMG network of independent member firms affiliated with KPMG International
Cooperative (“KPMG International”), a Swiss entity. All rights reserved.
SOLVENCY II EXPOSED
At HY15 we have seen more examples of analysts asking increasingly technical questions on SII – for example, sensitivity of EC
coverage ratio to corporate bonds, how the EC coverage ratio will differ from the SII ratio, EC target ranges and what is the future
view of the EC solvency ratio.
Firms may also have concerns about what credit analysts will give for the capital positions they have following successful SII
applications, e.g. MA, VA and TM. The UK regulator (the PRA), issued a statement in July 2015 clarifying that they will give insurers full
credit for transitional benefits when considering their position to be able to pay dividends to their shareholders. The PRA clarified that
the asset created from Transitional Deduction from Technical Provisions (TDTP) will be classified as Tier 1 capital. They also stress that
transitionals are a legitimate form of capital and that any savvy analysts should consider how the TDTP is released over the 16 years in
conjunction with any off-setting benefits of the un-winding of the Risk Margin.
This has prompted this year’s survey to include questions around what insurers think the market reactions to the new reporting
regime and SII applications will be:
Solvency II public disclosures
67% OF FIRMS HAVE CONCERNS ABOUT MARKET REACTIONS TO THE NEW SII REPORTING REGIME. CONCERNS ARE MAINLY DRIVEN BY THE INCREASE IN BALANCE SHEET VOLATILITY UNDER SII AND LOWER COVERAGE RATIOS. FIRMS GENERALLY EXPECT THAT THE ANALYSTS WILL GIVE CREDIT FOR TRANSITIONAL MEASURES, MATCHING ADJUSTMENT AND VOLATILITY ADJUSTMENT IN THEIR ASSESSMENT OF FIRMS’ AVAILABLE CAPITAL.
The majority of firms believe that investors will give credit for all SII applications and 80% of firms agree that investors will give credit
for TM in line with the statement from the PRA.
67% of firms have some concern about market reactions to the new reporting environment. Notably, a third of firms have concerns
over market reactions to lower solvency ratios. 53% have concerns over increase balance sheet volatility.
Of those who have concerns, the majority of these plan to manage these reactions either through their communications or by
disclosing sensitivities to promote better understanding of the key risk drivers. Notably, those who have already disclosed results are
less concerned about market reactions to SII.
80%
93%100%
0%
10%
20%
30%
40%
50%
60%
70%
80%
90%
100%
Transitional
Measures
Matching
Adjustment
Volatility
Adjustment
33%
53%
33%
0% 10% 20% 30% 40% 50% 60%
Yes - due to lower solvency
ratio
Yes - due to increased BS
volatility
No

SOLVENCY II EXPOSED 9
© 2015 KPMG LLP, a UK limited liability partnership and a member firm of the KPMG network of independent member firms affiliated with KPMG International
Cooperative (“KPMG International”), a Swiss entity. All rights reserved.
SOLVENCY II EXPOSED
86%
71%
64%
50%
21%
43% 43%
50%
21%21% 21%
29%
50%
29%
7%
14%
7%
21% 21%
0%
10%
20%
30%
40%
50%
60%
70%
80%
90%
Assets
BE
L
RM
SC
R
MC
R
Ao
C
QR
Ts
SF
CR
RS
R
Other
External Internal
In the lead up to SII implementation a number of companies have
sought assurance either internally or externally. In particular
companies have conducted a gap analysis with the SII regime as
it is currently interpreted to ensure there are no surprises when
results are first released.
More formally, some UK firms have also been asked by the PRA
to participate in a two phase SII assurance review process. Step 1
focussed on the interpretation of SII methodology and Step 2
focussed on the calculation of balance sheet items. This process
may have created awareness and encouraged the need for
assurance within the SII reporting process.
Our survey was completed before the PRA released CP43/15 on
external audit. The consultation paper requires relevant elements
of the SFCR to be externally audited, at a solo and group level,
but excludes the SCR (and consequently the SCR elements of the
RM) for IM firms. Auditors are expected to provide a reasonable
assurance opinion that the ‘Valuation for solvency purposes’ and
‘Capital management’ sections of the SFCR have been properly
prepared.
Solvency II public disclosures
THE MAJORITY OF FIRMS EXPECT TO RECEIVE SOME SORT OF EXTERNAL ASSURANCE ON THEIR SII RESULTS HOWEVER, APART FROM OWN FUNDS (EXCLUDING RISK MARGIN) THERE IS NO CLEAR CONSENSUS YET ON WHAT ASPECTS TO SUBJECT TO EXTERNAL AUDIT.
As well as the PRA, EIOPA indicated in June 2015 their support
for external audit of the main elements of the SFCR (identified as
the balance sheet, Own Funds and capital requirements).
While most companies are intending to get external assurance for
their asset values, BEL and RM. There is no clear consensus from
firms about what other aspects of the SII regime to subject to an
external audit. More firms intend to review their SCR internally.
Those who selected ‘other’ said that they would audit Group
Own Funds.
In general, firms are seeking each item to be externally audited or
internally reviewed, not both.
All of the firms planning to have their QRTs and SFCR audited
externally are also planning to get external assurance for the
underlying elements (i.e. BEL, RM etc.). 29% of firms intend to
externally audit their balance sheet items only, not their
templates or reports.

10 SOLVENCY II EXPOSED
© 2015 KPMG LLP, a UK limited liability partnership and a member firm of the KPMG network of independent member firms affiliated with KPMG International
Cooperative (“KPMG International”), a Swiss entity. All rights reserved.
SOLVENCY II EXPOSED
The implementation of SII has presented companies with an
opportunity to review the full scope of the financial metrics that
they produce and disclose to the market.
The 2014 survey showed that some consideration had been given
to this. Firms were beginning to look at the role of EV post SII
implementation. This thinking has developed in the 2015 survey
as 40% of firms have said they will drop EV reporting post SII,
whilst 13% have said they are undecided on it’s future. While EV
is shown to be declining the use and focus on RAPMs is
increasing.
The results below indicate the metrics firms intend to continue
producing and how focus on these metrics will change post SII.
Changes to financial framework
EV REPORTING IS BECOMING LESS IMPORTANT WITH 40% OF FIRMS PLANNING TO DROP EV
AFTER FY15. CASH AND NEW BUSINESS VALUE REPORTING REMAIN IMPORTANT METRICS
AND THERE IS A GROWING FOCUS PLACED ON RISK ADJUSTED PROFITABILITY METRICS
(RAPM). FIRMS HAVE NOT YET TAKEN THE OPPORTUNITY OF SII TO REDEFINE THEIR CASH
GENERATION, HOWEVER WHERE WE HAVE SEEN CHANGES, THERE IS NO CLEAR
CONSENSUS BETWEEN FIRMS ON THE MOST APPROPRIATE BASIS TO USE IN THE FUTURE.
Where firms are producing metrics they are also disclosing them
to the market. The exception to this is RAPMs which are
generally only used internally for managing the business and are
not disclosed to the public. This may develop over time as firms
without their own EC measure look for ways to demonstrate
profitability in a post SII world rather than just disclosing solvency.
Firms currently use a range of definitions for reporting cash
generation and it was expected that SII would provide an
opportunity to standardise definitions to either an IFRS or SII
basis. However, of the firms who have already changed their
cash definition, some have aligned with IFRS while others have
moved to SII post capital. This indicates there is no clear
consensus between firms on the most appropriate basis to use in
the future.
Firms were also asked if they were planning on changing their
approach to IFRS liabilities ahead of IFRS 4 Phase 2 of which all
said no. This is consistent with the results of the 2014 survey and
the industry thoughts in this area has not changed whilst all the
focus is still on SII.
73%
47%
80%
33%
81%
67%
47%
80%
20%
6%
0%
10%
20%
30%
40%
50%
60%
70%
80%
90%
100%
Cash and
free surplus
Embedded
value
New
business
value
Economic
capital with
a different
view to SII
Pillar 1
Risk
Adjusted
Profitability
Metric
(RAPM)
Produced Disclosed
29%
90%
71%
100%
75%
57%
10%
25%
43%
0% 20% 40% 60% 80% 100%
Cash and free surplus
Embedded value
New business value
Economic capital with a
different view to SII Pillar 1
Risk Adjusted Profitability
Metric (RAPM)
Less Focus Same Focus More Focus

SOLVENCY II EXPOSED 11
© 2015 KPMG LLP, a UK limited liability partnership and a member firm of the KPMG network of independent member firms affiliated with KPMG International
Cooperative (“KPMG International”), a Swiss entity. All rights reserved.
SOLVENCY II EXPOSED
Firms who are planning to continue reporting EV are considering
carefully the appropriateness of using the SII basis for this given
the implications of the valuation approach required such as
contract boundaries, matching adjustments and risk margins for
EV results for certain product classes.
The CFO Forum has not yet issued guidance on how EV
measures should interact with SII although we would expect
some form of clarification before SII goes live on 1 January 2016.
The results below show the metrics that firms intend to report in
the future and changes to their EV methodology in light of SII and
are expressed as a percentage of firms who will be producing EV.
Changes to financial framework
THE MAJORITY OF FIRMS KEEPING EV ARE PLANNING TO CHANGE THEIR METHODOLOGY TO ALIGN WITH SII. SOME FIRMS WILL MAKE ADJUSTMENTS TO ALLOW FOR CONTRACT BOUNDARIES. AS A RESULT EV IS EXPECTED TO BE LESS COMPARABLE BETWEEN FIRMS IN FUTURE.
We found that the impact of SII on EV is pronounced with 86% of
firms continuing with EV saying they would change their EV
methodology to align with SII in some way. The main changes are
aligning capital, making adjustments to bring EV cashflows more
in line with SII and aligning discount rates.
The different adjustments made to EV by firms, to take SII into
account for their economic definitions, will cause methodology to
diverge between firms. This is problematic for a metric that was
designed to improve comparability between firms.
14%
14%
57%
71%
86%
0% 20% 40% 60% 80% 100%
Other
Adjustments to cashflows (i.e
contract boundaries)
Align discount rate to SII
Align embedded value cashflows to
SII
Align capital requirements to SII
14%
43%
43%
43%
43%
71%
0% 50% 100%
Other
EV profit
EV analysis of earnings
VIF
VIF emergence
MCEV

12 SOLVENCY II EXPOSED
© 2015 KPMG LLP, a UK limited liability partnership and a member firm of the KPMG network of independent member firms affiliated with KPMG International
Cooperative (“KPMG International”), a Swiss entity. All rights reserved.
SOLVENCY II EXPOSED
Aspects of SII, in particular contract boundaries, are particularly
onerous for reporting new business on certain types of products.
As a result firms are concerned about their ability to demonstrate
the value added by new business using a purely SII basis.
Firms are responding to this by opting to continue reporting new
business in a manner consistent with their current new business
reporting or moving to align with an adjusted SII basis. This raises
concern over how firms will manage the disconnect between the
basis on which new business is valued and in force business is
managed, adding complexity to effective management.
There will also be a diversity of new business reporting as firms
make different adjustments for SII. This will make it more difficult
for investors to compare new business values between
companies.
The results below indicate the new business metrics firms will
disclose and the intended bases and are expressed as a
percentage of firms who will be producing new business metrics.
Changes to financial framework
FEW FIRMS INDICATED THAT THEY PLAN TO USE PURE SII AS A BASIS FOR VALUING NEW BUSINESS, WITH MOST FIRMS INDICATING THEY WILL USE AN ADJUSTED SII BASIS OR ALTERNATIVE MEASURES. THIS INDICATES THAT FIRMS ARE NOT CONFIDENT THAT SII PROVIDES A GOOD FRAMEWORK FOR ASSESSING AND DEMONSTRATING NEW BUSINESS VALUE. AS WITH EV, NEW BUSINESS VALUES ARE EXPECTED TO BE LESS EASILY COMPARABLE BETWEEN FIRMS.
Of the firms intending to continue disclosing new business metrics, all of them will disclose VNB. Those firms aligning their new
business metrics to SII will make adjustments for contract boundaries and the cost of capital.
27% of the firms will disclose their new business strain before the impact of SII capital requirements.
Align to SII
18%
Align to SII
with
adjustments
18%
Not aligned
to SII
46%
Undecided
18%
67%
83%
100%
75%
67%
25%
25%
33%
25%
0% 50% 100%
Premiums including APE
PVNBP
Value of new business
New business margin
New business strain
IRR
Payback periods
Contribution to SII own…
Contribution to SII Surplus
After capital
and with
buffers
37%
Before
Capital
27%
After capital
and without
buffers
18%
Undecided
18%

SOLVENCY II EXPOSED 13
© 2015 KPMG LLP, a UK limited liability partnership and a member firm of the KPMG network of independent member firms affiliated with KPMG International
Cooperative (“KPMG International”), a Swiss entity. All rights reserved.
SOLVENCY II EXPOSED
Although SII Pillar 1 is meant to represent an economic view of capital, there are a number of areas where firms have a different view
of the true 'economic' position. Of the 56% of firms that have an internal view of capital different to SII Pillar 1, these are the key
differences:
Changes to financial framework
MOST FIRMS HOLD AN INTERNAL VIEW OF THEIR BALANCE SHEET THAT DIFFERS FROM SII PILLAR 1. IN PARTICULAR 78% OF FIRMS WITH AN INTERNAL VIEW DON’T AGREE WITH THE SII TREATMENT OF CONTRACT BOUNDARIES. OTHER KEY DIFFERENCES ARE ON SII’S FUNGIBILITY RESTRICTIONS AND THE RISK MARGIN. ONLY 25% OF FIRMS WHO CURRENTLY DISCLOSE EC SAID THEY WILL CONTINUE DISCLOSE THIS POST SII.
The most common adjustments that firms intend to make are the removal of contract boundaries which is in line with the 2014
survey’s findings. This is a reflection of the survey participants for whom regular premium savings products form a significant part of
the product portfolio, which is most affected by the SII contract boundary rules. A number of firms are considering alterations to the
Risk Margin, in particular by changing the cost of capital.
Of the 56% of firms who said they will hold an internal view of capital post SII, only 25% will disclose this to the market. They are
most likely to do so by presenting reconciliations to the SII Pillar 1 capital requirements. It’s worth noting that 25% of firms who
currently disclose EC will continue to do so post SII. This suggests that even though firms may be managing their business based on
an internal view of capital, they will focus on regulatory capital in disclosures to the market. Firms are aiming to avoid confusion in the
market place from disclosing varying different capital positions.
11%
22%
22%
33%
33%
33%
44%
44%
56%
56%
56%
78%
0% 10% 20% 30% 40% 50% 60% 70% 80% 90%
Different confidence intervals used in risk calibrations
Removal of SII capital tiering limits
Inclusion of equivalence (parent / subsidiaries)
Treatment of non-insurance subsidiaries
Risk definition
Removal of risk margin
Allowance for pension scheme valuations
Dependency risk definition calibrations/correlations
Risk free rate adjustments
Removal of SII fungibility restrictions
Different risk margin cost of capital assumption
Removal of SII contract boundaries

14 SOLVENCY II EXPOSED
© 2015 KPMG LLP, a UK limited liability partnership and a member firm of the KPMG network of independent member firms affiliated with KPMG International
Cooperative (“KPMG International”), a Swiss entity. All rights reserved.
SOLVENCY II EXPOSED
RAPMs is an area of increasing interest to firms seeking to
demonstrate value and profitability in a post SII environment,
particularly given the decline in reporting and emphasis of EV. It
appears that the main role of RAPMs will be to provide internal
management information given most firms are not disclosing
these metrics to the market. A potential challenge for firms will
be juggling dual metrics and managing messages to the market if
actions are taken based on the internal metrics that are at odds
with the disclosed metrics.
The results below show the planned use of RAPMs and their
importance in different business areas for firms where they are
currently in use.
Changes to financial framework
FIRMS ARE PLACING INCREASED FOCUS ON RAPMS INTERNALLY ACROSS PRODUCT DEVELOPMENT/PRICING, RISK MANAGEMENT AND INVESTMENT STRATEGY BUT FEW PLAN TO INCLUDE THEM IN THEIR DISCLOSURES OR LINK DIRECTLY TO REMUNERATION.
81% of firms indicated that they will produce RAPMs in the
future. A number of firms indicated that whilst they currently
produce a RAPM they are looking to embed it further into the
business units.
The survey indicated a shift in the definition of profit used in the
RAPM numerator from IFRS/SI profits towards SII profits in the
future. Those companies currently using a change in EV or
change in EC measure intend to continue doing so. 67% of firms
are including a cost of capital in their profit measure.
The definition of capital in the RAPM denominator has a clearer
consensus with 86% of firms using a multiple of internal EC and
14% using a multiple of SII SCR.
As expected RAPMs will receive the most attention in product
development/pricing, risk management and investment strategy.
Given their importance in these areas it is slightly surprising that
firms are not placing more emphasis on them in remuneration.
18%27% 27%
18%27%
18%9% 9%
18%27%
45%
36%27%
45%36%
18%
45% 45%
0%
10%
20%
30%
40%
50%
60%
70%
80%
90%
100%
Product
Development
and product
pricing
Performance
management
Remuneration Risk
management
Investment
strategy
None Low Medium High
Yes
75%
No and won't in
future
19%
No but will in
future
6%

15 SOLVENCY II EXPOSED
© 2015 KPMG LLP, a UK limited liability partnership and a member firm of the KPMG network of independent member firms affiliated with KPMG International
Cooperative (“KPMG International”), a Swiss entity. All rights reserved.
SOLVENCY II EXPOSED
KPMG contacts
Ferdia Byrne
Partner
KPMG in the UK
Tel: +44 (0) 20 7694 2984
David Honour
Director
KPMG in the UK
Tel: +44 (0) 20 7694 2358
Richard Dyble
Executive Advisor
KPMG in the UK
Tel: +44 (0) 11 7905 4287
Thomas Filipinski
Executive Advisor
KPMG in the UK
Tel: +44 (0) 20 7694 4293
Viviane Leflaive
Partner
KPMG in France
Tel: +33155686227
Jeroen van Wageningen
Partner
KPMG in the Netherlands
Tel: +31 20 656 2409
Antonella Chiricosta
Partner
KPMG in Italy
Tel: +3906809711
Peter Ott
Partner
KPMG in Germany
Tel: +49 89 9282 1839

16 SOLVENCY II EXPOSED
© 2015 KPMG LLP, a UK limited liability partnership and a member firm of the KPMG network of independent member firms affiliated with KPMG International
Cooperative (“KPMG International”), a Swiss entity. All rights reserved.
The information contained herein is of a general nature and is not intended to address the circumstances of any particular individual or entity. Although we endeavour to provide accurate and timely
information, there can be no guarantee that such information is accurate as of the date it is received or that it will continue to be accurate in the future. No one should act on such information without
appropriate professional advice after a thorough examination of the particular situation.
© 2015 KPMG LLP, a UK limited liability partnership and a member firm of the KPMG network of independent member firms affiliated with KPMG International Cooperative (“KPMG International”), a
Swiss entity. All rights reserved.
The KPMG name, logo and “cutting through complexity” are registered trademarks or trademarks of KPMG International.