ETSAP R&D Proposals
27
TIMES Model Management Systems Basics ETSAP R&D Proposals Analytics Multi-case Comparison XLS TIMES-Starter Phase II Gary Goldstein, DecisionWare ETSAP Semi-annual Workshop October 22-23, 2015 Sophia-Antipolis, France
-
Upload
iea-etsap -
Category
Data & Analytics
-
view
216 -
download
0
Transcript of ETSAP R&D Proposals

© OECD/IEA 2011TIMES Model Management Systems Basics
ETSAP R&D Proposals
Analytics Multi-case Comparison XLSTIMES-Starter Phase II
Gary Goldstein, DecisionWare
ETSAP Semi-annual WorkshopOctober 22-23, 2015
Sophia-Antipolis, France
© OECD/IEA 2011TIMES Model Management Systems Basics
Analytics Multi-case Comparison XLS
2ETSAP R&D - AnalyticsXLS
© OECD/IEA 2011 TIMES Model Management Systems Basics
Analytics XLSOverview
3 3
Excel workbook “linked” to VBE means of the UpdateXLS
feature
Standards tables have scenario, 1-row qualifier with total, &
periods [though any VBE can be dumped & supplemental
calculations done as well]
Provides dynamic comparison of 4 (to 6) model runs
Core features:
Stacked bar charts of Reference (1st) scenario blow-up, side-by-side
of comparison scenarios, difference from Reference
1st/last period shares with pie charts, and growth/total over model
horizon
Metrics sheet with main indicators over the horizon
Handles multi-region details via a aggregate and separate region
specific workbooks
Serves as specification mechanism for VedaViz preparation
ETSAP R&D - AnalyticsXLS
© OECD/IEA 2011 TIMES Model Management Systems Basics
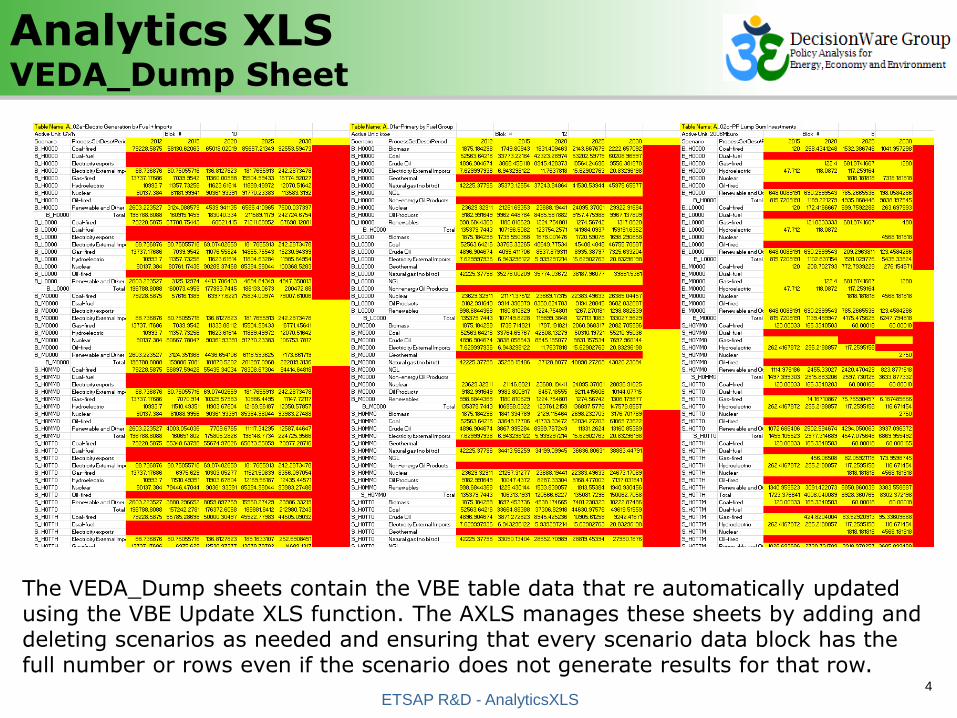
Analytics XLSVEDA_Dump Sheet
4 4
The VEDA_Dump sheets contain the VBE table data that re automatically updated using the VBE Update XLS function. The AXLS manages these sheets by adding and deleting scenarios as needed and ensuring that every scenario data block has the full number or rows even if the scenario does not generate results for that row.
ETSAP R&D - AnalyticsXLS

© OECD/IEA 2011 TIMES Model Management Systems Basics
Analytics XLSScenario Master Control Sheet
5 5
The Scenario control sheet is used to select the scenarios to be compared and determine their order of graphing, as well as managing the list of scenarios in the workbook (to keep them aligned with those in VBE). It also presents the System Cost values for all scenarios.
ETSAP R&D - AnalyticsXLS
© OECD/IEA 2011 TIMES Model Management Systems Basics
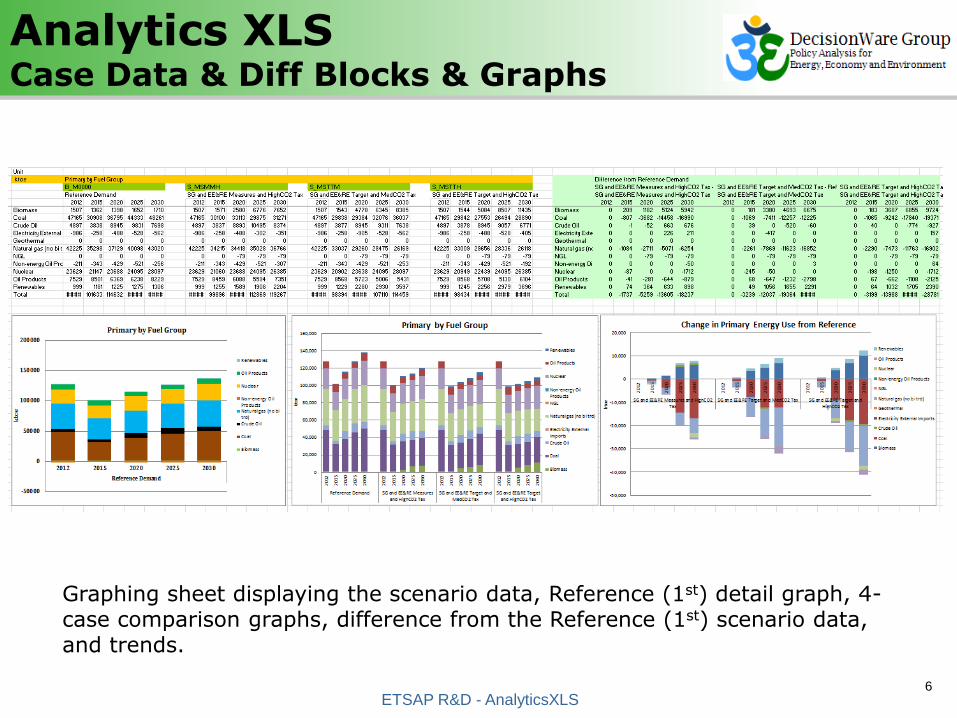
Analytics XLSCase Data & Diff Blocks & Graphs
6 6
Graphing sheet displaying the scenario data, Reference (1st) detail graph, 4-case comparison graphs, difference from the Reference (1st) scenario data, and trends.
ETSAP R&D - AnalyticsXLS

© OECD/IEA 2011 TIMES Model Management Systems Basics
Analytics XLSShares, Diff, Growth & Change Block
7 7
This portion of each graphing sheet provides relative information on first and last period shares, difference, growth and cumulative amount over the model horizon. It also provides relative changes between the Reference and other scenarios.
ETSAP R&D - AnalyticsXLS

© OECD/IEA 2011 TIMES Model Management Systems Basics
Analytics XLSMetrics Sheet
8 8
The Metrics presents aggregated results for key model metrics, such as System Cost, Primary Energy, Final Energy, Electricity Generation, New Power Plant Builds, Investment in Supply Technologies and Demand devices, Fuel expenditures, Emissions, etc. It also contains an archive section where summary results from every scenario can be stored.
ETSAP R&D - AnalyticsXLS
© OECD/IEA 2011TIMES Model Management Systems Basics
TIMES-Starter Model Phase II
9ETSAP R&D - AnalyticsXLS

© OECD/IEA 2011 TIMES Model Management Systems Basics
TIMES-Starter Phase IIStatus
10 10ETSAP R&D – TIMES-Starter Phase II
Initial Prototype operational
Demonstrates the Starter concept &
mechanisms
Model runs reasonably but needs fine-tuning
VBE & Analytics graphing workbook in place
Debuted (with some rough edges) at the IEA-
ERI training in China last week [prompting
this late submission to the ExCo]
© OECD/IEA 2011 TIMES Model Management Systems Basics
TIMES-StarterIEA Feedback from ERI Workshop
11 11ETSAP R&D – TIMES-Starter Phase II
"The TIMES-Starter seems to be a valuable tool for someone with no TIMES experience that wishes to set up a new model, the structure it provides is certainly a step forward compared to what is currently available. We very much appreciate the development of such a
starter model for capacity-building purposes, given the potential shown at the ERI training in Beijing, and look forward to collaborate further with ETSAP in possible
future occasions on capacity-building for energy systems modelling. Furthermore, we will be happy to
test future versions of the TIMES-Starter model to provide comments and data where possible."

© OECD/IEA 2011 TIMES Model Management Systems Basics
TIMES-StarterOrganization* & Dependencies
12 12
Energy Balance
[EB_<cnty>(yr)]
Existing &
Calibration
[BY-<sect>]
New
Technologies
[NT-<sect>]
Demand
Projection
[Demand-REF]
Supply
[SUP]
Reference
Guidance
[UC-<sect>]
Industry
Controls
[IND-*]
* All workbooks to be loaded into ANSWER start with ATx_<country>*,
with x=null for ver1 and “2” for ver2 ANSWER “Smart” XLS format
ETSAP R&D – TIMES-Starter Phase II
© OECD/IEA 2011 TIMES Model Management Systems Basics
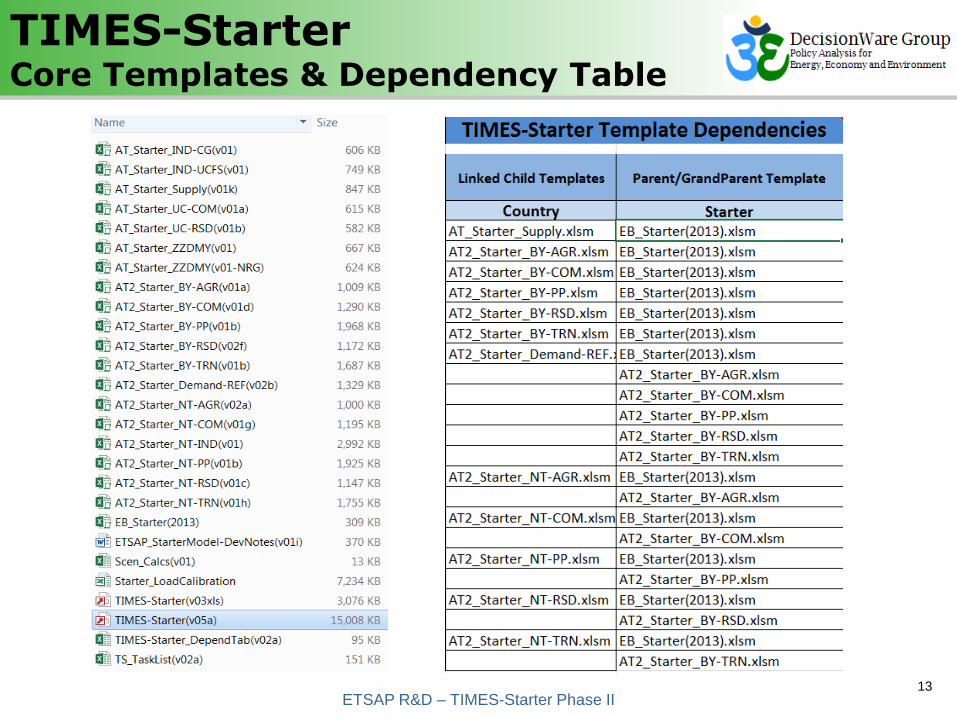
TIMES-StarterCore Templates & Dependency Table
13 13ETSAP R&D – TIMES-Starter Phase II

© OECD/IEA 2011 TIMES Model Management Systems Basics
TIMES-StarterSmart Workbooks Structure
14
[1] For v1 templates the Commodities, Process and UC declarations are provided on the Items sheet.[2] For the v1 templates data is loaded from the TS&TID Data sheet for standard processes and UCs, and from separate TOP/TID/TS_Datasheets for Supply.
TIMES-Starter Model Overview
Worksheet Description
ANSv6.8/9-Home
ANSWER-TIMES template sheet that is used to add new ANSWER-TIMES smart sheet to the current
workbook, or turn an existing XLS/XLSM into a "smart" workbook. [Note that the v1 workbooks all begin with
AT_ and the v2 workbooks with AT2_.]
SETUP
Mapping of EPA-US9r/other names to TIMES TIMES-Starter names and removal of unwanted items, emission
factors, and USD price conversion factors. The Setup sheet links to the EB workbook for the list of commodities
and emission rates.
EB Information for the Energy Balance workbook for the sector. [BYs only]
CalibrationThe calculation sheet where the energy balance is apportioned and the initial year technology stock established
for each sector. [BYs only]
REGIONSDescription of Regions for the Database where this instance of the New Techs will be used. [Only active on
Supply template.]
Commodities
Energy carriers, emissions, materials are defined by their name, description, units and set memberships to be
used in the rest of the sheets. In V1 templates commodity groups may also be declared. These are in turn
controlled by the SETUP sheet, in most cases. [Some v1 templates have an ITEMS sheet that contains both
commodity and process declarations.]
Processes
Process technologies are defined by their name, description, units and set memberships to be used in the rest
of the sheets. These are in turn controlled by the SETUP sheet, in most cases. [Some V1 templates have an
ITEMS sheet that contains both commodity and process declarations.]
CommDataA sheet with the data for commodities in the sector (mostly used for mapping sector emissions to overall
emissions and providing demand levels and load timings.
ProcData_<nature>One or more sheets with the data for all technologies in the sector. [Note that the V1 templates have separate
TID & TS sheets.]
EPA/ETSAP/PIEM/KIS
R/EC/other_<sheet>
Declaration and data sheets from the EPA-US9r (and perhaps other sources including but not limited to IEA,
ETSAP eTech-DS/Pak-IEM/Kuwait-RE/Energy Community-EE databases) providing the source values for the
technology options.
ETSAP R&D – TIMES-Starter Phase II

© OECD/IEA 2011 TIMES Model Management Systems Basics
TIMES-StarterMARKAL US9r to TIMES
15
TIMES-Starter Model OverviewETSAP R&D – TIMES-Starter Phase II
© OECD/IEA 2011 TIMES Model Management Systems Basics
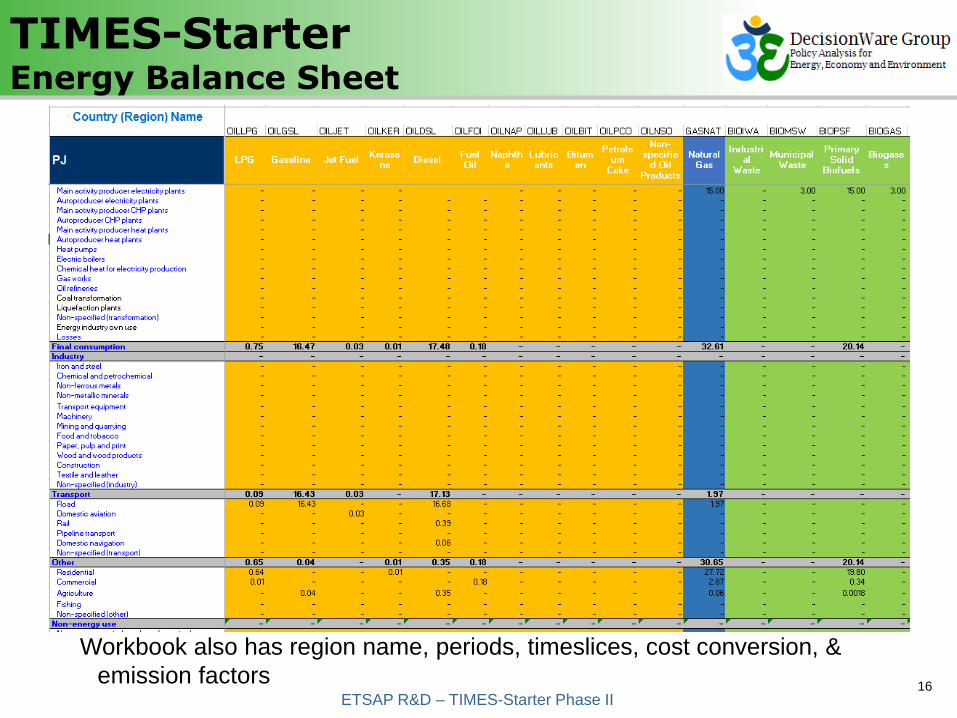
TIMES-StarterEnergy Balance Sheet
16
TIMES-Starter Model Overview
Workbook also has region name, periods, timeslices, cost conversion, &
emission factorsETSAP R&D – TIMES-Starter Phase II

© OECD/IEA 2011 TIMES Model Management Systems Basics
TIMES-StarterResidential Naming & Heating Devices
17
TIMES-Starter Model OverviewETSAP R&D – TIMES-Starter Phase II
© OECD/IEA 2011 TIMES Model Management Systems Basics
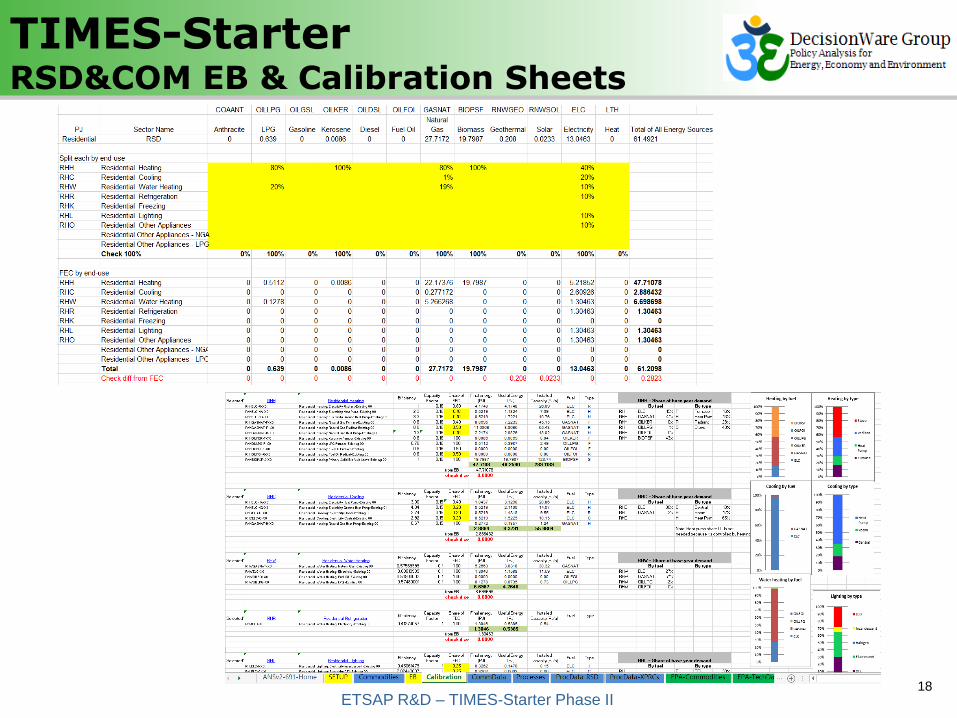
TIMES-StarterRSD&COM EB & Calibration Sheets
18
TIMES-Starter Model OverviewETSAP R&D – TIMES-Starter Phase II
© OECD/IEA 2011 TIMES Model Management Systems Basics
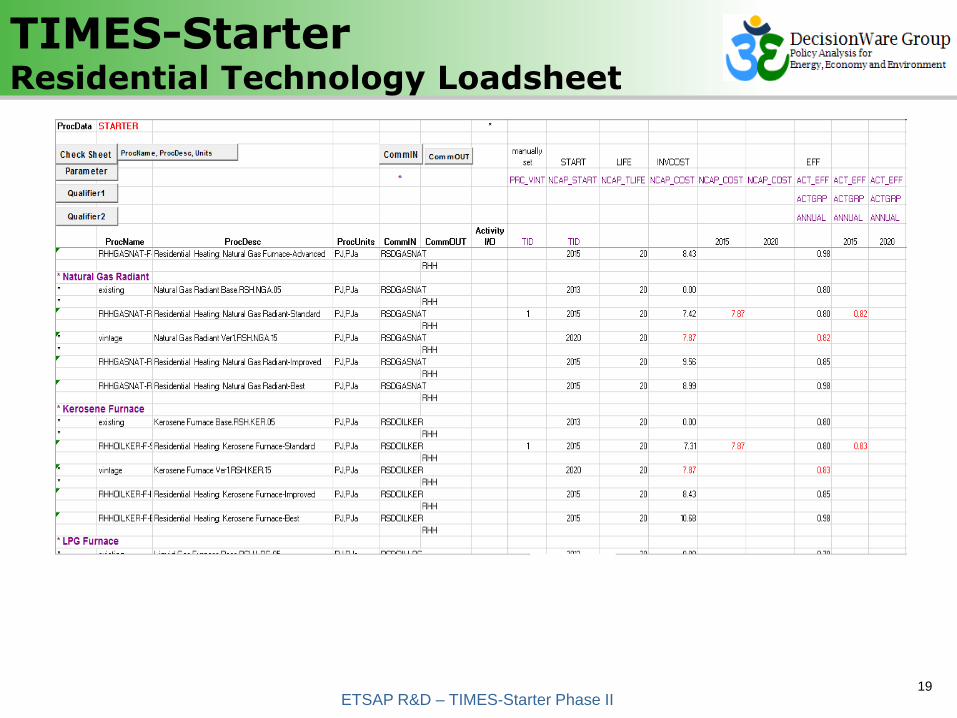
TIMES-StarterResidential Technology Loadsheet
19
TIMES-Starter Model OverviewETSAP R&D – TIMES-Starter Phase II
© OECD/IEA 2011 TIMES Model Management Systems Basics
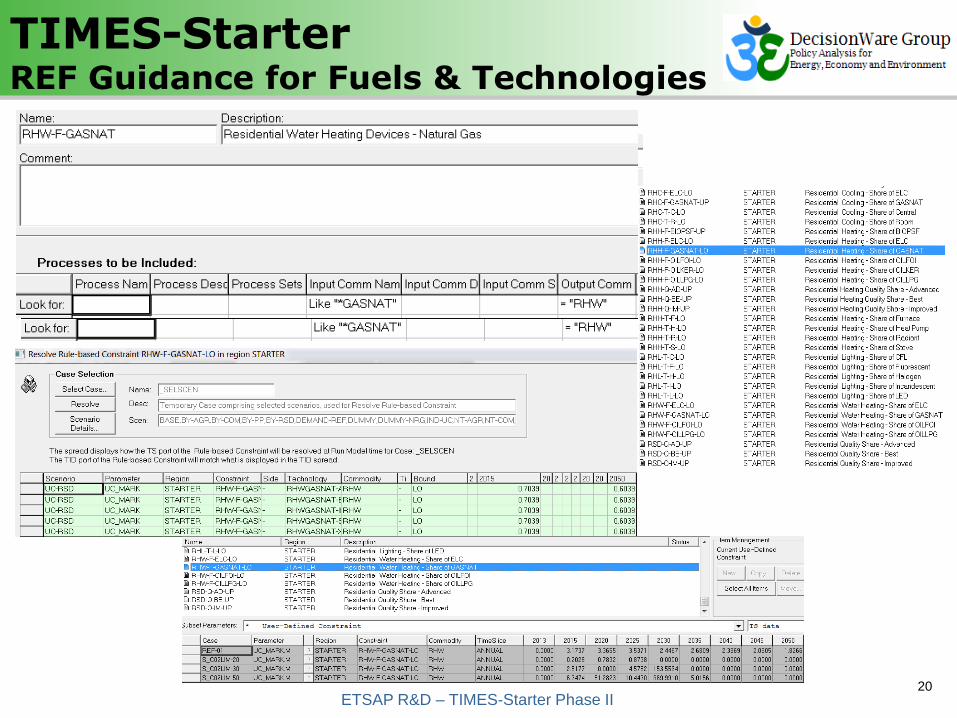
TIMES-StarterREF Guidance for Fuels & Technologies
20
TIMES-Starter Model OverviewETSAP R&D – TIMES-Starter Phase II
© OECD/IEA 2011 TIMES Model Management Systems Basics
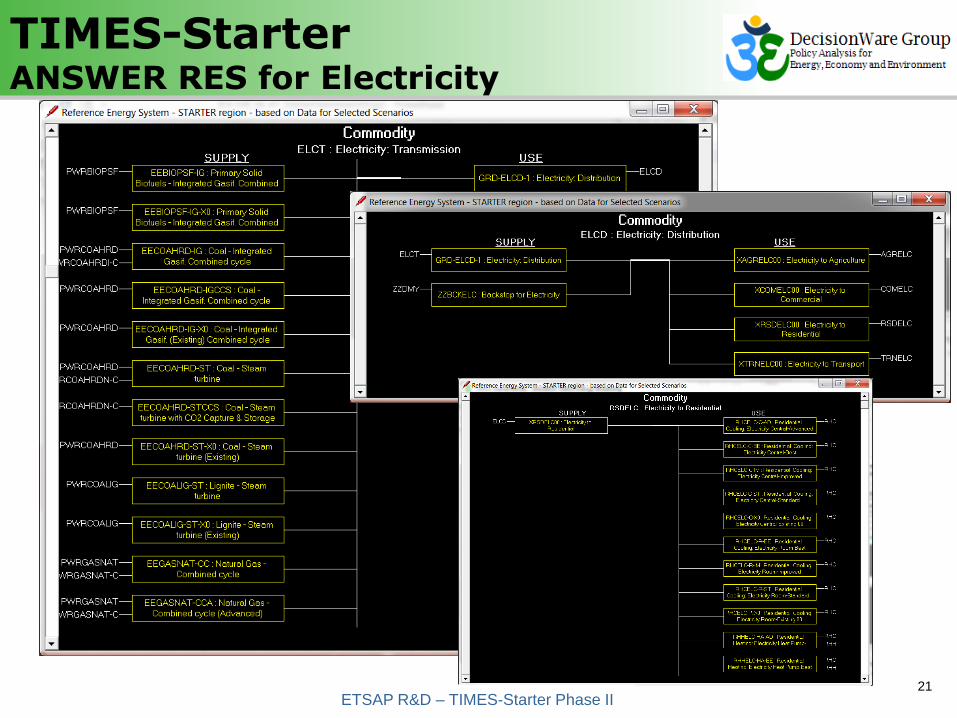
TIMES-StarterANSWER RES for Electricity
21
TIMES-Starter Model OverviewETSAP R&D – TIMES-Starter Phase II

© OECD/IEA 2011 TIMES Model Management Systems Basics
TIMES-Starter VBE Sets
22
TIMES-Starter Model OverviewETSAP R&D – TIMES-Starter Phase II

© OECD/IEA 2011 TIMES Model Management Systems Basics
TIMES-StarterVBE Tables & Cubes
23
TIMES-Starter Model OverviewETSAP R&D – TIMES-Starter Phase II

© OECD/IEA 2011 TIMES Model Management Systems Basics
TIMES-StarterAnalytics Graphing Workbook
24
TIMES-Starter Model OverviewETSAP R&D – TIMES-Starter Phase II
Main multi-case comparison graphing worksheets allow interactive selection of which cases to compare with 4-case stacked bar chart, 3-case diff, 1st/last period trend blocks, and model horizon metrics
© OECD/IEA 2011 TIMES Model Management Systems Basics
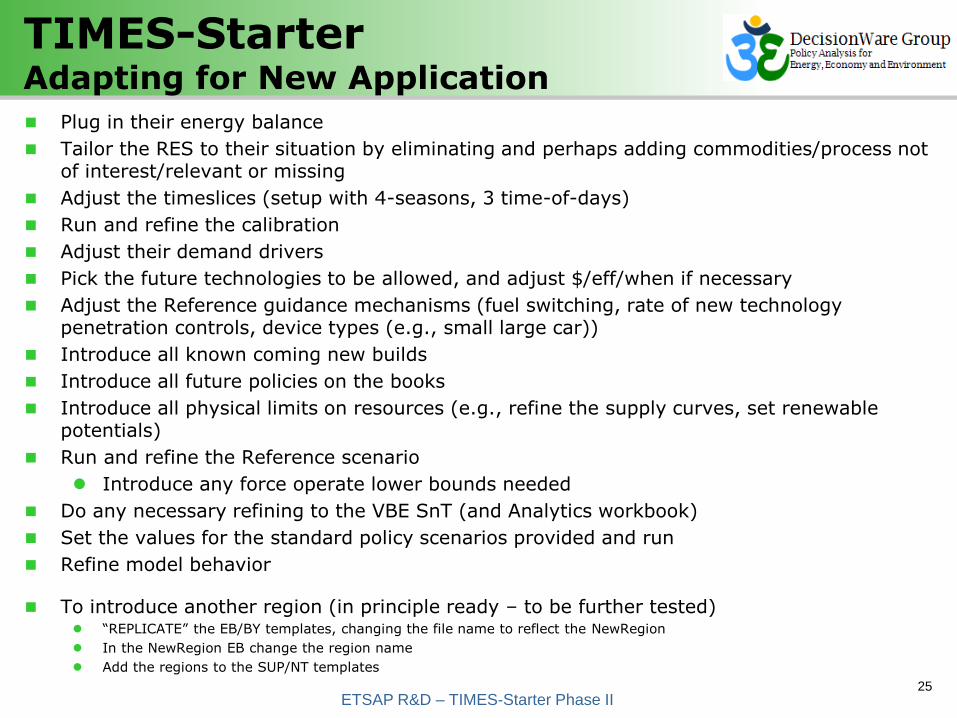
TIMES-StarterAdapting for New Application
25
TIMES-Starter Model Overview
Plug in their energy balance
Tailor the RES to their situation by eliminating and perhaps adding commodities/process not of interest/relevant or missing
Adjust the timeslices (setup with 4-seasons, 3 time-of-days)
Run and refine the calibration
Adjust their demand drivers
Pick the future technologies to be allowed, and adjust $/eff/when if necessary
Adjust the Reference guidance mechanisms (fuel switching, rate of new technology penetration controls, device types (e.g., small large car))
Introduce all known coming new builds
Introduce all future policies on the books
Introduce all physical limits on resources (e.g., refine the supply curves, set renewable potentials)
Run and refine the Reference scenario
Introduce any force operate lower bounds needed
Do any necessary refining to the VBE SnT (and Analytics workbook)
Set the values for the standard policy scenarios provided and run
Refine model behavior
To introduce another region (in principle ready – to be further tested) “REPLICATE” the EB/BY templates, changing the file name to reflect the NewRegion
In the NewRegion EB change the region name
Add the regions to the SUP/NT templates
ETSAP R&D – TIMES-Starter Phase II
© OECD/IEA 2011 TIMES Model Management Systems Basics
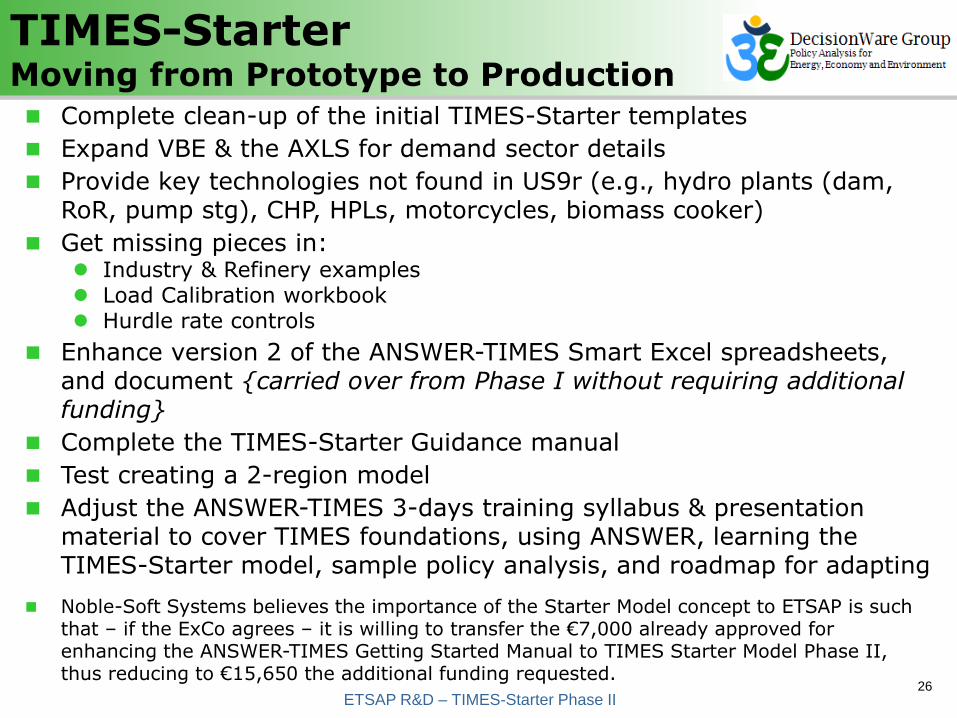
TIMES-StarterMoving from Prototype to Production
26ETSAP R&D – TIMES-Starter Phase II
Complete clean-up of the initial TIMES-Starter templates
Expand VBE & the AXLS for demand sector details
Provide key technologies not found in US9r (e.g., hydro plants (dam, RoR, pump stg), CHP, HPLs, motorcycles, biomass cooker)
Get missing pieces in: Industry & Refinery examples Load Calibration workbook Hurdle rate controls
Enhance version 2 of the ANSWER-TIMES Smart Excel spreadsheets, and document {carried over from Phase I without requiring additional funding}
Complete the TIMES-Starter Guidance manual
Test creating a 2-region model
Adjust the ANSWER-TIMES 3-days training syllabus & presentation material to cover TIMES foundations, using ANSWER, learning the TIMES-Starter model, sample policy analysis, and roadmap for adapting
Noble-Soft Systems believes the importance of the Starter Model concept to ETSAP is such that – if the ExCo agrees – it is willing to transfer the €7,000 already approved for enhancing the ANSWER-TIMES Getting Started Manual to TIMES Starter Model Phase II, thus reducing to €15,650 the additional funding requested.
26
© OECD/IEA 2011 TIMES Model Management Systems Basics
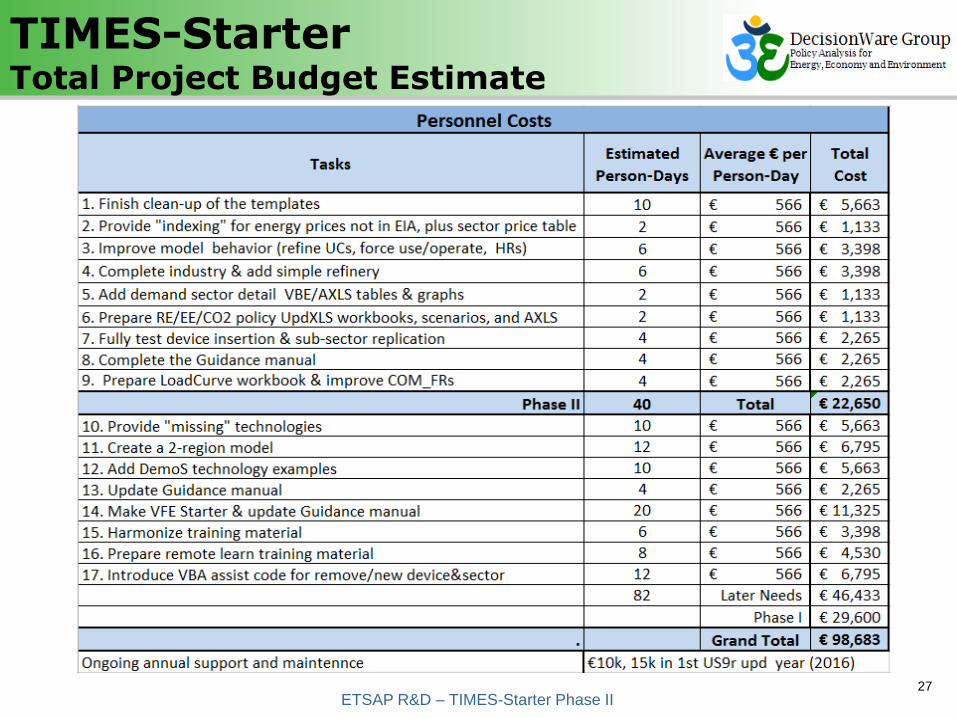
TIMES-StarterTotal Project Budget Estimate
27
TIMES-Starter Model OverviewETSAP R&D – TIMES-Starter Phase II