ESTIMATION of Kosovo population 2011
40
19.223 15.232 21.028 20.035 ESTIMATION of Kosovo population 2011 Republika e Kosovës Republika Kosova - Republic of Kosovo Qeveria e Kosovës -Vlada Kosova - Government of Kosova Zyra e Kryeministrit – Ured Premijera Office of the Prime Minister Pristina, February 2013
Transcript of ESTIMATION of Kosovo population 2011

19.223
15.232
21.028 20.035
ESTIMATION of Kosovo population 2011
Republika e KosovësRepublika Kosova - Republic of Kosovo
Qeveria e Kosovës -Vlada Kosova - Government of KosovaZyra e Kryeministrit – Ured Premijera
Offi ce of the Prime Minister
Pristina,February 2013


ESTIMATION of Kosovo population 2011
Pristina,February 2013

Preface
Population estimation is a necessity, practice and standard which is required to be carried out every year by offi cial statistical institutions of a country.
This is due to the fact that in the period between two censuses (period of ten years) in a country occur signifi cant population, municipality or settlement changes.
Kosovo Agency of Statistics (KAS) has estimated the population size at country level on annual basis and then this fi gure has been used as basic indicator for analyses and other planning.
Annual statistical data on population (demography) are fundamental for the research and determination of a wide range of analyses, especially those with signifi cant importance related to social and economic issues at certain levels: municipal, national and regional.
Population statistics are an important denominator and indicator for policymakers, analysts, researchers and various data users.
The data on population constitute the basic estimating component of national accounts, employment and other socio-economic issues.
Therefore, for all data users, these are the latest estimated offi cial data on the Kosovo population size
at municipal level for 2011. Next estimation (for 2012) will be carried out up to mid- 2013.
Chief Executive Offi cer of Kosovo Agency of Statistics
Mr. Isa Krasniqi
PAGE 4 ESTIMATION OF KOSOVO POPULATION 2011

PREFACE ............................................................................................................. ....4INTRODUCTION ................................................................................................... ....6For data users ................................................................................................................................................................................ 6Reference period ............................................................................................................................................................................ 7The basis of population estimation ........................................................................................................................................... 7Methodological overview ............................................................................................................................................................. 7
Data sources ................................................................................................................................................................................... 8
CHAPTER 1 .......................................................................................................... ..12Population census 2011 ............................................................................................................................................................. 12Update 2009 .................................................................................................................................................................................. 12Time frame ..................................................................................................................................................................................... 12Coverage ........................................................................................................................................................................................ 12The aim of the project ................................................................................................................................................................. 13Data collection methodology .................................................................................................................................................... 13Data quality of Update 2009 .................................................................................................................................................... 14Population .................................................................................................................................................................................... 14Households .................................................................................................................................................................................... 15Conclusions ................................................................................................................................................................................... 16Estimation for municipalities: Leposaviq, Zubin Potok, Zveçan and Mitrovica North ................................................. 18
Households .................................................................................................................................................................................... 18
CHAPTER 2 ............................................................................................................18Population ..................................................................................................................................................................................... 20Data quality ................................................................................................................................................................................... 20Comparision of data ................................................................................................................................................................... 21Demographic data ........................................................................................................................................................................ 23Population censuses data / 1948-1991 .................................................................................................................................. 24
Population displacements ......................................................................................................................................................... 25
CHAPTER 3 ............................................................................................................28Population movements 01 April - 31 December 2011......................................................................................................... 28Natural growth ............................................................................................................................................................................. 28Data quality ................................................................................................................................................................................... 28Other population movements (migration) .............................................................................................................................. 31Emigration and Immigration ...................................................................................................................................................... 31Internal emigration and immigration ...................................................................................................................................... 32External emigration and immigration ..................................................................................................................................... 34External migration ....................................................................................................................................................................... 34
External immigration .................................................................................................................................................................. 35
Contents

For data users Until the pre-fi nal offi cial Population census that has been conducted in 1981, population who worked and lived abroad Kosovo for a certain period of time, called as “Population temporarily living abroad’’, has been estimated as population of respective country.Therefore, previous population estimates included as well the nonresident population (until 2011).
Ast er the approval of basic statistical legislation (two laws): the Law on Population, Households and Housing Census (Law no. 03/L-237) and the Law on Offi cial Statistics of the Republic of Kosovo (Law no. 04 / L-036) approved during the years 2010-2011, and the amandements of the defi nition on resident population of a country1 and UNSD2and EUROSTAT3 recommendations compared to previous censuses that were conducted in 1948, 1953, 1961, 1971 and 1981. In this report KAS has estimated the residential population respecting the applicable legislation.
Although Kosovo is nota member of the European Union (EU), like other candidate and potential candidate countries Kosovo as well transmits (sends) to EUROSTAT demographic data on annual basis, respecting the defi ned criteria and deadlines. According to the proposed Regulation of the European Parliament4 (Regulation of the European Parliament and of the Council on European statistics on demography) Article 4, States shall transmit data to Eurostat within 8 months following the calendar year. Also, according to Article 5 as the reference date should be the midnight of 31 December of the calendar year.
Since this is the fi rst census on population estimation carried out at municipal level, in the following section are provided explanations for data users on: methodology, data quality, harmonization, correction of inconsistencies, quality and comprehension of editing as well as documentation of imputation variables was carried out5
In this report is also explained the data coherence6 where in order to provide a clearer picture to the users, additional elaboration and separate tables were used from which later on were derived the fi nal data (fi nal tables).
Relevance of these data will be updated in the future with available and accurate data.
1 Changes and harmonization of standards on key defi nitions recommended for censuses were carried out from ‘90, especially since 2000.2 United Nations Statistics Division3 Statistical Offi ce of the European Union4 Regulation of the European Parliament and of the Council on European statistics on demography5 Statistical method which implies the supplementation of the data. These are potential values based on other information available6 Refers to eligibility of combined reliable data in diff erent ways and for diff erent uses
INTRODUCTION
PAGE 6 ESTIMATION OF KOSOVO POPULATION 2011

INTRODUCTION
PAGE 7ESTIMATION OF KOSOVO POPULATION 2011
Reference period Estimation of Kosovo population for 2011 basically refers to the recent population census conducted in April 2011 as well as demographic changes and other movements occurred ast er the census up to December 31, 2011.
The basis of population estimation In preparation of this estimation, KAS has applied methods practiced on population estimations carried out by statistical institutions on annual basis using diff erent sources.
Based on the Law on Offi cial Statistics of the Republic of Kosovo (Law no. 04/L-036) Article 29, item (2): KAS has the right to adjust data provided by administrative sources in order to make them consistent with defi nitions and classifi cations of statistical registers that it owns.
According to the drast regulation of the European Parliament for statistics and demography (Regulation of the European Parliament and of the Council on European statistics on demography) Article 7 the estimation data should also be based on data sources, selected by the states, which are in compliance with national laws and practices. The scientifi cally based estimation and documented by statistical methods is used when appropriate.
Methodological overviewPopulation, Households and Housing Census 2011 was the starting database (starting point) KAS has estimated the population of municipalities that were not part of population census (2011), based on various sources. In the text below are provided detailed explanations, so the users can assess these sources.
‘The update 2008-2009’7 was used as the key basis of estimation for municipalities: Leposaviq, Zveçan, Zubin Potok and for Mitrovica North.
For estimation of resident population at national level is aff ected by the component of: births, deaths and international migration (NMIM)
Population estimation=basic population+births-deaths±international migration.
At municipal level, the resident population is aff ected by an additional component of population change: internal migration (NMInM)
7 In the following text will be used the short term: Update 2009

INTRODUCTION
PAGE 8 ESTIMATION OF KOSOVO POPULATION 2011
Population estimation=basic population+births-deaths±international/internal migration.
The fi nal population estimated data at municipal level is calculated according to the following procedures:
Pn =P0 + (N-M)+(I–E)
Pn - number of residents computed for a given yearP0 - Population in the year recorded P0- 31 March 2011
N - Number of live births (Fertility), 01 April-31 December 2011
M - Number of deaths (Mortality), 01 April-31 December 2011 I -Immigrations, 01 April 2008 - 01 April 2011
E - Emigrations, 01 April-31 December 2011
Data sources For population estimation were used various statistical sources such as: population censuses databases, updated databases, databases of various registers, other administrative sources, surveys, reports and other researches.
These data have been analyzed according to the statistical methods and served as signifi cant instruments and statistical records for population estimation at the country and municipal levels.

INTRODUCTION
PAGE 9ESTIMATION OF KOSOVO POPULATION 2011
For this estimation have been used as a reference basis the following sources:
Population Census data: source of information, Census 2011, KAS.
Data from Update 2009: KAS’ data sources (2008- 2009).
1991 population estimation data : data source, estimation by FSOY
Population census data: data source, Censuses 1948-2011
Data from the surveys: referring to the researches carried out by KAS and other institutions
Data from DPS: referring to the vital data from the Department of Population Statistics at KAS.
Data from DSS: referring to the data from the surveys of Social Department at KAS.
Data from Ministries: data source, databases of respective ministries
Administrative registers; data source, registers of respective institutions
Data provided by municipalities: data source, web sites, and other municipal offi cial documents
OSCE data: data source refers to the data of respective municipalities
UNHCR data: referring to the latest data from the statistical database of this organization
European Centre for Minority Issues, Regional Offi ce in Kosovo8: source, data of respective municipalities.
Data from Serbia: data source, offi cial Statistical website http://webrzs.stat.gov.rs/WebSite/
Other data: referring to various publications of organizations, institutions or specifi c groups
8 European Centre for Minority Issues Regional Offi ce – ECMI Kosovo

INTRODUCTION
PAGE 10 ESTIMATION OF KOSOVO POPULATION 2011
N
S
W
0 15
km
30
E
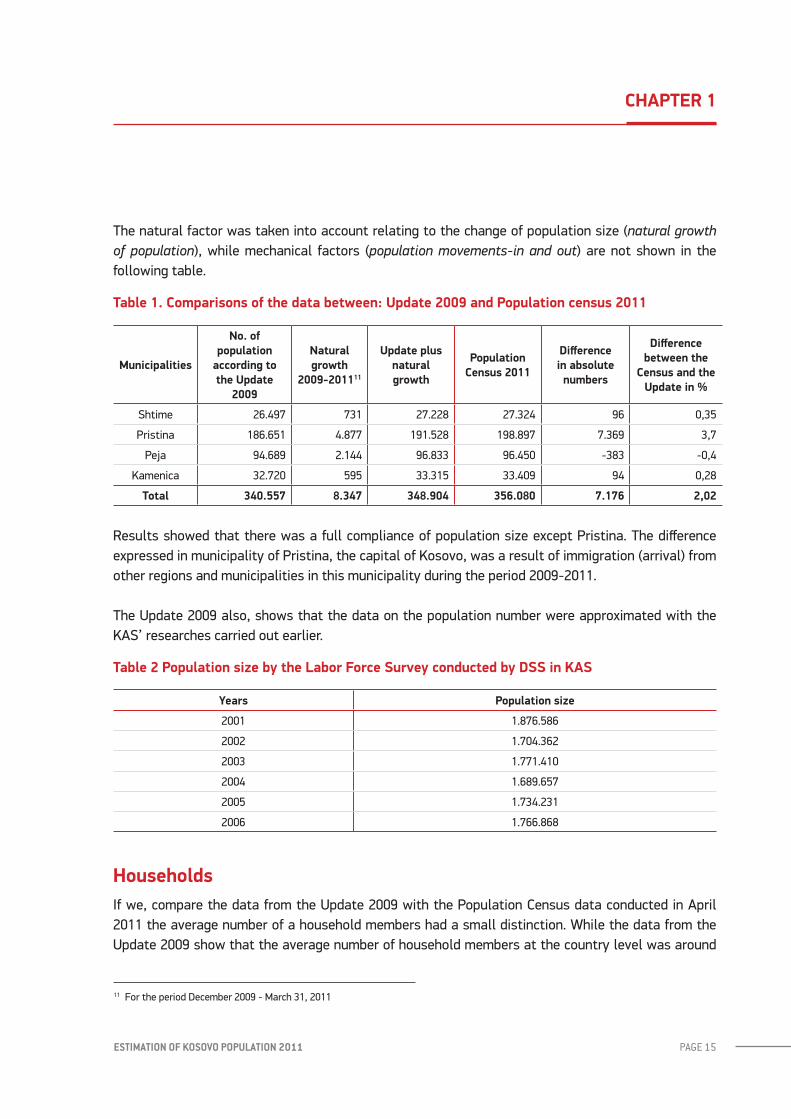
Deçan40392
Junik6151
Gllogovc59160
Fushë Kosovë35733
Graçanicë10871
Obiliq21769
Rahovec56932
Malishevë55470
Suharekë60549
Mamusha5584
Prizren179869
Shtërpcë6942
Ferizaj109899
Lipjan58292
Shtime27645
Novobërdë6796
Prishtinë201804
Podujevë88877
Vushtrri70495
Skënderaj51255
Kamenicë35981
Mitrovicë84949
Zubin Potok6599
Leposaviq13712
Istog39727
Pejë97360
Gjilan90863
Ranillug3853
Dragash34308
Gjakovë95363
Kaçanik33664
Viti47408
Kllokot2585
Partesh1784
Hani i Elezit9514
Legend:
< = 10,000 Inhabitants (10)
Klinë39047
10,001 - 40,000 Inhabitants (10)
40,001 - 80,000 Inhabitants (9)
80,000 + Inhabitants (8)
Zveçan7443
Evaluation 2011 - Number of Population by Kosovo Municipalities


Population census 2011Population census conducted in April 2011 was carried out in accordance with UNSD9 and EUROSTAT10 international standards and recommendations on censuses. According to local and international institutions the process was assessed positively and the fi nal data are offi cial.
The population census process almost at all stages up to the release of the fi nal results has been assisted and monitored by international statistical institutions. KAS has published for data users also additional information related to the progress and quality of these data summarized in two special reports: Data quality Report and Post Enumeration (PER) Report.
According to population census data conducted in April 2011, Kosovo has in total 1,739,825 residents, excluding municipalities: Leposaviq, Zubin Potok, Zveçan and Mitrovica North.
Update 2009 In analyses and demographic trends the data derived from the Update 2009 resulted to be in consistency with the data derived from Population census 2011. Therefore data related to municipalities that have not been subject to population census (April, 2011), until next updating, the data from the Update 2009 have been taken into account as the main source for estimation of population, households and some other indicators in municipalities that did not participate in the census (April 2011).
Time frame Within framework of preparations for a generic population census as well as other activities, at the end of 2008, KAS updated around 1,000 Enumeration Areas (EAs) from a total of 4650. At the end of 2009 with the purpose of proper preparations and other Census needs, KAS updated other remaining enumeration areas.
Coverage2009 Update project was implemented throughout the territory of Kosovo. There was no refusal including the smallest levels such as Enumeration Area (EA). All municipalities and communities living in Kosovo were involved in this project.
9 United Nations Statistics Division10 Statistical Offi ce of the European Union
CHAPTER 1
PAGE 12 ESTIMATION OF KOSOVO POPULATION 2011

CHAPTER 1
PAGE 13ESTIMATION OF KOSOVO POPULATION 2011
The aim of the projectThe importance of this project was crucial for a successful census, based on the great lack of statistical data from respective institutions and municipalities for a long time, since the last offi cial census has been conducted in 1981. In addition, big demographic changes and numerous population movements that took place ast er 1999 both inside and outside Kosovo were needed and it was almost impossible to organize a successful census without a solid base for some indicators.
Update 2009 enabled the extraction of approximate data on the number of households and persons, ethnicity and later on these data were used as the basis for:
division of enumeration areas (EAs),
number of enumerators at a settlement and municipal level
number of controllers
number of supervisors
number of trainers,
Allocation- quantity of census materials at the level of EAs, settlement and municipality such as: forms, manuals, maps, etc.
organization and distribution of the awareness campaign and
Division of the training centers by the languages of communities.
At the same time, this update aimed to be a powerful instrument for monitoring the possible changes during the population census process in any given area (participation-nonparticipation in generic census)
Thus, at the end of 2009, KAS had a solid basis and it was prepared on time for potential challenges during the census process.
Organization and engagement of the staff in this project was as same as scheme used during the population census in 2011.
Data collection methodologyData collection from Update 2009 was carried out visiting households door to door and the data were received through questionnaires and instructions drast ed by KAS. In cases when a household was not directly contacted the data were provided by other relatives.
CHAPTER 1
PAGE 14 ESTIMATION OF KOSOVO POPULATION 2011
During the Census were used the updated maps in formats that were used later during the generic census and the manuals. Also, in this form was used to enumerate (count) only resident population.
2009 Update was carried out by economic operators (there were also consultants from other foreign countries) while supervisors, key trainers were from the KAS. Persons and the communities living in those certain areas were selected as enumerators and controllers for those certain settlements.The checked and analyzed data during the period 2009 were inserted into the database,, whereas necessary data were extracted and were used for needs of KAS, municipalities and international organizations that have monitored the population census process.
Data quality of Update 2009
Population If we compare the data from the “Update 2009” with the fi nal data derived from the generic population census 2011 we can see an approximate consistency in terms of common statistical indicators. In some cases (the data at municipal level) were so approximate that it was hard to make the distinction between them taking into account diff erent periods of time (reference date) when these projects were implemented.
According to the population census (2011) the total number of enumerated residents in Kosovo was 1,739,825 excluding Kosovo municipalities mentioned above which did not participate in the Census.According to the Update 2009 the total number of enumerated residents in Kosovo was 1,766,768 excluding Kosovo municipalities mentioned above which did not participate in the Census. The diff erence at the country level was just 1.55% more enumerated residents in Update 2009. If the KAS’ fi ndings, that were carried out during the monitoring of the 2009 Update process, would have been taken into account , when that in some areas was reported an over-enumeration by 1-2%, then the data correspond fully with each other. In statistical terms this change is admissible taking into account the time factor.
In most of municipalities, the data from the Update 2009 correspond with the data from the Census 2011 on the main indicators (households, population and housing).
In order to view the changes between the data from the Updated 2009 and the Census 2011, in the table below are shown two big municipalities and two medium municipalities (by the number of residents.)
CHAPTER 1
PAGE 15ESTIMATION OF KOSOVO POPULATION 2011
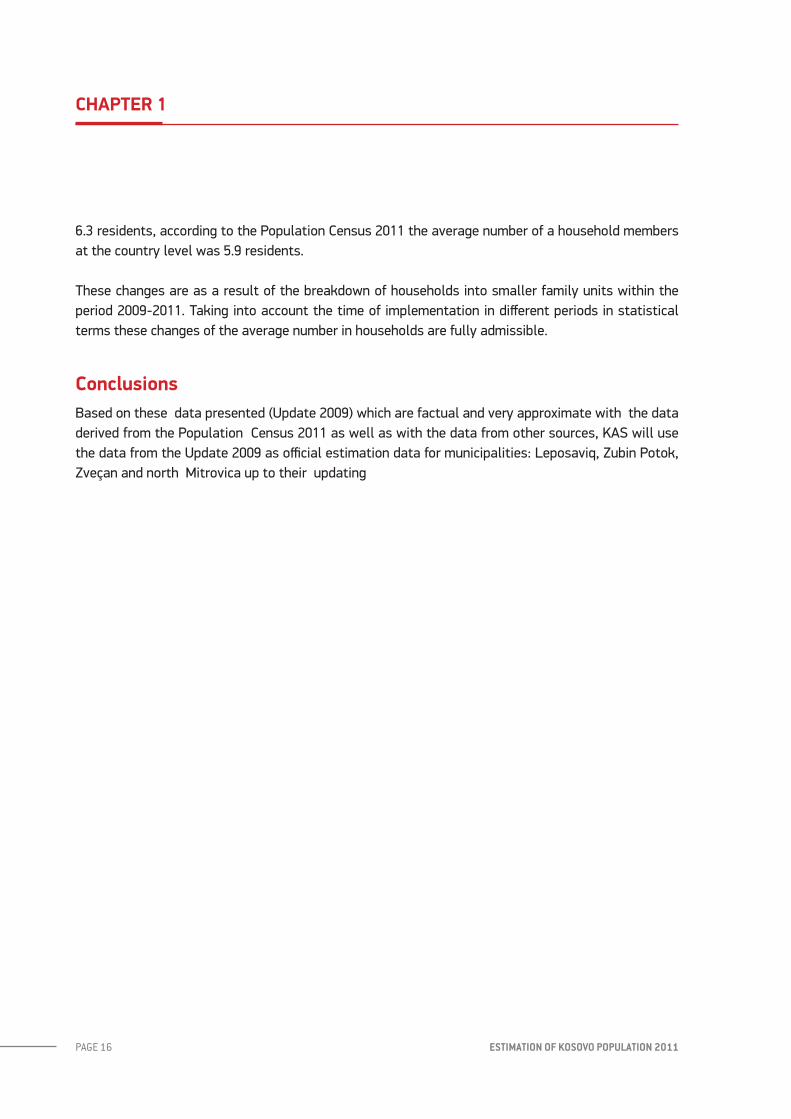
The natural factor was taken into account relating to the change of population size (natural growth of population), while mechanical factors (population movements-in and out) are not shown in the following table.
Table 1. Comparisons of the data between: Update 2009 and Population census 2011
Municipalities
No. of population
according to the Update
2009
Natural growth
2009-201111
Update plus natural growth
Population Census 2011
Diff erence in absolute
numbers
Diff erence between the
Census and the Update in %
Shtime 26.497 731 27.228 27.324 96 0,35
Pristina 186.651 4.877 191.528 198.897 7.369 3,7
Peja 94.689 2.144 96.833 96.450 -383 -0,4
Kamenica 32.720 595 33.315 33.409 94 0,28
Total 340.557 8.347 348.904 356.080 7.176 2,02
Results showed that there was a full compliance of population size except Pristina. The diff erence expressed in municipality of Pristina, the capital of Kosovo, was a result of immigration (arrival) from other regions and municipalities in this municipality during the period 2009-2011.
The Update 2009 also, shows that the data on the population number were approximated with the KAS’ researches carried out earlier.
Table 2 Population size by the Labor Force Survey conducted by DSS in KAS
Years Population size
2001 1.876.586
2002 1.704.362
2003 1.771.410
2004 1.689.657
2005 1.734.231
2006 1.766.868
HouseholdsIf we, compare the data from the Update 2009 with the Population Census data conducted in April 2011 the average number of a household members had a small distinction. While the data from the Update 2009 show that the average number of household members at the country level was around
11 For the period December 2009 - March 31, 2011
CHAPTER 1
PAGE 16 ESTIMATION OF KOSOVO POPULATION 2011
6.3 residents, according to the Population Census 2011 the average number of a household members at the country level was 5.9 residents.
These changes are as a result of the breakdown of households into smaller family units within the period 2009-2011. Taking into account the time of implementation in diff erent periods in statistical terms these changes of the average number in households are fully admissible.
ConclusionsBased on these data presented (Update 2009) which are factual and very approximate with the data derived from the Population Census 2011 as well as with the data from other sources, KAS will use the data from the Update 2009 as offi cial estimation data for municipalities: Leposaviq, Zubin Potok, Zveçan and north Mitrovica up to their updating


Estimation for municipalities: Leposaviq, Zubin Potok, Zveçan and Mitrovica NorthNote: Because north part of Mitrovica earlier (before 2012) was an administrative area not separated from the rest of Mitrovica, in the following analysis was impossible to make comparisons with earlier sources, while for municipalities: Leposaviq, Zveçan and Zubin Potok have been used various data sources. 11
HouseholdsAccording to data from the Update 2009 the total number of households in four Kosovo municipalities abovementioned was 11,122 households.
In the following table are presented the data according to the Update 2009 on: the number of households, the average of household members that is divided into two groups by ethnicity12: 1 Albanian and 2 Serbian and others. The data are expressed in absolute and relative numbers.
Table 3. Number of households by ethnicity and average members in a household
Municipalities Households % of households by ethnicity
Total Albanian Serbs and others Albanian Serbs and
others
Leposaviq4.193 58 4.135
0,52 37,18100 1,38 98,62
Zubin Potok1.698 154 1.544
1,38 13,88100 9,07 90,93
Zveçan1.838 40 1.798
0,36 16,17100 1,38 98,62
Mitrovica North 3.393 191 3.202
1,72 28,79100 5,63 94,37
Total/Average 11.122 443 10.679 3,98 96,02
According to the data from the Update 2009, Albanians constituted 3.98% or in total 443 households. Serbs and others constituted 96.02 % or 10,679 households.
The size of a household compared with two activities had a diff erence of 0.3 persons.
12 The breakdown into smaller ethnic groups at this stage could have omissions and at the same time according to some data
CHAPTER 2
PAGE 18 ESTIMATION OF KOSOVO POPULATION 2011

CHAPTER 2
PAGE 19ESTIMATION OF KOSOVO POPULATION 2011
Table 4. The size of the households according to the Update 2009 and Population census 2011
Ethnicity Household size
Update 2009 Population Census.2011 Diff erence
Albanian 6,3 5,9 -0,4
Serb 3,5 3,7 0,2
In the following table are provided two data sources on average number of a household members in some municipalities of Kosovo only for Serb community.
Table 5. Average number of members in a Serbian household: Update 2009/Population census 2011
Municipalities Update 2009 Population Census 2011
Graçanica 4,1 4,3
Ranillug 4,1 4,2
Partesh 4,3 4,3
Kllokot 4,1 4,1
Kamenica 3,5 3,8
Fushë Kosova 3,5 3,9
Obiliq 3,9 4,2
Novo Berda 4,1 3,8
Vushtrri 4,7 4,2
Although these activities have been carried out separately, and at diff erent times the data presented show that there is a stressing statistical approximation between these two sources.
Since the data from the Update 2009 are in line with the data drawn from the Population census 2011 on the average number of members of a Serbian households, these data will be taken as offi cial data for this area of Kosovo.

CHAPTER 2
PAGE 20 ESTIMATION OF KOSOVO POPULATION 2011
Population
As is known, the abovementioned municipalities didn’t participate in the census conducted in April 2011 and therefore, the data derived from various sources that have been used in this report on population size for this area are the estimation.
According to data from the Update 2009 the number of population of these above mentioned municipalities of Kosovo was in total 40.196 residents.
Table 6. Number of population by ethnic composition from the Update 2009
MunicipalitiesPopulation
Population particpation by ethnicity
Total Albanian Serbs and others Albanian Serbs and others
Leposaviq13.773 323 13.450
0,8 33,46100 2,35 97,65
Z.Potok6.616 995 5.621
2,48 13,98100 15,04 84,96
Zveçan7.481 386 7.095
0,96 17,65100 5,16 94,84
Mitrovica North12.326 867 11.459
2,16 28,51100 7,03 92,97
Total/average 40.196 2.571 37.625 6,4 93,6
The ethnic composition was divided into two groups as follows: Albanian population in these three municipalities composed 6.40% or 2.571 residents and Serbian and others around 93.60% or 37.625 residents.
Data quality It should be noted that almost all data on the number of population of Albanian community (Leposaviq, Zubin Potok and Zveçan- not including the Mitrovica North) were almost identical with the data from the Update 2009 despite that these data were drawn in diff erent periods of time and from various sources.

CHAPTER 2
PAGE 21ESTIMATION OF KOSOVO POPULATION 2011
According to the data from the Update 2009 the total number of Albanian population in these three municipalities was in total 1,704 residents, while according to respective municipalities and OSCE13 the total was 1,700 residents. The diff erence was only 4 residents, and when we add to this the time factor, we can say that the data represent the same number of Albanian population in this area.
Table 7. Data on the number of Albanian population by sources
Municipalities Update 2009 Respective municipalities and
OSCE14
Shqiptarë
Leposaviq 323 350
Zubin Potok 995 1.000
Zveçan 386 350
Mitrovica e Veriut 7,03% 7,10%
Since the data drawn from the Update 2009 on the Albanian community are representative data they will be offi cial data for this part of Kosovo.
Data on Serb community drawn from various sources indicate that the number of Serb population had a stressing distinction compared with the data derived from the Update 2009.
It is worth mentioning that despite that the main source were respective municipalities (municipal offi cials) the data presented by various institutions including international ones had signifi cant diff erences on the number of population of Serb community in these municipalities even though they were referring to the same reference year.
Comparision of dataIn the table below are provided the data from: the Update 2009, from municipality of Leposaviq and Zveçan as well as the data from the OSCE. As stated above, as a data source for the OSCE and many other international organizations were municipal administrations of these municipalities.1314
13 OSCE 14 MUNICIPAL PROFILES November 2011, OSBE, Mission in Kosovo – Burimi i bazuar ne administratat komunale te ketyre komunave

CHAPTER 2
PAGE 22 ESTIMATION OF KOSOVO POPULATION 2011
Table 8. Comparison of data by sources
Municipalities
Population estimation,15
1991
Municipality: Leposaviq,
Zveçan16, 2010
Update 2009
OSCE 17
2010Update 2009
OSCEUpdate 2009
OSCE
Gjithsej Shqiptar Serb dhe t tjerë
Leposaviq 16.395 14.262 13.773 18.890 323 350 13.450 18.540
Z.Potok 8.479 — 6.616 14.900 995 1.000 5.621 13.900
Zveçan 10.030 17.000 7.481 16.650 386 350 7.095 16.300
Mitrovicë V. — — 12.326 29.460 867 4.900 11.459 24.560
Gjithsej 34.904 31.262 40.196 79.900 2.571 6.600 37.625 73.300
Data from offi cial website of municipality of Leposaviq are approximate with the data from the Update 2009. Data from offi cial website of municipality of Zveçan don’t match with the data from the Update 2009. The data on municipality of Zveçan were not available in offi cial documents / web site of this municipality.151617
Also, according to the European Centre for Minority Issues, Regional Offi ce in Kosovo (ECMI Kosovo) which uses the local community offi ces as the source of estimated data, which is compared for control purposes with Municipal Profi les extracted by the OSCE, and civil society for a part of this area are shown in the following table:
Table 9. Data on municipality of Leposaviq18
Approximate number of community members
Year Albanian Serb Roma Ashkali Egyptian Bosnian Turks Others
2010 400 15.500 150 450
Table 10. Data on municipality of Zubin Potok19
Percentage of Population
Year Albanian Serb Roma Ashkali Egyptian Bosnian Turks Others
1991* 46,40% 52,60% - - - 1,00%
2008 11,6 89,4 - - - -
2009 * 5,4% 93,9% manje od 1%
15 Estimation by FSOY: Census ‘91 Population, bulletin No. 9 Belgrade 1995 (for Albanians it is an estimation while Serbs were enumerated)16 http://www.leposavic.org/Opste-Informacije/ html: http://www.opstinazvecan.rs/index.17 MUNICIPAL PROFILES November 2011, OSBE, Mission in Kosovo – the source based on the municipal administrations of these
municipalities) 18 http://www.ecmikosovo.org/19 Ibid

CHAPTER 2
PAGE 23ESTIMATION OF KOSOVO POPULATION 2011
Table 11. Data on municipality of Zveçan20
Percentage of Population
Year Albanian Serb Roma Ashkali Egyptian Bosnian Turks Others
1991* 16,20% 79,10% 0,10% 0,80% 0,20% 3,60%
2008 4,50% 95% 0,10% 0,10% 0,30%
2010 5,80% 94% 0,10% 0,10%
Due to non-participation of this area in the Census conducted in April 2011, based on analysis, demographic facts and trends of population movements, can be concluded that the data on serb community estimated by municipal representatives of municipalities: Leposaviq, Zubin Potok, Zveçan and north part of Mitrovica present representative data.
These estimates of municipalities have been used so far by various institutions, including international ones.
Due to these diff erences in the number of population of Serb community, based on the resources, facts and demographic trends following is an analysis focusing the Serbian community.
Demographic dataStatistical data indicate that Serbian community in recent decades had a downward trend of population due to small natural growth and mechanical movements of population
Table 12. Natural growth of Serb community in Kosovo for the period 1986-1996 in absolute numbers21
Years 1986 1987 1988 1989 1990 1991 1992 1993 1994 1995 1996
Natural growth
2.051 2.069 1.846 1.588 2.021 2.044 1.620 1.632 1.610 855 959
Such declining trend of Serbian population could be observed also in other areas inhabited by Serbian population in Kosovo and abroad.
20 Ibid21 Population, Households by settlements and territorial organization of Kosovo until 2008, Pristina SOK

CHAPTER 2
PAGE 24 ESTIMATION OF KOSOVO POPULATION 2011
Table 13. Natural growth of population in Serbia22
Year Live-born Live-born per 1000 residents
Number of deaths
Number of deaths per
1000 residents
Natural growth
Natural growth
per 1000 residents
1999 72.222 9,6 101.444 13,5 -29.222 -3,9
2000 73.764 9,8 104.042 13,8 -30.278 -4,0
2001 78.435 10,5 99.008 13,2 -20.573 -2,7
2002 78.101 10,4 102.785 13,7 -24.684 -3,3
2003 79.025 10,6 103.946 13,9 -24.921 -3,3
2004 78.186 10,5 104.320 14,0 -26.134 -3,5
2005 72.180 9,7 106.771 14,3 -34.591 -4,6
2006 70.997 9,6 102.884 13,9 -31.887 -4,3
2007 68.102 9,2 102.805 13,9 -34.703 -4,7
2008 69.083 9,4 102.711 14,0 -33.628 -4,6
2009 70.299 9,6 104.000 14,2 -33.701 -4,6
2010 68.304 9,4 103.211 14,2 -34.907 -4,8
2011 65.598 9,0 102.935 14,2 -37.337 -5,2
Population censuses data / 1948-1991Data on Serb community indicate that the biggest participation of this community in total population of Kosovo has been in ‘50 with 24.1% at the country level. Since then, Kosovo Serb community has had continuous decrease.
Table 14. Data from population censuses 1948-1991 on Serb community in Kosovo23
Data: 1948 1953 1961 1971 1981 1991
Serb community 176.718 189.869 227.016 228.264 209.497 194.190
% at Kosovo level 24,1 23,3 23,5 18,4 13,2 9,9
Data for the period 1981-1991 indicate that Serb community in these municipalities (Leposaviq, Zubin Potok and Zveçan) had a decrease of -7.0% or in total -2,116 resident, while Albanian community had an increase of 84.3% or 2,271 residents, and other communities had an increase of 3.0% or 52 residents.
22 http://webrzs.stat.gov.rs/WebSite/23 Source: Publications from Population Censuses 1948-1991

CHAPTER 2
PAGE 25ESTIMATION OF KOSOVO POPULATION 2011
Table 15. Number of population by ethnicity 1981-1991 and the increase / decrease of population.
Years TotalAlbanian Serb Others
Population size
198124 34.697 2.693 30.288 1.716
199125 34.904 4.964 28.172 1.768
Increase/decrease in % 0,6 84,3 (7,0) 3,0
Table 16 . Number of population by censuses 1948-1991 (for the period 1981-1991 by ethnicity)
Year
s
Leposaviq Zveçan Zubin Potoku Total communities
Total in these municipalities
Tota
l
Alba
nian
Serb
Oth
ers
Tota
l
Alba
nian
Serb
Oth
ers
Tota
l
Alba
nian
Serb
Oth
ers
Alba
nian
Serb
Oth
ers
Population size Population size Population size Population size
‘48 14.851 6.417 9.502 30.770
‘53 16.911 7.890 10.403 35.204
‘61 18.910 9.166 10.642 38.718
‘71 18.044 1.,095 9.516 37.655
‘81 16.906 858 14.977 1.071 9.710 1.044 8.115 551 8.081 791 7.196 94 2.693 30.288 1.716 34.697
‘91 16.395 951 14.299 1.145 10.030 1.934 7.591 505 8.479 2.079 6.282 118 4.964 28.172 1.768 34.904
Population displacementsDue to the circumstances (war 1998-1999) there were population movements in this area, a part of Albanian community has moved to other parts of Kosovo (outside these municipalities) while a part of Serb community has moved to these municipalities.
As stated above, from all sources received and based on the Update 2009 the number of Albanian population in these three municipalities (excluding the north part of Mitrovica) was in total of 1,704 residents.
24 Census 1981: Population by nationality and settlements in SAP of Kosovo.Final results fi rst phase, Bulletin 33, June 1984 Pristina.25 Census 1991, Source: Statistical Federal Offi ce, Belgrade, Bulletin No. 17/97 Belgrade / Estimation for Kosovo, data by settlements and
municipalities

CHAPTER 2
PAGE 26 ESTIMATION OF KOSOVO POPULATION 2011
According to the latest data of September 2012 from UNHCR26, the number of persons of Albanian community displaced mainly in south part of Mitrovica, originating from the north part of the cities of Mitrovica, Zveçan, Leposaviq and Zubin Potok was in total 7,260 displaced persons.
Also, a part of displaced Serbian community originating from other settlements / municipalities of Kosovo has moved to the following municipalities: Leposaviq, Zubin Potok, Zveçan including north part of Mitrovica, their number was around 6.950 displaced persons.
In the table below the data for 2001, 2009 and 2011 were calculated based on the average of population movement during the years 1981-1991.
Table 17. Data from the population censuses and computations
Year
Leposaviq Zveçan Zubin Potok
Total
Tota
l
Alba
nian
Serb
Oth
ers
Tota
l
Alba
nian
Serb
Oth
ers
Tota
l
Alba
nian
Serb
Oth
ers
1981 16.906 858 14.977 1.071 9.710 1.044 8.115 551 8.081 791 7.196 94 34.697
1991 16.395 951 14.299 1.145 10.030 1.934 7.591 505 8.479 2.079 6.282 118 34.904
200127 15.884 1.044 13.621 1.219 10.350 2.824 7.067 459 8.877 3.367 5.368 142 35.111
UNHCR28 1.332 (721)29 1.930 123 (1.198) (2.438) 1.189 51 (814) (2.371) 1.557 -680
2009 17.216 323 15.551 1.342 9.152 386 8.256 510 8.063 996 6.925 142 34.4312011 17.209 340 15.436 1.433 9.020 388 8.177 455 8.059 1.000 6.887 172 34.288
Based on computations made , the number of population in these three municipalities is 34.288 residents, while according to the Update 2009 these municipalities had in total 27,870 residents.
If other factors are taken into account such are: decrease of natural growth of all communities starting from ‘90s and population displacements for various reasons in other countries abroad Kosovo, then the population of these municipalities would have been more approximate to the number evidenced during the Update 200930
26 UNHCR, Offi ce of the Chief of Mission Pristina, Kosovo; STATISTICAL OVERVIEW, Update at end September 2012, page 4, based on the survey of 2005/2006.
27 Computed according to demographic trends 1981-199128 UNHCR, Offi ce of the Chief of Mission Pristina, Kosovo; STATISTICAL OVERVIEW, Update at end September 2012, faqe 4, bazuar ne anketen
e vitit 2005/2006.29 The data on the number of displaced for the Albanian population are estimated based on demographic trends 1981-199130 For more information see the KAS reports during the years 1991-2011

CHAPTER 2
PAGE 27ESTIMATION OF KOSOVO POPULATION 2011
While the data derived from the Update 2009 indicated the consistency with the data derived from the Census of April 2011 for many indicators such as:.
Number of population in 34 municipalities: Update 2009- Census 2011 (diff erence 1.5%)
Average number of a household members in 34 municipalities: Update 200 -Census 2011 (diff erence 0.4%)
Average number of a household members in Serb community: Update 2009-Census 2011 (0.2%)
Number of Albanian population: Leposaviq, Zubin Potok and Zveçan: Update 2009 and Census 2011 (diff erence 0.2%).
Since the households were used as the data source for Update 2009, the data corresponded with the data extracted from the Population Census 2011 and other sources, since these two activities have been carried out within a period of time less than two years, the data from the Update 2009 shall be taken as offi cial data on the number of population in this area.

Population movements 01 April - 31 December 2011
Natural growth Vital administrative data (live births, deaths) have a high level of reliability that reaches almost at the representative level of the situation on the ground, except the cases of unreported births by Serb community. This community reports mainly a part of deaths.31
Note: Average of the data on fertility and mortality in Serbia has been taken as a comparative source for estimation of vital data on fertility and mortality of Serb community in Kosovo.
Data quality In order to assess the quality of vital data, KAS has compared these data with recent data drawn from the Census 2011
Since it was possible to be drawn from the Census, the indicators on live births for a period of six (6) last years and on infant deaths32, they were compared with the data on these indicators aggregated in administrative form.
The data aggregated in administrative form indicate that during the period 2006-2010 as live births were recorded 143.864 cases, while during the population census for this period were recorded 149.735 cases.
Table 18. Comparison of two data sources on live births
Data from: Live births
Birth registers (2006-2010) 143.864
Population Census 2011 (2006-2010) 149.735
This change, of live birth number between administrative data and 2011 population census data has resultet from the fact that not all birth cases have been reported, particularly by Serbian community (registered at the registry offi ce) while they were participants in the census.
31 http://esk.rks-gov.net/publikimet/popullsia : In 2009, Serb community has reported in total 113 cases of deaths, in 2010 a total of 95, and in 2011 a total of 140 cases to deaths.
32 R3 questionnaire. question no. 7: Have you given birth to live-born children ast er 2005 / If yes, write the number of live-born children ast er 2005, and questin no. 8 Do you have live-born children ast er 2005 died under age 1 / if yes, write the number of dead children.
CHAPTER 3
PAGE 28 ESTIMATION OF KOSOVO POPULATION 2011

CHAPTER 3
PAGE 29ESTIMATION OF KOSOVO POPULATION 2011
While the infant deaths are almost fully in same line with administrative data from Census. This quite small diff erence is due to that the Serb community didn’t report all cases of deaths in the civil registry of Kosovo (infant deaths), while it has participated in the census.
Table 19. Comparison of two data sources
Data from: Infant deaths
Birth registers (2006-2010) 335
Population Census 2011 329
Based on these data, one can conclude that the cases of infant births and deaths from administrative data as well as those from the census provide consistent and reliable statistical data.
It was not possible to compare the data on the number of deaths, because in the census form was no such questions.
In the following table are provided the data on the number of population at municipal level according to population census 2011 and vital events (live births and deaths) that have occurred from 01 April to 31 December 2011 .

CHAPTER 3
PAGE 30 ESTIMATION OF KOSOVO POPULATION 2011
Table 20. Population census 2011 and natural growth for the period 01 April - 31 December 2011
Municipality
Reference period
Population census 2011
01 April-31 December 2011 Census+ natural growth RFertility Mortality Natural growth
Deçan 40,019 562 113 449 40,468Gjakova 94,556 1,327 335 992 95,548Gllogoc 58,531 983 167 816 59,347Gjilan 90,178 1,165 335 831 91,009
Dragash 33,997 583 156 427 34,424Istog 39,289 541 132 409 39,698
Kaçanik 33,409 500 122 378 33,787Klina 38,496 740 120 620 39,116
Fushë Kosova 34,827 573 123 450 35,277Kamenica 36,085 349 150 199 36,284Mitrovica 84,235 1,243 356 887 85,122Leposaviq 13,773 92 130 -38 13,735
Lipjan 57,605 951 164 787 58,392Novobërda 6,729 45 30 15 6,744
Obiliq 21,549 315 66 249 21,798Rahovec 56,208 1,014 151 862 57,070
Peja 96,450 1,351 320 1,031 97,481Podujeva 88,499 1,251 236 1,015 89,514Pristina 198,897 2,922 605 2,317 201,214Prizren 177,781 2,640 552 2,087 179,868
Skenderaj 50,858 848 131 718 51,576Shtime 27,324 426 58 369 27,693
Shtërpca 6,949 74 46 28 6,977Suhareka 59,722 1,165 214 951 60,673
Ferizaj 108,610 1,636 361 1,275 109,885Vitia 46,987 700 161 539 47,526
Vushtrri 69,870 1,033 233 800 70,670Zubin Potok 6,616 52 58 -6 6,610
Zveçan 7,481 54 76 -23 7,458Malisheva 54,613 1,149 118 1,031 55,644
Junik 6,084 71 12 59 6,143Mamusha 5,507 92 10 82 5,589
Hani i Elezit 9,403 145 25 120 9,523Graçanica 10,675 63 67 -4 10,671Ranillug 3,866 25 37 -12 3,854Partesh 1,787 21 23 -2 1,785Kllokot 2,556 17 19 -2 2,554Total 1,780,021 26,719 6,014 20,705 1,800,726

CHAPTER 3
PAGE 31ESTIMATION OF KOSOVO POPULATION 2011
Other population movements (migration)
Emigration and Immigration33
Kosovo has adopted the law on “Settlement and residence’’ 34 (no. 02/L-121) in September 2007, but its implementation in practice is in the early stages and at the same time it is a challenge that has to be addressed and implemented by the responsible bodies.
Implementation of this law including: residents, lessors, civil registry offi ces and other competent institutions would be a particular benefi t for of entire Kosovo society.
Establishment of a database on population movements and constant monitoring would make possible for the institutions, mainly municipalities to make authentic plans and strategies for their community based on these data.
Under this law, all citizens who change their settlement or residence address are obliged to provide, within 8 (eight) days, the competent bodies with basic information for their family and some other personal data as specifi ed in this law (to fi ll in registration-deregistration form)
Also, all citizens who will leave Kosovo for more than three months, based on this law are obliged to inform the competent authority before travelling. Citizens who return with the aim of permanent residence shall inform the competent body on their return within 8 (eight) days ast er her/his return. Although punitive provisions are provided they are applied in practice very little.
Therefore, in the absence of these data on demographic changes that have occurred ast er the census (critical moment - March 31, 2011 at 24.00h), KAS is based on alternative sources by applying statistical standard and methods for estimation.
33 Emigration - population leaving a certain country Immigration- population coming in a certain country.34 http://www.assembly-kosova.org

CHAPTER 3
PAGE 32 ESTIMATION OF KOSOVO POPULATION 2011
Internal emigration and immigration As a source of the data on population movements inside Kosovo were used the data from:
Population census database
Ministry of Internal Aff airs
Ministry of Return
Ministry of Local Government Administration and
Municipalities
Data from the Ministries did not refl ect the situation on the ground about internal movements of the population. Municipalities have provided valuable contribution on internal movements when KAS requested from them to provide data on the number of households and persons by ethnicity that have arrived respectively lest their municipalities (within Kosovo) for more than a year respecting the applicable legislation.
Only 1/4 of the municipalities reported some data mainly on persons arrived in their municipalities while only around 10% of the municipalities provided data on people who lest their municipalities.
The results of the analysis of data from the abovemnetioned sources on population movements from one settlement/ municipality to another indicated that the data from relevant institutions were not representative of the situation on the ground.
Relevant institutions off ered a quite small number of internal migrations (in total around 1400 persons) that doesn’t represent the number of realistic movements based on statistics that KAS owns.
Therefore, KAS has used the Census 2011 database as the main source on internal movements.
The data in the table below represent the number of persons who have changed their settlement/ municipality (within three years) and moved to another settlement / other municipality in Kosovo for various reasons such as: employment, family reasons (family reunifi cation, marriage) permamnet displacements as well as other socio-economic factors.
This database is an overview of how internal migrations have occurred within the period 1 April up to 31 March of the years 2008 - 2011.
Based on that, the trend of movements from year to year was almost approximate the same for these three years, then as a basis for internal migrations was taken the average of these three years, within nine (9) months. These movements (01 April-31 December 2011) were added to the total number of respective municipalities.

CHAPTER 3
PAGE 33ESTIMATION OF KOSOVO POPULATION 2011
Table 21. Interior emigration / immigration in Kosovo
MUNICIPALITY
Date of moving from previous residence place01 April 2008-31 March 2009
01 April 2009-31 March 2010
01 April 2010-31 March 2011
TotalBalance
of internal migration (3 years)
Annual average
Average for 9
monthsArrived Lest Arrived Lest Arrived Lest Arrived Lest Deçan 123 151 115 171 143 174 381 496 -115 -38 -29
Gjakova 200 349 293 409 316 346 809 1,104 -295 -98 -74Gllogoc 230 400 240 409 251 387 721 1,195 -474 -158 -119Gjilan 331 381 335 453 426 424 1,092 1,258 -166 -55 -41
Dragash 50 99 40 165 73 202 163 466 -303 -101 -76Istog 228 117 262 132 227 167 717 416 301 100 75
Kaçanik 115 195 129 214 96 267 340 676 -336 -112 -84Klina 196 229 206 273 269 266 671 767 -96 -32 -24Fushë
Kosova675 146 922 190 972 247 2,569 582 1,987 662 497
Kamenica 67 419 96 432 106 461 269 1,312 -1,043 -348 -261Mitrovica 213 320 281 404 342 414 836 1,138 -302 -101 -75Leposaviq 0 9 0 12 0 5 0 26 -26 -9 -7
Lipjan 236 267 294 333 296 360 826 960 -134 -45 -33Novobërda 117 47 151 40 81 22 349 109 240 80 60
Obiliq 182 196 183 162 205 226 570 584 -14 -5 -4Rahovec 121 203 159 326 220 258 500 787 -287 -96 -72
Peja 273 311 325 286 297 331 895 928 -33 -11 -8Podujeva 132 724 190 938 173 971 495 2,633 -2,138 -713 -534Pristina 2,104 1,015 2,619 1,404 2,544 1,554 7,267 3,973 3,294 1,098 823Prizren 523 342 671 392 793 415 1,987 1,149 838 279 209
Skenderaj 172 499 196 548 216 583 584 1,630 -1,046 -349 -262Shtime 137 191 152 158 167 171 456 520 -64 -21 -16
Shtërpca 22 75 29 38 19 63 70 177 -107 -36 -27Suhareka 172 224 209 233 222 361 603 818 -215 -72 -54
Ferizaj 506 266 485 395 595 362 1,586 1,023 563 188 141Viti 132 180 177 278 161 264 470 722 -252 -84 -63
Vushtrri 229 303 270 408 294 455 793 1,165 -372 -124 -93Zubin Potok
0 4 0 6 0 3 0 14 -14 -5 -3
Zveqan 0 7 0 8 0 9 0 25 -25 -8 -6Malisheva 213 281 226 390 197 407 636 1,078 -442 -147 -110
Junik 34 13 43 16 33 22 110 51 59 20 15Mamusha 0 0 5 0 4 4 9 4 5 2 1
Hani i Elezit
51 46 39 46 53 42 143 135 8 3 2
Graçanica 218 10 259 11 409 18 886 39 847 282 212Ranillug 4 3 12 4 12 4 28 12 16 5 4Partesh 3 3 7 6 7 2 17 12 5 2 1Kllokot 19 0 75 6 50 1 144 7 137 46 34Total 8,028 8,028 9,695 9,695 10,269 10,269 27,992 27,992 0 0 0
CHAPTER 3
PAGE 34 ESTIMATION OF KOSOVO POPULATION 2011
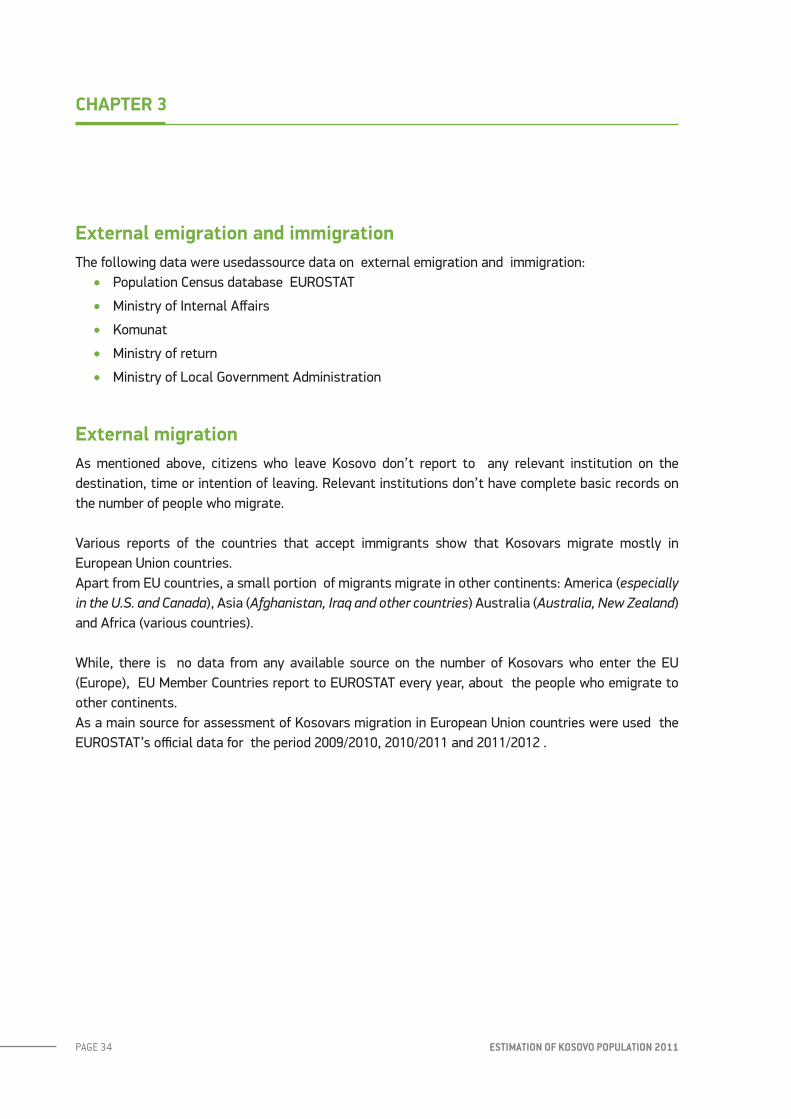
External emigration and immigration The following data were usedassource data on external emigration and immigration:
Population Census database EUROSTAT
Ministry of Internal Aff airs
Komunat
Ministry of return
Ministry of Local Government Administration
External migrationAs mentioned above, citizens who leave Kosovo don’t report to any relevant institution on the destination, time or intention of leaving. Relevant institutions don’t have complete basic records on the number of people who migrate.
Various reports of the countries that accept immigrants show that Kosovars migrate mostly in European Union countries.Apart from EU countries, a small portion of migrants migrate in other continents: America (especially in the U.S. and Canada), Asia (Afghanistan, Iraq and other countries) Australia (Australia, New Zealand) and Africa (various countries).
While, there is no data from any available source on the number of Kosovars who enter the EU (Europe), EU Member Countries report to EUROSTAT every year, about the people who emigrate to other continents.As a main source for assessment of Kosovars migration in European Union countries were used the EUROSTAT’s offi cial data for the period 2009/2010, 2010/2011 and 2011/2012 .

CHAPTER 3
PAGE 35ESTIMATION OF KOSOVO POPULATION 2011
Table 22. Number of Kosovo citizens who have sought asylum in EU countries35
Time frame Total
2009/2010October November December January February March April May June July August September
13.9351.570 1.375 1.210 885 1.065 1.270 1.110 945 985 960 1.190 1.370
2010/2011October November December January February March April May June July August September
12.0851.545 1.610 1.355 1.000 1.000 1.095 1.020 900 615 545 670 730
2011/2012October November December January February March April May June July August September
8.700695 725 795 670 560 740 505 720 790 815 755 930
According to the data, the number of Kosovars who have sought asylum during the period of nine (9) months (01 April -31 December 2011) in the EU countries is in total 6.695 persons. The number of migration will be taken into accunt as the basis of the migration balance, which was distributed pro rata to the number of population in municipalities.
External immigrationRelevant local and international institutions did not cover all persons who immigrated to Kosovo. Due to the diff erent profi les36 of people who immigrated to Kosovo, several institutions have provided data based on methodologies applied by those institutions only for a certain group. Data received from: ministries, municipalities and other local institutions refl ected a small number of returnees, while the data from UNHCR and IOM refl ected a larger number of returnees.
In the following table is given the total number of persons returned in Kosovo from all countries. This table refl ects the returnees (on voluntary basis, forced and assisted by IOM) originating from Kosovo including: returnees from diff erent countries, IDPs and refugees.
35 EUROSTST’s publications36 .a.Returnees from other countries, b.IDPs (persons assisted, volunteers, forced) c. Persons who have immigrated ast er many years in
Kosovo (Kosovo citizen or non-citizen) d. Diff erent marriages with citizens outside Kosovo d. Persons immigrated for the reasons of activities such as: business, work, organization, etc..

CHAPTER 3
PAGE 36 ESTIMATION OF KOSOVO POPULATION 2011
Table 23. Data on the number of persons Returned in Kosovo 2010-2012
InstitutionsPersons: returned, displaced and refugees
2010 2011 2012
UNHCR37 8.507 6.152 3.79638
IOM39 2.204 1.789 1.306
Based on that the data from UNHCR are representative and reliable sources, these data were taken as the basis for the number of persons who have immigrated in Kosovo.373839
Since the data include the period of one (1) year, the average number of returnees within nine (9) months was approximately 4,614 persons.
Balance of external migration according to this data in Kosovo for the period 01 April up to 31 December 2011 at the country level was -2,081 persons.
37 UNHCR, Offi ce of the Chief of Mission Pristina, Kosovo, STATISTICAL OVERVIEW, Update at end September 2012 38 Until September 201239 International Organization for Migration, mission in Kosovo

CHAPTER 3
PAGE 37ESTIMATION OF KOSOVO POPULATION 2011
Table 24. The fi nal estimated data for 2001 by municipalities
MUNICIPALITY
Data from: Total number of population
December 31, 2011
Population Census2011
Natural growth(01/04-31/12/2011)
Balance of migration
Balance of external migration
Balance of internal migration(average of
9 months)Deçan 40,019 449 -47 -29 40,392
Gjakova 94,556 992 -111 -74 95,363Gllogoc 58,531 816 -68 -119 59,160Gjilan 90,178 831 -105 -41 90,863
Dragash 33,997 427 -40 -76 34,308Istog 39,289 409 -46 75 39,727
Kaçanik 33,409 378 -39 -84 33,664Klina 38,496 620 -45 -24 39,047
Fushë Kosova 34,827 450 -41 497 35,733Kamenica 36,085 199 -42 -261 35,981Mitrovica 84,235 887 -98 -75 84,949Leposaviq 13,773 -38 -16 -7 13,712
Lipjan 57,605 787 -67 -33 58,292Novobërda 6,729 15 -8 60 6,796
Obiliq 21,549 249 -25 -4 21,769Rahovec 56,208 862 -66 -72 56,932
Peja 96,450 1,031 -113 -8 97,360Podujeva 88,499 1,015 -103 -534 88,877Pristina 198,897 2,317 -233 823 201,804Prizren 177,781 2,087 -208 209 179,869
Skenderaj 50,858 718 -59 -262 51,255Shtime 27,324 369 -32 -16 27,645
Shtërpca 6,949 28 -8 -27 6,942Suhareka 59,722 951 -70 -54 60,549
Ferizaj 108,610 1,275 -127 141 109,899Viti 46,987 539 -55 -63 47,408
Vushtrri 69,870 800 -82 -93 70,495Zubin Potok 6,616 -6 -8 -3 6,599
Zveçan 7,481 -23 -9 -6 7,443Malisheva 54,613 1,031 -64 -110 55,470
Junik 6,084 59 -7 15 6,151Mamusha 5,507 82 -6 1 5,584
Hani i Elezit 9,403 120 -11 2 9,514Graçanica 10,675 -4 -12 212 10,871Ranillug 3,866 -12 -5 4 3,853Partesh 1,787 -2 -2 1 1,784Kllokot 2,556 -2 -3 34 2,585Total 1,780,021 20,705 -2,081 0 1,798,645