ESCUELA TÉCNICA SUPERIOR DE INGENIEROS …oa.upm.es/47657/1/MIKEL_KEVIN_FERNANDEZ_COSIALS_2.pdf ·...
221
UNIVERSIDAD POLITÉCNICA DE MADRID DEPARTAMENTO DE INGENIERÍA ENERGÉTICA ESCUELA TÉCNICA SUPERIOR DE INGENIEROS INDUSTRIALES ANALYSIS AND IMPROVEMENT OF HYDROGEN MITIGATION STRATEGIES DURING A SEVERE ACCIDENT IN NUCLEAR CONTAINMENTS DOCTORAL THESIS KEVIN FERNÁNDEZ-COSIALS, POWER ENGINEER THESIS MENTOR: GONZALO JIMÉNEZ VARAS JULY 2017
Transcript of ESCUELA TÉCNICA SUPERIOR DE INGENIEROS …oa.upm.es/47657/1/MIKEL_KEVIN_FERNANDEZ_COSIALS_2.pdf ·...

UNIVERSIDAD POLITÉCNICA DE MADRID
DEPARTAMENTO DE INGENIERÍA ENERGÉTICA
ESCUELA TÉCNICA SUPERIOR DE
INGENIEROS INDUSTRIALES
ANALYSIS AND IMPROVEMENT OF HYDROGEN
MITIGATION STRATEGIES DURING A SEVERE
ACCIDENT IN NUCLEAR CONTAINMENTS
DOCTORAL THESIS
KEVIN FERNÁNDEZ-COSIALS, POWER ENGINEER
THESIS MENTOR: GONZALO JIMÉNEZ VARAS
JULY 2017

Author remark: For an optimal reading of the document, use the double page display
visualization option.
Nota del autor: Para una lectura óptima del documento, use la opción de visualización a
doble página.

i
“We can judge our progress by the
courage of our questions and the depth of
our answers, our willingness to embrace
what is true rather than what feels good.”
- Carl Sagan

ii
ABSTRACT
The computational simulation of nuclear containment phenomenology during an accident has been
historically a challenging issue. The containment size, the extreme characteristics of the mass and energy
release and the presence of several phases and species have enclosed this discipline within the lumped
parameters approach. In this approach, the full containment building is usually modeled in one or few
computational cells to simplify the calculation. Simulations with this approach provide values of the
containment thermodynamic variables (pressure, temperature, enthalpy, etc.) averaged in large volumes.
Said so, during the latest years, computer power has been increasing stable and constantly
according to Moore’s Law, and nowadays containment codes offer the possibility of creating functional
full 3D containment models. This combination of effects bring the possibility of highly detailed simulations
and extended sensitivity analyses in a single workstation.
In detail, GOTHIC 8.0 code, and later versions, is capable of simulating design basis accidents and
severe accidents in a full 3D model with a reasonable computational cost. Given that there was no
established methodology for creating and developing these models, the first step of the Thesis was to
create a methodology for this purposes. The methodology created is composed of three steps. First, the
creation of a detailed CAD model of the containment. Second, the creation of a simplified CAD model
based on the GOTHIC selectable geometries. Third, the implementation of the simplified geometry in
GOTHIC via an in-house script. After these steps, the thermal-hydraulic GOTHIC model would be ready
to simulate accidental sequences. As an application of the methodology, a PWR-W 3D containment
model has been created for the Thesis.
In a second step, before an accident simulation, a verification and validation process of the
containment model and code is necessary. GOTHIC is capable of satisfactorily simulate several
experiments involving all kind of phenomenology, as shown in the “Qualification Report”. However, it was
found necessary to perform an in-house validation of the code and for this reason, two works have been
developed. First, the simulation of a light gas transport in a large enclosure, which was part of the
International Benchmark Exercise III. This study pointed out the code capability of simulating this
phenomenology accurately. Second, a mesh independence study of the 3D PWR-W containment model.
This study helped in the decision-making process between accuracy and computational cost.
Once the model was built up and validated, a wide range of transients were ready for simulation.
However, the analysis process had to be previously reviewed and adapted to this new 3D containment
model. When analyzing the results of a lumped parameters model with a single node, there is only one
value per variable, and it is easily comparable to the safety limits in order to assess any damage or limit
surpass. A 3D model have thousands of cells and values, and therefore, the question was how to assess
damage adequately for containment 3D analysis that takes into account all the values provided by the
model. For example, classical pressure and temperature peak values are valid but not enough, as they
are meant to be compared with the solution in a single cell that represents a large volume.

iii
In this Thesis, a re-analysis of equipment and instrumentation peak temperatures for EQ is made
based on the 3D containment analysis. A generic EQ for PWR-W large dry is chosen and subsequently,
these limits are evaluated in an analysis of a Double Ended Guillotine Break Loss Of Coolant Accident in
the PWR-W 3D containment model developed with GOTHIC 8.1 (QA). In addition, a sensitivity analysis
on the break location is performed. The results show that under a generic EQ criteria, equipment or
instrumentation from different rooms could be under risk of damage during the transient.
Besides design basis accidents, severe accidents scenarios are also interesting to simulate and
analyze. Severe accidents normally have to deal with hydrogen, an element whose combustion can impair
the containment. To coup with this threat, the SAMGs can be used. These guidelines include several
actions to handle the hydrogen challenge including the venting strategy; however, these guidelines do
not normally help the operators in deciding when the optimal moment to vent is.
To address this issue, the PWR-W containment model is used to simulate a SBO scenario including
actions from the SAMGs. The venting and spraying strategy and their impact on hydrogen risk are
evaluated in a sensitivity analysis; more than 60 sequences have been simulated with different timing of
venting and spraying.
To compare all simulations between each other, a quantitative approach to hydrogen risk was
needed. Therefore, hydrogen risk is estimated using a new proposed parameter named “Tau”. This
parameter takes into account three variables for each cell: the time it spends within the flammability limits,
the mass of hydrogen that is within the flammability limits, and the combustion regime reached. With this
parameter, a single value can be obtained to quantify the hydrogen risk in a complete transient.
Finally, reviewing the sensitivity analysis, it is found that hydrogen risk is highly dependent on the
venting strategy used. As a proposal, optimal time windows for venting are proposed in order to reduce
the hydrogen risk of the transient.
As a conclusion, it is stated that containment 3D models and analyses are an excellent tool to
advance in the nuclear safety discipline. It needs new methodologies, criteria and assessment, but if
created and used correctly, containment 3D analyses will be the future for nuclear power plants licensing.

iv
RESUMEN
La simulación computacional de la fenomenología de una contención nuclear durante un accidente
ha sido históricamente un desafío. El tamaño de la contención, las características de la liberación de
masa y energía así como la presencia de varias fases y especies han atrapado a esta disciplina con la
aproximación de parámetros agrupados. En esta aproximación, toda la contención se simula en un único
nodo de computación para simplificar los cálculos. Las simulaciones con esta aproximación proporcionan
valores medios de variables termodinámicas de la contención (presión, temperatura, entalpía, etc.)
Dicho esto, en los últimos años, la capacidad de los ordenadores ha crecido estable y constante
acorde a la ley de Moore, y los códigos de simulación de contenciones tienen la capacidad de crear
contenciones 3D funcionales. Esta combinación de efectos da la posibilidad de simular casos de un alto
grado de detalle, y realizar análisis de sensibilidad extensos en un ordenador corriente.
En detalle, el código GOTHIC 8.0, y sus subsiguientes, tiene la posibilidad de simular accidentes
base de diseño y accidentes severos en una contención 3D con un coste computacional razonable. Dado
que no existía una metodología de creación y desarrollo de estos modelos, el primer paso de esta tesis
fue crear esta metodología. La metodología desarrollada se compone de tres pasos. El primero es la
creación de un modelo detallado CAD de la contención. El segundo paso es la creación de un modelo
simplificado de contención que encaje en las geometrías que permite el código GOTHIC. El tercero es la
implementación de la geometría en el código mediante un script propio. Tras estos pasos el modelo
termo-hidráulico estaría preparado para simular secuencias de accidente. Aplicando esta metodología,
un modelo de contención PWR-W 3D ha sido creado para esta tesis.
Previamente a la simulación de accidentes, es necesario un proceso de verificación y validación
del código y los modelos. El código es capaz de reproducir satisfactoriamente experimentos que
engloban todo tipo de fenomenología, como se observa en el “Qualification Report”. Sin embargo, se ha
considerado necesario realizar trabajos de validación propios; en concreto se han realizado dos trabajos.
El primero consistió en la simulación de un transporte de gas ligero en un contenedor grande, que fue
parte del “International Benchmark Exercise III”. Este estudio demostró la capacidad del código en
simular con precisión esta fenomenología. El segundo proceso de validación consistió en un estudio de
independencia de malla del modelo de contención PWR-W. Este estudio ayudó en la toma de decisiones
entre coste computacional y precisión.
Una vez el modelo estaba creado y validado, se abrió un amplio abanico de posibilidades. Sin
embargo, el proceso de análisis de transitorios debía ser previamente adaptado y revisado para estas
simulaciones 3D de contención. Cuando se analizan los resultados de un modelo de parámetros
agrupados de un solo nodo, sólo existe un único valor por variable, y éste es fácilmente comparable con
los límites de seguridad para evaluar el daño. Un modelo 3D tiene miles de celdas y valores, por lo tanto,
la pregunta que surge es cómo definir un nuevo concepto de daño que sea adecuado para análisis de
contención 3D y que tenga en cuenta los miles de valores provenientes de un modelo 3D. Los valores

v
clásicos de presión y temperatura son válidos, pero no es suficiente, ya que están pensados para ser
comparados con la solución en un solo nodo de cálculo que represente un volumen muy grande.
Siguiendo esta línea de la tesis, se ha realizado un re análisis de las temperaturas usadas para
calificación ambiental de equipos teniendo en cuenta los modelos de contención 3D. Se ha usado un
criterio genérico para PWR-W de EQ y seguidamente, este criterio se ha aplicado al análisis de un
accidente de pérdida de refrigerante con rotura en doble guillotina en la contención 3D del PWR-W
desarrollada con GOTHIC 8.1. Adicionalmente, se ha realizado un análisis de sensibilidad a la
localización de la rotura. Los resultados muestran que con este EQ genérico, el posible equipo y/o
instrumentación de las diferentes habitaciones podría resultar dañado durante el transitorio.
Además de accidentes base de diseño, los accidentes severos resultan también interesantes para
simular y analizar. Los accidentes severos normalmente tienen que lidiar con hidrógeno, un elemento
cuya combustión puede dañar la contención. Para evitar daños, las guías de gestión de accidente severo
son usadas. Estas guías incluyen ciertas acciones que permiten manejar el riesgo de hidrógeno,
incluyendo la acción de venteo de la contención. Sin embargo, estas guías no ayudan normalmente a
decidir cuál es el momento óptimo para ventear la misma.
En esta tesis el modelo de contención PWR-W es usado para simular un SBO incluyendo acciones
de guías de gestión de accidente severo. El impacto que provocan el spray y el venteo en el riesgo de
hidrógeno se han evaluado en un análisis de sensibilidad a través de más de 60 secuencias con distintos
tiempos de spray y venteo. Para comparar todas las simulaciones entre ellas, se necesita una
aproximación cuantitativa al riesgo de hidrógeno. Para ello, este riesgo se evalúa según una propuesta
de parámetro llamado “Tau”. Este parámetro tiene en cuenta tres variables por celda: el tiempo que ésta
está dentro de los límites de flamabilidad, la masa de hidrógeno dentro de esos límites, y el régimen de
combustión alcanzado. Con este parámetro, se obtiene un único valor por simulación para cuantificar el
riesgo de hidrógeno.
Finalmente, revisando los análisis de sensibilidad, se observa que el riesgo de hidrógeno es muy
dependiente de la estrategia de venteo usada. En esta tesis, se proponen ventanas de tiempo óptimas
para el venteo que reducen el riesgo de hidrógeno.
A modo de conclusión, se establece que los análisis 3D de contención son una excelente
herramienta para hacer avanzar a la seguridad nuclear. Se necesitan nuevas metodologías, criterios y
evaluaciones, pero si se crean y usan correctamente, los análisis de contención 3D serán el futuro del
licenciamiento de centrales nucleares.

vi
THESIS’ ACKNOWLEDGMENTS
Usually, awards are thanked, dedicated, and shared when received. This work is the product of
some single ideas, several years of work, dozens of dead-ends, hundreds of papers read and thousands
of computer simulations. It is anyway obvious that this Thesis is not an award for anything; however, the
act of finishing it (some might say abandon it) resembles enough to an award to follow the mentioned
formulae.
Consequently to our previous decision, I would like to first, dedicate this Thesis to my Family.
Particularly, to my father Guillermo, who really pushed and challenged me to the limit when I mostly
needed. To my mother Clara, from which I honestly will try to return all the unconditional love she has
given, to me, and to the world. And to my sister Carlota; I’m absurdly lucky of having her in my life.
Secondly, I would like to thank the mentors that have marched with me in the path of completing
this work. In first place, I would like to show my gratitude to my thesis tutor, whose guidance has put me
where I am now, thanks Gonzalo. In second place, I have to acknowledge my Thesis-colleague, whose
knowledge fights, conclusions battles and scientific method combats during all these years have definitely
improve the quality of this work, thanks Rafa. Thirdly, I cannot miss the opportunity to thank the person
that let me to absorb as much knowledge as I could when I was next to him in PSI, thanks Michele.
Finally, I would like to share this Thesis with everyone that has positively influenced me for this
work during these years, but unfortunately they are too many to name them all… Well, in fact, I actually do
not like these kind of acknowledgments… Because it is actually possible to name everyone that has
positively influenced me enough to be remembered. This is not a ceremony with a limited time, there is
not a maximum number of pages per Thesis, a maximum number of persons to dedicate, or an extra cost
per person named in the printed version; and taking into account that I really appreciate these persons, I
want them to be a part of my thesis, literally.
For this reason, I would like to start sharing this Thesis with more family, my grandparents Marisefa
and Telmo, with Gilbert II, Jorge, Vir and little Chloe Manhattan. I would like to share it also with the people
that has been in the UPM nuclear department with whom I’ve spent terrific times: with a special care to
Samy Stevenson, and with Charlie, Santi, Dani Calvo & Justo, Gonzalo, Karen, Zuri and Panizo. I also
really want to share it with the people from La Galerna, life is all about priorities; Apu, “Dr. J”, Alfonso,
David, Carmen, Nico, Nacho, Xavi and Pepe. I am not forgetting the people from the PSI and Switzerland:
Davide, Benedict, Ali, Nathan, Bojan and Arnoldo. Special thanks to this last one who opened for me the
Pandora-black box CFDs were turning in. Some of the greatest joys and cracks I have suffered during
these years that make me look the Thesis in a different way are thanks to CBC people: Thanks Doc and
the 2003 and 2001 fem teams. The charging battery for this Thesis has also a name, the Sons of Liberty:
Lalo, Pul, Crespi, Alvaro, Guz, Nico, Pepe, Pera and Millet. Part of this Thesis is definitely yours, and
belongs to the soul of Peniche. I want to share it also with the Best Team, Ana, Adri and my big friend Mr
Toraño. The sharing encompasses Hinds, Ade y Ana, again, it can be noted that part of this Thesis smells

vii
like your music. Old and new friends are finally also part of it: Indio, Pérez, Alfon, Perea, Hache, Maru,
and Ize.
And finally, this last sentence is for you Érika, Love, I am really amazed of the way you make me
happy all the time.

viii
THESIS’ OBJECTIVES
One of the main Thesis objectives was to explore the full potential of 3D containment models. In
comparison to lumped parameters models, these models allow not only deeper detail, but also new
approaches to the way of analyzing transients. So, the main objectives of the Thesis were to create fully
functional 3D containment models, and then investigate into the two main kind of accidents in a nuclear
power plant, the design basis accident, and the severe accident.
The design basis accident is interesting because instrumentation and equipment EQ limits were
calculated usually using the lumped parameters approach. This could be controversial because the
equipment and instrumentation qualification is affected by local phenomena. This approach is inherently
thought to be conservative, so a main objective of the Thesis is to debate on this hypothesis.
The severe accident is also interesting because hydrogen is generated during its development.
CFD codes have been already used to calculate the hydrogen distribution within a nuclear containment
in a single simulation. What is interesting, is that with a containment model capable of simulating long
transients in an adequate amount of time, the behavior of the transient as a function of certain variable
can be extracted. In this aspect, the venting strategy contemplated in the SAMGs was the target variable.
There is no clear definition on when to vent regarding on the hydrogen risk, or if this strategy actually
reduces the hydrogen risk inside the containment. There is controversy on this topic, so research on this
line seemed very useful.

ix
This Page is Intentionally Left
Blank

x
THESIS’ FINANCIAL SUPPORT
The financial support of this Thesis has been obtained from several sources. The author has to
acknowledge “Iberdrola, Construcción e Ingeniería”, for the support based on the project FILTRONUC.
Central Nuclear de Almaraz-Trillo, for the support based on the project “Creación de modelos
termohidráulicos de contención 3D de CN Almaraz y CN Trillo. To “Jóvenes Nucleares” and “Sociedad
Nuclear Española” for the support in the travel to IYNC 2016. The Spanish CSN “Cátedra Federico Goded
del Consejo de Seguridad Nuclear” for its support during the internship in PSI. The European GENTLE
project, for its support in the internship in PSI as well. The project PYGAS, that depends on the Spanish
ministry of work and employment, and allowed us to obtain financial resources to increase our
computational power. And finally, thanks to CESVIMA, from UPM, which provide us with the use of
MAGERIT, a supercomputing center. Without this support, this Thesis would definitely not have been
possible.

xi
This Page is Intentionally Left
Blank

xii
THESIS’ OUTCOMES
During the development of the Thesis, several research papers have been published, as well as
many conference proceedings. The list below shows the most significant ones (the articles in press will
not be showed).
δ Jiménez G, Bocanegra R, Fernández-Cosials K, Queral C, Montero-Mayorga J. Development of
a PWR-W and an AP1000 containment building 3D model with a CFD code for Best-Estimate
Thermal-Hydraulic Analysis. ICONE22, Prague: ASME; 2014, p. 6. doi: 10.1115/ICONE22-30445.
δ Fernández-Cosials K, Jiménez G, Matías R. Investigations of the break-up of hydrogen
stratification in a PWR with CFD codes. CFD4NRS, Zurich: 2014
δ Jiménez G, Bocanegra R, Fernández-Cosials K, Barreira P, Rey L, J.M. P, et al. Desarrollo de
modelos 3D de los edificios de la Central Nuclear de Almaraz y de la Central Nuclear de Trillo
con el código GOTHIC 8.0. Reun. Anu. la Soc. Nucl. Española, Valencia, Spain.: 2014
δ Jiménez G, Matías R, Fernández-Cosials K, Justo D, Bocanegra R, Mena L, et al. Estudio de la
distribución de hidrógeno en una contención PWR con códigos CFD. Nucl España 2015;363:53–
55
δ Jiménez G, Fernández-Cosials K, Bocanegra R, López-Alonso E. Best-estimate LOCA simulation
in a PWR-W containment building with a detailed 3D GOTHIC model. ENYGF, Paris: 2015.
δ Jimenez G, Bocanegra R, Fernández-Cosials K, Barreira P, Rey L, J.M. P, et al. Estudio Termo-
hidráulico de los patrones de flujo tridimensional en las contenciones de C.N. Almaraz y C.N.
Trillo con el código GOTHIC en un accidente tipo LBLOCA. Reun. Anu. la Soc. Nucl. Española,
Coruña, Spain: 2015.
δ Fernández-Cosials MK, Jimenez G, Lopez-Alonso E. Analysis of a gas stratification break-up by
a vertical jet using the GOTHIC code. Nucl Eng Des 2016; 297:123–35.
doi:10.1016/j.nucengdes.2015.11.035.
δ Bocanegra R, Jimenez G, Fernández-Cosials MK. Development of a PWR-W GOTHIC 3D model
for containment accident analysis. Ann Nucl Energy 2016; 87:547–60.
doi:10.1016/j.anucene.2015.10.022.
δ Fernández-Cosials K, Goñi Z, Jiménez G, Queral C, Montero J. Three-dimensional simulation of
a LBLOCA in a AP1000 containment buidling. Int. Youth Nucl. Congr., Hangzhou: 2016.
δ Jimenez G, Bocanegra R, Fernández-Cosials K, Barreira P, Rey L, J.M. P, et al. Development of
Almaraz and Trillo NPP containment GOTHIC 3D models for thermal-hydraulic analysis. Eur.
Nucl. Conferfence, 2016

xiii
δ Fernández-Cosials K, Jiménez G, Estévez-Albuja S, Bocanegra R, Barreira P, Rey L, et al.
Double-Ended LBLOCA Containment Analysis in Trillo NPP with GOTHIC 8.1. Reun. Anu. la Soc.
Nucl. Española, Santander, Spain.: 2016.
δ Goñi Z, Jiménez G, Fernández-Cosials K, Queral C, Montero J. Análisis de un accidente tipo
SBLOCA en la contención AP1000 con el código GOTHIC 8.0. Nucl España 2016;373:72-76.
δ Bocanegra R, Jimenez G, Fernández-Cosials K. GOTHIC Advisory Group Meeting. GOTHIC Advis. Gr. Meet. Madrid, Spain: 2017.
δ Fernández-Cosials K, Bocanegra R, Estévez-Albuja S, Goñi Z, Jiménez G. Towards the definition
of local damage criteria for containment safety analysis. Ind. Res. Meet., Madrid, Spain.: 2017
δ Fernández-Cosials K, Andreani M, Jiménez G. On the augmentation factor of the heat transfer
coefficient using the GOTHIC code during a jet interaction. GOTHIC Advis. Gr. Meet., Madrid,
Spain: 2017.
δ

xiv
THESIS’ STRUCTURE
There are two versions of this document (digital and printed). In the digital version, sections and
figures are included as hyperlinks. For reading improvement, Figures are not imbibed in the text, but put
separately in different sheets. For this reason, in the digital version, it is encouraged to use the double-
page view display. The bibliography is cited in order of appearance. The present document is divided into
seven sections The first three sections compound an introduction and state of the art to the containment
phenomenology, licensing and safety analysis regarding design basis accidents and severe accidents.
These three sections are the following:
1. State of the art of the containment analysis of design basis accidents; in this part the
chronological evolution of safety analysis of a nuclear power plant containment is described. Containment
modeling, safety standards and application examples are explained.
2. Hydrogen & nuclear safety; in this section the relationship between hydrogen and nuclear safety
is described. The hydrogen properties, deepen on its flammability is explained. In addition the state of the
art of the computational simulation of hydrogen is also explained.
3. Hydrogen mitigation strategies; this section deals with the human actions contemplated in the
severe accident management guidelines regarding the hydrogen issue.
The fourth section of this Thesis describes the computer codes and models used. It is named as:
4. Models & Methods; the GOTHIC code is detailed in this section as it plays a central role on the
Thesis. MELCOR and ProTON codes are described as well. The PWR-W containment model used for
the studies is also depicted.
The next two sections show the main studies using the PWR-W model. The first study deepens in
design basis accidents while the latter looks for insights in the venting strategy to deal with hydrogen risk.
5. Analysis of equipment and instrumentation EQ using containment 3D models; this section covers
the re-analysis of the temperature limits utilized for EQ. The motivations for this criteria are shown, as
well as its proper definition. The simulations that support this new analysis are also explained and
analyzed.
6. Hydrogen mitigation in a PWR-W containment during a SBO scenario; Tau parameter definition
and application on venting strategy analysis; in this section the definition of the Tau parameter, which
quantifies the hydrogen risk is provided. This parameter is used in an analysis on the venting strategy in
order to provide insights on the best timing for venting.
The final chapter, condenses the efforts of this Thesis and the main advances in two sheets:
Conclusions. Bibliography is included at the end of the document.

xv
THESIS’ CONTENT
1 State of the Art of Containment Analysis of Design Basis Accidents ........ 1
1.1 Introduction to the LOCA as the Main Design Basis Accident ...................... 3
1.2 Nuclear Safety; context, origin and development ......................................... 5
1.3 Design Basis Accident Concept ................................................................... 7
1.4 The LOCA as a Design Basis Accident ........................................................ 9
1.5 Containment Safety Evolution.................................................................... 13
Early Legislation ........................................................................................... 13
Containment types for Water Reactors ......................................................... 17
1.6 Numerical models of containments for accident analysis ........................... 32
Containment codes ....................................................................................... 32
Modeling Guidelines for containment analysis .............................................. 34
Conclusions on the Lumped Parameters Methodologies............................... 36
1.7 Annex A. ANSI/ANS 56.4-1983 Requirements for Containments Integrity Analysis,
[58]. 38
Analytical Considerations .............................................................................. 38
Thermodynamic Considerations ................................................................... 38
Mass and Energy Release Considerations ................................................... 39
Structural Heat Transfer Considerations ....................................................... 39
Containment Spray Considerations............................................................... 39
Containment Heat Removal Considerations ................................................. 40
2 Hydrogen & Nuclear Safety ................................................................... 41
2.1 Introduction ................................................................................................ 43
2.2 Hydrogen properties .................................................................................. 45
Hydrogen Generation.................................................................................... 46
Hydrogen Flammability ................................................................................. 47
Hydrogen Ignition .......................................................................................... 53
2.3 Computational Simulation of Hydrogen Risk.............................................. 55

xvi
3 Hydrogen Mitigations Strategies during a Severe Accident .................... 63
3.1 Introduction ................................................................................................ 65
3.2 Severe Accident Management Guidelines ................................................. 67
Mitigation Strategies against Hydrogen ......................................................... 69
4 Models & Methods ................................................................................ 77
4.1 Introduction ................................................................................................ 79
4.2 The GOTHIC Code .................................................................................... 80
GOTHIC Capabilities .................................................................................... 80
GOTHIC Verification & Validation ................................................................. 81
4.3 The MELCOR Code ................................................................................. 111
MELCOR Capabilities ................................................................................. 111
MELCOR Verification & Validation .............................................................. 112
4.4 The ProTON Code ................................................................................... 114
ProTON Capabilities ................................................................................... 114
4.5 Development of a 3D PWR-W Containment Model with GOTHIC Code 121
Detailed PWR-W CAD 3D Model ................................................................ 121
Simplified PWR-W 3D CAD Model .............................................................. 123
PWR-W containment GOTHIC 3D model .................................................... 123
Opened Research Lines ............................................................................. 130
5 Analysis of Equipment and Instrumentation EQ Using 3D Containment Models
133
5.1 Introduction .............................................................................................. 135
5.2 Analysis of Temperature Limits Obtained with LP Models ....................... 138
5.3 Containment Model .................................................................................. 141
Mass & Energy Release ............................................................................. 141
Post-Processing.......................................................................................... 143
5.4 Simulation Results ................................................................................... 143
Base Case Results ..................................................................................... 143
Sensitivity Analysis ..................................................................................... 151
5.5 Conclusions ............................................................................................. 153

xvii
6 Hydrogen Mitigation in a PWR-W Containment during a SBO Scenario; Tau
Parameter Definition and Application on Venting Strategy Analysis ................ 157
6.1 Introduction .............................................................................................. 159
6.2 PWR-W Containment Model .................................................................... 161
6.3 Evaluation of the Hydrogen Risk; the Tau Parameter .............................. 163
The Tau Parameter, (τ) ............................................................................... 163
6.4 SBO Reference Sequence ....................................................................... 167
Mass & Energy Release ............................................................................. 167
Reference SBO GOTHIC Simulation .......................................................... 167
6.5 Sensitivity Analysis for Human Actions .................................................... 171
6.6 Results, Discussion and Proposal ........................................................... 175
6.7 Conclusions ............................................................................................. 177
6.8 Annex B ................................................................................................... 179
Thesis’ Conclusions .............................................................................................. 182
Bibliography ......................................................................................................... 184

xviii
LIST OF FIGURES
Figure 1-1. Atomic Energy Commission and its evolution, the Nuclear Regulatory Commission . 4
Figure 1-2. Shipping port Nuclear Power Plant Illustration. http://www.ansnuclearcafe.org/wp-
content/uploads/2014/01/PWRplantWEreprint.jpg ........................................................................ 4
Figure 1-3. Bypass phase after a LOCA [7] ................................................................................... 8
Figure 1-4. Wash-1400 extract on deaths per year [9] ................................................................ 10
Figure 1-5. Problematic issues regarding LOCA phenomena [10] .............................................. 10
Figure 1-6. “China Syndrome” reached the popular culture through the movie theaters increasing the
unpopularity of Nuclear Power Plants, March, 1979. By Source, Fair use,
https://en.wikipedia.org/w/index.php?curid=7454833 .................................................................. 14
Figure 1-7. Different contaiments design pressure values, free volume and leakage rate, [26] . 14
Figure 1-8. Footage of 1988 rocket-sled test, F-4 Phantom, SANDIA National Laboratories, [30]16
Figure 1-9. Footage of 1988 rocket-sled test, F-4 Phantom, SANDIA National Laboratories, [30]16
Figure 1-10. Large Dry PWR Containment .................................................................................. 18
Figure 1-11. Ice condenser PWR containment, [31] .................................................................... 18
Figure 1-12. Sub Atmospheric PWR Containment, [32] .............................................................. 20
Figure 1-13. CANDU PHWR Containment................................................................................... 20
Figure 1-14 Konvoi PWR Containment type, [32] ........................................................................ 22
Figure 1-15. Advanced Passive Westinghouse reactor containment type, [33] .......................... 22
Figure 1-16. AES-92 reactor containment type, [34] .................................................................... 24
Figure 1-17. EPR reactor containment type, [35] ......................................................................... 24
Figure 1-18 BWR dry containment type, [36] ............................................................................... 26
Figure 1-19 Mark I containment type, [37] ................................................................................... 26
Figure 1-20 Mark II containment type, [37] .................................................................................. 28
Figure 1-21. Mark III containment type, [37] ................................................................................ 30
Figure 1-22. ESBWR containment type, [38] ............................................................................... 30
Figure 2-1. Containment pressure during the TMI-II accident, [66] ............................................. 44
Figure 2-2. Hydrogen Explosion on Fukushima-Daiichi,[66] ....................................................... 44
Figure 2-3. Hydrogen emission spectrum lines in the visible range. ........................................... 45
Figure 2-4. Shapiro flammability diagram for hydrogen-air-steam mixtures at 1 bar and 298 K, [71] 50

xix
Figure 2-5. Flame dependence on turbulence regime, [73] ......................................................... 50
Figure 2-6. Autoignition time dependence on Temperature and Pressure, [86] .......................... 54
Figure 2-7. Hydrogen and steam distribution calculation by Royl et al.[92] ................................. 56
Figure 2-8. Hydrogen distribution study in the Fukushima accident by Xiao et al. [103] ............. 58
Figure 2-9. Hydrogen distribution calculation in a KWU by Papini et al. [110] ............................ 60
Figure 2-10. General overview of the IBE-3 configuration, [117] ................................................. 60
Figure 3-1. Example of interaction in SMAGs .............................................................................. 66
Figure 3-2. Single Drop Collection Efficiency measured in CSE sprays, [131] ........................... 72
Figure 3-3, CA-4, Potential for hydrogen combustion, [132] ........................................................ 72
Figure 3-4, Volumetric Flow of containment gases, [133] ............................................................ 74
Figure 4-17. General Overview of the IBE-3 configuration [117]. ................................................ 82
Figure 4-18. Initial molar fractions [117] ....................................................................................... 82
Figure 4-19. Helium concentration evolution in the Pre-Test ....................................................... 84
Figure 4-20. Nodalization of the Pre-test case ............................................................................. 84
Figure 4-21. Nodalization of the Base Case ................................................................................ 86
Figure 4-22. Evolution of the Helium Concentration in the Base Case (Post-test) ...................... 88
Figure 4-23. Helium Concentration in upper and lower neighborhood cells ................................ 88
Figure 4-24. Temperatures in the Base Case (Post-test) ............................................................ 90
Figure 4-25. Time of Helium concentration drop below 0.2 at different heights for turbulence sensitivity
...................................................................................................................................................... 92
Figure 4-26. Velocity at height 5.9 m in the jet axis for turbulence sensitivity ............................. 92
Figure 4-27. Temperature in sensitivity HTC_1 ........................................................................... 94
Figure 4-28. Time of Helium concentration drop below 0.2 at different heights for heat transfer sensitivity
...................................................................................................................................................... 94
Figure 4-29. Helium Volume Fraction at top and bottom heights for maximum time step sensitivity 96
Figure 4-30. PIC of a light gas distribution with GOTHIC ............................................................ 98
Figure 4-31. Pressure results of the mesh sensitivity analysis in SG1 cage ............................. 106
Figure 4-32. Temperature results of the mesh sensitivity analysis in SG1 cage ....................... 106
Figure 4-33. Temperature results of the mesh sensitivity analysis in SG2 cage ....................... 107
Figure 4-34. Temperature results of the mesh sensitivity analysis in SG3 cage ....................... 107

xx
Figure 4-35. Temperature results of the mesh sensitivity analysis in the annulus and dome ... 108
Figure 4-36. Maximum temperature results of the mesh sensitivity analysis in SG1 cage ....... 108
Figure 4-37. AP1000 containment nodalization with MELCOR, [42] ......................................... 110
Figure 4-38. PWR containment used as basis, [159] ................................................................. 120
Figure 4-39. Vertical Snap construction method ........................................................................ 120
Figure 4-40. Detailed CAD containment model ......................................................................... 122
Figure 4-41. Simplified CAD containment model ....................................................................... 124
Figure 4-42. Mesh of the DIM model used in this Thesis ........................................................... 126
Figure 4-43. Mesh of the DIM model used in this Thesis ........................................................... 126
Figure 4-44. Different Rooms extracted from the Multi-zone model .......................................... 128
Figure 4-45. MZMB containment model used for a SBO simulation .......................................... 128
Figure 5-1: PWR-W Containment Analyzed Zones ................................................................... 140
Figure 5-2: PWR-W Containment Analyzed Zones ................................................................... 140
Figure 5-3: PWR-W Containment Analyzed Zones ................................................................... 142
Figure 5-4. Liquid Mass Flow of the M&E Release .................................................................... 142
Figure 5-5. Vapor Mass Flow of the M&E Release .................................................................... 144
Figure 5-6. Vapor Temperature of the M&E Release ................................................................ 144
Figure 5-7. Pressure of the M&E Release ................................................................................. 144
Figure 5-8. Liquid Temperature of the M&E Release ................................................................ 145
Figure 5-9. Average Containment Temperature Evolution ........................................................ 145
Figure 5-10. Average Containment Pressure Evolution ............................................................ 145
Figure 5-11. Room Average Temperature Evolution in the Base Case .................................... 146
Figure 5-12. Room Average Pressure Evolution in the Base Case ........................................... 146
Figure 5-13. Temperature evolution in the Base Case .............................................................. 148
Figure 5-14. Maximum Room Temperature of each Room in Base Case 1 .............................. 150
Figure 5-15. Velocity vectors and streamlines at the beginning of the transient. ...................... 150
Figure 5-16. Temperature Peaks Resume (Base Case 1)......................................................... 152
Figure 6-1. Containment rooms in CAD model. [146] ................................................................ 160
Figure 6-2. GOTHIC containment model ................................................................................... 162

xxi
Figure 6-3 Hydrogen source (SBO reference case) .................................................................. 166
Figure 6-4 Liquid water source (SBO reference case) ............................................................... 166
Figure 6-5. Vapor source (SBO reference case) ....................................................................... 166
Figure 6-6. Hydrogen Concentration inside the containment rooms (SBO reference case) ..... 168
Figure 6-7. Combustion regime limits reached inside the containment rooms (SBO reference case) 168
Figure 6-8. Average Temperature inside the containment rooms (SBO reference case) ......... 170
Figure 6-9 Average Pressure inside the containment (SBO reference case) ............................ 170
Figure 6-10 Tau evolution in every containment room (SBO reference case) .......................... 170
Figure 6-11. Tau value of sensitivity analysis on human actions ............................................... 172
Figure 6-12. Temporal evolution of Tau in representative cases............................................... 172
Figure 6-13. Tau temporal change rate in representative cases ............................................... 174
Figure 6-14. Maximum temperature reached (SBO reference case)......................................... 174
Figure 6-15. Gas volume fractions in an indicator in the dome region. ..................................... 176

xxii

xxiii
LIST OF RELEVANT ACRONYMS
AEC Atomic Energy Commission
BE Best Estimate
BWR Boiling Water Reactor
CFD Computational Fluid Dynamics
DDT Deflagration to Detonation Transition
DBA Design Basis Accident
DBE Design Basis Event
DEGB Double Ended Guillotine Break
ECCS Emergency Core Cooling System
EOP Emergency Operation Procedure
EQ Environmental Qualification
EQML Environmental Qualification Master List
FSAR Final Safety Analysis Report
FP Fission Products
FA Flame Acceleration
HELB High-Energy Line Break
IC Ice Condenser
IRWST Internal Refueling Water Storage Tank
LWR Light Water Reactor
LOCA Loss Of Coolant Accident
LOOP Loss Of Outside Power
MSLB Main Steam Line Break
xxiv
M&E Mass & Energy
MCCI Molten Concrete Core Interaction
NRC Nuclear Regulatory Commission,
PAR Passive Autocatalytic Recombiner
PCCS Passive Containment Cooling System
PHWR Pressurized Heavy-Water Reactor
PWR Pressurized Water Reactor
PCS Primary Cooling System
PRA Probabilistic Risk Assessment
ProTON Procesador Termohidráulico de Operaciones Nucleares
RPV Reactor Pressure Vessel
SA Severe Accident
SAMGs Severe Accident Guidelines
SAGs Severe Accident Management Guidelines
SCGs Severe Challenge Guidelines
SCST Severe Challenge Status Tree
SD Slow deflagration
SFP Spent Fuel Pool
SG Steam Generator
3D Three dimensional
TMI-2 Three Mile Island 2

xxv
This Page is Intentionally Left
Blank


1
1 State of the Art of Containment Analysis of Design Basis
Accidents
“Please allow me to introduce myself,
I am a man of wealth and taste.”
- Mick Jagger, Sympathy for the devil.

2
CHAPTER CONTENT
1.1 Introduction to the LOCA as the Main Design Basis Accident ...................... 3
1.2 Nuclear Safety; context, origin and development ......................................... 5
1.3 Design Basis Accident Concept ................................................................... 7
1.4 The LOCA as a Design Basis Accident ........................................................ 9
1.5 Containment Safety Evolution.................................................................... 13
Early Legislation ........................................................................................... 13
Containment types for Water Reactors ......................................................... 17
1.5.2.1 Pressurized Water Reactor Containments .................................................................. 17
1.5.2.1.1 Large Dry Containment type ................................................................................................ 19
1.5.2.1.2 Ice Condenser Containment type ........................................................................................ 19
1.5.2.1.3 Sub Atmospheric Containment type .................................................................................... 21
1.5.2.1.4 Pressurized Heavy-Water Reactor Containment type ......................................................... 21
1.5.2.1.5 Konvoi Containment type .................................................................................................... 23
1.5.2.1.6 Advanced Passive Water Reactor Containment type ........................................................... 23
1.5.2.1.7 VVER-1000/V412 (AES-92) Containment type ..................................................................... 25
1.5.2.1.8 EPR Containment type ......................................................................................................... 25
1.5.2.2 Boiling Water Reactor Containments ......................................................................... 27
1.5.2.2.1 Dry Containment type .......................................................................................................... 27
1.5.2.2.2 Mark I Containment type ..................................................................................................... 27
1.5.2.2.3 Mark II Containment type .................................................................................................... 29
1.5.2.2.4 Mark III Containment type ................................................................................................... 31
1.5.2.2.5 ESBWR containment type .................................................................................................... 31
1.6 Numerical models of containments for accident analysis ........................... 32
Containment codes ....................................................................................... 32
1.6.1.1 GASFLOW .................................................................................................................... 32
1.6.1.2 COCOSYS ..................................................................................................................... 32
1.6.1.3 MELCOR ...................................................................................................................... 33
1.6.1.4 MAAP .......................................................................................................................... 33
1.6.1.5 GOTHIC ........................................................................................................................ 33
Modeling Guidelines for containment analysis .............................................. 34
Conclusions on the Lumped Parameters Methodologies............................... 36
1.7 Annex A. ANSI/ANS 56.4-1983 Requirements for Containments Integrity Analysis,
[58]. 38
Analytical Considerations .............................................................................. 38
Thermodynamic Considerations ................................................................... 38
Mass and Energy Release Considerations ................................................... 39
Structural Heat Transfer Considerations ....................................................... 39
Containment Spray Considerations............................................................... 39
Containment Heat Removal Considerations ................................................. 40

Introduction to the LOCA as the Main Design Basis Accident
3
1.1 Introduction to the LOCA as the Main Design Basis Accident
Power. It is not unintentional that the word “power” describes the physics entity energy per unit of
time and human skills like the ability to influence others or a person strength. Mankind need for more
power is insatiable, not surprising as more power has normally lead to social and economic improvement,
evolution and progress. The path of obtaining more power have involved several sources: wood, wind,
water, coal, petrol, gas, nuclear or sunlight.
When the mentioned sources are scrutinized many advantages are found, as well as many
drawbacks. The source that this Thesis focus on is nuclear energy. It is undoubtable that the main
inconvenient of this energy source is that human beings are quite sensible to the main phenomena used
to obtain energy: radiation. Therefore, together with the use of this energy, it was required the born of a
full new science discipline: nuclear safety.
In this chapter nuclear safety is boarded through one of its main characters in the play, the Design
Basis Accident (DBA). Moreover the importance of the most common DBA for Light Water Reactors
(LWR); the Loss Of Coolant Accident (LOCA) for containment safety analysis in the nuclear industry will
be depicted.
Firstly, a short introduction about the first notions of nuclear safety and its evolution will be made,
following by the decision of using accidents to provide a design basis and the main design accident, the
LOCA.
Secondly, the containment safety evolution will be explained; how the containment has adapted to
design requirements made by regulatory bodies and how they have impose a basis for this containment
design. The result of different engineering companies and designers are the different containments
currently built around the world.
Thirdly, the numerical models created to simulate the conditions inside the containment after a
transient will be depicted. These models helped in the design process by providing the theoretical limits
these containments must withstand. Different containment codes will be shown as well as the modeling
guidelines imposed by the regulatory bodies on these numerical models.

State of the Art of Containment Analysis of Design Basis Accidents
4
Figure 1-1. Atomic Energy Commission and its evolution, the Nuclear Regulatory Commission
Figure 1-2. Shipping port Nuclear Power Plant Illustration. http://www.ansnuclearcafe.org/wp-
content/uploads/2014/01/PWRplantWEreprint.jpg

Nuclear Safety; context, origin and development
5
1.2 Nuclear Safety; context, origin and development
As stated before, nuclear safety is a mandatory discipline to master if nuclear energy is developed.
The safety related with nuclear industry have a mayor objective: retain the radioactive products of the
nuclear fission so they are as harmless as feasible. This objective is normally developed by a triple
eyesight:
1. Controlling the radioactive waste that appears in normal operation of a Nuclear Power Plant
(NPP).
2. Ensuring the normal operation of a NPP.
3. Mitigating the consequences of an accident.
This last aspect is unavoidable given that the circumstances and possibilities of an inadequate
cooling of the core exist, and assuring a 100 % core integrity anytime, anywhere, is a fallacy that only
makes nuclear industry less trustable to the public. Nuclear safety actually tries to be as close as “100 %
safe” as possible.
Before a fleet of nuclear power reactors was constructed and introduced into the commercial
market, it was important to develop a strategy in terms of safety. This initiative was developed as the
orders for the reactors started coming into the United States; the regulatory organism that was involved
in the design process at that moment was the Atomic Energy Commission (AEC) (afterwards Nuclear
Regulatory Commission, (NRC), Figure 1-1).
One of the first reports on nuclear safety was the WASH-3 [1]. On this report, an accident was
evaluated for each plant and within that accident there was core damage. Based on meteorological
models and effects, it was recommended an exclusion area based on the reactor thermal power as shown
in eq. (1).
𝑹 = 𝟎. 𝟎𝟏𝟔 ∙ √𝑷 (1)
WASH-3 stipulates that the doses outside the exclusion area should be lower than 3 Sv (close to
the lethal doses for an adult). For a 1000 MWe of a typical plant, the exclusion area would be of 27.8 km
of radius. However, this distance was totally impractical. Facilities that were not military or isolated could
not reach this distance. Therefore, a safety approach called “defense-in-depth” was developed to make
sure that the safety was assured in the design of a Light Water Reactor (LWR) [2]. This approach was
firstly used for Shipping Port NPP, (Figure 1-2) a Pressurized Water Reactor (PWR) built by
Westinghouse, because it could not fulfill the distance requirement.

State of the Art of Containment Analysis of Design Basis Accidents
6
The defense in depth concept was in fact a very old concept used in the Rome Republic and makes
references to the successive defense lines designed to fight the enemy in a front, a fort or in battle, in a
way that if one of the lines was broken, the next one was capable of resist the attack. The defense in
depth basis were the following, exposed in order of importance:
1. Accident Prevention
2. Safety Systems design
3. Containment Use
4. Accident management program development
5. Emergency plans and bidding of place
Applied to nuclear safety, it consist on the creation of several important physical barriers to the
release of the fission products to the environment in addition to safety systems. These barriers were:
The fuel itself acts as a first barrier, because the ceramic porous material that retains the gaseous
Fission Products (FP).
The cladding around the fuel pellets, where the fission products are generated, and they will
remain if there is no damage.
The reactor coolant system, which contains all the fuel elements forming a reactor core that is
made of steel and can withstand high pressure and temperature loads.
The containment, which is supposed to prevent any fission products from escaping to the
environment. This is the final physical barrier, if the containment integrity is compromised, then
the environment could suffer the radiological consequences.
The exclusion area, which is an area forbidden to the public.
The plant have to be in an area of low density of population.
The distance to large amounts of population conglomerates have to be large.
The evacuation plan of the surroundings.
If the integrity of at least one of these physical barriers is maintained in any accident scenario then,
the defense-in-depth approach against the release of radioactivity to the public environment will be
enough to assure the public safety. In practical design aspects, the defense-in-depth approach for safety
design was refined as the following set of preventive measures: provide systems and equipment, which
would prevent such malfunctions, as do occur, from turning into major accidents.

Design Basis Accident Concept
7
1.3 Design Basis Accident Concept
At the time that the first reactors were built in the United States the concept of maximum credible
accident or Design Basis Accident (DBA) was proposed as an equilibrium between the pessimist accident
proposed by WASH-740 [3] and the consideration that the safety systems included in the design were
capable to protect against all accidents. Between the different DBAs, the LOCA, that is not a single
accident but a spectrum of them, was considered the worst [2].
The normative 10 CFR 100 stipulated that under a DBA, the radiation doses outside the exclusion
area should not be higher than 0.25 Sv for full body and 3 Sv for thyroid and with 10 CFR 100, a definition
for DBA was given; a theoretical accident that a nuclear facility have to withstand in such way that due to
this accident, the rule 10 CFR 100 is always satisfied [4].
One of the accidents proposed to shape the design of an NPP is a catastrophic failure of the reactor
vessel. Reactor Pressure Vessels (RPVs) were fabricated based on ASME guidelines and, in principle,
they were able to withstand the catastrophic propagation of cracks, but the embrittlement due the
neutronic flux was starting to be known. In 1964, a catastrophic failure of a heat exchanger occurred. This
accident and the increasing concern of researchers given the growing number of NPP in the USA, lead
to a letter that encourage the research on mitigation strategies of a catastrophic failure of a RPV of a NPP.
In the report WASH-1285 it was concluded that the probability of catastrophic vessel failure was less than
10-6 per year and reactor. Therefore the catastrophic failure of the vessel was not taken into account in
the DBAs [5].
Besides DBAs, there are other accident types and they were considered in the regulation the 10
CFR 51, which appeared in 1971 and it contained safety criteria. Originally, it distinguish between 9 types
of accidents, from trivial happenings, Class 1, to the accidents considered in the evaluation of the design
basis, Class 8. Class 9 was reserved for severe accidents, which goes beyond the design basis, they
include core melting and radioactive emissions that violate the 10 CFR 100 [6].

State of the Art of Containment Analysis of Design Basis Accidents
8
Figure 1-3. Bypass phase after a LOCA [7]

The LOCA as a Design Basis Accident
9
1.4 The LOCA as a Design Basis Accident
The radiological consequences of the LOCA were considered the worst of all credible accidents
and it became the cornerstone of site evaluation for NPPs [2]. Originally, the design basis LOCA consisted
on a primary system pipe rupture, coincident with a Loss Of Outside Power (LOOP) and the use of the
single failure criteria, which in this case considered a failure of one of the diesel generators. This implies
the failure of one (out of two or three) energized trains by AC. The LOCA analysis required a consideration
of a spectrum of break size on different locations, including the Double Ended Guillotine Break (DEGB)
of the cold, intermediate and hot leg. That is, the coolant discharge from such a break is supposed to
occur from both sides of the break. Regarding the DEGB LOCA, this accident was considered the most
credible accident that leaves the fuel in a deficient cooling state for longer time and removes inventory
from the primary system at the greatest rate; therefore, the main focus for safety studies. The DEGB
LOCA was proposed then as a credible accident, but it must be noticed that there has not been a single
catastrophic break in the large pipes of the primary systems in the LWRs installed worldwide so far.
Currently, a safety design basis selected for the LWRs was, and remains, the Large Break Loss of
Coolant Accident (LBLOCA), [8]. Besides the LBLOCA as the enveloping accident, other accident and/or
transient events were specified. In addition, it was required that the specified events are analyzed and
documented for review in Chapter 15 of the Final Safety Analysis Report (FSAR) that each plant owner
has to submit before it can be granted a construction or operating license.
Regarding DEGB LOCA phenomenology, the first phase of the LOCA is the so-called “blowdown”,
where all the water inside the core escapes through the break and results in the uncovering of the reactor
core in a very short time (approximately 30 seconds). When the core is uncovered, the fuel rapidly rises
its temperature so water must be injected in order to avoid core damage. If the injection is not quick
enough to cool down the core, the temperature of the Zircalloy cladding can rise above the threshold
temperature for the exothermic Zircalloy–steam oxidation reaction, which can lead to fuel damage. At the
beginning of the injection, the bypass phase occur. In this phase the water injected does not reach the
core because there the steam coming from the core prevents it to refill the vessel lower head. In this
situation, the water flows directly to the break “bypassing” the core, and not cooling it, see Figure 1-3.
After the bypass phase, the refill phase occurs. In this phase, the water level starts to rise again because
the pressures on the Primary Cooling System (PCS) and the containment atmosphere are the same. The
last phase is the reflood, where all the fuel is again covered in water and the accident theoretically is
controlled in the final phase, long term cooling.
Because the LOCA was approved as a design basis, a robust Emergency Core Cooling System
(ECCS) was designed to assure the correct performance of the system and the adequate core cooling.
One of the main questions that arise was to wonder: what would happen if the

State of the Art of Containment Analysis of Design Basis Accidents
10
Figure 1-4. Wash-1400 extract on deaths per year [9]
Figure 1-5. Problematic issues regarding LOCA phenomena [10]

The LOCA as a Design Basis Accident
11
ECCS does not function adequately? If the ECCS does not function, it was concluded that this could
lead to core meltdown and possible containment failure. If the containment fails after a LOCA, the plant
surroundings will be in great danger. The AEC responded to this uncertainty by requiring improvements
in the new ECCS designs of the vendors, for example, providing greater capacity, redundancy, diversity,
and assurance of electrical supply in addition to passive systems [11].
The interest and worries were attracted to the understanding of the LOCA. The AEC started an
experimental program that built a small-scale thermal-hydraulic loop in order to simulate a large-break
LOCA with ECC injection. The first experimental results obtained were pretty discouraging as they led to
several doubts about the efficacy and performance of the ECCS. With these experiments, the “bypass”
phase of the accident was discovered. They observed that the water did not reach the core as it was
“bypassed”. The analysis models at that point in time had not recognized that the steam generated in the
hot core would not let the low-temperature water enter the core due to countercurrent flooding [12].
The U.S. AEC responded by demanding additional margins in the ECCS calculation models [13].
Quite detailed criteria were issued for the assumptions to be made and the heat transfer correlations to
be used in the models for predicting the plant’s thermal hydraulic behavior during the large LOCA and the
ECCS injection following the large LOCA. A limiting temperature for the Zircaloy cladding of the hot rods
was proposed, which was kept below the temperature at which the exothermic Zircaloy-steam reaction
accelerates. The specification of these criteria did not satisfy the critics, so public hearings on the ECCS
performance in LWRs were organized in January 1972.
A study of LBLOCA and ECCS for LWRs was conducted by a group assembled by the American
Physical Society (APS). This study concluded that there was an insufficient knowledge base to make
reliable quantitative predictions of the plant behavior and consequences in reactor accidents. This group
recommended an intensive research effort for 10 years or more, to acquire sufficient knowledge about
the very complex phenomena that prevail during the large LOCA accident [14]. They emphasized the
development of validated models, which could be used for LOCA with ECCS for prototypic plants. They
also pointed out the need to quantify the margins that may be available in mitigating a large LOCA by the
ECCS.
The LBLOCA and the ECCS research conducted in the United States and other countries was both
comprehensive and expensive, since several large-scale integral-effect and separate-effect test facilities
were built. The largest of these was the Loss Of Fluid Test (LOFT) facility, which employed a nuclear core
that generated 55 MWth. The scaling designed in these facilities was that the ratio of power/primary
system volume was kept equal to the design value of 1000 MWe , typical of a LWR [15].
In addition, new methodologies were being used to calculate the risk of core melting when some
equipment or systems were unavailable. In contrast to the deterministic approach, that assumed that
some part of the ECCS will not work, this methodology tried to calculate the possibility of a component
failure, and then integrate it into a full plant analysis. Also known as the Rasmussen report after the study
director, Professor Norman Rasmussen of MIT; this study used a methodology pioneered by the DOD

State of the Art of Containment Analysis of Design Basis Accidents
12
and NASA, called Probabilistic Risk Assessment (PRA) to predict the effects of individual component
failures on large, complex systems. Some computer analyses plus hand calculation solutions were used,
but no experimental work was carried out. The results were issued as WASH-1400 (NUREG-75/014) [9].
The study concluded that, while the risks of a core melt accident were small, they were more likely than
previously thought, approximately 5·10-5 per reactor year.
Few years after the report was released, the Three Mile Island accident occurred, in 1979 [16]. The
statements of the Rasmussen report were not seriously taken in consideration until the accident
happened. This accident clarified some aspects that were not directly addressed in nuclear safety. One
of them is that an accident theoretically less dangerous than a design basis DEGB LOCA can be as
harmful and provoke core damage. This accident has been the most hazardous provoked by a LOCA to
date.
To the present day, a huge understanding has been acquired, most of the experimental facilities
have been closed but their outcome has made possible the increase in the accuracy of computer codes.
It is believed that the codes such as RELAP5 or TRACE are able to generate reasonable predictions of
the primary system thermal hydraulic behavior of PWRs and Boiling Water Reactors (BWRs) in a LBLOCA
scenario, most of them can reproduce experiments accurately, see [17], [18] or [19] as examples. These
codes provide best-estimate analysis results for the design basis LOCA. The operational transients can
also be analyzed, and these codes have incorporated control systems with their time lags, the secondary
systems of PWRs and the actions on the safety and relief valves. In terms of understanding the core
damage and corium phenomenology, SA codes have been developed and validated through several
experiments as well, such as MELCOR or MAAP [20].

Containment Safety Evolution
13
1.5 Containment Safety Evolution
In this section, it will be described how containments are designed for the large LOCA thermal and
pressure loadings and how their integrity should not be in questioned for the design basis LOCA.
Early Legislation
The first legislation for the design of a NPP containment was given in the Reactor Site Criteria, 10
CFR 100, in 1962. It introduced the concepts of design basis LOCA, and the expected leak rate from the
containment to the environment. After the first calculations, containments were designed to withstand the
peak pressure associated with the reactor coolant system blowdown and maintain its safety function,
limiting the release of radionuclides to the environment at a maximum design leak rate. They were not
designed to withstand the loads associated with a rupture of the vessel or other type of loads such as, at-
that-date not considered, hydrogen deflagrations.
As commented before, in 1966, two questions aroused regarding the assumption of containment
as an independent barrier. The first one was the RPV integrity and the latter was the so-called 'China
syndrome'.
The first issue was into debate because containments were not designed to withstand a
catastrophic rupture of the RPV at high pressure since this was not considered a credible event
(probability less than 10-6, [21]). To the date of writing, only in the Fukushima accident a vessel break has
occurred [22]. Recent studies suggest that after an external flooding it is likehood to provoke a vessel
rupture [23], [24].
The second issue arose when studies suggested that a LOCA could lead to a scenario where the
molten core can break the lower head of the reactor pressure vessel, and then penetrate the concrete
containment basemat, that ultimately will lead to the earth or soil the NPP is placed on. This scenario was
euphemistically referred to as the 'China Syndrome', and it caused a strong public impact, see Figure 1-6.
Until 1965, there were no written criteria for design and review and all commercial power reactor
licenses were a case-by-case basis. In 1965, the AEC issued the first draft of the General Design Criteria,
Appendix A of 10 CFR 50. The final version of Appendix A, (finished in 1971), did not require the
containment to be designed to withstand a full core meltdown. The first five criteria define overall
requirements for quality assurance and protection against natural phenomena, fire, environmental and
dynamic effects (including LOCAs), and sharing of systems, structures and components [25].

State of the Art of Containment Analysis of Design Basis Accidents
14
Figure 1-6. “China Syndrome” reached the popular culture through the movie theaters increasing the unpopularity of
Nuclear Power Plants, March, 1979. By Source, Fair use, https://en.wikipedia.org/w/index.php?curid=7454833
Figure 1-7. Different contaiments design pressure values, free volume and leakage rate, [26]

Containment Safety Evolution
15
Criterion 1, Quality standards and records, requires, in part, that:
"Structures, systems, and components important to safety shall be designed, fabricated,
erected, and tested to quality standards commensurate with the importance of the safety
functions to be performed. Where generally recognized codes and standards are used, they
shall be identified and evaluated to determine their applicability, adequacy, and sufficiency and
shall be supplemented or modified as necessary to assure a quality product in keeping with the
required safety function."
Criterion 16, Containment Design states:
"Reactor containment and associated systems shall be provided to establish an essentially
leak-fight barrier against the uncontrolled release of radioactivity to the environment and to assure
that the containment design conditions important to safety are not exceeded for as long as
postulated accident conditions require."
Finally criteria 50 through 57 give specific requirements for reactor containment. These criteria
address the containment design basis, testing and inspection requirements and containment isolation
requirements.
Figure 1-7 shows the typical maximum leakage for each type of containment. Leakage is described
in this picture in terms of a percentage of the total containment atmosphere mass that has leaked over 24
hours. It can be observed clearly that in PWRs, the higher the containment volume, the lower the leakage
rate. The general design had to implement, in part, 10 CFR 50, Appendix A, General Design Criteria 16
which states "an essentially leak-tight barrier against the uncontrolled release of radioactivity to the
environment..." for the postulated design basis accidents. The design loads and their combinations as
well as the response limits are specified in NRC Reg. Guide 1.57 (for steel containments).
There are other types of loads that must be considered in the design. These loads include:
1. Temperature transients and gradients
2. Earthquake loads
3. Internal and external missiles
4. Mechanical loads from pipe rupture
5. External pressures
6. Winds and tornadoes.
All those loads must be taken into account, and the result will be the basis for the containment
design. It is remarkable that nowadays specifications for Gen III and III+ reactors are more restrictive and
have to withstand a F-4 Phantom collision (Figure 1-9), see [27,28]; even though the main basis is still
the LOCA [29]. Concluding, in the design process of the containment, the pressure and temperature after
a design basis LOCA is analytically calculated with a preliminary containment volume, the leakage is
calculated afterwards and if it is beyond the limits, a measure has to be taken, like increasing the
containment free volume or increasing the design pressure.

State of the Art of Containment Analysis of Design Basis Accidents
16
Figure 1-8. Footage of 1988 rocket-sled test, F-4 Phantom, SANDIA National Laboratories, [30]
Figure 1-9. Footage of 1988 rocket-sled test, F-4 Phantom, SANDIA National Laboratories, [30]

Containment Safety Evolution
17
Containment types for Water Reactors
Containment shapes and types have evolved in many different ways to meet the safety standards
with reasonable economics around the world; there are lots of containment types built among the different
countries. Consequently, the discussion that follows will be limited to the most common types. The
different containment types of current reactors will be described below with principal features that are
interesting for this chapter.
1.5.2.1 Pressurized Water Reactor Containments
PWRs have several types of containments taking into account the main designs. All these
containments have internal concrete structures and equipment or systems. The most important systems
common to all designs and are:
The heat removal system that prevents the containment from over pressurization. Such systems
are either independent spray systems, fan coolers or combined spray systems and an ECCS or
only a highly redundant ECCS (avoiding long-term steam formation after refill of the reactor
pressure vessel).
The control system that continuously monitors the reactor building containment atmosphere and
automatically closes the dampers and valves provided for automatic isolation of the containment.
The ventilation systems and filters that maintain the pressure inside the containment below the
surrounding atmosphere pressure and treat the ventilated gas to minimize the release of any
material.
The system that deals with hydrogen produced during a SA. The hydrogen-treating systems, when
operating, can mix the combustible gas within the containment (e.g., spray, fan coolers) and can
reduce the concentration of combustible gas using various mitigation measures, as discussed
below. Some additional systems have been set up in case of an accident that exceeds a DBA, in
particular:
1. Venting systems that prevent late over pressurization failure.
2. Igniters and/or recombiners that can reduce the hydrogen concentration.

State of the Art of Containment Analysis of Design Basis Accidents
18
Figure 1-10. Large Dry PWR Containment
Figure 1-11. Ice condenser PWR containment, [31]
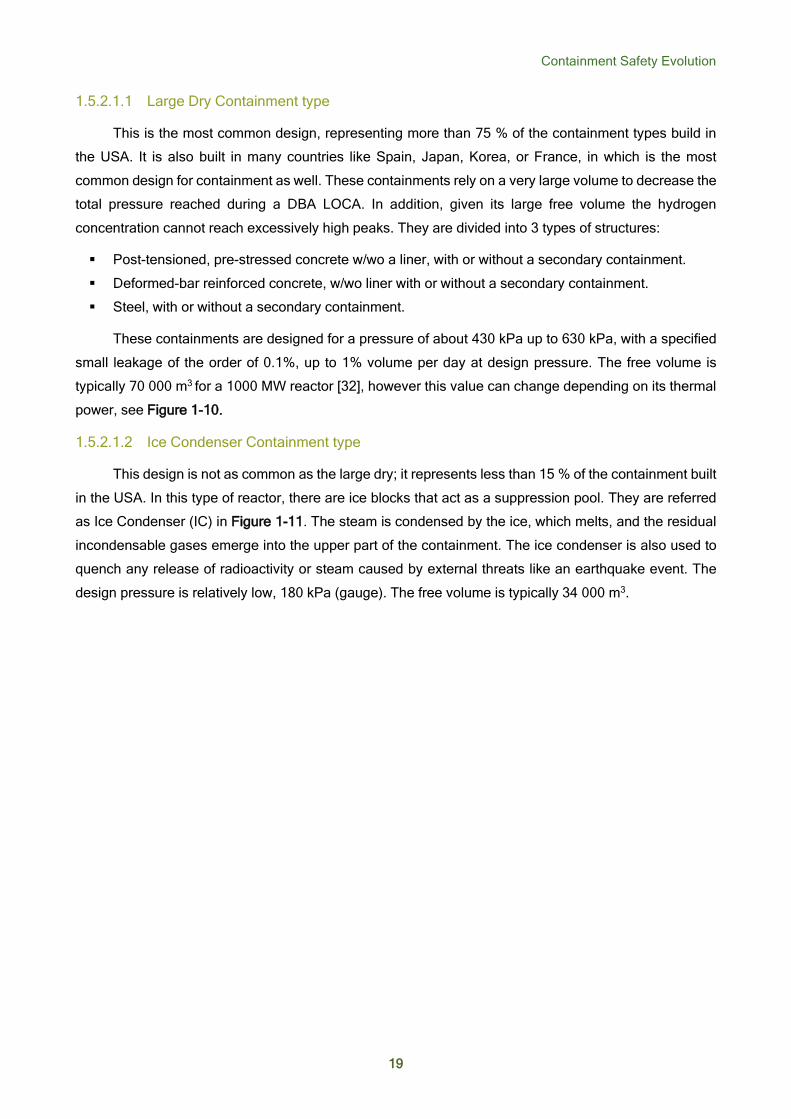
Containment Safety Evolution
19
1.5.2.1.1 Large Dry Containment type
This is the most common design, representing more than 75 % of the containment types build in
the USA. It is also built in many countries like Spain, Japan, Korea, or France, in which is the most
common design for containment as well. These containments rely on a very large volume to decrease the
total pressure reached during a DBA LOCA. In addition, given its large free volume the hydrogen
concentration cannot reach excessively high peaks. They are divided into 3 types of structures:
Post-tensioned, pre-stressed concrete w/wo a liner, with or without a secondary containment.
Deformed-bar reinforced concrete, w/wo liner with or without a secondary containment.
Steel, with or without a secondary containment.
These containments are designed for a pressure of about 430 kPa up to 630 kPa, with a specified
small leakage of the order of 0.1%, up to 1% volume per day at design pressure. The free volume is
typically 70 000 m3 for a 1000 MW reactor [32], however this value can change depending on its thermal
power, see Figure 1-10.
1.5.2.1.2 Ice Condenser Containment type
This design is not as common as the large dry; it represents less than 15 % of the containment built
in the USA. In this type of reactor, there are ice blocks that act as a suppression pool. They are referred
as Ice Condenser (IC) in Figure 1-11. The steam is condensed by the ice, which melts, and the residual
incondensable gases emerge into the upper part of the containment. The ice condenser is also used to
quench any release of radioactivity or steam caused by external threats like an earthquake event. The
design pressure is relatively low, 180 kPa (gauge). The free volume is typically 34 000 m3.

State of the Art of Containment Analysis of Design Basis Accidents
20
Figure 1-12. Sub Atmospheric PWR Containment, [32]
Figure 1-13. CANDU PHWR Containment

Containment Safety Evolution
21
1.5.2.1.3 Sub Atmospheric Containment type
Another containment type is the sub-atmospheric containment. These containments are not very
common as well; they only represent the 8 % of the containment types. Sub atmospheric containments
are a minor variation of the large dry type. In these versions the internal atmosphere of the containemnte
is kept largely under the atmosphere standard value to neglect any kind of leak from the contianment to
the outside. If there is any leakage in the containmient structure it will suck air from the outside instead of
expelling material. It is worth saying that all large dry containments are keept slightly under the
atmospheric pressure, but in this case the depression is significant, see Figure 1-12 .
1.5.2.1.4 Pressurized Heavy-Water Reactor Containment type
This containment type is basically built in Canada, where heavy water reactors, Canada Deuterium
Uranium, (CANDU) are built. The Pressurized Heavy-Water Reactor (PHWR) concept is basically a large
dry containment combined with a large-capacity dousing system to reduce the maximum pressure during
and after a LOCA. In addition CANDU containments placed in locations where more than one unit is built
have a system that consist on a large cylindrical vacuum building where steam is transported and later
condensed in the event of a major leak. The design pressure is 140 kPa (gauge pressure). The free
volume is typically 48 000 m3, see Figure 1-13.
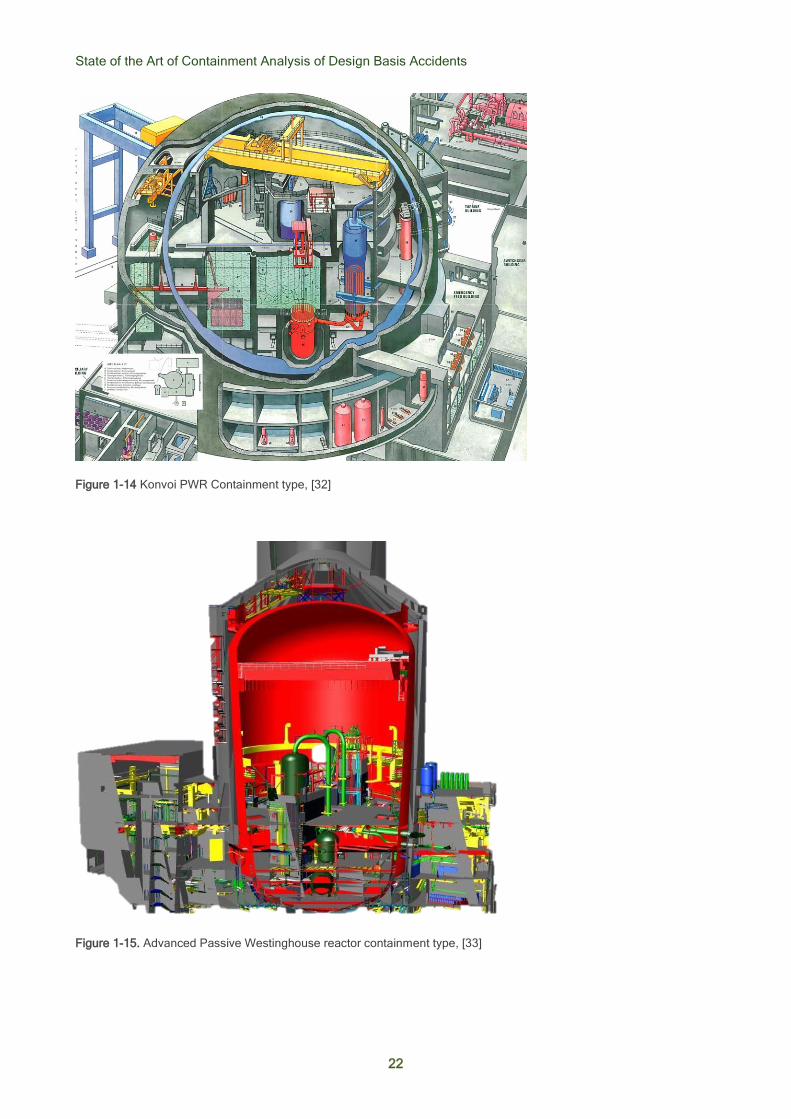
State of the Art of Containment Analysis of Design Basis Accidents
22
Figure 1-14 Konvoi PWR Containment type, [32]
Figure 1-15. Advanced Passive Westinghouse reactor containment type, [33]

Containment Safety Evolution
23
1.5.2.1.5 Konvoi Containment type
This containment type has been designed by the German firm Siemens-KWU and this type of
reactors have been basically built in Europe. This containment is no longer a cylinder but a sphere
because a sphere is able to withstand a higher internal pressure than a cylinder, see Figure 1-14. The
internal sphere is made of steel and it is considered the main containment. This sphere is covered with a
concrete envelope, but this structure is not designed to be airtight. These design is very similar to the
large dry type with the exception of the spray system, which is inexistent in the Konvoi type. The typical
free volume of a Konvoi containment is 60000 m3.
1.5.2.1.6 Advanced Passive Water Reactor Containment type
The first type of this containment was originally designed for the AP600 Westinghouse in the 90s,
but this concept is used nowadays by the AP1000 reactor and Chinese designs like the CAP 1400. In this
design, the containment systems have an important role in an accident management. The containment is
a steel cylinder surrounded by a containment building, see Figure 1-15. The containment walls act as a
heat sink during a DBA. The water condensed in this walls is lately driven to the Internal Refueling Water
Storage Tank (IRWST) or the containment sump. The IRWST can act as a heat sink and as sump and/or
a water repository for the ECCS. The containment shield building is designed to create an air flow
surrounding the outside of the metallic liner. If necessary, there is a Passive Containment Cooling System
(PCCS) tank that can inject water to the outside of the metallic liner making the heat transfer more
efficient.

State of the Art of Containment Analysis of Design Basis Accidents
24
Figure 1-16. AES-92 reactor containment type, [34]
Figure 1-17. EPR reactor containment type, [35]

Containment Safety Evolution
25
1.5.2.1.7 VVER-1000/V412 (AES-92) Containment type
This containment type has been designed by ROSATOM and it is mainly planned to build in Russia
and other countries. The AES-92 containment type is the last step in the VVER design evolution. The
containment design consist of a metallic liner, with an inner wall of pre-stressed concrete and an outer
wall reinforced concrete. The annulus is designed to capture any leakage from the inner wall and guide it
to a passive filter system. The passive heat removal system from the Steam Generators (SGs) is a system
that acts as a heat exchanger between the steam from the SGs and the atmosphere air, see Figure 1-16.
This containment has an active spray system with 4 trains.
1.5.2.1.8 EPR Containment type
This containment type has been designed by AREVA, it was originally planned to build in Europe,
but nowadays, many countries are interested. The EPR reactor building consists of a cylindrical reinforced
concrete outer shield building, a cylindrical pre-stressed concrete inner containment building with a steel
liner, and an annular space between the two buildings. This is it has a double-wall containment concept
with a leak-tight steel liner, (1) and (2) in Figure 1-17.
The shield building protects the containment building from external hazards. The reactor shield
building functions as a secondary containment to prevent the uncontrolled release of radioactivity to the
environment following a postulated DBA. The reactor shield building and annulus ventilation system are
designed to provide the secondary containment function under the environmental conditions of normal
operation, maintenance, testing, and postulated accidents, including protection against the dynamic
effects associated with a design basis accident. The AVS maintains the annulus at a sub-atmospheric
pressure during normal operations and following postulated design basis accidents, establishing an
essentially leak-tight barrier against uncontrolled release of radioactivity to the environment. The reactor
building houses the reactor coolant system, whose main components are the reactor vessel (3), the steam
generators (4), the pressurizer (5) and the reactor coolant pumps (6). Inside the containment building, a
specially-designed corium spreading area (7) is located. In the event of core meltdown, this is where any
molten core escaping from the reactor vessel would be collected, retained and cooled.

State of the Art of Containment Analysis of Design Basis Accidents
26
Figure 1-18 BWR dry containment type, [36]
Figure 1-19 Mark I containment type, [37]

Containment Safety Evolution
27
1.5.2.2 Boiling Water Reactor Containments
During the evolution of the boiling water reactors, three major types of containments were built. The
major containment designs are the Mark I, Mark II, and the Mark III. Unlike the Mark III that consists of a
primary containment and a drywell, the Mark I and Mark II designs consist of a drywell and a wet well
(suppression pool). All three containment designs use the principle of pressure suppression for LOCAs.
The primary containment is designed to condense steam and to contain fission products released from a
loss of coolant accident so that offsite radiation doses specified in 10 CFR 100 are not exceeded and to
provide a heat sink and water source for certain safety related equipment.
BWRs have normally containments that can differ slightly but are based on the same safety
standards than those of PWR. The volume of its containments is normally smaller than a PWR.
The following are particular features of the BWR containment concept:
Wet-well: which is a large capacity suppression pool situated inside the primary containment
structure. Above this pool is a leak-tight gas space.
Dry-well: which is a pressure-retaining structure surrounding the reactor coolant system.
Vent system that connects the dry well gas space to the wet well below the suppression pool
surface.
Most small-volume BWR containments are inerted during operation with nitrogen or other inert gas.
Some Mark III BWR containments are equipped with igniters above the water pool, inside the wet well, to
deal with hydrogen risk.
1.5.2.2.1 Dry Containment type
The dry containment type was the first containment type for commercial BWRs. This was the
containment of the Vallecitos NPP. The Vallecitos Boiling Water Reactor (VBWR), Figure 1-18 was the
first privately owned and operated nuclear power plant to deliver significant quantities of electricity to a
public utility grid. The reactor in its pressure vessel is housed in a gas-tight enclosure: a steel cylinder
with hemispherical ends.
1.5.2.2.2 Mark I Containment type
The BWR containment structures in the USA are predominantly Mark I steel designs. General
Electric (GE) began making the Mark I, light bulb BWR containment system back in the 60s. This concept
incorporates a reactor building, which surrounds the primary containment (drywell and suppression pool)
and houses the spent fuel pool and emergency core cooling systems. The suppression pool has a torus
shape that surrounds the dry well, see Figure 1-19. Steam from the vessel can be condensed in this pool
in order to reduce the pressure.

State of the Art of Containment Analysis of Design Basis Accidents
28
Figure 1-20 Mark II containment type, [37]

Containment Safety Evolution
29
1.5.2.2.3 Mark II Containment type
The Mark II primary containment consists of a steel dome head and either a post-tensioned
concrete wall or reinforced concrete wall standing on a base mat of reinforced concrete. The inner surface
of the containment is lined with a steel plate that acts as a leak-tight barrier. The containment wall also
serves as a support for the floor slabs of the reactor building (secondary containment) and the refueling
pools. The drywell, in the form of a frustum of a cone or a truncated cone, is located directly above the
suppression pool. The suppression chamber is cylindrical and separated from the drywell by a reinforced
concrete slab, Figure 1-20. The drywell is topped by an elliptical steel dome called a drywell head. The
drywell inerted atmosphere is vented into the suppression chamber through a series of down comer pipes
penetrating and supported by the drywell floor.

State of the Art of Containment Analysis of Design Basis Accidents
30
Figure 1-21. Mark III containment type, [37]
Figure 1-22. ESBWR containment type, [38]

Containment Safety Evolution
31
1.5.2.2.4 Mark III Containment type
For the Mark III containment, the drywell is a cylindrical, reinforced concrete structure with a
removable head, see Figure 1-21. The drywell is designed to withstand and confine steam generated
during a pipe rupture inside the containment and to channel the released steam into the suppression pool
via the weir wall and the horizontal vents. The suppression pool contains a large volume of water for
rapidly condensing steam directed to it. A leak tight, cylindrical, steel containment vessel surround the
drywell and the suppression pool to prevent gaseous and particulate fission products from escaping to
the environment following a pipe break inside containment.
1.5.2.2.5 ESBWR containment type
The Economic Simplified Boiling Water Reactor (ESBWR) is the final evolution of the GE BWR
concept. It is considered the reactor with the lowest core damage frequency of all Gen III or III+ reactors.
The ESBWR containment is a low-leakage reinforced concrete structure with an internal steel liner in the
drywell and suppression chamber to serve as a leak-tight barrier. The containment consist of a cylindrical
shell structure with a hemispherical dome, which consists of the RPV pedestal, the containment cylindrical
wall, the top slab, the suppression pool slab, and the foundation mat. The top slab of the containment is
an integral part of the Isolation Condenser/Passive Containment Cooling (IC/PCC) pools and the services
pools for storage of Dryer/Separator and other uses. The containment and the structures integrated with
the containment are constructed of cast-in-place, reinforced concrete. The containment structure has the
capability to maintain its functional integrity during and following the peak transient pressures and
temperatures which would occur following any postulated DBA LOCA. The containment passive systems
develop an essential role during an accident. The Gravity Driven Cooling System Pool (GDCS) can inject
water into the core relying on passive systems. The Passive Containment Cooling System Heat
Exchangers (PCCS HX) can condensate the hot steam from the dry well and inject it into the GDCS Pool,
see Figure 1-22.

State of the Art of Containment Analysis of Design Basis Accidents
32
1.6 Numerical models of containments for accident analysis
Calculations for the containment response under an accident have been always necessary to
analyze the accomplishment with the safety limits. To assess those limits, several codes have been
developed as a computational aid in theses analyses. In this section a short depiction of the codes used
and the methodology required for containment safety analysis will be made. For containment analysis the
Lumped Parameters (LP) approach is used.
Containment codes
In this section the main codes available for containment analysis will be shortly depicted. There are
more codes capable of doing containment analysis, but this section will focus on the most used in
OECD/NEA countries [39].
1.6.1.1 GASFLOW
GASFLOW was developed by Karlrshue Institute of Technology (KIT) in Germany. It is a
Computational Fluid Dynamics (CFD) code that can model the gas distribution and mixing processes in
geometrically complex facilities with multiple compartments and internal structures in a multi-block
computational domain connected by one-dimensional flow paths. It can simulate the effects of two-phase
flow dynamics with the Homogeneous Equilibrium model (HEM), two-phase heat transfer to walls and
internal structures, chemical kinetics, catalytic recombiners, and fluid turbulence. The code can model
two phase effects of condensation and/or vaporization in the fluid mixture regions within the assumptions
of the homogeneous equilibrium model; two-phase heat transfer to and from walls and internal structures
by convection and mass diffusion; chemical kinetics of hydrogen combustion with a generalized igniter
model; effects of catalytic recombination; fluid turbulence; and transport, deposition, and entrainment of
discrete particles. Heat conduction within walls and structures is one dimensional. The strongest point of
GASFLOW code is that the models were fully verified and validated against theoretical solutions and
experimental data, especially nuclear containment models [40].
1.6.1.2 COCOSYS
COCOSYS was developed by GRS in Germany. COCOSYS is a LP code system on the basis of
mechanistic models for the comprehensive simulation of all relevant processes and plant states during
design basis and SAs in the containments of LWRs. In COCOSYS, mechanistic models are used as far
as possible for analyzing the physical and chemical processes in containments. Essential interactions
between the individual processes, like e.g. between thermal hydraulics, hydrogen combustion as well as
fission product and aerosol behavior, are treated in a comprehensive way. With such a detailed approach,
COCOSYS is not restricted to relevant severe accident phenomena, but will also be able to demonstrate
interactions between these phenomena as well as the overall behavior of the containment, [41].

Numerical models of containments for accident analysis
33
1.6.1.3 MELCOR
MELCOR will be fully explained in Section 4.3, “The MELCOR Code”, but a small depiction will be
made to provide certain continuity in this chapter. MELCOR was developed by SANDIA National
Laboratories in the United States of America [42] under the USNRC sponsorship. MELCOR is a SA code,
as it can simulate all the phenomena that occur during a SA in water-cooled nuclear reactors, from the
initiating event to the possible release of radioactive products (the source term) outside the containment.
MELCOR uses a one dimensional model for transport process. MELCOR has reached a reasonably high
level of maturity over the years as evidenced from its wide acceptability and its broad range of applications
in regulatory decision support [43]. Nevertheless, it is important to recognize the phenomenological
uncertainties in MELCOR and their significance to MELCOR results. Moreover, it is important to
understand the compounding effect of various uncertainties on the ultimate parameter of interest (e.g.
source term) for all practical purposes, [42].
1.6.1.4 MAAP
MAAP was developed by Fauske & Associates LLC (FAI), in the United States of America as part
of the Industry Degraded Core Rulemaking (IDCOR) program. Nowadays FAI has developed and
maintained the code under the sponsorship of the Electric Power Research Institute (EPRI) and the MAAP
Users Group (MUG). It quantitatively predicts the evolution of a severe core damage accident starting
from full power conditions given a set of system faults and initiating events through events such as core
melt, primary system failure, vessel failure, shield tank/reactor vault failure, and containment failure.
MAAP is an integral system analysis code for assessing SAs including small break LOCA, large break
LOCA, LOCA/LOECI, and loss of heat sink in LWR and CANDU nuclear power plants. It is also capable
of modelling steam generator tube ruptures, main steam line breaks and anticipated transient without
scram initiating events [44].
1.6.1.5 GOTHIC
GOTHIC will be fully explained in Section 4.2 “The GOTHIC Code”, but a small depiction will be
made to provide certain continuity in this chapter. GOTHIC (Generator of Thermal Hydraulic Information
in Containments) is an integrated, general purpose thermal–hydraulics software package for design,
licensing, safety and operating analysis of nuclear power plant containments, confinement buildings and
system components. GOTHIC was developed by NAI in 1989, with financial support of EPRI in the United
States of America. GOTHIC can solve the conservation equations for mass, momentum and energy for
multi-component, multi-phase flow for three fields: gas mixture, continuous liquid and droplets. A finite
volume method is used, and cell volume and surface porosities are used to model complex geometries.
It also includes full treatment of the momentum transport terms in multi-dimensional models, with optional
models for turbulent shear and turbulent mass and energy diffusion. In contrast to standard CFD codes,
GOTHIC does not have a body-fitted mesh capability.

State of the Art of Containment Analysis of Design Basis Accidents
34
GOTHIC uses empirical 1D correlations for the heat transfer between the fluid and the structures
rather than attempting to model the convection specifically. The subdivision of a volume into a multi-
dimensional grid is done in orthogonal coordinates exclusively. The three dimensional (3D) capabilities
of GOTHIC in simulating basic flows, and in detail, hydrogen flows for containment analysis have been
investigated extensively, simulating test in facilities like PANDA, CSTF, BFMC or CVTR [45]. A large
validation effort against light gas experiments has been made by Dr. Andreani and Dr. Paladino at PSI
[46–49].
Modeling Guidelines for containment analysis
In this section, the general approach for containment modeling will be introduced. The methodology
exposed will belong to the GOTHIC code exclusively, but given that most of the requirements are made
by ASME and the CFR, the following regulation are general requirements for modeling a design basis
LOCA not depending on the code used.
The following considerations have been obtained from several studies [50–54] that will be
mentioned through this section.
In 1993, Duke Power Company (DPC), submitted for review and approval the document DPC-NE-
3003-P (Revision 0), “Mass and Energy Release and Containment Response Methodology”, [55]. The
containment analysis with GOTHIC was part of the calculations to support the replacement of the SGs at
Oconee Nuclear Station, Units 1, 2, and 3. The report describes methods of calculating the response of
the Oconee Nuclear Station reactor building, using the FATHOMS code (GOTHIC's name before the
EPRI project inception in 1989), to a postulated design basis LOCA and a postulated design basis Main
Steam Line Break (MSLB) accident. The staff issued a March 15, 1995, safety evaluation approving this
report for containment licensing calculations for the Oconee Nuclear Station.
In September 9, 1994 Duke Power Company (DPC) submitted the subject topical report DPC-NE-
3004-P (Revision 0) “Mass and Energy Release and Containment Response Methodology” for review.
The methodology described in the report was used in support of the replacement of the original preheater-
type Westinghouse SGs with feeding-type Babcock and Wilcox (B&W) SGs. The report describes the
DPC methodology for simulating the mass and energy release from high energy line breaks in
containment and the resulting long-term containment response for the Catawba and McGuire Nuclear
Stations using GOTHIC 4.0. In September 6, 1995, the NRC concluded that the DPC-NE-3004-P
analytical methodology was acceptable for use in predicting Catawba and McGuire containment pressure
and temperature responses to design basis accidents.
In May 20, 1999, Duke Energy Corporation (DEC) submitted for review the Report DPC-NE-3004,
"Mass and Energy Release and Containment Response Methodology," Revision 0. The NRC staff
reviewed the information provided by DEC and found that the revision proposed by the licensee was
acceptable.

Numerical models of containments for accident analysis
35
In 2001, Westinghouse developed a containment evaluation methodology with the GOTHIC 5.0
code for the Kewaunee Nuclear Power Plant in support of the replacement of the SGs. This methodology,
approved by the Wisconsin Public Service (WPS), was described in a document titled "Development and
Qualification of a GOTHIC Containment Model for the Kewaunee Nuclear Power Plant" [54]. This
methodology was approved by the NRC [56] in 2003.
In June 13, 2002, a letter from Duke Energy Corporation requested review and approval of a new
revision of the same analysis DPC-NE-3003-P (Revision 1). Revision 1 incorporates changes to the
methods described in the original topical report. It includes a description of GOTHIC 7.0 code to perform
containment thermal hydraulic calculations as well as the FATHOMS code. In the Rev. 1 Duke also
proposed the use of RETRAN-3Ds for MSLB mass and energy source term calculations instead of
RETRAN-024.
In April 2004, Nuclear Management Company (NMC) approved a plan to develop a containment
evaluation model for Prairie Island Nuclear Generating Plants, with GOTHIC 7.1, to replace the older
CONTEMP model used to perform the containment peak pressure and temperature analysis, equipment
qualification analysis and peak liner temperature calculations. As a novelty, both the Kewaunee and
Prairie Island containment evaluation models use the diffusion layer model (DLM) heat and mass transfer
option in GOTHIC.
In July 2004, Framatome ANP (FANP) developed a methodology [50], approved in August 2005,
to predict the maximum containment pressure and temperature response to a spectrum of high energy
line breaks using the GOTHIC 7.1 computer code. These methods were applicable for any large dry
containment for a pressurized water reactor (PWR) with either once-through SGs (OTSGs) or standard
SGs.
In August 2006, Westinghouse submit a topical report to the NRC [51], which described a
methodology for performing design basis containment analysis with GOTHIC 7.2a and a proposed new
methodology for generating LOCA Mass & Energy (M&E) input data for the containment response [57].
Once the methodology was approved, Westinghouse used it for the following applications:
PWR and BWR Containment Design Analysis for Peak Pressure
PWR and BWR Containment Design Analysis for Peak Temperature
PWR and BWR Containment Design Analysis for Peak Liner Temperature
PWR and BWR Minimum ECCS Containment Backpressure Analysis
PWR Containment Analysis for Peak Sump Temperature
BWR Containment Analysis for Peak Suppression Pool Temperature
PWR and BWR Containment Analysis for Thermal Hydraulic Input to ECCS Pump Net Positive
Suction Head (NPSHa) Analysis
BWR Containment Analysis for Thermal Hydraulic Input to Hydrodynamic Load Analysis
PWR and BWR Containment Analysis for Thermal Hydraulic Input to Equipment Qualification
Analysis

State of the Art of Containment Analysis of Design Basis Accidents
36
Later on, in September 2006, Dominion presented a methodology [52] using GOTHIC 7.2 code to
replace the evaluation methods in the updated final safety analysis report (UFSARs) for Surry, North
Anna, and Millstone Units 2 and 3 for the following containment design requirements:
LOCA containment peak pressure and temperature
MSLB containment peak pressure and temperature
LOCA containment depressurization time (CDT) for Surry and North Anna
LOCA containment sub-atmospheric peak pressure (SPP) for Surry and North Anna
Available NPSHa for pumps
Minimum and maximum sup water level and liquid temperature for input to other analysis
Containment liner temperature verification
Equipment Qualification (EQ) temperature validation
Transient performance of closed cooling loops for heat exchangers associated with the ECCS and
containment heat removal systems
This historical compendium of containment analysis with the GOTHIC code does not meant to be
complete, as the only references available were the public ones. However, it demonstrates the
acceptability of the NRC to a range of containment licensing applications with the GOTHIC code.
All these methodologies follow the guidance of the American National Standard ANSI/ANS 56.4-
1983 [58], which containment integrity analysis requirements are summarized in Annex A.
With all those considerations, the methodologies seen provide an adequate framework for DBA
containment analysis. It is however remarkable that this methodologies include several assumptions that
will be listed below and that are so important they have they own section:
Conclusions on the Lumped Parameters Methodologies
In this section, some conclusions observed during the literature research will be shown. This
conclusions are based on facts, capabilities and assumptions of the LP approach, and they will be
categorized as conservative, non-conservative or undefined. The following assumptions can be seen in
the methodologies referred:
The mass and energy from the break will be assumed to go directly to the containment
atmosphere region. This may be not conservative because if the break occur close to a room, it
will not spread instantly and homogeneously in the full containment and the room equipment will
have severe conditions than the rest of the containment rooms.
Free convection, condensation and (where appropriate) radiation heat transfer will be addressed
at the heat sink surfaces. Forced convection cannot be defended in a 0-D model. Neglecting
forced convection is supposed to be conservative to and assume only natural convection; but
authors like Corradini [59], have demonstrated that some cases of natural convection produce a
higher heat transfer than forced convection

Numerical models of containments for accident analysis
37
The sprays must be created, and the water temperature of the sump is considered the
temperature in thermal equilibrium with the containment. This is not conservative, because in a
3-D model is possible to have saturated water at the sump, and the rest of the water to be sub-
cooled
Unevaporated spray water is assumed to go to the sump region at thermal equilibrium with the
containment atmosphere. This is clearly not conservative, because is possible to have stagnant
water that doesn't go to the sumps
The water that condensates goes directly to the sump. This is not conservative, as it provides the
sump with an unlimited amount of water. There are maybe zones where the water is stagnant and
it does not reach the sump
The residence of the sprays in the containment atmosphere may be assumed to be zero. There
is discussion if is this conservative, because on the one hand, the non-zero residence time will
make the water to cool the containment atmosphere, but on the other hand, if it evaporates, it will
increase containment pressure
As a final conclusion to the section and seeing all this assumptions, it can be stated that a
containment 3D model can improve the accuracy and the safety limit of the simulation because it does
not apply hypothesis that are doubtedly conservative:
The mass and energy release will go to the cell of the model that represents the break. Then this
mass and energy release is transported through the rest of the containment cells by advection
and diffusion. The pressure is transmitted at sonic speed, but the temperature transport is a slower
process
Forced convection can be easily addressed by correlations with the containment walls and
equipment. All computational cells have a value of velocity on their faces
The spray is released in the upper part of the containment, and all the cells affected by the spray
doesn’t have to have the same liquid temperature. Each cell will have a different liquid
temperature
With a 3D model it is possible to create stagnation of water in specific places.
The water that condensates will have to find its path to the sumps, it will not be instantly and
maybe not easy at all
The residence time of the spray will not be zero. The spray can evaporate, increasing pressure or
it can make the steam to condense, increasing containment temperature

State of the Art of Containment Analysis of Design Basis Accidents
38
1.7 Annex A. ANSI/ANS 56.4-1983 Requirements for Containments Integrity Analysis, [58].
Analytical Considerations
The analysis shall include a spectrum of accident sequences, break sizes, power levels in the
reactor coolant system and secondary system to ensure the accident yielding the maximum or minimum
pressure and temperature is identified. Each analysis will be carried out to a sufficient duration to ensure
that the maximum pressure and temperature has been ascertained.
For dry and Water Pressure Suppression (WPS) containments, the bounding LOCA peak pressure
case will be carried out to ascertain that the pressure is reduced below 50% of the peak calculated
pressure within 24 hours and maintained below this pressure for the duration of the accident.
For sub-atmospheric containments, the analysis will be carried out to show that the containment
pressure is reduced below one atmosphere within one hour and maintained below one atmosphere for
the remainder of the accident. The analysis will incorporate the effects of the most severe single failure.
The single failure chosen will be consistent with the single failure chosen for the generation of the mass
and energy release data.
The loss of all non-emergency electric power to the plant shall be postulated concurrent with the
LOCA pipe break. Continued availability of offsite power is typically limiting for MSLB analysis. Initial
conditions will be chosen to yield a conservative result.
Thermodynamic Considerations
The dry containment may be modeled with one control volume, which must be capable of distinctly
modeling the containment vapor region and the containment liquid water region
The WPS containment shall be developed to track the thermodynamic response in the drywell and
wet-well regions. The volume of the containment will be estimated conservatively for the analysis. The
control volume modeling will be based on a conservation of mass and energy. The containment
atmosphere steam and non-condensable components in the vapor region shall be well-mixed and in
thermal equilibrium with each other. Drops may be modeled if the treatment of their thermodynamic and
mechanical behavior is justified. Non-condensable components are treated as ideal gases. The steam
component is treated with steam tables or equations that result in the temperatures and partial pressures
within one percent of the steam tables.
The containment sump or wet-well is in pressure equilibrium with the atmosphere. The containment
sump or wet-well temperature is determined from steam tables or suitable equations to determine the
thermodynamic state conditions of the water. Mass and energy transfer across the sump/atmosphere
interface need not be modeled unless the sump becomes saturated at the containment pressure and
begins to boil. For WPS containments, the drywell to wet-well vents shall be included in the analysis the
vent model phases are a vent clearing phase and a vent flow phase. During the vent clearing phase, the
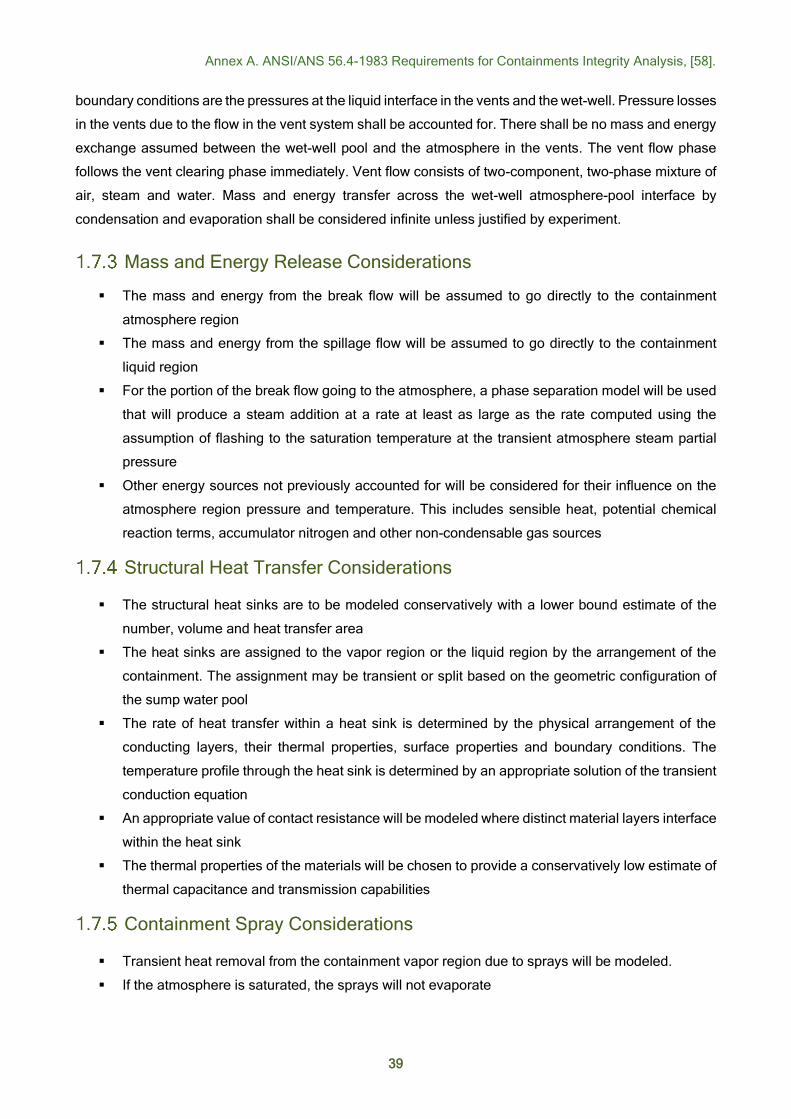
Annex A. ANSI/ANS 56.4-1983 Requirements for Containments Integrity Analysis, [58].
39
boundary conditions are the pressures at the liquid interface in the vents and the wet-well. Pressure losses
in the vents due to the flow in the vent system shall be accounted for. There shall be no mass and energy
exchange assumed between the wet-well pool and the atmosphere in the vents. The vent flow phase
follows the vent clearing phase immediately. Vent flow consists of two-component, two-phase mixture of
air, steam and water. Mass and energy transfer across the wet-well atmosphere-pool interface by
condensation and evaporation shall be considered infinite unless justified by experiment.
Mass and Energy Release Considerations
The mass and energy from the break flow will be assumed to go directly to the containment
atmosphere region
The mass and energy from the spillage flow will be assumed to go directly to the containment
liquid region
For the portion of the break flow going to the atmosphere, a phase separation model will be used
that will produce a steam addition at a rate at least as large as the rate computed using the
assumption of flashing to the saturation temperature at the transient atmosphere steam partial
pressure
Other energy sources not previously accounted for will be considered for their influence on the
atmosphere region pressure and temperature. This includes sensible heat, potential chemical
reaction terms, accumulator nitrogen and other non-condensable gas sources
Structural Heat Transfer Considerations
The structural heat sinks are to be modeled conservatively with a lower bound estimate of the
number, volume and heat transfer area
The heat sinks are assigned to the vapor region or the liquid region by the arrangement of the
containment. The assignment may be transient or split based on the geometric configuration of
the sump water pool
The rate of heat transfer within a heat sink is determined by the physical arrangement of the
conducting layers, their thermal properties, surface properties and boundary conditions. The
temperature profile through the heat sink is determined by an appropriate solution of the transient
conduction equation
An appropriate value of contact resistance will be modeled where distinct material layers interface
within the heat sink
The thermal properties of the materials will be chosen to provide a conservatively low estimate of
thermal capacitance and transmission capabilities
Containment Spray Considerations
Transient heat removal from the containment vapor region due to sprays will be modeled.
If the atmosphere is saturated, the sprays will not evaporate

State of the Art of Containment Analysis of Design Basis Accidents
40
If the atmosphere is superheated, the evaporation rate of the sprays may be assumed to be
unlimited
Unevaporated spray water is assumed to go to the sump region at a temperature in equilibrium
with the containment atmosphere
The residence time of the sprays in the containment atmosphere may be assumed to be zero
Containment Heat Removal Considerations
Mass and energy removal rates of containment heat removal components shall be chosen to be
representative of the components performance while retaining conservatism in the analysis
Containment heat removal components, such as fan coolers and recirculation system heat
exchangers must model the mechanism and efficiency of energy removal for each component
Sources of coolant for the containment heat removal components are assumed to be at their highest
credible temperature throughout the accident. A transient temperature may be used if it can be
justified
Sources that can be depleted during the accident are modeled at their lower bound volume.
Modeling of heat removal components shall include effects of fouling, condensate build up or any
conditions that may be expected to degrade the performance of the component
Steam condensed from the containment atmosphere by cooler units is added directly to the
containment sump at the saturation enthalpy of liquid water

41
2 Hydrogen & Nuclear Safety
“Roll up, Roll up for the Mystery Tour
The Magical Mystery Tour
Is waiting to take you away”
- John Lennon & Paul Mcartney, The Magical Mystery Tour.

42
CHAPTER CONTENT
2.1 Introduction ............................................................................................... 43
2.2 Hydrogen properties .................................................................................. 45
Hydrogen Generation.................................................................................... 46
2.2.1.1 Core Degradation within the Reactor Pressure Vessel ............................................... 46
2.2.1.2 Molten Concrete Core Interaction .............................................................................. 46
2.2.1.3 Fuel Degradation within the Spent Fuel Pools ............................................................ 46
Hydrogen Flammability ................................................................................. 47
2.2.2.1 Slow Deflagration Criteria ........................................................................................... 51
2.2.2.2 Flame Acceleration Criteria ......................................................................................... 51
2.2.2.3 Deflagration to Detonation Transition ........................................................................ 52
Hydrogen Ignition .......................................................................................... 53
2.3 Computational Simulation of Hydrogen Risk.............................................. 55

Introduction
43
2.1 Introduction
To introduce hydrogen and its importance in this Thesis, three aspects of its nature will be
commented below: a bad one, a good one, and a beautiful one.
Beginning always with something beautiful; hydrogen is the first element ever created when the
universe was still young, and nowadays it is the most abundant element in the observable
universe.
Following with some positive aspect; hydrogen can be used in many industries, to storage energy,
or as the propeller of a space rocket.
Finalizing with the counter-part; hydrogen reacts extremely violent in an exothermal reaction when
mixed with oxygen which represents the 21 % of the earth atmosphere.
It is now clear that any process that involves hydrogen management requires special care to avoid
a risky situation. There are many efforts in making hydrogen codes, standards, and procedures such as
NASA’s guidelines [60] or the international project HySafe [61–63]. But despite these efforts, accidents
with hydrogen have been a constant though history (for a complete record see [64]).
In this sense, the relationship between nuclear energy and hydrogen is especially turbulent. This
relationship became an important issue at the end of the 70’s. It was March, 1979, at the Three Mile Island
2 (TMI-2) NPP, an accident occur and it became one of the most important events in the history of civilian
use of nuclear power. On the second day after the accident begins, an enormous hydrogen combustion
occurred inside the NPP containment. The hydrogen had been generated during the oxidation of the
reactor fuel by zirconium–water interaction and had been accumulating in the containment escaping
through the PZR relief tank vent [16]. The hydrogen combustion occurred almost 10 hours after the start
of the accident. Analyses performed after the accident asserted that, by the time the burn occurred, the
generated hydrogen had become well mixed throughout most of the containment [65]. What triggered
hydrogen combustion might never be known with certainty: a plausible hypothesis is that it was initiated
by an electric spark of equipment [66]. The entire burn lasted approximately 12 s, Figure 2-1. In fact, this
combustion of approximately 350 kg of hydrogen caused the highest pressure load during the whole
accident. It is mentionable that the hydrogen combustion did not cause any severe damage on the
containment; the pressure spike reached an approximate maximum value of 2.8 bar and the containment
withstand it without serious troubles because the design pressure had a higher limit.
Since the TMI-2 containment withstood this load, there were no consequences for the environment.
But the hydrogen burn at the TMI-2 plant revealed an underestimation of the role that hydrogen took in
nuclear safety; although it was not unknown, the risk of hydrogen combustion had not been given
sufficient attention before.

Hydrogen & Nuclear Safety
44
Figure 2-1. Containment pressure during the TMI-II accident, [66]
Figure 2-2. Hydrogen Explosion on Fukushima-Daiichi,[66]

Hydrogen properties
45
The TMI-2 hydrogen combustion was thus a key event that, additionally to other research in nuclear
safety, also initiated intensive research on hydrogen management, that is, its prevention and mitigation
during hypothetical SAs in NPPs.
Thirty-two years later, on March 11th of 2011, the earthquake and latter tsunami stroke the
Fukushima-Daiichi NPP, 240 km away from Tokyo. This disaster provoked a SBO, this is, the plant run
out of AC and DC power for several hours. The temperature at the fuel quickly reached 1100 °C, and at
this point great amounts of hydrogen were generated due to the oxidation of the Zr.
The hydrogen generated in the fuel passed through the Safety Relief Valves (SRV), to the
Suppression Pool (SP), and it began to pressurize the containment. The hydrogen, among other gases,
started to leak through small cracks produced during the earthquake and through the containment head.
This hydrogen leaked to the containment building and started to accumulate in the reactor building. At the
beginning of this leakage the hydrogen risk was not very high because Mark I and II containments are
inertified with nitrogen [67].
On March 12th, the first hydrogen explosion in Fukushima unit 1 occurs; on March 14th another
explosion occurred in unit 3, and finally the last explosion occurred on March 15th, Figure 2-2.
Those explosions were seen worldwide, and they revealed the magnitude of the event. Even with
the measures taken after TMI-2, the hydrogen was again under a global attention, and the nuclear energy
was once more on the spot.
2.2 Hydrogen properties
Hydrogen gas was first artificially
produced in the early 16th century by the
reaction of acids on metals. In 1766, Henry
Cavendish was the first to recognize that
hydrogen gas was a discrete substance, and
that it produces water when burned, the
property for which it was later named: in Greek, hydrogen means "water-former". Hydrogen chemical
symbol is H and its atomic number is 1. The hydrogen atom consists of a nucleus, formed of a single
proton, and of a single electron. The hydrogen molecule consists of two hydrogen atoms bounded
together. The hydrogen emission spectrum was the first one discovered by Johann Balmer in 1885.
The dynamic viscosity of hydrogen at 0 °C is 8.4·10-6 Pa·s which is somewhat lower than the
dynamic viscosity of air at 0 °C that is 17.4 ·10-6. For the specific situation of a SA, this means that when
hydrogen is flowing upward, the air entrainment would be less intensive than in a comparable situation
with steam, but not fundamentally different.
Figure 2-3. Hydrogen emission spectrum lines in the
visible range.

Hydrogen & Nuclear Safety
46
The diffusivity of hydrogen in air at pressure of 1 atmosphere and temperature of 25 °C is 0.41·10-
4 m2/s. Thus, during a severe accident, greater diffusion of hydrogen than of steam may be expected. This
is relevant for predicting the formation of regions with high hydrogen concentration, which makes
hydrogen ignition and subsequent combustion more likely [66].
Hydrogen has a density of 0.0838 kg/m³ and is much lighter than other gases likely to be found in
the atmosphere of a NPP containment during a SA (steam, air consisting mostly of oxygen and nitrogen,
as well as carbon monoxide and carbon dioxide generated by molten core concrete interaction). Thus,
when hydrogen is part of a heterogeneous atmosphere in a closed compartment, it is likely to accumulate
in the upper parts due to its buoyancy drawn by density difference.
Hydrogen Generation
In this section the main processes that can generate hydrogen during an accident will be exposed.
The accidents that generate all these situations will not be discussed but it must be noted that a single
accident scenario (SBO for example) can generate hydrogen by all the mechanisms mentioned below.
2.2.1.1 Core Degradation within the Reactor Pressure Vessel
Hydrogen generation it is produced from exothermal oxidation of Zircaloy of the fuel cladding and
fuel assembly grids during the early core degradation process as well as in the later phase through
oxidation of other hot metallic components or metals within the molten pool or debris bed in the RPV.
Hydrogen production is a fast process due to zirconium oxidation by steam ranging from 0.1 to 5.0 kg/s
(degradation and reflood of the overheated core). A very rough order of magnitude of hydrogen created
by full Zircaloy oxidation could be up to 1000 kg of H2 for typical PWR compared to at least 3 to 4 time
more for a BWR with the same power (around 1000 MWe), and around 1100 kg of H2 for a 1000 MWe
VVER.
2.2.1.2 Molten Concrete Core Interaction
After the failure of RPV, the melt can relocate to the reactor pit (or calandria vault). Depending on
the concrete composition, which is NPP design specific, a large amount of hydrogen and carbon
monoxide may be produced during the Molten Concrete Core Interaction (MCCI). Generation of non-
condensable gas from MCCI is a continuous process in contrast to the release of hydrogen from the core
oxidation within the RPV.
2.2.1.3 Fuel Degradation within the Spent Fuel Pools
The irradiated and spent fuel is stored in the SFP. In case of loss of cooling for a SFP, the SFP pool
water is heated-up by the decay heat of the fuel assemblies, causing a boil-off situation when the SFP
water reaches saturated condition. As a consequence, the water level in the SFP decreases. Without
sufficient water supply, the fuel assemblies may become uncovered and the fuel is overheated. Oxidation

Hydrogen properties
47
of the cladding by steam may lead to a large amount of hydrogen production, while oxidation with air is
also possible.
Following the Fukushima accident, concerns on SFP cooling have been increasingly raised in the
international nuclear community. It is still under discussion whether hydrogen mitigation measures are
needed or what measures can be implemented, although no specific requirements have been
implemented in most countries. Nevertheless, the primary focus is on preventive measures, e.g.,
implementation of additional injection and heat removal systems from the SFP, especially passive
systems, [68,69].
Hydrogen Flammability
Hydrogen is a very complex reactive, its combustion is not as simple as hydrogen molecules and
oxygen molecules reacting together, several species are created and can seriously affect the reaction
kinetics. Hydrogen and oxygen reactions are simplified to what is called the San Diego mechanism [70],
showed in Table 1. It is a compilation of several references that can be found in [70], but that will not be
cited explicitly here as they do not really have a serious contribution to the Thesis.
Where k is the reaction rate coefficient, Ta is the activation temperature, T the temperature of the
reaction. With this mechanism, it can be seen that the overall chain-branching reaction is the following:
3H2 + O2 ⇌ 2H2O + 2H (2)
One of the first efforts to categorize the combustion regimes was published in 1957 by Saphire &
Mophat; it combines several experimental data in a single diagram [71], see Figure 2-4. Even though this
diagram is still used, more detailed methods have arisen over the years.

Hydrogen & Nuclear Safety
48
Rate coefficients in Arrhenius form k = BTnexp(−Ta/T).
Reaction B n Ta (K)
H + O2 ⇌ OH + O 3.52 × 10¹⁶ −0.7 8590
H2 + O ⇌ OH + H 5.06 × 10⁴ 2.67 3165
H2 + OH ⇌ H2O + H 1.17 × 10⁹ 1.3 1825
H2O + O ⇌ OH + OH 7.00 × 10⁵ 2.33 7321
H + O2 + M ⇌ HO2 + M
k0 5.75 × 10¹⁹ −1.4 0.0
k∞ 4.65 × 10¹² 0.44 0.0
HO2 + H ⇌ OH + OH 7.08 × 10¹³ 0.0 148
HO2 + H ⇌ H2 + O2 1.66 × 10¹³ 0.0 414
HO2 + H ⇌ H2O + O 3.10 × 10¹³ 0.0 866
HO2 + O ⇌ OH + O2 2.00 × 10¹³ 0.0 0.0
HO2 + OH ⇌ H2O + O2
2.89 × 10¹³ 0.0 −250
4.50 × 10¹⁴ 0.0 5500
H + OH + M ⇌ H2O + M 4.00 × 10²² −2.0 0.0
H + H + M ⇌ H2 + M 1.30 × 10¹⁸ −1.0 0.0
O + O + M ⇌ O2 + M 6.17 × 10¹⁵ −0.5 0.0
H + O + M ⇌ OH + M 4.71 × 10¹⁸ −1.0 0.0
OH + OH + M ⇌ H2O2 + M
k0 2.76 × 1025 −3.2 0.0
k∞ 9.55 × 10¹³ −0.27 0.0
HO2 + HO2 ⇌ H2O2 + O2
1.03 × 10¹⁴ 0.0 5556
1.94 × 10¹¹ 0.0 −709
H2O2 + H ⇌ HO2 + H2 2.30 × 10¹³ 0.0 4000
H2O2 + H ⇌ H2O + OH 1.00 × 10¹³ 0.0 1804
H2O2 + OH ⇌ H2O + HO2
1.74 × 10¹² 0.0 160
7.59 × 10¹³ 0.0 3660
H2O2 + O ⇌ HO2 + OH 9.63 × 10⁶ 2.0 2009
Table 1. San Diego Mechanism, extracted from [70]
In Nuclear safety, to simplify the analysis and calculation, the combustion regimes are classified in
three regimes according to CSNI (2000) [72], that were based on several studies and experiments:

Hydrogen properties
49
Slow deflagration (SD): in this case the flame velocity is lower that the speed of sound of the
reactant. The velocities reach 200 m/s and the pressure increase is in the order of the initial
pressure.
Flame acceleration (FA): In this case the flame velocity is higher that the reactants sound velocity
but slower than the products one. The velocity is approximately 500 m/s. The pressure increase
is about 10 times the initial pressure.
Deflagration to Detonation Transition (DDT): In this case the flame velocity is higher than the
reactants and the products sound velocity. The velocity of the flame can reach 1200 m/s and the
pressure increases about 30 times the initial pressure.
There are some criteria to identify in which regime the hydrogen cloud is. Those are the flammability
criterion, which determines slow deflagration, the Sigma Criterion that determines the possibility of FA,
and the Lambda Criterion which determines a DDT situation. Any hydrogen mixture can enter the
flammability limits and do not produce a combustion. This is because an igniter of the mixture is still
necessary. The burning process occurs when two requirements are satisfied. First an ignition source is
required, and then a specific mixture of gases that lies within the flammability limits, i.e. the
hydrogen/air/steam proportion is adequate for sustaining combustion.
This criteria has been implemented in several studies (Including this Thesis, See parameter Tau
on Section 6.3 “Evaluation of the Hydrogen Risk; the Tau Parameter” and it takes into account species
concentration, characteristic length of the room, pressure, temperature and properties of each species.
However, it must be said that there are more variables involved in hydrogen combustion such as the
turbulence of the mixture. As an example, a regime classification comparing the Reynolds number and
the Damköhler number is shown in Figure 2-5. These variables are not used on the calculation of the
flammability limits, and will not be discussed.

Hydrogen & Nuclear Safety
50
Figure 2-4. Shapiro flammability diagram for hydrogen-air-steam mixtures at 1 bar and 298 K, [71]
Figure 2-5. Flame dependence on turbulence regime, [73]

Hydrogen properties
51
2.2.2.1 Slow Deflagration Criteria
The factors that affect the flammability limits for slow deflagration criteria are concentration of each
species, and temperature. The flammability limits are not themselves a property of the mixture, but they
are very useful for engineering and safety studies as they are indicative of the mixture capacity to maintain
the flame propagation after a high enough energy release by an ignition source [74]. Several experimental
programs had evaluated these limits [75] for several temperatures. In deeper detail Byun et al. [76]
proposed linear functions of the molar fraction of hydrogen, steam and temperature for expressing the
flammability limits. From the data compiled by Stamps and Berman (1991) [74], the following expressions
shown in eq. (3) can be obtained.
XLFL-UPW H2 ≥ 0.037 + 0.011·XH2O − 4.16·10−5 (T −373)
XLFL-DWN H2 ≥ 0.086 + 0.008·XH2O − 1.02·10−4 (T −373) (3)
XUFL H2 ≤ 0.772 + 1.087·XH2O + 2.71·10−4 (T −373)
XINERT H2O ≥ 0.63 + 3·10−4 (T −373)
The XLFL (Low Flammability Limits) and XUFL (Upper Flammability Limits) bound the minimum
hydrogen concentration needed in the mixture to combust. In addition there is a maximum steam
concentration, XINERT, which makes the mixture unable to combust. This expressions are used in the
analyses using the upward propagation as it is the most conservative restriction for hydrogen flammability.
2.2.2.2 Flame Acceleration Criteria
To assess this possibility of FA, the sigma criterion is used (σ criterion ) developed by FZK
(Fortschungzentrum Karlsruhe, Germany) and KI (Kurchatov Institute Moscow, Russia) [72]. Through
several experiments and discussions they concluded that the FA does not fully depend on the geometrical
scale or blockage conditions, but depends on the initial properties of the mixture [77]. This means that
this criterion can be evaluated with the species concentration on the cell solely. The parameter correlating
the FA occurrence is the expansion ratio, called σ parameter. This parameter is compared against a
critical value (σ*) creating the sigma index as shown in eq. (4):
𝑖𝜎 = 𝜎
𝜎∗ (4)
When iσ ≥ 1.0, FA regime can be reached and, if iσ < 1.0, FA is not possible. In addition,
uncertainties in the model (8%) recommend reducing this threshold value to 0.92.
The sigma parameter is defined as shown in eq. (5). Being the subscript b burned and u for
unburned mixture, v for velocity and ρ density:
𝜎 =𝑣𝑏
𝑣𝑢=
𝜌𝑏
𝜌𝑢 (5)

Hydrogen & Nuclear Safety
52
This means that the burned properties of the mixture have to be inferred prior to the hydrogen
combustion if hydrogen risk wants to be addressed. There are experiments data available in CSNI 2000
[72], but in order to cover most ranges, a simple chemical formulae is applied. The burned mixture is
assumed through the adiabatic isobaric complete combustion of ideal gases. This means that all the heat
produced by the hydrogen combustion is used to elevate the temperature of the gases of the mixture.
This is not exactly true, as it is known that the combustion also increases the mixture pressure, but several
works, like the one made by Martin-Valdepeñas uses this assumption [78]. In addition, other works [79]
have demonstrated that the critical value of sigma (σ*) clearly separates mixtures under slow deflagration
and Flame Acceleration. This value has been fitted by the following polynomial function of the relation of
the stoichiometric concentration ratio of H2 and O2 and the temperature of the mixture by a function (eq.
(6)):
𝜎∗ = 𝜎∗(𝐸𝑎, 𝑇𝑢) (6)
Being Ea the mixture activation energy, dependent on the stoichiometric ratio, Φ. There is an
expression for the activation energy, which was fitted by minimum squares to experimental and
thermodynamic data as shown in eq. (7):
𝐸𝑎 = 7.73 · 103 − 4.06 · Φ · 102 + 8.96 · Φ2 · 101 − 4.32 · Φ4 · 10−1 (7)
The usage of that formulae can be done from values of Φ between 0.1 and 7.5. In this formulae, it
is supposed that the stoichiometric values for hydrogen and oxygen are 2:1; however, there is still room
for improvement, as it is known from the San Diego Mechanism, that the overall reaction for hydrogen
combustion at high temperatures (T > 500 K) could be different. The stoichiometric values for the reaction
are therefore not fixed as the temperature allows some reactions and inhibits another.
2.2.2.3 Deflagration to Detonation Transition
More problematic than FA processes are DDT scenarios. DDT scenarios occur when the velocity
of the flame front is higher than the speed of sound of the reactants and the products as well. A stable
coupling between the shock wave and the reaction zone has to happen. From numerical simulations, it
has been suggested that this process needs a minimum size of the reactive mixture volume [72].
The analysis showed (on facilities of different characteristic sizes) that the minimum mixture size of
the premixed cloud for DDT must be above a certain value measured in units of the detonation cell size,
known as the λ parameter. This parameter is a function of concentration of species, temperature and
pressure, see eq. (8):
𝜆 = 𝜆(𝑃, 𝑇, 𝑋𝐻2, 𝑋…) (8)
The λ parameter is a property of the mixture depending on pressure, temperature and gas
concentrations. A wide experimental database exists for this property, hence KI have fitted different
analytical functions by minimum squares [80,81]. With this parameter defined DDT can be predicted.
Based on several experiments, the minimum characteristic cloud size for DDT occurrence is 7λ[82]. So
the index lambda (𝑖𝜆)can be expressed as represented in eq. (9) :

Hydrogen properties
53
𝑖𝜆 = 𝐷
7𝜆 (9)
Where D is the characteristic room size. To calculate the characteristic room size can be done by
calculating the volume of the room and then use the cubic root of this value to obtain the characteristic
length of the room. This is as well an assumption, but it has been widely used, [82], [78].
If iλ ≥ 1, DDT is achievable and, if iλ < 1, DDT is not possible. In addition, due to the high
uncertainties of the model (43%), its recommend to reduce this threshold value to 0.57. Even though
numerical simulations are assumed accurate for hydrogen distribution, [83] and recently [84,85]; it is
particularly disturbing that some authors consider that hydrogen detonation is still an unsolved issue. In
words of Sanchez and Williams, 2014:
“Transitions from deflagration to detonation and possible interaction between vorticiy waves
and entropy waves in detonation are complex issues that are not well understood” … “The fluid
mechanics of the process of transition from deflagration to detonation has been studied
extensively, largely because of safety concerns, but it is quite complicated and remains poorly
understood in many aspects”[70].
To conclude, with this three criteria for SD, FA, and DDT the accident scenarios can be evaluated
and the hydrogen risk can be estimated.
Hydrogen Ignition
Hydrogen can auto ignitiate itself at high temperatures, (Figure 2-6, seen in [70], based on [86])
and its dependence on the ignition time is proportional to several parameters as pressure, concentration
or temperature, however the time of autoignition of hydrogen mixtures at low temperature (below 500 K)
is very extended. It is more likely that under this circumstances the hydrogen finds an external source for
its ignition. The external source of ignition can be as small as a simple spark, or a hot wire. In a NPP there
are several [87,88] potential igniters that can start the combustion of hydrogen and oxygen. Therefore, in
nuclear safety it is important to maintain the hydrogen risk as lower as possible and the fewer time
possible in flammability conditions as well. The studies on hydrogen risk normally do not take into account
the ignition source because of the random feature of this process during an accidental sequence, and
only focuses on the gas concentration and mixture properties to calculate the hydrogen risk. It must be
said that, if it is intended to calculate the hydrogen risk and calculate all possible combustions inside a
containment, hundreds of simulations with different scenarios will be needed, as the combustion in one
region of the containment at certain moment of the accident can be totally different from another, and
affects the other regions.

Hydrogen & Nuclear Safety
54
Figure 2-6. Autoignition time dependence on Temperature and Pressure, [86]

Computational Simulation of Hydrogen Risk
55
2.3 Computational Simulation of Hydrogen Risk
Whenever a study tries to focus on hydrogen management, its aim is normally not to perform the
calculation of hydrogen combustion, but to estimate quantitatively or qualitatively the hydrogen risk,
therefore, the correct hydrogen distribution is critical. An extensive literature review on this topic has been
written by the author in previous works. The following paragraphs describe the state of the art in hydrogen
distribution in containment analyses. (Extracted from Fernández-Cosials et al. [89]) .
Three tools are normally used when simulating the hydrogen distribution in a containment building:
lumped parameter codes, CFD codes and containment codes with 3D capabilities. The LP codes, such
as MAAP or MELCOR, are found appropriate to simulate a large number of severe accident sequences
and phenomenology of core degradation and hydrogen production. Nevertheless, they cannot predict
some of the details of local gas mixing [90]. Taking some geometrical simplifications, some studies
included the hydrogen distribution simulation and risk evaluation with lumped parameter codes, for
example the study done by SNERDI for the Passive Autocatalytic Recombiner (PAR) installation in
CANDU6 reactors with MELCOR [91].

Hydrogen & Nuclear Safety
56
Figure 2-7. Hydrogen and steam distribution calculation by Royl et al.[92]

Computational Simulation of Hydrogen Risk
57
Several CFD codes are able to reproduce more accurately the thermal–hydraulic containment
phenomenology during a severe accident, [39], [80], if the main variables related to fuel degradation are
introduced as boundary conditions. The capability of CFD codes to evaluate the hydrogen distribution is
intensively assessed, [72]. But considering the large volume of a typical reactor containment (50000–
65000 m3), the difficulty of simulating the wall condensation and that at least three species (air, hydrogen,
and steam) are involved, the simulations of large scale facilities with commercial CFD codes is a very
challenging task even though there some past successful studies, [78,93–95].
Moreover, the use of 3D containment codes, such as GOTHIC, for safety demonstration analyses
has been repeatedly established as a useful tool for hydrogen distribution within the containment and
capable to determine local and global hydrogen concentration with a reasonable precision [96].
The use of CFD/3D containment codes and lumped codes is not mutually exclusive, in fact they are
usually used together. The lumped codes normally provide the source term and the CFD/3D codes
calculate the hydrogen transport in detail. There are several good examples in the literature of analysis
for real nuclear power plants with different combinations of codes.
The first case found in the literature that uses a 3D approach is the PWR-KWU numerical simulation
of transport, and mixing of hydrogen found in [92], followed by [97]. There is a APR1400 hydrogen in
containment distribution simulation with GOTHIC and GASFLOW, using the integral severe accident code
MAAP as the source term code, performed by KAERI and presented in 2004 [98]. Recently they have
published an update about their work with GASFLOW for APR1400 [99]. In the case of the licensing
process of EPR in the UK [100], [101], [102], MAAP4 was used as a basis for simulating severe accidents,
using COCOSYS for cases that need more detail, and for the most penalizing cases GASFLOW was
used. Cases involving supersonic deflagrations or detonations were simulated with another code called
COM3D.

Hydrogen & Nuclear Safety
58
Figure 2-8. Hydrogen distribution study in the Fukushima accident by Xiao et al. [103]

Computational Simulation of Hydrogen Risk
59
In the case of the AP1000 licensing process in the UK, the calculation of hydrogen generations
performed with GENNY (Westinghouse proprietary code), MELCOR and MAAP4 [104]. The study from
AECL [105] used GOTHIC to model containment thermal hydraulics and hydrogen transport for licensing
of PAR installation of CANDU reactors in Canada. GOTHIC was also used for licensing calculations US-
APWR Reactor of Mitsubishi in USA [106]. The study conducted by Grgic et al. [107] presents the
hydrogen concentration analysis in PWR containment for PAR location. The mass and energy source
term are obtained using MAAP and forth prediction of the hydrogen distribution a 3D GOTHIC
containment model is used, in order to reach the level of detail needed. KIT researchers have conducted
comparative calculations between MELCOR and GASFLOW for calculating the hydrogen distribution in
a KWU-PWR containment [108].
The UPM nuclear safety group has been used MELCOR extensively for simulating the hydrogen
source term and ANSYS CFX ([78]) and GOTHIC for hydrogen distribution within PWR-W and PWR-
KWU containments [109].
Recently, Papini et al. from PSI has presented a very detailed hydrogen distribution calculation with
GOTHIC for a PWR-KWU containment, using MELCOR as source term code [110], [111], [112] . The
researchers were able to obtain detailed local hydrogen concentration values, even though the steam–
hydrogen discharge was super-sonic.
Within the SARNET2 European Project, a detailed simulation for a PWR-KWU containment
geometry has been done by several partners comparing different lumped parameter and containment
codes [113]. In this comparison, some differences were found between the codes. Historically,
experimental facilities like PANDA or TOSQAN have been used to validate codes against the hydrogen
phenomena, and asses their capabilities by comparing its results with experimental data. In the frame of
the OECD SETH project, conducted in PSI, the stratification build up was investigated ([46,47,114–116]).
OECD-SETH2 project performed research on the erosion and break-up of a stratified atmosphere.

Hydrogen & Nuclear Safety
60
Figure 2-9. Hydrogen distribution calculation in a KWU by Papini et al. [110]
Figure 2-10. General overview of the IBE-3 configuration, [117]

Computational Simulation of Hydrogen Risk
61
The OECD-SETH 2 project was followed by the International Benchmark Exercise 3 (IBE-3) [118]
This experiment has been deeply analyzed [89]. In this benchmark, the participants had to adequately
simulate the erosion of a helium stratified layer by a vertical helium jet. The IBE-3 reached conclusions
that can help further investigations on hydrogen distribution. However, as with other benchmarks in the
literature like Gallego’s or Klejnak, [119,120], it was difficult to draw general conclusions from one
participant to another because of the different mesh, solver, simulation settings or physics.
In the recent years, an international project from the OECD/NEA called HYdrogen Mitigation
Experiments for Reactor Safety (HYMERES) has been developed [121]. The objective of this project is to
improve the understanding of the hydrogen risk phenomenology in containment in order to enhance its
modelling in support of safety assessment that will be performed for current and new nuclear power
plants. Many successful hydrogen simulations arise and the understanding of it is being increased without
stop, [122].

62

63
3 Hydrogen Mitigations Strategies during a Severe Accident
“I live my life for the stars that shine
People say it's just a waste of time”
- Noel & Liam Gallagher, Rock ‘N’ Roll Star.

64
CHAPTER CONTENT
3.1 Introduction ............................................................................................... 65
3.2 Severe Accident Management Guidelines ................................................. 67
3.2.1 Mitigation Strategies against Hydrogen ......................................................... 69
3.2.1.1 Hydrogen Concentration Reduction ...................................................................... 70
3.2.1.1.1 gniters Operation ................................................................................................... 70
3.2.1.1.2 Recombiners Actuation ........................................................................................ 70
3.2.1.2 Oxygen Mass Reduction ......................................................................................... 71
3.2.1.3 Hydrogen Mass Reduction ...................................................................................... 71
3.2.1.4 The Venting Strategy ............................................................................................... 75

Introduction
65
3.1 Introduction
Following the TMI accident, hydrogen risk was taken into account more seriously in nuclear safety.
Prior to this accident, hydrogen did not had the research communities’ attention, but nowadays, and
knowing that hundreds of kilograms of hydrogen can be generated during a SA, this topic is extremely
relevant.
Hydrogen is a very reactive element, and must be managed carefully. If hydrogen is mixed with
oxygen, it can react violently, releasing great amounts of energy into the containment (its flammability
and consequences have been explained in the previous Section 2.2.2 “Hydrogen Flammability”).
However, it is important to remember that this reaction needs an igniter, a spark to initiate, if there is no
spark, the reaction will not be produced. These hydrogen explosions can compromise the containment
integrity, as very high pressure peaks are created. If the containment barrier is broken, the worst scenario
is reached, it could drive to a release of large amounts of radioactive material to the environment, and the
reactor surroundings. This was the case of the Fukushima accident, where the radioactivity released has
impeded a lots of citizens to come back to their houses, and they probably will not be able to come back
for a long time. In addition, if the evacuation program is not accomplished on schedule, health damage
caused by radioactivity can be possible in this accident scenario.

Hydrogen Mitigations Strategies during a Severe Accident
66
Figure 3-1. Example of interaction in SMAGs
Enter SAMG
Start Severe Challenge
Status Tree (SCST)
monitoring
Monitor DFC
parameters
Ok?
Long term monitoring
activities SAEG-1
SAMG termination
SAEG-2
Go to appropriate SAG to
return parameter within
desired range
Is plant in a
controlled
stable state?
Y
es
Yes
No
N
o
No

Severe Accident Management Guidelines
67
3.2 Severe Accident Management Guidelines
NPPs have operation procedures in case of accident or abnormal operation. These are included in
the Emergency Operation Procedures (EOPs), the operating procedures for abnormal conditions, etc.
These documents have clear instructions about what to do, when to do it, and how to do it, in order to
mitigate the accident consequences. If the core damage has been reached, or the plant is under a SBO
without diesel generators, these procedures transit to the Severe Accident Management Guidelines
(SAMGs). In this sense, SAMGs fills the link between existing EOPs and the Site Emergency Plan. The
severe accident guidelines are plant specific, and consist of a series of documents. In contrast to the
EOPs, which are very specific in decision taking for certain actions, SAMGs are designed to be more a
guide than a detailed procedure such as the EOPs. Operators and technical staff have to provide an
answer to questions like the following, [123]:
What will happen if I do nothing?
What will happen if I carry out an accident management measure?
What is the best strategy in the present situation?
Is the available information correct?
What are the most important things going on in the plant just now?
Which subsystems are in order and which are not?
How far is the present state from the relevant danger limits?
How to get information about physical quantities not directly measurable?
As an example, if a measure is going to be taken to reduce the hydrogen risk, prior to that action it
is necessary to evaluate all the possible damages or counterparts of applying that measure. It is in this
point where the experts can consider the danger of certain action in a different way [124].
The SAMGs contain two different monitor diagrams; the Diagram Flow Chart (DFC) and the Severe
Challenge Status Tree (SCST). These diagrams are monitored by several indicators and measurements.
The SCST and DFC are monitored in parallel but the SCST has priority over the DFC. If, during periodic
evaluation of the SCST, a severe challenge condition occurs, the usage of the DFC must be stopped,
then go to the corresponding SCG and implement it. The guidelines that help in the operator and
technician actions are the Severe Accident Guidelines (SAGs) for the DFC and the Severe Challenge
Guidelines (SCGs) for the SCST. SCGs are similar to SAGs but they contain no evaluation of negative
impacts. Besides the DFC and SCST, SAMGs contain exit conditions to the SAMGs themselves; the
Severe Accident Exit Guidelines (SAEGs). The SAEGs are checked in the flow algorithm to exit SAMGs
when the plant is in a stable and controlled state.

Hydrogen Mitigations Strategies during a Severe Accident
68
The SCGs are exposed below:
SCG-1: Mitigate Fission Product Releases:
This severe challenge has strategies such as: stop injection flow, use the containment spray to
mitigate auxiliary building releases, depressurize containment using fan coolers or containment
sprays, dump steam from affected SG(s) through the condenser, operate the spray to keep
containment from pressurizing, or start auxiliary building ventilation.
SCG-2: Depressurize Containment:
This severe challenge has strategies for mitigation such as: use containment fan coolers, use
containment spray pumps or vent the containment (mini-purge system, hydrogen purge system,
containment atmosphere monitor, or hydrogen control system.
SCG-3: Control Hydrogen Flammability:
This severe challenge has strategies for mitigation such as: stop containment heat sinks, open
pressurizer PORVs, isolate potential ignition sources (like non-safety valves) or containment
venting.
SCG-4: Control Containment Vacuum:
This severe challenge has strategies for mitigation such as: stop containment heat sinks, open
pressurizer PORVs, add instrument air to containment or establish nitrogen to accumulators to
avoid damage.
Normally, there are 8 SAGs that provide strategies and possible actions to mitigate the accident
consequences. They are mentioned below:
SAG-1: Inject into the Steam Generators
SAG-2: Depressurize the RCS
SAG-3: Inject into the RCS
SAG-4: Inject into Containment
SAG-5: Reduce Fission Product Releases
SAG-6: Control Containment Conditions
SAG-7: Reduce Containment Hydrogen
SAG-8: Flood Containment
As stated before, when changing EOPs to SAMGs, it is necessary to monitor all indicators of the
severe challenges shown in DFC. When a monitor of a severe challenge surpasses the limits it is
necessary to restore the previous value to be under the limits again. To do so, the operators have to enter
the correspondent SAG, and evaluate all risks and actions that can be made, in order to minimize the
radioactivity release to the environment.

Severe Accident Management Guidelines
69
SAMGs are also helped by Computational Aids (CAs). These aids are normally graphs or charts
that indicate the operator if the plant is inside a severe challenge region. As commented above, the
decision making is very difficult, so there are seven tools designed to help in those decisions:
CA-1: RCS Injection to Recover Core
CA-2: Injection Rate for Long Term Decay Heat Removal
CA-3: Hydrogen Flammability in Containment
CA-4: Volumetric Release Rate from Vent
CA-5: Containment Water Level and Volume
CA-6: RWST Gravity Drain
CA-7: Hydrogen Impact when depressurizing Containment
Mitigation Strategies against Hydrogen
In this section, all possible actions that help in reducing the hydrogen risk will be explained. These
actions are contemplated in SAGs and SCGs.
As seen in Section 2.2.2 “Hydrogen Flammability”, to produce a hydrogen deflagration or detonation
several conditions should be reached. Hydrogen flammability depends exactly on the same parameters
that hydrogen mitigation rely on. In addition to hydrogen flammability limits, hydrogen safety also takes in
to account the amount of hydrogen that can combust; this is the mass of hydrogen that stays inside the
containment building. To present this measures that appear on the SAMGs, a separation by dependence
on some flammability aspect will be made.
To enhance readability and understanding an illustrative example will be explained first: Some
indicators are measuring high hydrogen concentration values inside the containment. In this hypothetical
scenario the pressure in the containment is also very high. On the one hand, it can be argued that it is
necessary to vent the containment to reduce the pressure because otherwise the containment will leak
radioactive material to the environment. Prior to the venting, it is necessary to activate the spray in the
containment to wash out all possible radionuclei and aerosols. However, if there is hydrogen in the
containment it can also be argued that if the spray is used, the steam volume fraction inside the
containment will be reduced and therefore the volume fraction of hydrogen and oxygen will rise. This
rising can lead to a hydrogen combustion in a DDT regime that can compromise the containment integrity
and that would lead to a containment leak. As shown, both argumentations have adequate reasons and
facts, and deciding which action is the most important to apply can be a very challenging task.
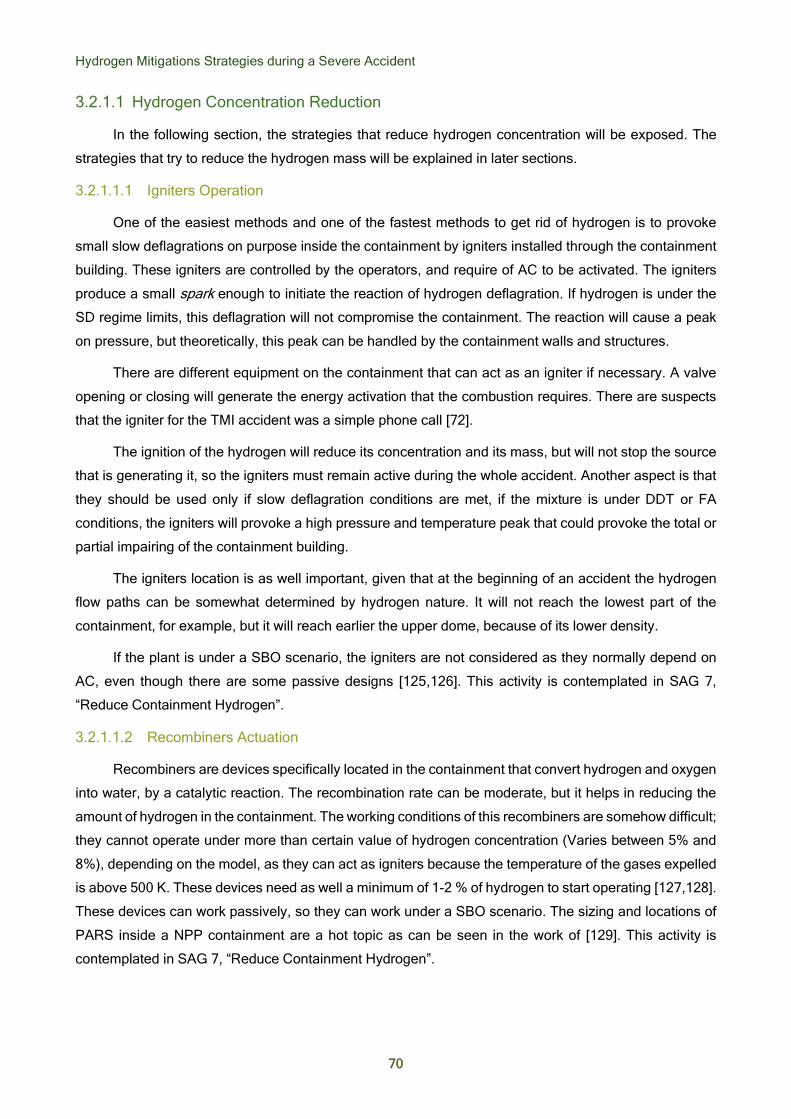
Hydrogen Mitigations Strategies during a Severe Accident
70
3.2.1.1 Hydrogen Concentration Reduction
In the following section, the strategies that reduce hydrogen concentration will be exposed. The
strategies that try to reduce the hydrogen mass will be explained in later sections.
3.2.1.1.1 Igniters Operation
One of the easiest methods and one of the fastest methods to get rid of hydrogen is to provoke
small slow deflagrations on purpose inside the containment by igniters installed through the containment
building. These igniters are controlled by the operators, and require of AC to be activated. The igniters
produce a small spark enough to initiate the reaction of hydrogen deflagration. If hydrogen is under the
SD regime limits, this deflagration will not compromise the containment. The reaction will cause a peak
on pressure, but theoretically, this peak can be handled by the containment walls and structures.
There are different equipment on the containment that can act as an igniter if necessary. A valve
opening or closing will generate the energy activation that the combustion requires. There are suspects
that the igniter for the TMI accident was a simple phone call [72].
The ignition of the hydrogen will reduce its concentration and its mass, but will not stop the source
that is generating it, so the igniters must remain active during the whole accident. Another aspect is that
they should be used only if slow deflagration conditions are met, if the mixture is under DDT or FA
conditions, the igniters will provoke a high pressure and temperature peak that could provoke the total or
partial impairing of the containment building.
The igniters location is as well important, given that at the beginning of an accident the hydrogen
flow paths can be somewhat determined by hydrogen nature. It will not reach the lowest part of the
containment, for example, but it will reach earlier the upper dome, because of its lower density.
If the plant is under a SBO scenario, the igniters are not considered as they normally depend on
AC, even though there are some passive designs [125,126]. This activity is contemplated in SAG 7,
“Reduce Containment Hydrogen”.
3.2.1.1.2 Recombiners Actuation
Recombiners are devices specifically located in the containment that convert hydrogen and oxygen
into water, by a catalytic reaction. The recombination rate can be moderate, but it helps in reducing the
amount of hydrogen in the containment. The working conditions of this recombiners are somehow difficult;
they cannot operate under more than certain value of hydrogen concentration (Varies between 5% and
8%), depending on the model, as they can act as igniters because the temperature of the gases expelled
is above 500 K. These devices need as well a minimum of 1-2 % of hydrogen to start operating [127,128].
These devices can work passively, so they can work under a SBO scenario. The sizing and locations of
PARS inside a NPP containment are a hot topic as can be seen in the work of [129]. This activity is
contemplated in SAG 7, “Reduce Containment Hydrogen”.

Severe Accident Management Guidelines
71
3.2.1.2 Oxygen Mass Reduction
Given that the hydrogen reaction needs oxygen for the combustion, if the quantity of oxygen in the
containment atmosphere is reduced, the energy released will lower. In addition, if the oxygen
concentration is very low, the reaction will be less violent, as taken into account in the flammability limits
for the lambda and sigma criterion. To reduce the amount of oxygen in the containment it is possible to
make it by an early venting (prior to the hydrogen release). If the containment is vented during the first
stages of the accident, the oxygen and nitrogen the containment atmosphere had, will be changed by
steam generated in the primary system. This steam is mainly H2O, and as shown in Section 2.2.2
“Hydrogen Flammability”, there are some mechanisms showed in the San Diego Mechanism, that involve
this reactant. However, it can be generally considered that if the oxygen is replaced with steam, the
hydrogen risk will not be eliminated, but partially downgraded. In addition, this strategy can be made
under an SBO scenario given that it does not require AC.
The venting strategy can be not only made to reduce the amount of oxygen if it is made prior to the
hydrogen release, but also to reduce the total hydrogen mass, by venting when the hydrogen has been
released in to the containment as is shown later in the chapter.
To inert the containment in terms of oxygen, it is necessary to reduce its volume fraction to less
than 1%. This is a consequence of the stoichiometry of the hydrogen chemical reaction which is 3:1 and
the hydrogen flammability limits. This activity can be taken into account in the SCG-3 “Control Hydrogen
Flammability”.
3.2.1.3 Hydrogen Mass Reduction
Some measures are not intended to change the flammability limit condition of the hydrogen but to
reduce the hydrogen mass inside the containment. To reduce the hydrogen mass inside the containment
it is possible to do it by venting the containment after the hydrogen release with it inside.
It will be less damaging that 100 kg instead of 200 kg of hydrogen deflagrate, so with a containment
venting it is possible to reduce this risk.
It has been said several times that the venting will not change the hydrogen concentration. (See for
example [130]). However, this is made because the lumped approach was set in mind. If the whole
containment is a single node, and the vent is activated, the concentration will not change, naturally,
because the same species are being taken from the same cell. However, if the containment is modeled
with a 3D approach and the venting is only made in a particular place of the containment though a small
window (pipe) of the model, the venting will change the hydrogen concentration in the different rooms,
because of the non-homogeneous concentration in the containment.

Hydrogen Mitigations Strategies during a Severe Accident
72
Figure 3-2. Single Drop Collection Efficiency measured in CSE sprays, [131]
Figure 3-3, CA-4, Potential for hydrogen combustion, [132]

Severe Accident Management Guidelines
73
It will be seen in next chapters, that the venting actually changes the hydrogen concentration in the
different rooms. The hydrogen tends to accumulate in the upper dome, and, if the venting is not made
through the top of it (which is not the case of any known NPP), and it vents in a middle elevation,
depending on the species density it is possible that most of the vented species will not be hydrogen. If
the venting is made during the hydrogen release, then if the venting pipe is near the hydrogen source,
then most of it can be vented, but if it is not, most of the venting will be steam, oxygen and nitrogen.
An additional comment must be made for the venting strategy. The venting is normally made
through a venting pipe, this pipe is opened to the ambient that has 21 % of oxygen. Ambient conditions
usually flow until the valve that opens the venting. If the atmosphere inside the containment is a low-
oxygen atmosphere, but high-hydrogen, and then the venting occurs, a great mass of hydrogen is going
to meet a great mass of oxygen that can lead to the total or partial destruction of the venting pipe through
a FA or a DDT combustion. This must be taken in to account, given that, if the explosion is made in the
valve, the venting will remain open and the equipment can be damaged. This activity can be taken into
account in the SCG-3 “Control Hydrogen Flammability”.

Hydrogen Mitigations Strategies during a Severe Accident
74
Figure 3-4, Volumetric Flow of containment gases, [133]

Severe Accident Management Guidelines
75
3.2.1.4 The Venting Strategy
The venting strategy combines the consequences of the hydrogen mitigation strategies altogether;
it can reduce the hydrogen concentration, it can reduce the hydrogen mass and it can reduce the oxygen
concentration. However, the hydrogen risk may not be lower than the initial one if the venting strategy is
made, because several mechanisms and phenomena compete one with each other. The advantages and
disadvantages of the venting strategy can be summarized in the following:
Venting before hydrogen generation:
Reduce the amount of oxygen. If there is less amount of oxygen in the containment there will be
less fuel on the atmosphere to cause a combustion. However, by reducing the amount of oxygen,
the stoichiometric ratio of hydrogen-oxygen would be normally more similar to 3:1, what makes
the flammability criteria easier to meet.
Inertization of the atmosphere. By reducing the amount of oxygen it increases the molar fraction
of steam in the containment atmosphere. If the containment atmosphere has more than 63 % of
steam, it is considered inerted and it cannot propagate the hydrogen combustion in a destructive
manner. This effect can be countered by the supposed spray injection previous to the venting,
because the spray injection will cause the steam to condensate, and then the fraction of oxygen
and hydrogen can rise again.
Reduce the pressure. Venting will reduce the pressure inside containment, and if the pressure is
lower, the hydrogen risk is lower as well, because a higher pressure will increase the possibility
of DDT.
After/during hydrogen generation:
Reduce the hydrogen concentration. This is true, even though some references consider that the
hydrogen concentration does not change with the venting strategy (see for example [66]) , due to
the lumped conception of the containment that historically has been used to perform containment
analysis. The containment is 3D and the venting only applies to a local space, so flow patterns
appear and maybe high-steam concentration zones are vented instead of hydrogen, or vice versa,
high hydrogen concentration zones can be vented.
Reduce the hydrogen and oxygen mass. When venting a fraction of the hydrogen generated is
evacuated through the venting pipe. This will make that if the hydrogen explosion occurs, the
explosion will be less violent.
It must be noticed however, that the venting strategy has an inconvenient. Prior to the venting it is
highly required by SAMGs to spray the containment in order to reduce the amount of radioactive aerosols
and FP particles floating in the atmosphere [131,134,135], see Figure 3-2. If this particles are not washed
out, they will be expelled to the environment. Only in exceptional cases, the venting without spraying is
an option during a SA. The spray is normally used during small periods of time, given that it uses the
water from the RWST or the recirculation water.

Hydrogen Mitigations Strategies during a Severe Accident
76
The counterpart of washing out this particles is that steam from the containment atmosphere will
be condensed, and this condensation will decrease the partial concentration of steam and therefore, it
will augment the concentration of both hydrogen and oxygen. If this concentration is augmented enough,
it could surpass the limits of sigma or lambda criterion and enter a more dangerous zone combustion
regime. Studies like del Corno et al. [135], suggest that only a couple minutes are needed to wash out all
mayor particles, so keeping the spray actuation at minimum can help when dealing with hydrogen risk.
A small advantage of using the spray is that it induces a mixing in the whole containment. It can
break stratifications made, and if there were some small hydrogen clusters, they can be break-up thanks
to the mixing induced by this measure.
Taking into account all this pros and cons, it is not obvious if the venting strategy can reduce the
hydrogen risk in containment or not. However, what is obvious is that a containment full of hydrogen must
be vented at some point; the hydrogen cannot be floating ad infinitum inside the containment waiting for
a spark to combust.
Because of this advantages and disadvantages, Computational Aid (CA) can be used in the
decision tree concerning the venting action. The CA used is CA-3 and CA-4, and it consist of a series of
graphs that help the operator to estimate if the hydrogen is under the combustion limits or not. CA-4 is
not used to decide whether or not to vent, but what is the best way to vent, in terms of vent path and
timing, in order to minimize the radiological consequences of venting. CA-4 is not used to estimate the
depressurization rate that will result from venting containment. CA-4 alike graph is shown in Figure 3-3
and Figure 3-4.

77
4 Models & Methods
“Work it harder, Make it better
Do it faster, Makes us stronger
More than ever, Hour after
Our work is Never over”
- Daft Punk, Harder Better Faster Stronger.

78
CHAPTER CONTENT
4.1 Introduction ................................................................................................ 79
4.2 The GOTHIC Code .................................................................................... 80
GOTHIC Capabilities .................................................................................... 80
GOTHIC Verification & Validation ................................................................. 81
4.2.2.1 GOTHIC Generic Validation ......................................................................................... 81
4.2.2.1.1 Conclusions on Generic Validation....................................................................................... 81
4.2.2.2 Author validation of the GOTHIC code ....................................................................... 83
4.2.2.2.1 Stratification Break-up of a Hydrogen Cloud in a Large Enclosure Validation ..................... 83
4.2.2.2.2 Mesh Sensitivity to a M & E Release in a Full Containment ............................................... 103
4.3 The MELCOR Code ................................................................................. 111
MELCOR Capabilities ................................................................................. 111
MELCOR Verification & Validation .............................................................. 112
4.4 The ProTON Code ................................................................................... 114
ProTON Capabilities ................................................................................... 114
4.4.1.1 Room-averaged Values ............................................................................................. 114
4.4.1.2 Maximum Room Values ............................................................................................ 115
4.4.1.3 Room Thermal Conductors Behavior ........................................................................ 115
4.4.1.4 Hydrogen Flammability Limits .................................................................................. 116
4.5 Development of a 3D PWR-W Containment with the GOTHIC Code ...... 121
Detailed PWR-W CAD 3D Model ................................................................ 121
Simplified PWR-W 3D CAD Model .............................................................. 123
PWR-W containment GOTHIC 3D model .................................................... 123
4.5.3.1 Modeling Approach .................................................................................................. 123
4.5.3.2 Model Mesh .............................................................................................................. 125
4.5.3.3 Flow Connectors ....................................................................................................... 127
4.5.3.4 Thermal Conductors.................................................................................................. 129
4.5.3.4.1 Heat Sinks Geometry and Nodalization ............................................................................. 129
4.5.3.4.2 Conductor Surface Heat Transfer ....................................................................................... 130
Opened Research Lines ............................................................................. 130

Introduction
79
4.1 Introduction
In this section, the codes, models and methods used in the Thesis will be explained. The GOTHIC
code, which plays a central role in the development of the Thesis will be broadly depicted, with a small
section dedicated to its validation for the current studies. The MELCOR Code will be shortly debriefed,
given that it has only been used as an “input-generator” for M&E which is later introduced into GOTHIC.
The ProTON code, a code developed by the author and some collaborators, will be shown, as well as its
capabilities and improvements.
After code description, the containment GOTHIC 3D model will be deeply explained; including the
methodology created for its development as well as all parameters implicated. All different models and its
differences will be shown as well. These models are the ones used in the simulation of DBAs and SAs for
this Thesis and are the rock basis for the proposals made.

Models & Methods
80
4.2 The GOTHIC Code
In this section, the code used for the containment accident analysis will be commented. The
validation process necessary to support all calculations will be also described as well as the authors
contribution to the code validation in an international benchmark; the International Benchmark Exercise-
3 (IBE-3) that took place in the PANDA facilities in the Paul Scherrer Institute (PSI). All simulations of the
present Thesis have been performed using the GOTHIC 8.1 (QA) code.
GOTHIC Capabilities
For a complete report of GOTHIC capabilities see the technical manual included in [45].

The GOTHIC Code
81
GOTHIC Verification & Validation
In this section the validation of GOTHIC 8.1 (QA) will be exposed. First, a small depiction of the
validation made by the code developers in terms of phenomenology captured in several experiments.
Second, a validation made by the author and some GOTHIC users that are necessary for the latter work
will be exposed, in this works the connection between the validation and the Thesis will be made.
4.2.2.1 GOTHIC Generic Validation
This section can be fully found in [45].
4.2.2.1.1 Conclusions on Generic Validation
Given the exposed results, and the comparison between the experiments and the simulations two
mayor conclusions can be extracted:
1. GOTHIC is perfectly able to predict the evolution in pressure in the different rooms of a large
enclosure in a blowdown situation or a light gas release. The LP approach is successful in this
exercises, as well as the subdivided models.
2. GOTHIC cannot reach an excellent accuracy when calculating convective-diffusive transported
variables such as temperature or gas concentration with the LP approach. To obtain the best results
the subdivided models provide a better performance. The counterpart is the excessive
computational cost this models require to run a long transient.

Models & Methods
82
Figure 4-1. General Overview of the IBE-3 configuration [117].
Figure 4-2. Initial molar fractions [117]

The GOTHIC Code
83
4.2.2.2 Author validation of the GOTHIC code
In this section the validation performed by the author to address some specific characteristics of
the Thesis will be made. The first validation exercise showed will be the benchmark exercise made at
PANDA facilities in PSI [89,136,137] (which later will become part of the GOTHIC 8.2 qualification Report,
[138]). This validation had to do with the stratification break-up of a hydrogen cloud inside a large
enclosure. The second validation will be the work presented in the GOTHIC advisory group [139] in the
European meeting in 2017. In addition, a detailed validation related to heat transfer made by the author
can be found in [140].
4.2.2.2.1 Stratification Break-up of a Hydrogen Cloud in a Large Enclosure Validation
The following section is an adaptation of the author’s publication, “Analysis of a gas stratification
break-up by a vertical jet using the GOTHIC code” [89], published in Nuclear Engineering and Design in
2016. It will describe the insights of the benchmark experiment, the different GOTHIC models used for its
simulation, the different sensitivities and finally the Parameter Influence Chart (PIC) of the simulation.
Experiment set up
PANDA (PAssive Nachwärmeabfuhr und Druckabbau test Anlag) was the chosen facility for the
experiment. PANDA consists of six vessels with thermal insulation and connections between each other
[141]. The IBE-3 only employs one of these vessels, which has 4 m diameter and 8 m height, Figure 4-1.
The PANDA vessel and the major internal penetrations/flanges are made from stainless steel. All external
surfaces have been insulated using two layers of rock wool, 100 mm thick each.
The test consisted of a helium injection from a vertical pipe placed inside the vessel. The experiment
had an outlet pipe at the bottom to maintain the pressure stable. Helium was used in this test because
the use of hydrogen is risky, and its behavior in terms of buoyancy and diffusion is similar to helium [96].
Prior to the injection, stratified air/helium conditions are created in the test vessel. A helium-rich
layer occupies the upper region. The measured helium, air and water vapor molar fractions at time t = 0
as a function of elevation are displayed in Figure 4-2. This figure was compiled from mass spectroscopy
measurements taken principally along the axis of the vessel. In addition to the internal injection pipe, there
are a number of penetrations and flanges projecting into the vessel.
The experiment was conducted under ambient conditions. The gases in the vessel (helium/air
mixture at the top, and air below) were initially at room temperature (20 ⁰C), however specific
temperatures for each height were also provided. The temperature of the injected air/helium mixture was
slightly above the room temperature, 23.0 ⁰C, and it raised to 29.3 ⁰C during the course of the test.
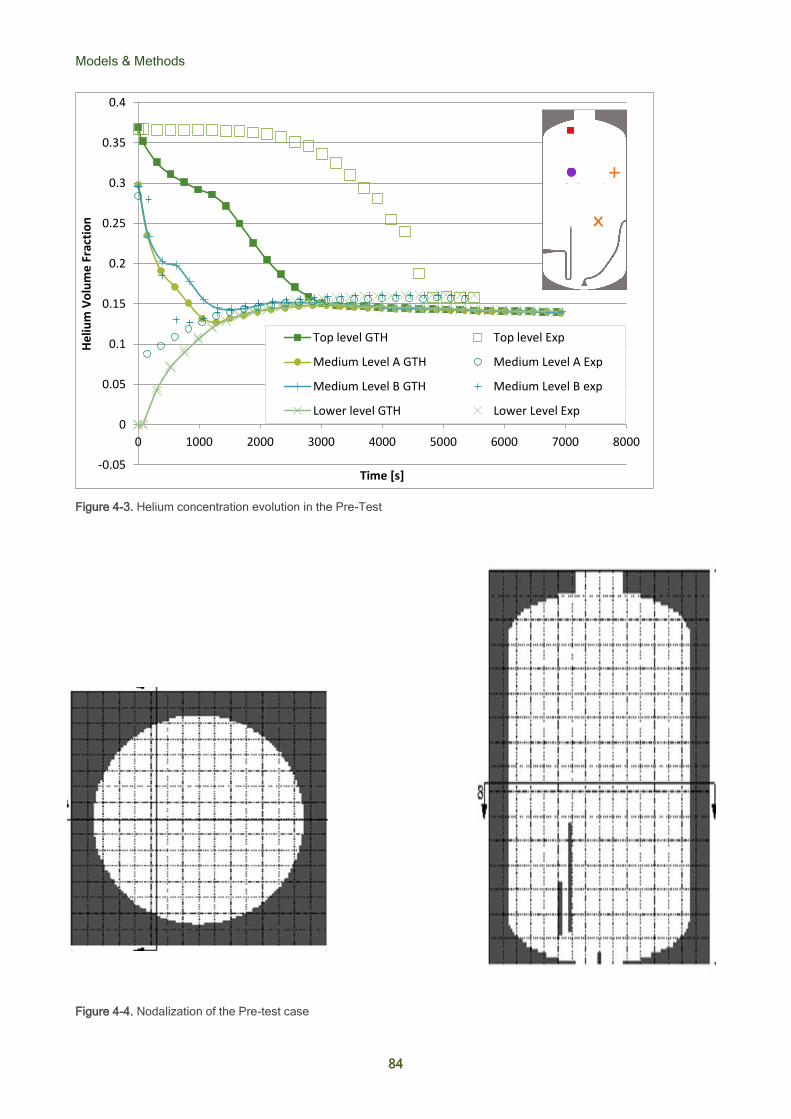
Models & Methods
84
Figure 4-3. Helium concentration evolution in the Pre-Test
Figure 4-4. Nodalization of the Pre-test case
-0.05
0
0.05
0.1
0.15
0.2
0.25
0.3
0.35
0.4
0 1000 2000 3000 4000 5000 6000 7000 8000
He
lium
Vo
lum
e F
ract
ion
Time [s]
Top level GTH Top level Exp
Medium Level A GTH Medium Level A Exp
Medium Level B GTH Medium Level B exp
Lower level GTH Lower Level Exp

The GOTHIC Code
85
When the jet reached the stratified layer, it interacted to it provoking erosion. The erosion destroyed
the stratification gradually. The jet did not penetrate the stratified layer but it made the interface lose mass
and to move upwards. This process ended when the interface reached the top of the vessel and all the
helium was well mixed in the whole vessel.
The erosion process was the main phenomenon of interest for simulations. A good indicator of this
phenomenon was the time when the helium concentration drops below 0.2 at different heights in the
injection line axis. It was used to score the simulations, as it was used in IBE-3. The simulation
phenomena are very sensitive because different modes of stratified layer erosion can occur depending
on the interaction of the jet with the interface; velocity, density, and diffusion coefficient affect the
simulation of the experiment.
This end-of-stratification is an important phenomenon to be predicted during an accident, because
the hydrogen risk is much lower if the hydrogen is totally mixed in the containment volume, compared to
a high concentration zone in the top of it, [39].
Base Case
The Base Case presented in this section was done after the results of the IBE-3 were released.
The prior simulation sent to the IBE-3 (User 45) clearly did not reach the expectations [117]. In that pre-
test simulation, the jet break up phenomena was captured, but the time of the stratification break up was
too early relative to the experimental data, see Figure 4-3. The main identified cause of those results was
that the mesh of the simulation was too coarse (Figure 4-4), especially near the He injection point. The
other two important causes identified were that the discretization scheme was First Order (FOUP) and
the heat transfer though the tank wall was not modeled.
The Helium drop score will be used to measure the accuracy of each simulation because it is a very
sensitive parameter. The score is obtained by calculating the absolute error of the time when the Helium
concentration drops below 0.2 in a fixed height, and then averaging with all heights.
After these results, the post-test model or Base Case was created, learning from the bad results
the pre-test simulation had.
Base Case Model
The first change from the pre-test to the post-test was the model nodalization. Base Case mesh
was necessarily fine enough to catch the relevant phenomena and to fit in the measurement points so no
interpolation errors are committed. The mesh had to be hexahedral, and to achieve the best resolution in
the measurement points a MATLAB mesher for GOTHIC was created for this project. The centroids of all
the cells fit exactly in the measurement points after three iterations of the mesher. The biggest refinement
was made at the injection height and at the stratified layer.

Models & Methods
86
Figure 4-5. Nodalization of the Base Case
Turbulence Model
Wall Heat Transfer
Diffusion Discretization
Scheme Max Time
Step Pressure Control
Pressure Convergence
Limit
k-ε standard No Yes BSOUP 0.1 s 68 kPa 1.00E-06
Table 2. Base Case parameters

The GOTHIC Code
87
The mesh created by the MATLAB mesher, kept the smoothness under 1.3 (that is, the volume
difference between adjacent cells is less than 30%). The created mesh is shown in Figure 4-5.
The total number of cells is 26901, with 21 grid lines in the X and in Y direction and 61 grid lines in
the Z direction. As there are some cells completely blocked, the number of active cells was approximately
24,000.
A second case with a finer mesh with 30000 cells was created to confirm the stability of the results
for minor changes in the nodalization. This second model approaches the code limitations and no finer
refinement could be made. However, the chosen mesh refinement for the base case, as found in GOTHIC
and PANDA literature, [46,47,114,115], has been demonstrated to be able to provide accurate solutions
for different light gas distribution phenomena.
The following parameter selection was assessed by prior studies found in the literature, [47]. The
turbulence model selected was the k-ε standard and the molecular diffusion was enabled. The minimum
porosity was set to 0.001. The minimum porosity is defined as the minimum cell volume or cell face
porosity that will be allowed in the model. If the calculated porosity is less than minimum porosity then the
cell or cell face will completely blocked with a porosity value of zero, see [45] for more details.
The matrix resolution was solved by the conjugate gradient method, the space differencing scheme
was second order and the flux variables were calculated up stream (BSOUP). The maximum time step
was set to 0.1 seconds and the minimum to 10-4 seconds. The time step is dynamic between this two
values and the solver uses controls to limit the errors by reducing the time step. The control for the
pressure change from one iteration to another was set to 68 kPa. If the change in these controls exceeds
a limit, the time step is reduced. Time step controls are the cell pressure change, the steam enthalpy
change or the CFL condition. The pressure convergence limit was set to 10-6 with a maximum number of
iterations of 20000.
In this model, the vessel was supposed to be adiabatic, according to the test specifications, thus
the heat transfer through the vessel walls was set to zero. A flow boundary condition at the pipe inlet and
a pressure boundary condition at the venting line completed the model. The total time of the simulation
was 6000 seconds. Table 3 summarizes the relevant parameters considered in the model.

Models & Methods
88
Figure 4-6. Evolution of the Helium Concentration in the Base Case (Post-test)
Figure 4-7. Helium Concentration in upper and lower neighborhood cells
0.000
0.050
0.100
0.150
0.200
0.250
0.300
0.350
0.400
0 1000 2000 3000 4000 5000 6000
He
lium
Vo
lum
e F
ract
ion
Time [s]
Upper level Exp Upper level GTH
Middle level Exp Middle level GTH
Middle-lower level Exp Middle lower level GTH
Lower level Exp Lower level GTH
0
0.05
0.1
0.15
0.2
0.25
0.3
0.35
0 1000 2000 3000 4000 5000 6000 7000
He
lium
Vo
lum
e F
ract
ion
Time [s]
Cell at height 6.05 m
Cell at height 5.9 m
Exp value at height 6 m
Exp value at height 5.9 m
Lower concentration
at a higher height

The GOTHIC Code
89
Base Case results
The objective of the Base Case was to create a base where the sensitivities will be made, and to
assure, as other authors have done before, that GOTHIC is able to correctly predict the stratified layer
erosion in a 3D model.
The Base Case took 26 hours of CPU time to run. The mass and energy imbalance of the simulation
were stable, 10-5 for energy and 10-6 for mass. The relative mass imbalance is the difference between the
total system mass calculated and the total system mass calculated from the initial system mass and the
net mass through the boundaries divided by the initial mass plus the total mass inflow to the system. The
energy imbalance is similarly defined. The time step oscillated from 0.035 to 0.038 seconds. The limiting
control in the time step was the Courant-Friedrich-Levy number.
The jet reaches the interface forming a fountain shaped perturbation. The kinetic energy of the jet
and the negatively buoyant forces that impeded the jet to penetrate the stratification layer, defined this
perturbation. The jet however eroded the interface and moved it up, until all the stratification disappeared
and the helium was well mixed in the vessel. When observing the timing of the helium concentration drop
in the experiment and in the GOTHIC results, Table 4, the simulation appears to be accurate. As
commented before, helium concentration drop is a very good indicator of the whole simulation, because
all phenomena are affecting it. To predict it correctly the simulation must be accurate in many fields. The
simulation had an average error of 7.4%; a good agreement with the experimental results was achieved
(see Table 4 and Figure 4-6).
Those results would have ranked in first position on the IBE-3 with a score of 127.1. The score is
calculated with the absolute error of the time that the helium concentration drops below 0.2 at a specific
height and then it is averaged with ten different heights, Table 4; the IBE-3 conductors consider it a very
representative score. This way the lower the score, the better the agreement between the simulation and
the experiment.
The mesh is fine enough to catch a curious phenomenon found in the experiments that the coarse
and unsmoothed mesh of the pre-test could not. Because of the jet penetration of the interface, the molar
fraction indicator located at 6.276 m dropped 0.2 before an indicator located at 6.184 m in the jet axis.
This was reproduced in the simulation as shown in Figure 4-7.

Models & Methods
90
Heigh (mm) Exp Time (s) GTH Time (s) Relative Error Absolute Error
6000 373.4 420.0 12.480 46.6
6092 584.9 555.0 5.112 29.9
6184 803.7 690.0 14.147 113.7
6276 797.4 870.0 9.105 72.6
6386 1016.5 1080.0 6.247 63.5
6496 1461.5 1350.0 7.629 111.5
6601 1680.5 1620.0 3.600 60.5
6706 1899.2 1905.0 0.305 5.8
6926 2570.0 2670.0 3.891 100
7478 4597.4 5265.0 14.521 667.6
Table 3. Time of the helium concentration drop below 0.2 in the Base Case
Figure 4-8. Temperatures in the Base Case (Post-test)

The GOTHIC Code
91
The major discrepancies in the simulation involve the temperatures, and in particular at the end of the
simulation, as shown in Figure 4-8. This lack of consistency is supposed to be because the heat transfer
through the vessel walls is not present. The major discrepancies in helium concentration occur at the end
of the simulation, when the erosion is highly delayed relative to the experiment. The diffusion, the helium
properties and different temperatures are involved. The thermal conduction through the vessel walls,
which was not modeled in the Base Case, was found to be necessary to correctly predict the temperature
evolution during the transient. This will be part of the sensitivities described below.
Sensitivity Analysis
Although the modeling of the IBE-3 was acceptable in the base case, a deeper understanding of
this modeling was needed. For this reason the sensitivity analysis was performed. The objective of the
sensitivity analysis is to obtain a whole picture of the relevant parameters of the simulation. Some
important parameters (shown in Table 3) were used in this part of the project. The Base case was used
to create all the sensitivities and its score on He drop (127.1) will be the main comparison.
Turbulence Model Sensitivity
The turbulence model is crucial because the mass and energy transfer is increased or disturbed by
turbulence. The k-ε model worked correctly for this phenomenon (Andreani, et al., 2012). Half of the
participants on the IBE-3 used k-ε models or variants.
There were four turbulence sensitivities:
TRB_1: k-ε RNG turbulence model
TRB_2: k-ε NG2 turbulence model
TRB_3: Mixing-length turbulence model
TRB_4: No turbulence model
The first case to evaluate will be the one with a k-ε RNG turbulence model (TRB_1). This is a k-ε
model with a Renormalized source Group. The mass and energy imbalance and the time step were not
altered with this turbulence model and the temperatures were the same as the Base Case. However, the
Helium behavior was different as this turbulence model increased the diffusion and turbulent momentum
transport and it provoked an overprediction of the erosion rate. The score of this simulation is 340.95 as
shown in the sensitivity summary (Figure 4-9).
The second turbulence model (TRB_2) used is the k-ε with a second order approximation of the
Reynolds stress term (k-ε NG2). The mass and energy imbalance were the same as the Base Case, but
the time step during the simulation was very different, it dropped to 0.02 seconds. This change in the
turbulence model provoked the worst simulation score: 1868. The simulation erosion rate was highly
delayed with this turbulence model. This underprediction of the erosion rate is related to the lower velocity
of the jet when it reaches the stratification, Figure 4-10.

Models & Methods
92
Figure 4-9. Time of Helium concentration drop below 0.2 at different heights for turbulence sensitivity
Figure 4-10. Velocity at height 5.9 m in the jet axis for turbulence sensitivity
-0.2
0
0.2
0.4
0.6
0.8
1
1.2
1.4
0 1000 2000 3000 4000 5000 6000 7000
Ve
loci
ty (
m/s
)
Time (s)
BaseCase
TRB_1
TRB_2
TRB_3
TRB_4

The GOTHIC Code
93
The third turbulence model chosen is the Mixing-length model (TRB_3). The mixing length used
was similar to the diameter of the injection pipe, the reference for this length is the one obtained from a
benchmark participant. The score of this model is 555.45, which was slightly more than the other
participant score. The mixing length turbulence model delays the beginning of the erosion, but once it has
started, an erosion process faster than the experiment is obtained.
Finally, the fourth turbulence, sensitivity TRB_4 used no turbulence model. This case was
surprising, because it provided better results than a case with turbulence model. The score of this
simulation is 675.4. This model has an advancement of the erosion front faster than the experiment and
the Base Case. This advance is because the turbulence reduces the velocity of the jet when it reaches
the stratification layer, as seen in Figure 4-10. This laminar sensitivity with an increase in this velocity
(convective transport), causes a considerable impact on the stratification layer break.
Heat transfer sensitivity
In this sensitivity, the heat transfer through the vessel walls was included in the model. In the Base
Case the walls were considered adiabatic, but the temperature measurements of the experiment proved
that this was not a valid assumption. If the temperature distribution is better modeled, then the He
properties will be calculated at the right temperature. Moreover, the density and viscosity of the He could
vary considerably with only a few degrees of difference. The vertical walls of the cylinder, the upper part
and the floor of the PANDA vessel were modeled as heat structures. The thermal conductors are one-
dimensional, and connect each cell in contact with the wall with an exterior boundary condition through a
thermal resistance. This boundary condition is a natural convection coefficient and an external
temperature. The vessel steel and the rock wool form the thermal resistance. The radiation is neglected
in the model.
In GOTHIC, different heat transfer correlations for the convection coefficient can be used. The sensitivities
were:
HTC_1: Vertical plate natural convection correlation 1
HTC_2: Vertical plate natural convection correlation 1 including forced convection correlation
HTC_3: Vertical plate natural convection correlation 2
The first simulation, HTC_1, scored 61.01, this was the most accurate simulation. The He
concentration drop fitted better in the entire simulation, and in particular, at the end of the simulation when
the temperatures were better predicted, as shown in Figure 4-11. The erosion rate agrees nearly perfectly
with the experimental data, Figure 4-12. In the Base Case, the major discrepancies in temperature
occurred at the end of the simulation, this higher discrepancy is responsible for the inaccuracy of the
helium concentration. When this temperature discrepancy is reduced, the global results are improved.

Models & Methods
94
Figure 4-11. Temperature in sensitivity HTC_1
Figure 4-12. Time of Helium concentration drop below 0.2 at different heights for heat transfer sensitivity

The GOTHIC Code
95
The rest of the sensitivities (HTC_2, HTC_3) have small differences between each other, they
scored 62.7 and 61.01 respectively, Figure 4-12. These results show that the heat transfer is a process
that should not be neglected. However, once it is modeled, the differences between GOTHIC heat transfer
models does not significantly impact the He distribution.
Molecular Diffusion sensitivity
GOTHIC has the option to enable or disable the molecular diffusion, an additional term in the
diffusion coefficient. In this sensitivity, the molecular diffusion was turned off. However, the turbulence
diffusion was still present, as well as the numerical diffusion. The score of this simulation was 216.47,
which represents a good agreement with the data. This could mean, taking also into account the results
of the previous section, that the total diffusion is dominated by the turbulent diffusion, not by the molecular
diffusion. The erosion rate, due to the smaller diffusion coefficient, is delayed relative to the experiment
and the Base Case.
Discretization Scheme sensitivity
The discretization scheme used in the Base Case is the Bounded Second Order and Up Wind
(BSOUP). This method reduces the numerical errors with a penalty of time compared to the First Order
Up Wind (FOUP) scheme used in this sensitivity. The computational resources used are lower than the
Base Case.
The FOUP method increases the numerical diffusion so the erosion rate at the beginning of the
simulation is accelerated and the jet penetration in the stratified layer is higher. However, at the end of
the simulation, this sensitivity erosion rate, as the Base Case, is delayed. It could be argued that this is
because the diffusion is not the dominant phenomenon, or at least numerical and molecular diffusion as
seen in Sensitivity 5.3. The score of the simulation is 254.4.
Maximum time step sensitivity
GOTHIC has a correction algorithm for the time step. The time step is reduced if some controls are
exceeded, e.g. CFL number, the total pressure change, a specific turbulent time or a steam enthalpy
change. The algorithm corrects the time step for the next step, which means that in this time step the error
is accumulated. To stabilize the time step, the max time step is to set step lower time step than the
minimum value obtained. In the Base Case the time step oscillates between 0.038 and 0.035 seconds so
the following sensitivities were made:
DTM_1: Maximum time step: 0.034 seconds
DTM_2: Maximum time step: 0.02 seconds
DTM_3: Maximum time step: 0.015 seconds
DTM_4: Maximum time step: 0.01 seconds

Models & Methods
96
Figure 4-13. Helium Volume Fraction at top and bottom heights for maximum time step sensitivity
Turbulence Model
Heat Transfer
Diffusion
Discretization Scheme
Max Time Step
Pressure Convergence Limit
k-ε standard Yes Yes BSOUP 0.1 s 1.00E-05
Table 4. Recommended parameters for a light gas distribution with GOTHIC
The GOTHIC Code
97
In all sensitivities, the time step started to rise until it reached the maximum time step. Then the
time step remained constant until the end of the simulation. The mass and energy imbalance in the Base
Case reached 4.3 10-5 for energy, and 2.9 10-6 for mass. When decreasing the maximum time step, the
energy residual gets worse and the mass residual is improved. DTM_4 reached 4.7 10-5 for the energy
residual and 6 10-7 for the mass residual. There was a smooth transition between those values among
the sensitivities. These changes in the mass and energy imbalance affect the Helium concentration, as it
shown in Figure 4-13. The Base Case score was better than the sensitivities, which scored 220, 271, 301
and 307 respectively. The sensitivities DTM_3 and DTM_4 were almost similar, as shown in Figure 4-13,
so it could be argued that a time step independent solution was achieved. However, this solution was not
the most accurate. It was possible that a compensating error phenomenon was occurring. This will be
investigated in later sections. However, the discrepancies at the end of the simulation, are caused by
neglecting the heat transfer though the vessel walls, as seen in sensitivity 5.2.
Pressure convergence limit sensitivity
The pressure convergence limit is the control imposed on the algorithm used in the convergence of
the conservation equation solutions. This simulation could have an impact similar to the time step
sensitivity, because a numerical error will be induced in the solution. The Base Case has a pressure
convergence limit of 10-6. Two sensitivities were made:
PCN_1: Pressure convergence limit: 10-5
PCN_2: Pressure convergence limit 10-4
The score of the first simulation (PCN_1) is 127.17. It behaved the same as the Base Case. No
differences were observed in this simulation, the mass and energy imbalance, time step and He
concentration in the vessel were identical to the Base Case. The second simulation (PCN_2), changed
slightly more, but the changes were almost inappreciable. The score of the second sensitivity was 128.32,
so it could be argued that these parameters have little influence on the main results. Simulation PCN_1
and PCN_2 needed less computational resources than the Base Case, reducing the CPU time.
Sensitivity analyses conclusions
After all sensitivities were made, the best combination of parameters can be inferred but in order to
achieve robust conclusions an extra simulation was made. The extra simulation had the heat transfer
modeled and a maximum time step of 0.01 seconds. This simulation was made in order to isolate errors
in the maximum time step sensitivities. This simulation has the same mass and energy imbalance as
DTM_4, and its score was 214.1.

Models & Methods
98
Figure 4-14. PIC of a light gas distribution with GOTHIC
Parameter Renormalized PI
Turbulence model 47.83 %
Heat transfer 2.87 %
Molecular Diffusion 7.59%
Discretization Scheme 15.33%
Maximum time step 8.27%
Pressure Convergence Limit
2.88%
Table 5 Renormalized PI of simulation of a light gas distribution with GOTHIC

The GOTHIC Code
99
Therefore, it was believed that the code control limits for the time step are not only good to perform
a simulation, but also sometimes better than user-imposed controls. This could be because if the time
step is reduced, but the error created in each time step is not significantly reduced, a greater number of
time steps, will lead to a greater total error.
The phenomena related to the experiment were very difficult to simulate, so if the simulation terms
are changed to an easier phenomena or configuration, probably the precautions taken in this simulation
will be valid for the easiest configuration.
Based on the sensitivities, the parameters that can provide an accurate simulation are shown in
Table 5.
The Parameter Influence Chart
The sensitivity analyses have provided information to perform a parameter influence analysis. This
analysis could be very useful for CFD users as it indicates which parameters are the most influential. For
this reason, the Parameter Influence Chart, (hereinafter PIC) is designed. It is influenced by the Morris
method philosophy, of single-input change analysis [142]. The PIC allows the user to observe the
influence of all the parameters elected in the simulation results. The PIC is a graphic that displays the
parameter influence for a certain code and for specific phenomena simulation (E.g. GOTHIC and
hydrogen distribution or ANSYS FLUENT and combustion of gasoline... etc.) It can provide knowledge
on how much carefulness must be taken in the parameters election.
The variable evaluated in the PIC is the parameter influence (hereinafter PI) and it was designed
following this formula:
𝑃𝐼 =∑ 𝐸𝑟(𝑖)𝑁
𝑖=1
𝑁+
∑ ∑ 𝐸𝑟(𝑖, 𝑗)𝑁𝑗>𝑖
𝑁𝑖=1
𝑁 · (𝑁 − 1) · 0.5
Er(i) is the sensitivity "i " relative error. Er(i,j) is the relative error from one sensitivity to another and
N is the number of sensitivities. So for example, in the PI of the turbulence model N would be equal to 5,
and Er(i) and Er(i,j) are the average of the 10 comparisons (which correspond to the 10 score locations).
This formula takes into account the importance of the parameter itself and it also takes in to account any
differences between the parameter values.
𝐸𝑟(𝑖) =|𝑆𝑖𝑚(𝑖) − 𝐸𝑥𝑝|
𝐸𝑥𝑝 ; 𝐸𝑟(𝑖, 𝑗) =
|𝑆𝑖𝑚(𝑖) − 𝑆𝑖𝑚(𝑗)|
𝐸𝑥𝑝
For example, if a parameter value provides a solution that does not agree with the experimental
data and when that parameter is changed, the solution does not vary considerably, the influence of the
parameter will be medium because even though the simulation is not accurate, the calibration of this
parameter will not help in achieving a better solution. If the election of a parameter is critical, only one
value makes a good solution and the rest are far from it, then the PI will be high because there will be big
(10)
(11)

Models & Methods
100
differences between most of the solutions and the experimental data and also big differences when
comparing solutions.
PIC of a light gas distribution with GOTHIC
When applying the concept of the PIC to a light gas distribution with GOTHIC it is possible to
observe that the most influential parameters are the turbulence model, and the discretization scheme.
Less influential are the heat transfer model and the pressure convergence limit. The molecular diffusion
and the maximum time step have a medium influence on the global simulation. The simulation has a
strong dependence on the physics models used, but also a medium dependence on the solver
parameters. All sensitivities are summarized in Figure 4-14.
If the PI is normalized to a percentage, then, for example, it is possible to obtain the percent of time
that is worth spending on the selection of each parameter, see Table 5. In this simulation it is not worth
spending much time in the pressure convergence limit, although it is worth spending in the turbulence
model.
PIC reliability
For some commercial CFD codes, the CPU time required for some experiments is excessive. In
this aspect, the PIC can include a reliability factor to be able to run several sensitivities in a reasonable
time. This reliability factor takes in to account the total time of the experiment and the simulation time.
The reliability follows the following formula:
𝑅 =𝑡𝑠𝑖𝑚
2
𝑡𝑒𝑥𝑝2
If a sensitivity only simulates the first 1000 seconds of a 10000 seconds simulation the reliability of
the PIC will be lower. The reliability should also include the specific phenomena the experiment is trying
to reproduce. For example, an experiment lasts 1000 seconds, but the phenomena that experimentalists
want to observe occur only beyond 500 seconds. A PIC of the first 300 seconds of the experiment will
have zero reliability because the reliability time used in the formula must take into account only the time
when the phenomena that the experimentalist want to observe, occur. The PIC of the present research
has a reliability of one.
PIC recommendations
As an instruction guide for the creation of a PIC for certain simulations and for certain codes the
following advice is given:
1. A complex experiment of a certain phenomenon should be chosen to create the PIC, because if
these phenomena are not complex enough maybe later simulations will not behave as thought
relative to their sensitivities. When a simulation achieves a certain level of accuracy that
(
(12)

The GOTHIC Code
101
simulation can be taken as the first Base Case. If no simulation is accurate, the PIC could not be
made.
2. A wide range of sensitivities must be made including all parameters that could be varied. The
sensitivities should not include parameters a commercial user cannot change. If the parameter
change in the sensitivity is not discrete (e.g. turbulence model), and it is a continuous parameter
(e.g. maximum time step) the values for each sensitivity should be chosen carefully, not making
more sensitivities than necessary and seeking for a value that reaches the parameter-
independent solution.
3. When the sensitivities are done, the PI of each sensitivity can be calculated. The measurement
time, locations and values for comparing each simulation with the experiment and between each
other should be as accurate and representative as possible.
4. The PI's of the simulation compose the PIC. The PI's more related to each other should be put
together so the PIC "flavor" is shown. (E.g. physics parameters, solver parameters, etc.) The
simulation then is easily shown as solver or physics dependent.
5. A PIC can be extended to other similar simulations if the phenomenology present and the
conditions are similar. Using a PIC for a simulation with different phenomenology could lead to
unfortunate effects.
6. Finally, the PIC developers can reveal recommendations for the parameter choice they have
found most accurate in the sensitivities task.
Conclusions of the IBE-3
The IBE-3 experiment has been reproduced correctly with the GOTHIC 8.0 code. Mesh refinement
and smoothness should be carefully made in order to obtain accurate results as confirmed in the pre-test
to post-test changes and also in (Andreani et al., 2012). The Base Case model provided good results,
and the sensitivity analysis is a necessary step to understand the behavior of the simulation. In this work,
the results indicate that the convection is a dominant phenomenon as shown in sensitivities 5.1, 5.3 and
5.4, and that the heat transfer cannot be neglected.
A parametric study of an experiment simulation was found necessary to truly understand the
phenomena and the code behavior. According to the results of this work, the best parameter combination
for a simulation of a light gas distribution with GOTHIC is the following:
The turbulence model with best results is the standard k-ɛ.
The heat transfer should be included with a correlation for natural convection.
The molecular diffusion should be included.
The discretization scheme with best results is the BSOUP.
The pressure convergence limit could be 10-5 in order to reduce the simulation run time.
The Parameter Influence Chart is a useful tool to assess the importance and influence of the
simulation parameters. It is very helpful in evaluating the time that should be spent in the parameter
choosing, or to evaluate the error that may be committed when using a certain parameter. The PIC of the

Models & Methods
102
GOTHIC code when simulating a light gas distribution reveals that the most influential parameters are the
turbulence model, the control volume hydraulic diameter and the discretization scheme, the less
influential are the heat transfer model and the pressure convergence limit.
The future works start with a wide range of light gas distribution simulations with GOTHIC. Now
those simulations will be easy to perform thanks to the PIC already made. Secondly, the concept of the
PIC could be exploited, the PIC of many simulations could be made, and a repository of PIC's containing
the code and the simulation could be defined. This repository could help with future projects and will make
the work much easier.

The GOTHIC Code
103
4.2.2.2.2 Mesh Sensitivity to a M & E Release in a Full Containment
In this section a mesh sensitivity is made for the analysis of a LBLOCA in a PWR-W containment.
A mesh refinement is something completely necessary in the CFD field, because of the assumed
accuracy of theses simulations. There are several quotes that summarize the authors’ opinion on the field,
in words of some CFD masters:
“The very important point, independent of the semantics, is that use of a verified code is not
enough. This point is probably well recognized by present readers, but it is not universally so.
Especially in the commercial CFD arena, user expectations are often that the purchase and use of a
‘really good code׳ will remove from the user the obligation of ‘doing his homework’, that is, the
straightforward but tedious work of verification of calculations via systematic grid-convergence
studies. This unrealistic hope is sometimes encouraged by advertising.”
- P.J. Roache, [143].
“The frequently heard argument ‘any solution is better than none’ can be dangerous in the
extreme. The greatest disaster one can encounter in computation is not instability or lack of
convergence but results that are simultaneously good enough to be believable but bad enough to
cause trouble.”
- Ferziger and Peric, [144].
“The judicial presumption of innocence does not hold in CFD. CFD results are wrong until
proven otherwise.”
- Bert Blocken, [145].
“If CFD codes are used as black boxes that, after pushing a couple buttons, vomit colored
results which are supposed correct, this science discipline will become a pseudoscience where the
ability of showing and selling the results will influence the validation of those, converting the
acceptance decision in just a matter of faith”
- Thesis Author
This analysis is made in order to confirm that the solutions are monotonic at some point of mesh
refinement, even though there are several phenomena involved. The model used is the multi-zone model
described in [146,147]. This is a PWR-W containment with a M&E release. The present work is an
adaptation of the publication made by the author and colleagues [139].
The different meshes used can be seen in Table 6. In this table the different cell size in meters is
showed as well as the number of cells of each model. The CPU time is the time needed in a machine of
8 cores of 2.6 GHz each for a 1000 seconds simulation. The numerical scheme of all simulations is
FLSOUP. All cells of the model are hexahedral. The refinement is made with an scale two, to follow an
adequate refinement ratio, [148].

Models & Methods
104
Model Cell size Aspect Ratio
Cell Num
CPU Time [h]
M1 5x5x5 1 1829 1.33
M2 5x5x2.5 2 3366 2.66
M3 5x5x1.25 4 6732 144.00
M4 2.5x2.5x5 2 7316 8.70
M5 2.5x2.5x2.5 1 13464 6.81
M6 1.25x1.25x5 4 29264 178.09
M7 1.25x1.25x2.5 2 60336 107.61
M8 1.25x1.25x1.25 1 107712 215.30
M9 2.5x2.5x1.25 2 26928 144.00
M10 5x5x5 (v2s 2.5m) 2 2321 11.45
M11 5x5x5 (v2s 1.25m) 4 6353 5.25
M12 2.5x2.5x2.5 (v2s 1.25m) 2 17496 85.00
Table 6. Mesh sensitivity analysis parameters and results

The GOTHIC Code
105
The results in the following figures show that in terms of pressure the difference are very small, see
Figure 4-15. This is consequent with the conclusions obtained in Section 4.2.2.1.1; the pressure is well
calculated even with a LP approach. The mesh-independent solution is somehow achieved after a
refinement. The solution has a positive slope in terms of pressure, this means more refinement, implies
a more conservative model.
In terms of average room temperature, it has been previously shown that a LP approach is not
capable of obtaining results with a good accuracy. As shown in the following figures, with a cell size of
5x5x5 meters the solution is very accurate in almost all locations with a difference below 10 %. The mayor
differences occur during a small period of time in the SGC 3, with a difference between values of almost
20%. This results show that if temperature is the target variable, a cell size of 2.5 meters is enough to
capture it with an adequate accuracy. It is also shown that if the maximum accuracy is required, the more
refinement the better.
In terms of maximum temperature, strong differences between models are found and maintained
during long periods of time, see Figure 4-20. This is somehow expected given that a smaller cell can
achieve more temperature easily than a bigger cell, because less amount of hot mass must be heated or
transported. In this aspect, if the maximum temperature of a room is the target variable, the model should
be refined at maximum.

Models & Methods
106
Figure 4-15. Pressure results of the mesh sensitivity analysis in SG1 cage
Figure 4-16. Temperature results of the mesh sensitivity analysis in SG1 cage

The GOTHIC Code
107
Figure 4-17. Temperature results of the mesh sensitivity analysis in SG2 cage
Figure 4-18. Temperature results of the mesh sensitivity analysis in SG3 cage

Models & Methods
108
Figure 4-19. Temperature results of the mesh sensitivity analysis in the annulus and dome
Figure 4-20. Maximum temperature results of the mesh sensitivity analysis in SG1 cage

The GOTHIC Code
109
As a conclusion of the mesh sensitivity analysis it could the following statements are proposed:
1. If the target variable of the simulation is the pressure, the LP approach is totally capable of
providing adequate results. The computational cost of this approach is almost unappreciable and
this will lead to computer resources optimization.
2. If the target variable of the simulation are the transport of variables such as temperature or gas
concentration, the subdivided model is the best choice for this purpose. A cell size of 5 meters is
capable of obtaining reasonable results with an adequate computational cost. A balance should
be made between accuracy and computational cost in order to optimize resources.
3. If the target variable of the simulation is the maximum temperature, the subdivided model is the
only option for this purpose. Between the subdivided models, the most refined should be used,
given that temperature is a cell value, and the smaller the cell, the easiest will be heat it up; more
easily than a bigger cell.

Models & Methods
110
Figure 4-21. AP1000 containment nodalization with MELCOR, [42]

The MELCOR Code
111
4.3 The MELCOR Code
In this section, the MELCOR (Methods for Estimation of Leakages and Consequences of Release)
code will be shortly depicted. Its mayor features will be commented, as well as part of its validation. The
MELCOR code has been used in this Thesis to provide the M&E release input for the containment.
However, this input data has been obtained by the UPM research Group. This is the reason why this
chapter length is not as extended as the previous Section; 4.2 “The GOTHIC Code”.
Concerning the MELCOR code, it has been developed for in-vessel and ex-vessel transient
analyses. The code contains models that allow simulating all the phenomena that could occur during a
SA in light water reactors, from the initiating event, leading to the release of fission products outside the
containment, and their behavior within the reactor coolant system and containment building. The flexible
nodalization of the reactor coolant system allows the simulation of different types of LWRs, such as PWR,
BWR or WWER. The code consists of different packages describing the relevant phenomena in the case
of a severe accident. Control functions increase the flexibility with respect to simulations of auxiliary
systems as well as the output information, [81,149,150].
MELCOR Capabilities
MELCOR is capable of predicting the hydrogen generation during a SA, including Zr-steam
reaction, Fe oxidation, and B4C oxidation for the “rod-like” geometry and in the “late phase” configuration.
The code also includes ex-vessel generation due to MCCI and DCH phenomena [20].
MELCOR uses a one dimensional model for transport process, including non-condensable gases
and water. The hydrogen distribution related phenomena that are modelled in MELCOR are: pressure
driven flows: natural circulation flow; buoyancy driven exchange gas flow through a single junction through
flows between containment nodes; use of control volume nodes to simulate global/regional concentration
gradients (stratification); and phase change due to flashing, rainout, boiling of water pool, steam/water
absorption, spray droplet evaporation or steam condensation. With this capabilities MELCOR can
simulate even complex containment phenomena such as AP1000 containment response to a DBA or SA,
see Figure 4-21.
MELCOR models the combustion of gases in control volumes. The bulk burn models (deflagrations)
consider the effects of burning premixed gases without modelling the actual reaction kinetics or tracking
the actual flame front propagation. A simple diffusion flame model allows for the burning of hydrogen-rich
mixtures upon entry into volumes containing oxygen. Deflagrations events take place if the gas
concentration in a control, volume satisfies Le Chatelier’s principle. The combustion rate is determined
by the flame speed, the volume characteristic dimension, and the combustion completeness. The flame
speed and combustion completeness can each be input as constant values, or they may be calculated
from user-defined control functions or the default empirical correlations. For user convenience, print
messages are used to warn the user when the flammability criterion is satisfied in a control volume.
However, only deflagrations are modelled; detonations are merely flagged, [151].
Models & Methods
112
MELCOR has models for most of the containment safety systems that are related to hydrogen
mitigation, such as recombiners; ignition from PARs; glow plug type igniters; filtered venting; fan coolers;
and dousing spray.
MELCOR code is considered a reference code for SA analysis. It has reached a reasonably high
level of maturity over the years as evidenced by its wide acceptability and its broad range of applications
in regulatory decision support. Nevertheless, it is important to recognize the phenomenological
uncertainties in MELCOR and their significance results. Moreover, it is important to understand the
compounding effect of various uncertainties on the ultimate parameter of interest (e.g. source term) for
all practical purposes. Some of the more important uncertainties are associated with in-vessel melt
progression modelling. MELCOR lacks a mechanistic model for evaluating fuel mechanical response to
the effects of clad oxidation, material interactions, Zircaloy melting, fuel swelling and other processes that
occur at very high temperatures.
As in the case of in-vessel melt progression, the ex-vessel phenomenological modelling is based
on experiments which were conducted to gain an understanding of melt spreading on the floor, debris
quenching in presence of water, and molten core-concrete interaction, among others. These uncertainties
are currently captured in MELCOR in a parametric manner.
MELCOR Verification & Validation
Within the group of integral codes, MELCOR is used worldwide by many organizations not only for
validation work but also for plant analyses. The information exchange between the different users is
managed annually by user group meetings such as the EMUG. The uncertainties of the code for analyses
of different severe accident scenarios in LWRs are known within the user group, and based on this
knowledge, experienced users are able to perform reliable plant analyses and to give an indication of the
related uncertainties,
The code developer performed validations of hydrogen distribution against the containment natural
circulation tests, for instant, selected tests from HDR E11.2 (ISP-29) and NUPEC M-7-1 (ISP-35)
experimental programs. The MELCOR model provides a reasonable representation of the containment
response under both natural circulation and forced flow conditions. [152,153]
Developer performed code validation with respect to hydrogen combustion against the
experimental data from Nevada Test Site and the TMI hydrogen burn event. The empirical combustion
models were derived from small scale experimental data, for example, FITS and VGES.
The validation analysis for safety systems was performed by the code developers against vendor
data. For example, a model that calculated heat removal and steam condensation rates of PWR fan
coolers; or, validation studies of spray performance against steam dousing tests to analyzed the spray
heat transfer rates.
Regarding generation of hydrogen, the MELCOR code developer has performed numerous
validation assessments using results from integral tests, such as Phebus FPT-1 & FPT-4, Phebus-B9,
The MELCOR Code
113
CORA-13, Quench-6, LOFT LP-FP-2, and PBF-SFD 1-4. Overall, MELCOR 1.8.6 & 2.1 provide a
reasonable representation of hydrogen generation for these tests [154]. However, it has been noted that
MELCOR 1.8.6 underestimates the hydrogen generation burst during reflood that was observed in CORA-
13 though recent improvement to the modelling of oxidation of submerged surfaces in MELCOR 2.1 has
demonstrated significant improvement in this regard. Furthermore, MELCOR 1.8.6 has been validated
against the TMI-2 accident where the core is severely damaged and hydrogen generation is complicated
by the process of fuel degradation and blockage of steam flow. MELCOR 1.8.6 underestimates the total
hydrogen generation, though again, it is believed that this may be due to the hydrogen generation burst
from submerged surfaces during the restart of the RCP 2B pump,[155].

Models & Methods
114
4.4 The ProTON Code
In this section the ProTON (Procesador Termohidráulico de Operaciones Nucleares) code will be
described, as well as the mayor features created and used for the Thesis. ProTON is a post processor for
the GOTHIC results data that operates in a MATLAB environment [156].
This code has been written by this Thesis author, in collaboration with Daniel Justo and Daniel
Calvo at Universidad Politécnica de Madrid (UPM). Bug-fixing has been also made by Samanta Estévez,
Zuriñe Goñi and Rafael Bocangera. The versions of the code used for this Thesis are ProTON_v7 and its
later evolution ProTON_v8.
ProTON Capabilities
As stated before, ProTON was a tool totally required for the development of the present work as
well as for any study that want to observe room-averaged values in a subdivided GOTHIC model. This is
because the post-processing in GOTHIC does not allow all the features needed.
ProTON can work with models that have a single subdivided control volume as well as with models
with several control volumes. In the actual version, the user has to define what type of model ProTON is
analyzing.
4.4.1.1 Room-averaged Values
The first need is to divide a 3D containment model into its different rooms or compartments and
show in an easy way the main behavior of the variables inside that room (pressure, temperature, gas
volume fraction …etc.) ProTON is able to provide averaged values per room in of a simulation transient.
To obtain the room averaged values the code follows the following steps:
1. This averaging is made in a volumetric form. First, the porosity and total volume of all cells of the
model are obtained from the file .SOT that is generated when the simulation runs. This values are
multiplied and stored inside a matrix in a position correspondent to the cell number. This values
are multiplied to obtain the net free volume of all the cells of the model.
2. Every room the user wants to analyze has to be defined. Rooms are defined by the number of the
cells that compounds it. ProTON stores which room number corresponds to what group of cells.
3. ProTON imports all the simulation data. Then, concerning a certain room, the values that the user
want to analyze are multiplied by the net free volume of the correspondent cell (flow properties
should not be analyzed this way, because they are not calculated in the cell center, but in the cell
faces).
4. All the values previously calculated (multiplied by the cell net free volume) that belong to a certain
room are added up into a single value.
5. This single value is divided by the total net free volume of the room to obtain the volume-averaged
value.

The ProTON Code
115
6. All this values are written into a .txt file and all graphs of the target values are printed and stored
in a created folder.
7. If another room is selected to be analyzed, the algorithm starts again.
It is necessary to make a volume average because otherwise the different cell size would lead to
an inadequate averaging of a variable. A small cell of 1 m3 would have the same weight as one with 100
m3; this is obviously unacceptable. In addition, it is worth commenting that the higher the number of rooms
analyzed the more information is extracted from the model. It is better to subdivide a big room into two or
three smaller rooms to obtain a more detailed evolution of the target variables.
4.4.1.2 Maximum Room Values
Proton has the capability of calculating the maximum values per room of certain variable during the
whole transient. This is made in a similar way as the acquirement of the room-averaged values. In this
case, the values are not volume averaged, because the target variable is the maximum value of certain
variable, and the value itself provides this information.
To obtain the maximum values the code follows the following steps:
1. Every room the user wants to analyze has to be defined. Rooms are defined by the number of the
cells that compounds it. ProTON stores which room number corresponds to what group of cells.
2. ProTON imports all the simulation data and every value of the room cells is compared one with
another with an algorithm implemented in MATLAB. The maximum value obtained is stored
3. The process is repeated every time step of the simulation
4. The temporal evolution of the maximum values of the room are written into a .txt file and all graphs
of the target values are printed and stored in a created folder.
5. If another room is selected to be analyzed, the algorithm starts again.
In this case, the smaller the cell size, the better, because all data can be obtained in a more accurate
way, given that the cell value that GOTHIC provides is the space averaged value (GOTHIC uses the finite
volume method for the discretization).
4.4.1.3 Room Thermal Conductors Behavior
An extra feature added to ProTON was ProTON-Cond. The thermal conductor information is hard
to obtain from GOTHIC post-processor and this requires to create ProTON-Cond. With this feature the
thermal conductors’ parameters (such as heat rate or heat transfer coefficient) can be globally analyzed,
as well as locally in every room.
To obtain the thermal conductors values the code follows the following steps:
1. Every room the user wants to analyze has to be defined. Rooms are defined by the number of the
cells that compounds it. ProTON stores which room number corresponds to what group of cells.
2. ProTON searches in the .SOT file all the thermal conductors’ data and stores it.

Models & Methods
116
3. At the first time step ProTON compares one value with another within the room cells, and obtains
maximums, minimums and averaged values of the thermal conductors’ parameters.
4. The temporal evolution of the maximum and/or averaged values of the room are written into a .txt
file and all graphs of the target values are printed and stored in a created folder.
5. If another room is selected to be analyzed, the algorithm starts again.
Tanks to ProTON-Cond, the behavior of thermal conductors that represents equipment inside a
room can be tracked and monitored in an easy way.
4.4.1.4 Hydrogen Flammability Limits
There are examples of simulations that deal with the flammability, sigma and lambda criteria, [78],
however it is not simple to conjugate hydrogen risk and make a room analysis, to follow some local
damage criteria. Local damage criteria, referred as hydrogen risk evaluated in a single room was
introduced by Sherman and Berman in [82]. In this study every room was assessed with the lambda
criteria, but in the later literature this room-separation approach is not used extensively. In this Thesis,
the ideas from Sherman and Berman are re-introduced with the additional increase in computer capability
and hydrogen risk criteria. Different room analysis, with different hydrogen flammability criteria will be the
core of creating a complete local damage criteria under hydrogen conditions in a NPP during a severe
accident.
In addition, there are some efforts found in Dorofeev 2007, [157] to evaluate the damage provoked
by a hydrogen combustion in a large scale. Dorofeev proposes the Blast Damage Criteria, which varies
from total destruction of buildings to border of minor structural damage. It was seen that the parameters
affecting this damage are the flame speed and the amount of hydrogen (in kg). This will be taken in to
account to create the parameter Tau that will help in differentiating hydrogen risks on different Rooms.
This parameter will be fully explained later in Section 6.3.1 “The Tau Parameter, (τ)”.
ProTON_v8 has the capability of obtaining if a cell of the model is under SD, FA or DDT conditions.
This is made through the flammability limits, the sigma criterion and the lambda criterion.
All these criteria rely on cell values, so they can be calculated for each cell with a special attention
to the lambda criterion that uses the characteristic length of the room.
The flammability limits used for the SD limits is adapted to the data and works of [74,76]. Seen in
Section 2.2.2 “Hydrogen Flammability”.
𝑋𝐻2 > 0.037 + 0.011 · 𝑋𝐻2𝑂 − 0.0000416 · (𝑇 − 373)
𝑋𝐻2 < 0.772 + 1.087 · 𝑋𝐻2𝑂 + 0.000271 · (𝑇 − 373)
𝑋𝐻2𝑂 < 0.63 + 0.0003 · (𝑇 − 373)
𝑋𝑂2 > 0.01
(13)

The ProTON Code
117
Where X is the gas volume fraction of the species, and T is the temperature in K. This limits are
calculated on each cell and if they are surpassed a flag variable is set to the number 1, indicating that at
that time step, in that cell, the SD is possible.
If the flag variable is at value 1, the code analyzes if the cell is also under FA conditions, surpassing
the Sigma criterion. This criterion calculates the activation energy and the density of the “possible” burned
mixture based on the works of FZK and KI, [77,79].
𝛷 = 𝑋𝐻2
2 · 𝑋𝑂2
𝐸𝑎 = 7730 − 406 · 𝛷 + 89.6 · 𝛷2 − 0.432 · 𝛷4
𝜎∗ = 0.000009 · (𝐸𝑎
𝑇)
3
− 0.0019 · (𝐸𝑎
𝑇)
2
+ 0.1807 (𝐸𝑎
𝑇)
1
+ 0.2314
𝜎 = 𝜌𝑢
𝜌𝑏
𝑖𝜎 = 𝜎
𝜎∗
Where the subscript u stands for unburned, and b for burned. To calculate the values of the burned
mixture, it is assumed to combust completely through an adiabatic isobaric process being all species ideal
gases. If the sigma index is higher than 0.92 a FA combustion is possible. In this case, the flag variable
will be set to 2. Even though this is not a rigorous application of the σ criterion, it is an indicator of the
mixture sensitivity and a conservative way to reduce the uncertainties of the room limits and gradients.
This implementation is extracted from [78].
If the flag variable is at value 2, the code also analyzes if the cell is also under DDT conditions,
surpassing the Lambda criterion. This criterion predicts a DDT situation and is based on the works of KI,
[158]. The results are evaluated on each containment room and if the lambda criterion is satisfied, the
flag variable of those cells turns into 3.
(18)
(17)
(16)
(15)
(14)

Models & Methods
118
Name Value Comments
A Dry hydrogen concentration
In % vol dry
B Initial temperature In Kelvin
C Steam
concentration In % vol
D initial pressure In MPa
λ Cell size In cm
Table 7. Variables nomenclature equivalence for lambda calculation
Name Value Name Value
a -1.13331 h 8.74995·10-4
b 45.9807 i -0.0407641
c -0.15765 j 331.162
d 0.0565429 k -418.215
e 3.5962·10-7 m 2.3897
f 0.997468 n -8.42378
g -0.0266646
Table 8. Constants nomenclature equivalence for lambda calculation

The ProTON Code
119
log(𝜆) = [𝑎 − 𝑚 + (𝑏
(𝐴 −𝑘𝑏
)𝑓 + ℎ · (𝐴 − 𝑔 · 𝐵)2 + 𝑖 · (𝐴 − 𝑔 · 𝐵)) ·
𝑗 · (1 + 𝑑 · 𝐶 + 𝑒 · 𝐵 · 𝐶2)
𝐵]
· [(𝐷 − 𝑐)
1· (
1
0.1 − 𝑐+ 𝑛 · (𝐷 − 0.1))] + 𝑚
The characteristic length of the evaluated room (L) will be the cubic root of the free volume of the
room. And the index lambda is defined as:
𝑖𝜆 = 𝐿
7 · 𝜆
If this index is less than 1, DDT is not possible, and if it surpasses 1, DDT is possible. However,
uncertainties in the model (43%) recommend reducing this threshold value to 0.57.
Now that all cells have a flag indicating in which flammability state they are:
0 No deflagration
1 Slow deflagration
2 Flame Acceleration
3 Deflagration to Detonation Transition
It is possible to calculate the Tau parameter of the cell in an easy way. (It will be later explained in
Section 6.3.1 “The Tau Parameter, (τ)”).
(19)
(20)

Models & Methods
120
Figure 4-22. PWR containment used as basis, [159]
Figure 4-23. Vertical Snap construction method

Development of a 3D PWR-W Containment Model with the GOTHIC Code
121
4.5 Development of a 3D PWR-W Containment Model with the GOTHIC Code
In this section the creation of the model who will play a central role in this Thesis will be explained
step by step. This detailed information will be given because the simple creation of the model is a step
forward in the state of the art of containment 3D models with the GOTHIC code. This section is adapted
from the Thesis author’s publications, [146], [147] , [160] and [161].
In the first part of this section the creation of the CAD will be explained as well as the three steps
methodology of model creation. In the following section, the modeling approach will be exposed, including
the mesh, thermal conductors, heat sinks or flow paths.
Detailed PWR-W CAD 3D Model
The first step was needed in order to group and organize the information and clarify the internal
distribution of the containment. A new methodology named Vertical Snap has been developed for this
process.
The main documents for the containment geometry have been extracted from previous works at
the Nuclear Engineering Department of UPM, summarized in the report “Analysis of three severe accident
sequences (AB, SGTR and V) in a 3 loop W-PWR 900 MWe NPP with the MELCOR code” [159].
This process started by importing the containment drawings and equipment location schemes to a
CAD software. Therefore, a digital version is traced with the CAD designer writing tools, extruding walls
and compartments using the Vertical Snap method, see Figure 4-23. This method consist on extruding
the containment geometry from bottom to top, and if there is any incongruence between layouts, the lower
layout is taken as the valid one.

Models & Methods
122
Figure 4-24. Detailed CAD containment model

Development of a 3D PWR-W Containment Model with the GOTHIC Code
123
Simplified PWR-W 3D CAD Model
Since GOTHIC code only allows specific geometries , and it is easier to work with the CAD
environment rather than GOTHIC environment, the containment CAD model is rebuilt using only these
geometries, obtaining a “bridge” between the detailed and the GOTHIC mode, see Figure 4-25l.
Moreover, GOTHIC can also use opening blockages, thus, for complex geometries, two methods
were studied; subtracting blocks and wedges from other blocks and wedges, or creating complicated
geometry through the union of small simple blocks. Subtraction geometry is useful when a big blockage
has little openings (e.g. gratings). Union geometry is useful to represent small walls or equipment.
To represent the building geometry in the GOTHIC code, the CAD blockages coordinates were
extracted to be processed into a GOTHIC compatible format. In this aspect, the CAD model should allow,
a correct extraction using a specific macro, named ETSII-UPM GOTHIC Geometry Implementer (GGI),
developed for this process.
PWR-W containment GOTHIC 3D model
In this section the creation of the 3D thermal hydraulic model of the containment model will be
exposed. The mesh, flowpaths, thermal conductors and external conditions will be depicted.
4.5.3.1 Modeling Approach
Control volumes are used to represent the regions occupied by a fluid. A control volume was
created to represent the containment volume with a dimension of 45 × 45 × 80 m.
According to the GOTHIC User Guide, the elevation and height of a volume define its vertical
position with respect to the rest of the computational model. Gravitational forces are determined by this
position. The calculated pressure for each volume is representative of the pressure at the center of the
volume and is used to calculate the fluid properties and the volume average temperature. In the
Kewaunee and Prairie Island Containment Evaluation Models [54,162], the height was arbitrarily set to
100 ft. (30.48 m). In Framatome methodology [50], height is set as the volume divided by the transverse
cross-sectional area of the containment cylinder to maintain the default liquid/vapor interface area
(volume/height) equal to the cross-sectional area. However, in Dominion methodology [52], the
containment height is calculated taking into account the spray height to ensure a proper heat and mass
transfer in the covered region. All these models have one thing in common; they are all Lumped parameter
Models (LPMs), where the geometry is not explicitly represented. While the methodology used is
developed for three-dimensional M&E release studies, the elevation set has been taken directly from the
containment drawings and CAD models. The nominal floor area set in the model has also been taken
from the containment drawings and CAD models.

Models & Methods
124
Figure 4-25. Simplified CAD containment model
Turbulence model
Molecular diffusion
Minimum porosity
Pressure control
Enthalpy control
Max. Time step
Discretization scheme
k-ε standard Enabled 0.01 6.89 kPa 2.326
J/g 0.01 s BSOUP
Table 9. Typical parameters of a simulation with the GOTHIC 3D PWR-W Containment Model
Small geometry variation

Development of a 3D PWR-W Containment Model with the GOTHIC Code
125
GOTHIC uses the volume hydraulic diameter (Dh) to define the surface area of structures within the
volume that may be wetted by a liquid film as 4V/Dh, where “V’’ is the containment net free volume.
Dominion and Framatome methodologies calculate the Dh with this method. However, in Kewaunee and
Prairie Island Containment Evaluation Models, the Dh was arbitrarily set to 10 ft. (3.048 m). In the present
methodology, the hydraulic diameter is set using the containment cylinder diameter (40 m).
In GOTHIC, blockages can be defined within subdivided volumes to model objects that displace
fluid within a volume or that model the shaped boundaries of a volume. They allow to model surfaces that
restrict flow between cells of a subdivided volume. There are five blockages allowed in GOTHIC: blocks,
cylinders, wedges, cones and caps. Several hundred blockages and openings were needed to define the
internal geometry of the UPM-PWR containment building.
Depending on the simulation, there are several model parameters that can change, however Table
9 is an example of typical parameters employed:
4.5.3.2 Model Mesh
The conservation equations are solved for each cell of a hexahedral computational grid. For each
cell in the mesh, average values describing the fluid condition and motion are calculated.
According to GOTHIC Technical Manual, a blockage will only separate two fluid regions if it covers
a cell’s grid line entirely, thus the mesh need to separate regions adequately. A preliminary mesh was
created in the CAD simplified 3D model to assure the hydraulic independence when necessary.
The mesh also has to be fine enough to take into account local phenomena. The refinement will
also determine the ‘weight’ of the model, so the mesh should not be fine enough to make the model
inoperable due to its excessive computational cost. Accordingly, three GOTHIC models with different
mesh size were developed, one Detailed Integral Model (DIM) with 27132 nodes and two Multi-Zone
Models (MZMs), with 12358 (MZMA) and 1829 (MZMB) nodes respectively.
The DIM used for this Thesis has 27132 cells, with 38 grid lines in the X direction, 34 in Y direction
and 21 in Z direction. As seen in the validation chapter (Section 4.2.2 “GOTHIC Verification & Validation”)
this mesh is fine enough to capture the relevant phenomena for a LOCA M&E release.
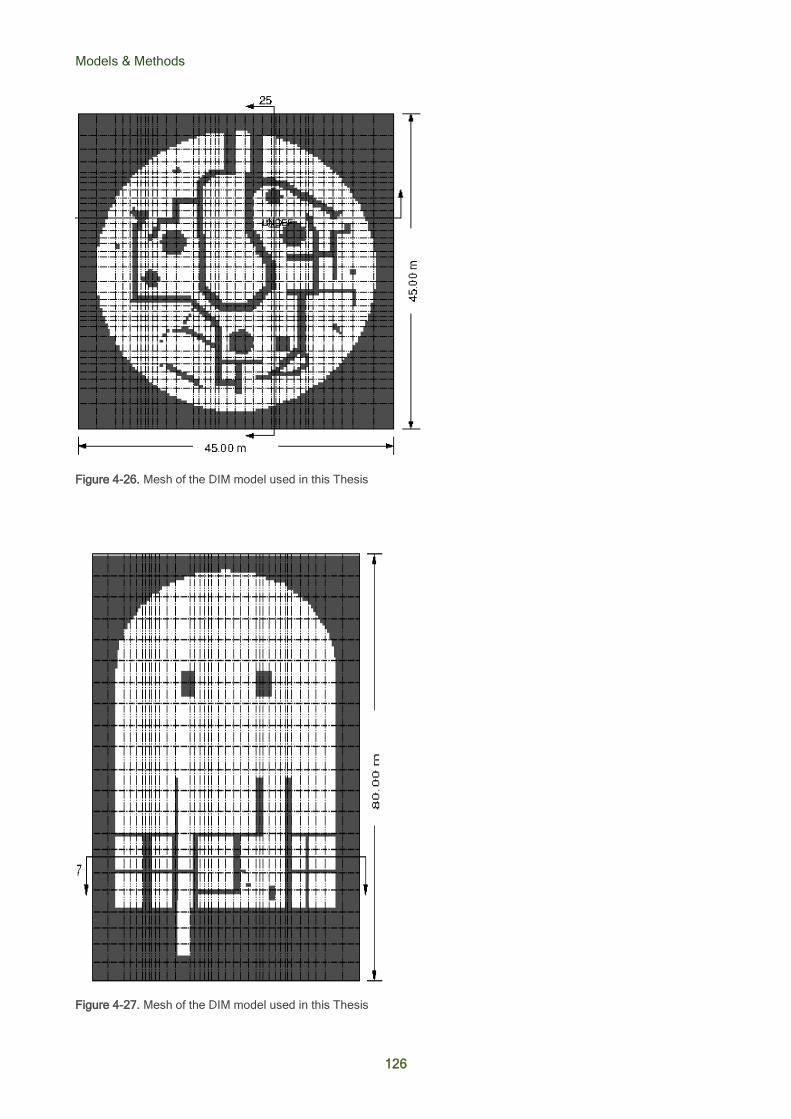
Models & Methods
126
Figure 4-26. Mesh of the DIM model used in this Thesis
Figure 4-27. Mesh of the DIM model used in this Thesis
Development of a 3D PWR-W Containment Model with the GOTHIC Code
127
The concept of Multi-Zone Model is a different model philosophy relative to the DIM, where the
whole containment is represented in a single control volume. In the MZMs, 11 control volumes, connected
thought flow paths and/or 3D connectors, represent the containment building. These implies remodeling
the geometry, ‘extracting’ different zones (Steam Generator (SG) cages, stair cages, elevation 42 rooms
and the fuel transfer pool) from the main control volume and relocating them into independent control
volumes as seen in Figure 4-28.
The mesh in the MZMB used in this Thesis has to be fine enough to account local phenomena. The
refinement will also determine the computational cost of the model, so the mesh should not be too fine so
the model becomes inoperable. Accordingly, to achieve an adequate accuracy-cost ratio, the GOTHIC
model used in the analysis has 1829 cells, with an average cell characteristic length of 5 m. As seen in
the validation chapter (Section 4.2.2 “GOTHIC Verification & Validation”) this mesh is fine enough to
capture the relevant phenomena for gas transport.
4.5.3.3 Flow Connectors
GOTHIC flow paths are used to connect control volumes to one another or to connect boundary
conditions to control volumes. Flow paths transport liquid, vapor, and droplet mass and energy. GOTHIC
requires values to specify the flow path elevations, end height, hydraulic diameter, area, friction length,
inertia length, and loss coefficient.
In the DIM, it was unnecessary to use flow-paths or 3D connectors to communicate fluid between
different regions because all the apertures and complex structures are represented with blockages and
openings in the same control volume. In the case of the MZMs, three 3D connectors were used to
communicate the upper part of each SG cage with the main control. It was also necessary to use 64 flow-
paths to represent the connection between different rooms with the main control volume.
The LPM is made of 8 control volumes connected by flow paths. The control volumes in the LPM
represent the same geometry as the MZMA and B.
The flow area of a junction is the minimum cross sectional area connecting the volumes and the
fluid velocities through the junction are based on this area. The hydraulic diameter of the junction is used
to calculate wall friction pressure drop. These flow path parameters are extracted from the CAD models
and technical drawings.
The inertial length of a junction determines the length in the momentum equation. In the junction
momentum balance, it is significant in the calculation of the short term differential pressure across walls
in sub-compartment analysis due to a rapid pressurization of one room. Typically, for containment
applications, the inertial effect is significant only during one or two seconds immediately following an event
that causes a rapid pressure change. The inertial length is set to the distance between cell centroids.

Models & Methods
128
Figure 4-28. Different Rooms extracted from the Multi-zone model
Figure 4-29. MZMB containment model used for a SBO simulation

Development of a 3D PWR-W Containment Model with the GOTHIC Code
129
The frictional length of the junction is used to calculate the frictional pressure drop. For doorways,
the junction friction length can normally be set to zero since the friction loss will be small relative to the
form loss.
The momentum Transport Option controls the transport of momentum through the flow path. This
option is set to N&T (Normal and Transverse) to include ‘transverse’ and ‘in-line with the flow’ momentum.
4.5.3.4 Thermal Conductors
Thermal conductors are used to model the heat capacity of solid structures, heat transfer between
the fluid and these structures, radiative heat transfer among structure surfaces, and to steam in the vapor
space, heat transfer through solid structures separating volumes, and heat sources associated with the
structures.
Heat and mass transfer between the vapor or liquid regions and the structures are specified by heat
transfer coefficient types assigned to each thermal conductor. Heat transfer coefficients are assigned to
the thermal conductor surfaces exposed to the containment atmosphere.
4.5.3.4.1 Heat Sinks Geometry and Nodalization
Thermal conductors are divided into regions, at least one for each material layer, with thickness.
The material density, thermal conductivity and specific heat are introduced by the GOTHIC user.
Conductors with higher heat flux at the surface and low thermal conductivity must have closely spaced
nodes near the surface to adequately track the steep temperature profile.
In all methodologies studied, GOTHIC automatic nodalization feature was used to subdivide the
thermal conductors. The auto-divide option spaces the region boundaries closer together as the heat
transfer coefficient increases and as the material conductivity decreases. The surface thickness is set to
keep the Biot number less than 0.1.
In some methodologies, such as Dominion, thermal conductors are not modeled for each individual
piece of equipment or structure in the containment with a separate conductor. Smaller conductors of
similar material composition are combined into a single effective conductor. In this combination, the total
mass and the total exposed surface area of the conductors is preserved.
The heat sink material types, surface areas, and thickness are based on plant-specific inventories.
Concrete, carbon steel, and stainless steel are the most common materials.
To represent the thermal connection in the 3D models, several thermal conductors were used
connecting thermally different regions separated by a wall, and also to represent the condensation over
the different surfaces, including the SGs, the liner in the external walls of the containment and the polar
crane. For internal walls thermal connection, external thermal conductors were used to define manually
each side and the longitude of the surface. For elements such as the polar crane and the SGs, the use of
internal thermal conductor was considered adequate. For walls representing the containment cylinder
and dome, internal thermal conductors were also used. 262 thermal conductors were implemented in the

Models & Methods
130
DIM, 235 in the MZMA and 235 in the MZMB. 15 conductor types were created to represent the different
elements in the model using 6 types of materials such as carbon steel, concrete, paint, etc. The primary
system conductors are set have a temperature boundary condition set to the temperature of the coolant.
4.5.3.4.2 Conductor Surface Heat Transfer
GOTHIC has a large number of heat transfer coefficient options that can be used for containment
analyses. These include the FILM, DIRECT, Tagami, and user-specified heat transfer coefficient options.
GOTHIC also has condensation options that include Uchida, Gido–Koestel, and Diffusion Layer Model
(DLM) condensation options.
Natural convection, condensation and radiation are credited normally in Licensing Analysis, [52].
However, forced convection has not been considered for peak temperature and pressure analysis
because it is difficult to justify in a lumped parameter model as there are no velocities in a single node.
As a consequence, in the 3D models of this study, forced convection is not activated in the thermal
conductors.
With the DIRECT option, all condensate goes directly to the liquid pool at the bottom of the cell.
The effects of the condensate film on the heat and mass transfer are incorporated in the formulation of
the DLM option. Under DLM option, the condensation rate is calculated using a mass and heat transfer
analogy to take into account for the presence of Non Condensable Gases (NCGs). It has been validated
against seven test sets as shown in the qualification report, [45]. The DLM was accepted by the NRC,
[56] for LOCA and MSLB peak pressure and temperature containment analysis. In vertical surfaces,
conductors transfer heat to the vapor phase option is used. For conductors representing the containment
floor or sump walls that will eventually be covered with water from the break and condensate, the SPLIT
phase option is used to switch the heat transfer from the vapor phase to the liquid phase as the liquid
level rises in the containment buildings.
The heat transfer and condensation model used in all models is ‘DIRECT’ and ‘DLM-FM’ for the
vertical walls in contact with the containment atmosphere, ‘Sp Heat Flux’ with a nominal value fixed to 0.0
for the heat sinks as the polar crane, ‘Sp Temp’ for SGs (fixing the temperature inside to 316 °C), and ‘Sp
ambient’ for external containment walls side (Text 35 °C), coupled with a ‘Sp Conv’ with a nominal heat
transfer coefficient value of 11.35 W/m2 °C, [51].
Opened Research Lines
Once the creation of the models is made, they are ready to be used for DBA or SA analysis. The
model used in the EQ Criteria re-analysis (Section 5 “Analysis of Equipment and Instrumentation EQ
Using 3D Containment Models”) will be the DIM because the maximum temperatures are the target
variables of the simulation. The model used in the hydrogen risk quantification development (Section 6
“Hydrogen Mitigation in a PWR-W Containment during a SBO Scenario; Tau Parameter Definition and
Application on Venting Strategy Analysis”) will be the MZMB because the simulated transient last 20000
seconds and the mesh size is enough to capture the more relevant phenomena.

Development of a 3D PWR-W Containment Model with the GOTHIC Code
131
Accordingly, this containment creation methodology is available for other containment types such
as an AP1000® or a Siemens KWU to perform transient simulations. To deepen in these research lines
the author has published several articles and conference proceedings, see [163–167].

132

133
5 Analysis of Equipment and Instrumentation EQ Using 3D
Containment Models
“You're rarer than a can of dandelion and burdock
And those other girls are just Postmix lemonade”
- Alex Turner, Suck it and See.

134
CHAPTER CONTENT
5.1 Introduction .............................................................................................. 135
5.2 Analysis of Temperature Limits Obtained with LP Models ....................... 138
5.3 Containment Model .................................................................................. 141
Mass & Energy Release ............................................................................. 141
Post-Processing.......................................................................................... 143
5.4 Simulation Results ................................................................................... 143
Base Case Results ..................................................................................... 143
Sensitivity Analysis ..................................................................................... 151
5.5 Conclusions ............................................................................................. 153

Introduction
135
5.1 Introduction
In this section, based on the code improvement of the post-processing capabilities described in
Section 4.4 “The ProTON Code” and the containment modeling for licensing analysis described in Section
1.6.2 “Modeling Guidelines for containment analysis” a re-analysis of the temperature limits for
Environmental Qualification (EQ) of equipment is made. It deepens in the concept of equipment and
instrumentation harsh local conditions now available with 3D containment analysis. This section is an
adaptation from the Thesis author’s publication [168].
The analysis made has been done with the PWR-W containment 3D model described in Section
4.5 “Development of a 3D PWR-W Containment Model with the GOTHIC Code”, so in this section a small
debrief with the room assignation will be made. The M&E release inputs have been all obtained with the
MELCOR code, described in Section 4.3 ”The MELCOR Code”, and they will be exposed. Concluding, in
this chapter, the LOCA simulations presented are analyzed applying the generic EQ criteria and finally,
discussion and conclusions are drawn.
As seen in Section 1.6 “Numerical models of containments for accident analysis“, for containment
safety analysis, the LOCA and the MSLB, commonly grouped in High-Energy Line Breaks (HELBs), are
normally chosen as the transients which maximize the M&E release to the containment atmosphere from
the primary and secondary cooling system. This maximized release is assumed to create the most
conservative conditions in the containment, regarding pressure and temperature, [8].
As seen in Section 1.6.2 “Modeling Guidelines for containment analysis”, to conduct those
containment safety analyses and evaluate the consequences of an accident in the containment
atmosphere, some challenges are faced. First, the need to model a containment with a large free volume
(around 60000 m3) and a complex geometry. Second, the small characteristic length scale of the
simulation phenomena, such as friction, conduction, convection and condensation. To deal with the
different scales, the solution traditionally taken is the LP approach, which uses correlations to simulate
the physical phenomena and models the containment in a single or few computational cells. Therefore, it
is possible to model a big building such a NPP containment and, at the same time, capture the friction,
conduction, convection and condensation phenomena. The LP approach provides reasonable results on
pressure and temperature peaks with very low computational requirements. Regulatory bodies have
accepted the LP approach, imposing some biases. Examples on NPP containment analyses with this
approach can be found in [52–54,162,169,170].However, the LP approach has assumptions such as
instantaneous fluid mixing inside a control volume, no 2D/3D effects of the flow patterns, instantaneous
interaction of all thermal structures with the fluid inside a control volume and no forced convection. It is
mentionable that some of these hypothesis have been questioned historically, see for example [59,171].
As a summary, although its limitations, containment DBA analysis performed with the LP approach can
lead to obtain the global pressure and temperature limits in a NPP containment.

Analysis of Equipment and Instrumentation EQ Using 3D Containment Models
136
Maximum temperature
Country/NPP Reference
160 °C Belgium/ DOEL
[172]
155 °C Finland/ Loviisa
[172]
172 °C Spain [172]
170 °C Sweden [172]
200 °C UK [172]
190 °C Korea [173]
260 °C AP1000 [174]
130 °C Krsko/Slovenia [175]
177 °C US-APWR [106]
Table 10. Different containment maximum temperatures for EQ

Introduction
137
The pressure obtained in these containment analyses was historically taken into account to set
design parameters such as the minimum free volume inside the containment, or the thickness of the
containment walls among other design criteria, see 10 CFR 50 Ap. A Criterion 50, [176]. The temperatures
evolution obtained with these analyses are also taken into account for several design criteria. Specifically,
it is used to create an enveloping temperature profile that covers all Design Basis Events (DBE) used for
the Environmental Qualification (EQ) of equipment and instrumentation important to safety inside the
containment, [177]. This equipment is tested and subjected to the enveloping temperature profile to
assure its performance under DBE conditions.
As computer resources increase and new software tools are developed, new levels of accuracy
and detail can be achieved; but licensing analysis have not always been adapted to these improvements.
A positive example of updating the regulation to these new capabilities can be found in [178] where it was
stated that given the present computers capability, it was possible to make a realistic estimations of the
fuel and the ECCS performance during a LOCA and to quantify the uncertainty of the calculations.
However, although the new 3D capabilities of containment codes such as GOTHIC or GASFLOW are
available, containment safety analyses are still done nowadays using the LP approach.
With an adequate cell size in a 3D containment model, flow patterns and physical variables can be
tracked and analyzed with an accuracy level unreachable for LP models. International organisms are
taking into account these new tools, although not for DBA analysis, [85], [84]. The first use of these 3D
models was motivated by hydrogen distribution analysis and then evolved to containment severe accident
analysis thermal hydraulics, see [179], [92], [180], [78] or [112]. IAEA and the OECD/NEA state that CFD
codes are able to reproduce more accurately the thermal-hydraulic containment phenomenology
involving hydrogen [181], [83] .
As seen in Section 1.6.2 “Modeling Guidelines for containment analysis”, the DBA analysis
compares the simulation results against the safety limits of pressure and temperature for containment.
During a transient, the pressure is transmitted at sonic speed all over the rooms, and it became
homogeneous almost instantly in the full containment, so there is not a noticeable difference between LP
and 3D models results. However, temperature distribution is more heterogeneous, as slower convective-
diffusive processes are responsible for its spreading. 3D flow patterns inside the containment affect
directly to this temperature spreading. Therefore, achieving a sufficiently accurate nodalization is crucial
to correctly predict these flow patterns. With a LP model, it is not possible to observe all these phenomena.
3D models are able to capture this phenomena and therefore analyze new parameters such as room
maximum local temperature, three dimensional flow patterns or heat flux through specific equipment or
containment walls. This fact impulses the need of an analysis on the temperature limits obtained by a LP
model, as it is based on global average values.

Analysis of Equipment and Instrumentation EQ Using 3D Containment Models
138
5.2 Analysis of Temperature Limits Obtained with LP Models
In this section, a small depiction of EQ within containments is made Along with a comparison of the
peak values of the enveloping profiles used for different NPPs.
EQ requirements from NRC have passed through from the DOR Guidelines and NUREG-0588 to
the EQ Final Rule as 10 CFR 50.49, which started to apply in 1983, [182]. In this regulation, a DBE is
defined as any event that produces a harsh environment, this is, different from the normal or abnormal
conditions. Moreover, in a NPP, all safety-related equipment, directly or indirectly, that requires harsh-
environment qualification is grouped into the Environmental Qualification Master List (EQML). The
performance requirements of an EQML component are tested regarding their location, qualification
criteria or harsh DBA among others.
The harsh environment is calculated by a thermal-hydraulic code including several assumptions to
maximize temperature and pressure. NUREG-0588 identifies several computer codes acceptable for
defining these conditions, [183]. Different HELB, provide different patterns for pressure and temperature,
and it is common practice to create an envelope of all calculated profiles. Then, equipment qualified with
an enveloping profile is considered acceptable for any plant-specific or location-specific profile that falls
within the envelope, [177]. It is remarkable that these different containment zones can be valuated
separately, as seen in [177], but these different zones are modeled as a LP volumes.
Generic industry environmental profiles have been available, see [183,184]. However, these
generic profiles are actually of discouraged use; NPP and countries regulatory bodies should calculate
their own plant-specific profiles as stated in the Regulatory Guide 1.89 [185], or in the latest IEEE for 1E
equipment, [186] and its revision [187]. Therefore, the peak temperature of the EQ enveloping profile is
country and/or plant–specific, as shown in Table 10 (they are not up-to-date values, and each country
value may be subordinated to the plant-specific ones). In addition, IEEE establishes a margin of 8°C to
these safety limits [186].

Analysis of Temperature Limits Obtained with LP Models
139
Instrumentation in a PWR-W containment has to bear accident conditions similarly to an EQML
component. NPPs are encouraged to use plant-specific values, [188] but generic values are also
available. Generic values for peak temperatures are set to 148 ºC, see [189,190]. Recent studies like [87]
have used this limit to assess an accident with the MELCOR code, using a containment model with nine
control volumes. It is stated that the instrument performance will be degraded if pressure and temperature
environments exceeds these instrumentation EQ (environmental qualification) ranges, and that
instrument performance is not well known if those limits are exceeded [65].
In this Thesis the general criteria used for qualifying containment equipment and instrumentation is
used to assess but with a 3D computational model instead of a LP model. The temperature that affects
an electrical or mechanical equipment, or the instrumentation in containment is the temperature of its
nearby surroundings. Unlike LP models, this local temperature can be calculated using 3D models.
To address this issue and expose differences, as a first step, a 3D containment model is made with
all rooms located and labeled independently. It will be taken as a hypothesis that all rooms of the
containment could contain electrical equipment (cables, pumps, etc.) or instrumentation. Secondly, the
detailed room conditions under a DBA will be extracted from the 3D simulations performed with GOTHIC.
Thirdly, the peak temperature of the enveloping profile will be the variable to assess, given that if it is
surpassed anytime, the EQ criteria will be surely surpassed. In this aspect, the peak temperature criterion
for equipment and instrumentation will be set to 148.9 °C, as it has been the general criteria used for
decades [184]; if this local conditions are exceed, it would be considered that equipment and
instrumentation in this room is under damage conditions. This damage will be quantified by the room peak
temperature and pressure, and the amount of time that a cell or group of cells inside this room are
exceeding the limits for a generic PWR-W. This criterion will be applied in the next sections of the study
to a DEGB LOCA for a PWR-W containment for demonstration purposes.

Analysis of Equipment and Instrumentation EQ Using 3D Containment Models
140
Figure 5-1: PWR-W Containment Analyzed Zones
Figure 5-2: PWR-W Containment Analyzed Zones

Containment Model
141
5.3 Containment Model
The containment 3D model used is the DIM, it has been fully explained in Section 4.5.3 “PWR-W
containment GOTHIC 3D model”.
To perform the equipment and instrumentation damage analysis, 49 compartment zones have been
defined as shown in Figure 5-1 to Figure 5-3. Room 49, which is not represented in the Figures shown,
corresponds to the dome region. The layouts shown in this annex are a reconstruction made from [159].
For all the simulations performed in this section the turbulence model used was the k-ε standard.
The molecular diffusion was enabled. Minimum porosity was set to 0.02, meaning that all the cells with
more than 98% of its volume blocked will be considered totally blocked. The pressure matrix solution
method used was conjugate with the flux variables calculated up-stream with a space differencing scheme
of first order (FOUP). The maximum time step allowed was variable, it depends on the case simulating
and varies between 0.01 sec and 10-5 sec. The pressure control change was limited to 6.89 kPa.
Mass & Energy Release
The postulated accidents consist of a DEGB LOCA in the RCS cold leg. The M&E release data,
used as input, was obtained from a MELCOR model developed at UPM, and extensively used in different
national and European projects [159]. This original model has been upgraded by Rafael Bocanegra. The
NPP taken as reference is a PWR-W with a power generation of 2696 MWth and 900 MWe. The primary
system has three loops with a recirculating pump, a vertical SG with U-tubes and hot/cold legs. One of
the loops includes a Pressurizer (PZR) with relief and safety valves. For all the simulations, the
accumulators, the high pressure injection and the low pressure injection are assumed available. Neither
containment spray system nor containment HVAC cooling system are available in the simulation.
The M&E release is modeled with four boundary conditions, one for each side of the break, and
one for each phase (liquid and vapor). For each M&E release there are three sets of data: mass flow,
temperature and pressure. The M&E release input for the liquid of the vessel side break can be observed
in the following figures.

Analysis of Equipment and Instrumentation EQ Using 3D Containment Models
142
Figure 5-3: PWR-W Containment Analyzed Zones
Figure 5-4. Liquid Mass Flow of the M&E Release
0
5000
10000
15000
20000
25000
30000
0.1 1.0 10.0 100.0 1000.0
Mas
s Fl
ow
[kg
/s]
Time [s]
Vessel Side Liquid
Pump Side Liquid
Simulation Results
143
Post-Processing
To process the GOTHIC output files, the ProTON code described in Section 4.4 “The ProTON
Code” is used. The goal of ProTON for this work is to obtain the average temperature and pressure
distribution over each compartment due to GOTHIC 8.1 does not allow to do it directly. ProTON is also
used to obtain wall temperatures, heat fluxes and condensed masses.
For qualitative results, the ParaView [191] post-processor is used. These results are useful for a
rapid understanding of the temperature distribution over the different compartments to locate high
temperature peaks.
To perform the analysis, 49 compartment zones have been defined as shown in Figure 5-1 to Figure
5-3. Room 49, which is not represented in those Figures, correspond to the dome region. The layouts
shown are a reconstruction made from [159].
5.4 Simulation Results
In this section, the main objective of the present simulation is to obtain information about
temperatures inside the different rooms of the containment. Firstly, a base case will be explained in detail,
and afterwards, the remaining cases will be summarized. The base case, sensitivities, and M&E release
input are all performed under the BE approach, avoiding conservative hypothesis.
Base Case Results
The simulation time is set to 1000 seconds; the break occurs at the first second. The calculation
time was approximately 95 hours using 5 cores (Intel i5 3.2 GHz). The results were post-processed with
the tools before mentioned, ProTON and ParaView. The average pressure and temperature can be seen
in Figure 5-9 and Figure 5-10.

Analysis of Equipment and Instrumentation EQ Using 3D Containment Models
144
Figure 5-5. Vapor Mass Flow of the M&E Release
Figure 5-6. Vapor Temperature of the M&E Release
Figure 5-7. Pressure of the M&E Release
0
500
1000
1500
2000
2500
0.1 1.0 10.0 100.0 1000.0
Mas
s Fl
ow
[kg
/s]
Time [s]
Vessel Side Vapor
Pump Side Vapor
0
50
100
150
200
250
300
350
400
450
500
0.1 1.0 10.0 100.0 1000.0
Tem
per
atu
re [°C
]
Time [s]
Vessel Side VaporTemperature
Pump Side Vapor Temperature
0
5000
10000
15000
20000
25000
0.1 1.0 10.0 100.0 1000.0
Pre
ssu
re [
kPa]
Time [s]
Vessel Side Pressure
Pump Side Pressure

Simulation Results
145
Figure 5-8. Liquid Temperature of the M&E Release
Figure 5-9. Average Containment Temperature Evolution
Figure 5-10. Average Containment Pressure Evolution
0
50
100
150
200
250
300
350
400
450
500
0.1 1.0 10.0 100.0 1000.0
Tem
per
atu
re [
°C]
Time [s]
Vessel Side Liquid Temperature
Pump Side Liquid Temperature
35
45
55
65
75
85
95
105
115
125
1 10 100 1000
Tem
per
atu
re [
°C]
Time [s]
100
120
140
160
180
200
220
240
260
280
1 10 100 1000
Pre
ssu
re [
kPa]
Time [s]

Analysis of Equipment and Instrumentation EQ Using 3D Containment Models
146
Figure 5-11. Room Average Temperature Evolution in the Base Case
Figure 5-12. Room Average Pressure Evolution in the Base Case
40
60
80
100
120
140
160
180
1 10 100 1000
Tem
per
atu
re [°C
]
Time [s]
100
120
140
160
180
200
220
240
260
280
1 10 100 1000
Pre
ssu
re [
kPa]
Time [s]
148.9 °C; Generic equipment and
instrumentation EQ limit

Simulation Results
147
On this figures, a high peak of mass flow is observed the first seconds after the break. After the
initial peak, the flow is slowly getting lower as the pressure inside the primary system is decreasing. The
liquid component of the break enters the containment in a superheated state, provoking an instant
vaporization into small drops. When the temperature and pressure decreases, the liquid flow enters the
containments without vaporization.
The averaged values are calculated taking into account the volume of each cell and its net porosity.
The pressure reaches its peak of 260 kPa at 11 seconds, while the average temperature peak reaches
114 °C. These values are both under the limits stipulated by the EQ maximum Pressure and Temperature
(PT) criteria (148.9 °C and 448 kPa). After the initial peak, the containment structures and the concrete
walls behave as a heat sink lowering the containment pressure and temperature. At 1000 seconds, the
pressure and temperature have decreased to half of their peak values.
This behavior is analogous to similar LBLOCA analyses in a PWR-W containment found in the
literature, [192]. An initial rapid peak followed by a slow descent in pressure and temperature caused by
condensation and convection with the heat sinks.
When the average temperature and pressure of each room is observed, the following curves are
obtained (Figure 5-11 & Figure 5-12). Each line corresponds to every room analyzed, and the red dotted
line is the temperature limit imposed for a generic PWR in [184].
Taking into account the individual room information, the development of the transient varies widely
in some cases. At the beginning of the transient, the pressure is nearly homogeneous in all rooms except
for those close to the break that are pressurized slightly before the others. There is another non-
homogeneous pressurization in three rooms: the refueling pool, with its lower zone, and the drain pump
room, whose pressurization is slower or non-existent because they are assumed to be, completely or
partially, airtight. At the end of the transient, the differences in pressure in some rooms are provoked by
the condensed water, which is accumulated in certain rooms and adds extra pressure because of the
water column. The pressure stays under the EQ limits globally, and also, locally during the whole
transient.
Regarding the temperature evolution, it does not reach homogeneity at any moment. Even though
all room temperature evolutions have similar structure (initial peak followed by a slow descent), the
temperature transport, as it was previously explained, is mostly a convective-diffusive process, and its
spreading is much slower than pressure, see Figure 5-13. This originates that nearly all rooms have
different temperatures, and that these high temperature peaks do not lower quickly as can be seen in
Figure 5-11.
Maximum temperatures reached are shown in Figure 5-14. The hot spot appears in Room 5, where
the break is located and then this high temperature vapor is transported to the adjacent rooms, as well as
to the dome (Room 49). The vapor moves through the SG1 cage (Room 5), as shown in the streamlines,
Figure 5-15.

Analysis of Equipment and Instrumentation EQ Using 3D Containment Models
148
Figure 5-13. Temperature evolution in the Base Case

Simulation Results
149
In certain rooms, this peaks exceed the temperature limits. This is summarized in Figure 5-16. In
this graph, the maximum temperature reached by any of the room cells is displayed in red. In addition,
the time that the room is exceeding the temperature limit is displayed in blue. It can be seen that room 5,
which is the room where the break is located, the maximum temperature inside reaches 176.41°C at some
point of the transient. The time that room 5 exceeds the limits is the longest. However, it only surpasses
the limits during the blowdown phase. Even though the M&E release continues releasing the primary
inventory and also water from the Accumulators (ACC), Low pressure Safety Injection (LPSI) and High
Pressure Safety Injection (HPSI), this high temperatures are not reached again.
Under the generic temperature limit (148.9 °C), this BE simulation would exceed the generic
equipment qualifying limit in 8 rooms. Excluding these 8 rooms, the remaining ones are all under the limits
during the whole transient.
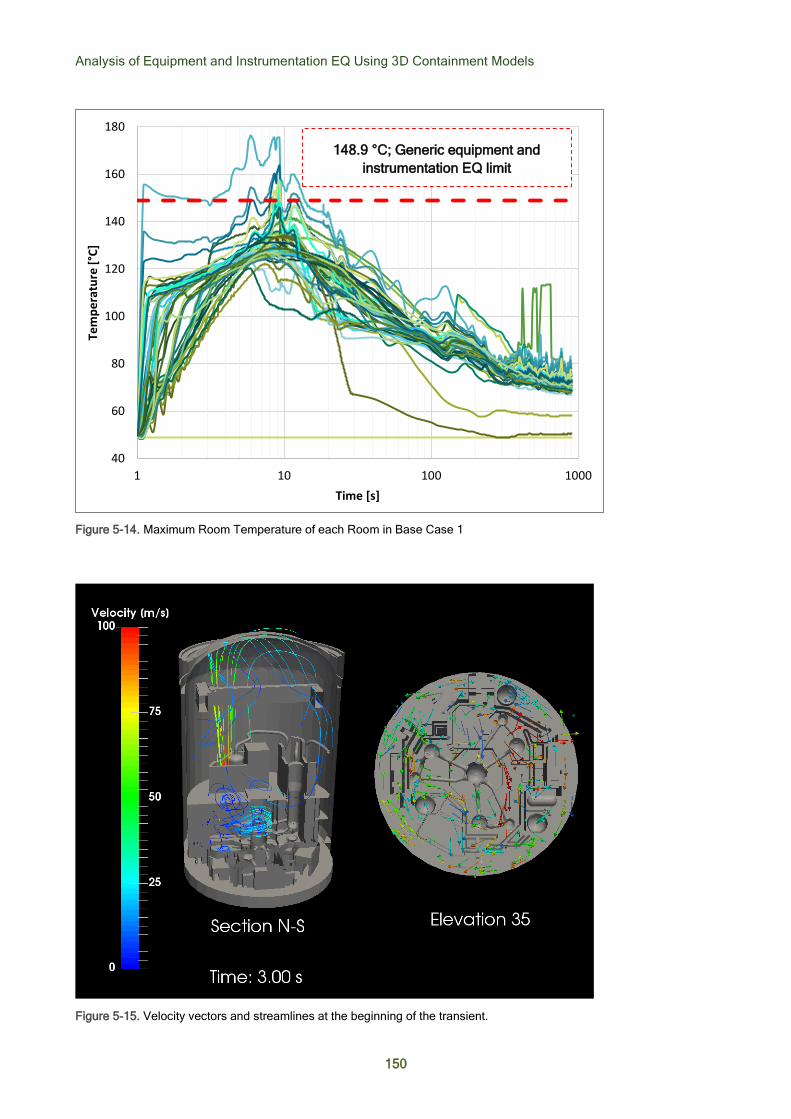
Analysis of Equipment and Instrumentation EQ Using 3D Containment Models
150
Figure 5-14. Maximum Room Temperature of each Room in Base Case 1
Figure 5-15. Velocity vectors and streamlines at the beginning of the transient.
40
60
80
100
120
140
160
180
1 10 100 1000
Tem
pe
ratu
re [
°C]
Time [s]
148.9 °C; Generic equipment and
instrumentation EQ limit

Simulation Results
151
Sensitivity Analysis
Taking into account that the containment conditions evolution and that the temperature peaks
produced are highly dependent on the break location and the corresponding M&E release input, eight
sensitivity cases were performed. These cases are shown in Table 11. Case 1 corresponds to a break
located in the loop 1 cold leg, which is the Base Case, analyzed before.
For each case, the M&E release data was extracted from the corresponding MELCOR simulation,
and implemented in GOTHIC afterwards. All cases were analyzed with ProTON and the summary of the
results can be seen in Table 12.
It is found that in every simulation the EQ limits are exceeded in at least one room inside the
containment. Damage times and maximum temperatures vary between simulations. However, it is
possible to observe that Hot Leg Break simulations leads to higher temperatures. The in-containment
equipment EQ limits, as well as the operating range of the containment instrumentation are clearly
reached, and therefore its function can be impaired.

Analysis of Equipment and Instrumentation EQ Using 3D Containment Models
152
Figure 5-16. Temperature Peaks Resume (Base Case 1)
Case 1 Case 2 Case 3 Case 4 Case 5 Case 6 Case 7 Case 8 Case 9
Loop 1 2 3 1 2 3 1 2 3
Location Cold leg Cold leg Cold leg Hot leg Hot leg Hot leg Pump
Suction
Pump
Suction
Pump
Suction
Table 11. Sensitivity Cases for the DBA analysis
0
2
4
6
8
10
12
14
135
140
145
150
155
160
165
170
175
180
Room 5 Room 23 Room 24 Room 39 Room 28 Room 6 Room 7 Room 25
Tim
e a
bo
ve t
he
lim
it [
s]
Max
Te
mp
era
ture
Re
ach
ed
[°C
] Max Temp Duration

Conclusions
153
5.5 Conclusions
Containment analyses have been usually performed using LP approach, given that the containment
conditions during a DBE are extreme in terms of pressure or temperature gradients, M&E release and
that the usual containment volume is around 60000 m3. Three-dimensional codes have been normally
used for containment analysis in terms of hydrogen risk analysis. Previous research at UPM used a three-
dimensional model for a pressure and temperature analysis and has shown that containment lumped
analysis are correct in terms of pressure, but can hide high temperature peaks.
Containment equipment and instrumentation are qualified based on pressure and temperature
enveloping profiles, normally calculated with LP models. However, this containment temperature obtained
with LP models is an average value and does not correctly represent the heterogeneity of this parameter.
Exploring this argument, a generic equipment and instrumentation EQ limit criterion, based on the
most commonly used limit during the last decades, has been used in this work. To compare against the
limits, the maximum temperature of this profile is taken (148.9 °C with an 8 °C margin) because if this
temperature is exceeded anytime during the transient, the EQ criteria will be surely surpassed.
Subsequently, these limits has been used to assess a DEGB LOCA in a PWR-W 3D containment model
developed with GOTHIC 8.1 (QA); showing that in all sensitivity cases analyzed, at least in one room, the
EQ limit is surpassed. If the temperatures obtained from the different simulations are compared against
plant-specific higher EQ limits, there are still several rooms in which those limits are surpassed.
From the results obtained, a proposal is raised: 3D models should be used to evaluate the potential
damage for the containment equipment and instrumentation during an accident. The EQ basis for
equipment and instrumentation should be made taking into account the results from 3D detailed models,
because the temperature heterogeneity in the containment rooms makes invalid the average values of
LP models.
Evaluating the results, it is not perfectly clear which sequence is the most severe, in terms of
temperature limits, as only a LBLOCA is simulated. To create an enveloping EQ criteria, it is proposed to
develop a methodology that takes into account not only the HELB break size, but also the location and
the orientation.
With the industry trends on CFD use, , it is maybe time to reconsider the way the methodology of
temperature and pressure enveloping profiles for EQ equipment and instrumentation is being performed.

Analysis of Equipment and Instrumentation EQ Using 3D Containment Models
154
Ca
se
1
Ca
se
2
Ca
se
3
Ca
se
4
Ca
se
5
Ca
se
6
Ca
se
7
Ca
se
8
Ca
se
9
Room 1 141.7 145.0 147.4 153.4 144.8 146.8 150.9 147.8 149.4
Room 2 133.1 132.2 129.4 141.6 127.8 131.0 139.2 150.2 130.9
Room 3 128.2 129.2 126.1 129.8 154.9 133.7 130.3 149.1 125.6
Room 4 128.4 128.9 124.3 129.6 156.8 132.1 130.6 145.3 125.1
Room 5 176.4 157.6 143.2 245.7 166.7 164.1 283.1 161.0 146.5
Room 6 152.7 149.4 147.7 223.9 161.3 171.0 281.8 192.1 150.6
Room 7 150.3 213.2 163.5 183.6 228.8 196.8 253.9 255.8 160.1
Room 8 130.0 130.0 201.3 171.6 163.8 237.5 159.0 212.6 216.7
Room 9 139.8 138.4 147.4 174.2 151.9 163.1 144.0 207.1 150.7
Room 10 136.0 129.4 130.6 175.0 139.6 139.5 135.8 111.3 133.7
Room 11 128.9 129.4 131.6 166.5 152.2 128.9 135.7 136.8 129.5
Room 12 128.7 128.4 123.8 169.1 170.9 125.6 132.9 158.0 128.1
Room 13 128.1 133.4 138.0 165.7 176.7 132.8 143.5 161.2 135.9
Room 14 135.5 138.6 152.9 157.3 195.6 181.3 176.5 198.7 154.0
Room 15 48.8 48.8 48.8 48.8 48.8 48.8 48.8 48.8 48.8
Room 16 130.3 136.6 161.5 160.0 191.7 196.8 159.2 207.4 159.4
Room 17 128.0 131.8 127.3 141.1 181.1 157.5 140.8 115.5 129.1
Room 18 128.8 130.2 126.8 133.1 174.8 130.2 137.2 158.5 128.6
Room 19 128.2 131.0 128.8 130.1 177.2 168.8 138.8 177.6 129.4
Room 20 127.2 125.3 133.4 137.8 124.3 178.9 129.3 170.9 152.2
Room 21 130.1 130.5 105.6 128.1 128.0 107.8 129.6 136.3 108.3
Room 22 136.5 135.8 128.1 133.8 131.2 159.8 139.0 132.0 130.6
Room 23 162.7 141.6 152.4 231.8 200.0 218.5 172.2 199.3 163.7

Conclusions
155
Room 24 163.8 140.2 142.5 227.7 154.0 154.5 167.1 132.5 144.8
Room 25 149.8 133.0 145.3 142.0 148.6 168.6 156.5 140.6 149.0
Room 26 134.4 129.2 157.4 133.0 140.0 182.2 163.0 193.4 154.8
Room 27 131.4 127.1 165.5 141.0 139.1 205.3 154.4 174.3 163.5
Room 28 157.3 137.5 143.2 145.2 145.0 143.5 149.1 161.5 145.6
Room 29 128.5 128.1 129.7 159.4 136.7 136.4 131.7 133.9 132.3
Room 30 128.7 128.6 125.3 177.4 162.4 127.6 130.8 144.4 129.4
Room 31 133.4 129.1 132.6 164.9 133.5 132.4 129.6 139.0 135.7
Room 32 130.1 131.7 138.6 129.0 159.4 151.5 158.5 168.6 140.0
Room 33 134.8 138.8 136.7 140.7 136.3 137.1 138.6 136.0 139.2
Room 34 124.4 121.4 128.8 127.5 122.2 140.4 128.7 141.0 128.5
Room 35 126.1 123.5 127.8 129.4 124.9 147.5 131.2 146.2 129.4
Room 36 131.3 131.3 126.7 135.4 166.6 126.8 133.6 109.6 127.5
Room 37 126.8 128.5 127.9 128.3 158.7 146.6 129.6 106.2 129.0
Room 38 127.8 124.3 132.2 139.1 123.1 168.9 129.3 151.8 148.0
Room 39 157.0 143.1 148.3 189.0 148.6 200.1 157.7 190.1 152.2
Room 40 148.1 132.6 139.8 187.4 148.2 144.1 144.0 130.0 141.7
Room 41 124.1 129.1 140.4 167.4 140.2 158.9 120.1 131.0 144.7
Room 42 130.2 123.4 143.7 181.6 120.7 163.5 154.3 274.0 146.5
Room 43 128.7 126.5 140.0 165.6 136.1 160.3 137.9 165.0 138.7
Room 44 126.1 126.8 128.1 180.8 131.4 127.5 127.4 128.0 128.5
Room 45 122.1 120.5 127.8 124.8 124.8 128.2 124.6 120.0 131.2
Room 46 120.3 117.1 130.3 119.6 116.3 129.0 120.4 121.0 133.6
Room 47 124.7 117.8 128.5 127.5 116.4 160.3 126.7 141.1 139.9
Room 48 145.9 134.0 139.2 194.6 151.2 158.4 151.6 152.3 140.9
Room 49 127.1 123.9 119.8 156.6 123.1 126.5 131.0 134.6 125.4
Table 12. Sensitivity analysis results.

156

157
6 Hydrogen Mitigation in a PWR-W Containment during a
SBO Scenario; Tau Parameter Definition and Application
on Venting Strategy Analysis
“You said, it was gonna be easy
Now you’re driving away”
- Carlotta Cosials & Ana Perrote, Easy.

158
CHAPTER CONTENT
6.1 Introduction .............................................................................................. 159
6.2 PWR-W Containment Model .................................................................... 161
6.3 Evaluation of the Hydrogen Risk; the Tau Parameter .............................. 163
The Tau Parameter, (τ) ............................................................................... 163
6.3.1.1 Combustion Regime Hazard ...................................................................................... 163
6.3.1.2 Time Hazard .............................................................................................................. 164
6.3.1.3 Mass Hazard .............................................................................................................. 164
6.3.1.4 Tau Normalization ..................................................................................................... 165
6.4 SBO Reference Sequence ....................................................................... 167
Mass & Energy Release ............................................................................. 167
Reference SBO GOTHIC Simulation .......................................................... 167
6.5 Sensitivity Analysis for Human Actions .................................................... 171
6.6 Results, Discussion and Proposal ........................................................... 175
6.7 Conclusions ............................................................................................. 177
6.8 Annex B ................................................................................................... 179

Introduction
159
6.1 Introduction
In this chapter, an SBO simulation in a PWR-W containment is performed using the GOTHIC code.
A sensitivity analysis on the venting strategy is also included to estimate the optimal timing for
containment venting that minimize the hydrogen risk.
In the first section of the chapter, a description of the computational criteria to evaluate the hydrogen
risk, the Tau parameter, is explained. The ProTON implementation was previously explained in Section
4.4.1 “ProTON Capabilities”. The following sections cover the SBO simulation and its analysis focusing
on the hydrogen risk. Afterwards, the sensitivity analysis results is exposed and explained, and finally,
some proposals for the SAG-7 are made as a conclusion.
SAs in NPPs, and specifically hydrogen management, have hardened over more than 30 years,
due to its considerable hazardousness, its difficult prediction and its importance to society.
As seen in Section 2.2.1 “Hydrogen Generation” during a SA in a LWR, large quantities of hydrogen
can be generated during the reactor core degradation. This hydrogen can be released into the
containment atmosphere and it could react violently with oxygen. Therefore, hydrogen combustion during
a SA becomes one of the most significant hazards to the containment integrity, [66].
As seen in Section 2.2.2 “Hydrogen Flammability”, hydrogen combustion can impair the
containment integrity, but depending on how it burns, it can be more or less hazardous. The combustion
regimes, from the point of view of nuclear safety, are classified into three regimes; Slow Deflagration (SD),
Flame Acceleration (FA), and the Deflagration to Detonation Transition (DDT) [72]. These regimes have
been extensively studied in several facilities to assess the hydrogen risk in containment, such as FZK
(Fortschungzentrum Karlsruhe, Germany), KI (Kurchatov Institute Moscow, Russia), NUPEC (Nuclear
Power Engineering Corporation, Japan), CEA (Commissariat a l’Energie Atomique, France) or NRC
(Nuclear Regulatory Commission, USA) [81].
As seen in Section 3.2 “Severe Accident Management Guidelines”, during a SA, the NPP operators
follow the SAMGs, being these guidelines plant-specific [193]. Even though NPPs were not initially
designed to withstand a SA, these guidelines attempt to mitigate the radiological consequences of the
accident. Therefore, SAMGs final objective is not to protect the reactor core but to limit fission product
releases to the environment [124]. It must be noticed that these are guidelines and not very detailed
procedures; therefore, during a SA, the operators must take decisions on how to prioritize hazards and
what to do to mitigate them [130]. If hydrogen is generated during a SA and some limits are surpassed
(normally about 5 % of hydrogen concentration in dry air), the decision diagram leads to the guideline that
helps the operator to mitigate the risk: the Severe Accident Guideline 7 (SAG-7) “Reduce containment
hydrogen”.

Hydrogen Mitigation in a PWR-W Containment during a SBO Scenario; Tau Parameter Definition and
Application on Venting Strategy Analysis
160
Room Identification Room Location
Room 1 Main Volume
Room 2 SG 1 Cage
Room 3 SG 2 Cage
Room 4 SG 3 Cage
Room 5 Refueling Pool
Room 6 West Stairs
Room 7 East Stairs
Room 8 Equipment Rooms
Room 9 Lower Equipment Rooms
Room 10 SG 3 Vertical Corridor
Room 11 SG 2 Vertical Corridor
Table 13. Room identification for the PWR-W GOTHIC containment model
Figure 6-1. Containment rooms in CAD model. [146]
Turbulence model
Molecular diffusion
Minimum porosity
Pressure control
Enthalpy control
Max. Time step
Discretization scheme
k-ε standard Enabled 0.01 6.89 kPa 2.326 J/g 0.01 s BSOUP
Table 14. PWR containment GOTHIC model parameters

PWR-W Containment Model
161
If the flammability conditions inside the containment could lead to its failure then the Severe
Challenge Guideline 3 (SCG-3) “Control Hydrogen Flammability” is activated. As stated before, a
hydrogen combustion can produce the containment impairing and limit its safety function, so SAG-7 and
SCG-3 are important during a SA, [131].
As seen in Section 3.2.1 “Mitigation Strategies against Hydrogen”, there are several ways to
manage hydrogen risk during a SA. It is possible to reduce hydrogen concentration and/or mass inside
the containment to limit the deflagration consequences. It is also possible to reduce the oxygen mass in
the containment, which will limit the hydrogen combustion. In detail, the containment venting strategy has
both pros and cons regarding the hydrogen risk, depending on the time of venting. An early venting
strategy can reduce the mass of hydrogen and/or oxygen, which will make the possible hydrogen burn
less energetic, but it can increase hydrogen concentration later in the accident, affecting the combustion
regime and inducing a DDT instead of a SD combustion. This is why it is particularly interesting to
investigate the timing for this strategy [194].
6.2 PWR-W Containment Model
In this section the specific design of the PWR-W GOTHIC containment model are detailed. The
main basis of the model is described in Section 4.5.3 “PWR-W containment GOTHIC 3D model”; however,
some add-ons have been implemented for this specific problem. A summarized model description is
explained below. This model has been created based on a CAD model, Figure 6-1.
The model consists of 11 control volumes connected by flow paths and/or 3D connectors that
represent each of the containment rooms, see Figure 6-2. Each room location can be seen in Table 13.
The main parameters of the PWR-W GOTHIC model for this work are shown in Table 14. The
pressure matrix solution method used was conjugate with the flux variables calculated up-stream with a
space differencing scheme of second order (BSOUP). Detailed information about the original model can
be found in Section 4.5.3 “PWR-W containment GOTHIC 3D model”.
The spray system is modeled using 16 Boundary Conditions (BCs) to represent the spray rings on
the containment dome. The total flux of a typical PWR-W spray system at full capacity is divided among
the BCs with an injection of 15 kg/s per spray component [195] and a droplet diameter of 0.05 cm. The
venting system is modeled as a BC at 101 kPa and 25 °C connected through a flowpath located at 41 m
height based on a typical PWR-W venting line location, [196].

Hydrogen Mitigation in a PWR-W Containment during a SBO Scenario; Tau Parameter Definition and
Application on Venting Strategy Analysis
162
Figure 6-2. GOTHIC containment model

Evaluation of the Hydrogen Risk; the Tau Parameter
163
6.3 Evaluation of the Hydrogen Risk; the Tau Parameter
In this section the qualitative and quantitative approach to the hydrogen risk is exposed. The
combustion properties of hydrogen, which are the basis of the definition can be found in Section 2.2.2
“Hydrogen Flammability”. The Tau parameter is the result of the quantitative approach to hydrogen risk,
seen as the product of likelihood and consequence of a hydrogen burn.
The Tau Parameter, (τ)
In this section a new parameter (τ) is proposed to evaluate the hydrogen risk in computational
models with high complexity. Risk is normally defined as the product between likelihood and consequence
of an event, so the Tau parameter will take this into account in its numerical form. When performing
several simulations it is useful to reduce to a common indicator all simulations results so this great amount
of information is gatherable in a single parameter. Actual research uses indicators such as possibility of
DDT FA or SD, but those simulations are not easily comparable one with each other in hydrogen risk
terms. A parameter is needed that can make the hydrogen risk quantifiable and being suitable for a large
number of computational cells.
As stated before, the danger of hydrogen depends on its combustion regime. This means, that SD
will have small impact compared to a detonation within the lambda regime inside a room; the parameter
Tau have to be a function of the combustion regime.
In addition, it should also be proportional to the time spent in this combustion regime, because it is
not the same having a hydrogen mixture within the flammability limits during 1 minute than 1 hour, as the
possibilities of an ignition rise. For this reason Tau have to be function of the time spent within the limits.
Finally, the mass of hydrogen in this regime will be taken into account. This is because the
consequences are different if the combustion burns 1 kilograms of hydrogen or 100 kilograms.
Concluding, the Tau parameter will be a function of the combustion regime, the time inside the regime
and the mass of hydrogen within the limits:
𝜏 = 𝑓(𝐶𝑜𝑚𝑏 𝑅𝑒𝑔𝑖𝑚𝑒, 𝑇𝑖𝑚𝑒, 𝑀𝑎𝑠𝑠)
The Tau parameter dependence is qualitatively defined. In the following sections will be defined
quantitatively.
6.3.1.1 Combustion Regime Hazard
In this section a quantitative approach to the hazard of each combustion regime will be made. There
are several examples among the literature where the hydrogen different combustion regimes are
presented, as they have been previously discussed in Section 2.3.1. In addition, an estimation of the
damage a hydrogen deflagration can provoke can be found in the works of [157]. In this study, a blast
criteria is exposed in terms of pressure increase and distance to the ignition. An adaptation of this criteria

Hydrogen Mitigation in a PWR-W Containment during a SBO Scenario; Tau Parameter Definition and
Application on Venting Strategy Analysis
164
is made to categorize the hazardousness of each regime. Under this criteria, the PWR-W containment is
supposed to be a low congestion region.
Taking into account the pressure peaks and the velocities that each regime produces, a multiplier
is applied depending on them:
Slow Deflagration (SD): This regime will have a multiplier of 0.4. This is because the pressure
load produced by this ignition is below the containment design limits. However, the temperature
increase produced could impair the function of internal components or measurement systems and
equipment, which are qualified for a maximum atmosphere temperature of 148.9 °C [184].
Flame Acceleration (FA): a multiplier of 0.85 is used. Its impact on the containment can be
noticeable, provoking its possible impairment, it will depend on the mass of hydrogen burned. The
pressure load can damage internal walls or systems. But this regime will certainly reach the
equipment and measurement limits for temperature [184].
Deflagration to Detonation Transition (DDT): a multiplier of 1 is applied, given that the conditions
during this scenario cannot be easily withstand by any equipment, system or indicator. The
pressure spike provoked has the potential to impair the containment. It could even be argued that
if a combustion under a DDT regime occurs near the primary system it could provoke a LOCA on
the PCS.
Once the Tau parameter dependence on the combustion regimes is quantitatively defined, it can
be expressed as stated in eq. (53). Being f functions of time and mass of every combustion regime.
𝜏 = 0.4 · 𝑓𝑆𝐷( 𝑇𝑖𝑚𝑒, 𝑀𝑎𝑠𝑠) + 0.85 · 𝑓𝐹𝐴( 𝑇𝑖𝑚𝑒, 𝑀𝑎𝑠𝑠) + 𝑓𝐷𝐷𝑇( 𝑇𝑖𝑚𝑒, 𝑀𝑎𝑠𝑠)
6.3.1.2 Time Hazard
The time spent in certain regime must be another important term on the equation. The longer the
time a mixture is under SD, FA or DDT conditions the higher the risk of a spark, and therefore an ignition
process. For example, it has been suspected that the spontaneous burn produced during the TMI-2
accident was initiated by a ringing telephone [72]; therefore the time the cell spends in certain regime is
considered for the quantitative approach of hydrogen risk.
Taking into account the combustion regime and the time spent within the limits the Tau parameter
is defined as stated in eq. (54).
𝜏 = 0.4 · 𝑡𝑆𝐷 · 𝑓𝑆𝐷( 𝑀𝑎𝑠𝑠) + 0.85 · 𝑡𝐹𝐴 · 𝑓𝐹𝐴( 𝑀𝑎𝑠𝑠) + 𝑡𝐷𝐷𝑇 · 𝑓𝐷𝐷𝑇( 𝑀𝑎𝑠𝑠)
Being tSD tFA and tDDT, the time the cell has spent in SD, FA or DDT regime respectively.
6.3.1.3 Mass Hazard
The Tau parameter will be evaluated in every cell of the model and calculated trough all time steps.
The time value will be multiplied by the mass which is currently under those flammability conditions. Then,
(22)
(23)
(21)

Evaluation of the Hydrogen Risk; the Tau Parameter
165
the hydrogen risk takes into account not only that the mixture is flammable and the time that is on those
condition, but also the mass that stays on those conditions. Finally, the Tau parameter is completely
defined in eq. (55):
𝜏 = 0.4 · 𝑡𝑆𝐷 · 𝑚𝐻2 + 0.85 · 𝑡𝐹𝐴 · 𝑚𝐻2 + 1 · 𝑡𝐷𝐷𝑇 · 𝑚𝐻2
Every time step, the combustion limits are evaluated on each cell, then, if those limits are
overpassed, the hydrogen mass is calculated. This mass is multiplied by the time step size and by the
combustion regime correspondent multiplier, and afterwards, this process is repeated for the next cell or
time step. To obtain a single value for a single simulation, every cell Tau parameter will be added up to
the total Tau (or hydrogen risk) of the simulation as shown in eq. (56).
𝜏𝑡𝑜𝑡 = ∑ 𝜏𝑖
𝑁 𝑐𝑒𝑙𝑙𝑠
𝑖=1
It is relevant to mention that the linearity in the mass and time factors is a necessity, because Tau
is designed to be mesh-independent and time-step independent. Otherwise a change in the mesh
simulating the same accident would provide a different Tau just because of numerical reasons.
6.3.1.4 Tau Normalization
In this work, in order to provide information just by the Tau figure itself, a normalization is made. It
is made in order that if it reaches or surpasses the value 1, the consequences are supposed unavoidable.
For this reason, the TMI-2 accident is taken as a reference for this normalization. This is because TMI-2
is the only source of random ignition process inside a PWR containment; the timing of this accident is
taken into account. If other containment type is analyzed, a different normalization can be made. There
are some uncertainties on TMI accident data, but, it is somewhat accepted that core uncovery started 130
minutes after the accident initiation and that the random ignition of hydrogen was produced about 8 hours
later. At the beginning, hydrogen flowed off the primary system through the Pressurizer (PZR) relief tank.
From the first hydrogen generation to its ignition approximately passed 27000 seconds. That means that
the hydrogen was floating 27000 seconds on the containment without combustion. It will be assumed that
if hydrogen has been inside the containment for 27000 seconds, the combustion would have occur with
high probability. To normalize the Tau parameter, the time the mixture is under combustion characteristics
is divided by 27000 to weight the risk. During the TMI accident, approximately 350 kilograms of hydrogen
combusted [66]. Therefore, the hydrogen mass is divided by 350 kilograms.
(24)

Hydrogen Mitigation in a PWR-W Containment during a SBO Scenario; Tau Parameter Definition and
Application on Venting Strategy Analysis
166
Figure 6-3 Hydrogen source (SBO reference case)
Figure 6-4 Liquid water source (SBO reference case)
Figure 6-5. Vapor source (SBO reference case)
0
0.02
0.04
0.06
0.08
0.1
0.12
0.14
0.16
0 2000 4000 6000 8000 10000
Mas
s fl
ow
H2
[kg/
s]
Time [s]
Mass flow (kg/s) Loop 1
Mass flow (kg/s) Loop 2
Mass flow (kg/s) Loop 3
0
3
6
9
12
15
18
21
0 2000 4000 6000 8000 10000
Mas
s Fl
ow
H20
Liq
[kg
/s]
Time [s]
Mass flow (kg/s) Loop 1
Mass flow (kg/s) Loop 2
Mass flow (kg/s) Loop 3
0
1
2
3
4
5
6
0 2000 4000 6000 8000 10000
Mas
s Fl
ow
H20
Vap
[kg
/s]
Time [s]
Mass flow (kg/s) Loop 1
Mass flow (kg/s) Loop 2
Mass flow (kg/s) Loop 3

SBO Reference Sequence
167
To combine both parameters, the total mass of hydrogen generated and the time it was in the
containment are multiplied, being 9450000 kilograms-seconds. To assure containment damage the
normalization will be made assuming the mixture under DDT regime. Resuming, a hydrogen mixture that
satisfies the lambda criterion (DDT regime) for 27000 seconds with a mass of 350 kilograms will reach
Tau equal to 1, which means that damage inside of the cell and its surroundings is almost unavoidable,
and the impairing the containment function.
Therefore, the normalized Tau parameter for this study is:
𝜏 = 0.4 ·𝑡𝑆𝐷
27000·
𝑚𝐻2
350+ 0.85
𝑡𝐹𝐴
27000·
𝑚𝐻2
350+ 1 ·
𝑡𝐷𝐷𝑇
27000·
𝑚𝐻2
350
It can be noticed in eq. (56) that this parameter can be greater than 1, indicating that damage is
very probable as it surpasses TMI conditions extensively.
6.4 SBO Reference Sequence
In this section, the SBO sequence is simulated and analyzed in a GOTHIC 3D containment model
in order to obtain the Tau value (hydrogen risk). The SBO sequence input is obtained from the MELCOR
code [20].
Mass & Energy Release
The reference sequence is a SBO scenario with Alternate Current (AC) recovery at 10000 seconds
that avoids the vessel failure but not the core damage. This sequence has been extracted from the
literature [197], and it has been applied in recent studies [109]. It maximizes the hydrogen generation in
a 3 Loop PWR-W during the in-vessel phase but it avoids the ex-vessel phase. The first leakage occur
through the pump seals creating a Seal LOCA (SLOCA) at 500 seconds. The first hydrogen release starts
after 7000 seconds approximately. Following NUREG/CR-6158 [198], the most unfavorable situation for
hydrogen generation is when the core reflood occurs when its temperature is very high (about 1800 K).
The core reach this state at 9000 seconds, just before the accumulators’ injection. The injected water is
rapidly evaporated, starting an intense steam-zirconium reaction with the consequent hydrogen
generation. After 10000 seconds, AC is assumed recovered, and therefore the safety injection systems,
so the hydrogen generation is assumed to stop. The M&E release for this sequence can be seen in the
following figures.
Reference SBO GOTHIC Simulation
Once the M&E release input is obtained, it must be implemented in the GOTHIC containment model
in order to obtain the hydrogen risk. The SLOCA is modeled using 9 BCs, one for each loop, and one for
each phase and species. The boundary conditions are located near the pumps of the correspondent loop.
The transient lasts 20000 seconds in order to achieve an adequate computational cost. The simulation
took 21 hours to complete using 8 cores of 2.2 GHz each. The simulation results are shown in Figure 6-6.
(25)

Hydrogen Mitigation in a PWR-W Containment during a SBO Scenario; Tau Parameter Definition and
Application on Venting Strategy Analysis
168
Figure 6-6. Hydrogen Concentration inside the containment rooms (SBO reference case)
Figure 6-7. Combustion regime limits reached inside the containment rooms (SBO reference case)
0
0.02
0.04
0.06
0.08
0.1
0.12
0.14
0 2000 4000 6000 8000 10000 12000 14000 16000 18000 20000
Hyd
roge
n v
olu
me
frac
tio
n
Time [s]
Room 1
Room 2
Room 3
Room 4
Room 5
Room 6
Room 7
Room 8
Room 9
Room 10
Room 11

SBO Reference Sequence
169
The variables shown are averaged in volume and porosity for each containment room, using an
upgraded version of ProTON, [146]. This version of ProTON calculates the averaged values for pressure,
temperature or species concentration for each room as well as the Tau parameter (hydrogen risk).
As shown in Figure 6-6, hydrogen concentration is not homogeneous during part of the transient.
At the beginning of the sequence, the hydrogen concentration starts to rise in all rooms, being quicker in
the rooms near the breaks. The highest peaks occur after the core reflood due to the accumulators’
injection. This rapid release of hydrogen creates the highest concentration peak (13.2 %) located in the
room 10. At that moment the hydrogen distribution has differences in concentration ranging between 10-
35 % in the different rooms. Room 5 is supposed to be isolated and that provokes that its properties
remain constant. The differences in hydrogen concentration at the beginning of the transient are similar
to the ones found in the literature, [111,199]. Approximately 3600 seconds after the end of the M&E
release, the hydrogen concentration is stabilized and homogenized in the whole containment, with small
differences due to height. The final hydrogen concentration is approximately 9 %. No stratification was
observed at the end of the simulation time (20000 s).
The most dangerous combustion regime achieved is shown in Figure 6-7; in this graph, whenever
a room reaches “1”, it means that the SD regime is reached in at least in one of its cells, “2” for FA and
“3” for DDT combustion regime. Concerning the worst combustion regime achieved, it can be seen that
the SD regime is quickly achieved in all rooms as soon as the hydrogen concentration starts to rise inside
them. The FA is achieved afterwards in all rooms, with an initial peak in Room 2 due to a hydrogen cloud
movement. The hydrogen concentration continues to rise, and lambda criterion is satisfied in certain
rooms leading to DDT conditions during hundreds of seconds, until the room conditions do not allow this
type of combustion. However, the containment remains reaching the FA combustion limits until the end
of the simulation.
The sequence pressure and temperature can be seen in Figure 6-8 and Figure 6-9. The pressure
inside the containment does not reach the set point for the venting for pressure relief or the set point for
entering SAG-6 “Control Containment Conditions” (normally 140 kPa). In addition, the temperature stays
below the equipment and instrumentation EQ limit (148.9°C) in all containment rooms so any
instrumentation damage is avoided. The hydrogen and steam/water release increases the pressure and
temperature in all rooms, as its release is made at high temperature.

Hydrogen Mitigation in a PWR-W Containment during a SBO Scenario; Tau Parameter Definition and
Application on Venting Strategy Analysis
170
Figure 6-8. Average Temperature inside the containment rooms (SBO reference case)
Figure 6-9 Average Pressure inside the containment (SBO reference case)
Figure 6-10 Tau evolution in every containment room (SBO reference case)
35
40
45
50
55
60
65
70
75
80
0 2000 4000 6000 8000 10000 12000 14000 16000 18000 20000
Tem
per
atu
re [°C
]
Time [s]
Room 1 Room 2
Room 3 Room 4
Room 5 Room 6
100
105
110
115
120
125
130
135
0 2000 4000 6000 8000 10000 12000 14000 16000 18000 20000
Pre
ssu
re [
kPa]
Time [s]
0.00001
0.0001
0.001
0.01
0.1
1
0 2000 4000 6000 8000 10000 12000 14000 16000 18000 20000
Tau
par
amet
er
Time [s]
Room 1Room 2Room 3Room 4Room 5Room 6Room 7Room 8

Sensitivity Analysis for Human Actions
171
Adding up all local Tau values of each cell in the model, the total Tau is normalized to TMI-like
conditions, obtaining 𝜏 = 0.553. This indicates that the hydrogen risk is high and that a spontaneous
ignition is somewhat probable. The Tau temporal evolution for each room can be seen in Figure 6-10.
The mayor contributor to the total Tau is Room 1 (the containment dome and open regions), because it
occupies the largest volume and holds the mayor part of the hydrogen mass. The Tau increases rapidly
during the first and second hydrogen release, and afterwards, it augments more slowly because the DDT
regime is no longer possible and the hydrogen mass remains constant inside the containment.
6.5 Sensitivity Analysis for Human Actions
Once the Tau parameter is established as a quantitative indicator of the hydrogen risk, an analysis
on the human actions, concerning the spray and the venting strategies, is made. In this sense, a sensitivity
study, which includes 65 simulations, has been performed to cover a large range of venting and spray
timing. To achieve an adequate computational cost, the simulations were finished after 20000 seconds
of transient. Every simulation took approximately 22 hours using 8 cores of 2.2 GHz each.
It is assumed that before venting the containment, the spray should be activated to reduce the
atmosphere FP concentration as it is normally encouraged by SAMGs [124]. If there is no other option,
the venting process will be executed without spraying in order to protect the containment integrity against
hydrogen deflagrations or detonations. The opening of the isolation valve for initiating the venting is
normally a human action that does not require AC or DC, and can be performed during a SBO. The
venting strategy does not have neither a starting point nor a fixed duration, so combinations of short, long,
early and delayed venting are considered. The spray is set to function during 2000 seconds, based on
particle retention studies [135] and it starts before the venting in all cases. It is assumed that the spray
could start at any time during the transient even if the AC is not yet recovered thanks to the dedicated
batteries or to the support of FLEX equipment [68].
The large number of simulations analyzed is necessary because venting or spraying the
containment have both positive and negative impacts on hydrogen risk that are difficult to predict. On the
one hand, the sprays induce a mixing on the containment that could decrease high concentration zones
of hydrogen [200]. On the other hand, spraying the containment could enhance the steam condensation,
and this phenomenon would increase the oxygen and hydrogen volume fraction leading to severe
combustion regimes, [134]. The venting strategy positive and negative effects have been previously
explained, and they are difficult to predict altogether, [194]. The sensitivity timing table is shown in Table
15 in Annex B.

Hydrogen Mitigation in a PWR-W Containment during a SBO Scenario; Tau Parameter Definition and
Application on Venting Strategy Analysis
172
Figure 6-11. Tau value of sensitivity analysis on human actions
Figure 6-12. Temporal evolution of Tau in representative cases.
0.4
0.45
0.5
0.55
0.6
0.65
0 2000 4000 6000 8000 10000 12000 14000 16000 18000
Tota
l Tau
Par
amet
er
Vent Starting Time [s]
0
0.1
0.2
0.3
0.4
0.5
0.6
5000 7000 9000 11000 13000 15000 17000 19000
Tau
Par
amet
er
Time [s]
No Venting No Spray
Venting (9500-10500 s) Spray (5500-7500 s)
Venting (16500-17500 s) Spray (11500-13500 s)
Venting (14500-15500 s) Spray (7500-9500 s)
Venting (4500-6500 s) No Spray
No venting hydrogen risk (τ = 0.553)
Hydrogen
release start
Hydrogen
release stop

Sensitivity Analysis for Human Actions
173
The key parameter compared in the sensitivity analysis is Tau. To extract a tendency, Tau is
compared against the venting start, the venting length and the delay between the spray and the venting
as can be seen in Figure 6-11. In this figure the time of the venting start is plotted against the Tau
parameter, the area of the bubble is proportional to the duration of the venting procedure and the color of
the bubble is dependent on the time between spray and venting.
The early venting strategy, that intends to decrease the oxygen concentration before the hydrogen
is released, is definitely not an adequate strategy as it cannot evacuate that much oxygen. As a
consequence, it will increase the hydrogen volume fraction and strengthen the combustion regime. In
addition, the venting operation produces flow patterns inside the containment that influence the hydrogen
risk which cannot be easily predicted. It can be seen that the early venting strategy increases the
hydrogen risk. There is no clear tendency at these initial moments on when to vent to increase as
minimum the Tau value as it can be seen on Figure 6-11. There is no clear tendency as well on the
duration of the venting on these early moments before the hydrogen release at 7000 seconds. In addition,
cases with or without spray on this early moments have no clear differences on hydrogen risk.
However, just after the beginning of the hydrogen release, a tendency can be observed on the
hydrogen risk. The closer the venting starting time is to the secondary hydrogen peak production (9000-
10000 seconds) the lower the Tau value drops. This is because if the venting occurs during this phase,
the hydrogen peak that produces the DDT limits to be surpassed, is avoided on most of the containment
rooms. This makes the Tau value to drop and in addition, if the venting is made once the hydrogen release
has started, several kilograms of it will be vented, reducing even more the total hydrogen risk.
Once the hydrogen is released, it can be stated that the longer the venting the better, because more
hydrogen is evacuated from the containment, reducing the Tau value. The total mass of hydrogen
evacuated by a 1000 seconds venting after the hydrogen peak is approximately 100 kilograms, which
represent about an 18 % of the total hydrogen released.
In addition, Figure 6-11 shows that there is no clear tendency on the optimal moment to spray to
reduce the hydrogen risk; the spray have a small effect compared to the venting starting time. There is
small influence if the spray is activated at the time coincident with the hydrogen peak, because the spray
will condense steam, and consequently increase the hydrogen volume fraction at the moment where the
DDT regime can be achieved.

Hydrogen Mitigation in a PWR-W Containment during a SBO Scenario; Tau Parameter Definition and
Application on Venting Strategy Analysis
174
Figure 6-13. Tau temporal change rate in representative cases
Figure 6-14. Maximum temperature reached (SBO reference case)
0
0.00001
0.00002
0.00003
0.00004
0.00005
0.00006
5000 7000 9000 11000 13000 15000 17000 19000
Tau
ch
ange
rat
e: dτ/
dt
Time [s]
No Venting No Spray
Venting (9500-10500 s) Spray (5500-7500 s)Venting (16500-17500 s) Spray (11500-13500 s)Venting (14500-15500 s) Spray (7500-9500 s)Venting (4500-6500 s) No Spray
35
55
75
95
115
135
155
175
0 2000 4000 6000 8000 10000 12000 14000 16000 18000 20000
Tem
per
atu
re [°C
]
Time [s]
Room 1 Room 2 Room 3 Room 4 Room 5 Room 6
Room 7 Room 8 Room 9 Room 10 Room 11
Generic EQ limit temperature

Results, Discussion and Proposal
175
Figure 6-12 shows the Tau temporal evolution for five specific cases. It can be seen that those who
vent earlier will reduce its slope before and therefore the final Tau will be lower. In addition the spray does
not significantly modifies the Tau trend, and the main influencer is the venting operation. Moreover, the
simulation that reduces the amount of gases inside the containment prior to the hydrogen release, have
a higher slope because of the higher hydrogen volume fraction resultant. It is shown in Figure 6-13 the
derivative of Tau with respect to time. It can be seen that the mayor contributors to the Tau change rate
are the venting starting time and the hydrogen releases.
6.6 Results, Discussion and Proposal
As it has been discussed on the previous section, some venting strategies can reduce the hydrogen
risk considerably inside containment. These simulations show that the hydrogen risk can be reduced not
only by reducing the hydrogen mass inside the containment, but also by limiting the worst deflagration
possible. For this reason, the venting action could be based on hydrogen concentration in addition to
venting due to pressure overloads.
Figure 6-15 shows the gas volume fractions in the containment upper region. This concentration
could be captured by a hydrogen monitor in this location. This indicator should be powered by batteries
in order to be available during a SBO transient. According to this graph, the optimal period for venting
would be between 8500 and 12500 seconds after the beginning of the transient. Note that this venting
operation time is for this specific SBO case. Regarding SAs and core integrity, there are still several
uncertainties, so it is better to link this strategy to hydrogen concentration and not to a specific timing.
Consequently, the optimal window for the vent operation will be when the hydrogen concentration reaches
a gas volume fraction of 4 % with a slope of 2.5·10-5 s-1. After that time, the hydrogen risk is reduced when
venting is activated. It is mentionable that this hydrogen concentration is similar to those who are the set
point to enter SAG-7. This optimal window finishes after the hydrogen generation peak (12500 s) because
the DDT regime, which appears on certain rooms, cannot be avoided. In addition the earlier the hydrogen
is evacuated from the containment the better relative to hydrogen risk.
If the spray system is available at that time, it is required to be activated before venting to wash out
the FPs. If it is not available, then the vent system should be activated as early as possible when inside
the optimal window to spread as minimum FPs as possible.
Following the statements achieved in Section 5 “Analysis of Equipment and Instrumentation EQ
using 3D containment models”, it is necessary to observe if this indicator will be available during the
accident regarding the maximum allowed temperature. As shown in Figure 6-14, the maximum
temperature allowed of 148.9 °C, is not surpassed in any cell of the model. The maximum temperatures
reached are not even close to this limit, so therefore, no detailed analysis was found necessary.

Hydrogen Mitigation in a PWR-W Containment during a SBO Scenario; Tau Parameter Definition and
Application on Venting Strategy Analysis
176
Figure 6-15. Gas volume fractions in an indicator in the dome region.
0
0.1
0.2
0.3
0.4
0.5
0.6
0.7
0.8
0.9
0 5000 10000 15000 20000
Gas
Vo
lum
e Fr
acti
on
Time (s)
Gas volume Fractions in the indicator in SBO base case
Nitrogen
Hydrogen
Oxigen
Steam
Optimal window for
vent operation
Measurement
location

Conclusions
177
6.7 Conclusions
SA remains as one of the most important and challenging fields for nuclear safety. It involves
phenomenology with high uncertainties, which is hard to predict or simulate with computer codes. In a
SA, hydrogen can be generated during a core degradation. This is a strong threat on containment integrity
because of the possibility of the combustion in a violent regime between hydrogen and oxygen. The
SAMGs have been developed to guide the operators in taking the best decisions in the accident
management. However, the decision for venting the containment in order to reduce the hydrogen risk is
a strategy that has not been studied in detail with the current capabilities.
Simulating hydrogen transport in a containment is a challenging task because of the typical
containment size, the different species and phases involved or the condensation phenomena. The
computational cost required for the simulations is normally elevated because of the extended duration of
the transients and the complexity of the mentioned phenomenology.
In this study, the Tau parameter is created and defined to quantify the hydrogen risk. The Tau
parameter takes into account three aspects of the hydrogen hazardousness: the time a hydrogen cloud
spends within the flammability limits, the mass of hydrogen that is within the flammability limits, and the
combustion regime achieved (SD, FA or DDT). With this parameter it is possible to reduce a simulation
to a single value to quantify the hydrogen risk and being able to compare different scenarios.
As an application, a sensitivity analysis in a SBO scenario with containment vent and spray system
have been performed. The sensitivity analysis includes different operation times for venting and spraying.
The results of this analysis have shown the following:
First, venting the containment before the hydrogen release in order to reduce the amount of oxygen
and therefore reduce the hydrogen burn is not effective because there is enough supply of oxygen
remaining in the containment, and because it will vent steam, that helps inerting the containment. All
simulations with a venting prior to the hydrogen release show a higher Tau value (hydrogen risk) than the
no venting simulation. In addition, venting the containment before the hydrogen release creates flow
patterns inside the containment, that influence the Tau value but not in an easily predictable manner.
Some time period for venting increases more the hydrogen risk while other increases it less without a
clear tendency.
Second, the optimal time for venting appears just after the hydrogen release peak occurs. This way,
the most severe deflagration regime is normally avoided in most of the rooms. Approximately 100
kilograms of hydrogen are evacuated from the containment in a 1000 seconds venting reducing even
more the Tau value, because this mass does not stay in the containment.
Third, the spray timing has a very small influence on Tau if compared to venting. However, if the
spray is made during the hydrogen peak, the steam condensation it induces increased slightly the
hydrogen concentration and therefore the potential to reach a DDT regime.

Hydrogen Mitigation in a PWR-W Containment during a SBO Scenario; Tau Parameter Definition and
Application on Venting Strategy Analysis
178
Fourth, the venting strategy has therefore an optimal time window. This fact has encouraged the
authors to present a proposal for optimal venting time to decrease the hydrogen risk. To vent in this
specific window, an indicator of hydrogen concentration could be used to help the operators during a SA.
Summarizing all the results, it is now clear that the venting strategy, if properly performed, can
reduce the hydrogen risk inside the containment. In a SBO scenario, the venting strategy may be the only
option to deal with rapid hydrogen releases and it could avoid containment damage and emission of large
quantities of FPs to the environment. This knowledge could help in the future development and/or revision
of SAMGs for hydrogen management guidelines.

Annex B
179
6.8 Annex B
In this annex, the complete record of all the simulated cases for the sensitivity analysis is shown.
Containment Spray Venting τ
Opening (s) Close (s) Opening (s) Close (s)
Not used Not used Not used Not used 0.5535
Not used Not used 8500 9500 0.51676266
Not used Not used 7500 9500 0.55003158
Not used Not used 6500 8500 0.58795289
Not used Not used 6500 7500 0.58096832
Not used Not used 5500 7500 0.58206441
Not used Not used 5500 6500 0.57532956
Not used Not used 5000 6000 0.62675629
Not used Not used 4500 6500 0.61508782
Not used Not used 4500 8100 0.55109484
Not used Not used 4500 5500 0.6065548
Not used Not used 4000 5000 0.62980579
Not used Not used 3500 5500 0.58916795
Not used Not used 3500 7100 0.53497065
Not used Not used 3500 7500 0.60647572
Not used Not used 3500 4500 0.59152983
Not used Not used 2500 4500 0.58385635
Not used Not used 2500 6100 0.5865157
Not used Not used 2500 7500 0.5894621
Not used Not used 2500 3500 0.5932431
Not used Not used 1500 7500 0.59653531
Not used Not used 8500 9500 0.51676266
2500 4500 4500 6500 0.51862871
2500 4500 5500 7500 0.62431494
2500 4500 6500 8500 0.6296266
2500 4500 6500 7500 0.61808061

Hydrogen Mitigation in a PWR-W Containment during a SBO Scenario; Tau Parameter Definition and
Application on Venting Strategy Analysis
180
2500 4500 5500 6500 0.58158142
2500 4500 4500 5500 0.61318382
2500 4500 7500 9500 0.61427931
2500 4500 8500 9500 0.59953197
3500 5500 5500 7500 0.50385631
3500 5500 6500 8500 0.59018908
3500 5500 6500 7500 0.63446736
3500 5500 5500 6500 0.61811093
3500 5500 7500 9500 0.62961041
3500 5500 8500 9500 0.61759444
4500 6500 6500 8500 0.51702486
4500 6500 6500 7500 0.59014998
4500 6500 7500 9500 0.61955304
4500 6500 8500 9500 0.59972636
5500 7500 7500 9500 0.51944334
5500 7500 8500 9500 0.4962516
6500 8500 8500 9500 0.45159354
9500 11500 5500 7500 0.45907972
5500 7500 9500 10500 0.43177224
5500 7500 10500 11500 0.45814773
5500 7500 11500 12500 0.50200346
5500 7500 12500 13500 0.59497748
5500 7500 14500 15500 0.5101354
5500 7500 16500 17500 0.51399229
7500 9500 9500 10500 0.49694421
7500 9500 10500 11500 0.47523259
7500 9500 11500 12500 0.4625748
7500 9500 12500 13500 0.44722437
7500 9500 14500 15500 0.51718014
7500 9500 16500 17500 0.53520054

Annex B
181
9500 11500 10500 11500 0.49840799
9500 11500 11500 12500 0.47465659
9500 11500 12500 13500 0.46466325
9500 11500 14500 15500 0.45553672
9500 11500 16500 17500 0.51777718
11500 13500 12500 13500 0.52153483
11500 13500 14500 15500 0.47995842
11500 13500 16500 17500 0.52159113
13500 15500 14500 15500 0.49674074
Table 15. Timing for containment venting and spray for the sensitivity analysis.

Thesis’ Conclusions
182
Thesis’ Conclusions
Nuclear safety is getting more mature as a discipline in terms of containment CFD modeling.
Recent advances in code developing and computational power have pushed the LPM approach apart,
and have brought into the international scene the 3D integral containment approach. This new character
in the play demands new methodologies, procedures and analysis tools. The main advances originated
in this Thesis have to do with these mentioned demands.
Starting with the creation of a 3D model, the methodology developed to create a containment 3D
model in GOTHIC points out that a simplified CAD model is essential for this duty, in order to obtain
blockages coordinates. Afterwards, a script is needed in order to implement this geometry coordinates
into the thermal-hydraulic GOTHIC model.
The use of a verified code such as GOTHIC, needs to be complemented to perform a full 3D
transient simulation. The mesh independence study is a strict requirement in order to give credibility to
the simulation results. The verification process for the PWR-W GOTHIC containment model has proven
that a characteristic length of 5 m is enough to capture the relevant phenomena during a M & E release.
However if the target variables are maximums (such as maximum temperature), the mesh refinement
should be higher.
It is important to notice that if the target variable of the simulation analysis is the pressure, the LP
approach is perfectly valid in providing adequate results, given that pressure is transported at sonic
speed, and it is almost homogeneous during the majority of the transients.
Deepen in this research line, containment equipment and instrumentation are qualified based on
the pressure and temperature peak values, normally calculated with LP models, assumed to be local.
However, the containment temperature obtained with LP models is an average temperature and does not
correctly represent the heterogeneity of this phenomena.
For this reason, a re-analysis of these temperature limits is made setting the maximum temperature
locally allowed in 148.9 °C with an 8 °C margin. The application of this EQ criteria to a design basis LOCA
in the PWR-W containment shows that in all the sensitivities analyzed, at least in one room the generic
temperature limit is surpassed. This implies that the qualification basis for equipment and instrumentation
should be made taking into account the results from local values, because the temperature heterogeneity
in the containment rooms makes insufficient the average values.
The use of a 3D containment model in a SA simulation has required of some post-processing tools.
For example, if the target variable of the simulation is the hydrogen risk, a quantification of that risk was
needed. In this sense, a novel parameter called Tau has been proposed; which can quantify the hydrogen
risk of a full transient. The Tau parameter takes into account three aspects of the hydrogen risk: the time
a hydrogen cloud spends within the flammability limits, the mass of hydrogen within the flammability limits,
and the combustion regime achieved (SD, FA or DDT).

Thesis’ Conclusions
183
Once the Tau parameter is set, a sensitivity analysis can be performed in order to provide insights
on any desired variable. Therefore, as an application, a sensitivity analysis in a SBO scenario with
containment vent and spray system have been performed. The sensitivity analysis includes variance on
the target variables: operation times for venting and spraying. The results of this analysis have shown
several insights:
Firstly, the action of venting the containment before the hydrogen release in order to reduce the
amount of oxygen and therefore reduce the hydrogen burn is not effective because there is enough
oxygen remaining in the containment, and it is not the limiting species. All simulations with a venting prior
to the hydrogen release show a higher Tau value (hydrogen risk) than the no-venting simulation. In
addition, venting the containment before the hydrogen release creates flow patterns inside the
containment, that influence the Tau value but not in an easily predictable manner. Some time period for
venting increases the hydrogen risk largely while other increases it less without a clear tendency.
Secondly, the optimal time for venting appears just after the hydrogen release peak occurs. This
way, the most severe deflagration regime is normally avoided in most of the rooms. Approximately 100
kilograms of hydrogen are evacuated from the containment in a 1000 seconds venting reducing even
more the Tau.
Thirdly, the spray timing has a very small influence on Tau if compared to venting. However, if the
spray is made during the hydrogen peak, the steam condensation it induces increased slightly the
hydrogen concentration and therefore the potential to reach a DDT regime.
As a final conclusion, the venting strategy has therefore an optimal time window. This fact has
encouraged the authors to present a proposal for optimal venting time to decrease the hydrogen risk. To
vent in this specific window, an indicator of hydrogen concentration could be used to help the operators
during a SA.
Summarizing all these results, it is now clear that the venting strategy, if properly performed, can
reduce the hydrogen risk inside the containment. During a SBO scenario, the venting strategy may be the
only option to deal with hydrogen and it could avoid containment damage and emission of large quantities
of FPs to the environment. This knowledge could help in the future development and/or revision of SAMGs
for hydrogen management guidelines.
Condensing all knowledge acquired during this study, and regarding all methodologies and
advantages obtained with 3D containment analyses, it is definitely the moment to include 3D containment
analyses in the licensing process for future NPPs.

Bibliography
184
Bibliography
[1] USAEC. Summary Report of Reactor Safeguards Committee. Technical Report WASH-3 1950.
[2] NRC. Perspectives on Reactor Safety. NUREG/CR-6042, Rev 2; SAND 93-0971 1997.
[3] USAEC. Theoretical possibilities and consequences of major accidents in large nuclear power plants. Technical Report WASH-740 1957.
[4] NRC. CFR Title 10 Part 100 Reactors Site Criteria. 1962.
[5] THE_ADVISORY_COMMITTEE_ON_REACTOR_Safeguards. Report on the integrity of reactor
vessels for light water power reactors☆. Nuclear Engineering and Design 1974;28:147–95. doi:10.1016/0029-5493(74)90031-4.
[6] NRC. CFR Title 10 Part 51, Environmental protection regulations for domestic licensing and related regulatory functions. 1971.
[7] Hewitt GF, Collier JG. Introduction to Nuclear Power, Second Edition. Taylor & Francis; 2000.
[8] Sehgal BR. Nuclear Safety in Light Water Reactors - Severe Accident Phenomenology. Academic Press; 2012.
[9] NRC. Reactor safety study. An assessment of accident risks in U. S. commercial nuclear power plants. Executive summary: main report. [PWR and BWR]. WASH-1400 (NUREG 75/014) 1975. doi:10.2172/7134131.
[10] Henry RE. OVERVIEW: UNCERTAINTIES REMAINING IN SEVERE ACCIDENT PHENOMENOLOGY. vol. NEA-CSNI-R. 1995.
[11] USAEC. Emergency Core Cooling. US AEC Report TID-24226 1968.
[12] AEC. The Safety of Nuclear Power Reactors (Light water cooled) and Related Facilities. 1973.
[13] COTTRELL WB. ECCS rule-making hearing. 1974.
[14] Lewis HW, Budnitz RJ, Castleman AW, Dorfan DE, Finlayson FC, Garwin RL, et al. Report to the American Physical Society by the study group on light-water reactor safety. Reviews of Modern Physics 1975;47:S1.
[15] Modro SM, Aksan SN, Berta VT, Whaba AB. Review of LOFT Large Break Experiments. 1989.
[16] Commission UP. President’s Commission on the Accident at Three Mile Island Remarks Announcing Actions in Response to the Commission’s Report. 1979.
[17] Gómez-García-Toraño I, Sánchez-Espinoza V-H, Stieglitz R, Stuckert J, Laborde L, Belon S. Validation of ASTECV2.1 based on the QUENCH-08 experiment. Nuclear Engineering and Design 2017;314:29–43. doi:10.1016/j.nucengdes.2016.12.039.
[18] Woods BG, Collins B. RELAP5-3D modeling of PWR steam generator condensation experiments at the Oregon State University APEX facility. Nuclear Engineering and Design 2009;239:1925–32. doi:10.1016/j.nucengdes.2009.04.007.
[19] Kliem S, Kozmenkov Y, Höhne T, Rohde U. Analyses of the V1000CT-1 benchmark with the DYN3D/ATHLET and DYN3D/RELAP coupled code systems including a coolant mixing model validated against CFD calculations. Progress in Nuclear Energy 2006;48:830–48. doi:10.1016/j.pnucene.2006.06.008.
[20] Gauntt RO, Cole RK, Erickson CM, Gido RG, Gasser RD, Rodriguez SB, et al. MELCOR Computer Code Manuals. NUREG/CR-6119, Vol 2; SAND2000-2417/1 2000;3:247.
[21] Holt AB. The probability of catastrophic failure of reactor primary system components. Nuclear Engineering and Design 1974;28:239–51. doi:10.1016/0029-5493(74)90034-X.
[22] OECD/NEA. Five Years after the Fukushima Daiichi Accident: Nuclear Safety Improvements and Lessons Learnt. NEA No 7284 2016.
[23] Fernandez-Cosials MK, Jimenez G, Barreira P, Queral C. External flooding event analysis in a PWR-W with MAAP5. Annals of Nuclear Energy 2015;76:226–36. doi:10.1016/j.anucene.2014.09.055.
[24] Parisi C, Nevo A Del, Negrenti E, Sepielli M. ANALYSIS OF SBO ACCIDENT AT THE FUKUSHIMA

Bibliography
185
DAIICHI NPP UNIT 1. NURETH-15, PISA: 2013, p. 454.
[25] NRC. CFR Title 10 Part 50 Domestic Licesning of Production and Utilization Facilities. 1971.
[26] Hessheimer MF, Dameron RA. Containment Integrity Research at Sandia National Laboratories: An Overview. 2006.
[27] AREVA. UK EPR PCSR – Sub-Chapter 6 . 2 – Containment Systems 2012:1–129.
[28] NRC. CFR Title 10 Part 50.150 Aircraft impact assessment. 2009.
[29] Ostermann D, Krumb C, Wienand B. The Inner Containment of an EPR TM Pressurized Water Reactor. New Build and Innovation 2014;59:487–9.
[30] National_Laboratories S. Aircraft collision Test 1988. https://share-ng.sandia.gov/news/resources/video-gallery/index.html (accessed January 1, 2017).
[31] Nuclear-Power. Containment Building 2017. http://www.nuclear-power.net/nuclear-power-plant/containment-building/#prettyPhoto (accessed March 1, 2017).
[32] Ragheb M. Containment Structures. 2011.
[33] Westinghouse. Nuclear Safety Unequaled Desing n.d. http://www.westinghousenuclear.com/New-Plants/AP1000-PWR/Safety (accessed March 1, 2017).
[34] ROSATOM. AES-92 n.d. http://de.nucleopedia.org/images/thumb/9/9d/WWER-1000_V392.png/190px-WWER-1000_V392.png (accessed July 20, 2003).
[35] AREVA. EPR zasada dzialania n.d. http://polska.areva.com/home/liblocal/images/EPR/lay-out/ilot-nucleaire-numero10.PNG (accessed March 1, 2017).
[36] ASME. The Vallecitos Boiling Water Reactor. 1987.
[37] General Electric courtesy from NRC. Boiling Water Reactor Containments. n.d.
[38] Energy GHN. ESBWR Plant Description 2011.
[39] OECD/NEA. International Standard Problem ISP-47 on Containment Thermal-hydraulics, Final Report. NEA/CSNI/R(2007)10 2007.
[40] Travis JR, Jordan T, Royl P, Benz S, Xiao J, Xu Z. GASFLOW User’s Manual. Karlsrhue: 2011.
[41] Klein-Hessling; Arndt, S.; Weber, G.; Wolff, H.; Schwarz, S.; Spengler C. COCOSYS Short description. 2008.
[42] Tills J, Notafrancesco A, Phillips J. Application of the MELCOR Code to Design Basis PWR Large Dry Containment Analysis. 2009.
[43] Wolf L, Holzbauer H. Detailed Assessment of the Heiss Dampf Reaktor Hydrogen-Mixing Experiments E11. Nuclear Technology 1999;125:119–35.
[44] Fauske & Associates I. REVISED ACCIDENT SOURCE TERMS: NUREG-1465 vs MAAP 4.0.2. Technical Bulletin No 1295-2 n.d. http://www.fauske.com/sites/default/files/RevisedAccidentSourceTermsNUREG-1465vsMAAP4_0_2.pdf (accessed January 1, 2017).
[45] EPRI. GOTHIC Thermal Hydraulic Analysis Package, Version 8.1 (QA). vol. 1. Palo Alto, CA: 2014.
[46] Paladino D, Zboray R, Benz P, Andreani M. Three-gas mixture plume inducing mixing and stratification in a multi-compartment containment. Nuclear Engineering and Design 2010;240:210–20. doi:10.1016/j.nucengdes.2008.07.014.
[47] Andreani M, Kapulla R, Zboray R. Gas stratification break-up by a vertical jet: Simulations using the GOTHIC code. Nuclear Engineering and Design 2012;249:71–81. doi:10.1016/j.nucengdes.2011.06.004.
[48] Andreani M, Putz F, Dury T., Gjerloev C, Smith B. On the application of field codes to the analysis of gas mixing in large volumes: case studies using CFX and GOTHIC. Annals of Nuclear Energy 2003;30:685–714. doi:10.1016/S0306-4549(02)00113-5.
[49] Erkan N, Okamoto K. ANALYSIS OF PANDA SPRAY EXPERIMENTS PERFORMED IN TWO INTERCONNECTED VESSELS WITH OpenFOAM. NURETH-16, Chicago: 2015, p. 1251–60.
[50] Framatome. Analysis of Containment Response to Postulated Pipe Ruptures Using GOTHIC

Bibliography
186
2004:Baw-10252(Np).
[51] Ofstun R, Scobel J. Westinghouse Containment Analysis Methodology. WCAP-16608-NP 2006:1–164.
[52] Dominion. GOTHIC METHODOLOGY FOR ANALYZING THE RESPONSE TO POSTULATED PIPE RUPTURES INSIDE CONTAINMENT. DOM-NAF-3-NP-A 2006.
[53] Duke Power Company. Mass and Energy Release and Containment Response methodology. 2004.
[54] Ofstun R. Development and Qualification of a GOTHIC Containment Evaluation Model for the Kewaunee Nuclear Power Plant. WCAP-15667 2001.
[55] Duke Power Company. Mass and Energy Release and Containment Response Methodology. 1994.
[56] McMurtray AC. Letter From Anthony C. McMurtray (NRR) to Thomas Coutu (NMC) dated september 29 2003 Kewaunee Nuclear Power Plant Issuance of Amendment. 2003.
[57] Ofstun RP. Westinghouse Containment Analysis Methodology, Addendum 1, Appendix C, PWR LOCA Mass and Energy Release Input Calculation Methodology 2007.
[58] NRC. Pressure and Temperature Transient Analysis for Light Water Reactor Containments. ANSI/ANS-564 1983.
[59] Corradini LM. Turbulent condensation on a cold wall in the presence of a noncondensable gas. Nuclear Technology 1984;64:186–95.
[60] NASA. Safety standard for hydgogen and hydrogen systems. Guidelines for Hydrogen System Design, Materials Selection, Operations, Storage, and Transportation. vol. 25. 1997.
[61] Thomas J, Paul A, Inaki A, Daniele B, Herve B, Luc B, et al. Achievements of the EC network of excellence HySafe. International Journal of Hydrogen Energy 2011;36:2656–65. doi:10.1016/j.ijhydene.2010.05.087.
[62] Dahoe AE, Molkov VV. On the development of an International Curriculum on Hydrogen Safety Engineering and its implementation into educational programmes. International Journal of Hydrogen Energy 2007;32:1113–20. doi:10.1016/j.ijhydene.2006.07.006.
[63] Venetsanos AG, Adams P, Azkarate I, Bengaouer A, Brett L, Carcassi MN, et al. On the use of hydrogen in confined spaces: Results from the internal project InsHyde. International Journal of Hydrogen Energy 2011;36:2693–9. doi:10.1016/j.ijhydene.2010.05.030.
[64] H2 Incidents n.d. h2incidents.org (accessed January 1, 2017).
[65] King DB, Nicolette VF, Dandini VJ, Spletzer BL. Safety-Related Equipment Survival in Hydrogen Burns in Large Dry PWR Containment Buildings. NUREG/CR-4763 1988;SAND86-228.
[66] Kljenak I, Bentaib A, Jordan T. Early Containment Failure. In: Bal Raj Seghal, editor. Nuclear Safety in Light Water Reactors, Elsevier; 2012, p. 185–306. doi:10.1016/B978-0-12-388446-6.00003-4.
[67] OECD/NEA. The Fukushima Daiichi Nuclear Power Plant Accident: OECD/NEA Nuclear Safety Response and Lessons Learnt. 2013.
[68] NEI. Diverse and Flexible Coping Strategies (FLEX) Implementation Guide. NEI 12-06 2012.
[69] NRC. Recommendations for enhancing reactor safety in the 21st century. SECY-11-0093 2011.
[70] Sánchez AL, Williams FA. Recent advances in understanding of flammability characteristics of hydrogen. Progress in Energy and Combustion Science 2014;41:1–55. doi:10.1016/j.pecs.2013.10.002.
[71] Shapiro ZM, Moffette TR. Hydrogen flammability data and application to PWR loss-of-coolant accident. Pennsylvania: 1957. doi:OSTI Identifier: 4327402.
[72] OECD/NEA. Flame Acceleration and Deflagration-to-Detonation Transition in Nuclear Safety. NEA/CSNI/R(2000)7 2000:455.
[73] Williams FA. The Mathematics of Combustion. Society for Industrial and Applied Mathematics; 1985. doi:10.1137/1.9781611971064.
[74] Stamps D, Berman M. High-Temperature Hydrogen Combustion in Reactor Safety Applications. Nuclear Science and Engineering 1991;109:39–48.
[75] Kumar RK. Flammability Limits of Hydrogen-Oxygen-Diluent Mixtures. Journal of Fire Sciences 1985;3:245–62. doi:10.1177/073490418500300402.

Bibliography
187
[76] Byun CS, Jerng DW, Todreas NE, Driscoll MJ. Conceptual design and analysis of a semi-passive containment cooling system for a large concrete containment. Nuclear Engineering and Design 2000;199:227–42. doi:10.1016/S0029-5493(00)00228-4.
[77] Breitung W, Royl P. Procedure and tools for deterministic analysis and control of hydrogen behavior in severe accidents. Nuclear Engineering and Design 2000;202:249–68. doi:10.1016/S0029-5493(00)00380-0.
[78] Martín-Valdepeñas JM, Jiménez M a., Martín-Fuertes F, Fernández J a. Improvements in a CFD code for analysis of hydrogen behaviour within containments. Nuclear Engineering and Design 2007;237:627–47. doi:10.1016/j.nucengdes.2006.09.002.
[79] Dorofeev SB, Kuznetsov MS, Alekseev VI, Efimenko AA, Breitung W. Evaluation of limits for effective flame acceleration in hydrogen mixtures. Journal of Loss Prevention in the Process Industries 2001;14:583–9. doi:10.1016/S0950-4230(01)00050-X.
[80] OECD/NEA. ISP-49 on Hydrogen Combustion. NEA/CSNI/R(2011)9 2011.
[81] Karwat H, Bardelay J, Hashimoto T, Koroll G, Krause M, L’Heriteau JP, et al. State-of-the-art report on containment thermalhydraulics and hydrogen distribution, NEA/CSNI/R(99)16. 1999.
[82] Sherman MP, Berman M. The Possibility of Local Detonations During Degraded-Core Accidents in the Bellefonte Nuclear Power Plant. 1987.
[83] OECD/NEA. NEA/CSNI/R(2014)8. Status Report on Hydrogen Management and Related Computer Codes 2014.
[84] OECD/NEA. Assessment of CFD Codes for Nuclear Reactor Safety Problems. Nea/Csni/R(2014)12 2014:1–226.
[85] OECD/NEA. Best Practice Guidelines for the Use of CFD in Nuclear Reactor Safety Applications. Nea/Csni/R(2014)11 2014:1–176.
[86] Boivin P, Jiménez C, Sánchez AL, Williams FA. A four-step reduced mechanism for syngas combustion. Combustion and Flame 2011;158:1059–63. doi:10.1016/j.combustflame.2010.10.023.
[87] Knudson DL, Rempe JL, Lutz RJ. Scoping Study Investigating PWR Instrumentation during a Severe Accident Scenario. 2015.
[88] Rempe JL, Knudson DL. TMI-2 – A Case Study for PWR Instrumentation Performance During a Severe Accident. 2013.
[89] Fernández-Cosials MK, Jimenez G, Lopez-Alonso E. Analysis of a gas stratification break-up by a vertical jet using the GOTHIC code. Nuclear Engineering and Design 2016;297:123–35. doi:10.1016/j.nucengdes.2015.11.035.
[90] OECD/NEA. Status Report on Hydrogen Management and Related Computer Codes. NEA/CSNI/R(2014)8 2014.
[91] Huang G, Fang L. Analysis of hydrogen control in severe accidents of CANDU6. Annals of Nuclear Energy 2013;60:301–7. doi:10.1016/j.anucene.2013.04.019.
[92] Royl P, Rochholz H, Breitung W, Travis J., Necker G. Analysis of steam and hydrogen distributions with PAR mitigation in NPP containments. Nuclear Engineering and Design 2000;202:231–48. doi:10.1016/S0029-5493(00)00332-0.
[93] Bauwens CR, Dorofeev SB. CFD modeling and consequence analysis of an accidental hydrogen release in a large scale facility. International Journal of Hydrogen Energy, vol. 39, 2014, p. 20447–54. doi:10.1016/j.ijhydene.2014.04.142.
[94] Prabhudharwadkar DM, Iyer KN, Mohan N, Bajaj SS, Markandeya SG. Simulation of hydrogen distribution in an Indian Nuclear Reactor Containment. Nuclear Engineering and Design, vol. 241, Elsevier B.V.; 2011, p. 832–42. doi:10.1016/j.nucengdes.2010.11.012.
[95] Huang XG, Yang YH, Zhang SX. Analysis of hydrogen risk mitigation with passive autocatalytic recombiner system in CPR1000 NPP during a hypothetical station blackout. Annals of Nuclear Energy 2011;38:2762–9. doi:10.1016/j.anucene.2011.08.022.
[96] OECD/NEA. OECD/NEA THAI Project Hydrogen and Fission Product Issues Relevant for Containment Safety Assessment under Severe Accident Conditions Final Report 2010:1–33. doi:NEA/CSNI/R(2010)3.

Bibliography
188
[97] Bielert U, Breitung W, Kotchourko a., Royl P, Scholtyssek W, Veser a., et al. Multi-dimensional simulation of hydrogen distribution and turbulent combustion in severe accidents. Nuclear Engineering and Design 2001;209:165–72. doi:10.1016/S0029-5493(01)00399-5.
[98] Jong Tae JRK, Seong Wan H, Sang Baik K, Hee Dong K, Un Jang L, P. R, et al. 3-Dimensional Analysis of the Steam-Hydrogen Behavior from a Small Break Loss of Coolant Accident in the APR1400 Containment. Journal of the Korean Nuclear Society 2004;February:24–35.
[99] Kim J, Hong S-W. Analysis of hydrogen flame acceleration in APR1400 containment by coupling hydrogen distribution and combustion analysis codes. Progress in Nuclear Energy 2015;78:101–9. doi:10.1016/j.pnucene.2014.09.003.
[100] HSE. Generic Design Assessment – New Civil Reactor Build Step 4 Fault Studies – Containment and Severe Accident Assessment of the EDF and AREVA UK EPRTM Reactor. 2011.
[101] HSE. Generic Design Assessment – New Civil Reactor Build GDA Close-out for the EDF and AREVA UK EPRTM Reactor GDA Issue GI-UKEPR-RC-01 Revision 1 – Combustible Gas Control Systems. 2013.
[102] Dimmelmeier H, Eyink J, Movahed MA. Computational validation of the EPRTM combustible gas control system. Nuclear Engineering and Design 2012;249:118–24. doi:10.1016/j.nucengdes.2011.08.053.
[103] Xiao J, Breitung W, Kuznetsov M, Zhang H, Travis JR, Redlinger R, et al. GASFLOW-MPI: A new 3-D parallel all-speed CFD code for turbulent dispersion and combustion simulations Part II: First analysis of the hydrogen explosion in Fukushima Daiichi Unit 1. International Journal of Hydrogen Energy 2017. doi:10.1016/j.ijhydene.2017.01.219.
[104] HSE. Generic Design Assessment – New Civil Reactor Build Step 4 Reactor Chemistry Assessment of the Westinghouse AP1000® Reactor. 2013.
[105] Chan CK. Hydrogen Behavior in Containment, Washington D.C., USA: 2003.
[106] MHI. US-APWR Equipment Qualification Program 2013;MUAP-08015.
[107] Grgić D, Zdenko S, Bruno G. Prediction of Local Hydrogen Concentrations in PWR Containment Using GOTHIC code. Transactions of the American Nuclear Society, vol. 106, 2012, p. 24–8.
[108] Szabó T, Benz S, Kretzschmar F, Jordan T. Coupling of Melcor and Gasflow for Enhanced Simulation of Hydrogen Distribution During Accident Analysis. NURETH-15, PISA: 2013.
[109] López-Alonso E. A proposed methodology for passive autocatalytic recombiners sizing and location in LWR containments. Universidad Politécnica de Madrid, 2016.
[110] Papini D, Steiner P, Andreani M, Nič B, Klügel J, Prasser H, et al. Simulation of the hydrogen distribution in a power plant using the GOTHIC code. The 7th European Review Meeting on Severe Accident Research (ERMSAR-2015) 2015:24–6.
[111] Papini D, Andreani M, Ničeno B, Prasser H, Scherrer P, Psi I, et al. Simulation of hydrogen distribution in the containment during a severe accident with fast hydrogen-steam release. NURETH-16, Chicago: 2015, p. 1474–87.
[112] Jimenez G, Serrano C, Lopez-Alonso E, Molina M del C, Calvo D, García J, et al. BWR Mark III containment analyses using a GOTHIC 8.0 3D model. Annals of Nuclear Energy 2015;85:687–703. doi:10.1016/j.anucene.2015.06.025.
[113] Kelm S, Klauck M, Beck S, Allelein H-J, Preusser G, Sangiorgi M, et al. Generic Containment: Detailed comparison of containment simulations performed on plant scale. Annals of Nuclear Energy 2014;74:165–72. doi:10.1016/j.anucene.2014.07.006.
[114] Andreani M, Haller K, Heitsch M, Hemström B, Karppinen I, Macek J, et al. A benchmark exercise on the use of CFD codes for containment issues using best practice guidelines: A computational challenge. Nuclear Engineering and Design 2008;238:502–13. doi:10.1016/j.nucengdes.2007.01.021.
[115] Andreani M, Paladino D. Simulation of gas mixing and transport in a multi-compartment geometry using the GOTHIC containment code and relatively coarse meshes. Nuclear Engineering and Design 2010;240:1506–27. doi:10.1016/j.nucengdes.2010.02.020.
[116] Andreani M, Paladino D, George T. Simulation of basic gas mixing tests with condensation in the PANDA facility using the GOTHIC code. Nuclear Engineering and Design 2010;240:1528–47. doi:10.1016/j.nucengdes.2010.02.021.

Bibliography
189
[117] Andreani M, Badillo A, Kapulla R. Synthesis of the OECD/NEA-PSI CFD benchmark exercise. Nuclear Engineering and Design 2016;299:59–80. doi:10.1016/j.nucengdes.2015.12.029.
[118] Andreani M, Badillo A, Kapulla R, Smith B. SYNTHESIS OF THE OECD / NEA-PSI CFD BENCHMARK EXERCISE. NURETH-16, Chicago: 2015, p. 1787–801.
[119] Gallego E, Migoya E, Martín-Valdepeñas JM, Crespo A, García J, Venetsanos A, et al. An intercomparison exercise on the capabilities of CFD models to predict distribution and mixing of H2 in a closed vessel. International Journal of Hydrogen Energy 2007;32:2235–45. doi:10.1016/j.ijhydene.2007.04.009.
[120] Kljenak I, Kuznetsov M, Kostka P, Kubišova L, Manzini G, Povilaitis M. Simulation of hydrogen deflagration experiment–Benchmark exercise with lumped-parameter codes. Nuclear Engineering and Design 2015;283:51–9. doi:10.1016/j.nucengdes.2014.07.016.
[121] Paladino D, Mignot G, Kapulla R, Paranjape S, Andreani M, Studer E, et al. OECD / NEA HYMERES Project : For the Analysis and Mitigation of a Severe Accident Leading to Hydrogen Release Into a Nuclear Plant Containment. ICAPP 2014, 2014, p. 1314–22.
[122] Nishimura T, Hoshi H, Hotta A. Current research and development activities on fission products and hydrogen risk after the accident at Fukushima Daiichi Nuclear Power Station. Nuclear Engineering and Technology 2015;47:1–10. doi:10.1016/j.net.2014.12.002.
[123] Øwre F. Role of the man–machine interface in accident management strategies. Nuclear Engineering and Design 2001;209:201–10. doi:10.1016/S0029-5493(01)00403-4.
[124] EPRI. Severe Accident Management Guidance Technical Basis Report (Vol I and II). vol. 1. 2012.
[125] Green JM, Green JM. A Premixed Hydrogen / Oxygen Catalytic Igniter. vol. AIAA-89-23. 1989.
[126] Leyse M. Preventing Hydrogen Explosions In Severe Nuclear Accidents: Unresolved Safety Issues Involving Hydrogen Generation And Mitigation. 2014.
[127] Bachellerie E, Arnould F, Auglaire M, de Boeck B, Braillard O, Eckardt B, et al. Generic approach for designing and implementing a passive autocatalytic recombiner PAR-system in nuclear power plant containments. Nuclear Engineering and Design 2003;221:151–65. doi:10.1016/S0029-5493(02)00330-8.
[128] Reinecke E-A, Bentaib A, Kelm S, Jahn W, Meynet N, Caroli C. Open issues in the applicability of recombiner experiments and modelling to reactor simulations. Progress in Nuclear Energy 2010;52:136–47. doi:10.1016/j.pnucene.2009.09.010.
[129] Serrano C, Jimenez G, Molina M del C, López-Alonso E, Justo D, Zuriaga JV, et al. Proposed methodology for Passive Autocatalytic Recombiner sizing and location for a BWR Mark-III reactor containment building. Annals of Nuclear Energy 2016;94:589–602. doi:10.1016/j.anucene.2016.03.022.
[130] Vayssier G, Sehgal BR, Dinh N, Journeau C, Fischer M. Severe Accident Management. Nuclear Safety in Light Water Reactors, Elsevier; 2012, p. 519–88. doi:10.1016/B978-0-12-388446-6.00006-X.
[131] EPRI. Severe Accident Management Guidance Technical Basis Report (Volume 2 : The Physics of Accident Progression). TR-101869-V2 1992;2.
[132] Choi Y, Kim DH, Kim SD, Park SY, Jin YH. Computational Aid of CANDU Reactor Severe Accident Management Strategies for Containment Integrity. Transactions of the Korean Nuclear Society Spring Meeting 2010:491–2.
[133] Fauske & Associates. Evaluating the Venting Volumetric Release Rate. Technical Bulletin No 0895-1 n.d. https://www.fauske.com/sites/default/files/EvaluatingtheVentVolumetricReleaseRate.pdf (accessed January 1, 2017).
[134] Li YB, Cao XW. Strategy evaluation for fire spray system on Advanced Passive PWR Severe Accident Management Guideline. Progress in Nuclear Energy 2015;85:319–24. doi:10.1016/j.pnucene.2015.07.001.
[135] del Corno A, Morandi S, Parozzi F, Araneo L, Casella F. Experiments on aerosol removal by high-pressure water spray. Nuclear Engineering and Design 2017;311:28–34. doi:10.1016/j.nucengdes.2016.06.043.
[136] Jiménez G, Matías R, Fernández-Cosials K, Justo D, Bocanegra R, Mena L, et al. Estudio de la distribución de hidrógeno en una contención PWR con códigos CFD. Nuclear España 2015;363:53–5.

Bibliography
190
[137] Fernández-Cosials K, Jiménez G, Matías R. Investigations of the break-up of hydrogen stratification in a PWR with CFD codes. CFD4NRS, Zurich: 2014.
[138] EPRI. GOTHIC Thermal Hydraulic Analysis Package Version 8.2(QA). Palo Alto, CA: 2016.
[139] Bocanegra R, Jimenez G, Fernández-Cosials K. GOTHIC Advisory Group Meeting. GOTHIC Advisory Group Meeting Madrid, Madrid: 2017.
[140] Fernández-Cosials K, Andreani M, Jiménez G. On the augmentation factor of the heat transfer coefficient using the GOTHIC code during a jet interaction. GOTHIC Advisory Group Meeting, Madrid, Spain: 2017.
[141] Yadigaroglu G, Dreier J. Passive Advanced Water Reactor Design and the ALPHA programme at the Paul Scherrer Institut. Kerntechnik 1998;63:39–46.
[142] Morris MD. Factorial Sampling Plans for Preliminary Computational Experiments. Technometrics 1991;33:161–74. doi:10.2307/1269043.
[143] Roache PJ. QUANTIFICATION OF UNCERTAINTY IN COMPUTATIONAL FLUID DYNAMICS. Annual Review of Fluid Mechanics 1997;29:123–60. doi:10.1146/annurev.fluid.29.1.123.
[144] FERZIGER JH, PERIĆ M. FURTHER DISCUSSION OF NUMERICAL ERRORS IN CFD. International Journal for Numerical Methods in Fluids 1996;23:1263–74. doi:10.1002/(SICI)1097-0363(19961230)23:12<1263::AID-FLD478>3.0.CO;2-V.
[145] Blocken B. 50 years of Computational Wind Engineering: Past, present and future. Journal of Wind Engineering and Industrial Aerodynamics 2014;129:69–102. doi:10.1016/j.jweia.2014.03.008.
[146] Bocanegra R, Jimenez G, Fernández-Cosials MK. Development of a PWR-W GOTHIC 3D model for containment accident analysis. Annals of Nuclear Energy 2016;87:547–60. doi:10.1016/j.anucene.2015.10.022.
[147] Jiménez G, Bocanegra R, Fernández-Cosials K, Queral C, Montero-Mayorga J. Development of a PWR-W and an AP1000 containment building 3D model with a CFD code for Best-Estimate Thermal-Hydraulic Analysis. ICONE22, Prague: ASME; 2014, p. 6. doi:10.1115/ICONE22-30445.
[148] John Anderson. Computational Fluid Dynamics. McGraw-Hill Education; 1995.
[149] OECD/NEA. Containment Code Validation Matrix. NEA/CSNI/R(2014)3 2014.
[150] IAEA. Mitigation of hydrogen hazards in water cooled power reactors. IAEA-TECDOC-1196 2001:48.
[151] SNL. MELCOR Computer Code Manuals, Vol. 3: MELCOR Assessment Problems, Version 2.1.7347. 2015.
[152] OECD/NEA. ISP-29. Distribution of Hydrogen within the HDR containment under severe accident conditions. NEA/CSNI/R(93)4 1993.
[153] Jimenez Garcia MA, Martin-Fuertes F, Martin-Valdepenas J. MELCOR 183 application to NUPEC M-7-1 test (ISP-35) and two hydrogen severe accident scenarios in a typical PWR plant. AECL-11762 1997:547.
[154] Hoshi H, Ogino M, Kawabe R, Fukasawa M. Melcor Analysis on Tepco’S Fukushima Dai-Ichi Nps Accident. Nureth-15 2013:653.
[155] IAEA. Approaches and Tools for Severe Accident Analysis for Nuclear Power Plants, Safety Reports Series No. 56. Viena: 2008.
[156] MATLAB and Statistics Toolbox Release 2015a n.d.
[157] Dorofeev SB. Evaluation of safety distances related to unconfined hydrogen explosions. International Journal of Hydrogen Energy 2007;32:2118–24. doi:10.1016/j.ijhydene.2007.04.003.
[158] Dorofeev S. Deflagration to detonation transition in large confined volume of lean hydrogen-air mixtures. Combustion and Flame 1996;104:95–110. doi:10.1016/0010-2180(95)00113-1.
[159] Martin-Fuertes F, Fernandez JA, Aleza S, Máz I, Lopez JV, Sánchez J, et al. Analysis of three severe accident sequences(AB, SGTR and V) in a 3 loop W-PWR 900 MWe NPP with the MELCOR code. European Commission 1994;EUR 16054.
[160] Jimenez G, Bocanegra R, Fernández-Cosials K, Barreira P, Rey L, J.M. P, et al. Development of Almaraz and Trillo NPP containment GOTHIC 3D models for thermal-hydraulic analysis. European

Bibliography
191
Nuclear Conferfence, 2016.
[161] Jiménez G, Fernández-Cosials K, Bocanegra R, López-Alonso E. Best-estimate LOCA simulation in a PWR-W containment building with a detailed 3D GOTHIC model. ENYGF, Paris: 2015.
[162] Ofstun R. Development and Qualification of a GOTHIC Containment Evaluation Model for the Prairie Island Nuclear Generating Plants. WCAP-16219-NP 2004;Westinghou.
[163] Jiménez G, Bocanegra R, Fernández-Cosials K, Barreira P, Rey L, J.M. P, et al. Desarrollo de modelos 3D de los edificios de la Central Nuclear de Almaraz y de la Central Nuclear de Trillo con el código GOTHIC 8.0. Reunion Anual de la Sociedad Nuclear Española, Valencia, Spain.: 2014.
[164] Jimenez G, Bocanegra R, Fernández-Cosials K, Barreira P, Rey L, J.M. P, et al. Estudio Termo-hidráulico de los patrones de flujo tridimensional en las contenciones de C.N. Almaraz y C.N. Trillo con el código GOTHIC en un accidente tipo LBLOCA. Reunion Anual de la Sociedad Nuclear Española, Coruña, Spain: 2015.
[165] Fernández-Cosials K, Jiménez G, Estévez-Albuja S, Bocanegra R, Barreira P, Rey L, et al. Double-Ended LBLOCA Containment Analysis in Trillo NPP with GOTHIC 8.1. Reunion Anual de la Sociedad Nuclear Española, Santander, Spain.: 2016.
[166] Goñi Z, Jiménez G, Fernández-Cosials K, Queral C, Montero J. Análisis de un accidente tipo SBLOCA en la contención AP1000 con el código GOTHIC 8.0. Nuclear España 2016;373:72–6.
[167] Fernández-Cosials K, Goñi Z, Jiménez G, Queral C, Montero J. Three-dimensional simulation of a LBLOCA in a AP1000 containment buidling. International Youth Nuclear Congress, Hangzhou: 2016.
[168] Fernández-Cosials K, Bocanegra R, Estévez-Albuja S, Goñi Z, Jiménez G. Towards the definition of local damage criteria for containment safety analysis. Industriales Research Meeting, Madrid: 2017.
[169] Abdelghany JM, Guimond PJ, Higar KE, Wissinger GJ. Analysis of Containment Response to Postulated Pipe Ruptures Using GOTHIC. BAW-10252(NP) Revision 0 2004.
[170] WEC. Development and Qualification of a GOTHIC Containment Evaluation Model for the Prairie Island Nuclear Generating Plants g Containment Evaluation Model for the. WCAP-16219-NP 2004.
[171] Whitley RH, Chan CK, Okrent D. On the Analysis of containment heat transfer following a LOCA. Annals of Nuclear Engineering 1976;3:515–25.
[172] Euopean Commission. A comparison of European practices for the qualification of electrical and I & C equipment important to safety for European LWR nuclear power plant. EUR 16246 1996.
[173] Hyun K, Sup C, Soo D. Thermal Analysis for Environmental Qualification of Kori Nuclear power plant unit 3 and 4. Transactions of the Korean Nuclear Society Autumn Meeting 2006:1–2.
[174] Clark A, Fröding R. Combining Multiple Desing Basis Test Specifications into a single enveloping test. 26th Annual EQ Technical Meeting, Clearwater Beach, FL: 2014.
[175] Cavlina N, Feretic D, Grgic D, Spalj S, Spiler J. Use of GOTHIC Code for Assessment of Equipment Environmental Qualification. International Conference Nuclear Option in Countries with Small and Medium Electricity Grids 1996:227–34.
[176] NRC. Appendix A to Part 50- General Design Criteria for Nuclear Power Plants. 2015.
[177] EPRI. Plant Support Engineering: Nuclear Power Plant Equipment Qualification Reference Manual, Revision 1. 1021067 2010.
[178] NRC. Compendium of ECCS Research for Realistic LOCA Analysis. NUREG-1230 1988.
[179] Wolf L, Holzbauer H, Schall M, Con- KBM. Comparisons Between Lumped-Parameter Gothic Containment Analyses With Data. Nuclear Technology 1999;125:155–65.
[180] Kim J, Hong S-W, Kim S-B, Kim HD, Lee U, Royl P, et al. 3-Dimensional Analysis of the Steam-Hydrogen Behavior from a Small Brak Loss of Coolant Accident in the APR1400 Containment. Journal of the Korean Nuclear Society 2004;36:24–35.
[181] Abou-Rjeily Y, Cénérino G, Drozd A, Lee S, Misak J, Park CO, et al. Mitigation of Hydrogen Hazards in Severe Accidents in Nuclear Power Plants. 2011.
[182] NRC. CFR 10 Part 50.49 “Environmental Qualification of Electrical Equipment Important to Safety for Nuclear Power Plants.” Code of Federal Regulations 1983.

Bibliography
192
[183] NRC. Interim Staff Position on Environmental Qualification of Safety-Related Electrical Equipment. NUREG-0588 1981.
[184] IEEE. IEEE Standard for Qualifying Class 1E Equipment for Nuclear Power Generating Stations. IEEE Std 323-1974 1974. doi:10.1109/IEEESTD.1974.6568022.
[185] NRC. Environmental Qualification of Certain Electric Equipment Important to Safety for Nuclear Power Plants. Regulatory Guide 189 Revision 1 1984.
[186] IEEE. IEEE Standard for Qualifying Class 1E Equipment for Nuclear Power Generating Stations. IEEE Std 323-2003 2003. doi:10.1109/IEEESTD.2004.94415.
[187] IEEE. Nuclear facilities - Electrical equipment important to safety - Qualification. 2016.
[188] Basic I. Instrumentation to mitigate severe accidents. IAEA Training Workshop on Severe Accident Management Guideline, Vienna: 2015.
[189] Arcieri WC, Hanson DJ. Instrumentation Availability for a Pressurized Water Reactor With a Large Dry Containment During Severe Accidents. NUREG/CR-5691 1991.
[190] H. Hashemian. Maintenance of Process Instrumentation in Nuclear Power Plants. Berlin: Springer science + Bussiness media; 2006.
[191] Utkarsh Ayachit. The Paraview Guide. Kitware Inc.; 2015.
[192] Beeny B, Vaghetto R, Vierow K, Hassan YA. MELCOR and GOTHIC Analyses of a Large Dry Pressurized Water Reactor Containment to Support Resolution of GSI-191. Nuclear Technology 2016;196:292–302. doi:10.13182/NT16-36.
[193] NEI. Severe Accident Issue Closure Guidelines. NUMARC91-04 1994.
[194] OECD/NEA. Status Report on Filtered Containment Venting. NEA/CSNI/R(2014)7 2014.
[195] Huang XG, Yang YH, Cheng X, Al-Hawshabi NHA, Casey SP. Effect of spray on performance of the hydrogen mitigation system during LB-LOCA for CPR1000 NPP. Annals of Nuclear Energy 2011;38:1743–50. doi:10.1016/j.anucene.2011.04.003.
[196] Burelbach J, Lee S, Plys M, De la Rosa JC, Foronós J. Analysis of Potential Risk Caused by Hydrogen and Carbon Monoxide in Buildings attached to Containment for Ascó 1&2 and Vandellós II NPPs. PSA, 2015, p. 583–9.
[197] Martín-Valdepeñas JM, Jiménez MA, Martin-Fuertes F, Fernández JA. Definición de los parámetros fundamentales de los escenarios accidentales de riesgo de hidrógeno para centrales prototípicas españolas W-PWR de segunda y tercera generación. Madrid: 2000.
[198] Kuan P, Hanson DJ, Pafford DJ, Quick KS, Witt RJ. Implications for Accident Management of Adding Water to a Degrading Reactor Core. 1994.
[199] Commission of the European Communities. Hydrogen behaviour and Mitigation in Water.Cooled Nuclear Power Plant. COMMISSION OF THE EUROPEAN COMMUNITIES; 1991.
[200] Malet J, Huang X. Influence of spray characteristics on local light gas mixing in nuclear containment reactor applications. Computers & Fluids 2015;107:11–24. doi:10.1016/j.compfluid.2014.10.002.