ERYTHROCYTES MICROPARTICLES
37
1 !" #" $%%#&%’ ())*
-
Upload
nguyentuyen -
Category
Documents
-
view
224 -
download
3
Transcript of ERYTHROCYTES MICROPARTICLES
1
�
���������������� �� ���� ���������������� �
����������������� �������
����������������� ����������� ����
�
��������������
�
������������������������ �����!"#�"��������
��$��%%�#&�%�'��
())*�

2
Abstract
Scandal related to contaminated blood in the 80’s has dramatically changed the face of
transfusion medicine, and tremendous efforts have since been made to secure blood products
and to develop approaches while ensuring elimination of diseases transmitted by blood. In the
meantime, only a little advance has been made in the understanding of blood products.
Microparticles are small membrane-derived vesicles shed from stimulated cells. They are
implicated in many biological processes including hemostasis or intracellular communication,
but elevated number of microparticles is also often observed in various pathological
situations. For example, febril non hemolytic transfusion reactions, an unexplained fever, may
occasionally occurs after blood transfusion. An interesting hypothesis on the origin of this
fever would be implication of microparticles.
Improvement of knowledge on microparticules such as their formation, level in blood and
proteom may help to insure a better quality of blood products.
The aim of this work consists to develop methods that allow better characterization of
microparticles in blood products.

3
Table of contents Abstract ...................................................................................................................................... 2 1 Introduction ........................................................................................................................ 4
1.1 Overview of blood products ....................................................................................... 5 1.1.1 Erythrocyte concentrates .................................................................................... 5 1.1.2 Platelet concentrates ........................................................................................... 7 1.1.3 Fresh frozen plasma ........................................................................................... 7
1.2 Febrile non hemolytic transfusion reactions .............................................................. 8 1.3 Microparticles............................................................................................................. 9
1.3.1 Cells releasing microparticles ............................................................................ 9 1.3.2 Vesiculation of the plasma membrane, microparticles formation...................... 9 1.3.3 Phosphatidylserine ........................................................................................... 11 1.3.4 Functions of microparticles .............................................................................. 12 1.3.5 Scott syndrome................................................................................................. 13 1.3.6 Protein content of microparticles ..................................................................... 13 1.3.7 CD47 ................................................................................................................ 14
1.4 Aims of our studies .................................................................................................. 15 2 Materials and Methods ..................................................................................................... 16
2.1 Preparation of samples ............................................................................................. 16 2.1.1 Erythrocyte concentrates .................................................................................. 16 2.1.2 Sample of erythrocyte Microparticles .............................................................. 16 2.1.3 Erythrocyte lysates ........................................................................................... 17
2.2 Flow cytometry ........................................................................................................ 17 2.3 Proteomics................................................................................................................ 19
2.3.1 1D SDS PAGE ................................................................................................. 19 2.3.2 Protein identification by mass spectrometry .................................................... 20 2.3.3 Western blot analysis ....................................................................................... 21
2.4 Electron Microscopy ................................................................................................ 21 3 Results and discussion...................................................................................................... 23
3.1 Flow cytometry ........................................................................................................ 23 3.1.1 Count of microparticles .................................................................................... 23 3.1.2 Annexin-V........................................................................................................ 25
3.2 Proteomics................................................................................................................ 26 3.2.1 Silver staining 1D SDS PAGE ......................................................................... 26 3.2.2 Mass spectrometry............................................................................................ 26 3.2.3 Western Blot..................................................................................................... 28
3.3 Electron Microscopy ................................................................................................ 30 4 Conclusions ...................................................................................................................... 32 Acknowledgment ..................................................................................................................... 33 Reference List .......................................................................................................................... 34

4
1 Introduction
Each year, millions of blood products are transfused, for this reason many lives are concerned.
Because blood is the essential fluid of life, research in transfusion medicine is important, and
investigations on blood products should be developed, in order to increase transfusion safety.
Among several components, circulating blood contains small phospholipid vesicles called
microparticles (MPs), that are also known under the terms of microvesicles1 or ectosomes2.
The definition of MPs is not clear. Some authors consider that MPs are represented by every
vesicles that are released by cells, including exosomes that are vesicles smaller than 0,05 �m.
Others propose that MPs are characterized by sizes between 1 µm and 2 µm.
Those MPs of less than 1 µm in size are released from a variety of cells such as platelets, red
and white blood cells, or endothelial cells as well as other cell types3. They contain a subset of
proteins derived from their parent cells, mostly membrane proteins. MPs are heterogeneous,
and vary in size, phospholipids and protein composition. Release of MPs is a highly
controlled process prompted by various stimuli such as shear stress, complement attack,
proapoptotic stimulation or damage. MPs have a broad spectrum of biology activities. They
may facilitate cell-to-cell interactions, induce cell signalling, promote coagulation, or even
transfer receptors between two different cell types. However, all of those activities are not
fully demonstrated and the exact mechanisms involved in their production still need to be
elucidated.
An elevated level of MPs in plasma has been demonstrated in numerous diseases, such as
heparin-induce thrombocypenia4, thrombotic thrombocytopenic purpura5, diabetes6, acute
coronary syndromes7, cardio vascular disease8 or sepsis7. The aim of our study is to present
evidences that MPs are released from red blood cells during their storage, to evaluate their
5
sizes by electronic microscopy, to estimate their numbers as well as to identify their major
protein composition.
1.1 Overview of blood products
Three main labile blood product types are transfused : erythrocyte concentrates (EC), platelet
concentrates (PC) and fresh frozen plasma (FFP). Each of these products has to be stored
according to their particular components. However, during storage, modification or
degradation of those components may occur, and are known as storage lesions. Modifications
of many biochemical parameters have been identified over the years, notably those
concerning EC9. By using proteomic tools, modifications of the protein pattern of the
supernatant of EC during storage have been observed (Figure 1).
1.1.1 Erythrocyte concentrates
The main aim of red blood cell transfusion is to maintain the capacity of transporting and to
deliver O2 to tissues. EC are obtained from anticoagulated whole blood obtained from blood
donors. After centrifugation, filtration (to remove leukocytes and platelets), and having added
a conservative solution, red blood cells can be either stored or transfused to patients. Stored
cells are affected by numerous factors such as the type of anticoagulant, hematocrit, pH or
temperature, to mention only a few. Each factor is important and must be tightly controlled
because all may influence the storage conditions as well as the red blood cells viability. In
accordance with the European transfusion standards 10, at least 75% of erythrocytes must
survive 24-hours in vivo after transfusion. There are other constraints to consider, as a
minimum quantity of hemoglobin per units or a maximum rate of hemolysis. Table 1 presents
some characteristics of EC during storage.

6
Despite deep knowledge on red blood cells metabolism, the influencing factors of red blood
cells properties still need to be studied. At last, it should be mentioned that according to
certain studies, the age of the stored EC would increase the risk of transfusion complications
11, 12.
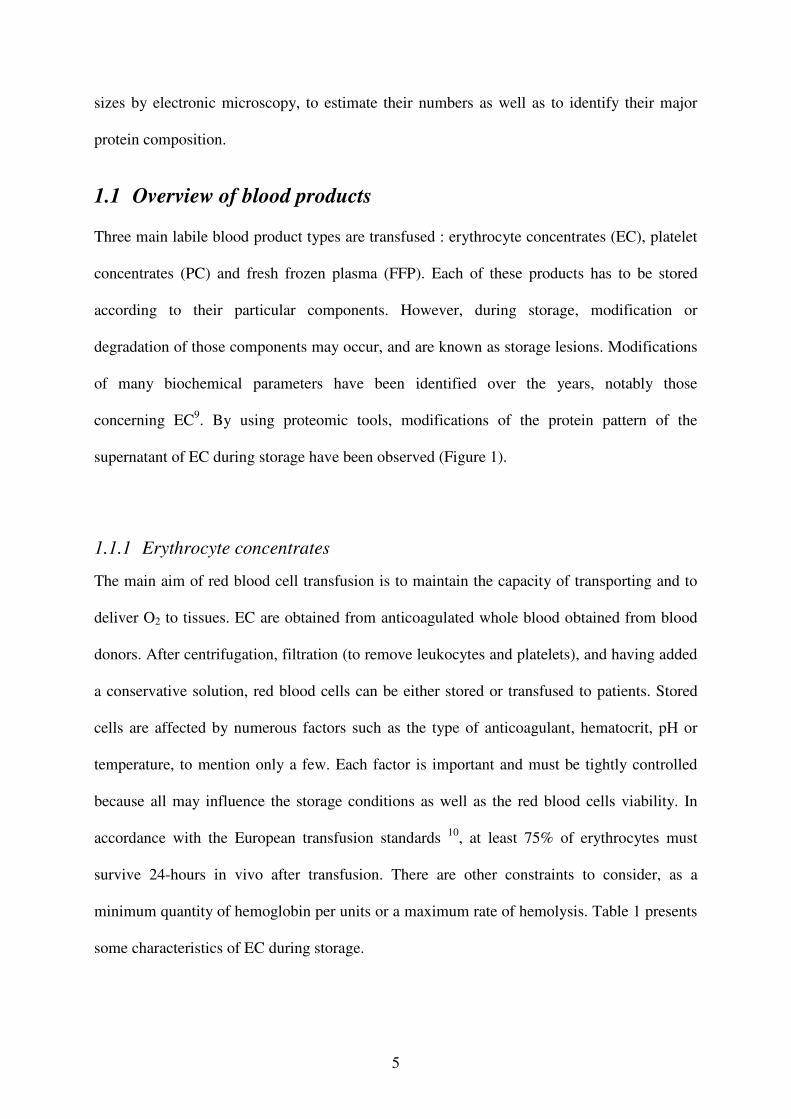
Figure 1 : Comparison of the 2-D patterns of the supernatant of an erythrocyte concentrate immediately after collection and after storage, at day 42. Eighty mL of blood (from a red blood cell concentrate prepared in a SAGM additive solution) were collected at day 0 and at day 42 (storage at 4°C). After centrifugation at 3000 g for 15 minutes, 20 mL of the supernatant were collected and concentrated to 500 µl on 10 kDa Vivaspin column. Fifty µg of proteins were “stained” using 400 pmol of Cy3 (day 0) and 400 pmol of Cy5 (day 42), respectively. Both sample were mixed and loaded on immobilized 4 to 7 non linear pH gradient followed by second dimension (9 to 16% polyacrylamide gel electrophoresis). 2-D fluorescence difference gel electrophoresis (Ettan™ DIGE) clearly showed several additional peptides accumulating after red blood cell storage at 4°C (spots arrowed in red in the zoom of the composite image). First dimension: immobilized 4 to 7 non linear pH gradient, second dimension: 9 to 16% polyacrylamide gel electrophoresis. Proteins were identified by MS (MALDI-TOF) (adapted from Queloz PA et al.9).
Day 0; Cy3 Day 42; Cy5
pI
Mr
Peroxiredoxin 2(P32119)
Apo-A1(P02647)
Day 0; Cy3 Day 42; Cy5
pI
Mr
pI
Mr
Peroxiredoxin 2(P32119)
Apo-A1(P02647)

7
Table 1 : Main biochemical characteristic of erythrocyte concentrate during storage Days of storage
Parameters 0 7 14 21 28 35 42 49 56
pH 6,92 6,79 6,65 6,55 6,47 6,40 6,35 6,29 6.24
Na+ (mmol/l) 102 88 83 79 74 71 69 69 65
K+ (mmol/l) 1,6 18,6 27,3 34,4 40,3 46,0 50,5 53,6 57,3
Hb libre (%) 0,08 0,14 0,17 0,23 0,31 0,28 0,3 0,5 0,52
Lactate (mmol/l) 1,79 10,26 16,13 21,55 27,66 28,96 32,77 24,53 29,59
Glucose (mmol/l) 26,8 22,3 18,8 15,7 13,1 10,9 9,0 7,2 5,9
2-3 DPG (% of the initial level
100 40-60 10 < 10 0 0 0 0 0
1.1.2 Platelet concentrates
Platelets play a fundamental role in hemostasis, they form plugs at the site of vascular lesion
by interaction with sub-endothelial matrix (adhesion) and with other platelets (aggregation).
PC are transfused into thrombocytopenic individuals as well as into patients whose platelets
are not fully functional. The most used process to collect platelet is apheresis. Storage
conditions, as for erythrocyte, are of importance. Platelet concentrates have a short period of
validity (5 days), and are quite sensitive to their environment, After 5 days, they undergo
irreversible activation and lesion. They are stored between 20°C to 24C° with constant
agitation. The temperature storage is critical and is associated with the potential risk of
bacterial growth that must be always considered. Unfortunately, it is still impossible to store
PC at 4°C, because at this temperature, a platelet membrane receptor is irreversibly modified,
leading to immediate phagocytosis by the liver macrophages of recipient9
1.1.3 Fresh frozen plasma
The objective of FFP transfusion is to maintain the coagulation parameters in bleeding
patients. However, the role and administration of FFP is still a debate subject in transfusion

8
medicine. Two common processes are used to obtain plasma for transfusion that are
centrifugation of whole blood and plasmapheresis. It is less difficult to store plasma, because
it is free of cells. Indeed, a long frozen period of storage is possible9.
1.2 Febrile non hemolytic transfusion reactions
As each treatment, blood transfusions entail advantages and drawbacks. Among them, febrile
non hemolytic transfusion reactions (FNHTR) still quite frequently occur. FNHTR is
characterized by a raise of the temperature of at least 1°C without any other explanation such
as red cell hemolysis or bacterial contamination of the product. Even if little is known on their
causes, it has been noticed that FNHTR rate is much lower when EC undergo leucoreduction.
The reported rates of FNHTR vary from 0.12 to 0.5%13. According to the 2006 report of the
Service régional vaudois de transfusion sanguine (SRTS VD), 45 FNHTR cases were
observed at the CHUV last year. Because 21’030 EC were distributed during the same period,
FNHTR occurred once every 470 transfusions (0.21%). With the appropriate precautions,
there are usually not serious consequences. Nevertheless, prevention is necessary because its
main symptom, fever, can be confused with more dangerous complications.
It has been shown that there is a link between the risk of transfusion complication and the age
of the transfused blood products11, 12. It has also been demonstrated that the number of MPs
increase with the age of blood products14. Thus, an interesting hypothesis is that MPs may
have a role in FNHRT.
9
1.3 Microparticles
1.3.1 Cells releasing microparticles
Platelet-derived MPs (PMPs) are the most studied and the most abundant; they represent more
than 90% of the plasma MPs from healthy individuals15. PMPs are not only involved in
hemostatic and inflammatory responses, but also in vascular remodling, angiogenesis16,
atherothrombosis, atherosclerosis8 and other diseases. A variety of stimuli such as ADP or
thrombin induce platelet to release of PMPs. Usually, those stimuli are involved in blood
coagulation.
Erythrocytes also release MPs (EMPs), which are generally smaller in size (0.15 µm) than
MPs described for other cells type. In addition of some similar activities to PMPs, EMPs may
be involved in red blood cells elimination and play a role in the complement system 17.
Monocytes, leukocytes and endothelial MPs play also an important role in several biological
activities, those MPs seem involved in cells communication (see below).
1.3.2 Vesiculation of the plasma membrane, microparticles formation
Cells are surrounded by a plasma membrane that is composed of a phospholipid bilayer. Each
of the two leaflets has a different lipid composition. Under normal physiological condition,
the two aminophospholipids, namely phosphatidylserine (PS) and phosphatidylethanoalamine
are mainly concentrated in the inner leaflet, whereas phosphatidylcholine and sphingomyelin
are on the external one. Aminophospholipids are negatively charged while the outer
phospholipids are neutral. The asymmetrical distribution of phospholipids in the plasma
membrane is actively maintained by three major enzyme systems : a flippase, a floppase, and
a scramblase. The flippase, an inward pump, is an ATP-dependent aminophospholipid
translocase responsible for rapid and specific translocation of PS and PE from the outer to the
inner leaflet against the electrochemical gradient. The floppase is an ATP-dependent
10
phospholipid translocase, less specific and much slower than flippase, it is an outwards pump
that facilitate transport of phospholipid from the inner to the outer leaflet. Scramblase is ATP-
independent but Ca2+-dependent enzyme that allows unspecifically phospholipid to move
randomly between both leaflets18.
During apoptosis or cell activation, the asymmetrical distribution of phospholipids disappears.
The concentration of cytosolic Ca2+ increases, that stimulates scramblase and floppase activity
and inhibits flippase. Consequently, the negatively charged aminophospholipids (PS and PE)
are exposed on the exoplamic side of both cells and MPs and are able to interact with outside.
This interaction plays an important physiological role in coagulation and apoptosis16, 19.
The change of phospholipid exposure is followed by membrane budding and MPs release.
Indeed Ca2+-dependent protease damages cytoskeleton proteins affecting by this way cell
shape and membrane mechanical stability. This process leads to MPs formation and release
that expose variable proportion of PS on their outer surface (Figure 2).
Moreover, in some case MPs can be released under less controlled situation, for example from
necrotic cells or from mechanical destruction of cells following injury. Investigations still in
process tend to highlight differences between MPs release and apoptotic blebs, even if
mechanisms are very similar.

11
Figure 2 : The plasma membrane response to cell stimulation The plasma membrane is a well-structured entity characterized by a controlled transverse distribution of lipids and proteins between the two leaflets but also by a lateral organization in domains termed ”rafts”. (From Hugel et al. 16).
1.3.3 Phosphatidylserine
Phosphatidylserine (PS) is a phospholipid (two fatty acids esterified on a glycerol molecule,
itself related to a phosphate group), whose phosphate group is associated to serine, an amino
acid. Because of its amphipilic character, it is a part of plasma membrane lipids. In
mammalians, PS is mainly located in the intracellular side. PS plays a key role in MP release
and has at least two main functions. PS promotes blood coagulation, and also constitutes a
recognition signal for clearance of senescent or apoptotic cells by the reticuloendothelial
system. Even if actors of PS externalisation seem to be the same in both case, regulatory
mechanism are most likely different16.

12
1.3.4 Functions of microparticles
One agrees that MPs release is an active process, but their role is not plainly elucidated.
Numerous studies show evidences of various activities. MPs are essential for hemostasis.
Indeed, MPs are effectors of the coagulation system20, especially PMPs. They provide
supplementary procoagulant phospholipids surfaces necessary for the assembly of the enzyme
complexes of the blood coagulation cascade. The catalytic properties of enzyme complexes
notably depend on phospholipid surfaces that are on the outer membrane of the cells and are
accessible to the coagulation factors. Thus, PS allow local concentrations needed in enzyme
to reach the kinetic requisites for optimal thrombin generation and efficient hemostasis.
Indeed, phospholipid surfaces significantly enhance the procoagulant activity of tissue factor,
the main blood coagulation initiator of the extrinsic pathway activated after cellular injury.
Catalytic components provided by the phospholipid rich surfaces allow both tenase and
prothrombinase complexes (procoagulant enzyme) to increase reaction rate by ~200-fold and
1000-fold, respectively21.
MPs are also effective vectors of biological information between two different cell types
within proximal or distal tissues. Leukocyte MPs activate endothelial cells or transfer
leukocyte antigens to epithelial cells. This transfer is usually associated modifications in cell
to cell adhesion properties and phosphorylation of cellular proteins22, 23.
Other studies have demonstrated that MPs may impair endothelial function24. Indeed, MPs
were found to induce vascular damages in isolated arteries. Under pathological situation, such
as myocardial infarction or preeclampsia, it was recently observed that MPs from apoptotic T
cells were responsible of endothelial dysfunction in both conductance and resistance arteries.
This dysfunction was due to the alteration of nitric oxide and prostacyclin pathway. It was
also established that endothelial dysfunction and reduction of nitric oxide synthase expression

13
was induced by circulating MPs from diabetics25. Those cases show the paracrine role of MPs
as vectors of bioactive effectors which impair endothelial function.
Other MPs roles in intercellular communication is also demonstrated. MPs derived from
platelets induce angiogenesis, both in vitro and in vivo. Platelet adhesion receptors are
transmitted to platelets MPs that deliver them later to hematopoietic stem cells. This would
favor endothelial homing by promoting chemotaxis, followed by cell migration and adhesion,
proliferation and survival26, 27.
1.3.5 Scott syndrome
Scott syndrome is a rare inherited hemorrhagic disorder link to the lack of scramblase activity.
As mentionned before, scramblase is an enzyme responsible for the transportation of
phospholipids randomly across the cell membrane. In the case of deficient scramblase, when
platelets are activated, phospholipid surfaces are not translocated to the outer leaflet and there
is neither phospholipid surfaces exposure on their outer membranes nor MPs release. Thus,
there is no catalytic surface for interacting coagulation factors usually provided by platelets
and their PMPs. As a consequence, coagulation is extremely affected. Scott syndrome
provided an illustration of the influences of MPs on biochemical processes28, 29.
1.3.6 Protein content of microparticles
If the majority of the studies on MPs deals with MPs functions, little is known about their
protein composition. As expected, MPs contain a subset of proteins issued from their parental
cells. A recent study on PMPs identified 578 proteins using 1D SDS-PAGE and liquid
chromatography coupled to a linear ion trap mass spectrometer. Among those 578 proteins,
380 have not been previously described as constituents of platelet proteome30.

14
1.3.7 CD47
CD47 is a transmembrane glycoprotein ubiquitously expressed in human tissues that include
erythrocytes. It is an integrin-associated membrane protein (IAP). On the cell surface of
erythrocytes, CD47 is associated with proteins of the Rh complex, which is known to be a
“marker of self”. A putative role of CD47 is the removal of senescent erythrocyte. Aging
erythrocytes are mainly removed from circulating blood by reticuloendothelial macrophages.
Recent studies have shown that CD47 is lost during erythrocytes storage31, 32. The presence of
CD47 prevents erythrocyte removal from blood circulation. Indeed, the interaction between
CD47 and the macrophage inhibitory receptor signal regulatory protein (SIRPα) is thought to
inhibit a phosphorylation cascade that blocks phagocytosis33(figure 3).
Figure 3 : Adhesive interactions of SIRP-CD47 on cell surfaces (the picture is based on mouse studies)34.
Another role of CD47 is the induction of PS externalization on erythrocyte membrane. It has
been observed that CD47 binding to its natural ligand thrombospondin-1 induced PS
15
translocation to the outer leaflet and was also associated with a loss of erythrocyte viability.
This may be an important pathway for the induction of erythrocyte death.
Erythrocytes do not have any more nucleus nor mitochondria which are the most important
organelles for apoptosis. However, via CD47 signaling, erythrocytes seem to have a form of
in vitro programmed cell death35. Nevertheless, investigations on the exact role of
erythrocytes CD47 are still in process36.
1.4 Aims of our studies
In order to eventually establish if MPs are involved in FNHTR, it appeared mandatory to have
a better characterization and understanding of MPs in blood products with a global approach.
In this work, we aimed to i) develop in the laboratory flow cytometry-based technologies to
be able to measure the number of EMPS, to ii) determine the size of MPs in blood products
and finally, iii) to isolate MPs by ultracentrifugation for proteomic studies. The results that
will be presented in this report will be focused on EMPs, from fresh as well as from 42 days
old EC.

16
2 Materials and Methods
2.1 Preparation of samples
2.1.1 Erythrocyte concentrates
Whole blood was first collected and prepared at the SRTS VD according to the standard
procedure described in the Swiss compendium of drugs. Briefly, preparation stages of those
concentrates consist firstly in collect of 450 ml 50 ml of whole blood by venipuncture in
blood bags (Baxter, Deerfield, IL) containing the anti-coagulant solution, citrate phosphate
dextrose (CPD). Leukocytes are then removed from erythrocytes by filtration. After
separation of plasma and CPD by centrifugation, erythrocytes are finally suspended in 100 ml
of conservation solution, sodium-adenin-glucose-mannitol (SAG-M), and are ready for
storage to a maximum of 42 days at 4°C.
2.1.2 Sample of erythrocyte Microparticles
Samples from fresh and 42 days stored EC were prepared for different types of
analysis.(Fresh sample, also called Day 0 samples are one or two days old.) For flow
cytometry, we analysed supernatants issued after two centrifugations steps at 1850g for 20
minutes at 4C°. For western blots and 1DE gel, an additional centrifugation step at 3200g for
20 minutes at 4°C is needed, followed by three ultracentrifugations at 120’000g for 90
minutes at 4C° where pellets were collected, dissolved in PBS and pooled, (figure 4) Samples
of EMPs where then stored at –80C°.

17
Figure 4 : Preparation of EMPs Samples.
2.1.3 Erythrocyte lysates
With the aim to compare proteins from EMPs and erythrocytes in 1 DE gel and Western blot,
erythrocyte lysates were prepared. Erythrocytes issued from EC were washed in PBS 10x and
spun at 1850g for 20 minutes at 4°C. Collected pellets were then washed in deionized water,
and after a second similar centrifugation, pellets were collected and prepared for future
analysis.
2.2 Flow cytometry
Our flow cytometry analysis were performed with a FACScaliburTM flow cytometer with
CellQuestTM pro software (BD Biosciences, Franklin Lakes, NJ)�
FACS was calibrated with CaliBRITTM3 (BD Biosciences) kit containing different fluorescent
beads. Size events were defined using a flow cytometery size calibration kit (Invitrogen,
Eugenes, OR) containing beads of different diameter, from ~1�m to ~15�m (figure 5(D) ).

18
Three antibodies (BD Pharmingen, San Diego, CA) were used to stain EMPs. Antibodies are
coupled either with Fluorescein IsoThioCyanate (FITC) or Phycoerythrin (PE) and allowed
FACS to sort stained events according to their fluorescence. Anti-human Glycophorin A PE
(also called Anti-human CD235a) and anti-human CD47 FITC are both directed against
specific membrane proteins of red blood cells and their MPs. Annexin V FITC has a high
affinity for phosphatidylserine and thus it is directed against apoptotic cells or MPs.
Various amounts of antibodies were added in 100 �l of EMPs sample. The amount of
antibodies depends on the staining (single or double) and on the sample itself. We met some
difficulties in double staining due to the interaction between antibodies and different
concentration of antibodies were tried in order to find the most efficient process, see table 2
for more details.
Once antibodies added, samples were incubated 15 minutes on an orbital shaker in the dark at
room temperature. 400 �l of PBS was then added to each sample and FACS analysis was
carried out within one hour.
Parameters of FACS are reported in table 4. Moreover, when EMPs were counted with
TruCount tubes, a threshold on the SSC side was applied.
Table 2 : Quantity of antibodies used in 100 �l of sample for FACS analysis.
Single staining Double Staining 10 �l AnxV 3 �l CD47 & 0.7 �l GPA
Sample Day 0 2 �l GPA 2 �l CD47 10 �l AnxV 10 �l AnxV & 5�l GPA
Sample Day 42 5 �l GPA 5 �l CD47 & 6 V GPA 2-5 �l CD47
GPA = anti-glycophorin A diluted 10x CD47 = Anti-CD47 AnxV = Annexin V
19
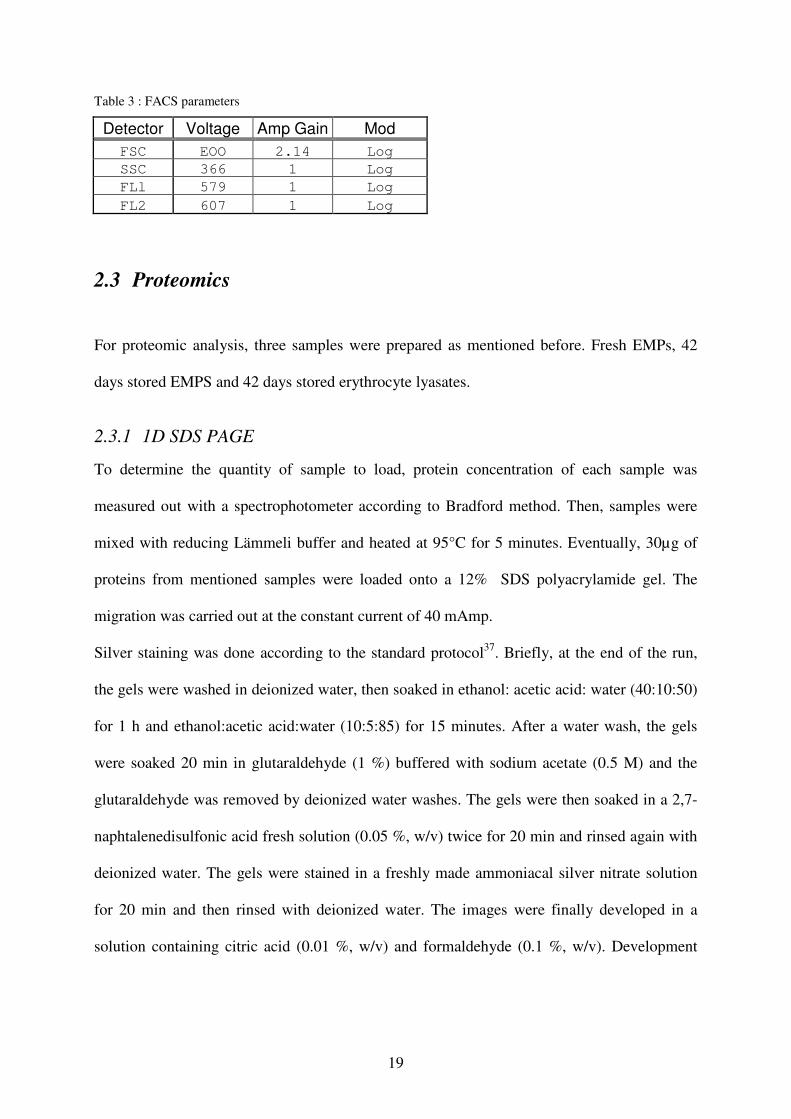
Table 3 : FACS parameters
Detector Voltage Amp Gain Mod FSC EOO 2.14 Log SSC 366 1 Log FLl 579 1 Log FL2 607 1 Log
2.3 Proteomics
For proteomic analysis, three samples were prepared as mentioned before. Fresh EMPs, 42
days stored EMPS and 42 days stored erythrocyte lyasates.
2.3.1 1D SDS PAGE
To determine the quantity of sample to load, protein concentration of each sample was
measured out with a spectrophotometer according to Bradford method. Then, samples were
mixed with reducing Lämmeli buffer and heated at 95°C for 5 minutes. Eventually, 30µg of
proteins from mentioned samples were loaded onto a 12% SDS polyacrylamide gel. The
migration was carried out at the constant current of 40 mAmp.
Silver staining was done according to the standard protocol37. Briefly, at the end of the run,
the gels were washed in deionized water, then soaked in ethanol: acetic acid: water (40:10:50)
for 1 h and ethanol:acetic acid:water (10:5:85) for 15 minutes. After a water wash, the gels
were soaked 20 min in glutaraldehyde (1 %) buffered with sodium acetate (0.5 M) and the
glutaraldehyde was removed by deionized water washes. The gels were then soaked in a 2,7-
naphtalenedisulfonic acid fresh solution (0.05 %, w/v) twice for 20 min and rinsed again with
deionized water. The gels were stained in a freshly made ammoniacal silver nitrate solution
for 20 min and then rinsed with deionized water. The images were finally developed in a
solution containing citric acid (0.01 %, w/v) and formaldehyde (0.1 %, w/v). Development

20
was stopped with an acetic acid:water (5:95) solution. All incubations were performed on an
orbital shaker.
2.3.2 Protein identification by mass spectrometry
1D SDS-PAGE was first run as previously described. The gel was then stained with
Coomassie blue a less sensitive method, therefore 300 µg of proteins were loaded.
Upon completion of electrophoresis, the gel was rinsed twice with deionized water and
stained with colloidal Coomassie blue (National Diagnostics, Atlanta, GA) overnight. The gel
was destained with dionized water.
Bands of interest were excised from gel with a scalpel and transferred into Eppendorf. In
collaboration with the PAF (Proteins Analysis Facility, unil ) in-gel proteolytic cleavage with
sequencing-grade trypsin (Promega) was performed automatically in the robotic workstation
Investigator ProGest (Perkin Elmer Life Sciences) according to the protocol of Wilm et al38.
Digests were evaporated to dryness and resuspended in 3 ul alpha-cyano-hydroxycinnamic
acid matrix (5 mg / ml in 60% (v :v) acetonitrile :water), of which 0.7 ul were deposed in
duplicate on a target plate. MALDI-MS-MS analysis was performed on a 4700 Proteomics
Analyser (Applied Biosystems, Framingham, MA, USA). After MALDI-TOF MS analysis,
internal calibration on trypsin autolysis peaks and subtraction of matrix peaks, the 10 most
intense ion signals were selected for MS/MS analysis.
Non-interpreted peptide tandem mass spectra were used for direct interrogation of the Uniprot
(Swissprot + TrEMBL) database using Mascot 2.0 (http://www.matrixscience.com). The mass
tolerance for database searches was 50 ppm. MASCOT was set up to only report peptide
matches with a score above 14. With the parameters used, the threshold for statistical
significance (p<0.05) corresponded to a total (protein) MASCOT score of 33. Proteins scoring
above 80 were considered automatically as valid, while all protein identifications with a total

21
MASCOT score between 33 and 80 were manually validated. Validation included
examination of the peptide rms (root mean square) mass error and of individual peptide
matches. Peptide matches were validated only if at least an ion series of 4 consecutive y ions
were matched, in addition to ions belonging to other series. Generally, only proteins matched
by at least two peptides were accepted.
2.3.3 Western blot analysis
From 6 to 30 �g of proteins issued from the three samples described before were loaded onto
a 12% SDS polyacrylamid minigels. Once the migration carried out at constant voltage
(200v), proteins were transferred to PVDF membranes using a Novex blot module
(Invitrogen, Carlsbad, CA) for 1h45min at fixed voltage (30V) according to the manufacture
instruction. After transfer, blotted membranes were soaked overnight in blocking solution
with PBS, 0.1% Tween 20 (v/v), 5% milk and 1% BSA (w/v). Anti-human Glycophorin A
(Santa Cruz Biotechnology, Santa Cruz, CA) and Anti-human CD47 (Abcam, Cambrige, UK)
were both used at a dilution 1:400. The goat anti-rabbit and goat anti-mouse HRP-conjugated
antibodies ( Dako, Baar, Switzerland) were both used at a dilution of 1:10’000. Subsequent
visualization was performed using enhanced chemiluminescence. (ECL) (GE Healthcare,
Uppsala, Sweden). The signal was finally captured using X-ray film.
2.4 Electron Microscopy
In collaboration with the CME (Electron Microscopy Centre, unil), two samples of EMPs
(fresh and 42 days stored) were prepared for electron microscopy. Briefly, few �l of each
sample were dropped off on a dried lamella beforehand dipped into polylysine solution
(Sigma, St-Louis, MO) Fixation was done in glutaraldehyde and post-fixation with Osmium

22
tetroxyde (Sigma). Samples were then dehydrated in ethanol and with a CPD 030 critical
point dryer (Bal-Tec, Balzers, Liechtenstein) critical-point drying was accomplished under
high pressure using liquid carbon dioxide as an exchange fluid. Samples were finally coated
with ~15 nm of platinum in a MED-010 high-vacuum sputter coater (Bal-Tec) and ready for
the scanning electron microscope (SEM). The SEM used is a JEOL-JSM-6300F ( JEOL,
Tokyo, Japan).

23
3 Results and discussion
3.1 Flow cytometry
3.1.1 Count of microparticles
In order to count EMPs, TruCountTM tubes (BD Biosciences) were used. Those tubes contain
a precise number of fluorescent beads and allow us to compare measured numbers of EMPs
between samples. They are generally used for determining absolute counts of leukocytes in
bloods products. Double staining of EMPs was done to avoid as much as possible false
positives and artefacts. For EMPs counts, FACS gates and setting were performed as
described in figure 5.
Figure 5 : Representative flow cytometric plots of erythrocytes EMPs stained with conjugated FITC Anti-CD47 and conjugated PE Anti-Glycophorin A. FSC-H and SSC-H for forward and side scatter parameters allow to measure respectively size and granularity (or general shape). (A) Region R1 and R2 represents EMPs and TruCount beads respectively in a FSC. (B) Region R3 represents region R2 events in a two fluorescence dot plot (FL1-H/FL2-H), to wit TruCount beads without any artefact. Region R3 was used to count the 5000 beads. (C) Region R4 represents region R1 events in a two fluorescence dot plot, FL1-H corresponding to FITC anti-CD47 stained events and FL2-H l corresponding to PE anti-Glycophorin A stained events. Namely, R4 region represents double stained EMPs. (D) With the same FACS adjustments, beads of 1 µm and 2 µm in diameters used for setting are shown.

24
With an aim to calculate the coefficient of variation, reproducibility tests were done. With the
same sample of EMPs prepared as mentioned before, double staining with anti-CD47 and
anti-Glycophorin A was done and FACS was then used to count numbers of double positive
EMPs counted for 5000 Trucount beads. The all process was separately repeated 5 times with
the same sample of EMPs from fresh EC, and 5 times with the same sample of EMPs from 42
days stored EC.
Result was a coefficient of variation of ~2.3% (Table 4).
Table 4 : Sample from EC, double stained. Numbers of EMPs is presented in relation to 5000 trucount beads
counted. Each measure was done separately from the other one. Increase between fresh and 42 days old sample
is statistically significant with paired t-test ( P = < 0.001)
Day 0 Day 42 1 5770 138280 2 5595 135675 3 5893 130564 4 5691 133764 5 5609 131149
Mean 5711.6 133886.4 Standard deviation 123.352341 3203.493921 Coefficient of variation 2.159681% 2.392695%
Once reproducibility demonstrated, we compared the number of EMPs from the same fresh
and 42 days stored EC. Comparison was done on EMPs samples from 6 different EC. EMPs
were also double stained with Anti-CD47 and Anti-Glycophorin A, and number of double
positive EMPs were counted with FACS for 5000 TruCount beads. Process was done twice
for each sample, and the mean of two measures was chosen for result.
Increase of EMPs was observed in all cases. Measured numbers of EMPs are from 2’800 to
7’700 in samples from fresh EC, while they are from 45’000 to 337’000 in samples from 42
days stored EC (Table 5).
25
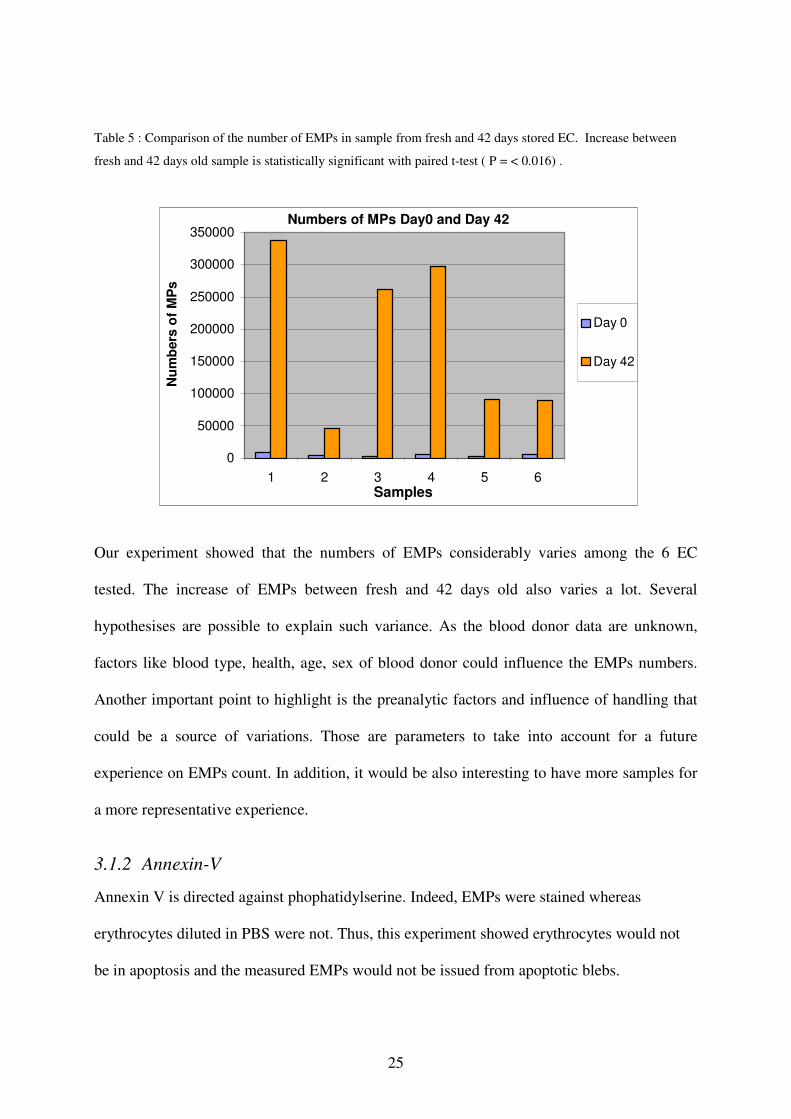
Table 5 : Comparison of the number of EMPs in sample from fresh and 42 days stored EC. Increase between
fresh and 42 days old sample is statistically significant with paired t-test ( P = < 0.016) .
Our experiment showed that the numbers of EMPs considerably varies among the 6 EC
tested. The increase of EMPs between fresh and 42 days old also varies a lot. Several
hypothesises are possible to explain such variance. As the blood donor data are unknown,
factors like blood type, health, age, sex of blood donor could influence the EMPs numbers.
Another important point to highlight is the preanalytic factors and influence of handling that
could be a source of variations. Those are parameters to take into account for a future
experience on EMPs count. In addition, it would be also interesting to have more samples for
a more representative experience.
3.1.2 Annexin-V
Annexin V is directed against phophatidylserine. Indeed, EMPs were stained whereas
erythrocytes diluted in PBS were not. Thus, this experiment showed erythrocytes would not
be in apoptosis and the measured EMPs would not be issued from apoptotic blebs.
Numbers of MPs Day0 and Day 42
0
50000
100000
150000
200000
250000
300000
350000
1 2 3 4 5 6Samples
Num
bers
of M
Ps
Day 0
Day 42

26
3.2 Proteomics
3.2.1 Silver staining 1D SDS PAGE
The goal of 1D SDS PAGE was to highlight eventual differences of protein profiles.
Apparently, they are very similar and it is not possible to point out clear variations. It seemed
also logical that red blood cells and their MPs share mainly the same proteins. Thus, a more
sensitive method is needed to demonstrate evidences of different proteins (figure 6).
MPs Day-0
Ery Lysates
17.5kD-
21.5kD-
31.0kD-
36.0kD-
43.0kD-
66.2kD-
76.0kD-
MW (KD)
MPs Day-42
Figure 6 : 1D SDS PAGE. Equivalent loads (30µg) of proteins were subjected to electrophoresis in a 12% SDS-PAGE gel and stained with silver. No major differences were noted between different samples.
3.2.2 Mass spectrometry
In order to analyse some bands with mass spectrometer, 1D SDS-PAGE stained with
Commassie Blue was performed (figure 7). Both samples are issued from the same EC 42
days stored. Interestingly, band 4.6 clearly appeared on EMPs samples whereas no band
(indicated 2.6) was observed in erythrocyte lysates.
27
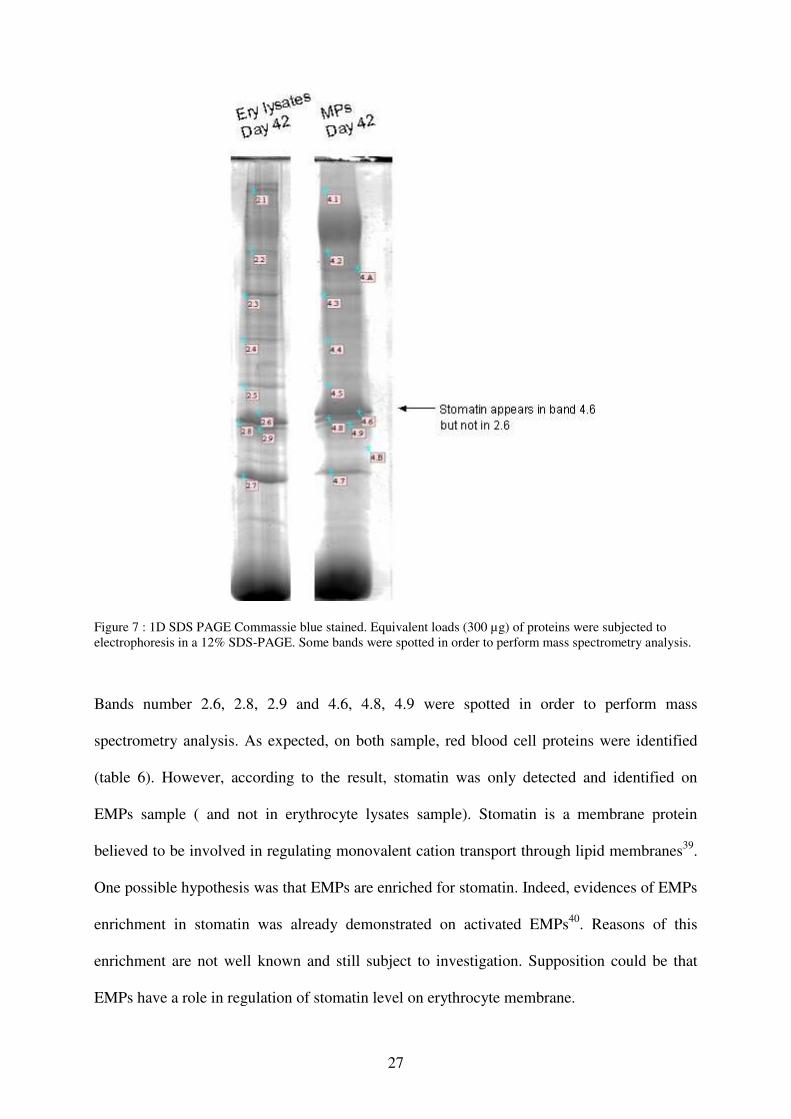
Figure 7 : 1D SDS PAGE Commassie blue stained. Equivalent loads (300 µg) of proteins were subjected to electrophoresis in a 12% SDS-PAGE. Some bands were spotted in order to perform mass spectrometry analysis.
Bands number 2.6, 2.8, 2.9 and 4.6, 4.8, 4.9 were spotted in order to perform mass
spectrometry analysis. As expected, on both sample, red blood cell proteins were identified
(table 6). However, according to the result, stomatin was only detected and identified on
EMPs sample ( and not in erythrocyte lysates sample). Stomatin is a membrane protein
believed to be involved in regulating monovalent cation transport through lipid membranes39.
One possible hypothesis was that EMPs are enriched for stomatin. Indeed, evidences of EMPs
enrichment in stomatin was already demonstrated on activated EMPs40. Reasons of this
enrichment are not well known and still subject to investigation. Supposition could be that
EMPs have a role in regulation of stomatin level on erythrocyte membrane.

28
Table 6 : Mass spectrometry results sample name on tube
organism result description mass MASCOT score
4.6 human STOM_HUMAN Erythrocyte band 7 integral membrane protein CAH1_HUMAN Carbonic anhydrase 1
31882 28909
515 191
4.8 human CAH1_HUMAN Carbonic anhydrase 1 HBB_HUMAN Hemoglobin subunit beta STOM_HUMAN Erythrocyte band 7 integral membrane protein CAH2_HUMAN Carbonic anhydrase 2
28909 16102 31882 29285
454 149 120 86
4.9 human HBB_HUMAN Hemoglobin subunit beta CAH2_HUMAN Carbonic anhydrase 2 STOM_HUMAN Erythrocyte band 7 integral membrane protein HBA_HUMAN Hemoglobin subunit alpha HBD_HUMAN Hemoglobin subunit delta
16102 29285 31882 15305 16159
149 86 120 100 99
2.6 human CAH1_HUMAN Carbonic anhydrase 1 PNPH_HUMAN Purine nucleoside phosphorylase
28909 32325
354 103
2.8 human CAH1_HUMAN, Carbonic anhydrase 1 28909 534 2.9 human CAH2_HUMAN Carbonic anhydrase 2
HBB_HUMAN Hemoglobin subunit beta HBD_HUMAN Hemoglobin subunit delta CAH1_HUMAN Carbonic anhydrase 1
29285 16102 16159 28909
397 210 125 71
3.2.3 Western Blot
To obtain more detailed of the expression of Glycophorin A and CD47, we analyzed
erythrocytes lysates and EMPs by Western blotting with anti-Glycophorin A and anti-CD47
antibodies. Glycophorin A is one of the most abundant integral protein of human erythrocytes
and CD47 is an erythrocyte membrane protein of Rhesus complex which is supposed to be
lost in senescent erythrocytes. The aim was first to develop methods of western blotting with
mentioned samples and antibodies. Evidence of Glycophorine A expression was demonstrated
on samples of erythrocytes lysates and both fresh and 42 days stored EMPs. Platelet samples
were used as negative control, and no signal was detected ( figure 8). Glycophorin A is highly
glycosylated and as a result, the apparent molecular weight in blot appears in higher mass

29
range than the calculated one of the non glycosylated backbone. In western blot, monomers
signal was near 42 kD while dimers signal was near 85 kD41 (figure 8) .
On the other hand, we didn’t success yet to obtain a signal with CD47 antibodies in spite of
several different tests. CD47 is not highly expressed and thus detection is more difficult
because the most abundant proteins hide the lowest abundant one. In prospective experiment,
methods to reduce most abundant proteins could be tried, for example size exclusion
chromatography.
Figure 8 : Western Blot analysis of glycophorin A expression. 20 �g of proteins were loaded for erythrocyte lysates and MPs Day 42 samples while 6 �g of proteins were loaded for MP Day 0 and platelets sample. Separated proteins on a 12% SDS PAGE gel were immunoblotted using anti-human glycophorin A. Monomers and dimers of glycophorin A bands were visible on erythrocyte lysates and MPs samples whereas no signal was detected on platelets sample.
Ery lys
ates
MP Day
42
MP Day
0
Platele
ts
115 Kd -82 Kd -63 Kd -48 Kd -
37 Kd -
25 Kd -
19 Kd -
14 Kd -
6 Kd -
MW
GPA/GPA
GPA
30
3.3 Electron Microscopy
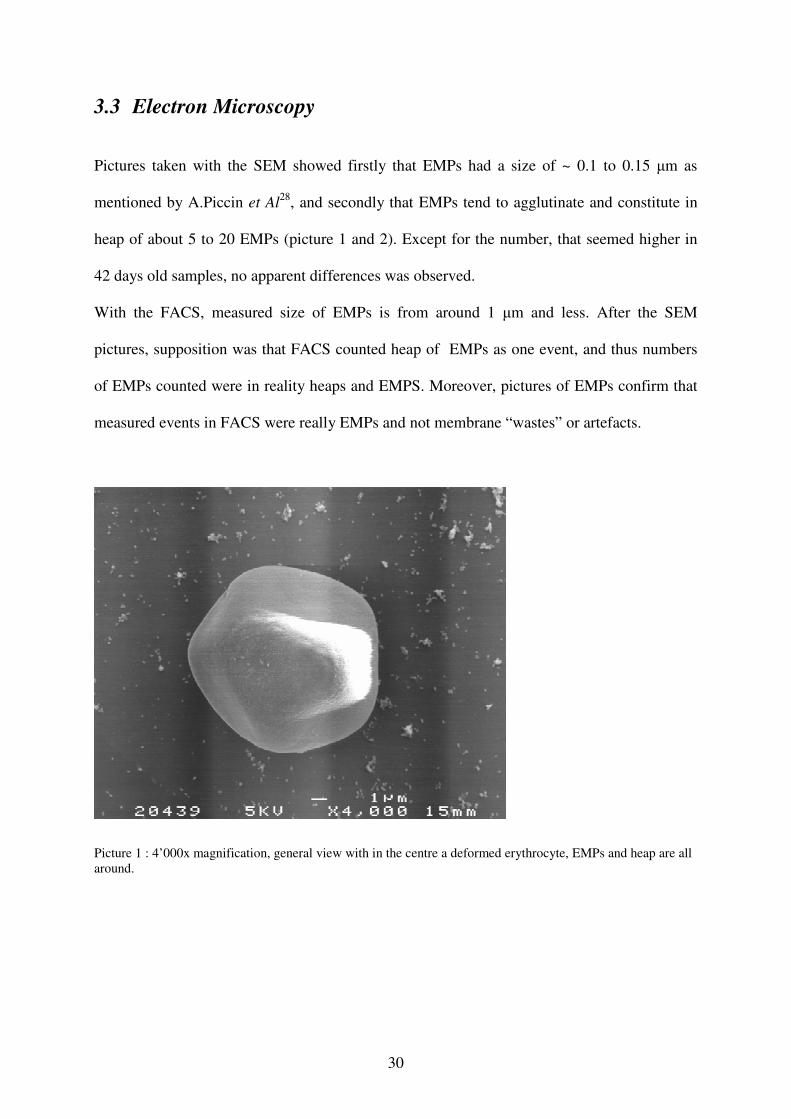
Pictures taken with the SEM showed firstly that EMPs had a size of ~ 0.1 to 0.15 �m as
mentioned by A.Piccin et Al28, and secondly that EMPs tend to agglutinate and constitute in
heap of about 5 to 20 EMPs (picture 1 and 2). Except for the number, that seemed higher in
42 days old samples, no apparent differences was observed.
With the FACS, measured size of EMPs is from around 1 �m and less. After the SEM
pictures, supposition was that FACS counted heap of EMPs as one event, and thus numbers
of EMPs counted were in reality heaps and EMPS. Moreover, pictures of EMPs confirm that
measured events in FACS were really EMPs and not membrane “wastes” or artefacts.
Picture 1 : 4’000x magnification, general view with in the centre a deformed erythrocyte, EMPs and heap are all around.

31
Picture 2 : 37’000x magnification, EMPs and heap.
32
4 Conclusions
Different techniques used in this work gave a global overview of red blood cells
microparticles. First of all, EMPs were isolated from EC with diverse centrifugations. FACS
analysis had demonstrated a significant increase of EMPs during storage, and a great
variability of EMPs numbers was measured in erythrocyte concentrates from various donors.
With proteomics, 1D SDS-PAGE and mass spectrometry brought to light that MPs were
enriched in stomatin comparing to erythrocytes. Presence of glycophorin A in EMPs was
underlined using western blot. Finally, scanning electron microscopy confirmed that EMPs
had a size of 0.15 �m, and showed that they tended to form heap.
Those first results are encouraging and they open perspectives for more investigations and
future experiments on MPs.

33
Acknowledgment
First of all, I would like to thanks Prof. Jean-Daniel Tissot for giving me the opportunity to
do my Master’s practical training in the laboratory of research and development at the
“Service Régional Vaudois de Transfusion Sanguine (SRTS VD)”. I am grateful to him for
his support, enthusiasm and for introducing me in the world of blood microparticles.
Special thanks go to my colleagues Lynne, Corrine, Giorgia, David and Stefano, for theirs
precious help and numerous advices. I thank also the other collaborators of the SRTS VD.
I would like to thanks to all my friends for their encouragements !
And finally, I would like to dedicate this work to Anne Zufferey, a brilliant scientist and my
best friend. I thank her for supporting me during my studies in biology, for numerous revision
sessions and for all good moments !!!
34
Reference List
(1) del C, I, Shrimpton CN, Thiagarajan P, Lopez JA. Tissue-factor-bearing microvesicles
arise from lipid rafts and fuse with activated platelets to initiate coagulation. Blood 2005 September 1;106(5):1604-11.
(2) Pilzer D, Gasser O, Moskovich O, Schifferli JA, Fishelson Z. Emission of membrane vesicles: roles in complement resistance, immunity and cancer. Springer Semin Immunopathol 2005 November;27(3):375-87.
(3) Diamant M, Tushuizen ME, Sturk A, Nieuwland R. Cellular microparticles: new players in the field of vascular disease? Eur J Clin Invest 2004 June;34(6):392-401.
(4) Warkentin TE, Hayward CP, Boshkov LK, Santos AV, Sheppard JA, Bode AP, Kelton JG. Sera from patients with heparin-induced thrombocytopenia generate platelet-derived microparticles with procoagulant activity: an explanation for the thrombotic complications of heparin-induced thrombocytopenia. Blood 1994 December 1;84(11):3691-9.
(5) Jimenez JJ, Jy W, Mauro LM, Horstman LL, Soderland C, Ahn YS. Endothelial microparticles released in thrombotic thrombocytopenic purpura express von Willebrand factor and markers of endothelial activation. Br J Haematol 2003 December;123(5):896-902.
(6) Nomura S, Suzuki M, Katsura K, Xie GL, Miyazaki Y, Miyake T, Kido H, Kagawa H, Fukuhara S. Platelet-derived microparticles may influence the development of atherosclerosis in diabetes mellitus. Atherosclerosis 1995 August;116(2):235-40.
(7) Bernal-Mizrachi L, Jy W, Jimenez JJ, Pastor J, Mauro LM, Horstman LL, de ME, Ahn YS. High levels of circulating endothelial microparticles in patients with acute coronary syndromes. Am Heart J 2003 June;145(6):962-70.
(8) VanWijk MJ, VanBavel E, Sturk A, Nieuwland R. Microparticles in cardiovascular diseases. Cardiovasc Res 2003 August 1;59(2):277-87.
(9) Queloz PA, Thadikkaran L, Crettaz D, Rossier JS, Barelli S, Tissot JD. Proteomics and transfusion medicine: future perspectives. Proteomics 2006 October;6(20):5605-14.
(10) Guide to the preparation, use and quality assurance of blood components. 12th ed. 2006.
(11) Purdy FR, Tweeddale MG, Merrick PM. Association of mortality with age of blood transfused in septic ICU patients. Can J Anaesth 1997 December;44(12):1256-61.
(12) Zallen G, Offner PJ, Moore EE, Blackwell J, Ciesla DJ, Gabriel J, Denny C, Silliman CC. Age of transfused blood is an independent risk factor for postinjury multiple organ failure. Am J Surg 1999 December;178(6):570-2.
35
(13) Yazer MH, Podlosky L, Clarke G, Nahirniak SM. The effect of prestorage WBC reduction on the rates of febrile nonhemolytic transfusion reactions to platelet concentrates and RBC. Transfusion 2004 January;44(1):10-5.
(14) Keuren JF, Magdeleyns EJ, Govers-Riemslag JW, Lindhout T, Curvers J. Effects of storage-induced platelet microparticles on the initiation and propagation phase of blood coagulation. Br J Haematol 2006 August;134(3):307-13.
(15) Horstman LL, Ahn YS. Platelet microparticles: a wide-angle perspective. Crit Rev Oncol Hematol 1999 April;30(2):111-42.
(16) Hugel B, Martinez MC, Kunzelmann C, Freyssinet JM. Membrane microparticles: two sides of the coin. Physiology (Bethesda ) 2005 February;20:22-7.
(17) Iida K, Whitlow MB, Nussenzweig V. Membrane vesiculation protects erythrocytes from destruction by complement. J Immunol 1991 October 15;147(8):2638-42.
(18) Bevers EM, Comfurius P, Dekkers DW, Zwaal RF. Lipid translocation across the plasma membrane of mammalian cells. Biochim Biophys Acta 1999 August 18;1439(3):317-30.
(19) Simak J, Gelderman MP. Cell membrane microparticles in blood and blood products: potentially pathogenic agents and diagnostic markers. Transfus Med Rev 2006 January;20(1):1-26.
(20) Morel O, Toti F, Hugel B, Bakouboula B, Camoin-Jau L, gnat-George F, Freyssinet JM. Procoagulant microparticles: disrupting the vascular homeostasis equation? Arterioscler Thromb Vasc Biol 2006 December;26(12):2594-604.
(21) del C, I, Nabi F, Tonda R, Thiagarajan P, Lopez JA, Kleiman NS. Effect of P-selectin on phosphatidylserine exposure and surface-dependent thrombin generation on monocytes. Arterioscler Thromb Vasc Biol 2005 May;25(5):1065-70.
(22) Mesri M, Altieri DC. Endothelial cell activation by leukocyte microparticles. J Immunol 1998 October 15;161(8):4382-7.
(23) Tabibzadeh SS, Kong QF, Kapur S. Passive acquisition of leukocyte proteins is associated with changes in phosphorylation of cellular proteins and cell-cell adhesion properties. Am J Pathol 1994 October;145(4):930-40.
(24) Brodsky SV, Zhang F, Nasjletti A, Goligorsky MS. Endothelium-derived microparticles impair endothelial function in vitro. Am J Physiol Heart Circ Physiol 2004 May;286(5):H1910-H1915.
(25) Martin S, Tesse A, Hugel B, Martinez MC, Morel O, Freyssinet JM, Andriantsitohaina R. Shed membrane particles from T lymphocytes impair endothelial function and regulate endothelial protein expression. Circulation 2004 April 6;109(13):1653-9.
(26) Baj-Krzyworzeka M, Majka M, Pratico D, Ratajczak J, Vilaire G, Kijowski J, Reca R, Janowska-Wieczorek A, Ratajczak MZ. Platelet-derived microparticles stimulate proliferation, survival, adhesion, and chemotaxis of hematopoietic cells. Exp Hematol 2002 May;30(5):450-9.

36
(27) Janowska-Wieczorek A, Majka M, Kijowski J, Baj-Krzyworzeka M, Reca R, Turner AR, Ratajczak J, Emerson SG, Kowalska MA, Ratajczak MZ. Platelet-derived microparticles bind to hematopoietic stem/progenitor cells and enhance their engraftment. Blood 2001 November 15;98(10):3143-9.
(28) Piccin A, Murphy WG, Smith OP. Circulating microparticles: pathophysiology and clinical implications. Blood Rev 2006 November 20.
(29) Zwaal RF, Comfurius P, Bevers EM. Scott syndrome, a bleeding disorder caused by defective scrambling of membrane phospholipids. Biochim Biophys Acta 2004 March 22;1636(2-3):119-28.
(30) Garcia BA, Smalley DM, Cho H, Shabanowitz J, Ley K, Hunt DF. The platelet microparticle proteome. J Proteome Res 2005 September;4(5):1516-21.
(31) Bessos H, Seghatchian J. Red cell storage lesion: the potential impact of storage-induced CD47 decline on immunomodulation and the survival of leucofiltered red cells. Transfus Apher Sci 2005 April;32(2):227-32.
(32) Stewart A, Urbaniak S, Turner M, Bessos H. The application of a new quantitative assay for the monitoring of integrin-associated protein CD47 on red blood cells during storage and comparison with the expression of CD47 and phosphatidylserine with flow cytometry. Transfusion 2005 September;45(9):1496-503.
(33) Oldenborg PA, Zheleznyak A, Fang YF, Lagenaur CF, Gresham HD, Lindberg FP. Role of CD47 as a marker of self on red blood cells. Science 2000 June 16;288(5473):2051-4.
(34) Subramanian S, Parthasarathy R, Sen S, Boder ET, Discher DE. Species- and cell type-specific interactions between CD47 and human SIRPalpha. Blood 2006 March 15;107(6):2548-56.
(35) Lang KS, Myssina S, Brand V, Sandu C, Lang PA, Berchtold S, Huber SM, Lang F, Wieder T. Involvement of ceramide in hyperosmotic shock-induced death of erythrocytes. Cell Death Differ 2004 February;11(2):231-43.
(36) Head DJ, Lee ZE, Swallah MM, Avent ND. Ligation of CD47 mediates phosphatidylserine expression on erythrocytes and a concomitant loss of viability in vitro. Br J Haematol 2005 September;130(5):788-90.
(37) Tissot JD, Schneider P, Hohlfeld P, Spertini F, Hochstrasser DF, Duchosal MA. Two-dimensional electrophoresis as an aid in the analysis of the clonality of immunoglobulins. Electrophoresis 1993 December;14(12):1366-71.
(38) Shevchenko A, Wilm M, Vorm O, Mann M. Mass spectrometric sequencing of proteins silver-stained polyacrylamide gels. Anal Chem 1996 March 1;68(5):850-8.
(39) Stewart GW. Stomatin. Int J Biochem Cell Biol 1997 February;29(2):271-4.
(40) Salzer U, Hinterdorfer P, Hunger U, Borken C, Prohaska R. Ca(++)-dependent vesicle release from erythrocytes involves stomatin-specific lipid rafts, synexin (annexin VII), and sorcin. Blood 2002 April 1;99(7):2569-77.

37
(41) Auffray I, Marfatia S, de JK, Lee G, Huang CH, Paszty C, Tanner MJ, Mohandas N, Chasis JA. Glycophorin A dimerization and band 3 interaction during erythroid membrane biogenesis: in vivo studies in human glycophorin A transgenic mice. Blood 2001 May 1;97(9):2872-8.