
English for Specialized Chemistry 3- Group 7
40
LOGO SPECTROSCOPY GROUP 7 ENGLISH FOR SPECIALIZED CHEMISTRY 3
-
Upload
tom-can-cook -
Category
Documents
-
view
13 -
download
1
Transcript of English for Specialized Chemistry 3- Group 7
LOGO
SPECTROSCOPYGROUP 7
ENGLISH FOR
SPECIALIZED CHEMISTRY 3

LOGOMembers of group 7
Dinh Thi Minh Nhat
Nguyen Thi Doi
Nguyen Van Sang
Nguyen Linh Tam
Ha Cuong Tuyen
Nguyen Thanh Huy
Nguyen Thi Thu Sen
Nguyen Thanh Luan
Tran Thi Thu Thao
1
2
3
4
5
6
7
8
9

LOGOContents
Introduction to spectroscopy1
Absortion spectrum2
Emission spectrum3
Ultraviolet – visible and infrared spectrophotometry4

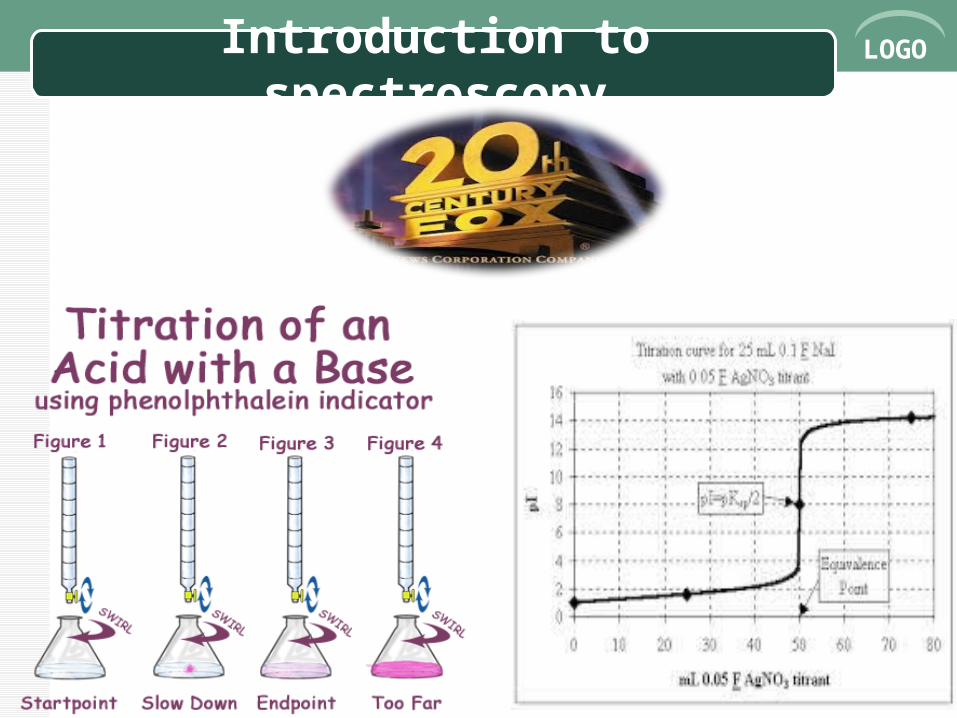
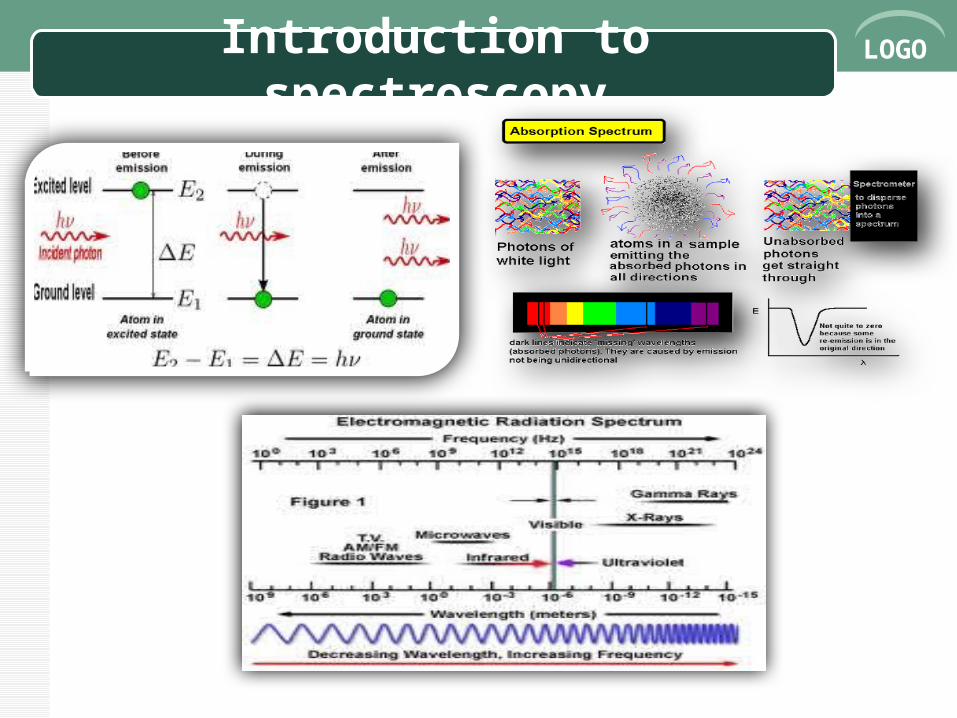
LOGOIntroduction to spectroscopy
What is spectrophotometry ?
Spectrophotometry is the quantitative
measurement of the reflection or transmission
properties of a material as a function of
wavelength.
LOGOIntroduction to spectroscopy

LOGOIntroduction to spectroscopy
major
minor
limited

LOGOIntroduction to spectroscopy

LOGOIntroduction to spectroscopy
One example Nessler
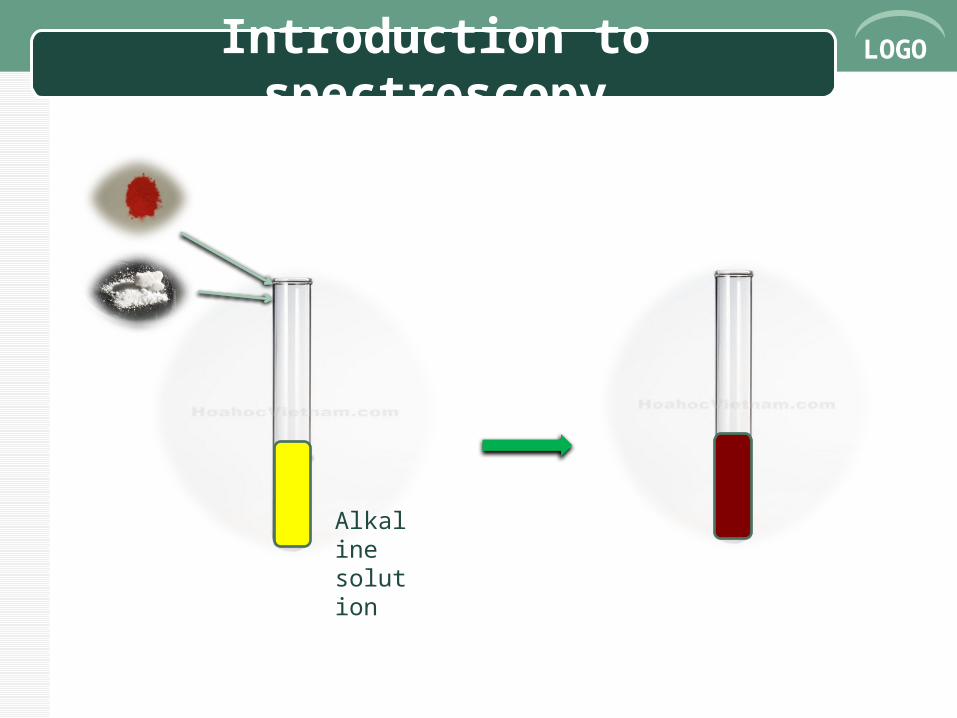
LOGOIntroduction to spectroscopy
Alkaline solution

LOGOIntroduction to spectroscopy
Equal volumes of the sample and standards
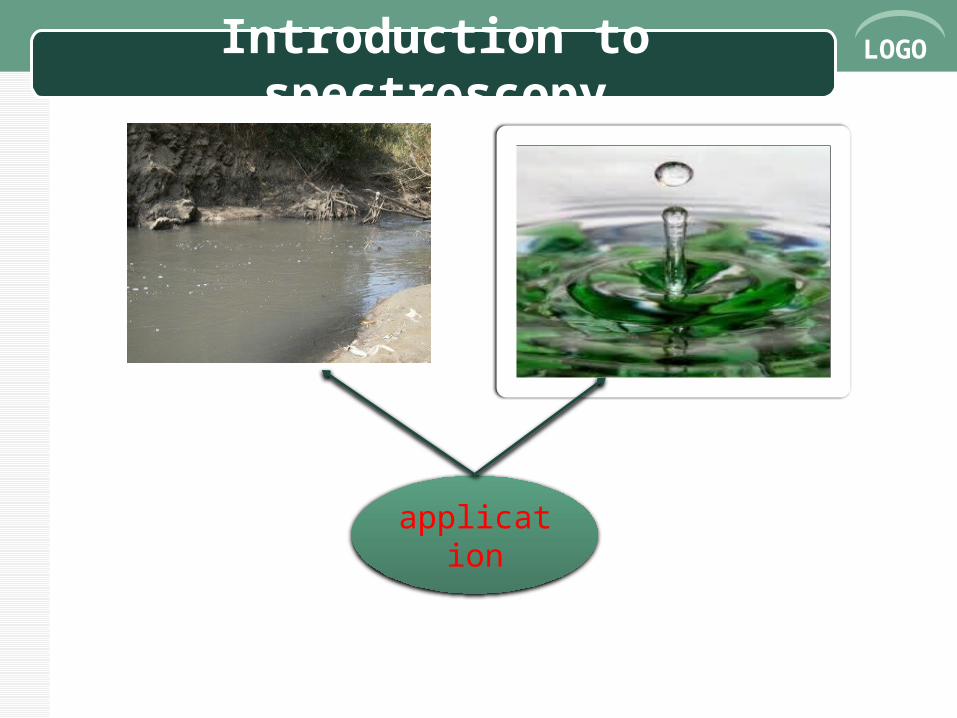
LOGOIntroduction to spectroscopy
application
LOGOIntroduction to spectroscopy

LOGOIntroduction to spectroscopy
At the and of 19th
century
LOGOIntroduction to spectroscopy
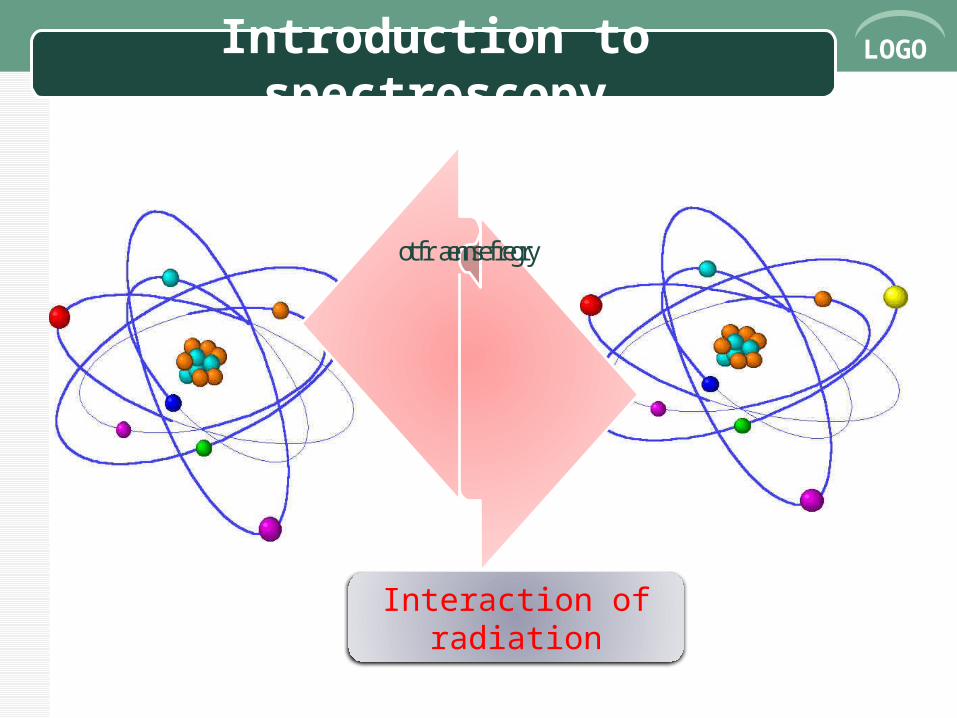
transferof energy
Interaction of radiation

LOGOIntroduction to spectroscopy
Emission

LOGOIntroduction to spectroscopy
Asborption

LOGOAbsortion spectrum
LOGOAbsortion spectrum
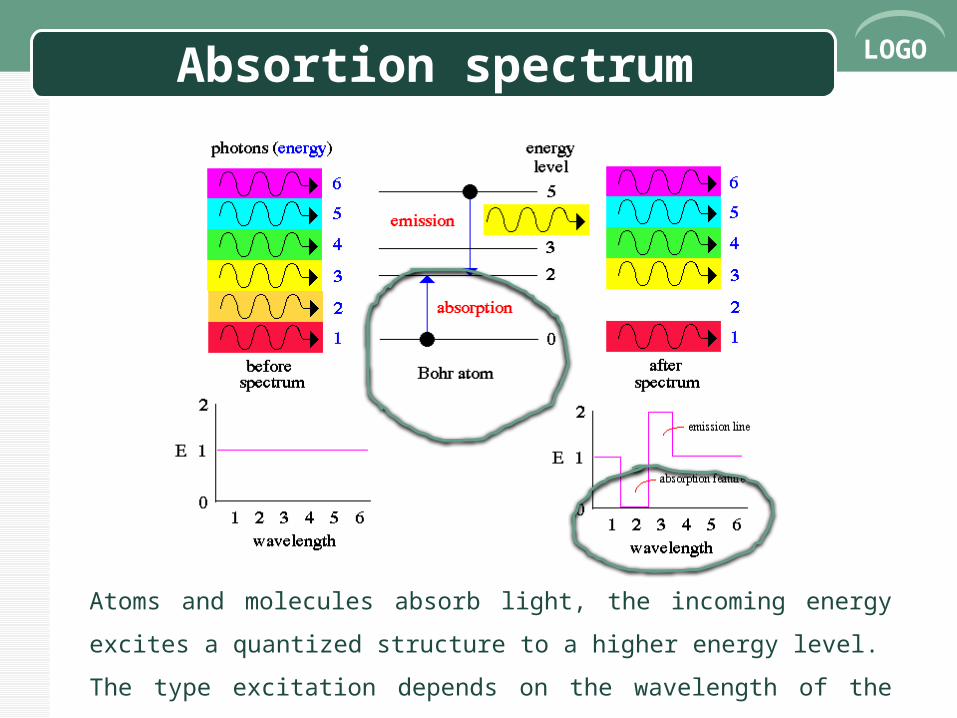
Atoms and molecules absorb light, the incoming energy excites a quantized
structure to a higher energy level.
The type excitation depends on the wavelength of the light.

LOGO Absortion spectrum

LOGOAbsortion spectrum
LOGOAbsortion spectrum
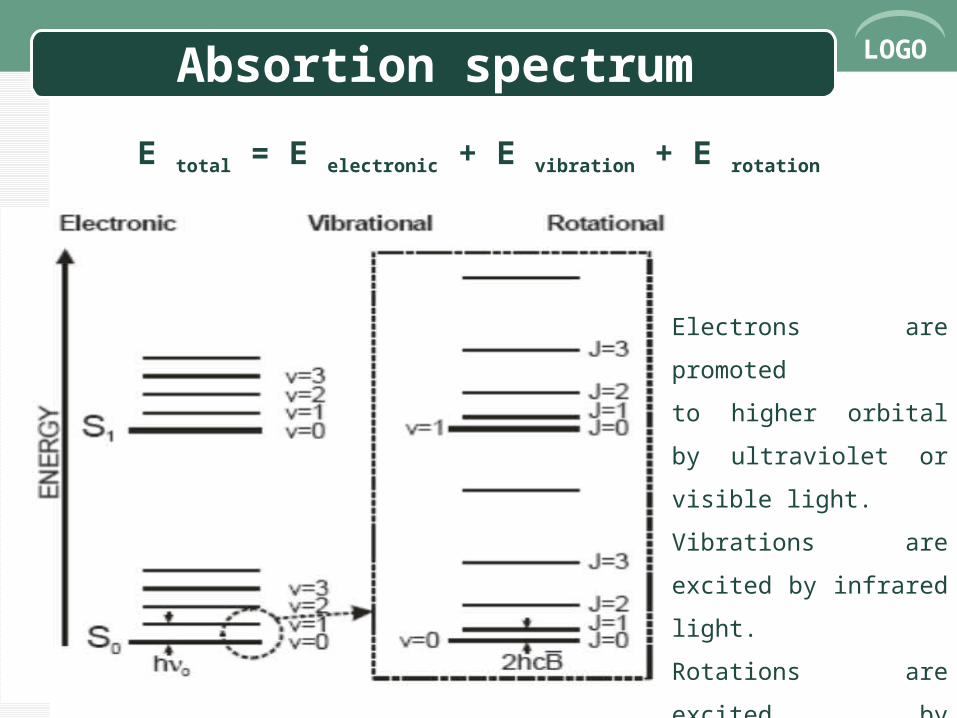
E total = E electronic + E vibration + E rotation
Electrons are promoted
to higher orbital by
ultraviolet or visible light.
Vibrations are excited by
infrared light.
Rotations are excited by
microwaves
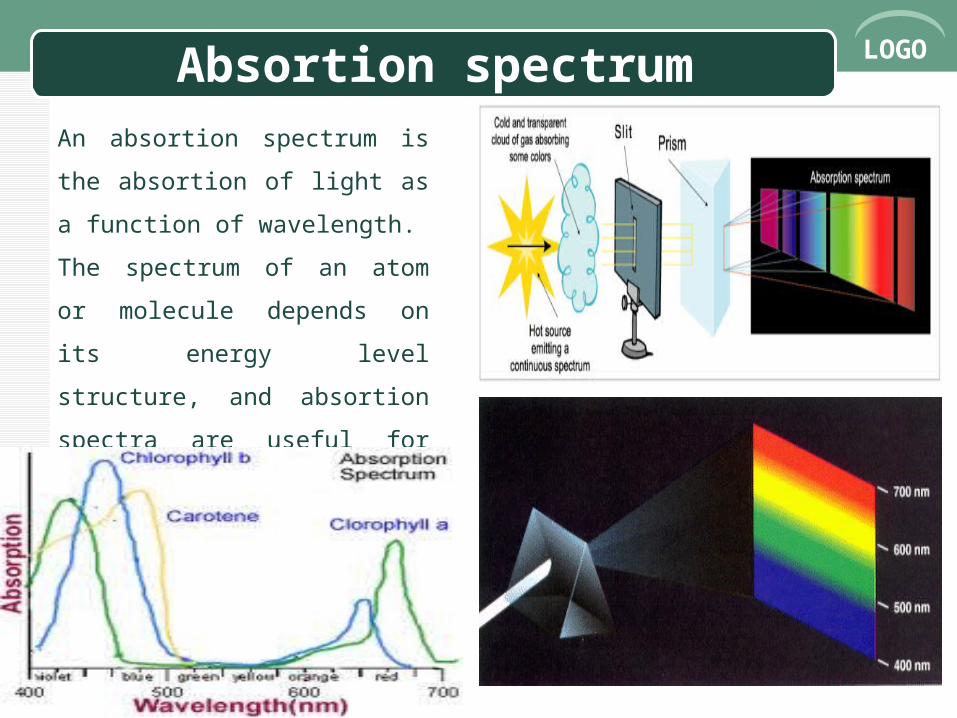
LOGOAbsortion spectrumAn absortion spectrum is the
absortion of light as a function of
wavelength.
The spectrum of an atom or
molecule depends on its energy
level structure, and absortion
spectra are useful for identifying of
compounds.

LOGOAbsortion spectrumMeasuring the concentration
of an absortion species in a
sample is accomplished by
applying the Beer-Lambert
Law
Absorbance = A
(or Optical Density
= OD)
It measures the intensity of light passing through a sample (I)
compares it to the intensity of light before it passes through the sample (I0)

LOGOAbsortion spectrum

LOGOEmission spectrum
Emission spectrum of hydrogen
Emission – liminescence
Emission spectrum of iron
The relationship among the wavelength and the
energy E are: E =
where c is the speed of light and h is Planck's
Constant.
LOGOEmission spectrum
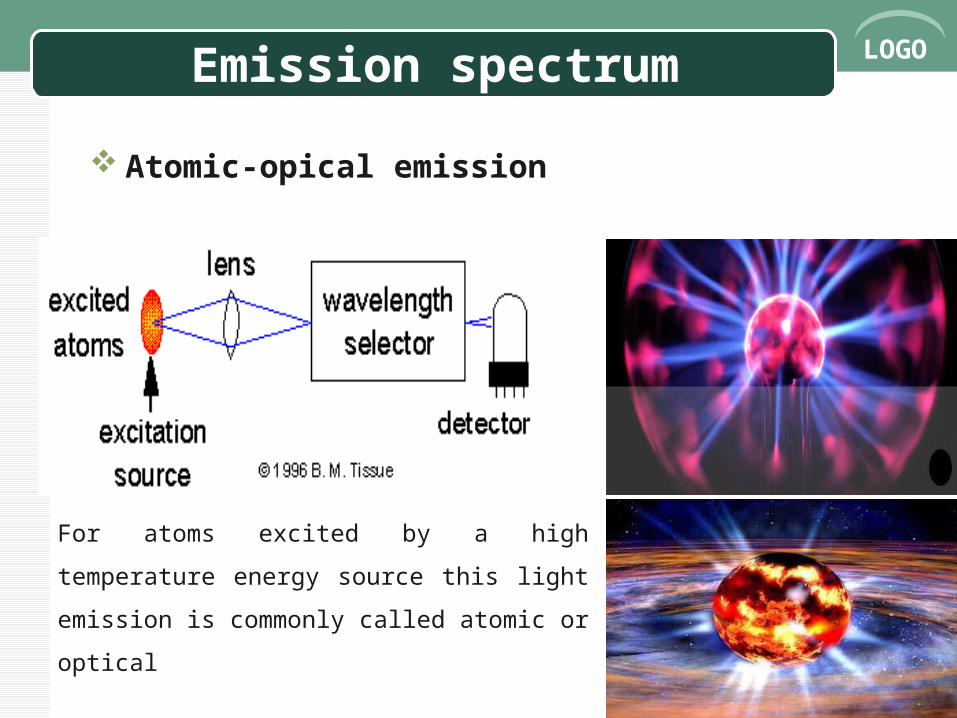
Atomic-opical emission
For atoms excited by a high temperature energy
source this light emission is commonly called
atomic or optical
LOGOEmission spectrum
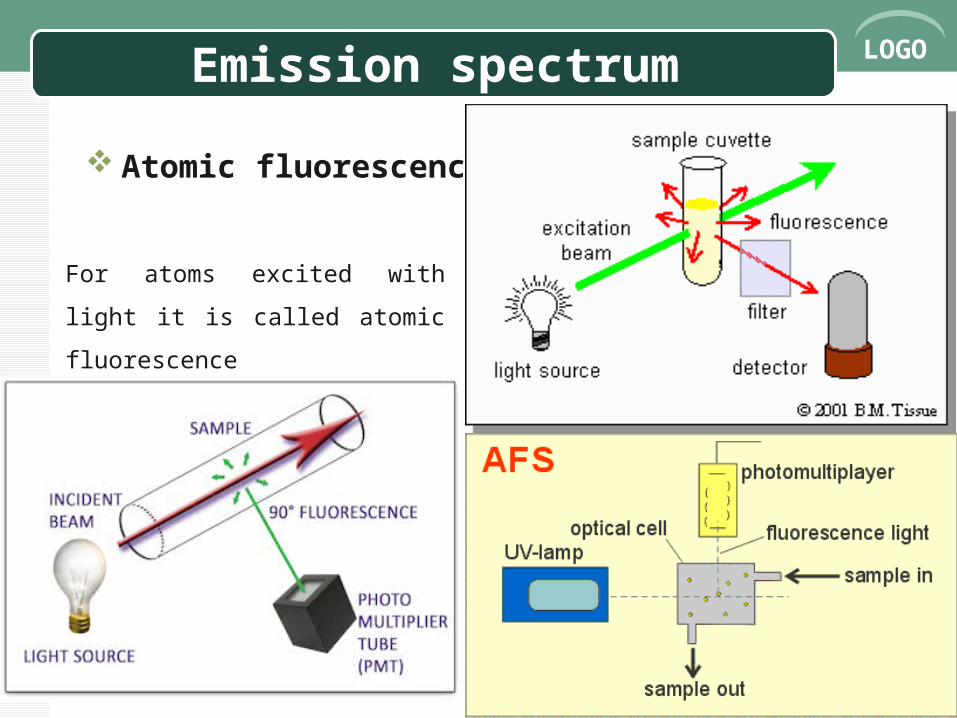
Atomic fluorescence
For atoms excited with light it is
called atomic fluorescence

LOGOEmission spectrum
Fluorescence- phosphorescence
Eneration of luminescence through excitation of a molecule which is formally
divided into two categories, fluorescence and phosphorescence.
If the transition is between states of the same spin, it will call fluorescence.
If the transition is between states of different spin, it will call phosphorescence.

LOGOEmission spectrum Applies
At low concentrations the emission intensity will generally be proportional to the
concentration of the emission
The emission spectrum can be used to determine the composition of a material

LOGOUltraviolet – visible and infrared spectrophotometry

LOGOUltraviolet – visible and infrared spectrophotometry
Ranges radiation
760 – 400 nm1000 – 760 nm
400 – 100 nm

LOGOUltraviolet – visible and infrared spectrophotometry
sunlight
Visible light that you see
vis
IR
uv
Source of lights radiation
Infrared radiation that can be felt as heat
Ultraviolet radiation that can’t be seen or left
LOGOUltraviolet – visible spectrophotometry
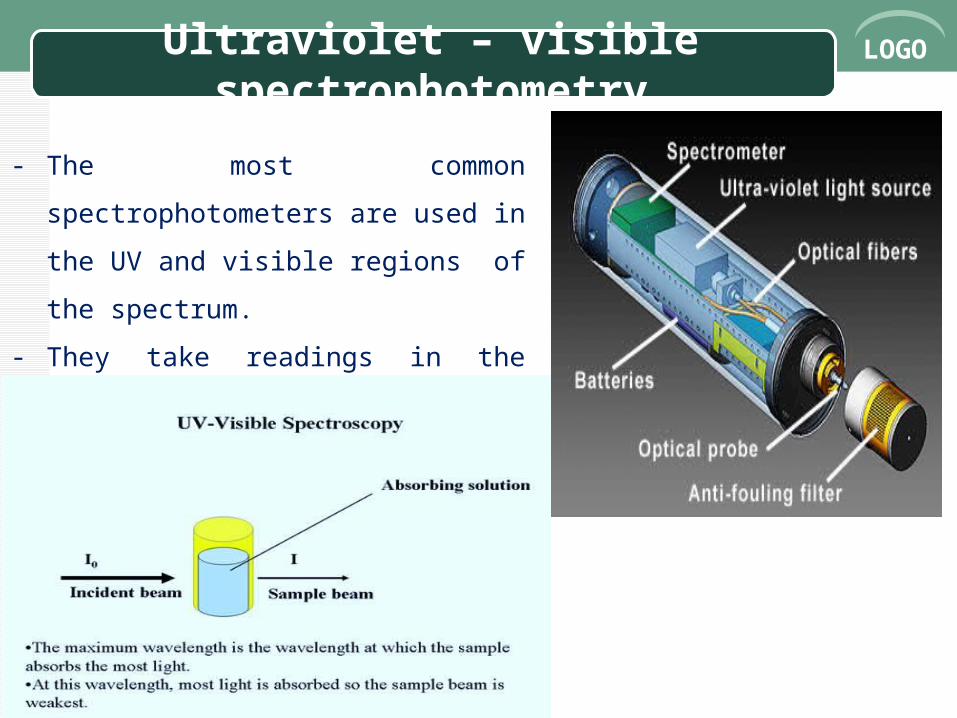
- The most common spectrophotometers
are used in the UV and visible regions of
the spectrum.
- They take readings in the region of
every 5–20 nanometers along the
visible region.

LOGOUltraviolet – visible spectrophotometry

LOGOUltraviolet – visible spectrophotometry
Ultraviolet Lights

LOGOUltraviolet – visible spectrophotometry
Visible Lights

LOGOInfrared spectrophotometry
Thermocouples for infrared radiation
Absorbed infrared radiation causes
rotational changes in molecules
IR
Infrared radiation was discovered
1800

LOGOInfrared spectrophotometry

LOGOReferences
[1]. Le Thi Thanh Huong, English for specialized chemistry, Ho
Chi Minh city University of Industry, 2012.

LOGO
www.themegallery.com