
Energy‐Water Nexus in Texas - Environmental Defense Fund · THE UNIVERSITY OF TEXAS AT AUSTIN |...
56
THE UNIVERSITY OF TEXAS AT AUSTIN | ENVIRONMENTAL DEFENSE FUND Energy‐Water Nexus in Texas Ashlynn S. Stillwell Carey W. King Michael E. Webber Ian J. Duncan Amy Hardberger
-
Upload
truongnguyet -
Category
Documents
-
view
216 -
download
2
Transcript of Energy‐Water Nexus in Texas - Environmental Defense Fund · THE UNIVERSITY OF TEXAS AT AUSTIN |...
THE UNIVERSITY OF TEXAS AT AUSTIN | ENVIRONMENTAL DEFENSE FUND
Energy‐Water Nexus in Texas
Ashlynn S. Stillwell
Carey W. King
Michael E. Webber
Ian J. Duncan
Amy Hardberger

THE UNIVERSITY OF TEXAS AT AUSTIN | ENVIRONMENTAL DEFENSE FUND
Energy‐Water Nexus in Texas
Ashlynn S. Stillwell1
Carey W. King1
Michael E. Webber1
Ian J. Duncan1
Amy Hardberger2
April 2009
Affiliations
1 The University of Texas at Austin
2 Environmental Defense Fund

Acknowledgements The authors would like to acknowledge the contributions of Eliot Meyer and Desmond Lawler at the University of Texas at Austin. This work was sponsored by the Energy Foundation and the Texas State Energy Conservation Office.
Table of Contents Executive Summary ............................................................................................................................. 1
Introduction ...................................................................................................................................... 3
Chapter 1. Water for Energy ........................................................................................................... 5
Electricity Generation and Use .................................................................................................................5
Cooling Technologies ................................................................................................................................6
Types of Power Plants.............................................................................................................................13
Chapter 2. Energy for Water ......................................................................................................... 20
Public Water Supply Systems..................................................................................................................20
Source Collection and Conveyance.....................................................................................................20
Treatment ...........................................................................................................................................21
Distribution .........................................................................................................................................22
Residential Water Use.........................................................................................................................23
Wastewater Systems ..............................................................................................................................24
Collection and Conveyance.................................................................................................................24
Treatment ...........................................................................................................................................24
Discharge.............................................................................................................................................25
Chapter 3. Energy‐Water Nexus in Texas ...................................................................................... 26
Electricity Generation from Texas Power Plants ....................................................................................26
Water Consumption and Withdrawals of Texas Power Plants ...............................................................26
Energy for Water and Wastewater Treatment Systems in Texas...........................................................27
Chapter 4. Future Energy and Water Use in Texas......................................................................... 30
Electricity Demand Projections...............................................................................................................30
Water Demand Projections.....................................................................................................................33
Conservation of Energy and Water.........................................................................................................33
ii
Chapter 5. Policy Discussion ......................................................................................................... 36
Carbon, Water, and Energy: Tensions and Policy Tradeoffs ..................................................................36
Energy Policies Have Mixed Water Impacts .......................................................................................36
Water Policies Might Have Detrimental Carbon Impacts ...................................................................37
Carbon Policies Might Have Detrimental Water Impacts ...................................................................37
Climate Change Impacts on Water Resources....................................................................................38
Conclusions .................................................................................................................................... 40
Future Work ............................................................................................................................................41
References .................................................................................................................................... 42
Appendix A: Glossary of Terms.......................................................................................................... 47
Energy terms ...........................................................................................................................................47
Water terms ............................................................................................................................................47
General terms .........................................................................................................................................48
Appendix B: Typical Water Balances for Power Plants ....................................................................... 49
American Electric Power .........................................................................................................................49
South Texas Project.................................................................................................................................51
1
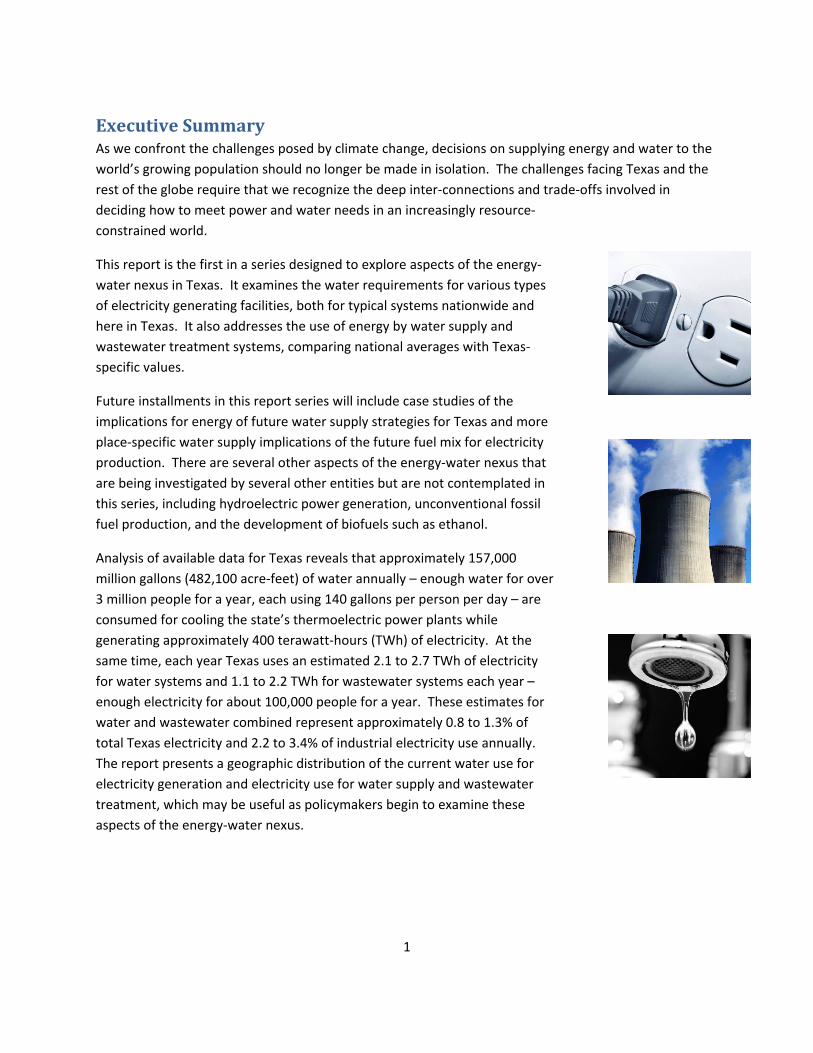
Executive Summary As we confront the challenges posed by climate change, decisions on supplying energy and water to the world’s growing population should no longer be made in isolation. The challenges facing Texas and the rest of the globe require that we recognize the deep inter‐connections and trade‐offs involved in deciding how to meet power and water needs in an increasingly resource‐constrained world.
This report is the first in a series designed to explore aspects of the energy‐water nexus in Texas. It examines the water requirements for various types of electricity generating facilities, both for typical systems nationwide and here in Texas. It also addresses the use of energy by water supply and wastewater treatment systems, comparing national averages with Texas‐specific values.
Future installments in this report series will include case studies of the implications for energy of future water supply strategies for Texas and more place‐specific water supply implications of the future fuel mix for electricity production. There are several other aspects of the energy‐water nexus that are being investigated by several other entities but are not contemplated in this series, including hydroelectric power generation, unconventional fossil fuel production, and the development of biofuels such as ethanol.
Analysis of available data for Texas reveals that approximately 157,000 million gallons (482,100 acre‐feet) of water annually – enough water for over 3 million people for a year, each using 140 gallons per person per day – are consumed for cooling the state’s thermoelectric power plants while generating approximately 400 terawatt‐hours (TWh) of electricity. At the same time, each year Texas uses an estimated 2.1 to 2.7 TWh of electricity for water systems and 1.1 to 2.2 TWh for wastewater systems each year – enough electricity for about 100,000 people for a year. These estimates for water and wastewater combined represent approximately 0.8 to 1.3% of total Texas electricity and 2.2 to 3.4% of industrial electricity use annually. The report presents a geographic distribution of the current water use for electricity generation and electricity use for water supply and wastewater treatment, which may be useful as policymakers begin to examine these aspects of the energy‐water nexus.
2
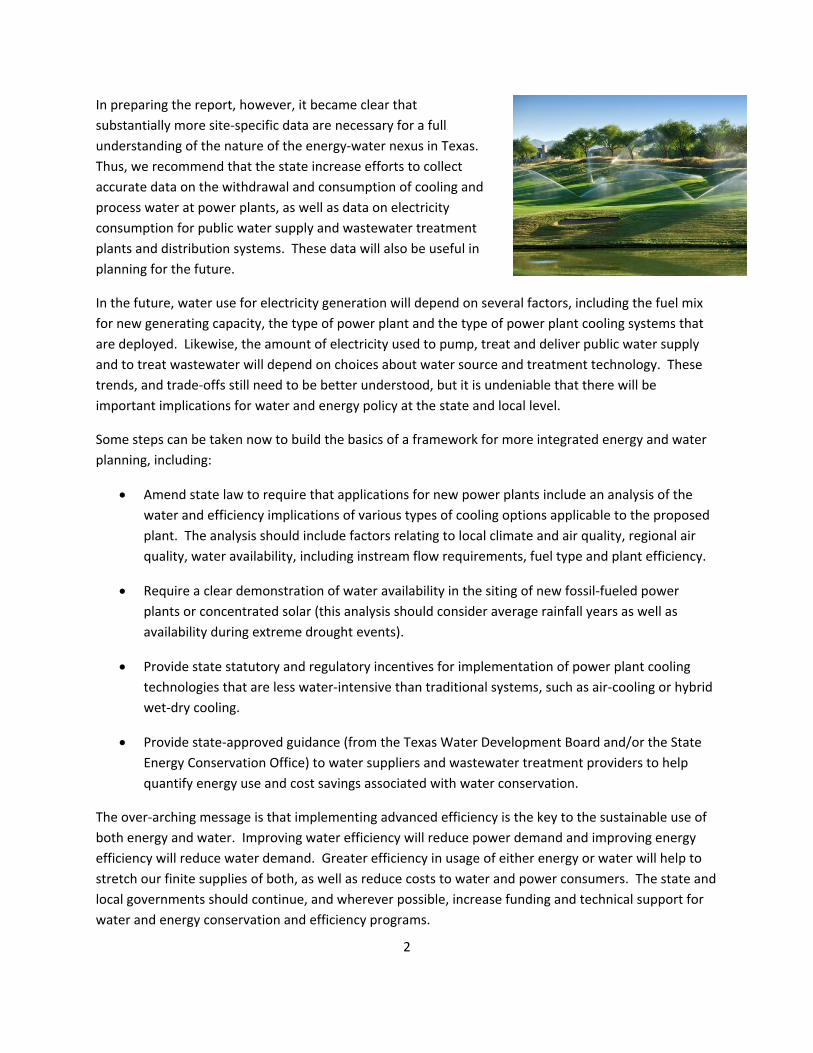
In preparing the report, however, it became clear that substantially more site‐specific data are necessary for a full understanding of the nature of the energy‐water nexus in Texas. Thus, we recommend that the state increase efforts to collect accurate data on the withdrawal and consumption of cooling and process water at power plants, as well as data on electricity consumption for public water supply and wastewater treatment plants and distribution systems. These data will also be useful in planning for the future.
In the future, water use for electricity generation will depend on several factors, including the fuel mix for new generating capacity, the type of power plant and the type of power plant cooling systems that are deployed. Likewise, the amount of electricity used to pump, treat and deliver public water supply and to treat wastewater will depend on choices about water source and treatment technology. These trends, and trade‐offs still need to be better understood, but it is undeniable that there will be important implications for water and energy policy at the state and local level.
Some steps can be taken now to build the basics of a framework for more integrated energy and water planning, including:
• Amend state law to require that applications for new power plants include an analysis of the water and efficiency implications of various types of cooling options applicable to the proposed plant. The analysis should include factors relating to local climate and air quality, regional air quality, water availability, including instream flow requirements, fuel type and plant efficiency.
• Require a clear demonstration of water availability in the siting of new fossil‐fueled power plants or concentrated solar (this analysis should consider average rainfall years as well as availability during extreme drought events).
• Provide state statutory and regulatory incentives for implementation of power plant cooling technologies that are less water‐intensive than traditional systems, such as air‐cooling or hybrid wet‐dry cooling.
• Provide state‐approved guidance (from the Texas Water Development Board and/or the State Energy Conservation Office) to water suppliers and wastewater treatment providers to help quantify energy use and cost savings associated with water conservation.
The over‐arching message is that implementing advanced efficiency is the key to the sustainable use of both energy and water. Improving water efficiency will reduce power demand and improving energy efficiency will reduce water demand. Greater efficiency in usage of either energy or water will help to stretch our finite supplies of both, as well as reduce costs to water and power consumers. The state and local governments should continue, and wherever possible, increase funding and technical support for water and energy conservation and efficiency programs.
3
Introduction Energy and water are intimately interrelated: we use energy for water and we use water for energy.
We use water for electricity production directly through hydroelectric power generation at major dams and indirectly as a coolant for thermoelectric power plants. Thermoelectric power plants—comprised of power plants that use heat to generate power, such as nuclear, coal, natural gas, solar thermal or biomass fuels—are the single largest user of water in the United States. We also use water as a critical input for the growth and production of biofuels, such as corn ethanol.
In addition to using water for energy, we also use energy for water. Specifically, we use a significant amount of electricity to produce, deliver, heat and treat water supplies and to treat wastewater.
Despite the interconnections, historically these two sectors have been regulated and managed independently of one another. Planning for energy supply traditionally gave scant consideration to water supply issues and planning for water supply often neglected to fully consider associated energy requirements. [1]
Failure to consider the interdependencies of energy and water introduces vulnerabilities whereby constraints of one resource introduce constraints in the other. That is, droughts and heat waves create water constraints that can become energy constraints, and grid outages or other failures in the energy system can become constraints in the water and wastewater sectors.
A severe drought in the southeast United States in 2007‐2008 brought power plants within days of being forced to shut down due to a lack of water for cooling. [2‐6] Today in the west, a multi‐year drought has lowered water levels behind Hoover Dam, introducing the risk that Las Vegas will lose a substantial portion of its drinking water at the same time the dam’s hydroelectric turbines quit spinning, which would cut off a significant source of power for Los Angeles. [7, 8] Heat waves can also introduce problems. During the 2003 heat wave in France that was responsible for approximately 15,000 deaths, nuclear power plants had to reduce their power output because of the high inlet temperatures of the cooling water. [9] Environmental regulations in France (and the United States) limit the rejection temperature of power plant cooling water to avoid ecosystem damage from thermal pollution. When the heat wave raised river temperatures, the nuclear power plants could not achieve sufficient cooling within the environmental limits, and so they reduced their power output at a time when electricity demand was spiking by residents turning on their air conditioners. In addition, the corollary is true: power outages hamper the ability for the water/wastewater sector to treat and distribute water. These power outages can occur for a variety of reasons, including grid failures that are common after hurricanes. For example, hurricanes Ike and Gustav induced sustained power outages, which can affect the ability to get safe, clean drinking water to the public.
Droughts, heat waves and hurricanes are not unusual experiences for Texas, and because of the energy‐water nexus, they introduce a coupled cross‐sectoral vulnerability. These vulnerabilities might only get more pronounced as resources become more constrained due to population growth and as water and energy suppliers confront new challenges associated with climate change. [10] Understanding and

4
accounting for the energy‐water nexus is becoming increasingly important to ensure that natural resource policies and plans lead to sustainable and affordable results. Using an integrated policymaking approach to make the system more resilient and sustainable would be a significant step forward.
This is the first in a series of reports designed to explore certain aspects of the energy‐water nexus. This report examines the average water requirements for various types of electricity generating facilities, both nationwide and here in Texas. It also addresses the use of energy by water supply and wastewater treatment systems, again from a national average and Texas‐specific perspectives.
Future installments in this report series will include case studies of energy implications of future water supply strategies for Texas and more place‐specific water supply implications of the future fuel mix for electricity production. There are several other aspects of the energy‐water nexus that are not contemplated in this series, but being investigated by several other entities, including production of hydropower for electricity generation and water use in producing various fossil fuels and alternative transportation fuels, such as ethanol or other biofuels.
Texas Electricity Consump on by Sector(Total: 380 billion kWh)
Transporta on0%
Commercial29%
Reside al33%
Industrial38%
U.S. Electricity Consump on by Sector(Total: 3,700 billion kWh)
Transporta on0%
Industrial28% Reside al
37%
Commercial35%
Chapter 1. Water for Energy A number of primary energy sources such as coal, uranium, natural gas, biomass, sun, water, or wind, can be used to generate electricity, which distributes energy to commercial, and industrial customers. Using different processes, energy within these fuel sources (chemical, kine c, or radiant energy) is converted into electrical energy. Based on the laws of thermodynamics, energy is neither created nor destroyed when converted into electrical energy. However, the conversion processes are inherently inefficient, which generates waste heat that is typically dissipated by use of cooling water.
The typical thermoelectric power plants use nuclear or fossil fuels to heat high purity water into steam, which then turns a turbine connected to a generator, producing electricity. The steam is then condensed back into water to con nue the process again in a closed loop. This conde requires cooling either by use of water, air, or both. The energy efficiency of the turbine in ng steam into electric energy depends in part on the eff of the steam conde process. That is, the efficiency of the power plant depends on its ability to cool its steam loop. The ty of water required for cooling depends on the type of fuel, power gen on technology, and cooling technology. Even some power plants that do not operate with a steam cycle (i.e. gas turbines) require a small amount of cooling for various components. In the case of fuels that must be mined (including coal, natural gas, and uranium), the mining process also requires water.
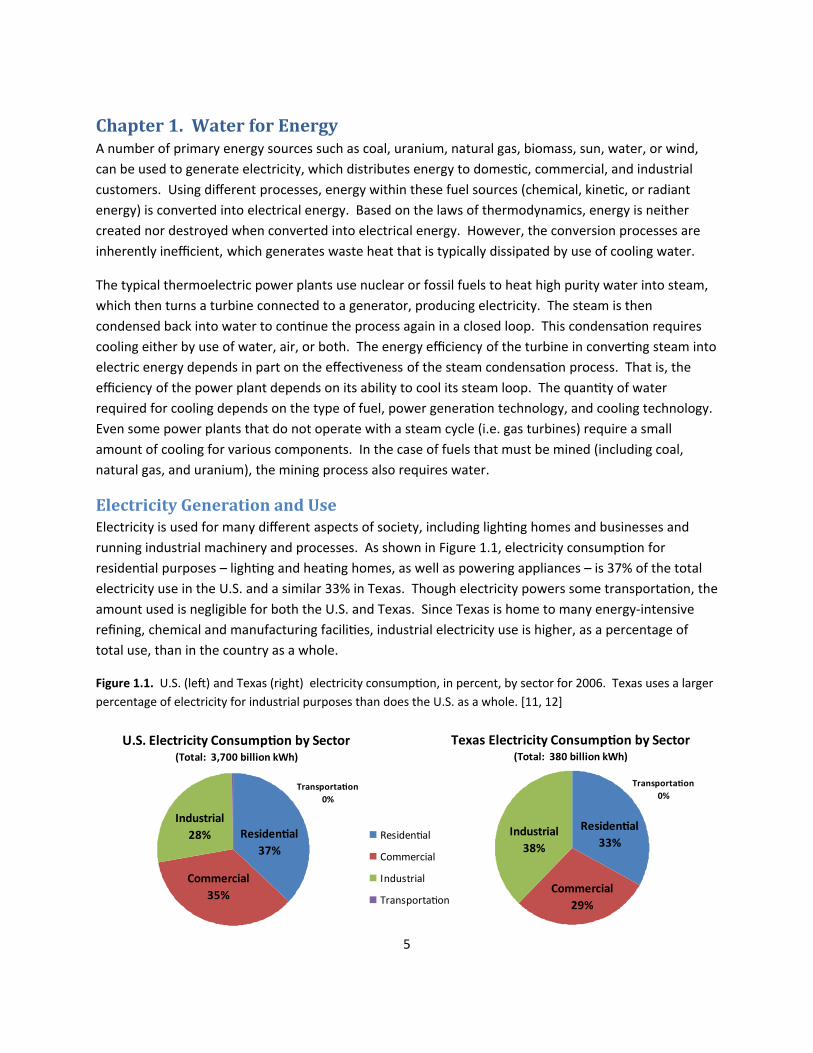
Electricity Generation and Use Electricity is used for many different aspects of society, including l ng homes and businesses and running industrial machinery and processes. As shown in Figure 1.1, electricity consump on for
purposes – ligh ng and hea ng homes, as well as powering appliances – is 37% of the total electricity use in the U.S. and a similar 33% in Texas. Though electricity powers some transp the amount used is negligible for both the U.S. and Texas. Since Texas is home to many energy-intensive refining, chemical and manufacturing fa industrial electricity use is higher, as a percentage of total use, than in the country as a whole.
Figure 1.1. U.S. ) and Texas (right) electricity consum in percent, by sector for 2006. Texas uses a larger percentage of electricity for industrial purposes than does the U.S. as a whole. [11, 12]
Residen al
Commercial
Industrial
Transporta on
5
6
U.S. Electricity Generation by Source(Total: 4,100 billion kWh)
Petroleum2%
Other1%
Renewable9%
Nuclear19% Coal
49%
Natural Gas20%
Texas Electricity Generation by Source(Total: 400 billion kWh)
Petroleum0%
Other2%
Renewable2%
Nuclear10%
Coal37%
Natural Gas49%
Coal
Natural Gas
Nuclear
Renewable
Petroleum
Other
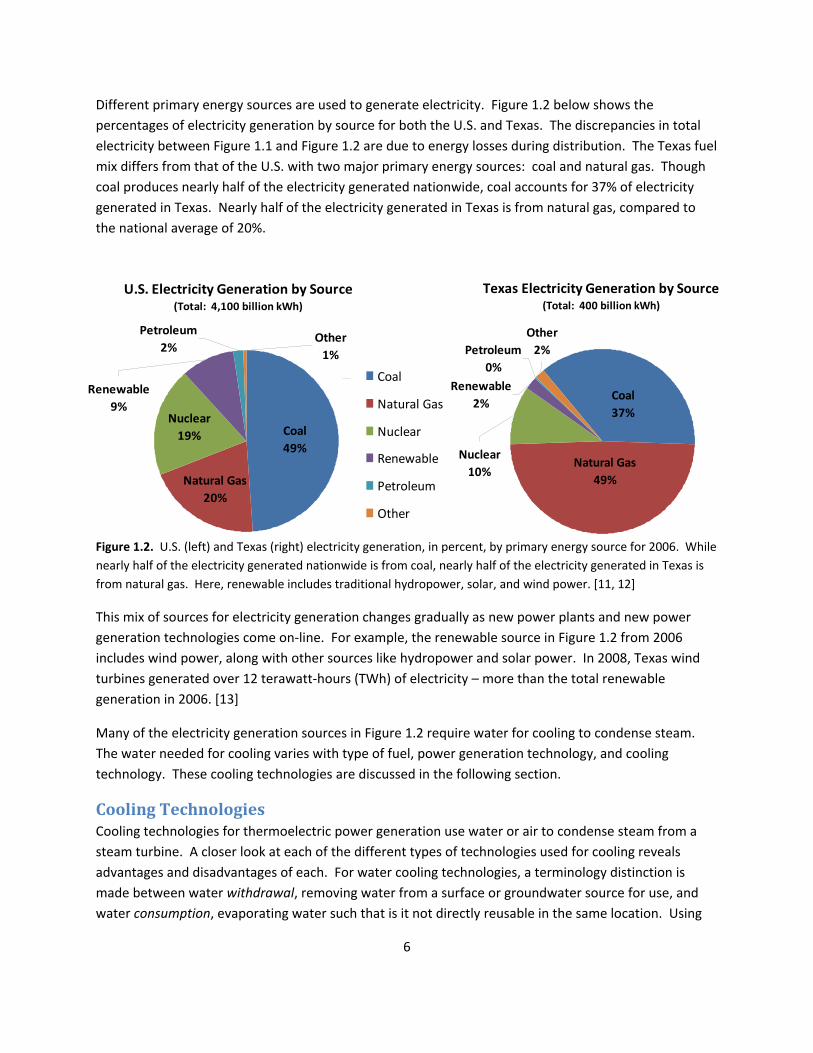
Different primary energy sources are used to generate electricity. Figure 1.2 below shows the percentages of electricity generation by source for both the U.S. and Texas. The discrepancies in total electricity between Figure 1.1 and Figure 1.2 are due to energy losses during distribution. The Texas fuel mix differs from that of the U.S. with two major primary energy sources: coal and natural gas. Though coal produces nearly half of the electricity generated nationwide, coal accounts for 37% of electricity generated in Texas. Nearly half of the electricity generated in Texas is from natural gas, compared to the national average of 20%.
Figure 1.2. U.S. (left) and Texas (right) electricity generation, in percent, by primary energy source for 2006. While nearly half of the electricity generated nationwide is from coal, nearly half of the electricity generated in Texas is from natural gas. Here, renewable includes traditional hydropower, solar, and wind power. [11, 12]
This mix of sources for electricity generation changes gradually as new power plants and new power generation technologies come on‐line. For example, the renewable source in Figure 1.2 from 2006 includes wind power, along with other sources like hydropower and solar power. In 2008, Texas wind turbines generated over 12 terawatt‐hours (TWh) of electricity – more than the total renewable generation in 2006. [13]
Many of the electricity generation sources in Figure 1.2 require water for cooling to condense steam. The water needed for cooling varies with type of fuel, power generation technology, and cooling technology. These cooling technologies are discussed in the following section.
Cooling Technologies Cooling technologies for thermoelectric power generation use water or air to condense steam from a steam turbine. A closer look at each of the different types of technologies used for cooling reveals advantages and disadvantages of each. For water cooling technologies, a terminology distinction is made between water withdrawal, removing water from a surface or groundwater source for use, and water consumption, evaporating water such that is it not directly reusable in the same location. Using
7
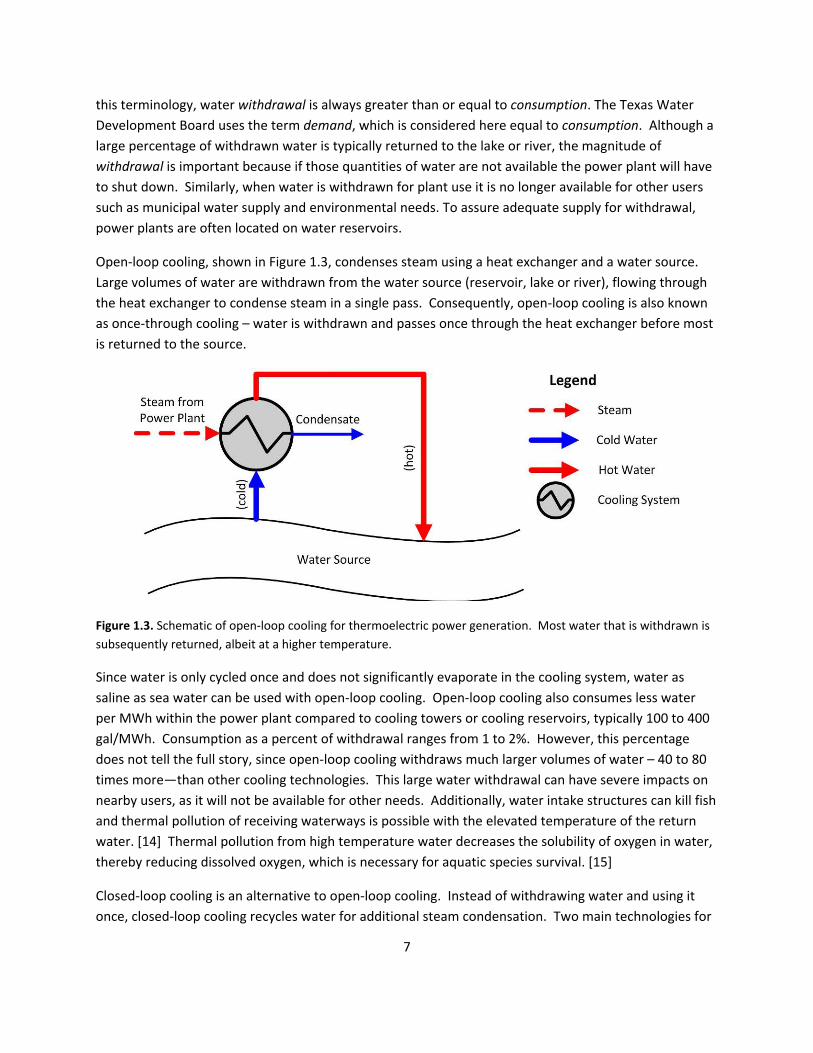
this terminology, water withdrawal is always greater than or equal to consumption. The Texas Water Development Board uses the term demand, which is considered here equal to consumption. Although a large percentage of withdrawn water is typically returned to the lake or river, the magnitude of withdrawal is important because if those quantities of water are not available the power plant will have to shut down. Similarly, when water is withdrawn for plant use it is no longer available for other users such as municipal water supply and environmental needs. To assure adequate supply for withdrawal, power plants are often located on water reservoirs.
Open‐loop cooling, shown in Figure 1.3, condenses steam using a heat exchanger and a water source. Large volumes of water are withdrawn from the water source (reservoir, lake or river), flowing through the heat exchanger to condense steam in a single pass. Consequently, open‐loop cooling is also known as once‐through cooling – water is withdrawn and passes once through the heat exchanger before most is returned to the source.
Figure 1.3. Schematic of open‐loop cooling for thermoelectric power generation. Most water that is withdrawn is subsequently returned, albeit at a higher temperature.
Since water is only cycled once and does not significantly evaporate in the cooling system, water as saline as sea water can be used with open‐loop cooling. Open‐loop cooling also consumes less water per MWh within the power plant compared to cooling towers or cooling reservoirs, typically 100 to 400 gal/MWh. Consumption as a percent of withdrawal ranges from 1 to 2%. However, this percentage does not tell the full story, since open‐loop cooling withdraws much larger volumes of water – 40 to 80 times more—than other cooling technologies. This large water withdrawal can have severe impacts on nearby users, as it will not be available for other needs. Additionally, water intake structures can kill fish and thermal pollution of receiving waterways is possible with the elevated temperature of the return water. [14] Thermal pollution from high temperature water decreases the solubility of oxygen in water, thereby reducing dissolved oxygen, which is necessary for aquatic species survival. [15]
Closed‐loop cooling is an alternative to open‐loop cooling. Instead of withdrawing water and using it once, closed‐loop cooling recycles water for additional steam condensation. Two main technologies for
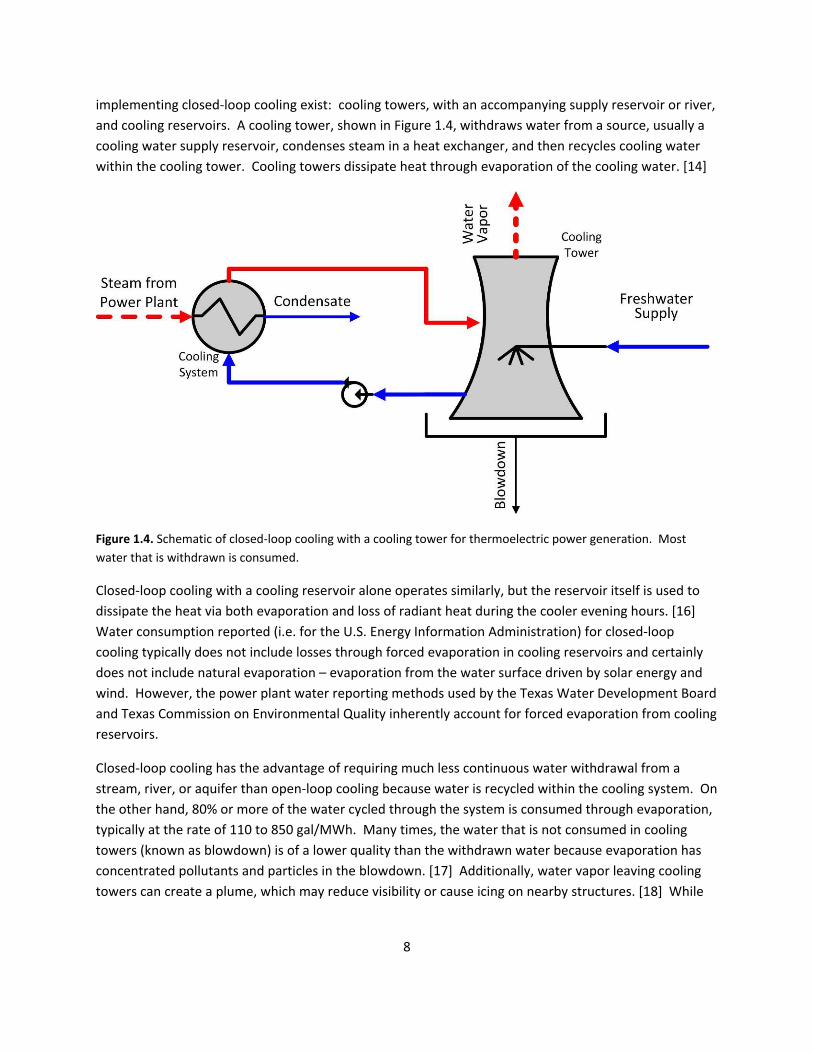
8
implementing closed‐loop cooling exist: cooling towers, with an accompanying supply reservoir or river, and cooling reservoirs. A cooling tower, shown in Figure 1.4, withdraws water from a source, usually a cooling water supply reservoir, condenses steam in a heat exchanger, and then recycles cooling water within the cooling tower. Cooling towers dissipate heat through evaporation of the cooling water. [14]
Figure 1.4. Schematic of closed‐loop cooling with a cooling tower for thermoelectric power generation. Most water that is withdrawn is consumed.
Closed‐loop cooling with a cooling reservoir alone operates similarly, but the reservoir itself is used to dissipate the heat via both evaporation and loss of radiant heat during the cooler evening hours. [16] Water consumption reported (i.e. for the U.S. Energy Information Administration) for closed‐loop cooling typically does not include losses through forced evaporation in cooling reservoirs and certainly does not include natural evaporation – evaporation from the water surface driven by solar energy and wind. However, the power plant water reporting methods used by the Texas Water Development Board and Texas Commission on Environmental Quality inherently account for forced evaporation from cooling reservoirs.
Closed‐loop cooling has the advantage of requiring much less continuous water withdrawal from a stream, river, or aquifer than open‐loop cooling because water is recycled within the cooling system. On the other hand, 80% or more of the water cycled through the system is consumed through evaporation, typically at the rate of 110 to 850 gal/MWh. Many times, the water that is not consumed in cooling towers (known as blowdown) is of a lower quality than the withdrawn water because evaporation has concentrated pollutants and particles in the blowdown. [17] Additionally, water vapor leaving cooling towers can create a plume, which may reduce visibility or cause icing on nearby structures. [18] While
9
many people associate cooling towers with nuclear power, they are also used by some coal and natural gas power plants.
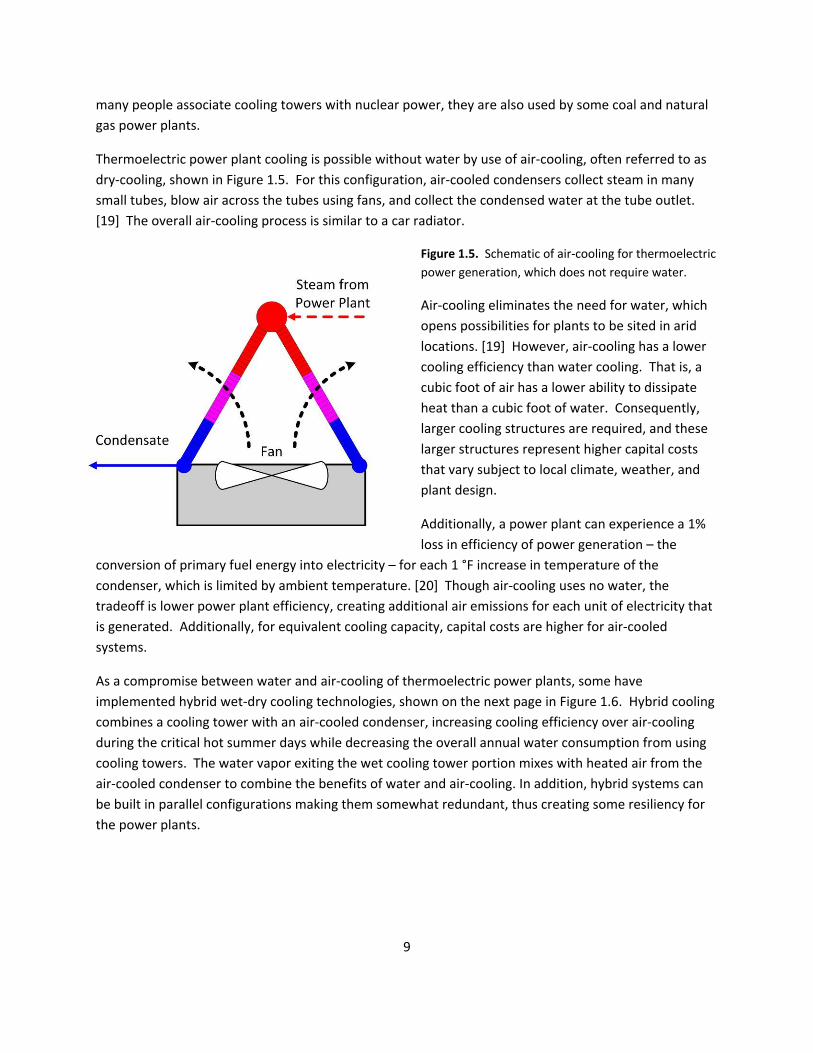
Thermoelectric power plant cooling is possible without water by use of air‐cooling, often referred to as dry‐cooling, shown in Figure 1.5. For this configuration, air‐cooled condensers collect steam in many small tubes, blow air across the tubes using fans, and collect the condensed water at the tube outlet. [19] The overall air‐cooling process is similar to a car radiator.
Figure 1.5. Schematic of air‐cooling for thermoelectric power generation, which does not require water.
Air‐cooling eliminates the need for water, which opens possibilities for plants to be sited in arid locations. [19] However, air‐cooling has a lower cooling efficiency than water cooling. That is, a cubic foot of air has a lower ability to dissipate heat than a cubic foot of water. Consequently, larger cooling structures are required, and these larger structures represent higher capital costs that vary subject to local climate, weather, and plant design.
Additionally, a power plant can experience a 1% loss in efficiency of power generation – the
conversion of primary fuel energy into electricity – for each 1 °F increase in temperature of the condenser, which is limited by ambient temperature. [20] Though air‐cooling uses no water, the tradeoff is lower power plant efficiency, creating additional air emissions for each unit of electricity that is generated. Additionally, for equivalent cooling capacity, capital costs are higher for air‐cooled systems.
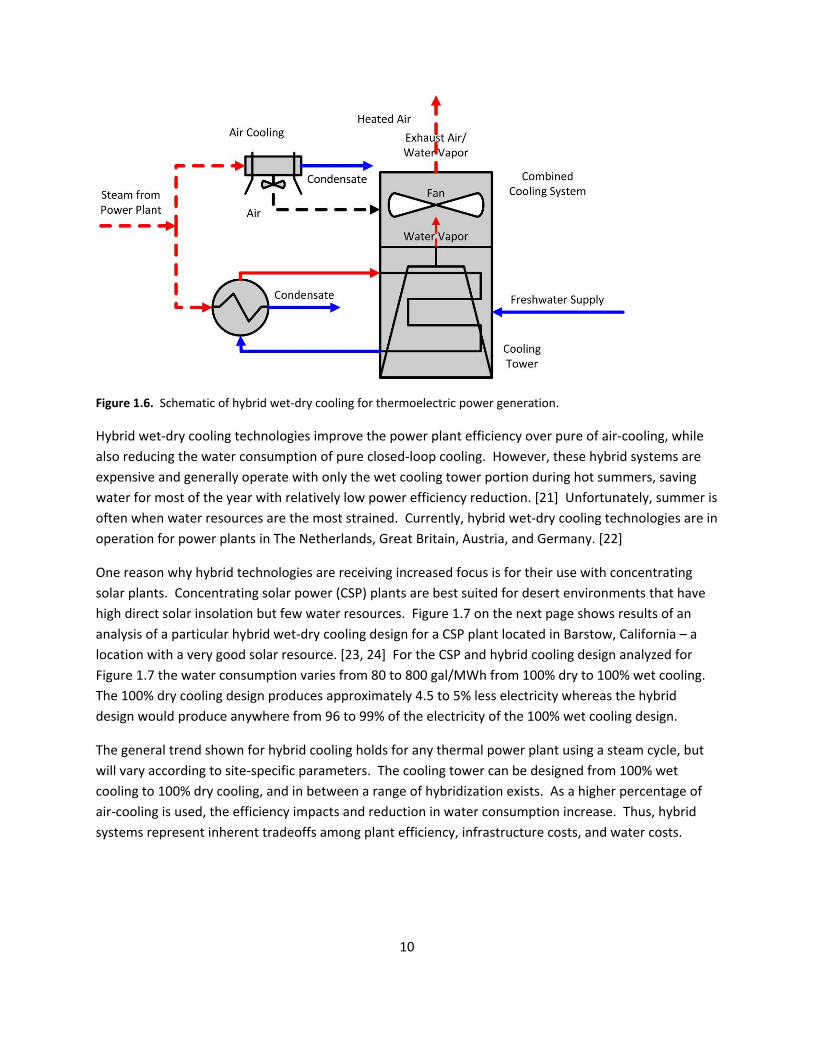
As a compromise between water and air‐cooling of thermoelectric power plants, some have implemented hybrid wet‐dry cooling technologies, shown on the next page in Figure 1.6. Hybrid cooling combines a cooling tower with an air‐cooled condenser, increasing cooling efficiency over air‐cooling during the critical hot summer days while decreasing the overall annual water consumption from using cooling towers. The water vapor exiting the wet cooling tower portion mixes with heated air from the air‐cooled condenser to combine the benefits of water and air‐cooling. In addition, hybrid systems can be built in parallel configurations making them somewhat redundant, thus creating some resiliency for the power plants.
10
Figure 1.6. Schematic of hybrid wet‐dry cooling for thermoelectric power generation.
Hybrid wet‐dry cooling technologies improve the power plant efficiency over pure of air‐cooling, while also reducing the water consumption of pure closed‐loop cooling. However, these hybrid systems are expensive and generally operate with only the wet cooling tower portion during hot summers, saving water for most of the year with relatively low power efficiency reduction. [21] Unfortunately, summer is often when water resources are the most strained. Currently, hybrid wet‐dry cooling technologies are in operation for power plants in The Netherlands, Great Britain, Austria, and Germany. [22]
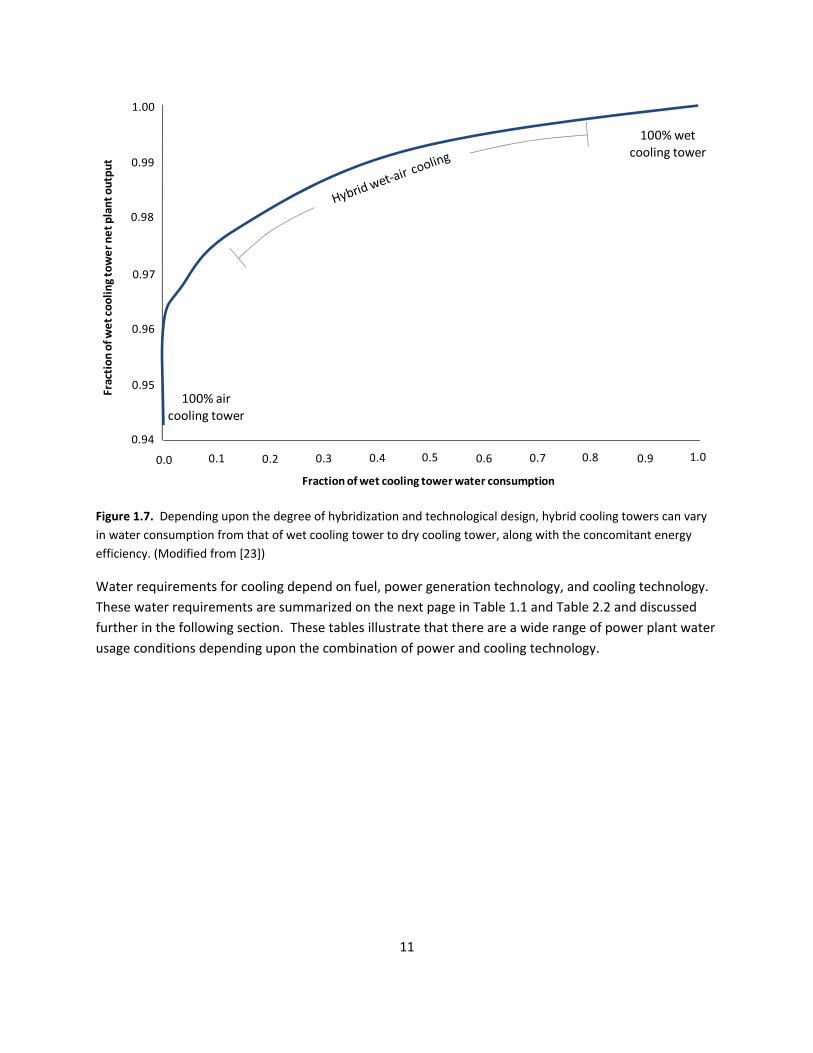
One reason why hybrid technologies are receiving increased focus is for their use with concentrating solar plants. Concentrating solar power (CSP) plants are best suited for desert environments that have high direct solar insolation but few water resources. Figure 1.7 on the next page shows results of an analysis of a particular hybrid wet‐dry cooling design for a CSP plant located in Barstow, California – a location with a very good solar resource. [23, 24] For the CSP and hybrid cooling design analyzed for Figure 1.7 the water consumption varies from 80 to 800 gal/MWh from 100% dry to 100% wet cooling. The 100% dry cooling design produces approximately 4.5 to 5% less electricity whereas the hybrid design would produce anywhere from 96 to 99% of the electricity of the 100% wet cooling design.
The general trend shown for hybrid cooling holds for any thermal power plant using a steam cycle, but will vary according to site‐specific parameters. The cooling tower can be designed from 100% wet cooling to 100% dry cooling, and in between a range of hybridization exists. As a higher percentage of air‐cooling is used, the efficiency impacts and reduction in water consumption increase. Thus, hybrid systems represent inherent tradeoffs among plant efficiency, infrastructure costs, and water costs.
11
0.0 0.1 0.2 0.3 0.4 0.5 0.6 0.7 0.8 0.9 1.00.94
0.95
0.96
0.97
0.98
0.99
1.00
Fraction of wet cooling tower water consumption
Fraction
of w
et coo
ling tower net plant outpu
t
100% wet cooling tower
100% air cooling tower
Figure 1.7. Depending upon the degree of hybridization and technological design, hybrid cooling towers can vary in water consumption from that of wet cooling tower to dry cooling tower, along with the concomitant energy efficiency. (Modified from [23])
Water requirements for cooling depend on fuel, power generation technology, and cooling technology. These water requirements are summarized on the next page in Table 1.1 and Table 2.2 and discussed further in the following section. These tables illustrate that there are a wide range of power plant water usage conditions depending upon the combination of power and cooling technology.
12
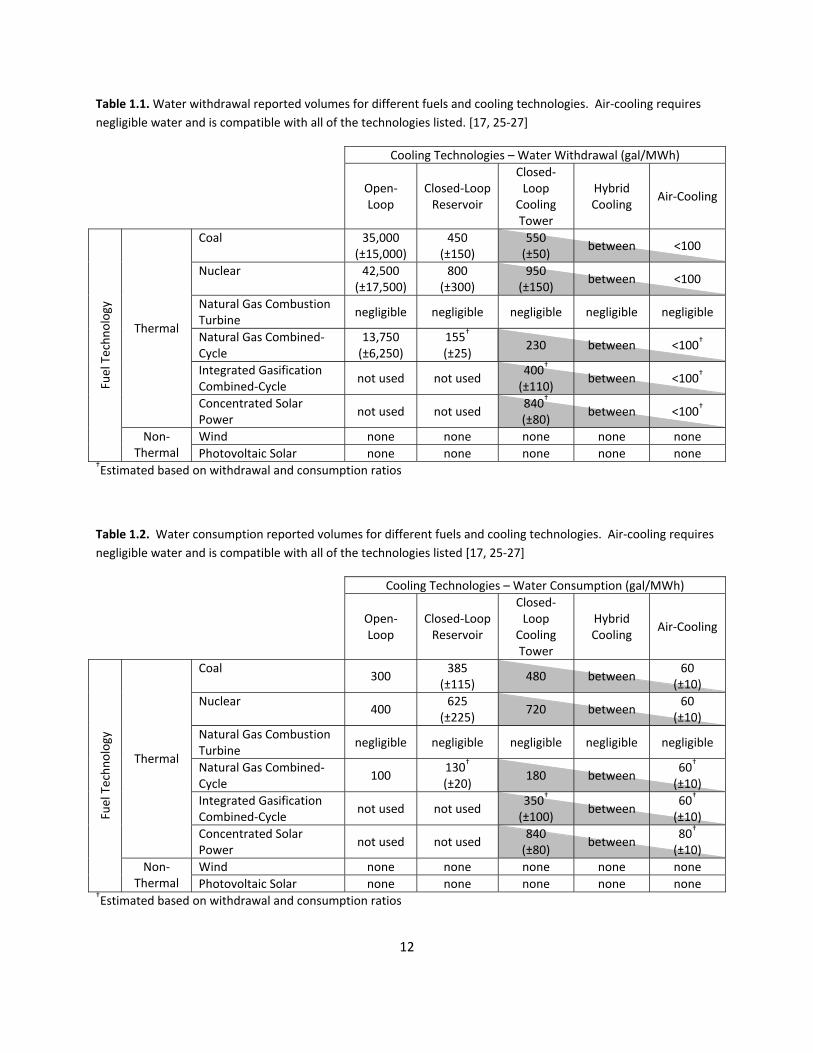
Table 1.1. Water withdrawal reported volumes for different fuels and cooling technologies. Air‐cooling requires negligible water and is compatible with all of the technologies listed. [17, 25‐27]
Cooling Technologies – Water Withdrawal (gal/MWh)
Open‐Loop
Closed‐Loop Reservoir
Closed‐Loop
Cooling Tower
Hybrid Cooling
Air‐Cooling
Coal 35,000 (±15,000)
450 (±150)
550 (±50)
between <100
Nuclear 42,500 (±17,500)
800 (±300)
950 (±150)
between <100
Natural Gas Combustion Turbine
negligible negligible negligible negligible negligible
Natural Gas Combined‐Cycle
13,750 (±6,250)
155† (±25)
230 between <100†
Integrated Gasification Combined‐Cycle
not used not used 400† (±110)
between <100†
Thermal
Concentrated Solar Power
not used not used 840† (±80)
between <100†
Wind none none none none none
Fuel Techn
ology
Non‐Thermal Photovoltaic Solar none none none none none
†Estimated based on withdrawal and consumption ratios
Table 1.2. Water consumption reported volumes for different fuels and cooling technologies. Air‐cooling requires negligible water and is compatible with all of the technologies listed [17, 25‐27]
Cooling Technologies – Water Consumption (gal/MWh)
Open‐Loop
Closed‐Loop Reservoir
Closed‐Loop
Cooling Tower
Hybrid Cooling
Air‐Cooling
Coal 300
385 (±115)
480 between 60
(±10) Nuclear
400 625
(±225) 720 between
60 (±10)
Natural Gas Combustion Turbine
negligible negligible negligible negligible negligible
Natural Gas Combined‐Cycle
100 130† (±20)
180 between 60† (±10)
Integrated Gasification Combined‐Cycle
not used not used 350† (±100)
between 60† (±10)
Thermal
Concentrated Solar Power
not used not used 840 (±80)
between 80† (±10)
Wind none none none none none
Fuel Techn
ology
Non‐Thermal Photovoltaic Solar none none none none none
†Estimated based on withdrawal and consumption ratios
13
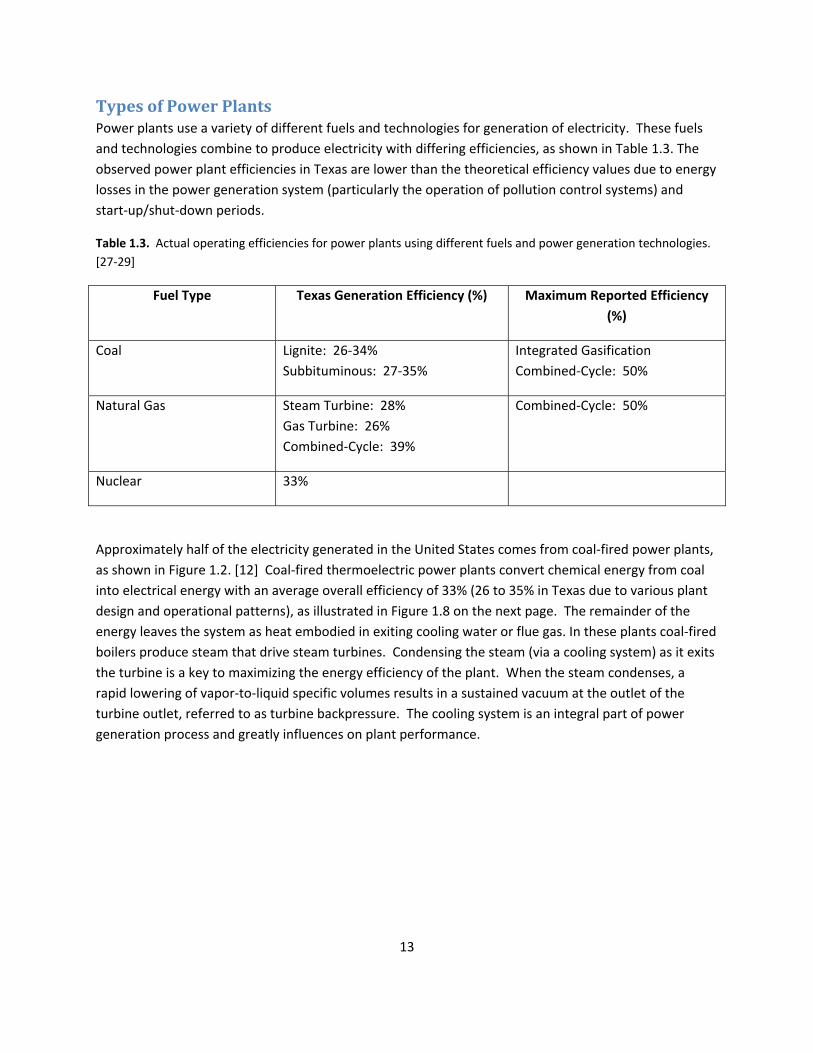
Types of Power Plants Power plants use a variety of different fuels and technologies for generation of electricity. These fuels and technologies combine to produce electricity with differing efficiencies, as shown in Table 1.3. The observed power plant efficiencies in Texas are lower than the theoretical efficiency values due to energy losses in the power generation system (particularly the operation of pollution control systems) and start‐up/shut‐down periods.
Table 1.3. Actual operating efficiencies for power plants using different fuels and power generation technologies. [27‐29]
Fuel Type Texas Generation Efficiency (%) Maximum Reported Efficiency (%)
Coal Lignite: 26‐34% Subbituminous: 27‐35%
Integrated Gasification Combined‐Cycle: 50%
Natural Gas Steam Turbine: 28% Gas Turbine: 26% Combined‐Cycle: 39%
Combined‐Cycle: 50%
Nuclear 33%
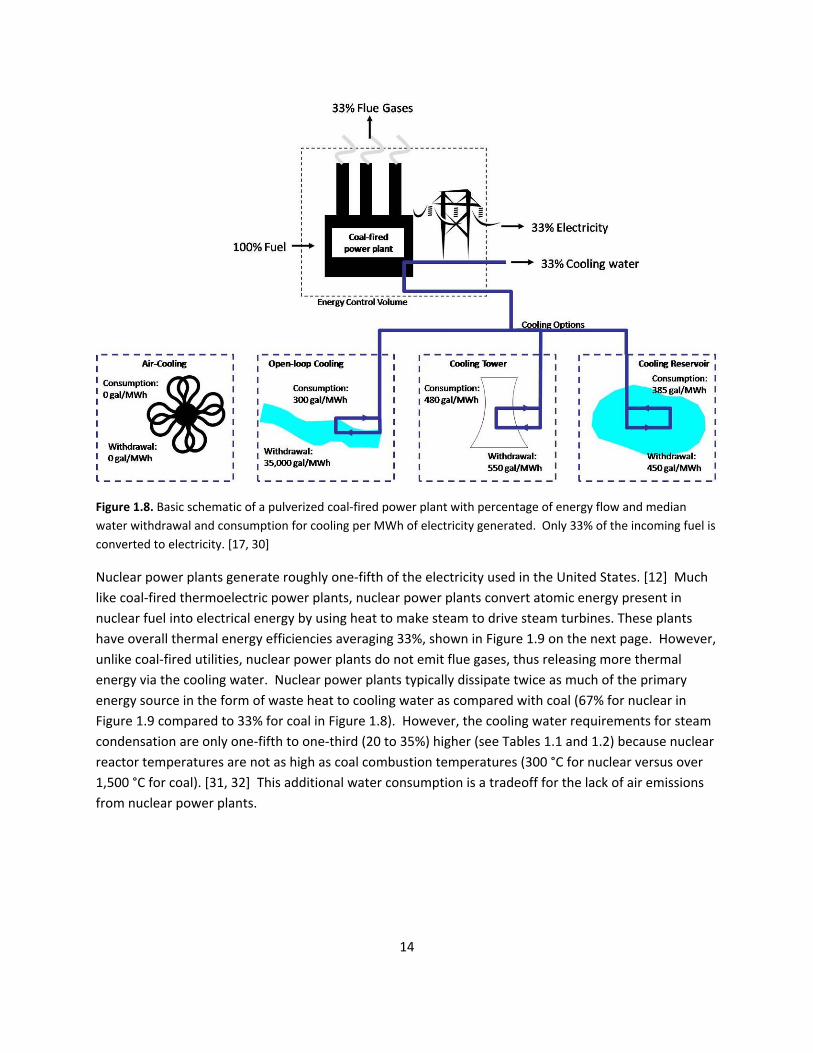
Approximately half of the electricity generated in the United States comes from coal‐fired power plants, as shown in Figure 1.2. [12] Coal‐fired thermoelectric power plants convert chemical energy from coal into electrical energy with an average overall efficiency of 33% (26 to 35% in Texas due to various plant design and operational patterns), as illustrated in Figure 1.8 on the next page. The remainder of the energy leaves the system as heat embodied in exiting cooling water or flue gas. In these plants coal‐fired boilers produce steam that drive steam turbines. Condensing the steam (via a cooling system) as it exits the turbine is a key to maximizing the energy efficiency of the plant. When the steam condenses, a rapid lowering of vapor‐to‐liquid specific volumes results in a sustained vacuum at the outlet of the turbine outlet, referred to as turbine backpressure. The cooling system is an integral part of power generation process and greatly influences on plant performance.
14
Figure 1.8. Basic schematic of a pulverized coal‐fired power plant with percentage of energy flow and median water withdrawal and consumption for cooling per MWh of electricity generated. Only 33% of the incoming fuel is converted to electricity. [17, 30]
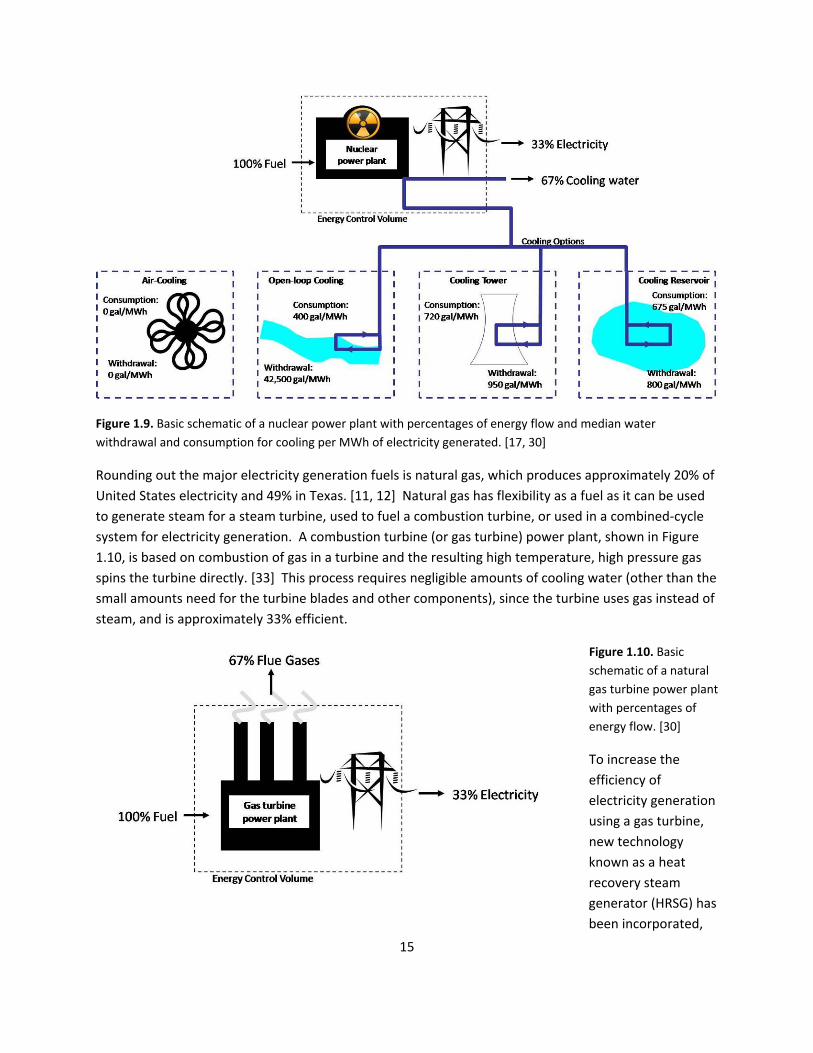
Nuclear power plants generate roughly one‐fifth of the electricity used in the United States. [12] Much like coal‐fired thermoelectric power plants, nuclear power plants convert atomic energy present in nuclear fuel into electrical energy by using heat to make steam to drive steam turbines. These plants have overall thermal energy efficiencies averaging 33%, shown in Figure 1.9 on the next page. However, unlike coal‐fired utilities, nuclear power plants do not emit flue gases, thus releasing more thermal energy via the cooling water. Nuclear power plants typically dissipate twice as much of the primary energy source in the form of waste heat to cooling water as compared with coal (67% for nuclear in Figure 1.9 compared to 33% for coal in Figure 1.8). However, the cooling water requirements for steam condensation are only one‐fifth to one‐third (20 to 35%) higher (see Tables 1.1 and 1.2) because nuclear reactor temperatures are not as high as coal combustion temperatures (300 °C for nuclear versus over 1,500 °C for coal). [31, 32] This additional water consumption is a tradeoff for the lack of air emissions from nuclear power plants.
15
Figure 1.9. Basic schematic of a nuclear power plant with percentages of energy flow and median water withdrawal and consumption for cooling per MWh of electricity generated. [17, 30]
Rounding out the major electricity generation fuels is natural gas, which produces approximately 20% of United States electricity and 49% in Texas. [11, 12] Natural gas has flexibility as a fuel as it can be used to generate steam for a steam turbine, used to fuel a combustion turbine, or used in a combined‐cycle system for electricity generation. A combustion turbine (or gas turbine) power plant, shown in Figure 1.10, is based on combustion of gas in a turbine and the resulting high temperature, high pressure gas spins the turbine directly. [33] This process requires negligible amounts of cooling water (other than the small amounts need for the turbine blades and other components), since the turbine uses gas instead of steam, and is approximately 33% efficient.
Figure 1.10. Basic schematic of a natural gas turbine power plant with percentages of energy flow. [30]
To increase the efficiency of electricity generation using a gas turbine, new technology known as a heat recovery steam generator (HRSG) has been incorporated,
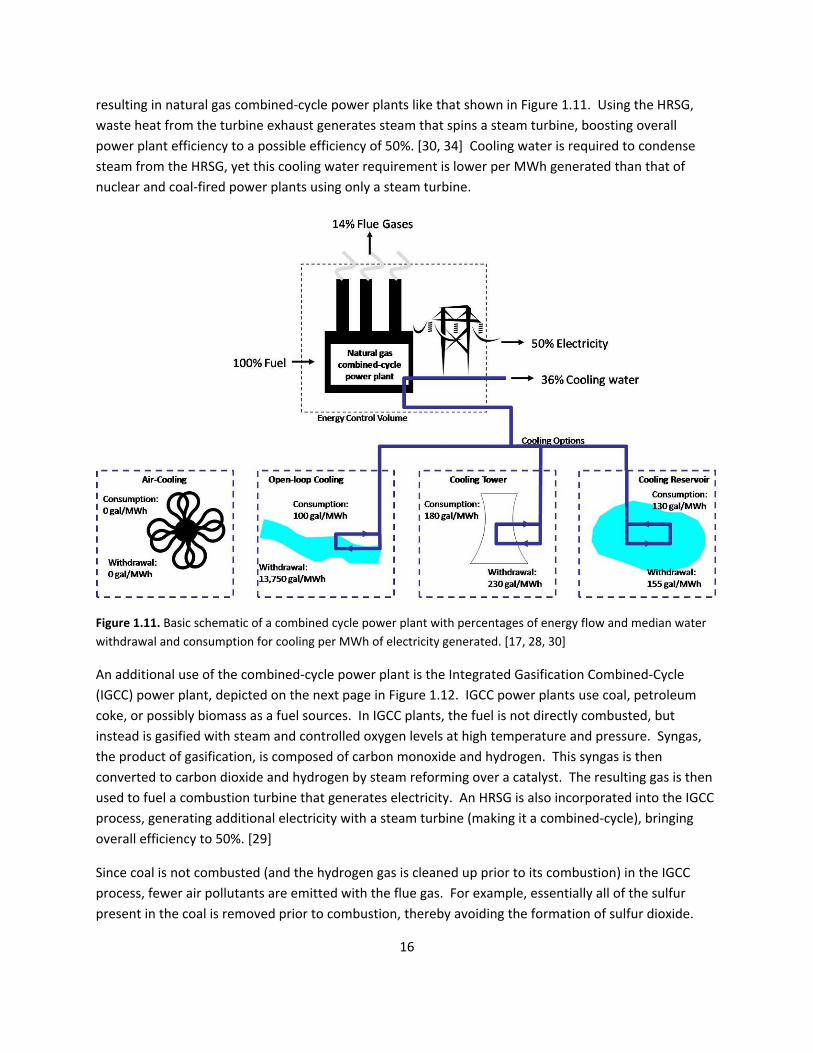
16
resulting in natural gas combined‐cycle power plants like that shown in Figure 1.11. Using the HRSG, waste heat from the turbine exhaust generates steam that spins a steam turbine, boosting overall power plant efficiency to a possible efficiency of 50%. [30, 34] Cooling water is required to condense steam from the HRSG, yet this cooling water requirement is lower per MWh generated than that of nuclear and coal‐fired power plants using only a steam turbine.
Figure 1.11. Basic schematic of a combined cycle power plant with percentages of energy flow and median water withdrawal and consumption for cooling per MWh of electricity generated. [17, 28, 30]
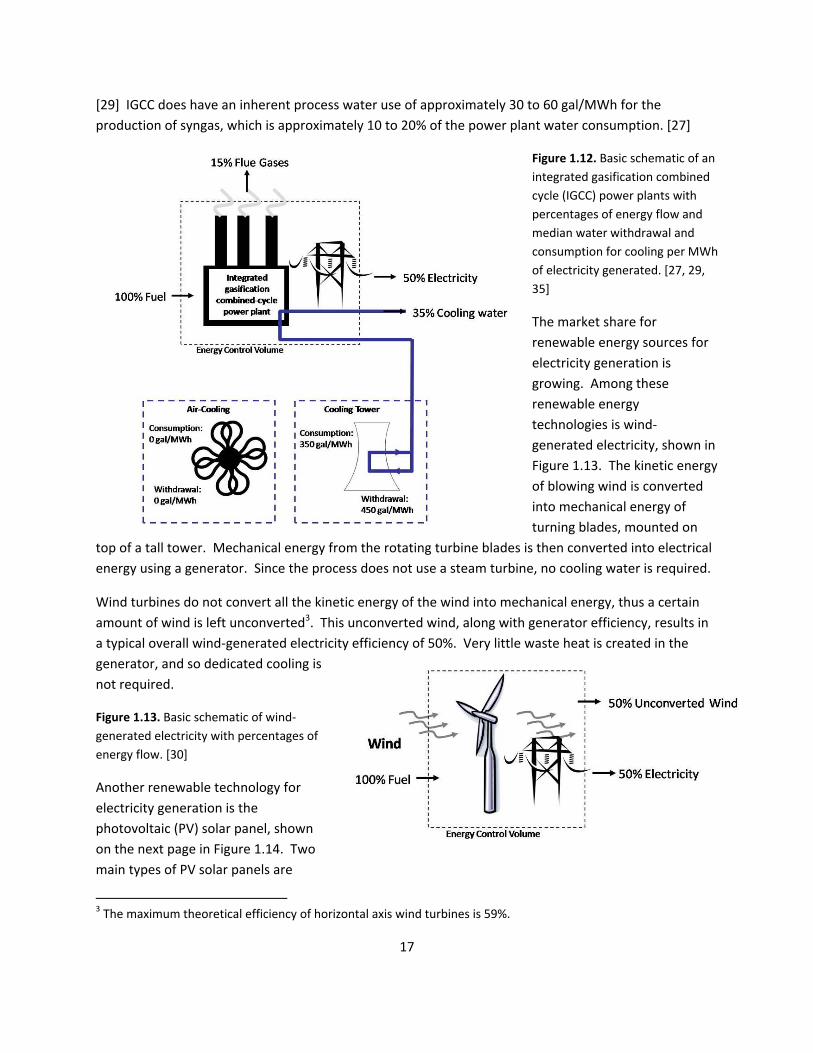
An additional use of the combined‐cycle power plant is the Integrated Gasification Combined‐Cycle (IGCC) power plant, depicted on the next page in Figure 1.12. IGCC power plants use coal, petroleum coke, or possibly biomass as a fuel sources. In IGCC plants, the fuel is not directly combusted, but instead is gasified with steam and controlled oxygen levels at high temperature and pressure. Syngas, the product of gasification, is composed of carbon monoxide and hydrogen. This syngas is then converted to carbon dioxide and hydrogen by steam reforming over a catalyst. The resulting gas is then used to fuel a combustion turbine that generates electricity. An HRSG is also incorporated into the IGCC process, generating additional electricity with a steam turbine (making it a combined‐cycle), bringing overall efficiency to 50%. [29]
Since coal is not combusted (and the hydrogen gas is cleaned up prior to its combustion) in the IGCC process, fewer air pollutants are emitted with the flue gas. For example, essentially all of the sulfur present in the coal is removed prior to combustion, thereby avoiding the formation of sulfur dioxide.
17
[29] IGCC does have an inherent process water use of approximately 30 to 60 gal/MWh for the production of syngas, which is approximately 10 to 20% of the power plant water consumption. [27]
Figure 1.12. Basic schematic of an integrated gasification combined cycle (IGCC) power plants with percentages of energy flow and median water withdrawal and consumption for cooling per MWh of electricity generated. [27, 29, 35]
The market share for renewable energy sources for electricity generation is growing. Among these renewable energy technologies is wind‐generated electricity, shown in Figure 1.13. The kinetic energy of blowing wind is converted into mechanical energy of turning blades, mounted on
top of a tall tower. Mechanical energy from the rotating turbine blades is then converted into electrical energy using a generator. Since the process does not use a steam turbine, no cooling water is required.
Wind turbines do not convert all the kinetic energy of the wind into mechanical energy, thus a certain amount of wind is left unconverted3. This unconverted wind, along with generator efficiency, results in a typical overall wind‐generated electricity efficiency of 50%. Very little waste heat is created in the generator, and so dedicated cooling is not required.
Figure 1.13. Basic schematic of wind‐generated electricity with percentages of energy flow. [30]
Another renewable technology for electricity generation is the photovoltaic (PV) solar panel, shown on the next page in Figure 1.14. Two main types of PV solar panels are
3 The maximum theoretical efficiency of horizontal axis wind turbines is 59%.
18
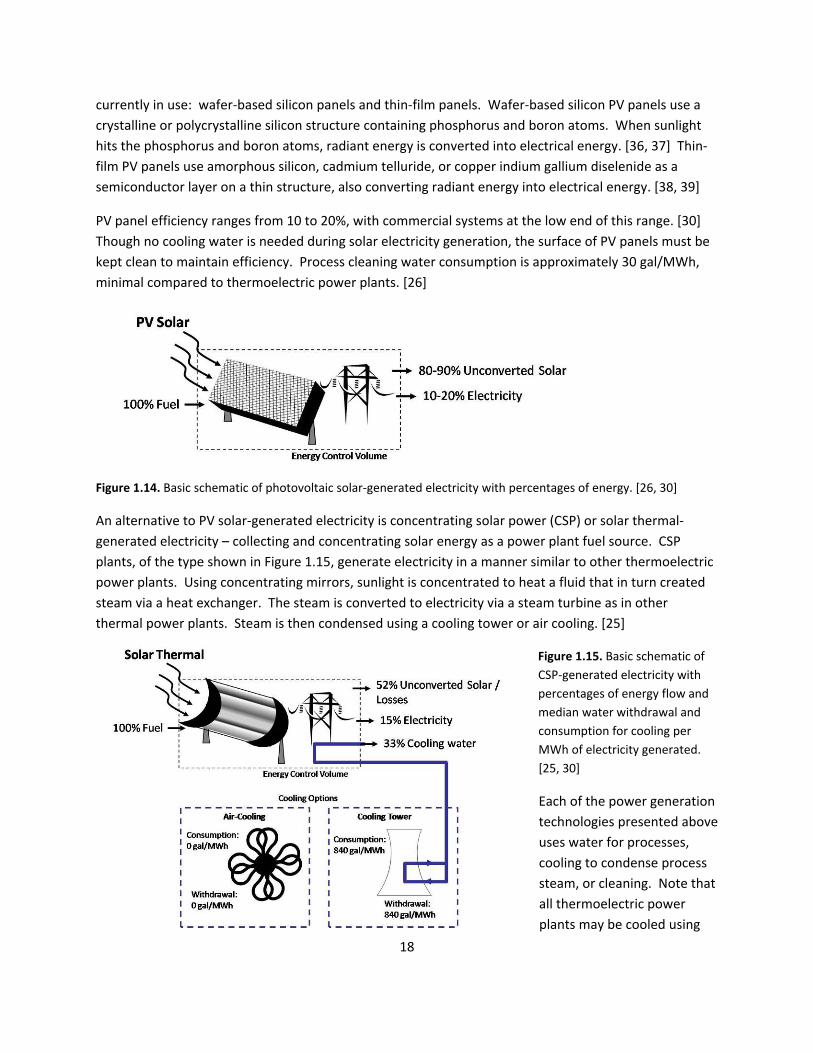
currently in use: wafer‐based silicon panels and thin‐film panels. Wafer‐based silicon PV panels use a crystalline or polycrystalline silicon structure containing phosphorus and boron atoms. When sunlight hits the phosphorus and boron atoms, radiant energy is converted into electrical energy. [36, 37] Thin‐film PV panels use amorphous silicon, cadmium telluride, or copper indium gallium diselenide as a semiconductor layer on a thin structure, also converting radiant energy into electrical energy. [38, 39]
PV panel efficiency ranges from 10 to 20%, with commercial systems at the low end of this range. [30] Though no cooling water is needed during solar electricity generation, the surface of PV panels must be kept clean to maintain efficiency. Process cleaning water consumption is approximately 30 gal/MWh, minimal compared to thermoelectric power plants. [26]
Figure 1.14. Basic schematic of photovoltaic solar‐generated electricity with percentages of energy. [26, 30]
An alternative to PV solar‐generated electricity is concentrating solar power (CSP) or solar thermal‐generated electricity – collecting and concentrating solar energy as a power plant fuel source. CSP plants, of the type shown in Figure 1.15, generate electricity in a manner similar to other thermoelectric power plants. Using concentrating mirrors, sunlight is concentrated to heat a fluid that in turn created steam via a heat exchanger. The steam is converted to electricity via a steam turbine as in other thermal power plants. Steam is then condensed using a cooling tower or air cooling. [25]
Figure 1.15. Basic schematic of CSP‐generated electricity with percentages of energy flow and median water withdrawal and consumption for cooling per MWh of electricity generated. [25, 30]
Each of the power generation technologies presented above uses water for processes, cooling to condense process steam, or cleaning. Note that all thermoelectric power plants may be cooled using

19
air‐cooling, which does not require water. For instance, the proposed Trailblazer Energy Center, near Sweetwater, Texas, is a pulverized coal facility for which Tenaska is considering air‐cooling to reduce water consumption. [40] Currently two thermal power plants in Texas, both natural gas‐powered combined‐cycle plants, use air‐cooling to some degree. These power plants have operated at over 45% power efficiency in 2006. [28]
20
Chapter 2. Energy for Water Freshwater is essential for human survival and prosperity, whether for drinking, sanitation, industrial use, irrigation, or power generation and every stage of the water supply process has energy requirements. Developing, pumping, and treating water for public water supply systems is a complex and resource‐intensive activity requiring significant amounts of energy. As pressure on water resources grows with population growth, public water suppliers are often looking further from home for new supplies or to technologies like desalination. Water is also a medium for transporting wastes. In order to protect water quality, wastewater discharges to surface and groundwater must meet various federal and state treatment requirements and those treatment processes require energy.
Public Water Supply Systems Public water supplies not only provide drinking water, they also are critical for a range of commercial and industrial activity. Providing public water supply requires collection and conveyance of source water, treatment and disinfection, then distribution to residential, commercial and sometimes industrial customers. Many end uses of water also require that the water be heated. Each of these steps requires energy inputs, typically in the form of electricity.
Source Collection and Conveyance
Public water supply in the United States comes from two main sources: surface water (streams, rivers, lakes) and groundwater (aquifers, wells). In 2000, 63% of U.S. public water (27.3 billion gallons per day) originated from surface water sources. [41] Moving raw water through pipelines or canals to the treatment plant requires pumping, except where gravity‐driven flow is possible.
Groundwater supplied 37% of source water for public water systems in 2000 (16 billion gallons per day), while domestic water use – self‐supplied water, usually in rural areas – was 98% groundwater through the use of wells. [42] Collection and conveyance of groundwater typically uses more electricity than surface water sources in the same location due to the energy requirements of pumping water from underground aquifers. These energy requirements for pumping vary with water depth: pumping from a depth of 120 feet (ft) requires 540 kilowatt‐hours per million gallons (kWh/Mgal), while pumping from 400 ft requires 2000 kWh/Mgal. [14] Average groundwater well depth in Texas is nearly 700 feet. [43] Generally, one‐third of the total energy required for collecting, treating, and distributing groundwater is for well pumping. [44]
The energy requirements for conveying source water to the treatment plant vary with geography; long‐haul and uphill water pipelines require more energy for pumping, while partially gravity‐fed systems require less. For example, California, which moves water hundreds of miles over two mountain ranges, requires 1,330 to 9,930 kWh/Mgal. [45]
Brackish groundwater and seawater are becoming more common sources of raw water in areas where freshwater supplies are not readily available. Seawater desalination plants are usually located close to the coast and so there is little energy required to convey the water to the treatment plant. Energy
21
requirements for pumping and conveying brackish groundwater are similar to those for freshwater aquifer sources.
Treatment
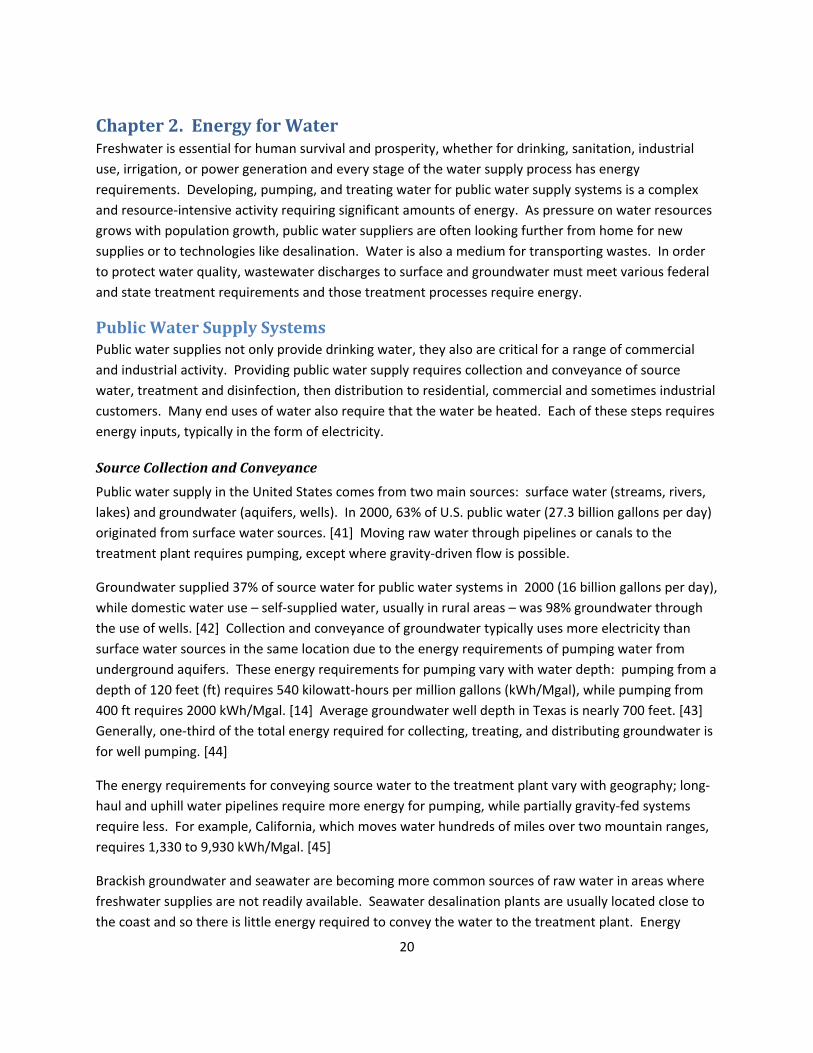
After raw source water is collected, it is treated to meet drinking water quality standards (even though only a small fraction of the water is used for drinking). A typical surface water treatment plant, shown in Figure 2.1, uses a combination of physical and chemical treatment processes to remove contaminants from water. Of the treatment processes shown in Figure 2.1, pumping between processes requires nearly three‐fourths of the total electricity used for water treatment. The actual treatment processes – flocculation, sedimentation, filtration, and disinfection – use the remaining fourth of the total electricity. [44]
Figure 2.1. Typical water treatment plant operations for converting surface water sources into drinking water supplies include many steps and require significant energy inputs. [44]
Groundwater treatment is similar to that of surface water treatment in Figure 2.1. Depending on raw groundwater quality, little treatment may be required: in some cases only taste and odor removal and disinfection are needed. [44]
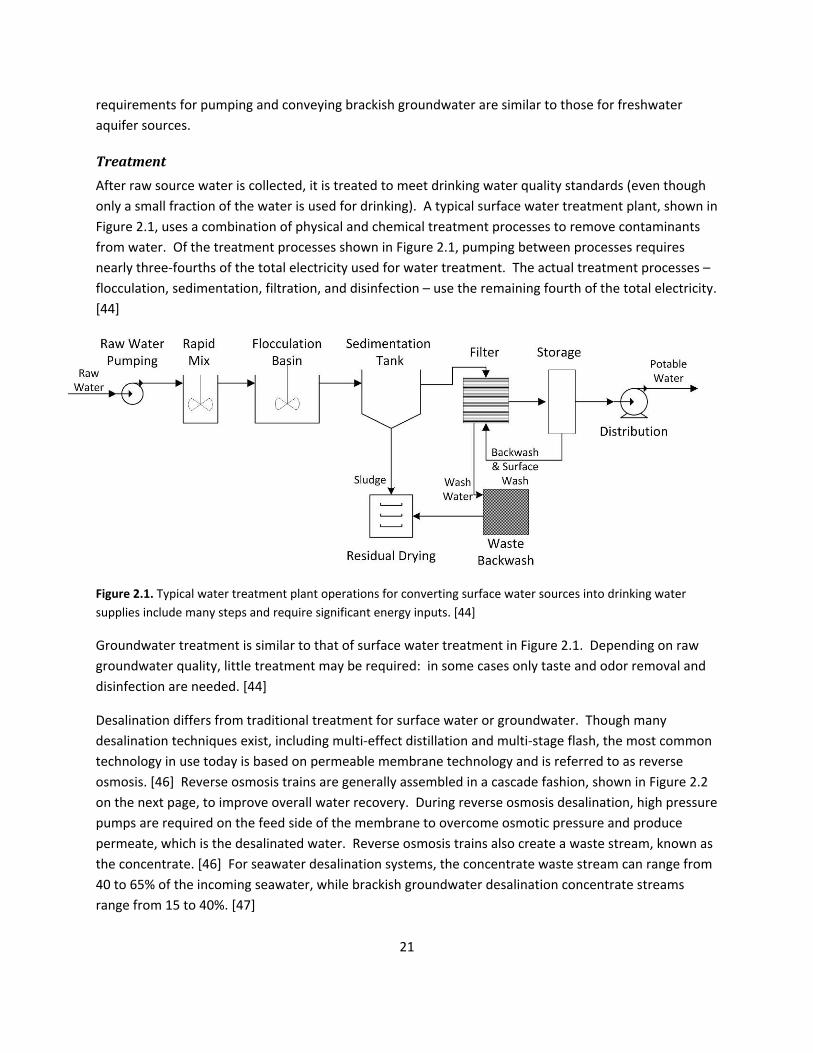
Desalination differs from traditional treatment for surface water or groundwater. Though many desalination techniques exist, including multi‐effect distillation and multi‐stage flash, the most common technology in use today is based on permeable membrane technology and is referred to as reverse osmosis. [46] Reverse osmosis trains are generally assembled in a cascade fashion, shown in Figure 2.2 on the next page, to improve overall water recovery. During reverse osmosis desalination, high pressure pumps are required on the feed side of the membrane to overcome osmotic pressure and produce permeate, which is the desalinated water. Reverse osmosis trains also create a waste stream, known as the concentrate. [46] For seawater desalination systems, the concentrate waste stream can range from 40 to 65% of the incoming seawater, while brackish groundwater desalination concentrate streams range from 15 to 40%. [47]
22
Figure 2.2. Reverse osmosis cascade train for water desalination. [48]
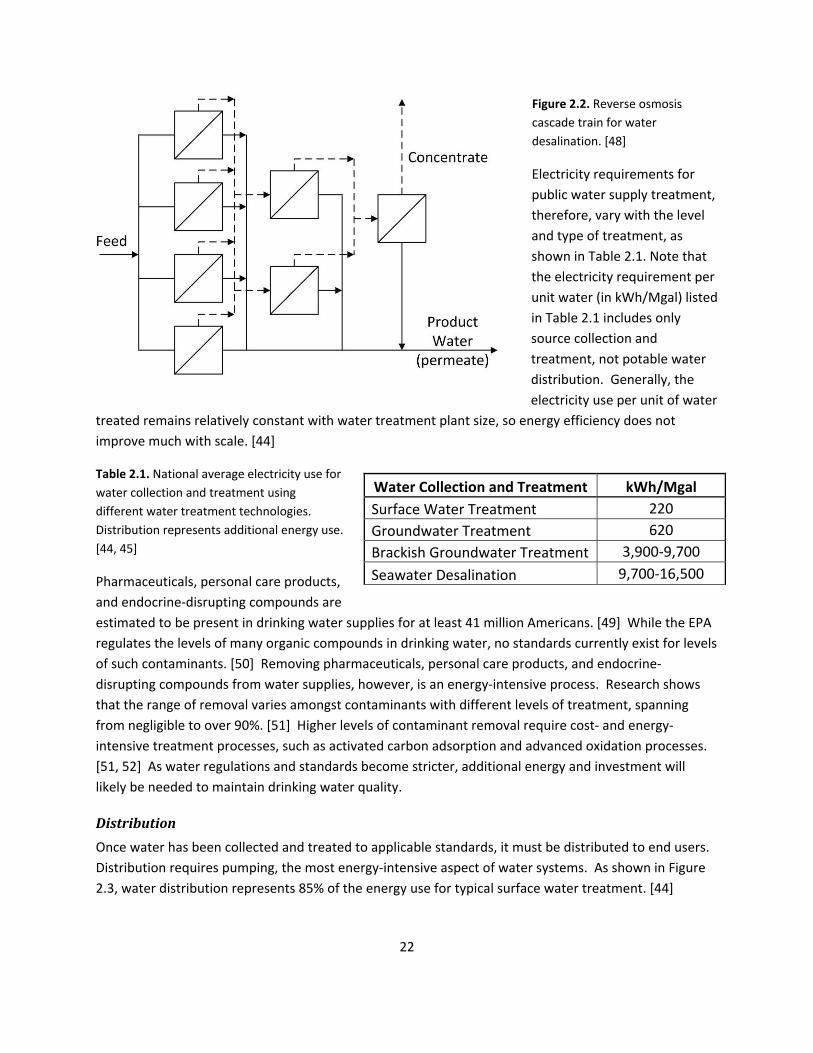
Electricity requirements for public water supply treatment, therefore, vary with the level and type of treatment, as shown in Table 2.1. Note that the electricity requirement per unit water (in kWh/Mgal) listed in Table 2.1 includes only source collection and treatment, not potable water distribution. Generally, the electricity use per unit of water
treated remains relatively constant with water treatment plant size, so energy efficiency does not improve much with scale. [44]
Table 2.1. National average electricity use for water collection and treatment using different water treatment technologies. Distribution represents additional energy use. [44, 45]
Pharmaceuticals, personal care products, and endocrine‐disrupting compounds are estimated to be present in drinking water supplies for at least 41 million Americans. [49] While the EPA regulates the levels of many organic compounds in drinking water, no standards currently exist for levels of such contaminants. [50] Removing pharmaceuticals, personal care products, and endocrine‐disrupting compounds from water supplies, however, is an energy‐intensive process. Research shows that the range of removal varies amongst contaminants with different levels of treatment, spanning from negligible to over 90%. [51] Higher levels of contaminant removal require cost‐ and energy‐intensive treatment processes, such as activated carbon adsorption and advanced oxidation processes. [51, 52] As water regulations and standards become stricter, additional energy and investment will likely be needed to maintain drinking water quality.
Distribution
Once water has been collected and treated to applicable standards, it must be distributed to end users. Distribution requires pumping, the most energy‐intensive aspect of water systems. As shown in Figure 2.3, water distribution represents 85% of the energy use for typical surface water treatment. [44]
Water Collection and Treatment kWh/Mgal Surface Water Treatment 220 Groundwater Treatment 620 Brackish Groundwater Treatment 3,900‐9,700
Seawater Desalination 9,700‐16,500
Energy Use for Drinking Water Treatment (kWh/Mgal)
Treatment 15%
Distribution 85%
23
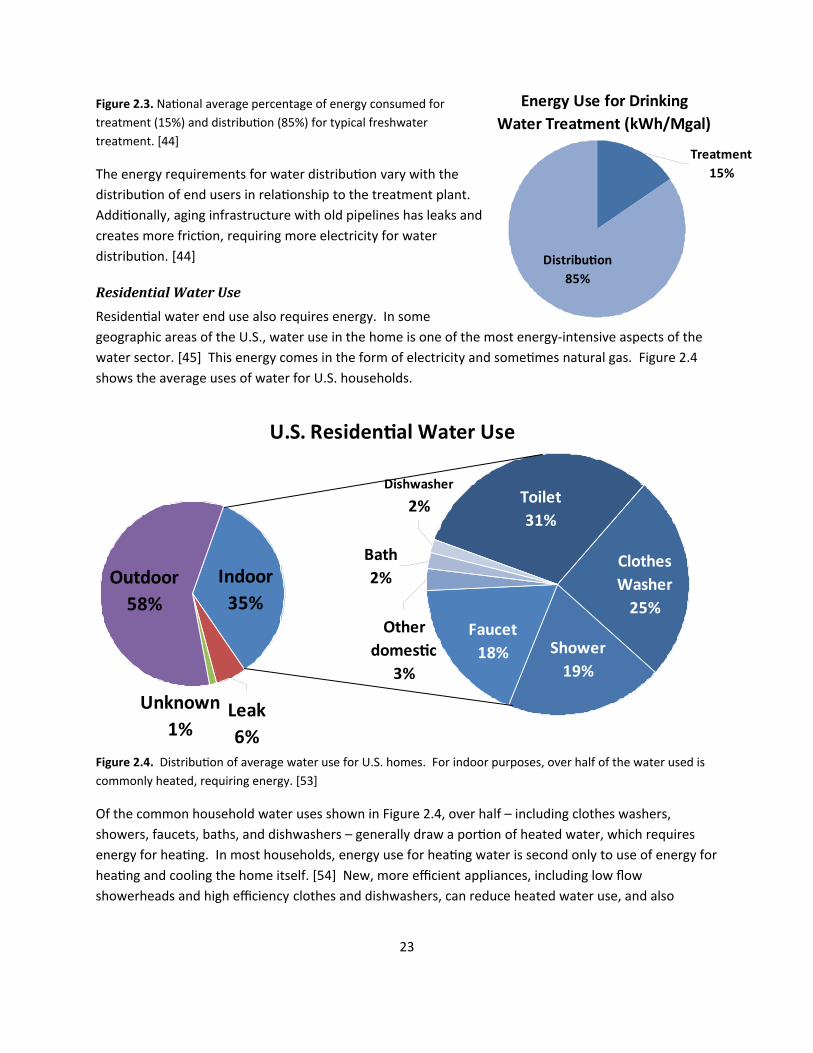
Figure 2.3. National average percentage of energy consumed for treatment (15%) and distribution (85%) for typical freshwater treatment. [44]
The energy requirements for water distribution vary with the distribution of end users in relationship to the treatment plant. Additionally, aging infrastructure with old pipelines has leaks and creates more friction, requiring more electricity for water distribution. [44]
Residential Water Use
Residential water end use also requires energy. In some geographic areas of the U.S., water use in the home is one of the most energy-intensive aspects of the water sector. [45] This energy comes in the form of electricity and sometimes natural gas. Figure 2.4 shows the average uses of water for U.S. households.
Figure 2.4. Distribution of average water use for U.S. homes. For indoor purposes, over half of the water used is commonly heated, requiring energy. [53]
Of the common household water uses shown in Figure 2.4, over half – including clothes washers, showers, faucets, baths, and dishwashers – generally draw a portion of heated water, which requires energy for heating. In most households, energy use for heating water is second only to use of energy for heating and cooling the home itself. [54] New, more efficient appliances, including low flow showerheads and high efficiency clothes and dishwashers, can reduce heated water use, and also
Bath2%
Dishwasher
2%
Clothes Washer
25%
Toilet31%
Shower19%
Faucet18%
Other domestic
3%
Indoor35%
Leak6%
Unknown1%
Outdoor58%
U.S. Residential Water Use
24
thereby reduce energy consumption. If residential consumption of heated water is reduced by a third, then electricity consumption in the state would be reduced by 1 to 3 billion kWh. [55]
After residential use, nearly all of the water used indoors leaves as wastewater, even though much of it is suitable for re‐use for irrigation or other applications. Treating this wastewater also requires energy, as discussed in the following section.
Wastewater Systems Like water systems, wastewater systems must also abide by federal and state environmental regulations. Treating raw sewage to wastewater effluent standards requires electricity for collection and conveyance, treatment, and discharge.
Collection and Conveyance
Municipal wastewater treatment plants utilize gravity for raw sewage collection and conveyance whenever possible, reducing the electricity required for pumps. Though wastewater conveyance may require fewer pumps than water distribution in some areas, wastewater pumps are less efficient due to pumping both solids and liquids. [45]
Treatment
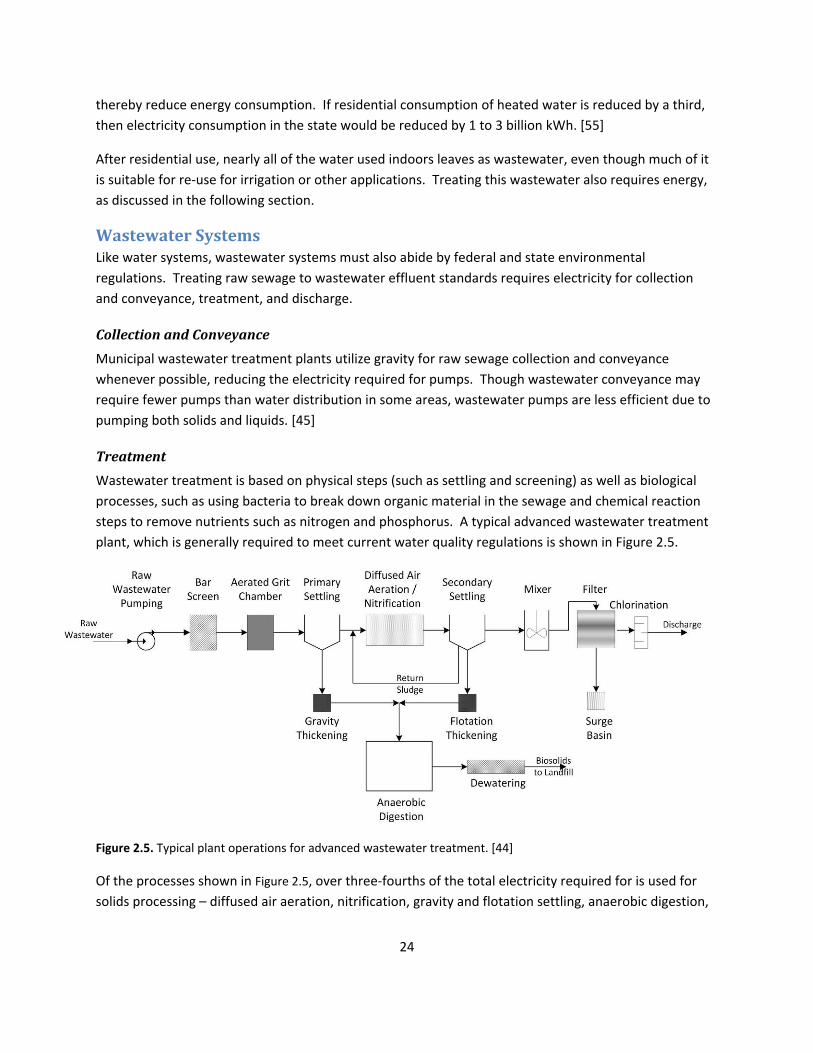
Wastewater treatment is based on physical steps (such as settling and screening) as well as biological processes, such as using bacteria to break down organic material in the sewage and chemical reaction steps to remove nutrients such as nitrogen and phosphorus. A typical advanced wastewater treatment plant, which is generally required to meet current water quality regulations is shown in Figure 2.5.
Figure 2.5. Typical plant operations for advanced wastewater treatment. [44]
Of the processes shown in Figure 2.5, over three‐fourths of the total electricity required for is used for solids processing – diffused air aeration, nitrification, gravity and flotation settling, anaerobic digestion,
25
and dewatering. Over 30% of the electricity required goes toward aeration alone due to the use of energy‐intensive blowers. [44]
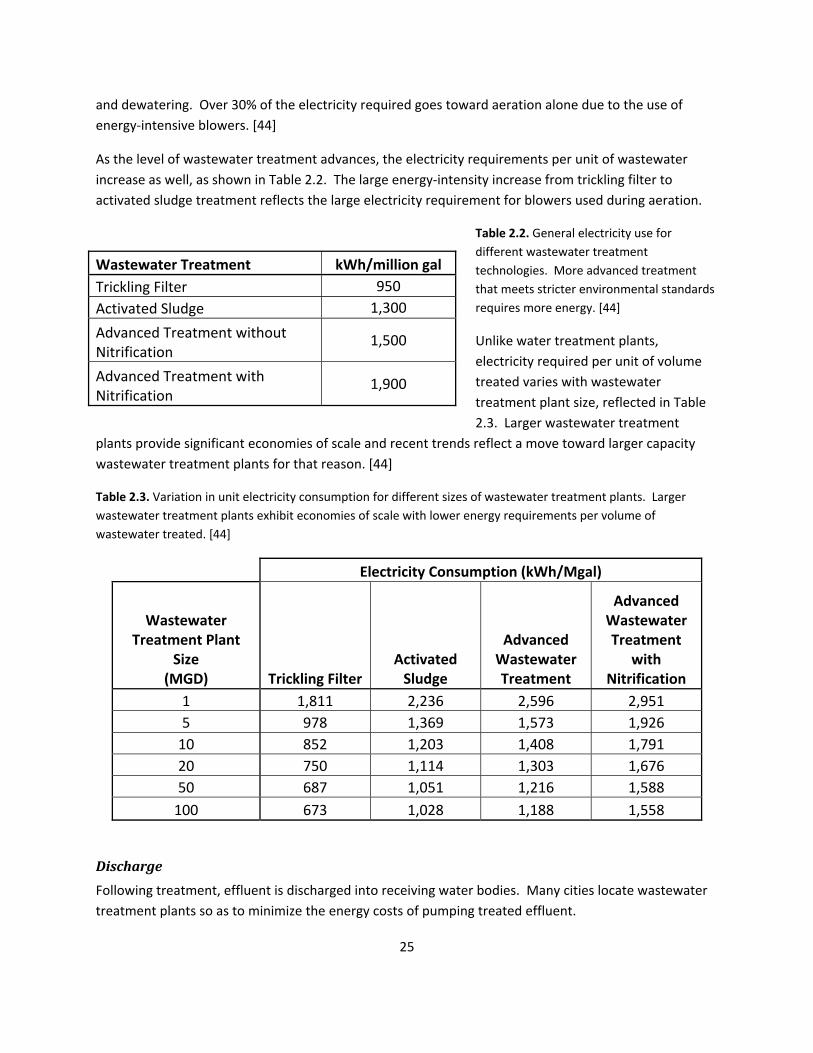
As the level of wastewater treatment advances, the electricity requirements per unit of wastewater increase as well, as shown in Table 2.2. The large energy‐intensity increase from trickling filter to activated sludge treatment reflects the large electricity requirement for blowers used during aeration.
Table 2.2. General electricity use for different wastewater treatment technologies. More advanced treatment that meets stricter environmental standards requires more energy. [44]
Unlike water treatment plants, electricity required per unit of volume treated varies with wastewater treatment plant size, reflected in Table 2.3. Larger wastewater treatment
plants provide significant economies of scale and recent trends reflect a move toward larger capacity wastewater treatment plants for that reason. [44]
Table 2.3. Variation in unit electricity consumption for different sizes of wastewater treatment plants. Larger wastewater treatment plants exhibit economies of scale with lower energy requirements per volume of wastewater treated. [44]
Electricity Consumption (kWh/Mgal)
Wastewater Treatment Plant
Size (MGD) Trickling Filter
Activated Sludge
Advanced Wastewater Treatment
Advanced Wastewater Treatment
with Nitrification
1 1,811 2,236 2,596 2,951 5 978 1,369 1,573 1,926 10 852 1,203 1,408 1,791 20 750 1,114 1,303 1,676 50 687 1,051 1,216 1,588 100 673 1,028 1,188 1,558
Discharge
Following treatment, effluent is discharged into receiving water bodies. Many cities locate wastewater treatment plants so as to minimize the energy costs of pumping treated effluent.
Wastewater Treatment kWh/million gal Trickling Filter 950 Activated Sludge 1,300
Advanced Treatment without Nitrification
1,500
Advanced Treatment with Nitrification
1,900
26
Chapter 3. EnergyWater Nexus in Texas As a highly‐populated, industry‐intensive state, Texas requires significant amounts of both energy and water. This chapter examines current resource use and energy‐water nexus issues. Future Texas trends are discussed in Chapter 4.
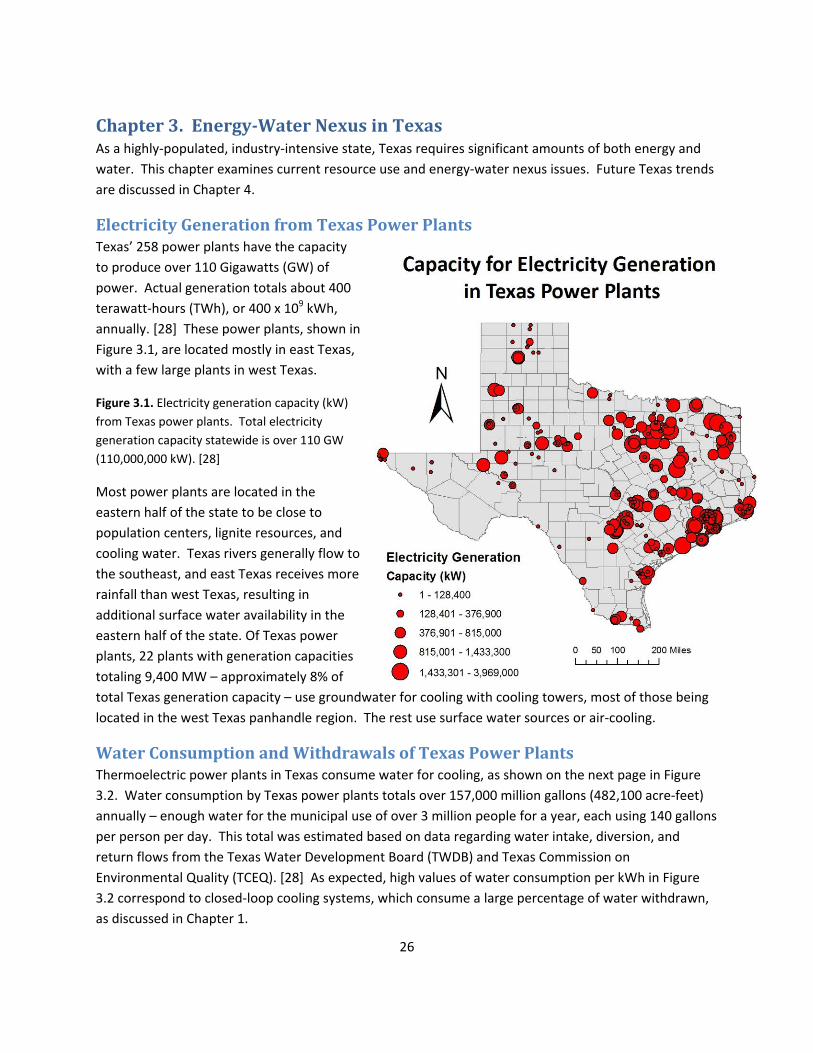
Electricity Generation from Texas Power Plants Texas’ 258 power plants have the capacity to produce over 110 Gigawatts (GW) of power. Actual generation totals about 400 terawatt‐hours (TWh), or 400 x 109 kWh, annually. [28] These power plants, shown in Figure 3.1, are located mostly in east Texas, with a few large plants in west Texas.
Figure 3.1. Electricity generation capacity (kW) from Texas power plants. Total electricity generation capacity statewide is over 110 GW (110,000,000 kW). [28]
Most power plants are located in the eastern half of the state to be close to population centers, lignite resources, and cooling water. Texas rivers generally flow to the southeast, and east Texas receives more rainfall than west Texas, resulting in additional surface water availability in the eastern half of the state. Of Texas power plants, 22 plants with generation capacities totaling 9,400 MW – approximately 8% of total Texas generation capacity – use groundwater for cooling with cooling towers, most of those being located in the west Texas panhandle region. The rest use surface water sources or air‐cooling.
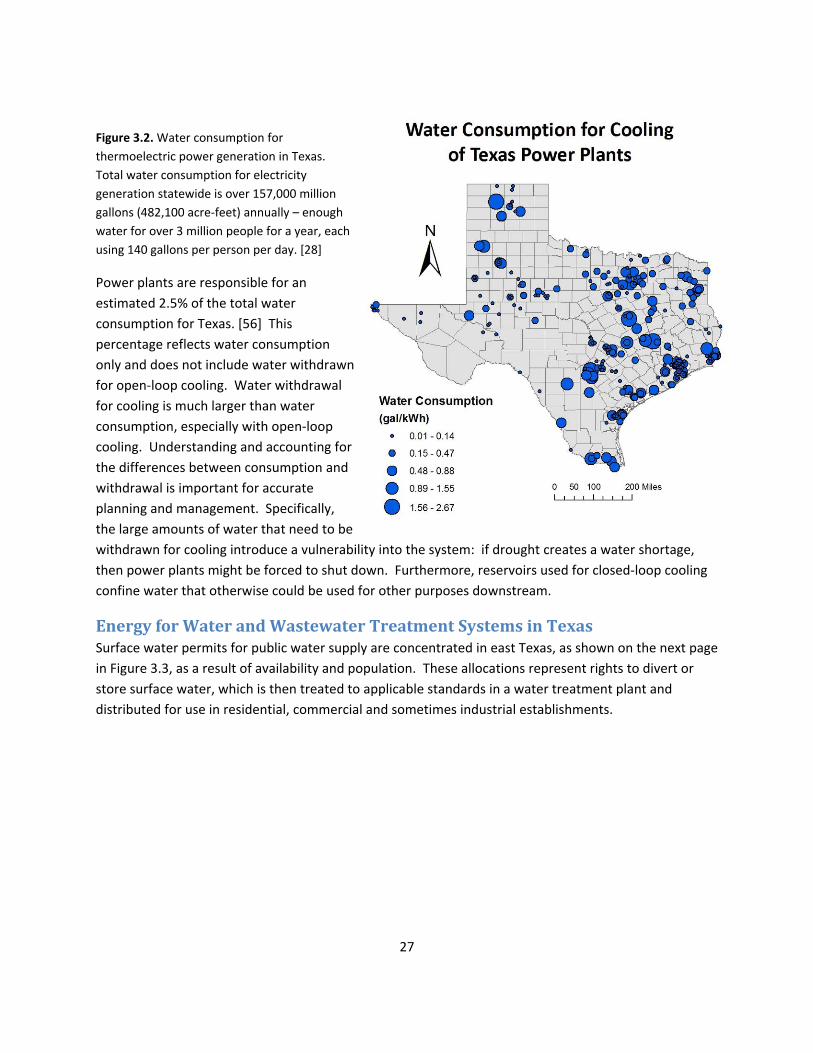
Water Consumption and Withdrawals of Texas Power Plants Thermoelectric power plants in Texas consume water for cooling, as shown on the next page in Figure 3.2. Water consumption by Texas power plants totals over 157,000 million gallons (482,100 acre‐feet) annually – enough water for the municipal use of over 3 million people for a year, each using 140 gallons per person per day. This total was estimated based on data regarding water intake, diversion, and return flows from the Texas Water Development Board (TWDB) and Texas Commission on Environmental Quality (TCEQ). [28] As expected, high values of water consumption per kWh in Figure 3.2 correspond to closed‐loop cooling systems, which consume a large percentage of water withdrawn, as discussed in Chapter 1.
27
Figure 3.2. Water consumption for thermoelectric power generation in Texas. Total water consumption for electricity generation statewide is over 157,000 million gallons (482,100 acre‐feet) annually – enough water for over 3 million people for a year, each using 140 gallons per person per day. [28]
Power plants are responsible for an estimated 2.5% of the total water consumption for Texas. [56] This percentage reflects water consumption only and does not include water withdrawn for open‐loop cooling. Water withdrawal for cooling is much larger than water consumption, especially with open‐loop cooling. Understanding and accounting for the differences between consumption and withdrawal is important for accurate planning and management. Specifically, the large amounts of water that need to be withdrawn for cooling introduce a vulnerability into the system: if drought creates a water shortage, then power plants might be forced to shut down. Furthermore, reservoirs used for closed‐loop cooling confine water that otherwise could be used for other purposes downstream.
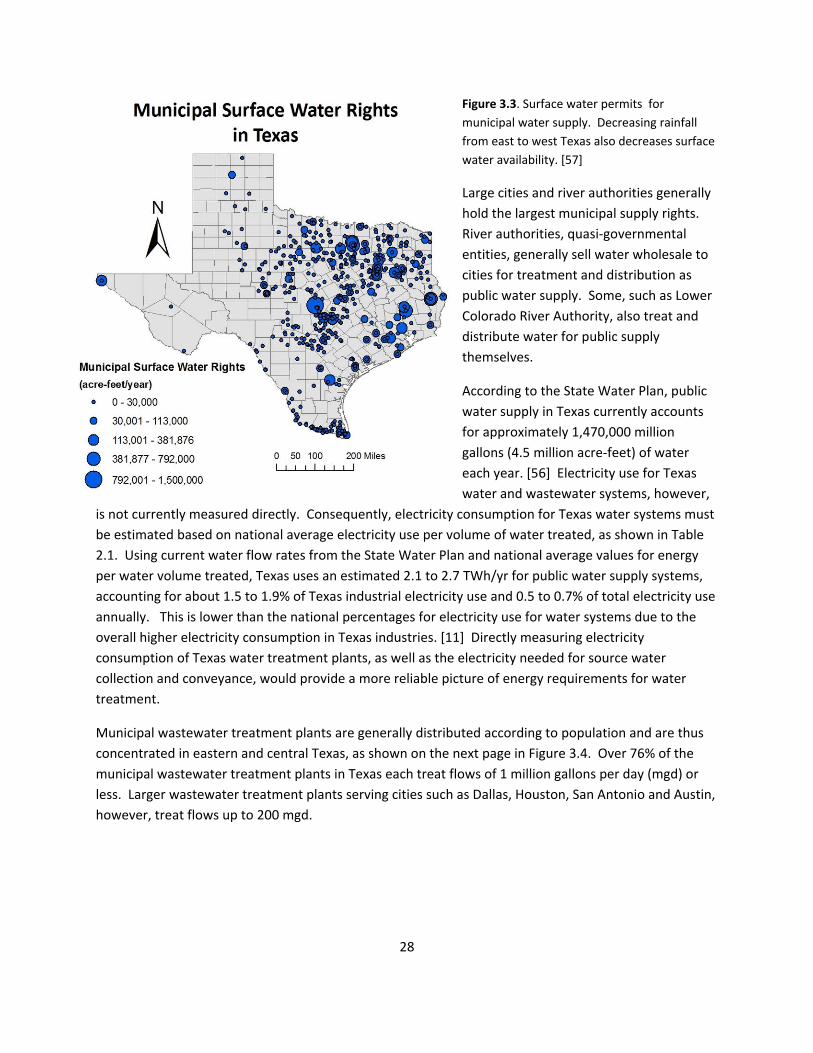
Energy for Water and Wastewater Treatment Systems in Texas Surface water permits for public water supply are concentrated in east Texas, as shown on the next page in Figure 3.3, as a result of availability and population. These allocations represent rights to divert or store surface water, which is then treated to applicable standards in a water treatment plant and distributed for use in residential, commercial and sometimes industrial establishments.
28
Figure 3.3. Surface water permits for municipal water supply. Decreasing rainfall from east to west Texas also decreases surface water availability. [57]
Large cities and river authorities generally hold the largest municipal supply rights. River authorities, quasi‐governmental entities, generally sell water wholesale to cities for treatment and distribution as public water supply. Some, such as Lower Colorado River Authority, also treat and distribute water for public supply themselves.
According to the State Water Plan, public water supply in Texas currently accounts for approximately 1,470,000 million gallons (4.5 million acre‐feet) of water each year. [56] Electricity use for Texas water and wastewater systems, however,
is not currently measured directly. Consequently, electricity consumption for Texas water systems must be estimated based on national average electricity use per volume of water treated, as shown in Table 2.1. Using current water flow rates from the State Water Plan and national average values for energy per water volume treated, Texas uses an estimated 2.1 to 2.7 TWh/yr for public water supply systems, accounting for about 1.5 to 1.9% of Texas industrial electricity use and 0.5 to 0.7% of total electricity use annually. This is lower than the national percentages for electricity use for water systems due to the overall higher electricity consumption in Texas industries. [11] Directly measuring electricity consumption of Texas water treatment plants, as well as the electricity needed for source water collection and conveyance, would provide a more reliable picture of energy requirements for water treatment.
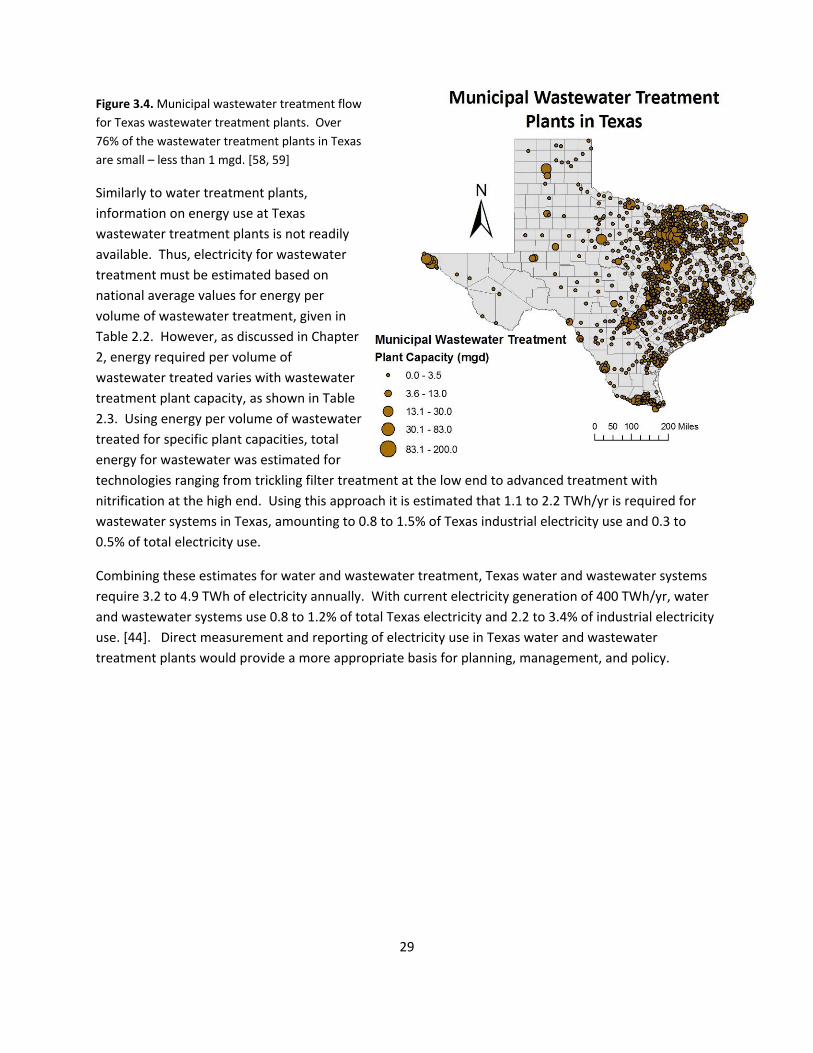
Municipal wastewater treatment plants are generally distributed according to population and are thus concentrated in eastern and central Texas, as shown on the next page in Figure 3.4. Over 76% of the municipal wastewater treatment plants in Texas each treat flows of 1 million gallons per day (mgd) or less. Larger wastewater treatment plants serving cities such as Dallas, Houston, San Antonio and Austin, however, treat flows up to 200 mgd.
29
Figure 3.4. Municipal wastewater treatment flow for Texas wastewater treatment plants. Over 76% of the wastewater treatment plants in Texas are small – less than 1 mgd. [58, 59]
Similarly to water treatment plants, information on energy use at Texas wastewater treatment plants is not readily available. Thus, electricity for wastewater treatment must be estimated based on national average values for energy per volume of wastewater treatment, given in Table 2.2. However, as discussed in Chapter 2, energy required per volume of wastewater treated varies with wastewater treatment plant capacity, as shown in Table 2.3. Using energy per volume of wastewater treated for specific plant capacities, total energy for wastewater was estimated for technologies ranging from trickling filter treatment at the low end to advanced treatment with nitrification at the high end. Using this approach it is estimated that 1.1 to 2.2 TWh/yr is required for wastewater systems in Texas, amounting to 0.8 to 1.5% of Texas industrial electricity use and 0.3 to 0.5% of total electricity use.
Combining these estimates for water and wastewater treatment, Texas water and wastewater systems require 3.2 to 4.9 TWh of electricity annually. With current electricity generation of 400 TWh/yr, water and wastewater systems use 0.8 to 1.2% of total Texas electricity and 2.2 to 3.4% of industrial electricity use. [44]. Direct measurement and reporting of electricity use in Texas water and wastewater treatment plants would provide a more appropriate basis for planning, management, and policy.
30
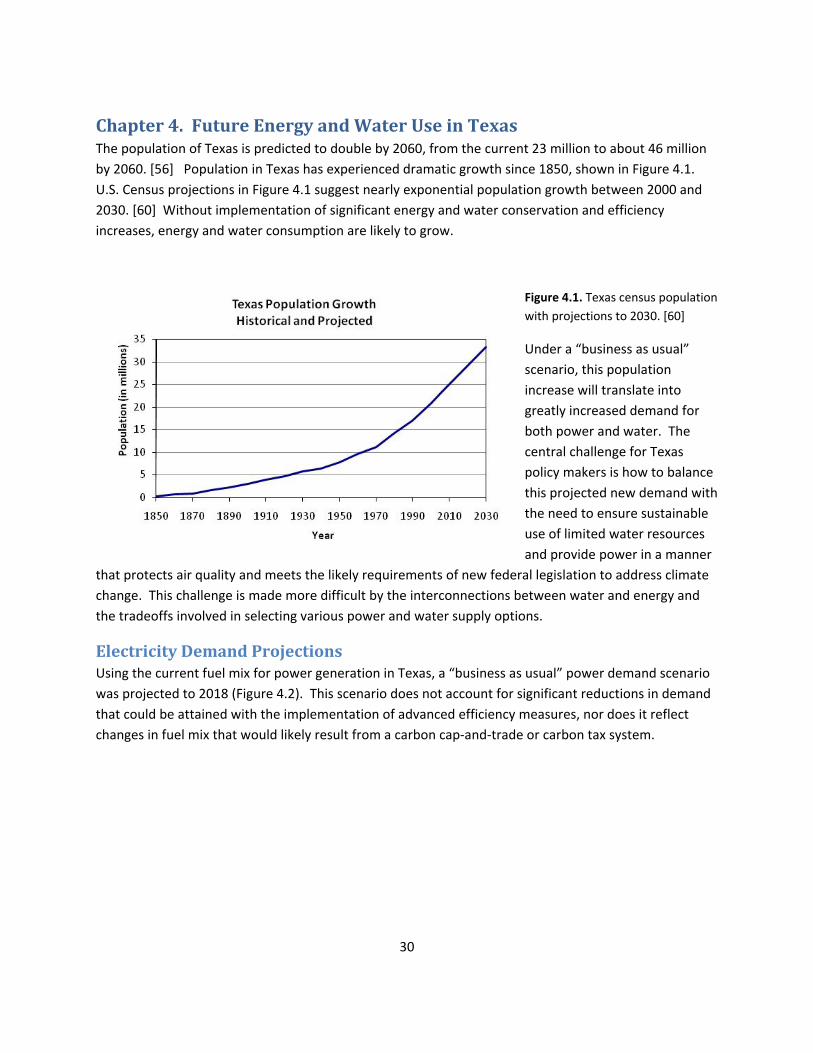
Chapter 4. Future Energy and Water Use in Texas The population of Texas is predicted to double by 2060, from the current 23 million to about 46 million by 2060. [56] Population in Texas has experienced dramatic growth since 1850, shown in Figure 4.1. U.S. Census projections in Figure 4.1 suggest nearly exponential population growth between 2000 and 2030. [60] Without implementation of significant energy and water conservation and efficiency increases, energy and water consumption are likely to grow.
Figure 4.1. Texas census population with projections to 2030. [60]
Under a “business as usual” scenario, this population increase will translate into greatly increased demand for both power and water. The central challenge for Texas policy makers is how to balance this projected new demand with the need to ensure sustainable use of limited water resources and provide power in a manner
that protects air quality and meets the likely requirements of new federal legislation to address climate change. This challenge is made more difficult by the interconnections between water and energy and the tradeoffs involved in selecting various power and water supply options.
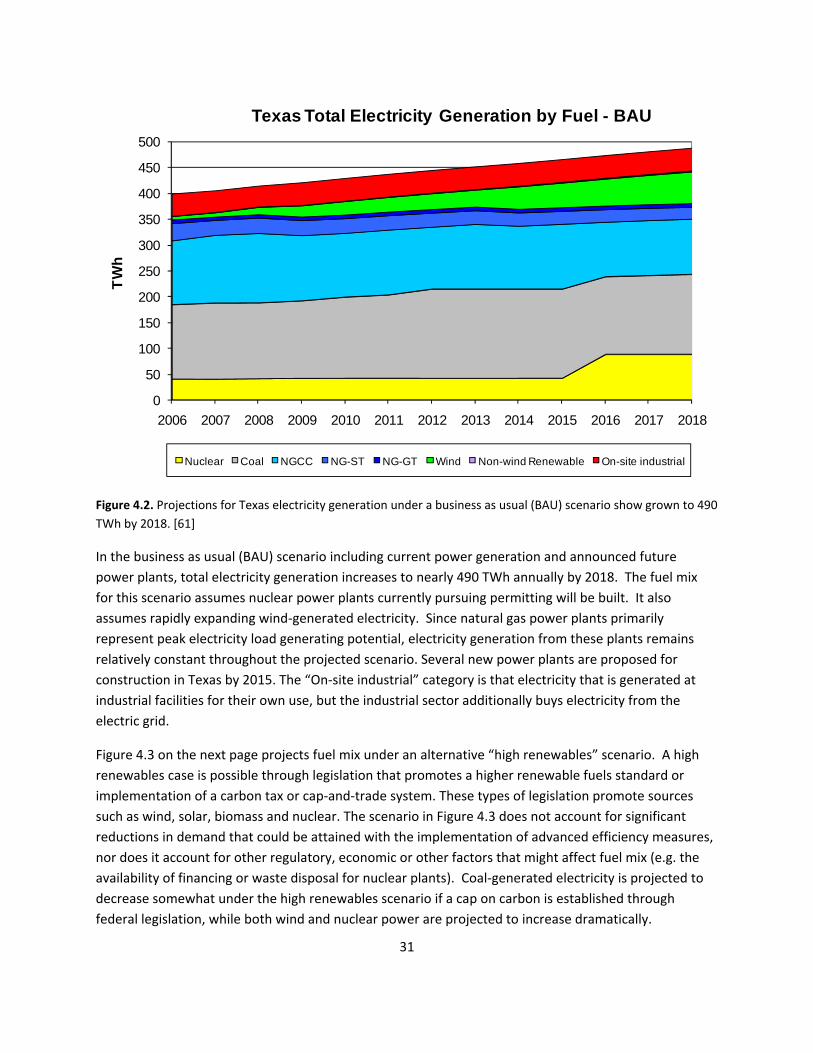
Electricity Demand Projections Using the current fuel mix for power generation in Texas, a “business as usual” power demand scenario was projected to 2018 (Figure 4.2). This scenario does not account for significant reductions in demand that could be attained with the implementation of advanced efficiency measures, nor does it reflect changes in fuel mix that would likely result from a carbon cap‐and‐trade or carbon tax system.
31
0
50
100
150
200
250
300
350
400
450
500
2006 2007 2008 2009 2010 2011 2012 2013 2014 2015 2016 2017 2018
TWh
Texas Total Electricity Generation by Fuel - BAU
Nuclear Coal NGCC NG-ST NG-GT Wind Non-wind Renewable On-site industrial
Figure 4.2. Projections for Texas electricity generation under a business as usual (BAU) scenario show grown to 490 TWh by 2018. [61]
In the business as usual (BAU) scenario including current power generation and announced future power plants, total electricity generation increases to nearly 490 TWh annually by 2018. The fuel mix for this scenario assumes nuclear power plants currently pursuing permitting will be built. It also assumes rapidly expanding wind‐generated electricity. Since natural gas power plants primarily represent peak electricity load generating potential, electricity generation from these plants remains relatively constant throughout the projected scenario. Several new power plants are proposed for construction in Texas by 2015. The “On‐site industrial” category is that electricity that is generated at industrial facilities for their own use, but the industrial sector additionally buys electricity from the electric grid.
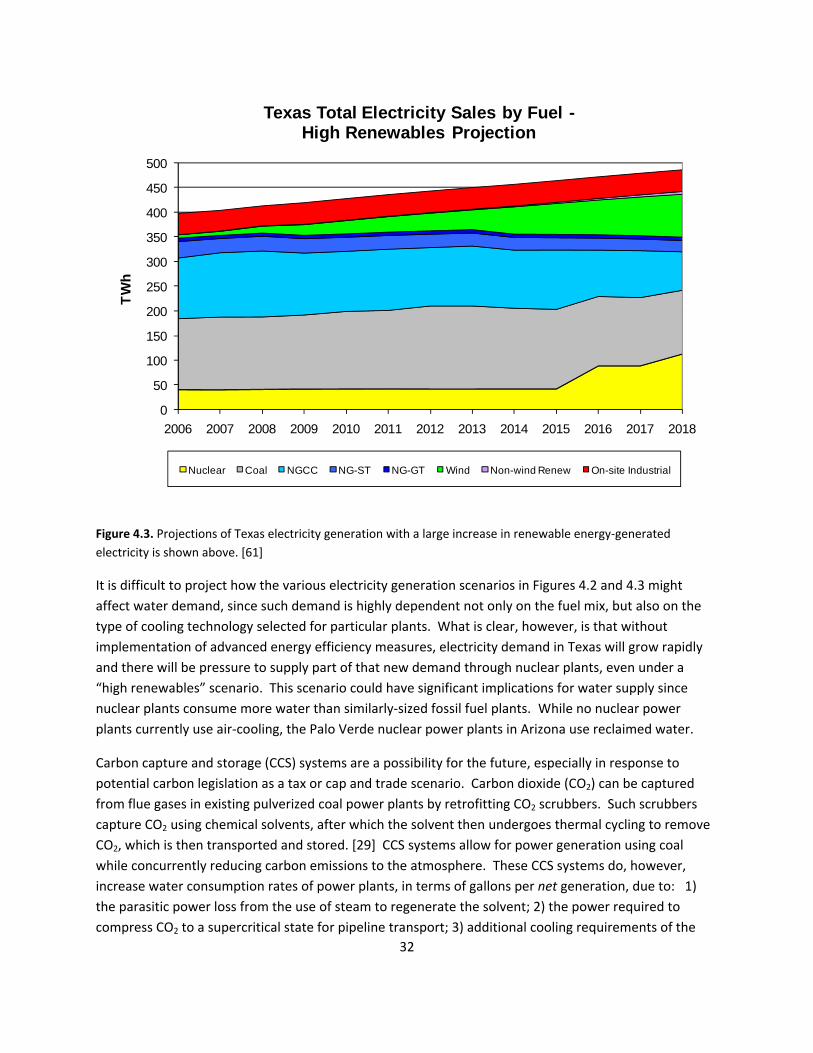
Figure 4.3 on the next page projects fuel mix under an alternative “high renewables” scenario. A high renewables case is possible through legislation that promotes a higher renewable fuels standard or implementation of a carbon tax or cap‐and‐trade system. These types of legislation promote sources such as wind, solar, biomass and nuclear. The scenario in Figure 4.3 does not account for significant reductions in demand that could be attained with the implementation of advanced efficiency measures, nor does it account for other regulatory, economic or other factors that might affect fuel mix (e.g. the availability of financing or waste disposal for nuclear plants). Coal‐generated electricity is projected to decrease somewhat under the high renewables scenario if a cap on carbon is established through federal legislation, while both wind and nuclear power are projected to increase dramatically.
32
0
50
100
150
200
250
300
350
400
450
500
2006 2007 2008 2009 2010 2011 2012 2013 2014 2015 2016 2017 2018
TWh
Texas Total Electricity Sales by Fuel -High Renewables Projection
Nuclear Coal NGCC NG-ST NG-GT Wind Non-wind Renew On-site Industrial
Figure 4.3. Projections of Texas electricity generation with a large increase in renewable energy‐generated electricity is shown above. [61]
It is difficult to project how the various electricity generation scenarios in Figures 4.2 and 4.3 might affect water demand, since such demand is highly dependent not only on the fuel mix, but also on the type of cooling technology selected for particular plants. What is clear, however, is that without implementation of advanced energy efficiency measures, electricity demand in Texas will grow rapidly and there will be pressure to supply part of that new demand through nuclear plants, even under a “high renewables” scenario. This scenario could have significant implications for water supply since nuclear plants consume more water than similarly‐sized fossil fuel plants. While no nuclear power plants currently use air‐cooling, the Palo Verde nuclear power plants in Arizona use reclaimed water.
Carbon capture and storage (CCS) systems are a possibility for the future, especially in response to potential carbon legislation as a tax or cap and trade scenario. Carbon dioxide (CO2) can be captured from flue gases in existing pulverized coal power plants by retrofitting CO2 scrubbers. Such scrubbers capture CO2 using chemical solvents, after which the solvent then undergoes thermal cycling to remove CO2, which is then transported and stored. [29] CCS systems allow for power generation using coal while concurrently reducing carbon emissions to the atmosphere. These CCS systems do, however, increase water consumption rates of power plants, in terms of gallons per net generation, due to: 1) the parasitic power loss from the use of steam to regenerate the solvent; 2) the power required to compress CO2 to a supercritical state for pipeline transport; 3) additional cooling requirements of the
33
carbon stripping process; and 4) additional electricity for pumping collected CO2 into storage. [28] These tradeoffs between air quality and water consumption may play an increasingly important role in the future.
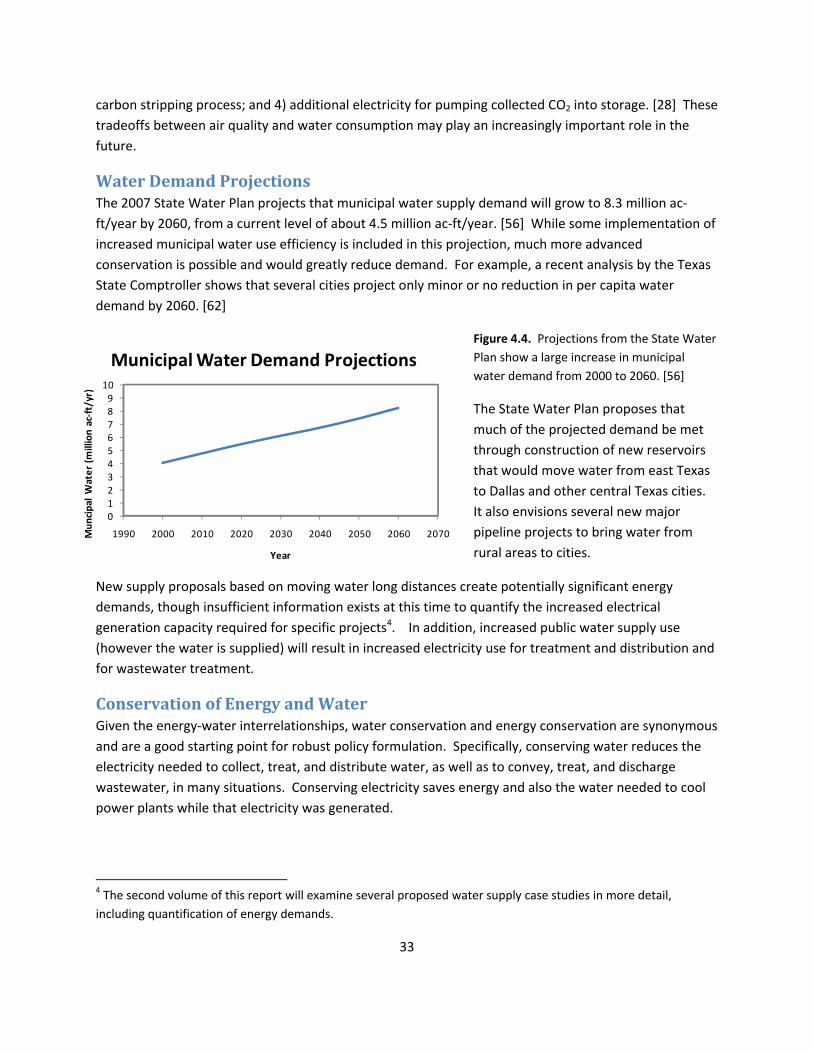
Water Demand Projections The 2007 State Water Plan projects that municipal water supply demand will grow to 8.3 million ac‐ft/year by 2060, from a current level of about 4.5 million ac‐ft/year. [56] While some implementation of increased municipal water use efficiency is included in this projection, much more advanced conservation is possible and would greatly reduce demand. For example, a recent analysis by the Texas State Comptroller shows that several cities project only minor or no reduction in per capita water demand by 2060. [62]
Figure 4.4. Projections from the State Water Plan show a large increase in municipal water demand from 2000 to 2060. [56]
The State Water Plan proposes that much of the projected demand be met through construction of new reservoirs that would move water from east Texas to Dallas and other central Texas cities. It also envisions several new major pipeline projects to bring water from rural areas to cities.
New supply proposals based on moving water long distances create potentially significant energy demands, though insufficient information exists at this time to quantify the increased electrical generation capacity required for specific projects4. In addition, increased public water supply use (however the water is supplied) will result in increased electricity use for treatment and distribution and for wastewater treatment.
Conservation of Energy and Water Given the energy‐water interrelationships, water conservation and energy conservation are synonymous and are a good starting point for robust policy formulation. Specifically, conserving water reduces the electricity needed to collect, treat, and distribute water, as well as to convey, treat, and discharge wastewater, in many situations. Conserving electricity saves energy and also the water needed to cool power plants while that electricity was generated.
4 The second volume of this report will examine several proposed water supply case studies in more detail, including quantification of energy demands.
012345678910
1990 2000 2010 2020 2030 2040 2050 2060 2070Mun
cipal Water (m
illion ac‐ft/yr)
Year
Municipal Water Demand Projections
34
The second volume of this report will have more detailed analysis on the mutual benefits of water and energy conservation, however some preliminary results are shared here. Because electricity consumption is linear with the amount of water and wastewater that are treated, distributed and collected, it can be seen that reducing water flows through these energy‐intensive steps reduces the amount of electricity that is required. If municipal water use and wastewater flows are reduced by 10%, the state’s demand for electricity would go down by 320 to 490 million kWh at the water/wastewater sectors alone. In addition, if the residential sector reduces its use of heated water by a third, then that would save approximately 1 to 3 billion kWh of electricity annually. [55] Reducing energy demand also reduces demand for cooling water at power plants: reducing overall electricity generation in Texas by 10% could reduce water consumption by as much as 15,000 million gallons of water per year, depending on which power plants reduce their output to accommodate the lower demand.
In addition to increased water efficiency, water reuse is an option for saving water and energy. Some water uses, such as landscape irrigation and toilet flushing, do not require water to be treated to drinking water standards. One alternative to watering lawns and flushing toilets with drinking water is using reclaimed water. Reclaimed water is effluent from a wastewater treatment plant, treated with a process like that shown in Figure 2.5 with additional tertiary filtration before reuse. Though reclaimed water is not necessarily safe for drinking, additional filtration removes contaminants that pose threats to human health during unintended exposure. [63] While this additional wastewater treatment requires approximately 120 kWh per million gallons for tertiary filtration, use of reclaimed water saves approximately 1,400 to 1,800 kWh of electricity per million gallons needed for collecting, treating, disinfecting, and distributing drinking water for non‐potables uses. [44]
In addition to saving energy, water reuse can augment existing water supplies and is generally a more cost‐effective option than acquiring new water supplies. [64] Varying levels of additional treatment are necessary, depending on the water reuse application.
Reclaimed water can also be used to artificially recharge groundwater aquifers through surface spreading and direct injection. Surface spreading – applying reclaimed water to the land surface to promote water seepage and percolation into the aquifer – requires little to no additional treatment or energy due to the natural filtration of soil. Direct injection – using wells to introduce reclaimed water into the aquifer water table – however, requires additional treatment beyond advanced wastewater treatment, usually energy‐intensive membrane water treatment to remove potential pathogens. [63]
Reclaimed water can also be reused to supplement public drinking water supply. Following advanced wastewater treatment, reclaimed water is treated using membranes or other advanced technology to remove pathogens and trace contaminants and is then added to an existing surface water source, such as a reservoir, or fed directly to a water treatment plant. Though this type of water reuse has sometimes ignited adverse public perception regarding quality – the “toilet‐to‐tap” idea – reclaimed water has a higher quality after membrane treatment than many raw water sources. [63] In fact, drinking water sources for over 26 million people in the United States contain between 5 and 100% treated wastewater effluent from upstream discharge during low flow periods. [64] Some water‐

35
strained societies such as Singapore also use reclaimed water as a public supply without adverse health effects.
Water reuse conserves water and, in some applications, conserves energy by not treating water for non‐potable uses to drinking water standards. In other applications, additional energy‐intensive treatment, such as membrane filtration, is necessary to protect human health during water reuse, requiring up to 4,000 kWh per million gallons. [45] Yet this energy investment for water reuse is still less than the energy needed for seawater desalination at 9,700 to 16,500 kWh per million gallons or long‐haul water transfer when water supplies are depleted, over 6,100 kWh per million gallons for the Colorado River Aqueduct transfer system in California. [45]
36
Chapter 5. Policy Discussion As Texas confronts the challenges posed by climate change, decisions about how to supply energy and water to our state’s growing population should no longer be made in isolation from each other. The challenges would benefit from recognizing the deep inter‐connections and trade‐offs involved in deciding how to meet power and water needs in a more resource‐constrained 21st century.
Carbon, Water, and Energy: Tensions and Policy Tradeoffs Because energy and water are inextricably linked, limits or increasing demands on one resource can affect the other. Furthermore, because of the power sector’s carbon emissions, increasing the energy efficiency of electric power generation both lowers these emissions and reduces water consumption. Since carbon emissions in part drive climate change, which impacts the hydrological cycle, it is another linkage between energy and water. Implementation of next generation power plant technologies such as ultra‐supercritical coal and integrated gasification combined‐cycle plants (as well as combined‐cycle natural gas technology) has the potential to increase energy efficiencies by 25 to 50% over those for traditional pulverized coal plants with pollution controls. Subsequently, the carbon emissions and water use per MWh of generated electricity would go down.
Increased efficiency in water usage also can play a role in reducing carbon emissions. Providing water for domestic, agricultural and industrial consumption requires energy, which emits carbon. Traditionally lowering water usage simultaneously lowers energy consumption, which lowers carbon emissions (though such reductions have always been overwhelmed by overall growth in the usage of both water and energy). For example over the last 50 years the water efficiency of power production has steadily increased while at the same time both electric power production and the water used for power production has steadily increased.
Despite the synergies of conservation, we are entering an era in which public policies designed to reduce water use for energy may lead to increases in carbon emissions. Conversely, policies to reduce carbon emissions might increase water use. And, energy policies, such as promotion of alternative biofuels for transportation have competing effects on water use.
Moving forward, these interrelationships must be identified and understood before implementing public policy proscriptions that benefit one component of this complicated carbon‐water‐energy relationship while accidentally undermining another. (Issues related to the linkages between transportation fuels and water will be discussed in a forthcoming report.)
Energy Policies Have Mixed Water Impacts
Analysis of current long‐term priorities in U.S. energy policy suggests a mixed outlook for future impacts of the energy sector on water resources. The Energy Policy Act of 2005 (EPACT 2005) and the Energy Independence and Security Act of 2007 (EISA 2007) both prioritized development of domestic sources of energy, including renewable power, nuclear power, and unconventional transportation fuels.
37
Because the electric power sector is responsible for the largest withdrawals of water in the U.S., changes to the power sector can have a significant impact on the availability of water resources. Specifically, increasing the market penetration of renewable technologies such as solar photovoltaics (PV) and wind turbines will lower the use of water by the power sector because those technologies do not require cooling. Concentrated solar power (CSP) systems are more compatible for large‐scale, centralized power generation than solar PV systems and they currently are considerably lower in cost per unit of electric power. The thermal conversion of radiant energy first to steam and then to electricity via a steam turbine, however, can require cooling water at rates (gallons per kWh) higher than coal and nuclear power plants if using pure wet cooling towers. However, air‐ and hybrid cooling systems for CSP could be implemented in Texas.
The positive water effects of renewable power might also possibly be offset by projected increases in nuclear power installations driven by carbon limits. Nuclear power is the most water‐intensive form of conventional power generation, and air‐cooling is very unlikely to ever be used for nuclear power plants. Furthermore, the economic environment that is conducive to renewable sources, namely high prices for carbon emissions and natural gas, is also good for nuclear power. Thus, it is possible that these forms of power will grow in tandem. Consequently, the net effect on water resources from future changes in the electric power sector due to carbon control policies are difficult to predict.
Water Policies Might Have Detrimental Carbon Impacts
Although the impact of long‐term energy policies on water consumption is not clear, some water policies under consideration may have detrimental impacts on carbon emissions. These policies include: 1) a push for new water supply from distant, low‐quality sources, and 2) stricter treatment standards for water and wastewater.
Some communities may turn to desalination to meet new water demand. Desalination of seawater is a drought‐resistant water supply, however with current technologies this stability comes with a large energy cost. In Texas desalination of brackish water is already underway or is being implemented as a portion of the public water supplies for the cities of San Antonio, El Paso, and Lubbock.
Finally, more stringent treatment standards for drinking water quality and wastewater may become added to federal regulations, in particular to remediate the presence of pharmaceuticals and other contaminants for which there are no current standards. Water treatment to remove low concentration pollutants is typically an energy‐intensive process. Thus, raising the treatment standards leads to increased energy consumption by water and wastewater treatment plants, which nominally yields increased carbon emissions.
Carbon Policies Might Have Detrimental Water Impacts
There is a general consensus among electric power companies that implementation of a national cap‐and‐trade program or a carbon tax is inevitable in the U.S. in the near future. Although some outcomes from implementation of new carbon policies will reduce water usage (such as greater penetration of wind power, and deployment of photo‐voltaic generation) at least for the first few decades it is possible
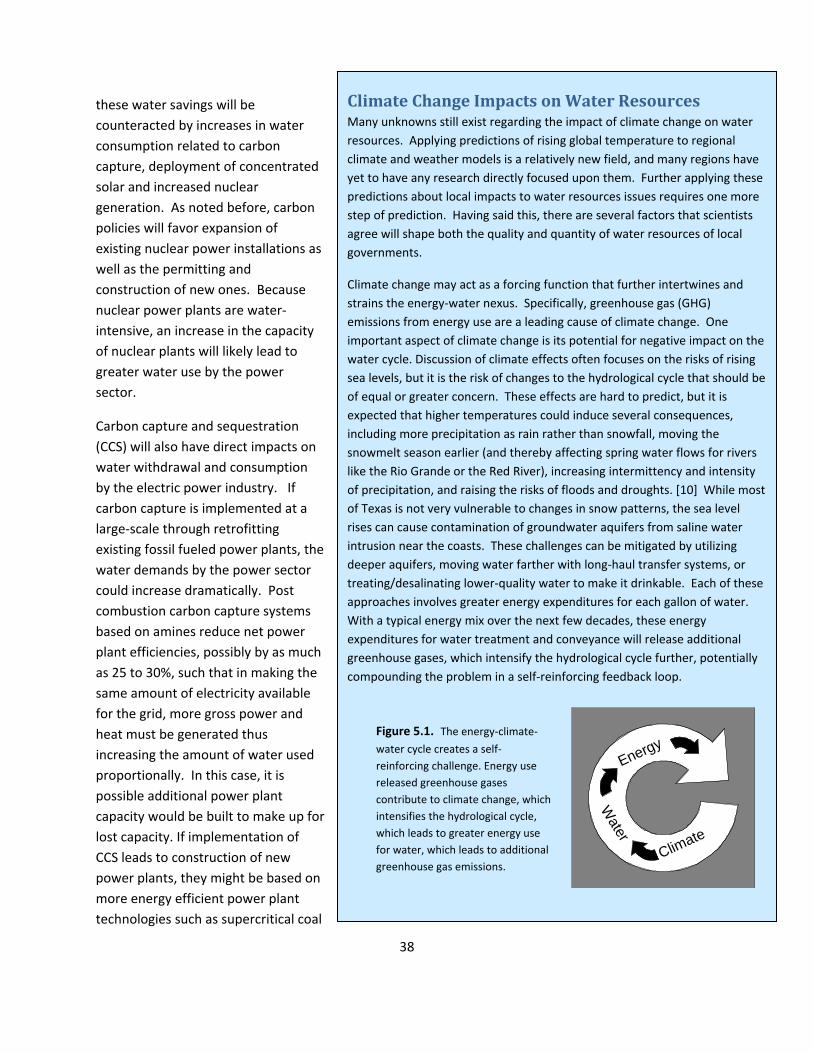
38
these water savings will be counteracted by increases in water consumption related to carbon capture, deployment of concentrated solar and increased nuclear generation. As noted before, carbon policies will favor expansion of existing nuclear power installations as well as the permitting and construction of new ones. Because nuclear power plants are water‐intensive, an increase in the capacity of nuclear plants will likely lead to greater water use by the power sector.
Carbon capture and sequestration (CCS) will also have direct impacts on water withdrawal and consumption by the electric power industry. If carbon capture is implemented at a large‐scale through retrofitting existing fossil fueled power plants, the water demands by the power sector could increase dramatically. Post combustion carbon capture systems based on amines reduce net power plant efficiencies, possibly by as much as 25 to 30%, such that in making the same amount of electricity available for the grid, more gross power and heat must be generated thus increasing the amount of water used proportionally. In this case, it is possible additional power plant capacity would be built to make up for lost capacity. If implementation of CCS leads to construction of new power plants, they might be based on more energy efficient power plant technologies such as supercritical coal
Climate Change Impacts on Water Resources Many unknowns still exist regarding the impact of climate change on water resources. Applying predictions of rising global temperature to regional climate and weather models is a relatively new field, and many regions have yet to have any research directly focused upon them. Further applying these predictions about local impacts to water resources issues requires one more step of prediction. Having said this, there are several factors that scientists agree will shape both the quality and quantity of water resources of local governments.
Climate change may act as a forcing function that further intertwines and strains the energy‐water nexus. Specifically, greenhouse gas (GHG) emissions from energy use are a leading cause of climate change. One important aspect of climate change is its potential for negative impact on the water cycle. Discussion of climate effects often focuses on the risks of rising sea levels, but it is the risk of changes to the hydrological cycle that should be of equal or greater concern. These effects are hard to predict, but it is expected that higher temperatures could induce several consequences, including more precipitation as rain rather than snowfall, moving the snowmelt season earlier (and thereby affecting spring water flows for rivers like the Rio Grande or the Red River), increasing intermittency and intensity of precipitation, and raising the risks of floods and droughts. [10] While most of Texas is not very vulnerable to changes in snow patterns, the sea level rises can cause contamination of groundwater aquifers from saline water intrusion near the coasts. These challenges can be mitigated by utilizing deeper aquifers, moving water farther with long‐haul transfer systems, or treating/desalinating lower‐quality water to make it drinkable. Each of these approaches involves greater energy expenditures for each gallon of water. With a typical energy mix over the next few decades, these energy expenditures for water treatment and conveyance will release additional greenhouse gases, which intensify the hydrological cycle further, potentially compounding the problem in a self‐reinforcing feedback loop.
Figure 5.1. The energy‐climate‐
water cycle creates a self‐reinforcing challenge. Energy use released greenhouse gases contribute to climate change, which intensifies the hydrological cycle, which leads to greater energy use for water, which leads to additional greenhouse gas emissions.
Water
Energy
Climate

39
and integrated gasification combined cycle (IGCC) plants all of which require less water than a typical pulverized coal power plant. For IGCC plants based on GE Radiant‐Convective (452 gallons per MWh), GE‐Quench (510 gallons per MWh), Conoco‐Phillips (433 gallons per MWh) or Shell (443 gallons per MWh) gasifiers, the water use is substantially less per unit of produced electricity than that of a typical pulverized coal power plant. [65]
An additional 10 to 20% more water is required for adding carbon capture to these IGCC reference plants, which is small relative to that for pulverized coal plants. [66] As a result an IGCC plant with carbon capture has a water usage one third less than a traditional pulverized coal plant without capture. [27]
If climate change driven public policy results in new‐build power plants being a mix of new power plant designs such as IGCC that have both higher water and energy efficiencies, even with carbon capture then clearly the effect on water resources will be positive.
40
Conclusions As long as thermoelectric power plants use water cooling technologies and water and wastewater treatment plants use electricity for processes, it will be important to consider the energy‐water nexus in planning and resource management. With population growth, the effects of climate change already impacting the hydrological cycle, and new carbon‐pricing policies under consideration, understanding the tradeoffs between energy and water becomes even more vital than ever for resource planning and management.
In preparing the report, however, it became clear that substantially more site‐specific data are necessary for a full understanding of the nature of the energy‐water nexus in Texas. Thus, we recommend that the state increase efforts to collect accurate data on the withdrawal and consumption of cooling and process water at power plants, as well as data on electricity consumption for public water supply and wastewater treatment plants and distribution systems. These data will also be useful in planning for the future.
In the future, water use for electricity generation will depend on several factors, including the fuel mix for new generating capacity, the type of power plant and the type of power plant cooling systems that are deployed. Likewise, the amount of electricity used to pump, treat and deliver public water supply and to treat wastewater will depend on choices about water source and treatment technology. These trends, and trade‐offs, still need to be better understood, but it is undeniable that there will be important implications for water and energy policy at the state and local level.
The following policy recommendations are steps that can be taken now to build the basics of a framework for more integrated energy and water planning:
• Require that applications for new power plants include an analysis of the water and efficiency implications of various types of cooling options applicable to the proposed plant. The analysis should include factors relating to local climate and air quality, regional air quality, water availability, including instream flow requirements, fuel type and plant efficiency.
• Require a clear demonstration of water availability in the siting of new fossil‐fueled power plants or concentrated solar (this analysis should consider average rainfall years as well as availability during extreme drought events).
• Provide state statutory and regulatory incentives for implementation of power plant cooling technologies that are less water‐intensive than traditional systems, such as air‐cooling or hybrid wet‐dry cooling.
• Provide state‐approved guidance (from the Texas Water Development Board and/or the State Energy Conservation Office) to water suppliers and wastewater treatment providers to help quantify energy use and cost savings associated with water conservation.

41
The over‐arching message is that implementing advanced efficiency is the key to the sustainable use of both energy and water. Improving water efficiency will reduce power demand and improving energy efficiency will reduce water demand. Greater efficiency in usage of either energy or water will help to stretch our finite supplies of both, as well as reduce costs to water and power consumers. The state and local governments should continue, and wherever possible, increase funding and technical support for water and energy conservation and efficiency programs.
Future Work Future installments in this report series will include case studies of energy implications of future water supply strategies for Texas and more place‐specific water supply implications of the future fuel mix for electricity production. There are several other aspects of the energy‐water nexus that are not contemplated in this series, but being investigated by several other entities, including production of hydropower for electricity generation, water use in producing various fossil fuels and alternative transportation fuels, such as ethanol or other biofuels.
42
References 1. "Energy Vision Update 2009 Thirsty Energy: Water and Energy in the 21st Century." (2009), Online. Available: http://www2.cera.com/docs/WEF Fall2008 CERA.pdf Accessed: March 16, 2009.
2. "Uruguay, Dams and People are Running Out of Water." Fundacion Proteger, (2008), Online. Available: http://internationalrivers.org/en/latin‐america/paraguay‐paran%C3%A1‐basin/uruguay‐river‐its‐dams‐and‐its‐people‐are‐running‐out‐water. Accessed: February 1, 2008.
3. "Drought could shut down nuclear power plants." MSNBC News, (January 23, 2008), Online. Available: http://www.msnbc.msn.com/id/22804065/. Accessed: December 19, 2008.
4. Barta, Patrick. "Amid Water Shortage, Australia Looks to the Sea." Wall Street Journal (March 11, 2008).
5. Emery, Theo. "Georgians want access to Tenn. water." Tennessean (February 8, 2008).
6. Mungin, Lateef. "Two Off‐Line Power Plants Help Region Hit Water Goal." Atlanta Journal‐Constitution (December 20, 2007).
7. Lippert, John and Jim Jr. Efstathiou. "Las Vegas Running Out of Water Means Dimming Los Angeles Lights." Bloomberg, (2009), Online. Available: http://www.bloomberg.com/apps/news?pid=20601109&sid=a b86mnWn9.w&refer=home. Accessed: March 16, 2009.
8. Olinger, David. "Water, land out of field's focus." Denver Post (January 29, 2008).
9. Poumadere, Marc, et al. "The 2003 Heat Wave in France: Dangerous Climate Change Here and Now." Risk Analysis, vol. 25, no. 6 (December 2005), pp. 1483‐1494.
10. Intergovernmental Panel on Climate Change. Technical Paper on Climate Change and Water. IPCC‐XXVII/Doc 13. Geneva, Switzerland, April 4‐6, 2008.
11. Texas Electricity Profile. Energy Information Administration, 2006.
12. U.S. Data Projections, Electricity Supply and Demand, Annual Energy Outlook. Energy Information Administration, 2008.
13. Energy Information Administration. Form EIA‐906, EIA‐920, and EIA‐923 Databases. Online. Available: http://www.eia.doe.gov/cneaf/electricity/page/eia906 920.html. Accessed: March 17, 2009.
14. U.S. Department of Energy. Energy Demands on Water Resources: Report to Congress on the Interdependency of Energy and Water. December 2006.
15. Tchobanoglous, George and Edward D. Schroeder. Water Quality: Characteristics, Modeling, Modification. Reading, MA: Addison Wesley Longman, 1987.
43
16. Harbeck, G. E. Jr. "Estimating Forced Evaporation from Cooling Ponds." Journal of the Power Division, Proceedings of the American Society of Civil Engineers, vol. 90, no. PO 3 (October 1964),
17. Goldstein, R. and W. Smith. Electric Power Research Institute. Water & Sustainability (Volume 3): U.S. Water Consumption for Power Production ‐ The Next Half Century. 1006786. Palo Alto, CA, March 2002.
18. Micheletti, Wayne C. and John M. Burns. Wayne C. Micheletti, Inc. and Burns Engineering Services, Inc. Emerging Issues and Needs in Power Plant Cooling Systems.
19. SPX Cooling Technologies. A World Leader in Air Cooled Condensers. 2007.
20. Kutscher, Chuck, et al. National Renewable Energy Laboratory. Hybrid Wet/Dry Cooling for Power Plants, Presentation at Parabolic Trough Technology Workshop. Incline Village, NV, February 14‐16, 2006.
21. Wynne, Hugh, et al. Bernstein Research. U.S. Utilities: What Would an EPA Requirement to Install Cooling Towers Cost the Power Industry? New York, NY, July 2, 2008.
22. SPX Cooling Technologies. Hybrid Cooling Towers: Cooling Towers without visible plume. Ratingen, Germany, 2005‐2006.
23. U.S. Department of Energy. Concentrating Solar Power Commercial Application Study: Reducing Water Consumption of Concentrating Solar Power Electricity Generation. Report to Congress. Washington, DC, 2008.
24. Midwest Research Institute / National Renewable Energy Laboratory. Task 2 ‐ Comparison of Wet and Dry Rankine Cycle Heat Rejection. LDC‐5‐55014‐01, Technical Support for Parabolic Trough Solar Technology, Nexant, Inc. San Francisco, CA, July 2006.
25. National Renewable Energy Laboratory. Parabolic Trough Power Plant System Technology. Online. Available: http://www.nrel.gov/csp/troughnet/power plant systems.html. Accessed: October 13, 2008.
26. Gleick, Peter H. "Water and Energy." Annual Review of Energy and the Environment, vol. 19, (1994), pp. 267‐299.
27. Woods, Mark C., et al. National Energy Technology Laboratory. Cost and Performance Baseline for Fossil Energy Plants, Volume 1: Bituminous Coal and Natural Gas to Electricity. Pittsburgh, PA, August 2007.
28. King, Carey, et al. "Water Demand Projections for Power Generation in Texas." (2008), Online. Available: http://www.twdb.state.tx.us/wrpi/data/socio/est/Final pwr.pdf. Accessed: August 31, 2008.
29. World Coal Institute. Coal Meeting the Climate Challenge. Richmond, UK, September 2007.
30. Masters, Gilbert M. Renewable and Efficient Electric Power Systems. Hoboken, NJ: John Wiley & Sons, Inc., 2004.
44
31. Brooklyn College. Nuclear Reactors. Online. Available: http://academic.brooklyn.cuny.edu/physics/sobel/Nucphys/pile.html. Accessed: January 24, 2009.
32. Arizona State University. Fossil Fuels. Online. Available: http://www.eas.asu.edu/~holbert/eee463/FOSSIL.HTML. Accessed: January 24, 2009.
33. U.S. Department of Energy. How Gas Turbine Power Plants Work. Online. Available: http://www.fe.doe.gov/programs/powersystems/turbines/turbines howitworks.html. Accessed: December 18, 2008.
34. U.S. Department of Energy. The Turbines of Tomorrow. Online. Available: http://www.fe.doe.gov/programs/powersystems/turbines/index.html. Accessed: December 18, 2008.
35. Thompson, John. "Coal Gasification ‐ Air Pollution and Permitting Implications of IGCC." USEPA Air Innovations Conference, (August 10, 2004),
36. City of Austin. Wastewater Reports ‐ Discharge Monitoring Reports (DMR). Online. Available: http://www.ci.austin.tx.us/water/wastewater.htm. Accessed: November 24, 2008.
37. Tullo, Alexander. "Solar Revolution." Chemical & Engineering News, vol. 84, no. 47 (November 20, 2006), pp. 25‐28.
38. Solar Home. Thin‐Film. Online. Available: http://www.solarhome.org/thin‐film.html. Accessed: March 27, 2008.
39. Malsch, Ineke. "Thin Films Seek a Solar Future." The Industrial Physicist, (2003), Online. Available: http://www.aip.org/tip/INPHFA/vol‐9/iss‐2/p16.pdf. Accessed: March 27, 2008.
40. Tenaska, Inc. The Tenaska Trailblazer Energy Center: Key Facts. Online. Available: http://www.tenaskatrailblazer.com/trailblazer.html. Accessed: January 24, 2009.
41. U.S. Geological Survey. Surface water use in the United States. Online. Available: http://ga.water.usgs.gov/edu/wusw.html. Accessed: December 18, 2008.
42. U.S. Geological Survey. Ground water use in the United States. Online. Available: http://ga.water.usgs.gov/edu/wugw.html. Accessed: December 18, 2008.
43. USGS Ground‐Water Data for the Nation. United States Geological Survey, 2009.
44. Goldstein, R. and W. Smith. Electric Power Research Institute. Water & Sustainability (Volume 4): U.S. Electricity Consumption for Water Supply & Treatment ‐ The Next Half Century. 1006787. Palo Alto, CA, March 2002.
45. California Energy Commission. California's Water‐Energy Relationship. CEC‐700‐2005‐011‐SF. Sacramento, CA, November 2005.
46. Van der Bruggen, Bart and Carlo Vandecasteele. "Distillation vs. membrane filtration: overview of process evolutions in seawater." Desalination, vol. 143, no. 3 (2002), pp. 207‐218.
45
47. Desalination: A National Perspective. Committee on Advancing Desalination Technology, National Research Council, 2008.
48. Lawler, Desmond and Mark Benjamin. "Physical and Chemical Treatment Processes for Water." 2008 (Unpublished.)
49. "Prescription drugs found in drinking water across U.S." CNN News, (March 10, 2008), Online. Available: http://www.cnn.com/2008/HEALTH/03/10/pharma.water1/index.html. Accessed: December 18, 2008.
50. U.S. Environmental Protection Agency. Water Quality Criteria: Drinking Water Health Advisories. Online. Available: http://www.epa.gov/waterscience/criteria/drinking/. Accessed: January 24, 2009.
51. Westerhoff, Paul, et al. "Fate of Endocrine‐Disruptor, Pharmaceutical, and Personal Care Product Chemicals during Simulated Drinking Water Treatment Processes." Environmental Science & Technology, vol. 39, no. 17 (2005), pp. 6649‐6663.
52. Zwiener, C. and F. H. Frimmel. "Oxidative Treatment of Pharmaceuticals in Water." Water Research, vol. 34, no. 6 (2000), pp. 1881‐1885.
53. AWWARF. Residential Water Use Summary. Online. Available: http://www.aquacraft.com/Publications/resident.htm. Accessed: January 25, 2009.
54. American Council for an Energy‐Efficient Economy. Consumer Guide to Home Energy Savings. Online. Available: http://www.aceee.org/consumerguide/waterheating.htm. Accessed: February 18, 2009.
55. Energy Information Administration. End‐Use Consumption of Electricity 2001. Online. Available: http://www.eia.doe.gov/emeu/recs/recs2001/enduse2001/enduse2001.html. Accessed: March 24, 2009.
56. Texas Water Development Board. Water for Texas 2007. GP‐8‐1. Austin, TX, January 2007.
57. Texas Commission on Environmental Quality. Water Rights Database and Related Files. Online. Available: http://www.tceq.state.tx.us/permitting/water supply/water rights/wr databases.html. Accessed: October 12, 2008.
58. Texas Commission on Environmental Quality. Site Layers. Online. Available: http://www.tceq.state.tx.us/gis/sites.html. Accessed: June 13, 2008.
59. U.S. Environmental Protection Agency. Envirofacts Data Warehouse. Online. Available: http://www.epa.gov/enviro/. Accessed: November 18, 2008.
60. Selected Historical Decennial Census Population and Housing Costs. Online. Available: http://www.census.gov/population/www/censusdata/hiscendata.html. Accessed: June 12, 2008.
46
61. Webber, Michael E., et al. Texas Commission on Environmental Quality. A Clean Energy Plan for Texas. 582‐8‐89236. Austin, TX, August 2008.
62. Texas Comptroller of Public Accounts. Liquid Assets: The State of Texas' Water Resources. 96‐1360. Austin, TX, January 2009.
63. Asano, Takashi, et al. Water Reuse: Issues, Technologies, and Applications. New York, NY: Metcalf & Eddy, Inc., 2007.
64. Anderson, J. "The environmental benefits of water recycling and reuse." Water Science and Technology: Water Supply, vol. 3, no. 4 (2003), pp. 1‐10.
65. Stiegel, Gary J., et al. National Energy Technology Laboratory. Power Plant Water Usage and Loss Study. Pittsburgh, PA, May 2007.
66. National Energy Technology Laboratory. IGCC Plants With and Without Carbon Capture and Sequestration. Pittsburgh, PA, 2007.
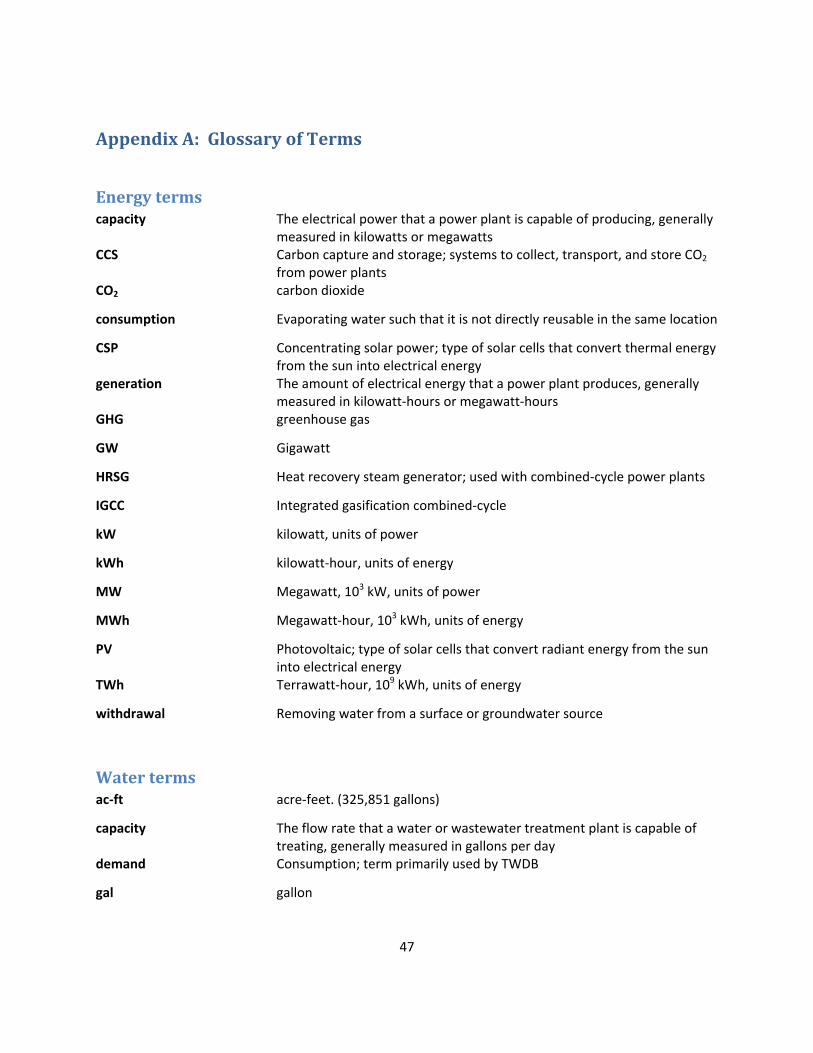
47
Appendix A: Glossary of Terms
Energy terms capacity The electrical power that a power plant is capable of producing, generally
measured in kilowatts or megawatts CCS Carbon capture and storage; systems to collect, transport, and store CO2
from power plants CO2 carbon dioxide
consumption Evaporating water such that it is not directly reusable in the same location
CSP Concentrating solar power; type of solar cells that convert thermal energy from the sun into electrical energy
generation The amount of electrical energy that a power plant produces, generally measured in kilowatt‐hours or megawatt‐hours
GHG greenhouse gas
GW Gigawatt
HRSG Heat recovery steam generator; used with combined‐cycle power plants
IGCC Integrated gasification combined‐cycle
kW kilowatt, units of power
kWh kilowatt‐hour, units of energy
MW Megawatt, 103 kW, units of power
MWh Megawatt‐hour, 103 kWh, units of energy
PV Photovoltaic; type of solar cells that convert radiant energy from the sun into electrical energy
TWh Terrawatt‐hour, 109 kWh, units of energy
withdrawal Removing water from a surface or groundwater source
Water terms ac‐ft acre‐feet. (325,851 gallons)
capacity The flow rate that a water or wastewater treatment plant is capable of treating, generally measured in gallons per day
demand Consumption; term primarily used by TWDB
gal gallon

48
Mgal million gallons
mgd million gallons per day
permitted discharge The maximum flow rate that a water or wastewater treatment plant can legally return to a receiving water body
General terms EISA 2007 Energy Independence and Security Act of 2007
EPA Environmental Protection Agency
EPACT 2005 Energy Policy Act of 2005
TCEQ Texas Commission on Environmental Quality
TWDB Texas Water Development Board
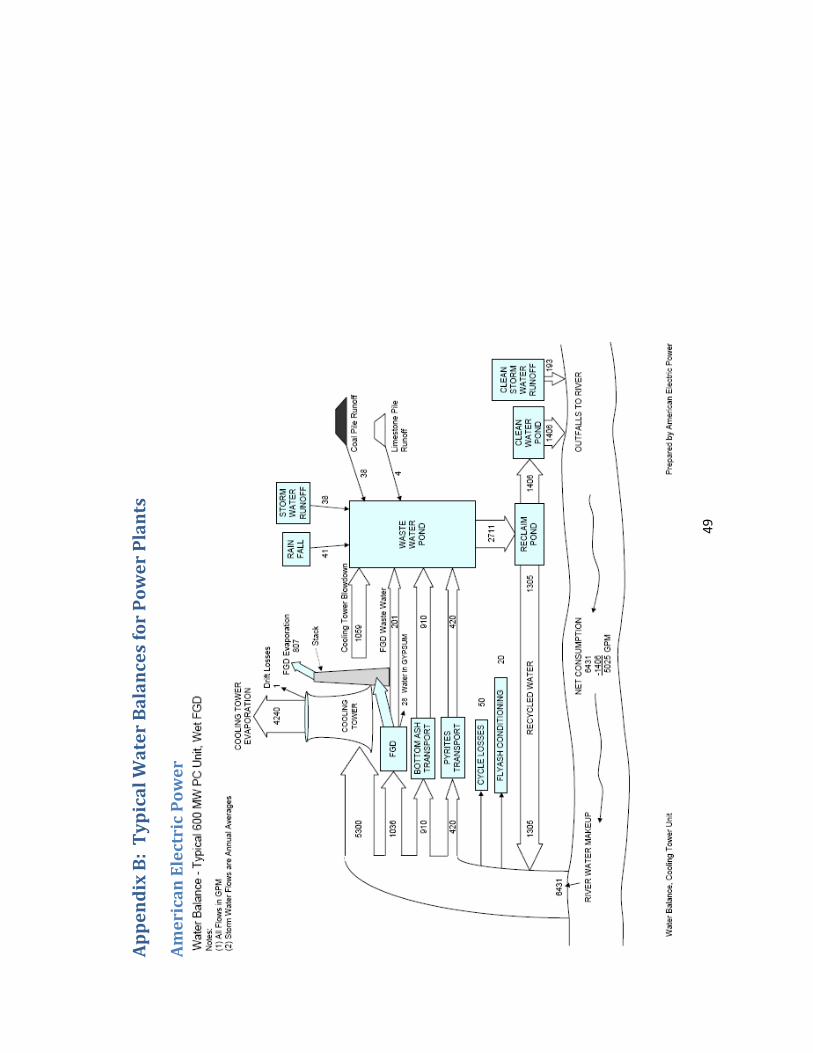
49
Appendix B: Typical Water Balances for Pow
er Plants
American Electric Pow
er
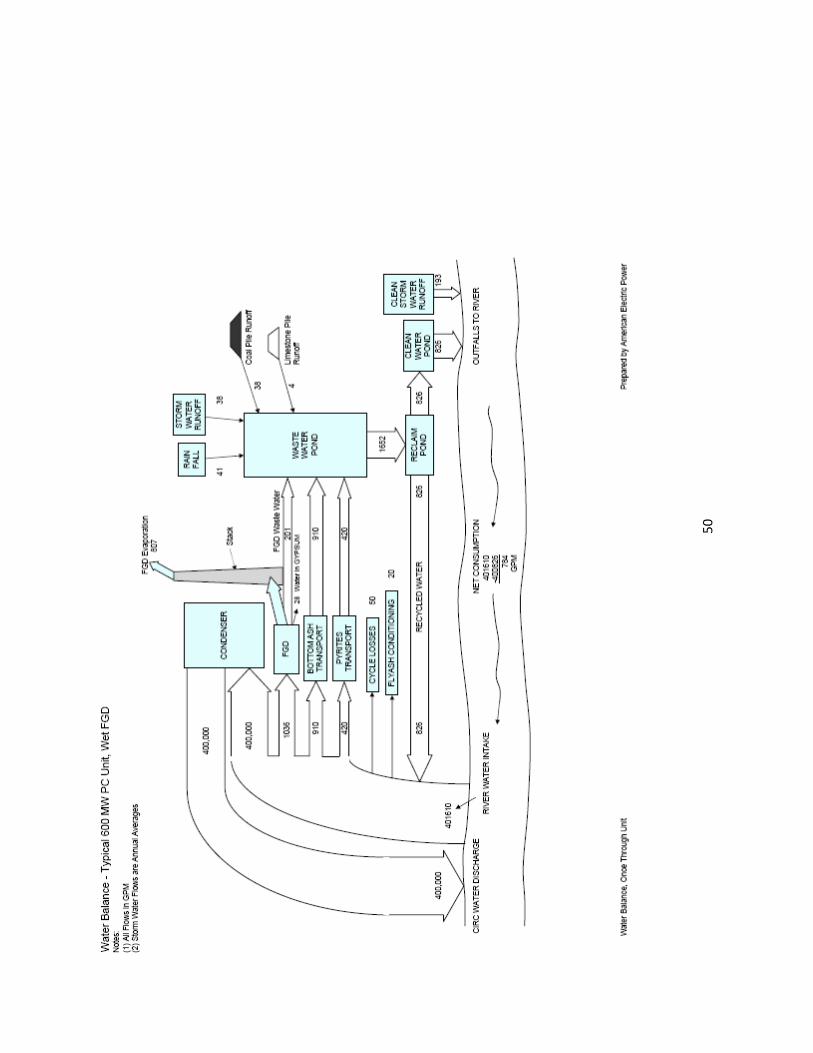
50
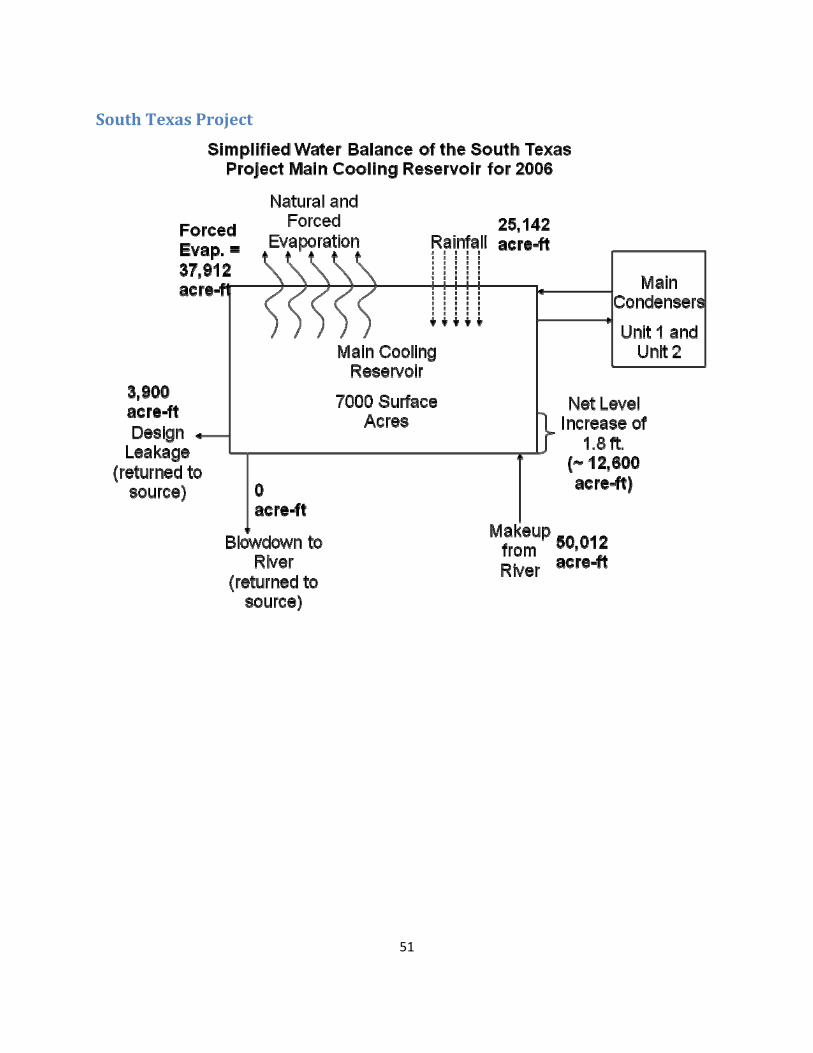
51
South Texas Project