
(energy efficiency, renewable ener- gies, GHG emissions ...
32
Annex 16a/15th MC/01-12-2017 … Interim Report Study on 2030 overall targets (energy efficiency, renewable ener- gies, GHG emissions reduction) for the Energy Community Authors: Gustav Resch, Albert Hiesl, Lukas Liebmann - TU Wien / EEG Andreas Türk, Dorian Frieden, Claudia Fruhmann - Joanneum Research Laszlo Szabo - REKK Client: Energy Community Secretariat Lead partner: Technische Universität Wien (TU Wien), Energy Economics Group Gusshausstraße 25-29 / 370-3, A-1040 Vienna, Austria Contributing partners (subcontractors): Joanneum Research, Austria Regional Centre for Energy Policy Research (REKK), Hungary
Transcript of (energy efficiency, renewable ener- gies, GHG emissions ...
Annex 16a/15th MC/01-12-2017
…
Interim Report
Study on 2030 overall targets (energy efficiency, renewable ener-gies, GHG emissions reduction) for the Energy Community
Authors: Gustav Resch, Albert Hiesl, Lukas Liebmann - TU Wien / EEG Andreas Türk, Dorian Frieden, Claudia Fruhmann - Joanneum Research Laszlo Szabo - REKK
Client: Energy Community Secretariat
Lead partner: Technische Universität Wien (TU Wien), Energy Economics Group Gusshausstraße 25-29 / 370-3, A-1040 Vienna, Austria
Contributing partners (subcontractors): Joanneum Research, Austria Regional Centre for Energy Policy Research (REKK), Hungary
Interim Report - Study on 2030 overall targets for the Energy Community
Page ii
Table of contents
1 Introduction ..................................................................................................................................... 3 1.1 Policy context............................................................................................................................................................... 3 1.2 Objectives and expected results of this study ............................................................................................................. 4 1.3 Structure of this report ................................................................................................................................................ 4
2 Methodology for 2030 targets on Energy Efficiency ...................................................................... 5 2.1 Approach taken at EU/EnC level .................................................................................................................................. 5 2.2 Proposed options for target setting ............................................................................................................................. 8 2.3 Data needs ................................................................................................................................................................. 11
3 Methodology for 2030 targets on Renewable Energies ............................................................... 12 3.1 Approach taken at EU/EnC level ................................................................................................................................ 12 3.2 Proposed options for target setting ........................................................................................................................... 14 3.3 Data needs ................................................................................................................................................................. 16
4 Methodology for 2030 targets on Greenhouse Gas Emission Reduction ..................................... 18 4.1 Approach taken at EU level ........................................................................................................................................ 18
4.1.1 2020 GHG targets.................................................................................................................................................................. 18 4.1.2 2030 GHG targets.................................................................................................................................................................. 20
4.2 Proposed options for GHG target setting .................................................................................................................. 22 4.2.1 Climate Policy development in the region ............................................................................................................................ 22 4.2.2 Elements of GHG target setting ............................................................................................................................................ 22 4.2.3 Setting regional and national targets .................................................................................................................................... 23 4.2.4 Consistency with INDCs and national emission projections .................................................................................................. 25 4.2.5 Split between the ETS and non-ETS sectors .......................................................................................................................... 25
4.3 Data needs ................................................................................................................................................................. 26
5 Concluding Remarks ....................................................................................................................... 27
6 References ..................................................................................................................................... 29
7 Annex I. GDP/ Capita comparison for regional target setting ....................................................... 31
8 Annex II. GDP/ Capita based burden sharing comparison ............................................................. 32
Interim Report - Study on 2030 overall targets for the Energy Community
Page 3
1 Introduction This report aims to outline derived methods for establishing 2030 energy and climate targets (on Energy Effi-ciency, Renewable Energy Sources, GHG Emission Reduction) for the Energy Community. Aim of the overall study is to develop a methodology for target setting and to conduct brief assessments of the impacts of target achieve-ment. This study, done on behalf of the Energy Community Secretariat, is conducted by a consortium led by Technische Universität Wien (TU Wien), counting on the assistance from two other key partners – namely Jo-anneum Research and the Regional Centre for Energy Policy Research (REKK).
1.1 Policy context During the first meeting of the Climate Action Group, held in Vienna on 5 September 2017, it was acknowledged that stable national energy and climate plans up to 2030 (and possibly beyond) should be accompanied by three overall targets, namely for the increase of renewable energy in overall energy consumption, increased energy efficiency and greenhouse gas emissions reduction.
This aims for establishing higher regulatory stability, increasing transparency concerning national efforts and will increase investment certainty. Whether these targets will be binding or indicative, and whether they will be bro-ken down to national entities, will have to be decided at a later stage by the Energy Community institutions in charge.
There is a need to align Contracting Parties (CPs) planned GHG trajectories, with strong focus on the energy transformation sector that has to go through a very strict alignment with mid and long term EU GHG targets.
Due to foreseen significant transformation of sectors of economy, including the energy sector, analysis and for-ward planning is needed to avoid large scale stranded assets, expensive policy failures and fossil lock-ins that are not compatible with the EU vision of deep decarbonisation. However, so far, Energy Community Contracting Parties have only established national targets for the increase of renewable energy, and an overall target for energy efficiency up to 2020 that may be insufficient for the needed transformational change. Setting binding 2030 GHG targets is the beginning of a convergence process towards the EU long term target that needs to take into account countries current emissions profiles, abilities and the strong need for economic recovery.
Another important policy framework is the Paris Climate Agreement. In general terms, Contracting Parties of the Energy Community support the call for enhanced action on climate change provided by the Paris Agreement. Efforts are needed at the various layers, i.e. at global, European, regional and at a national level, to let the vision of effectively combating climate become a reality. Countries need to call on each other to step up their climate action, to hold global warming to well below 2 degrees Celsius and to pursue efforts to limit it to 1.5 degrees Celsius. So far, all CPs, except Kosovo* have submitted voluntary pledges under the Paris Agreement that will be further strengthened in the upcoming years. This can be seen as a first step taken by CPs to prevent further negative impacts to their citizens and the overall economy, In line with EU efforts and their respective obligations in the EU accession process or other bilateral commitments as well as under the Paris Agreement, Contracting Parties of the Energy Community – assisted by the Climate Action Group, the Energy Efficiency Coordination Group and the Renewable Energy Coordination Group, the Energy Community Secretariat (ECS) and the Euro-pean Commission (EC) – will have to discuss a rigorous, streamlined and inclusive process to establish energy efficiency, renewables and greenhouse gas emission reduction targets for 2030. As an important next step within that process, an EU-convergent methodology for the calculation of the 2030 targets for the Contracting Parties should be presented at the next Ministerial Council on 14 December 2017.
Three distinct 2030 energy and climate targets need to be established: a target for energy efficiency, a target for the contribution of renewable energies and an overall GHG emission reduction target.
Interim Report - Study on 2030 overall targets for the Energy Community
Page 4
1.2 Objectives and expected results of this study The core objective of this project is to develop a methodology and to conduct a quantitative assessment to show pathways for achieving calculated 2030 energy efficiency, RE and GHG emissions reduction targets that can be expected under aligned framework conditions in the Energy Community Contracting Parties.
For doing so, we will align our methodologies to the approaches used for energy and climate target setting at EU Member State level, and we make use of specialised energy system models for assessing certain impacts related to that.
1.3 Structure of this report This report is structured as follows: Chapter 2 provides an outline of the proposed methodology for defining 2030 targets for energy efficiency. Next to that, chapter 3 is dedicated to renewable energies, discussing the options identified through studying the approach taken at EU and EC level for 2020 as well as the proposed methodology in the 2030 context as outlined by the European Commission as part the EC’s 2016 winter package. Chapter 4 provides then the corresponding outline for setting 2030 targets related to GHG emission reduction. We con-clude this brief interim report with draft recommendations on the way forward (chapter 5). Please note that complementary information on GHG target setting can be found in Annexes to this report.
Interim Report - Study on 2030 overall targets for the Energy Community
Page 5
2 Methodology for 2030 targets on Energy Efficiency
2.1 Approach taken at EU/EnC level
2020 EE target setting
EU level
The energy efficiency target established within the European Union (EU28) for 2020 aimed for a reduction of 20% compared to baseline trends – i.e. more precisely, as defined by the 2007 PRIMES baseline scenario. This relative target translates into the following primary/final energy targets for 2020 (EU, 2012):
• 1483 Mtoe in terms of primary energy consumption and • 1086 Mtoe in terms of final energy consumption
Therefore the Energy Efficiency (EE) Directive 2012/27/EU (EU, 2012) sets a legal framework for energy effi-ciency improvements in the timeframe from 2014 to 2020. This Directive was approved in October 2012. For reaching these objectives, EU Member States have to set their own individual indicative Energy Efficiency (EE) targets, having in mind the overall EU target, and report them to the EU. Member states have the flexibility to express their EE targets either in primary or final energy consumption, primary or final energy savings or in energy intensity. These targets have to be reported to the EU also by means of absolute values of primary and final energy consumption in 2020. By setting these national targets, Member States can also consider country-specific circumstances like:
• remaining potential for cost efficient energy savings, • development of GDP, • developments in energy imports and exports, • development of renewable energy sources, nuclear energy and carbon capture and storage, and • early actions.
The EE Directive predefines various measures that need to be adopted in order to assure reaching the overall energy efficiency target(s) such as (EU, 2012; EC, 2017b):
• Annual new reduction of 1.5% in national energy sales based on the average of energy sales by volume of the last three year period (2010-2012). There are some exceptions when calculating the volume of energy sales which could be applied e.g. partially or fully exclude energy sales used in transport. Fur-thermore, the 1.5% target can also be achieved by applying alternative strategic policy instruments.
• Energy efficient renovations to at least 3% of buildings owned and occupied by central governments per year based on the total floor area of heated and/or cooled buildings and also establishing a long-term strategy for mobilising investment in the renovation of the national stock of residential and commercial buildings (public and private);
• Mandatory energy efficiency certificates accompanying the sale and rental of buildings; • Minimum energy efficiency standards and labelling for a variety of products such as boilers, household
appliances, lighting and televisions (ecodesign); • National Energy Efficiency Action Plans have to be submitted by the MSs to the EC every three years; • Rollout of smart meters for electricity and for gas by 2020; • Energy audits for large companies at least every four years; • For a better management of energy consumption the right of consumers to receive easy and free access
on their real time consumption and historical data.
Interim Report - Study on 2030 overall targets for the Energy Community
Page 6
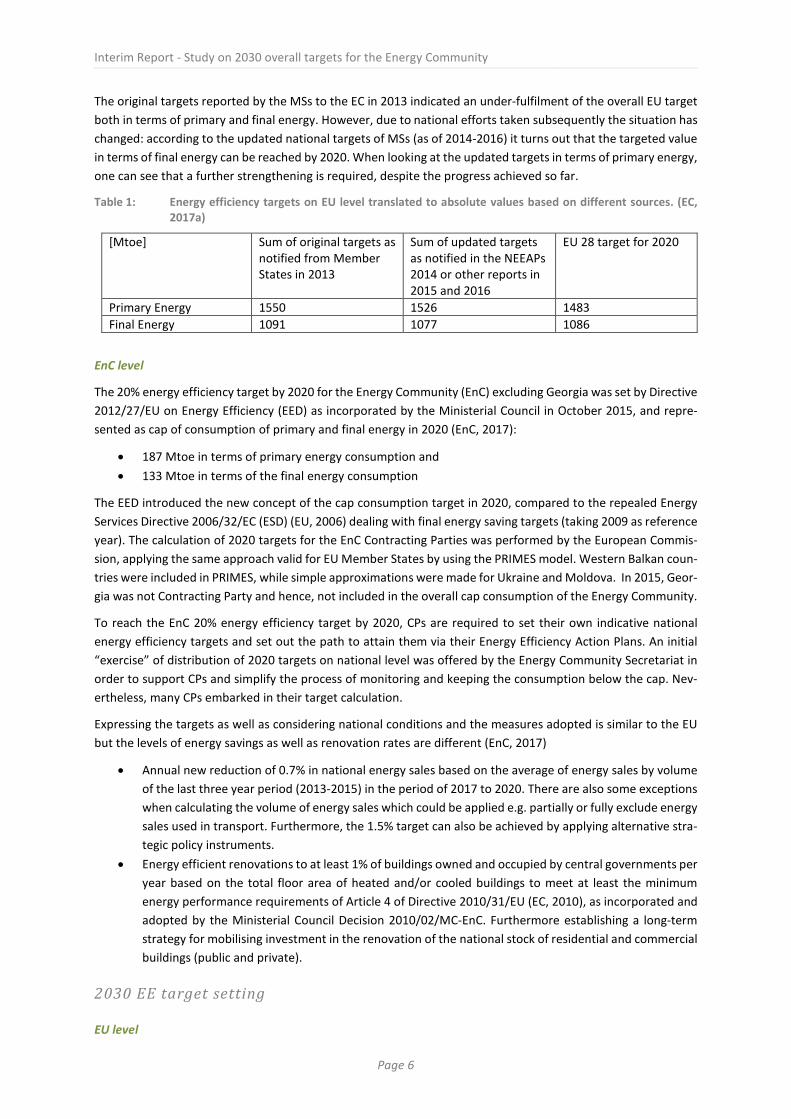
The original targets reported by the MSs to the EC in 2013 indicated an under-fulfilment of the overall EU target both in terms of primary and final energy. However, due to national efforts taken subsequently the situation has changed: according to the updated national targets of MSs (as of 2014-2016) it turns out that the targeted value in terms of final energy can be reached by 2020. When looking at the updated targets in terms of primary energy, one can see that a further strengthening is required, despite the progress achieved so far.
Table 1: Energy efficiency targets on EU level translated to absolute values based on different sources. (EC, 2017a)
[Mtoe] Sum of original targets as notified from Member States in 2013
Sum of updated targets as notified in the NEEAPs 2014 or other reports in 2015 and 2016
EU 28 target for 2020
Primary Energy 1550 1526 1483 Final Energy 1091 1077 1086
EnC level
The 20% energy efficiency target by 2020 for the Energy Community (EnC) excluding Georgia was set by Directive 2012/27/EU on Energy Efficiency (EED) as incorporated by the Ministerial Council in October 2015, and repre-sented as cap of consumption of primary and final energy in 2020 (EnC, 2017):
• 187 Mtoe in terms of primary energy consumption and • 133 Mtoe in terms of the final energy consumption
The EED introduced the new concept of the cap consumption target in 2020, compared to the repealed Energy Services Directive 2006/32/EC (ESD) (EU, 2006) dealing with final energy saving targets (taking 2009 as reference year). The calculation of 2020 targets for the EnC Contracting Parties was performed by the European Commis-sion, applying the same approach valid for EU Member States by using the PRIMES model. Western Balkan coun-tries were included in PRIMES, while simple approximations were made for Ukraine and Moldova. In 2015, Geor-gia was not Contracting Party and hence, not included in the overall cap consumption of the Energy Community.
To reach the EnC 20% energy efficiency target by 2020, CPs are required to set their own indicative national energy efficiency targets and set out the path to attain them via their Energy Efficiency Action Plans. An initial “exercise” of distribution of 2020 targets on national level was offered by the Energy Community Secretariat in order to support CPs and simplify the process of monitoring and keeping the consumption below the cap. Nev-ertheless, many CPs embarked in their target calculation.
Expressing the targets as well as considering national conditions and the measures adopted is similar to the EU but the levels of energy savings as well as renovation rates are different (EnC, 2017)
• Annual new reduction of 0.7% in national energy sales based on the average of energy sales by volume of the last three year period (2013-2015) in the period of 2017 to 2020. There are also some exceptions when calculating the volume of energy sales which could be applied e.g. partially or fully exclude energy sales used in transport. Furthermore, the 1.5% target can also be achieved by applying alternative stra-tegic policy instruments.
• Energy efficient renovations to at least 1% of buildings owned and occupied by central governments per year based on the total floor area of heated and/or cooled buildings to meet at least the minimum energy performance requirements of Article 4 of Directive 2010/31/EU (EC, 2010), as incorporated and adopted by the Ministerial Council Decision 2010/02/MC-EnC. Furthermore establishing a long-term strategy for mobilising investment in the renovation of the national stock of residential and commercial buildings (public and private).
2030 EE target setting
EU level
Interim Report - Study on 2030 overall targets for the Energy Community
Page 7
In November 2016, the European Commission proposed an update to the Energy Efficiency Directive, including a new EU energy efficiency target for 2030, and measures to update the Directive to assure target achievement in the 2030 timeframe. A binding energy efficiency target at EU level of 30% is proposed for 2030. However, there are no binding targets established so far at the level of individual Member States. The proposed EU targets for 2030 are set to (EC, 2016c):
• 1321 Mtoe in terms of primary energy consumption, and • 987 Mtoe in terms of final energy consumption.
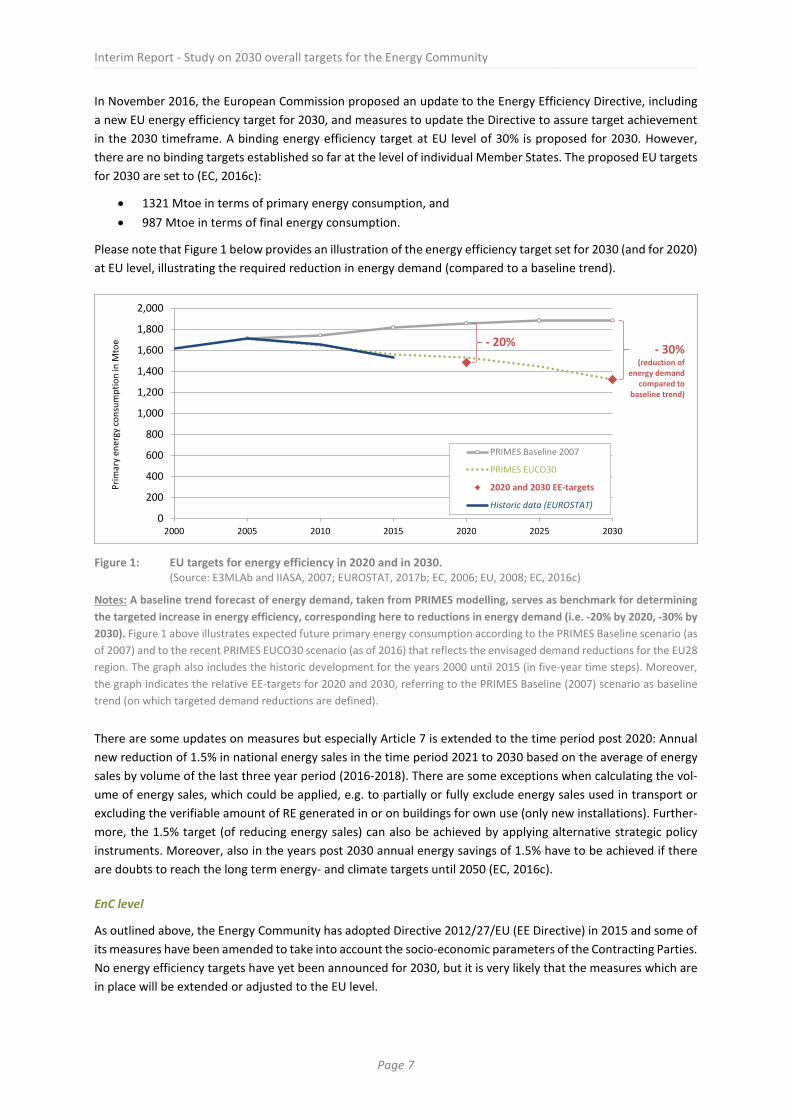
Please note that Figure 1 below provides an illustration of the energy efficiency target set for 2030 (and for 2020) at EU level, illustrating the required reduction in energy demand (compared to a baseline trend).
Figure 1: EU targets for energy efficiency in 2020 and in 2030. (Source: E3MLAb and IIASA, 2007; EUROSTAT, 2017b; EC, 2006; EU, 2008; EC, 2016c)
Notes: A baseline trend forecast of energy demand, taken from PRIMES modelling, serves as benchmark for determining the targeted increase in energy efficiency, corresponding here to reductions in energy demand (i.e. -20% by 2020, -30% by 2030). Figure 1 above illustrates expected future primary energy consumption according to the PRIMES Baseline scenario (as of 2007) and to the recent PRIMES EUCO30 scenario (as of 2016) that reflects the envisaged demand reductions for the EU28 region. The graph also includes the historic development for the years 2000 until 2015 (in five-year time steps). Moreover, the graph indicates the relative EE-targets for 2020 and 2030, referring to the PRIMES Baseline (2007) scenario as baseline trend (on which targeted demand reductions are defined).
There are some updates on measures but especially Article 7 is extended to the time period post 2020: Annual new reduction of 1.5% in national energy sales in the time period 2021 to 2030 based on the average of energy sales by volume of the last three year period (2016-2018). There are some exceptions when calculating the vol-ume of energy sales, which could be applied, e.g. to partially or fully exclude energy sales used in transport or excluding the verifiable amount of RE generated in or on buildings for own use (only new installations). Further-more, the 1.5% target (of reducing energy sales) can also be achieved by applying alternative strategic policy instruments. Moreover, also in the years post 2030 annual energy savings of 1.5% have to be achieved if there are doubts to reach the long term energy- and climate targets until 2050 (EC, 2016c).
EnC level
As outlined above, the Energy Community has adopted Directive 2012/27/EU (EE Directive) in 2015 and some of its measures have been amended to take into account the socio-economic parameters of the Contracting Parties. No energy efficiency targets have yet been announced for 2030, but it is very likely that the measures which are in place will be extended or adjusted to the EU level.
0
200
400
600
800
1,000
1,200
1,400
1,600
1,800
2,000
2000 2005 2010 2015 2020 2025 2030
Prim
ary
ener
gy co
nsum
ptio
n in
Mto
e
PRIMES Baseline 2007
PRIMES EUCO30
2020 and 2030 EE-targets
Historic data (EUROSTAT)
- 20% - 30%(reduction of
energy demand compared to
baseline trend)
Interim Report - Study on 2030 overall targets for the Energy Community
Page 8
2.2 Proposed options for target setting Before digging into details concerning options for target setting in the field of energy efficiency we start with a comparison of overall welfare trends (cf. box 1).
Box 1: A closer look at economic welfare: GDP per capita in the European Union and the Energy Community.
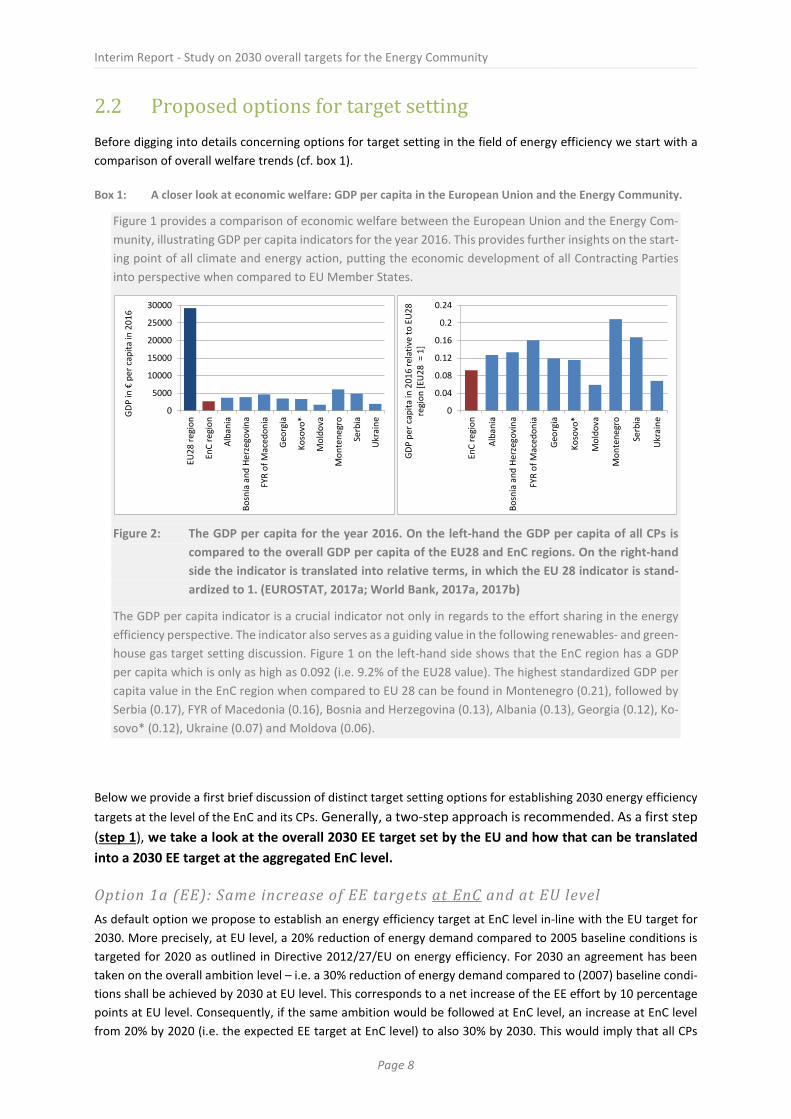
Figure 1 provides a comparison of economic welfare between the European Union and the Energy Com-munity, illustrating GDP per capita indicators for the year 2016. This provides further insights on the start-ing point of all climate and energy action, putting the economic development of all Contracting Parties into perspective when compared to EU Member States.
Figure 2: The GDP per capita for the year 2016. On the left-hand the GDP per capita of all CPs is compared to the overall GDP per capita of the EU28 and EnC regions. On the right-hand side the indicator is translated into relative terms, in which the EU 28 indicator is stand-ardized to 1. (EUROSTAT, 2017a; World Bank, 2017a, 2017b)
The GDP per capita indicator is a crucial indicator not only in regards to the effort sharing in the energy efficiency perspective. The indicator also serves as a guiding value in the following renewables- and green-house gas target setting discussion. Figure 1 on the left-hand side shows that the EnC region has a GDP per capita which is only as high as 0.092 (i.e. 9.2% of the EU28 value). The highest standardized GDP per capita value in the EnC region when compared to EU 28 can be found in Montenegro (0.21), followed by Serbia (0.17), FYR of Macedonia (0.16), Bosnia and Herzegovina (0.13), Albania (0.13), Georgia (0.12), Ko-sovo* (0.12), Ukraine (0.07) and Moldova (0.06).
Below we provide a first brief discussion of distinct target setting options for establishing 2030 energy efficiency targets at the level of the EnC and its CPs. Generally, a two-step approach is recommended. As a first step (step 1), we take a look at the overall 2030 EE target set by the EU and how that can be translated into a 2030 EE target at the aggregated EnC level.
Option 1a (EE): Same increase of EE targets at EnC and at EU level As default option we propose to establish an energy efficiency target at EnC level in-line with the EU target for 2030. More precisely, at EU level, a 20% reduction of energy demand compared to 2005 baseline conditions is targeted for 2020 as outlined in Directive 2012/27/EU on energy efficiency. For 2030 an agreement has been taken on the overall ambition level – i.e. a 30% reduction of energy demand compared to (2007) baseline condi-tions shall be achieved by 2030 at EU level. This corresponds to a net increase of the EE effort by 10 percentage points at EU level. Consequently, if the same ambition would be followed at EnC level, an increase at EnC level from 20% by 2020 (i.e. the expected EE target at EnC level) to also 30% by 2030. This would imply that all CPs
0
0.04
0.08
0.12
0.16
0.2
0.24
EnC
regi
on
Alba
nia
Bosn
ia a
nd H
erze
govi
na
FYR
of M
aced
onia
Geor
gia
Koso
vo*
Mol
dova
Mon
tene
gro
Serb
ia
Ukr
aine
GDP
per c
apita
in 2
016
rela
tive
to E
U28
re
gion
[EU
28 =
1]
0
5000
10000
15000
20000
25000
30000
EU28
regi
on
EnC
regi
on
Alba
nia
Bosn
ia a
nd H
erze
govi
na
FYR
of M
aced
onia
Geor
gia
Koso
vo*
Mol
dova
Mon
tene
gro
Serb
ia
Ukr
aine
GDP
in €
per c
apita
in 2
016
Interim Report - Study on 2030 overall targets for the Energy Community
Page 9
have to commit themselves to various measures. These measures were already formulated in the Energy Effi-ciency Directive 2012/27/EU as well as in the 4th edition of the Energy Communities Legal Framework (EnC, 2017) for the energy efficiency target for the year 2020, and for 2030 proposed updates are foreseen as published by the European Commission in the proposed recast of the EE Directive as part of the EC’s winter package (see section 2.1 for more details).
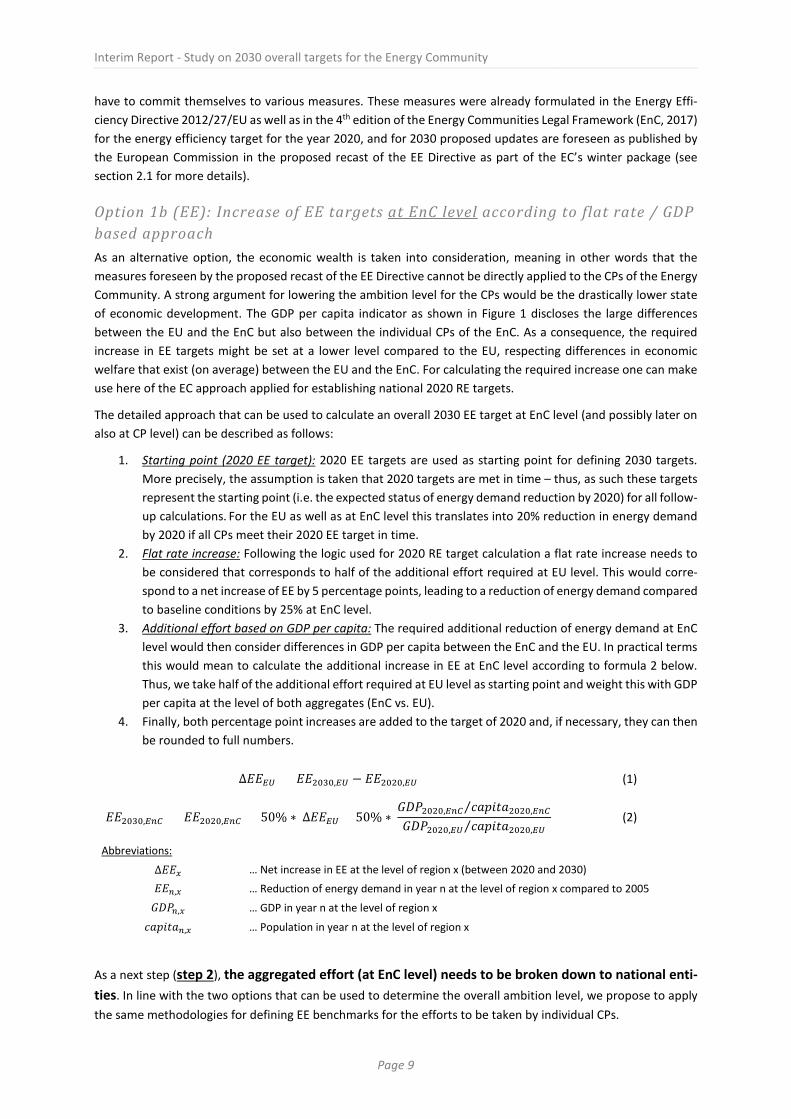
Option 1b (EE): Increase of EE targets at EnC level according to flat rate / GDP based approach As an alternative option, the economic wealth is taken into consideration, meaning in other words that the measures foreseen by the proposed recast of the EE Directive cannot be directly applied to the CPs of the Energy Community. A strong argument for lowering the ambition level for the CPs would be the drastically lower state of economic development. The GDP per capita indicator as shown in Figure 1 discloses the large differences between the EU and the EnC but also between the individual CPs of the EnC. As a consequence, the required increase in EE targets might be set at a lower level compared to the EU, respecting differences in economic welfare that exist (on average) between the EU and the EnC. For calculating the required increase one can make use here of the EC approach applied for establishing national 2020 RE targets.
The detailed approach that can be used to calculate an overall 2030 EE target at EnC level (and possibly later on also at CP level) can be described as follows:
1. Starting point (2020 EE target): 2020 EE targets are used as starting point for defining 2030 targets. More precisely, the assumption is taken that 2020 targets are met in time – thus, as such these targets represent the starting point (i.e. the expected status of energy demand reduction by 2020) for all follow-up calculations. For the EU as well as at EnC level this translates into 20% reduction in energy demand by 2020 if all CPs meet their 2020 EE target in time.
2. Flat rate increase: Following the logic used for 2020 RE target calculation a flat rate increase needs to be considered that corresponds to half of the additional effort required at EU level. This would corre-spond to a net increase of EE by 5 percentage points, leading to a reduction of energy demand compared to baseline conditions by 25% at EnC level.
3. Additional effort based on GDP per capita: The required additional reduction of energy demand at EnC level would then consider differences in GDP per capita between the EnC and the EU. In practical terms this would mean to calculate the additional increase in EE at EnC level according to formula 2 below. Thus, we take half of the additional effort required at EU level as starting point and weight this with GDP per capita at the level of both aggregates (EnC vs. EU).
4. Finally, both percentage point increases are added to the target of 2020 and, if necessary, they can then be rounded to full numbers.
∆𝐸𝐸𝐸𝐸𝐸𝐸𝐸𝐸 = 𝐸𝐸𝐸𝐸2030,𝐸𝐸𝐸𝐸 − 𝐸𝐸𝐸𝐸2020,𝐸𝐸𝐸𝐸 (1)
𝐸𝐸𝐸𝐸2030,𝐸𝐸𝐸𝐸𝐸𝐸 = 𝐸𝐸𝐸𝐸2020,𝐸𝐸𝐸𝐸𝐸𝐸 + 50% ∗ ∆𝐸𝐸𝐸𝐸𝐸𝐸𝐸𝐸 + 50% ∗ 𝐺𝐺𝐺𝐺𝐺𝐺2020,𝐸𝐸𝐸𝐸𝐸𝐸 𝑐𝑐𝑐𝑐𝑐𝑐𝑐𝑐𝑐𝑐𝑐𝑐2020,𝐸𝐸𝐸𝐸𝐸𝐸⁄𝐺𝐺𝐺𝐺𝐺𝐺2020,𝐸𝐸𝐸𝐸 𝑐𝑐𝑐𝑐𝑐𝑐𝑐𝑐𝑐𝑐𝑐𝑐2020,𝐸𝐸𝐸𝐸⁄ (2)
Abbreviations:
∆𝐸𝐸𝐸𝐸𝑥𝑥 … Net increase in EE at the level of region x (between 2020 and 2030) 𝐸𝐸𝐸𝐸𝐸𝐸,𝑥𝑥 … Reduction of energy demand in year n at the level of region x compared to 2005
𝐺𝐺𝐺𝐺𝐺𝐺𝐸𝐸,𝑥𝑥 … GDP in year n at the level of region x
𝑐𝑐𝑐𝑐𝑐𝑐𝑐𝑐𝑐𝑐𝑐𝑐𝐸𝐸,𝑥𝑥 … Population in year n at the level of region x
As a next step (step 2), the aggregated effort (at EnC level) needs to be broken down to national enti-ties. In line with the two options that can be used to determine the overall ambition level, we propose to apply the same methodologies for defining EE benchmarks for the efforts to be taken by individual CPs.
Interim Report - Study on 2030 overall targets for the Energy Community
Page 10
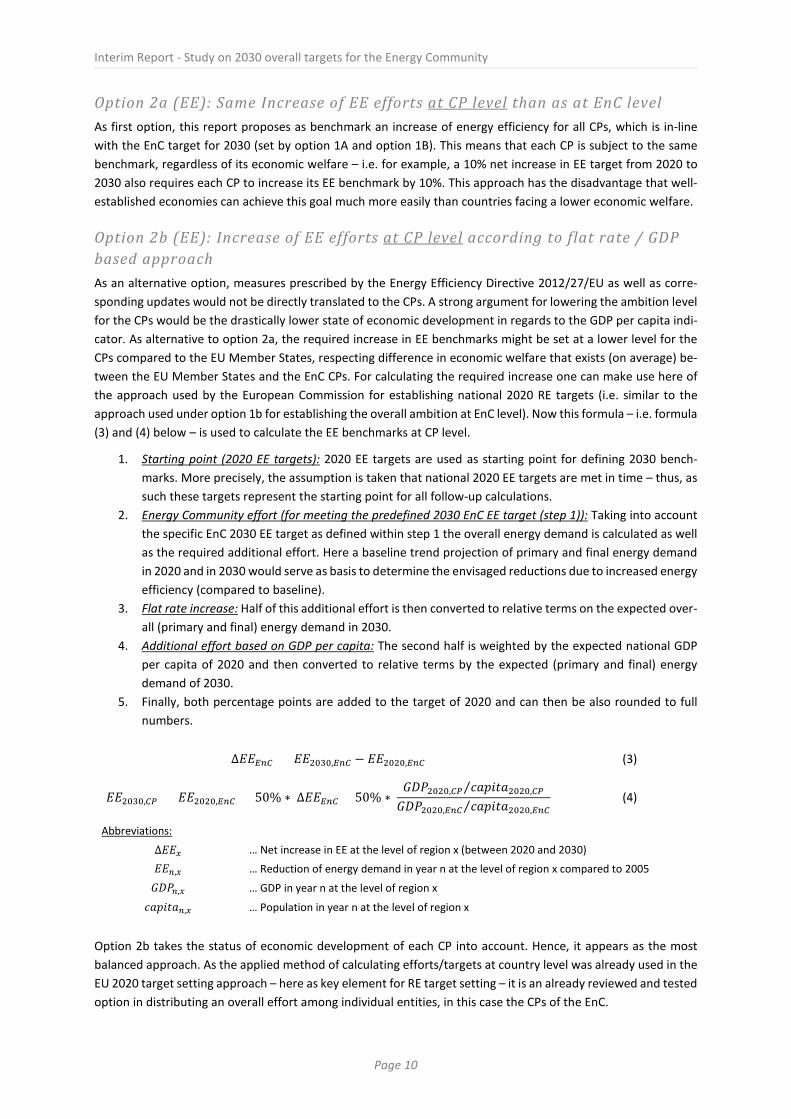
Option 2a (EE): Same Increase of EE efforts at CP level than as at EnC level As first option, this report proposes as benchmark an increase of energy efficiency for all CPs, which is in-line with the EnC target for 2030 (set by option 1A and option 1B). This means that each CP is subject to the same benchmark, regardless of its economic welfare – i.e. for example, a 10% net increase in EE target from 2020 to 2030 also requires each CP to increase its EE benchmark by 10%. This approach has the disadvantage that well-established economies can achieve this goal much more easily than countries facing a lower economic welfare.
Option 2b (EE): Increase of EE efforts at CP level according to flat rate / GDP based approach As an alternative option, measures prescribed by the Energy Efficiency Directive 2012/27/EU as well as corre-sponding updates would not be directly translated to the CPs. A strong argument for lowering the ambition level for the CPs would be the drastically lower state of economic development in regards to the GDP per capita indi-cator. As alternative to option 2a, the required increase in EE benchmarks might be set at a lower level for the CPs compared to the EU Member States, respecting difference in economic welfare that exists (on average) be-tween the EU Member States and the EnC CPs. For calculating the required increase one can make use here of the approach used by the European Commission for establishing national 2020 RE targets (i.e. similar to the approach used under option 1b for establishing the overall ambition at EnC level). Now this formula – i.e. formula (3) and (4) below – is used to calculate the EE benchmarks at CP level.
1. Starting point (2020 EE targets): 2020 EE targets are used as starting point for defining 2030 bench-marks. More precisely, the assumption is taken that national 2020 EE targets are met in time – thus, as such these targets represent the starting point for all follow-up calculations.
2. Energy Community effort (for meeting the predefined 2030 EnC EE target (step 1)): Taking into account the specific EnC 2030 EE target as defined within step 1 the overall energy demand is calculated as well as the required additional effort. Here a baseline trend projection of primary and final energy demand in 2020 and in 2030 would serve as basis to determine the envisaged reductions due to increased energy efficiency (compared to baseline).
3. Flat rate increase: Half of this additional effort is then converted to relative terms on the expected over-all (primary and final) energy demand in 2030.
4. Additional effort based on GDP per capita: The second half is weighted by the expected national GDP per capita of 2020 and then converted to relative terms by the expected (primary and final) energy demand of 2030.
5. Finally, both percentage points are added to the target of 2020 and can then be also rounded to full numbers.
∆𝐸𝐸𝐸𝐸𝐸𝐸𝐸𝐸𝐸𝐸 = 𝐸𝐸𝐸𝐸2030,𝐸𝐸𝐸𝐸𝐸𝐸 − 𝐸𝐸𝐸𝐸2020,𝐸𝐸𝐸𝐸𝐸𝐸 (3)
𝐸𝐸𝐸𝐸2030,𝐸𝐸𝐶𝐶 = 𝐸𝐸𝐸𝐸2020,𝐸𝐸𝐸𝐸𝐸𝐸 + 50% ∗ ∆𝐸𝐸𝐸𝐸𝐸𝐸𝐸𝐸𝐸𝐸 + 50% ∗ 𝐺𝐺𝐺𝐺𝐺𝐺2020,𝐸𝐸𝐶𝐶 𝑐𝑐𝑐𝑐𝑐𝑐𝑐𝑐𝑐𝑐𝑐𝑐2020,𝐸𝐸𝐶𝐶⁄𝐺𝐺𝐺𝐺𝐺𝐺2020,𝐸𝐸𝐸𝐸𝐸𝐸 𝑐𝑐𝑐𝑐𝑐𝑐𝑐𝑐𝑐𝑐𝑐𝑐2020,𝐸𝐸𝐸𝐸𝐸𝐸⁄ (4)
Abbreviations:
∆𝐸𝐸𝐸𝐸𝑥𝑥 … Net increase in EE at the level of region x (between 2020 and 2030) 𝐸𝐸𝐸𝐸𝐸𝐸,𝑥𝑥 … Reduction of energy demand in year n at the level of region x compared to 2005
𝐺𝐺𝐺𝐺𝐺𝐺𝐸𝐸,𝑥𝑥 … GDP in year n at the level of region x
𝑐𝑐𝑐𝑐𝑐𝑐𝑐𝑐𝑐𝑐𝑐𝑐𝐸𝐸,𝑥𝑥 … Population in year n at the level of region x
Option 2b takes the status of economic development of each CP into account. Hence, it appears as the most balanced approach. As the applied method of calculating efforts/targets at country level was already used in the EU 2020 target setting approach – here as key element for RE target setting – it is an already reviewed and tested option in distributing an overall effort among individual entities, in this case the CPs of the EnC.
Interim Report - Study on 2030 overall targets for the Energy Community
Page 11
2.3 Data needs The amount of data required for calculating EE targets was already reviewed in detail by the project consortium. Most fundamental data sets are explained in the following:
• Baseline/Reference trends concerning future energy demand by 2020 and 2030 are of key relevance. Here PRIMES modelling will serve as key data source. Thus, for several CPs a reference scenario has been modelled by PRIMES in the year 2012. The derived results represent a comprehensive dataset to envisage a “business-as-usual” scenario for all CPs except Ukraine, Moldova and Georgia.
• For those CPs not assessed by PRIMES, basic assumptions will have to be taken concerning future energy demand developments. Next to energy trends, also general economic trends appear indispensable, e.g. trends concerning economic development or population. Within the EU process commonly used EURO-STAT scenarios on population growth will be taken into consideration, in order to incorporate such trends at CP level for 2030 EE target setting.
• Alternatively, the expected energy consumption of individual CPs in the year 2020 can be taken also from recently published NEEAPs.
Interim Report - Study on 2030 overall targets for the Energy Community
Page 12
3 Methodology for 2030 targets on Renewable Energies
3.1 Approach taken at EU/EnC level
2020 RE target setting
EU level
2020 RE targets have been established at the level of the European Union and its Member States by Directive 2009/28/EC (EU, 2009a) on the promotion of the use of energy from renewable sources, subsequently named as RE Directive, officially published on 23 April 2009. The overall EU target of achieving a share of 20% RE by 2020 refers to gross final energy consumption, which in contrast to the commonly applied statistical definition of final energy includes electricity and heat distribution and transmission losses as well as own consumption of the en-ergy branch.
Following the RE Directive the EU target is allocated to differentiated binding national targets based on a flat rate / GDP-based approach. The calculation of the 2020 RE targets for each Member State was based on three main elements:
• base year 2005 for the calculation of the initial share of renewable energies; • half of the overall effort to move from 9% RE in 2005 to 20% RE by 2020 is distributed equally across all
MSs, implying a flat-rate increase of 5.5%; and • the additional residual effort is distributed across MSs based on their relative GDP per capita;
Additionally, first mover bonuses are considered for certain MSs proactive in establishing RE markets in prior to the base year, and caps have been taken into account for Latvia and Sweden, facing a substantially higher 2020 RES target than other MSs.
All three energy sectors are affected by RE: electricity, heating & cooling and transport. The decision on the mix of contributions from these sectors to reach their binding national targets is left to the MSs. Additionally, for renewables in the transport sector an own target has been established, aiming for a minimum share of 10% of renewable energies in transport fuel demand. The target for RE in transport has been set at the same level for each Member State in order to ensure consistency in transport fuel specifications and availability, expecting that Member States which do not have the relevant resources to produce biofuels will be able to obtain renewable transport fuels from elsewhere.
Additionally, sufficient flexibility is intended to be ensured for MSs to implement the RE Directive in the way that best suits their particular national circumstances. Consequently, this comprises that MSs are free to decide on appropriate domestic RE support, choosing the means that best suits their national circumstances. Moreover, as national targets are defined in a way that does not explicitly reflect the national resource availability, the RE Directive provides an option for MSs of achieving their targets by supporting the development of renewable energies in other MSs as well as third countries.
EnC level
In December 2008, after the (practical) adoption of the RE Directive within the European Union, the EnC “Minis-terial Council welcomed the proposal of the European Commission to launch a study on the impact and modali-ties of a possible inclusion of this future directive in the Energy Community Treaty and to set up a Renewable Energy Task Force” (Conclusion no. 5, MC meeting in Tirana, December 2008).
Interim Report - Study on 2030 overall targets for the Energy Community
Page 13
The calculation of RE targets for the Contracting Parties was made to ensure that all parties jointly using the cooperation mechanisms have ambitious targets that will generate new renewable energy capacities in the Con-tracting Parties (“same level of ambition” principle) and convergent with EU's target to reach at least a 20% share of renewable energy in 2020.
When the process started in 2009, the most contentious issue was the lack of accuracy and reliability of biomass consumption data in 2005 official energy statistics. Therefore, a biomass consumption survey study was per-formed for the years 2010 and 2011 and the 2009 energy balances were revised accordingly for the purpose of calculating the 2020 RE targets.
The calculation of the 2020 RE targets for each Contracting Party (a target at Energy Community level was not envisaged) was based on the same three main elements as done at EU level:
• establishment of a base year – here in contrast to the EU 2009 (instead of 2005 as used at EU level) was chosen as base year;
• a flat-rate increase of 5.5% consistent with the effort of EU MSs; and • the additional residual effort by Contracting Party was determined based on the relative GDP per capita;
Furthermore, a trajectory-based reduction accounting for the change of the base year from 2005 to 2009, as-suming that Contracting Parties would have made the same progress as applicable at EU level during this period, leading to a -15.65% reduction of the total additional effort.
The consultant engaged developed gross final energy consumption (GFEC) projections to 2020 taking into ac-count an efficiency factor based on the decrease of the energy intensity of the CPs economies.
Based on these calculations, in 2012, the Ministerial Council amended and adopted the RE Directive 2009/28/EC to be implemented in the Energy Community and the CPs agreed on binding 2020 targets concerning the share of renewable energy sources in gross final energy consumption.
The sum of RE targets, set out for CPs, leads to an overall 15% RE share to be reached at Energy Community level by 2020, starting from a 9% RE share in 2009. This is significantly lower than the 20% RE target the EU aims to in 2020, mainly due to the large-scale impact of the Ukrainian energy sector in the overall energy mix of the EnC.
Other important aspects related to 2020 RE targets at EnC level are that during previous years, several CPs have conducted biomass consumption surveys that resulted in changes in official energy statistical data affecting the baseline renewable energy share in 2009 and the following years and overreaching the 2020 RE targets without additional effort. In contrast to above, FYR of Macedonia conducted a biomass consumption survey that resulted in a lower RE share in 2009 (17.7%) compared with the one used for the 2020 target calculation (21.9%). Ukraine has not conducted yet biomass consumption surveys and despite investment in new renewable energy capaci-ties, the RE share is significantly below the trajectory.
Since Georgia became a CP of the Energy Community in 2017 and due to the lack of reliable energy statistics on biomass consumption as well as due to the short period of time to 2020, a binding target to 2020 for Georgia was not proposed for adoption to the Ministerial Council.
Following the revision of biomass data and their incorporation into energy statistics, a 2030 target calculation that is consistent with the EU objective appears useful.
2030 RE target setting On 30 November 2016 the European Commission published a package of proposals for legislative measures for the time horizon from 2020 to 2030 called “Clean Energy for all Europeans” commonly referred to as the winter package. It aims at further promoting the clean energy transition while developing the internal market for elec-tricity and thus fostering the Energy Union.
Concerning renewable energies this package includes a proposal for a recast of the (2020) RE Directive (COM(2016) 767 final/2). The recast aims at establishing a stable framework for the promotion of energy from
Interim Report - Study on 2030 overall targets for the Energy Community
Page 14
renewable energy sources and mainly includes an EU-wide binding target of 27% RE share in gross final consump-tion by 2030. Such a share in turn translates into a share of roughly 45-50% of renewables in the electricity sector and, together with the energy efficiency targets to a minimum reduction in GHG of 40% compared to 1990. Unlike for the 2020 energy and climate targets, the recast does not include a breakdown of the EU-wide target into binding national targets. This may hamper target achievement for the EU as a whole as MSs cannot directly be held responsible for target achievement. Instead, the new governance directive (COM(2016) 861 final/2) shall provide adequate measures to ensure that the European bloc hits its targets. MSs are supposed to commit them-selves through free pledging, stipulated in “integrated national energy and climate plans (INECPS)”. While MSs dispose of considerable legislative scope in designing policies to achieve their national pledges, falling below the binding 2020 targets shall be directly sanctioned with penalty payments into a fund.
At this point (as of November 2017), no agreement has been taken on the exact approach to be used for an effort sharing, nor on the binding character of MS pledges. The impact assessment for the proposed RED (SWD (2016) 410 final) discusses however options how ambition or delivery gaps can be avoided. Moreover, a subsection about the disregarded option “Introduce binding national targets” includes a table presenting 2030 renewable shares per MS under various criteria. The table further shows RE shares for 2030 that would result if the former RED effort sharing method (i.e. the flat rate / GDP-based approach) were applied. It also presents an alternative method including a 25% land area share. While no document in the winter package presents the actual calcula-tion method for the land area, it appears to be targeted at taking into account MS specific RE potentials (potential based approach). These two effort-sharing methods lead to significant differences in the required additional RE shares for the 2020-2030 period.
3.2 Proposed options for target setting
As starting point (step 1) for establishing a methodology for 2030 RE target setting we take a closer look at the overall Energy Community and elaborate on the ambition level concerning future RE deployment. Two different approaches appear suitable to determine the ambition in increasing the deployment of renewable en-ergies at Energy Community level:
Option 1a (RE): Same increase of RE share at EnC and at EU level On the one hand, overall RE effort may be fully aligned to the European Union. At EU level, according to previous agreements taken at the European Council (cf. EUCO 169/14) it is planned to increase the RE share from 20% by 2020 to (at least) 27% by 2030. This corresponds to a net increase by 7 percentage points at EU level. Conse-quently, if the same ambition would be followed at EnC level, an increase of the RE share at EnC level from 15% by 2020 (i.e. the expected RE share at EnC level if all CPs would reach their binding 2020 RE targets) to 22% by 2030.
Option 1b (RE): Increase of RE share at EnC level according to flat rate / GDP based approach As alternative to above, the required increase in renewables energies might be set at a lower level compared to the EU, respecting difference in economic welfare that exists (on average) between the EU and the EnC. For calculating the required increase one can make use here of the approach used by the European Commission for establishing national 2020 RE targets. As outlined above (cf. section 3.1) a flat rate / GDP based approach was used to calculate the binding national 2020 RE targets of the RE Directive (2009/28/EC).
The detailed approach that can be used to calculate 2030 RE targets at EnC level (and possibly later on also at CP level) can be described as follows:
1. Starting point (2020 RE deployment): Binding 2020 RE targets are used as starting point for defining 2030 targets. More precisely, the assumption is taken that binding national 2020 RE targets are met in
Interim Report - Study on 2030 overall targets for the Energy Community
Page 15
time – thus, as such these targets represent the starting point (i.e. the expected status of RE deployment by 2020) for all follow-up calculations. For the EU this translates into 20% RE by 2020 whereas at EnC level a RE share of 15% can be expected by 2020 if all CPs meet their 2020 RE target in time.
2. Flat rate increase: Following the logic used for 2020 RE target calculation a flat rate increase needs to be considered that corresponds to half of the additional effort required at EU level. Since the RE share has to increase at EU level from 20% by 2020 to 27% by 2030 this would correspond to a net increase of the RE share by 3.5 percentage points, leading to a RE share of 18.5% at EnC level.
3. Additional effort based on GDP per capita: The required additional increase of renewable energies at EnC level would then consider differences in GDP per capita between the EnC and the EU. In practical terms this would mean to calculate the additional RE increase at EnC level according to formula 2 below. Thus, we take half of the additional effort required at EU level as starting point and weight this with GDP per capita at the level of both aggregates (EnC vs. EU).
4. Finally, both percentage point increases are added to the target of 2020 and, if necessary, they can then be rounded to full numbers.
∆𝑅𝑅𝐸𝐸𝐸𝐸𝐸𝐸 = 𝑅𝑅𝐸𝐸2030,𝐸𝐸𝐸𝐸 − 𝑅𝑅𝐸𝐸2020,𝐸𝐸𝐸𝐸 (1)
𝑅𝑅𝐸𝐸2030,𝐸𝐸𝐸𝐸𝐸𝐸 = 𝑅𝑅𝐸𝐸2020,𝐸𝐸𝐸𝐸𝐸𝐸 + 50% ∗ ∆𝑅𝑅𝐸𝐸𝐸𝐸𝐸𝐸 + 50% ∗ 𝐺𝐺𝐺𝐺𝐺𝐺2020,𝐸𝐸𝐸𝐸𝐸𝐸 𝑐𝑐𝑐𝑐𝑐𝑐𝑐𝑐𝑐𝑐𝑐𝑐2020,𝐸𝐸𝐸𝐸𝐸𝐸⁄𝐺𝐺𝐺𝐺𝐺𝐺2020,𝐸𝐸𝐸𝐸 𝑐𝑐𝑐𝑐𝑐𝑐𝑐𝑐𝑐𝑐𝑐𝑐2020,𝐸𝐸𝐸𝐸⁄ (2)
Abbreviations:
∆𝑅𝑅𝐸𝐸𝑥𝑥 … Net increase in RE share at the level of region x (between 2020 and 2030) 𝑅𝑅𝐸𝐸𝐸𝐸,𝑥𝑥 … RE share in year n at the level of region x
𝐺𝐺𝐺𝐺𝐺𝐺𝐸𝐸,𝑥𝑥 … GDP in year n at the level of region x
𝑐𝑐𝑐𝑐𝑐𝑐𝑐𝑐𝑐𝑐𝑐𝑐𝐸𝐸,𝑥𝑥 … Population in year n at the level of region x
As a next step (step 2), the aggregated effort (at EnC level) needs to be broken down to national enti-ties. Here we propose to make use of one of the benchmarking options for 2030 as published by the European
Commission within the “Clean Energy for all Europeans” winter package, containing proposals for Directives in
the field of energy and climate policy. More precisely, the impact assessment for the proposed recast of the RE
Directive (SWD (2016) 410 final) discusses several options how ambition or delivery gaps can be avoided. A sub-
section about the disregarded option “Introduce binding national targets” includes however a table (cf. page 172
of the IA (SWD (2016) 410 final)) presenting 2030 renewable shares per Member State under various criteria. It
contains RE shares for 2030 that would result if the former RE Directive effort-sharing method (i.e. the 2020 RE
target allocation based on the flat rate / GDP based approach) were applied. Finally, it presents an alternative
method including a 25% land area share in addition to a flat rate increase (that deserves 50% weight) and the
GDP per capita correlation (with another 25% weighting). While no document in the winter package presents the
actual calculation method for the land area, it appears to be targeted at taking into account MS specific RE po-
tentials (potential-based approach). These two effort sharing methods lead to significant differences in the re-
quired additional RE shares for the 2020-2030 period at MS level, and the potential-based approach defines a
high ambition for countries characterised by low population density. Below we introduce the default flat rate /
GDP based approach to break the overall RE effort at EnC level down to national entities conceptually. Addition-
ally, as default option a flat rate approach is introduced, meaning that under that approach all CPs have to in-
crease their RE targets for 2020 by the same percentage points – similar to the overall net increase at EnC level.
Thus, proposed options for breaking down the overall effort to individual CPs are:
Interim Report - Study on 2030 overall targets for the Energy Community
Page 16
Option 2a (RE): Same increase of RE share at CP level as applied at EnC level (flat rate approach) The simplest way to break down the overall RE effort as determined within step 1 at EnC level is to follow a flat rate approach. This means in practical terms that all CPs have to increase their 2020 RE target by the same per-centage points – if for example at EnC level it has been decided to increase the RE share from 15% in 2020 to 22% by 2030 all CPs have to increase their individual 2020 RE targets also by 7 percentage points.
Following such an approach appears simple and straightforward but criticism may however arise that differences between the CPs in economic wealth are ignored. Thus, this may be seen as useful if costs related to the required RE uptake are small in magnitude or if strong positive economic co-effects that come along with RE development outweigh by far any cost.
Option 2b (RE): Increase of RE share at CP level according to flat rate / GDP based approach As outlined above (cf. section 3.1) a flat rate / GDP based approach was used to calculate the binding national 2020 RE targets of the RE Directive (2009/28/EC). If we make use of that approach for defining 2030 RE bench-marks at CP level to distribute the overall RE effort the following procedure can be applied:
1. Starting point (2020 RE deployment): Binding 2020 RE targets are used as starting point for defining 2030 targets. More precisely, the assumption is taken that binding national 2020 RE targets are met in time – thus, as such these targets represent the starting point (i.e. the expected status of RE deployment by 2020) for all follow-up calculations.
2. Energy Community effort (for meeting the predefined 2030 EnC RE target (step 1)): Taking into account the specific EnC 2030 RE target as defined within step 1 the overall required RE deployment in energetic terms is calculated as well as the required additional effort. Here 2020 and 2030 forecasts of energy demand trends have to be taken into consideration – according to the 2020 EU approach a reference trend appears useful in this respect.
3. Flat rate increase: Half of this additional effort is then converted to relative terms on the expected over-all gross final energy demand in 2030.
4. Additional effort based on GDP per capita: The second half is weighted by the expected national GDP per capita of 2020 and then converted to relative terms by the expected gross final energy demand of 2030.
5. Finally, both percentage points are added to the target of 2020 and then rounded to full numbers.
Thus, as such this approach considers the CP’s economic strength in terms of GDP as well as efforts made in the past. On the other hand, the approach ignores other aspects such as the potential availability of renewable re-sources and related costs. As opposed to the 2020 RE target setting, no first mover bonuses appear useful to consider: Since there is a legally binding support framework in place in the period prior 2020, first mover bonuses are deemed to be unfair. Neither we suggest to include any caps on overall RE shares (as used for MSs with comparatively high RE shares in the 2020 context).
3.3 Data needs Data that is needed for the practical calculation of RE targets/benchmarks in the 2030 context for the EnC will be listed within this section. Thus, a brief list of data inputs includes:
• A reliable statistical basis concerning the status quo (e.g. as of 2015) of energy supply and demand in general terms, and in particular of the role renewable energies play therein, is generally required. This appears simple and straightforward for the majority of CPs since Eurostat does already provide such information at present. For certain CPs, for example Georgia, Moldova and the Ukraine, data quality

Interim Report - Study on 2030 overall targets for the Energy Community
Page 17
and reliability appears still problematic from today’s perspective. Data on the status quo (e.g. as of 2015 etc.) is generally less important if 2020 RE targets are already set. For Georgia where not 2020 target is and will be established this information represents however a key necessity.
• Other key input parameter for the proposed target setting approaches in the field of renewable energies comprises trend forecasts for 2020 and 2030. This involves in particular general parameter like popula-tion and GDP, apart from these also 2030 reference trends concerning (gross) final energy demand are required if for example the 2020 approach concerning RE effort sharing shall be repeated (flat rate / GDP based approach). For countries where such energy scenarios – i.e. the PRIMES reference scenario – are not available a simple proxy based on similarities to neighbouring CPs may serve as alternative.
Interim Report - Study on 2030 overall targets for the Energy Community
Page 18
4 Methodology for 2030 targets on Greenhouse Gas Emission Reduction
4.1 Approach taken at EU level There have been several stages in sharing emission reductions targets across the EU and its Member States. The first effort sharing for the 2008-2012 period emerged from political agreements of Member States. The second and third effort sharing for 2013-2020 and 2021-2030 were based on modelling and GDP related formulas which are briefly described below (EC, 2009, EC 2016c). Both, 2020 and 2030 target setting methodologies are consid-ered because CPs did so far not underlie emission reduction targets and are still affected by economic recession. Therefore, CPs may not be able to adopt 2030 targets with the same ambition as EU Member States.
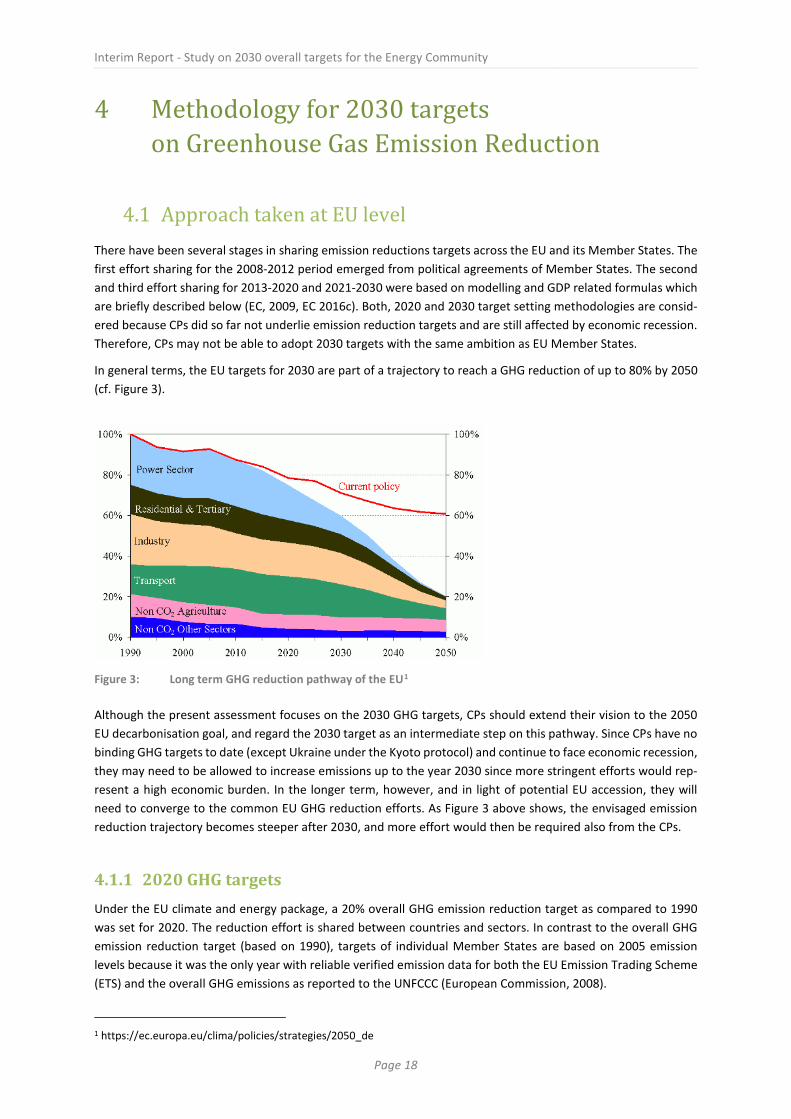
In general terms, the EU targets for 2030 are part of a trajectory to reach a GHG reduction of up to 80% by 2050 (cf. Figure 3).
Figure 3: Long term GHG reduction pathway of the EU1
Although the present assessment focuses on the 2030 GHG targets, CPs should extend their vision to the 2050 EU decarbonisation goal, and regard the 2030 target as an intermediate step on this pathway. Since CPs have no binding GHG targets to date (except Ukraine under the Kyoto protocol) and continue to face economic recession, they may need to be allowed to increase emissions up to the year 2030 since more stringent efforts would rep-resent a high economic burden. In the longer term, however, and in light of potential EU accession, they will need to converge to the common EU GHG reduction efforts. As Figure 3 above shows, the envisaged emission reduction trajectory becomes steeper after 2030, and more effort would then be required also from the CPs.
4.1.1 2020 GHG targets Under the EU climate and energy package, a 20% overall GHG emission reduction target as compared to 1990 was set for 2020. The reduction effort is shared between countries and sectors. In contrast to the overall GHG emission reduction target (based on 1990), targets of individual Member States are based on 2005 emission levels because it was the only year with reliable verified emission data for both the EU Emission Trading Scheme (ETS) and the overall GHG emissions as reported to the UNFCCC (European Commission, 2008).
1 https://ec.europa.eu/clima/policies/strategies/2050_de
Interim Report - Study on 2030 overall targets for the Energy Community
Page 19
In general, the sectoral breakdown was carried out as follows:
• Emissions not covered under the European ETS – i.e. the so called Non-ETS sectors, including housing, transport (w/o aviation), agriculture and waste – have to be reduced by 10% on average below 2005 levels by 2020;
• Emissions related to sectors covered by the EU ETS (i.e. large-scale power and energy intensive industry facilities, aviation) have to fall 21% below 2005 levels by 2020.
The split between the non-ETS and ETS sectors was done in a way to minimize costs according to the cost-efficient reference option described in the Commission Staff Working Document SEC(2008) 85.2 Because emission reduc-tions in the ETS sectors had a higher cost efficient potential as compared to the Non-ETS sectors, a higher share of total reductions was attributed to the ETS. Combining the ETS target and national non-ETS targets results in an overall EU wide target of a 14% GHG emission reduction as compared to 2005 (equivalent to the above stated 20% reduction compared to 1990). The timeframe for target achievement was set for 2013-2020.
Non-ETS sector -10% compared to 2005 levels
Emission reduction targets for the non-ETS sector are regulated under the EU Effort Sharing Decision (ESD, Deci-sion No 406/2009/EC). Under this regulation six greenhouse gases are covered: carbon dioxide (CO2), methane (CH4), nitrous oxide (N2O), hydrofluorocarbons (HFCs), perfluorocarbons (PFCs) and sulphur hexafluoride (SF6). The non-ETS sectors cover emissions from housing, transport (except aviation), agriculture and waste. Emissions from land-use, land-use change and forestry (LULUCF) are excluded.
The overall non-ETS emission target is shared between Member States. Individual targets range from -20% to +20%. 2005 GDP per capita was used as the main benchmark for national target setting, which means that the reduction profiles of Member States (in %) were determined as a function of their GDP per capita (see Annex II). Member States with a GDP per capita above the EU average were obliged to reduce non-ETS emissions more than EU average, those with a GDP per capita below the EU average are obliged to limit non-ETS emissions to an extent below the EU average reduction. In some cases individual Member States with a very low GDP per capita and thus a strong need for economic growth in a longer term even gained the permission to increase emissions. However, allowed emission increases are capped (maximum of +20% compared to 2005 levels for the lowest income country) but still represent an emission reduction effort compared to 1990. At the other end emission reductions were capped with a maximum of -20% for the wealthiest country. The emission targets of the other Member States were set according to relative position of their GDP per capita using a function between the EU average and the minimum and maximum reductions. On average, the EU reduction target yields of -10% reduc-tions compared to 2005 levels for the non-ETS sectors.
In order to meet their emission targets, each Member State committed to binding annual GHG emission limits (capped by the annual emission allocations, AEAs) following a linear path from 2013 to 2020. In Member States required to reduce their GHG emissions by 2020, 2013 emissions were not allowed to exceed the average annual emissions of the 2008-2010 period. In Member States that must keep emission growth within a boundary , 2013 emission were not allowed to exceed the level arising from a linear path calculated from 2009 to 2020 (business as usual scenario).
To ensure a fair and cost-effective achievement of annual GHG levels, the effort sharing decision provides various flexibilities:
• Up to 5% of AEAs are allowed to be traded between Member States (buying and selling) • Until 2019 Member States are allowed to access up to 5% of AEAs allocated to the subsequent year in
advance (borrowing)
2 SEC(2008) 85, COMMISSION STAFF WORKING DOCUMENT, IMPACT ASSESSMENT Document accompanying the Package of Implementation measures for the EU's objectives on climate change and renewable energy for 2020
Interim Report - Study on 2030 overall targets for the Energy Community
Page 20
• When annual emissions are lower than binding annual GHG emission limits, Member States are allowed to use any surplus in later years (banking)
• In 2013-2014 Member States can apply for a 5% increase in AEAs for increased emissions resulting from extreme weather conditions
• Member States may use credits from project activities undertaken in countries outside the EU (Kyoto protocol mechanisms CDM & JI). Generally, these credits are not allowed to exceed 3% of Member States GHG emissions in 2005. For certain Member States this percentage is increased by 1% for projects carried out in least developed countries and small island developing states.
ETS sector In the third phase of the EU ETS applying to the period 2013-2020, an overall EU ETS target replaced national target settings. Three greenhouse gases are covered: carbon dioxide (CO2), nitrous oxide (N20) and perfluorocar-bons (PFCs).
The EU ETS thus sets an overall cap on the total amount of GHG emissions from all installations covered by the system (more than 11,000 heavy energy-using power and industry facilities & airlines). Each year, the cap is reduced by 1.75% representing an emission reduction of approx. 21% by 2020 compared to 2005. Thereby, about 60% of the EU’s emission reductions are to be achieved within the EU ETS. 3
Generally, emission allowances are allocated by auctioning and can be traded between covered installations. CO2 emissions from aviation have been included in the EU ETS since 2012.
4.1.2 2030 GHG targets For 2030, a 40% GHG emission reduction target as compared to 1990 was set. Using 2005 as a base year, 30% need to be reduced in the non-ETS sectors and 43% in the ETS sectors. The timeline for target achievement is 2021-2030.
Non-ETS sectors -30% compared to 2005 levels
Limits for emissions from the non-ETS sectors in the period 2021-2030 are regulated by the Effort Sharing Regu-lation (ESR, currently published as proposal). The ESR covers the same sectors as the ESD, but the greenhouse gas nitrogen trifluoride (NF3) is included in addition.
Generally, to calculate effort sharing targets, the ESR uses the same methodology as the ESD. Differentiation in efforts is based on relative differences of the respective GDP per capita of Member States. However, the meth-odology has been expanded, and benchmark values and limits were adjusted.
First, GDPs per capita of 2013 are used for target calculation and the EU average target changes from -20% to -30%.
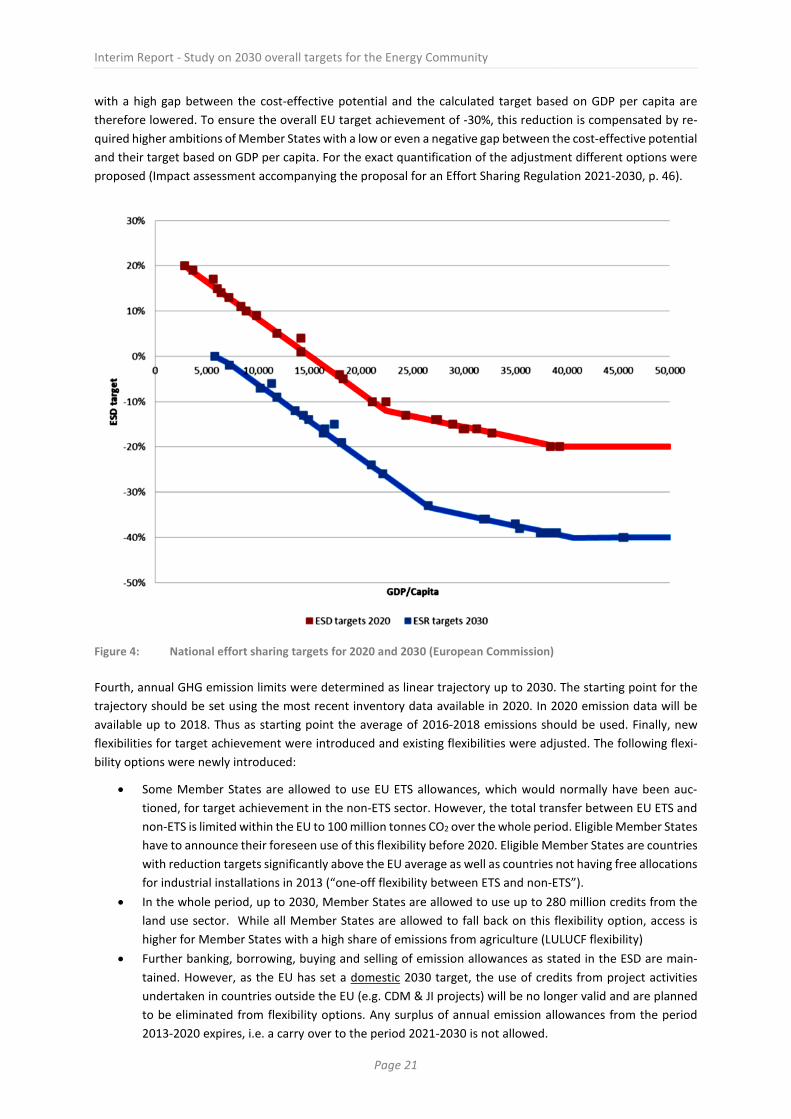
Second, the upper and lower emission limits are set at 0% and -40% compared to 2005 levels (instead of the range +20% to -20% in the period 2013-2020). Thus, the ESR bans further emission increases for all Member States (see Figure 4 for comparison with the 2020 targets).
Third, in order to reflect cost-effectiveness for all Member States, adjustments to targets for high income Mem-ber States (Member States with a GDP per capita above the EU average) are made. For high income Member States, a target setting based on GDP per capita solely results in reduction requirements exceeding their cost-effective reduction potential. This gap between the cost-effective and the more ambitious target varies quite significantly between high-income Member States (from -5% to +30%). Required ambitions for Member States 3 SEC(2008) 85, COMMISSION STAFF WORKING DOCUMENT, IMPACT ASSESSMENT Document accompanying the Package of Implementation measures for the EU's objectives on climate change and renewable energy for 2020
Interim Report - Study on 2030 overall targets for the Energy Community
Page 21
with a high gap between the cost-effective potential and the calculated target based on GDP per capita are therefore lowered. To ensure the overall EU target achievement of -30%, this reduction is compensated by re-quired higher ambitions of Member States with a low or even a negative gap between the cost-effective potential and their target based on GDP per capita. For the exact quantification of the adjustment different options were proposed (Impact assessment accompanying the proposal for an Effort Sharing Regulation 2021-2030, p. 46).
Figure 4: National effort sharing targets for 2020 and 2030 (European Commission)
Fourth, annual GHG emission limits were determined as linear trajectory up to 2030. The starting point for the trajectory should be set using the most recent inventory data available in 2020. In 2020 emission data will be available up to 2018. Thus as starting point the average of 2016-2018 emissions should be used. Finally, new flexibilities for target achievement were introduced and existing flexibilities were adjusted. The following flexi-bility options were newly introduced:
• Some Member States are allowed to use EU ETS allowances, which would normally have been auc-tioned, for target achievement in the non-ETS sector. However, the total transfer between EU ETS and non-ETS is limited within the EU to 100 million tonnes CO2 over the whole period. Eligible Member States have to announce their foreseen use of this flexibility before 2020. Eligible Member States are countries with reduction targets significantly above the EU average as well as countries not having free allocations for industrial installations in 2013 (“one-off flexibility between ETS and non-ETS”).
• In the whole period, up to 2030, Member States are allowed to use up to 280 million credits from the land use sector. While all Member States are allowed to fall back on this flexibility option, access is higher for Member States with a high share of emissions from agriculture (LULUCF flexibility)
• Further banking, borrowing, buying and selling of emission allowances as stated in the ESD are main-tained. However, as the EU has set a domestic 2030 target, the use of credits from project activities undertaken in countries outside the EU (e.g. CDM & JI projects) will be no longer valid and are planned to be eliminated from flexibility options. Any surplus of annual emission allowances from the period 2013-2020 expires, i.e. a carry over to the period 2021-2030 is not allowed.
Interim Report - Study on 2030 overall targets for the Energy Community
Page 22
ETS sectors From 2021 to 2030 the yearly amount of emission allowance will decrease by 2.2%, this is more than the 1.74% up to 2020. This corresponds to a reduction of 556 million tonnes of CO2-equivalent emissions in the ETS sectors over the period.
The proposal further develops some rules to address the risk of carbon leakage. This includes free allocation to focus on the sectors at highest risk of relocating their production outside the European Union.
Croatia’s EU accession and the EU effort sharing
Croatia joined the European Union in 2013. Croatia’s Accession Treaty stipulates that the Effort Sharing Decision (ESD) shall be amended to include Croatia’s target. Croatia can increase its emissions not covered by the EU ETS by 11% compared to 2005 by 2020. For the ETS sectors defined in Article 9 of the EU ETS directive, it was laid down that "The Community-wide quantity of allowances will be increased as a result of Croatia's accession only by the quantity of allowances that Croatia shall auction pursuant to Article 10(1)."
4.2 Proposed options for GHG target setting This section first provides an overview of climate policy developments in the region and then outline policy op-tions for the GHG target setting of the CPs. Data requirements, limitations and advantages of the proposed meth-odologies will be introduced.
4.2.1 Climate Policy development in the region All CPs except Kosovo* are parties to the United Nations Framework Convention on Climate Change (UNFCCC) and all CPs except Ukraine were non-Annex-I countries to the UNFCCC without binding emission reduction obli-gations under the Kyoto Protocol. In contrast Croatia already had an internationally binding target under the Kyoto Protocol (as Annex-I party) before entering the European Union in 2013. Annex-I countries had binding rules for emissions accounting including the more complex emission sources (and sinks) in land-use, land-use-change and forestry. UN compliant GHG inventories made it easier for Annex-I countries to trade emission re-duction units among themselves either on a governmental or project basis and enabled an easier inclusion of Croatia under the ESD.
As non–Annex-I countries, during the Kyoto Protocol period the CPs could generate and sell credits under the Clean Development Mechanism (CDM), one of the flexibility mechanisms defined in the Kyoto Protocol. The so called Emission Reduction Units generated under the CDM could be traded and used for Annex-I country target achievement. Several of the West Balkan countries have implemented projects under the CDM which provided for some project-based accounting experience. No new CDM projects are being developed in the CPs.
Following the Paris agreement, CPs (except Kosovo*) have submitted Intended Nationally Determined Contribu-tions (INDCs) including voluntary emission reduction targets for 2030. Parties to the Paris agreement also agreed to a facilitative dialogue in 2018 to review collective efforts and progress in relation to the goals of the Paris Agreement.
4.2.2 Elements of GHG target setting The major elements of the target setting and measurement methodology concern the following areas:
• Definition of an overall, regional emission reduction target • How to set potential national (overall or non-ETS) targets (including e.g. the selection of the base year,
consideration of GDP)
Interim Report - Study on 2030 overall targets for the Energy Community
Page 23
• The possible split between the ETS and non-ETS sectors (methodology, feasibility, in particular regarding the absence of an ETS)
• Achievement of national targets: Potential pathways to be followed, flexibilities • The list of potential gases (e.g. regarding data availability) • Consistency between RE, EE, and GHG targets
4.2.3 Setting regional and national targets There are several fundamentally different options that are conceivable in relation to the EU target setting, and here three are outlined. The first applied the EU methodology to the EnC region as a whole, the second includes a less stringent GDP weighted regional target, and the third is based on comparable GDP related efforts of CPs with EU countries. The latter is our preferred approach.
Option 1 (GHG): Adoption of the same target (non-ETS/EU ETS) and methodol-ogy at EnC and at EU level An important question is whether the EnC’s regional target should correspond with the EU 2030 target, and the same methodology should be applied. In this case, the effort sharing distribution shown in Figure 2 would need to be adapted to the range of per capita GDPs in the EnC.
Full application of the EU rules would exclude emission increases for any CP over the period 2021-2030 compared to 2005. Provided that the GDP levels of the contracting parties (CPs) are much lower as compared to EU MS, this would result in a disproportionally high burden for EnC contracting parties. As an illustration, the EU target of 40% emission reduction by 1990 corresponds to a 1.5% reduction per 1000 € regional GDP/capita (2013 val-ues). For the EnC countries, in contrast, the same regional emission reduction of 40% would result in a reduction of 12.3% per 1000 € regional GDP/capita (see Annex I).
In addition, these targets would be more ambitious than those for new EU Member States for 2020. Since EU countries with lowers GDPs were allowed to increase their emissions between 2005 and 2020, this could be perceived inequitable.
Data needs: 2005 ETS (verified emissions of installations in ETS sectors) and non ETS emissions (all gases of the 2030 ESR)
Option 2 (GHG): Adoption of (a) top-down GDP-weighted regional target(s) A regional target may be defined based on the same reduction per € GDP/capita, either for the entire economy (Option 2a) or for the EU ETS and non-ETS separately (Option 2b). National targets are derived with the same GDP based methodology as the EU either for the non-ETS sectors or for the entire economy (and either using the 2020 or the 2030 method for Non-ETS effort sharing).
• Option 2a A regional target may be defined based on the same reduction per € GDP/capita. Using the 1.5% reduction per 1000 € regional GDP/capita in the EU as mentioned above, multiplication with the average GDP/capita in the EnC would lead to an overall reduction target of 4.85% compared to 2005(see Annex I). An indicative split between the EU-ETS and non ETS sectors could be done (see section 4.2.5).
• Option 2b: Separate regional targets for the EU-ETS and non EU-ETS sectors could be defined. The same approach as in 2a would be applied but separately for the EU ETS and non ETS. This step is introduced in more detail in section 4.2.5.
Option 3 (GHG): Adoption of a bottom-up calculated regional target based on GDP weighted national targets
Interim Report - Study on 2030 overall targets for the Energy Community
Page 24
With this option, instead of a top-down approach (i.e. first defining an overall regional target followed by a break-down to the national level), a bottom-up approach beginning with national targets would be used. This would allow to directly applying national GDP-related targets comparable to EU Member State efforts.
An EnC contracting party with a corresponding GDP to an EU MS would adopt a similar target. There are signifi-cant GDP differences among the CPs with some reaching close to low-GDP EU countries. Due to the absence of an ETS, the level of effort for the non-ETS sectors could be assumed for the entire economy. This would lead to a significantly lower aggregated regional target compared to the EU, but would result in a higher “GDP fairness” compared to adoption of the same regional target as the EU.
We propose Ukraine, Moldova and Georgia are treated separately because they are at a very early stage of im-plementing the EU energy acquis.
For the application of the 2020 or 2030 EU approach, the effort sharing rules represented by the graph in Figure 3 and Annex II may be equally applied. Two sub-options are feasible:
• Option 3a: Use of the same effort sharing rules as applied in the EU for 2020 or 2030 target setting (non ETS sectors). This approach would not require emission reductions from CPs up to 2030 compared to 2005 levels, but may still represent emission reductions compared to 1990. This is due to the strong economic decline in the 1990s from which the region has only partly recovered so far. As most EnC countries are below the lowest GDP of EU countries, a 0% reduction would apply to most countries if the 2030 approach is applied and up to +20% increase of GHG emissions if the 2020 approach would be applied.
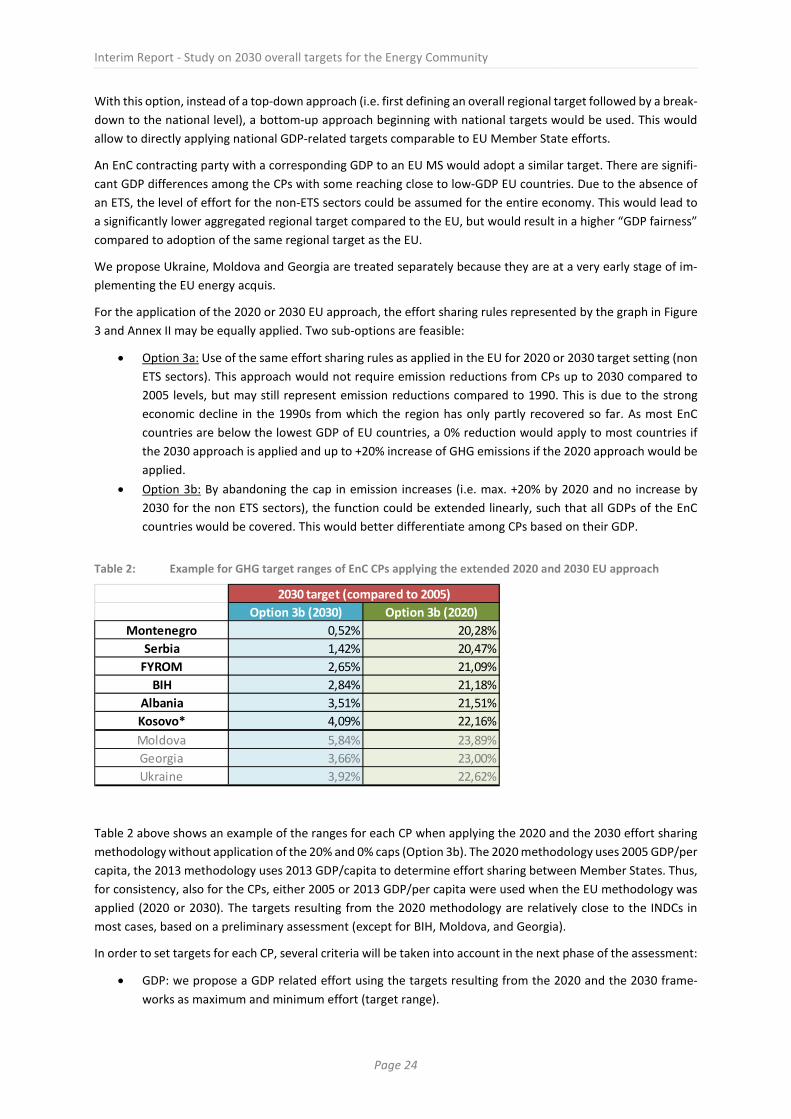
• Option 3b: By abandoning the cap in emission increases (i.e. max. +20% by 2020 and no increase by 2030 for the non ETS sectors), the function could be extended linearly, such that all GDPs of the EnC countries would be covered. This would better differentiate among CPs based on their GDP.
Table 2: Example for GHG target ranges of EnC CPs applying the extended 2020 and 2030 EU approach
Table 2 above shows an example of the ranges for each CP when applying the 2020 and the 2030 effort sharing methodology without application of the 20% and 0% caps (Option 3b). The 2020 methodology uses 2005 GDP/per capita, the 2013 methodology uses 2013 GDP/capita to determine effort sharing between Member States. Thus, for consistency, also for the CPs, either 2005 or 2013 GDP/per capita were used when the EU methodology was applied (2020 or 2030). The targets resulting from the 2020 methodology are relatively close to the INDCs in most cases, based on a preliminary assessment (except for BIH, Moldova, and Georgia).
In order to set targets for each CP, several criteria will be taken into account in the next phase of the assessment:
• GDP: we propose a GDP related effort using the targets resulting from the 2020 and the 2030 frame-works as maximum and minimum effort (target range).
Option 3b (2030) Option 3b (2020)Montenegro 0,52% 20,28%
Serbia 1,42% 20,47%FYROM 2,65% 21,09%
BIH 2,84% 21,18%Albania 3,51% 21,51%Kosovo* 4,09% 22,16%Moldova 5,84% 23,89%Georgia 3,66% 23,00%Ukraine 3,92% 22,62%
2030 target (compared to 2005)
Interim Report - Study on 2030 overall targets for the Energy Community
Page 25
• We suggest to approximate national targets by applying an additional methodological step. This may consist in using the highest and lowest national target resulting from the 2020 and 2030 EU methodol-ogy (option 3b) as start and end point for establishing a linear GDP-target correlation (based on the table above a linear function would be created between +0.52% for Montenegro and +22.16% for Ko-sovo*). This would result in a gradient in national ambition levels moving from the more strict 2030 methodology based targets to the less ambitious 2020 methodology based targets.
• Small countries have little flexibility to meet an ambitious 2030 target, as their GH emissions may strongly depend on a few individual projects or economic performance of a few companies. Here ex-ceptions may be applied depending on the specific national context.
For Moldova, Georgia and Ukraine the consistency of the INDC targets with the proposed RES and EE targets for 2030 will be assessed, the assumptions made in the INDCs validated and possible adjustments to the stringency of the proposed targets suggested.
Based on national targets for CPs ETS and non -ETS sectors will be indicatively split if data availability is sufficient. This step is introduced in subsection 4.2.5.
Data needs: 2005 GHG emission values, the BAU projections, data needed to separate ETS and non-ETS emissions (sectoral or utility level emissions data)
4.2.4 Consistency with INDCs and national emission projections INDCs are based on the international climate framework and not on the EU framework. The targets proposed may thus not be in line with the ambition of the EU framework. Still, assumptions made to define INDCs can inform target setting within this project. Also national emissions projections and climate plans may be considered in order to set 2030 GHG targets that can be realistically achieved. Some INDCs are based on reductions com-pared to 1990, others on reductions compared to BAU scenarios.
INDCs will be converted to 2005 based reduction targets and compared with the targets established based on the above proposed methodology. In case the ambition of our proposed targets strongly differs from INDCs we will compare and validate the used BAU projections with the PRIMES reference case.
Data needs: GHG emission values, and the BAU projections 2005 GHG data for the entire economy (at sectoral level)
4.2.5 Split between the ETS and non-ETS sectors Full application of the EU GHG policy approach would require an establishment of an ETS which is currently not in place in the EnC. However, Serbia and Montenegro will need to join the EU ETS in the light of their foreseen EU accession. Under the absence of an ETS, specific fixed targets (e.g. sectoral) may still be defined for the cor-responding sectors or specific big industrial emitters on national level. Without the flexibility from trading this would, however, counteract the core idea of the ETS, namely cost-efficiency. In addition, this would limit flexi-bility options for the non-ETS sectors as compared to the EU approach which allows for flexibility between the ETS and non-ETS sectors and for obtaining revenues from auctioning of ETS allowances.
Although in an ideal case the proposed GHG target setting would be ‘ETS ready’ for the CPs – as some of them might join the ETS scheme in the future – this ‘ideal’ assessment is constrained by two factors. First, data on the split of ETS and non-ETS sectors are missing in some countries. Second, a similar approach as in the EU is not feasible in splitting up the targets, as it was based on a comprehensive modelling of an overall cost-efficient target achievement in the EU MS (EC, 2008). As the consortium has no available models to cover all sectors in all CPs, the approximation will be limited to assessing available modelling estimates (based on literature review mainly from national sources) and studies covering the electricity sector, which is one of the most important ETS sectors. For the electricity sector, models and recent studies (e.g. SEERMAP, SLED) will be used for assessing the
Interim Report - Study on 2030 overall targets for the Energy Community
Page 26
possible contribution of the sector to the target achievement. This assessment will provide an indication of ranges of reduction efforts in the CPs power generation under various ETS assumptions (e.g. on carbon price ranges). In addition, this model assessment can provide indications of the impact on the power sector emissions in case a new fossil based generation enters into the generation portfolio of the CPs during the period 2018- 2030. Depending on data quality and sectoral differences between countries, this may result in different sectoral splits in the contracting parties, and the assessment might be limited to the CPs where data availability allows for such an assessment.
Data needs: 2005 GHG data for the entire economy (at sectoral level), and list of all ETS installations and emissions
4.3 Data needs Base year emissions data: Data quality will be assessed for 1990 and 2005.
ETS, non-ETS: It will be assessed to which extent company-level emissions can be gathered in order to separate sectoral emissions according to the EU’s approach to differentiate between the ETS and non-ETS sectors.
Considered gases: Depending on data availability, it will be discussed whether targets can be defined in a similar way as in the EU. Depending on whether data quality has substantially improved since 2005, a later base year may be considered. This would, however, then differ from the EU approach.
GDP data is required in order to consider GDP correction of national targets (already collected for 2005 and 2013, see Annex II).
Interim Report - Study on 2030 overall targets for the Energy Community
Page 27
5 Concluding Remarks This report introduces several options that can be applied for 2030 target setting in the field of energy efficiency, renewables and GHG emission reduction. Below we provide a first brief recap of proposed target setting meth-ods.
With respect to energy efficiency and renewable energies a two-step approach is recommended. As starting point (step 1) for establishing a methodology for 2030 EE and RE target setting the overall ambition level at Energy Community level shall be determined. Here two distinct approaches were introduced:
• On the one hand, the overall EE or RE effort can be fully aligned to the European Union. Concerning renewables that would for example from today’s perspective imply to increase the RE share from 20% by 2020 to (at least) 27% by 2030 at EU level, corresponding to a net increase by 7 percentage points. Consequently, if the same ambition would be followed at EnC level, an increase of the RE share at EnC level from 15% by 2020 (i.e. the expected RE share at EnC level if all CPs would reach their binding 2020 RE targets) to 22% by 2030 would arise.
• The flat rate approach ignores however differences in economic welfare between the EU and EnC. In order to overcome that criticism, a flat rate / GDP based approach as used to calculate the binding national 2020 RE targets of the RE Directive (2009/28/EC) can be applied. Here differences in GDP per capita are considered and used to distribute half of the required additional effort.
As a next step (step 2), the aggregated effort (at EnC level) needs to be broken down to national entities. Here again that two approaches introduced under step 1 come into play. The pros and cons of individual options as briefly outlined above remain:
• Using a flat rate approach appears simple and straightforward but criticism may however arise that differences between the CPs in economic wealth are ignored. Thus, this may be seen as useful if costs related to the required RE uptake are small in magnitude or if strong positive economic co-effects that come along with RE development outweigh by far any cost.
• In contrast to above, a flat rate / GDP based approach would consider differences in CP’s economic strength in terms of GDP. Moreover, when combined with a flat rate approach differences between CPs in the required ambition remain however comparatively small.
In general terms, our recommendation would be to follow a flat rate / GDP based approach under both steps. Doing so appears most useful to assure the intended alignment to overall EU approaches and appears fair from a socio-economic perspective.
Setting binding 2030 GHG targets is the beginning of a convergence process towards the EU long term target that needs to take into account countries current emissions profiles, abilities and the strong need for economic recovery.
We do not recommend a split between ETS and Non-ETS sectors as undertaken at EU level, as establishing neither a regional trading system nor national ones (that can be linked to the EU ETS) is foreseen by 2030. In addition, data on the splitting up of sectors is partly missing. Consequently, a very first step towards this direction should be to build up a harmonised and EU conform emission monitoring and reporting system in the EnC.
We propose that an EnC Contracting Party with a similar GDP/capita as an EU MS would adopt a similar target. Due to the absence of an ETS system in the CPs and to the absence of a robust, harmonised energy sector mod-elling on the region, the level of effort for the Non-ETS sectors could be assumed for the entire economy. This would lead to a significantly lower aggregated regional target as compared to the EU, but would result in a higher “GDP fairness” as compared to adopting the same regional target as the EU.
Interim Report - Study on 2030 overall targets for the Energy Community
Page 28
Moreover, we suggest that Ukraine, Moldova and Georgia to be treated separately concerning their GHG targets as they are at a very early stage of implementing EU energy acquis.
For the level of ambition our proposal for the CPs to adopt a GHG target that is based on the application of the EU 2020 and 2030 effort sharing methodology, with a weighting that is based on the GDP/capita levels of the CPs. Due to the applied method, the resulting GHG reduction targets stay between the EU 2020 and EU 2030 ambition, ranging from 0.5% to 23.89% emission surplus compared to 2005 emission levels. The preliminary as-sessment carried out shows that targets resulting from the 2020 level of ambition come relatively close to the INDCs in most cases. If this proposal is followed the specific level of effort among CPs will depend on their GDP/capita level, leading to a gradient in national ambition levels moving from the more strict 2030 methodology based targets (for higher income CPs) to the less ambitious 2020 methodology based targets (for lower income CPs). In case of small countries the emissions profile depends on a few individual projects or economic perfor-mance of a few companies, therefore in this case exceptions may be applied. For Moldova, Georgia and Ukraine we will assess the consistency of the INDC targets with the proposed RES and EE targets for 2030, validate the assumptions made in the INDCs and suggest possible adjustments to the stringency of the proposed targets.
Interim Report - Study on 2030 overall targets for the Energy Community
Page 29
6 References E3MLab and IIASA, 2017, Technical report on Member State results of the EUCO policy scenarios, https://ec.eu-
ropa.eu/energy/en/data-analysis/energy-modelling, Downloaded on 15.10.2017.
Energy Community, 2017. The Energy Community Legal Framework 4th Edition, Available online http://heyz-ine.com/files/uploaded/d386c46cdb96b998cac94d7951dd775d9b66a3e7.pdf, checked on 3.11,2017, May 2017.
European Commission, 2008, European Energy and Transport - TRENDS TO 2030 - UPDATE 2007, Directorate-general for energy and transport, Luxembourg: Office for Official Publications of the European Communi-ties.
European Commission, 2016a. COM(2016) 765 final. Proposal for a directive of the European Parliament and of the Council amending Directive 2010/31/EU on the energy performance of buildings. Available online http://ec.europa.eu/energy/sites/ener/files/documents/1_en_act_part1_v10.pdf, checked on 15.03.2017, Brussels 30.11.2016.
European Commission, 2016b. COM(2016) 767 final/2. Proposal for a directive of the European Parliament and of the Council on the promotion of the use of energy from renewable sources (recast). Available online http://ec.europa.eu/energy/sites/ener/files/documents/1_en_act_part1_v7_1.pdf, checked on 15.03.2017, Brussels 23.2.2017.
European Commission, 2016c, Proposal for a REGULATION OF THE EUROPEAN PARLIAMENT AND OF THE COUN-CIL on binding annual greenhouse gas emission reductions by Member States from 2021 to 2030 for a resilient Energy Union and to meet commitments under the Paris Agreement and amending Regulation No 525/2013 of the European Parliament and the Council on a mechanism for monitoring and reporting greenhouse gas emissions and other information relevant to climate change. COM/2016/0482 final - 2016/0231 (COD), 2003. DIRECTIVE 2003/87/EC OF THE EUROPEAN PARLIAMENT AND OF THE COUNCIL of 13 October 2003 establish-ing a scheme for greenhouse gas emission allowance trading within the Community and amending Council Directive 96/61/EC
European Commission, 2016c. COM(2016) 761 final. Proposal for a directive of the European Parliament and of the Council amending Directive 2012/27/EU on energy efficiency. Available online http://eur-lex.eu-ropa.eu/resource.html?uri=cellar:efad95f3-b7f5-11e6-9e3c-01aa75ed71a1.0009.02/DOC_1&format=PDF, checked on 3.11.2017, Brussels 30.11.2016.
European Commission, 2017a. Evolution of indicative national energy efficiency targets for 2020. Available online https://ec.europa.eu/energy/sites/ener/files/documents/article_3_eed_indicative_national_en-ergy_efficiency_targets_2020_january_2017.pdf. CheckAssessed on 3.11.2017, 4.1.2017.
European Commission, 2017b. Information on Energy Efficiency Policies https://ec.europa.eu/energy/en/top-ics/energy-efficiency checked on 3.11.2017.
European Council, 2014. European Council (23 and 24 October 2014) ‒ Conclusions, EUCO 169/14, Brussels, 24 October 2014.
European Union, 2006, Directive 2006/32/EC of the European Parliament and of the Council of 235 April 2009 on the effort of Member States to reduce their greenhouse gas emissions to meet the Community’s green-house gas emission reduction commitments up to 2020, Brussels 27.4.2006.
European Union, 2009a. Directive 2009/28/EC of the European Parliament and of the Council of 23 April 2009 on the promotion of the use of energy from renewable sources and amending and subsequently repealing Directives 2001/77/EC and 2003/30/EC, Brussels 23.4.2009.
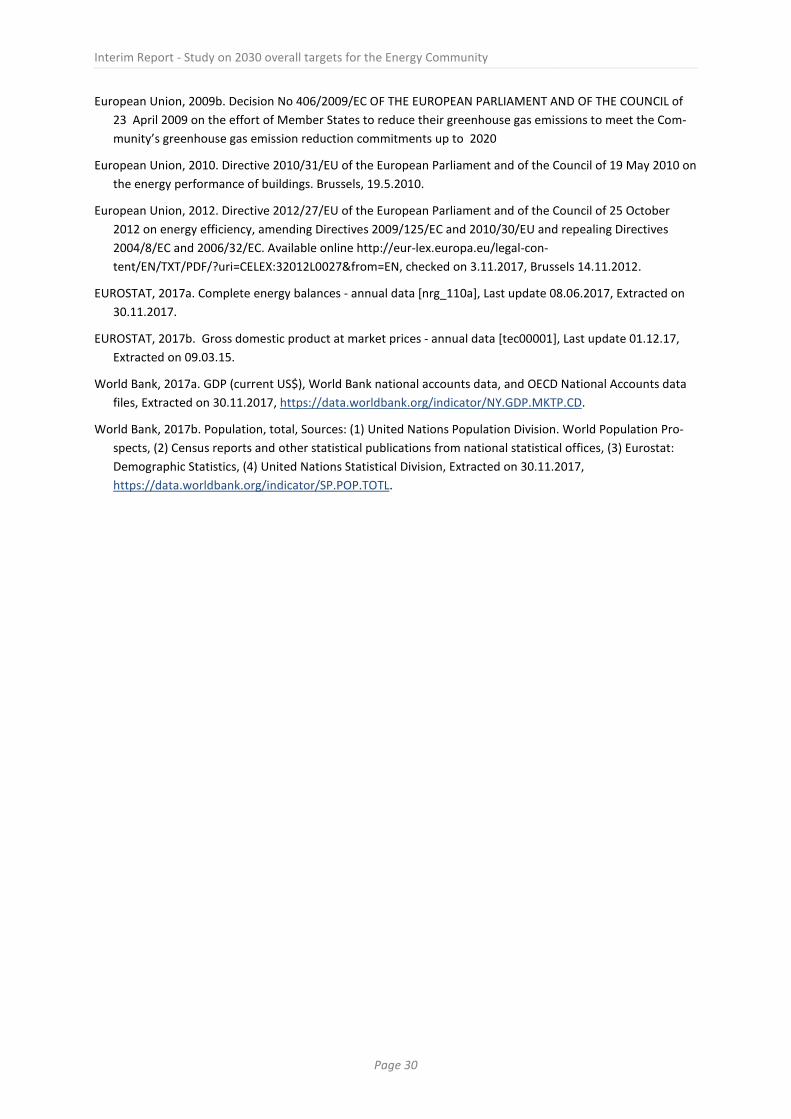
Interim Report - Study on 2030 overall targets for the Energy Community
Page 30
European Union, 2009b. Decision No 406/2009/EC OF THE EUROPEAN PARLIAMENT AND OF THE COUNCIL of 23 April 2009 on the effort of Member States to reduce their greenhouse gas emissions to meet the Com-munity’s greenhouse gas emission reduction commitments up to 2020
European Union, 2010. Directive 2010/31/EU of the European Parliament and of the Council of 19 May 2010 on the energy performance of buildings. Brussels, 19.5.2010.
European Union, 2012. Directive 2012/27/EU of the European Parliament and of the Council of 25 October 2012 on energy efficiency, amending Directives 2009/125/EC and 2010/30/EU and repealing Directives 2004/8/EC and 2006/32/EC. Available online http://eur-lex.europa.eu/legal-con-tent/EN/TXT/PDF/?uri=CELEX:32012L0027&from=EN, checked on 3.11.2017, Brussels 14.11.2012.
EUROSTAT, 2017a. Complete energy balances - annual data [nrg_110a], Last update 08.06.2017, Extracted on 30.11.2017.
EUROSTAT, 2017b. Gross domestic product at market prices - annual data [tec00001], Last update 01.12.17, Extracted on 09.03.15.
World Bank, 2017a. GDP (current US$), World Bank national accounts data, and OECD National Accounts data files, Extracted on 30.11.2017, https://data.worldbank.org/indicator/NY.GDP.MKTP.CD.
World Bank, 2017b. Population, total, Sources: (1) United Nations Population Division. World Population Pro-spects, (2) Census reports and other statistical publications from national statistical offices, (3) Eurostat: Demographic Statistics, (4) United Nations Statistical Division, Extracted on 30.11.2017, https://data.worldbank.org/indicator/SP.POP.TOTL.
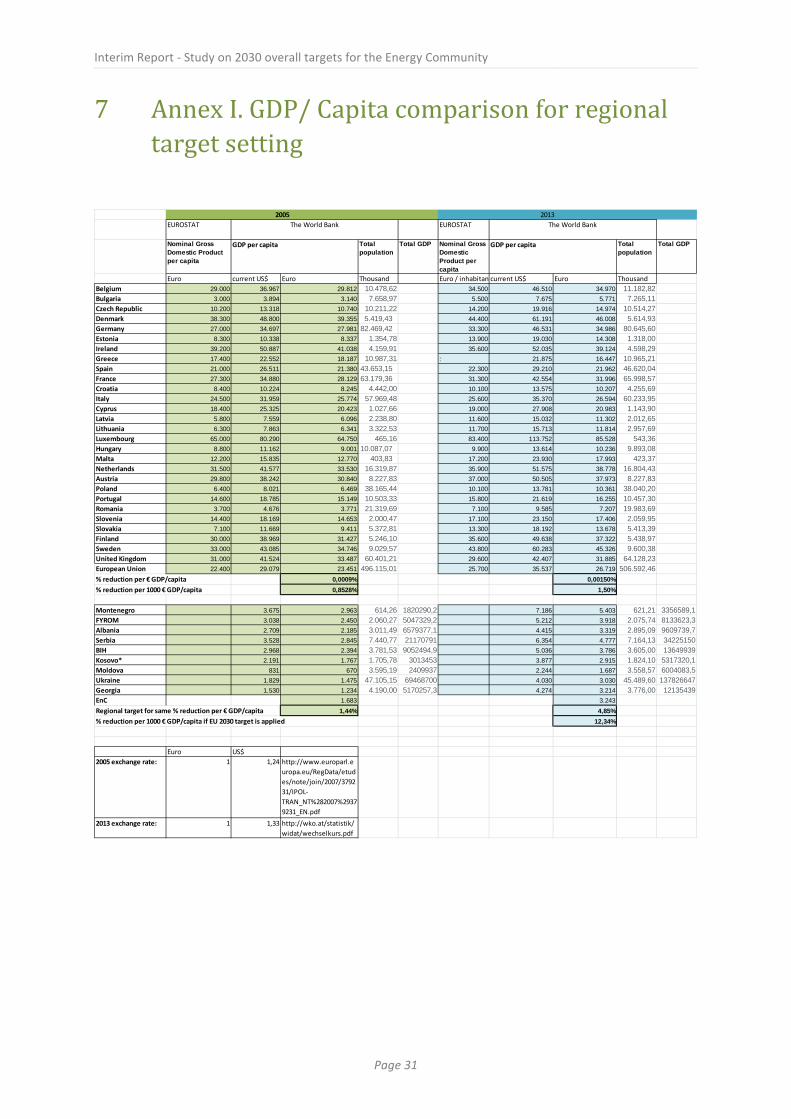
Interim Report - Study on 2030 overall targets for the Energy Community
Page 31
7 Annex I. GDP/ Capita comparison for regional target setting
EUROSTAT EUROSTAT
Nominal Gross Domestic Product per capita
Total population
Total GDP Nominal Gross Domestic Product per capita
Total population
Total GDP
Euro current US$ Euro Thousand Euro / inhabitantcurrent US$ Euro ThousandBelgium 29.000 36.967 29.812 10.478,62 34.500 46.510 34.970 11.182,82Bulgaria 3.000 3.894 3.140 7.658,97 5.500 7.675 5.771 7.265,11Czech Republic 10.200 13.318 10.740 10.211,22 14.200 19.916 14.974 10.514,27Denmark 38.300 48.800 39.355 5.419,43 44.400 61.191 46.008 5.614,93Germany 27.000 34.697 27.981 82.469,42 33.300 46.531 34.986 80.645,60Estonia 8.300 10.338 8.337 1.354,78 13.900 19.030 14.308 1.318,00Ireland 39.200 50.887 41.038 4.159,91 35.600 52.035 39.124 4.598,29Greece 17.400 22.552 18.187 10.987,31 : 21.875 16.447 10.965,21Spain 21.000 26.511 21.380 43.653,15 22.300 29.210 21.962 46.620,04France 27.300 34.880 28.129 63.179,36 31.300 42.554 31.996 65.998,57Croatia 8.400 10.224 8.245 4.442,00 10.100 13.575 10.207 4.255,69Italy 24.500 31.959 25.774 57.969,48 25.600 35.370 26.594 60.233,95Cyprus 18.400 25.325 20.423 1.027,66 19.000 27.908 20.983 1.143,90Latvia 5.800 7.559 6.096 2.238,80 11.600 15.032 11.302 2.012,65Lithuania 6.300 7.863 6.341 3.322,53 11.700 15.713 11.814 2.957,69Luxembourg 65.000 80.290 64.750 465,16 83.400 113.752 85.528 543,36Hungary 8.800 11.162 9.001 10.087,07 9.900 13.614 10.236 9.893,08Malta 12.200 15.835 12.770 403,83 17.200 23.930 17.993 423,37Netherlands 31.500 41.577 33.530 16.319,87 35.900 51.575 38.778 16.804,43Austria 29.800 38.242 30.840 8.227,83 37.000 50.505 37.973 8.227,83Poland 6.400 8.021 6.469 38.165,44 10.100 13.781 10.361 38.040,20Portugal 14.600 18.785 15.149 10.503,33 15.800 21.619 16.255 10.457,30Romania 3.700 4.676 3.771 21.319,69 7.100 9.585 7.207 19.983,69Slovenia 14.400 18.169 14.653 2.000,47 17.100 23.150 17.406 2.059,95Slovakia 7.100 11.669 9.411 5.372,81 13.300 18.192 13.678 5.413,39Finland 30.000 38.969 31.427 5.246,10 35.600 49.638 37.322 5.438,97Sweden 33.000 43.085 34.746 9.029,57 43.800 60.283 45.326 9.600,38United Kingdom 31.000 41.524 33.487 60.401,21 29.600 42.407 31.885 64.128,23European Union 22.400 29.079 23.451 496.115,01 25.700 35.537 26.719 506.592,46% reduction per € GDP/capita 0,0009% 0,00150%% reduction per 1000 € GDP/capita 0,8528% 1,50%
Montenegro 3.675 2.963 614,26 1820290,2 7.186 5.403 621,21 3356589,1FYROM 3.038 2.450 2.060,27 5047329,2 5.212 3.918 2.075,74 8133623,3Albania 2.709 2.185 3.011,49 6579377,1 4.415 3.319 2.895,09 9609739,7Serbia 3.528 2.845 7.440,77 21170791 6.354 4.777 7.164,13 34225150BIH 2.968 2.394 3.781,53 9052494,9 5.036 3.786 3.605,00 13649939Kosovo* 2.191 1.767 1.705,78 3013453 3.877 2.915 1.824,10 5317320,1Moldova 831 670 3.595,19 2409937 2.244 1.687 3.558,57 6004083,5Ukraine 1.829 1.475 47.105,15 69468700 4.030 3.030 45.489,60 137826647Georgia 1.530 1.234 4.190,00 5170257,3 4.274 3.214 3.776,00 12135439EnC 1.683 3.243Regional target for same % reduction per € GDP/capita 1,44% 4,85%% reduction per 1000 € GDP/capita if EU 2030 target is applied 12,34%
Euro US$2005 exchange rate: 1 1,24 http://www.europarl.e
uropa.eu/RegData/etudes/note/join/2007/379231/IPOL-TRAN_NT%282007%29379231_EN.pdf
2013 exchange rate: 1 1,33 http://wko.at/statistik/widat/wechselkurs.pdf
2005 2013
GDP per capita GDP per capita
The World BankThe World Bank
Interim Report - Study on 2030 overall targets for the Energy Community
Page 32
8 Annex II. GDP/ Capita based burden sharing comparison
Shaded area:
• Includes the possible targets for the CPs based on the 2020 and 2030 effort sharing methods. • 2014 GDP/Capita for CPs (current price, Eurostat) (2015 is not available for all countries) Range: 1691
to 5430 Euro/capita


![GHG presentation 2 [Autosaved]](https://static.fdocument.pub/doc/165x107/58ef3baf1a28abaa358b4687/ghg-presentation-2-autosaved.jpg)