Empirical accounting research - hu-berlin.de
255
Empirical accounting research ─ Three essays with intersections to management and corporate govern- ance D I S S E R T A T I O N zur Erlangung des akademischen Grades doctor rerum politicarum (Doktor der Wirtschaftswissenschaft) eingereicht an der Wirtschaftswissenschaftlichen Fakultät der Humboldt-Universität zu Berlin von Diplom-Ökonom Tolga Davarcioglu Präsident der Humboldt-Universität zu Berlin: Prof. Dr. Jan-Hendrik Olbertz Dekan der Wirtschaftswissenschaftlichen Fakultät: Prof. Oliver Günther, Ph.D. Gutachter: 1. Prof. Dr. Joachim Gassen 2. Prof. Dr. Joachim Schwalbach Tag des Kolloquiums: 22.07.2011
Transcript of Empirical accounting research - hu-berlin.de

Empirical accounting research
─
Three essays with intersections to management and corporate govern-
ance
D I S S E R T A T I O N
zur Erlangung des akademischen Grades
doctor rerum politicarum
(Doktor der Wirtschaftswissenschaft)
eingereicht an der
Wirtschaftswissenschaftlichen Fakultät
der Humboldt-Universität zu Berlin
von
Diplom-Ökonom Tolga Davarcioglu
Präsident der Humboldt-Universität zu Berlin:
Prof. Dr. Jan-Hendrik Olbertz
Dekan der Wirtschaftswissenschaftlichen Fakultät:
Prof. Oliver Günther, Ph.D.
Gutachter: 1. Prof. Dr. Joachim Gassen
2. Prof. Dr. Joachim Schwalbach
Tag des Kolloquiums: 22.07.2011
To the reader
Historically, German financial accounting and reporting was geared towards regulatory requirements like taxation and dividend pay-outs. In recent years, German public firms started adopting internationally accepted financial accounting standards to signal their commitment to capital market communication. Nowadays, German financial accounting and reporting is trying to meet multiple objectives: It is used as a communication device to shareholders while at the same time it remains instrumental in regulatory settings like, e.g. taxation. Also, financial accounting is a key ingredient to many issues of cor-porate governance.
The dissertation thesis of Tolga Davarcioglu reflects this multi-objective nature by in-vestigating the phenomenon of financial accounting from different angles. While the first paper looks into the determinants of voluntary compliance to accounting standards, the second paper assesses the effects of mandatory IFRS adoption. Finally, the third paper studies the interplay of board structure and firm performance. In general, the pro-jects find that some of the standard economic incentive stories do not seem to be able to explain the financial accounting behavior of German firms. This calls for future re-search into the (non-economic) determinants of managerial behavior.
The overarching theme of the three papers is methodological: all papers use empirical archival approaches. This is considered to be “mainstream” in the current international literature. Nevertheless, the work presented here is far from being mainstream as it is based on carefully hand-collected data. In recent years, most studies in the area of em-pirical financial accounting research have been based on publicly available standardized databases. While these databases allow large-sample studies with obvious advantages in terms of descriptive appeal and external validity, the data presented in these databases are only a crude proxy for the financial accounting information available to market par-ticipants. Financial accounting information is rich, multi-dimensional and qualitative as well as quantitative in nature. Researchers which strive to understand the determinants and consequences of financial reporting should be studying financial accounting data “in the wild”. Focusing the analysis on key financial figures available from public data sources is like studying the behavior of elephants by going to the zoo: It is useful but likely to provide an incomplete picture.
The use of high-quality data is a significant contribution as it makes the mixed results of some of the projects more interesting. Mixed findings based on standard archival data can always be blamed to lacking construct validity. In turn, the findings presented here clearly indicate the limitations of traditional economic theories which predict manage-rial behavior. Thus, future work is needed to continue the work presented here by link-ing theories of different paradigms. In that respect, the work of Tolga Davarcioglu adds to our understanding of the real-world phenomenon of financial reporting and corporate governance. I hope it will be widely read and used.
Berlin, October 17, 2011
Joachim Gassen

Acknowledgements This thesis was written during the five years that I worked as research assistant at the Institute for Accounting and Auditing of the Humboldt-Universität zu Berlin. It was accepted as a dissertation by the School of Business and Economics in the summer term 2011.
First and foremost, I would like to thank my supervisor Prof. Dr. Joachim Gassen. He provided continuous support and motivation during the writing process; without his advice the thesis would not have come to existence. He also allowed me insights into scientific working that would have been hidden to me otherwise and encouraged me to present results on conferences. Additionally, I am thankful that I could learn so much, and that this fortunately was not restricted to accounting research.
I would also like to express my gratitude to Prof. Dr. Joachim Schwalbach for his will-ingness to act as second supervisor and allowing for a smooth examination process. I am indebted to Prof. Bärbel Gertich for chairing the dissertation committee as well as for cordial and encouraging conversations at our institute.
While I was writing the thesis, I always referred to it as “my” work, however, my col-leagues played an indispensible role in its successful completion. I will always keep my occupation at the institute in fond memory because the boundaries between being col-leagues and friends faded so quickly. Each and everyone made the time memorable in an own special way: Heidlinde Völker, the institute’s “mastermind”, created a very pleasant working atmosphere by her caring and helpful manner; her absence is an ele-gant way to challenge the institute’s operability. I would like to highlight co-working with Dr. Ulrich “Uli” Küting. His dedication to accounting related questions and – at least to the same extent – our numerous non-work related discussions had a lasting posi-tive influence on the writing process. Timo Eisenschink demonstrated impressively on a day-to-day basis but especially on weekends, that there is a life aside from the office. Nico Kavvadias was relentless in pointing out the relationship between good food and academic work and provided valuable lessons in culinary Berlin. Matthias Weil did not only bring a fresh breeze into the institute but was also (nearly) untiringly available for sports activities. With Jochen Pierk, temporarily my office buddy, I had many semi-serious discussions on the state of the nation over a cup of tea. I only shortly co-worked with Marcus Witzky and Jens Günther, but therefore, discussions during our canteen visits were intense and characterized by interestingly diverging perspectives. Our assis-tant professor Prof. Urška Kosi, PhD, brought a welcome diversity to the boys club and was cheerful, humorous and baked delicious goodies on top of that. I would like to ex-press my gratitude to each of them for a memorable and instructional time, countless discussions and proofreading the thesis partly or entirely.
I would like to say thank you to our student assistants particularly for the excellent sup-port in getting required literature or data and the help with all other tasks that the re-search assistant seems to unlearn after his studies. I will also not forget our many cor-dial conversations or our book and movie reviews.
The Wirtschaftswissenschaftliche Gesellschaft an der Humboldt-Universität zu Berlin e.V. supported me financially during my research stay at the Hong Kong University of Science and Technology; thank you very much for that.
I am indebted to my friends for convenient breaks from research and teaching activities. Especially Cornelius Mundt and Dr. Daniel Baumgarten have been friends for a long

time now and are a guarantee for a thrilling exchange of views. Additionally, Daniel did not only bear my econometric questions but also answered them.
My special thanks go to my family: My brother Koray began my “education” – cer-tainly without knowing – far before my schooldays and had an at least acceptable an-swer to all the small as well as the big questions of life. I would like to thank my parents for so much but particularly for supporting me at every time in every aspect and for ap-proving and/or bearing my good as well as my not so good decisions.
Berlin, October 2011 Tolga Davarcioglu

-V-
Contents - Overview
An introductory summary ...................................................................................1
What drives voluntary accounting compliance? Evidence from German Accounting Standards ........................................................................................11
Accounting quality after voluntary IFRS adoption – Evidence based on provision disclosure of German firms...............................................................93
Multiple board appointments and firm performance - German evidence..171

-VI-
Contents
An introductory summary................................................................................... 1
Accounting research and empirical accounting.................................................. 1
References ........................................................................................................ 10
What drives voluntary accounting compliance? Evidence from German
Accounting Standards........................................................................................ 11
1 Introduction ................................................................................................... 12
2 Background.................................................................................................... 16
2.1 Motivation and related studies .......................................................................... 16
2.2 The institutional setting in Germany.................................................................19
2.2.1 The Accounting Standards Committee of Germany and German
Accounting Standards.........................................................................19
2.2.2 Investigated German Accounting Standards.......................................23
2.3 Prior findings and hypotheses development .....................................................26
3 Empirical analyses......................................................................................... 36
3.1 Sample selection ...............................................................................................36
3.2 Empirical measures ...........................................................................................38
3.2.1 Compliance with GAS in the sample..................................................38
3.2.2 Main variables: Public exposure and compliance pressure ................39
3.2.3 Control variables .................................................................................41
3.3 Research design................................................................................................. 42
3.4 Empirical Results ..............................................................................................48
3.4.1 Findings on compliance ......................................................................48
3.4.2 Anecdotal evidence of GAS compliance ............................................64
3.4.3 Analysis of changers ...........................................................................65
3.4.4 Compliance as a routine process.........................................................74
4 Summary and conclusions ............................................................................. 77
References ........................................................................................................ 82
Appendix .......................................................................................................... 90
Accounting quality after voluntary IFRS adoption – Evidence based on
provision disclosure of German firms .............................................................. 93
1 Introduction ................................................................................................... 94

-VII-
2 Background ..................................................................................................101
2.1 Institutional setting..........................................................................................101
2.2 Accounting for provisions under German GAAP and IFRS...........................102
2.2.1 Basics .....................................................................................................102
2.2.2 Recognition............................................................................................102
2.2.3 Measurement..........................................................................................104
2.2.4 Disclosure ..............................................................................................105
3 Literature review, hypotheses and model development...............................107
3.1 Literature review .............................................................................................107
3.2 Hypotheses and model development...............................................................109
4 Sample and data ...........................................................................................119
4.1 Sample selection .............................................................................................119
4.2 Data .................................................................................................................122
5 Empirical analyses .......................................................................................122
5.1 Quantitative effects of IFRS adoption on provisions......................................122
5.2 Analysis of accounting quality........................................................................129
5.2.1 Descriptive analysis ...............................................................................129
5.2.2 Level analysis ........................................................................................136
5.2.3 Change analysis .....................................................................................146
6 Summary and conclusion .............................................................................150
References .......................................................................................................156
Appendix A: Derivation of accounting quality indices ..................................162
Appendix B: Sample firms and accounting quality measures ........................169
Multiple board appointments and firm performance - German evidence..171
1 Introduction ..................................................................................................172
2 Prior literature and research questions .........................................................177
2.1 Perspectives on multiple board appointments.................................................177
2.2 Literature review .............................................................................................180
2.3 Research question ...........................................................................................183
3 The institutional setting in Germany............................................................184
4 Empirical analyses .......................................................................................187
4.1 Sample selection and data ...............................................................................187
4.2 Data description ..............................................................................................188
-VIII-
4.2.1 Director characteristics ..........................................................................188
4.2.2 Firm characteristics................................................................................190
4.2.3 Correlations............................................................................................196
4.3 Multiple board appointments and firm performance ...................................... 198
4.3.1 Methodology..........................................................................................198
4.3.2 Busyness vs. Reputation Hypothesis .....................................................201
4.3.3 Bank boards ...........................................................................................212
4.3.4 International boards ...............................................................................215
4.3.5 Additional tests ......................................................................................221
5 Summary and conclusions ........................................................................... 226
References ...................................................................................................... 232
Appendix ........................................................................................................ 240

-1-
An introductory summary
Accounting research and empirical accounting
Accounting, in its specific sense, is not defined up to now and may never be. This
probably lies in the circumstance that accounting is a response to practical needs. Since
these needs are different in every country and period of time, accounting is an ever-
changing, dynamic and evolving profession. In this respect, accounting can be consid-
ered to follow the Darwinian principle in so far that only useful accounting principles
survive (Alexander and Nobes, 2010). Of course, there have been endeavors to define
accounting. A somewhat broader definition is provided by the Accounting Principles
Board (1970):
“Accounting is a service activity. Its function is to provide quantitative information
primarily financial in nature, about economic entities that is intended to be useful in
making economic decisions, in making resolved choices among alternative courses of
action.”
The broadness of this definition illustrates that accounting is multifaceted. In order to
provide “quantitative information”, there are rules that need to be applied. An essential
part of accounting is about developing and interpreting accounting rules. The provided
information generally pertains to “economic entities”. In the accounting profession, this
usually refers to business entities which include hospitals and non-profit organizations.
But then, these entities are also composed of individuals like managers, board directors
or employees. And who are the parties that are supposed to make “economic decisions
(…) among alternative courses of action”? Interested parties, also called users of ac-

-2-
counting information, include those outside the business such as investors, lenders, sup-
pliers, customers, governments or the public.
Given the purpose of accounting, research pertaining to accounting deals with the ques-
tion how to provide decision-useful information but also has the intention to predict and
to explain behavior based on theoretical models. Bearing this in mind, it is unsurprising
that accounting research is broad and intersects with numerous other disciplines like
law, management, finance, economics or psychology. Consequently, accounting papers
cover a broad range of topics. Oler, Oler and Skousen (2010) categorize these topics
into financial accounting, managerial accounting, auditing, tax, governance, and others.
While this gives an idea about possible subjects of accounting research, it tells little
about the nature of accounting research. Typically, accounting research is subdivided
into normative and positive research. While it is no easy task to trace back the begin-
nings of accounting research, they are believed to be normative in nature (Fülbier and
Weller, 2008). Normative research aims at giving ideas about what ought to be. Typical
questions raised in this research line deal with purpose and content of financial state-
ment items like the balance sheet and income statement. On the other hand, positive
accounting research is a phenomenon of the late 1960s, pioneered by works of Benston
(1967), Ball and Brown (1968), and Beaver (1968). Positive research aims at postulat-
ing hypotheses about causes and effects with respect to accounting practices and to test
these hypotheses (Kinney, 1986). Empirical accounting is an indispensable part of posi-
tive accounting research. Its scope is to provide results that accept or reject hypotheses
and by this, to provide evidence for or against theoretical models. Also, descriptive and
explorative empirical accounting provides important contributions to advance account-
ing theory and to identify contemporary “hot topics” in accounting.
-3-
The three papers provided by this cumulative PhD-thesis need to be considered against
this background. I address topics from the area of accounting, management and corpo-
rate governance in these papers. Building on theoretical frameworks, I apply established
empirical methodology in order to validate or reject predictions on certain accounting
outcomes. In particular, each paper combines publicly available data with purposefully
hand-collected data. At the same time, each paper takes advantage of a special setting
that is predominantly determined by institutional factors. As a result, research questions
can be addressed with a novel data quality. This kind of research comes with both ad-
vantages and disadvantages. While it addresses questions that have not been raised be-
fore, it also implies to explore in the dark. Research questions that are illuminated in
this vein can yield interesting answers, yet, the approach also bears the risk of produc-
ing null results. To some extent, this also holds true for the papers presented. Of course,
a null result does not necessarily mean that the result bears no content or informational
value. Rather, the expected content or expected relationship has not been found. In this
respect, this kind of research is important because even in the face of null results, it can
give other researches important input for future research. Subsequently, I give a short
overview of each of the three papers.
The first paper with the title “What drives voluntary accounting compliance? Evidence
from German Accounting Standards” deals with compliance to voluntary accounting
standards. In the broadest sense, this paper relates to the accounting choice literature,
which Fields, Lys and Vincent (2001) define as:
“An accounting choice is any decision whose primary purpose is to influence (either in
form or substance) the output of the accounting system in a particular way, including
-4-
not only financial statements published in accordance with GAAP, but also tax returns
and regulatory filings.”
German Accounting Standards (GAS) aim at improving accounting quality of consoli-
dated financial statements by restricting some of the rule-based options offered in Ger-
man GAAP, requesting more disclosure and demanding more standardized disclosure.
Providing accounting information is essential for facilitating contracting. In this respect,
gaining insights into why firms voluntarily exceed disclosure requirements or adopt
alternative accounting regimes is important in order to assess to which extent disclosure
can be left to the market and where regulation is necessary to guarantee provision of
relevant information to different users of accounting information. An understanding on
why firms adopt alternative accounting regimes can also be helpful in harmonization
endeavors. Yet, the mere circumstance that a firm adopts an accounting regime does not
necessarily imply that the firm complies with all its requirements. Studies within this
field can provide valuable insights that can help to find triggers that encourage compli-
ance by companies and ultimately might improve accounting quality.
My research investigates the factors that drive compliance with the four German Ac-
counting Standards GAS 2 (Cash Flow Statements), GAS 3 (Segment Reporting),
GAS 4 (Acquisition Accounting in Consolidated Financial Statements) and GAS 14
(Foreign Currency Translation). The selection of the standards is based on the extent to
which the standards restrict favored rule-based options of German GAAP. I consider the
institutional setting of the study to be particularly suitable in order to assess my research
questions. During 1998 and 2004, publicly listed German firms had the option to choose
among three different accounting regimes in order to prepare their consolidated finan-
cial statements: German GAAP, IAS/IFRS and US GAAP. Firms that apply German
-5-
GAAP were supposed to comply, in addition, with GAS. This setting allows to extend
existing literature by investigating whether compliance is driven by public exposure and
peer pressure.
Results of the study show that compliance for every standard is decided on a case-to-
case basis since compliance is significantly lower for standards that restrict popular
rule-based options. The results of an ordered logistic regression show that compliance is
driven by size, the auditor’s affiliation to the institution that develops the GAS and debt
agency problems. I find no relationship between compliance and public exposure. Addi-
tional tests investigating the compliance with standards separately show that peer pres-
sure, the auditor and financing needs influence the compliance decision. A change
analysis reveals that firms that newly adopt GAS make only minor changes to their cash
flow statements and segment reports. Results also suggest that once firms have decided
to comply with GAS, this becomes a routine practice implying that firms comply with
GAS out of habit or because it has become a standard process.
The implications for institutions that formulate accounting standards or codices that
practitioners can choose to apply on a voluntary basis are fourfold. First, even in the
light of a set of rules aiming at improving corporate disclosure, non-compliance is still
prevalent and additional incentives and advantages for various users need to be provided
in order to get the rules accepted by practitioners. Second, in order to avoid a labeling
process, partial compliance to rules should be disclosed to the users of accounting in-
formation in detail as this might be relevant with regard to comparability. Third, accep-
tance of the standards by other firms within the same industry can have a positive influ-
ence on compliance. Fourth, affiliated third parties with the publishing organization that
-6-
are also affiliated to firms that apply the standards can enhance compliance and dis-
semination of the standards.
The second paper with the title “Accounting quality after voluntary IFRS adoption –
Evidence based on provision disclosure of German firms” deals with the effects of vol-
untary IFRS adoption on accounting quality based on provision disclosure. In so far, the
paper can also be seen in the light of accounting choice, but it puts its focus on the con-
sequences on accounting quality. Drawing on Cascino et al. (2010):
“The quality of accounting information refers to: i) the informativeness of reported
numbers, ii) the level of disclosure, and iii) the degree of compliance with generally
accepted accounting standards.”
The study puts its focus on the level of disclosure and the degree of compliance around
IFRS adoption on accounting for provisions. Dealing with the dispersion of IFRS is
relevant because the IFRS play an outstandingly important role in the harmonization
process of accounting worldwide. Whether and to what extent the proclaimed goal to
provide standards of high quality that facilitate users of accounting information to make
economic decisions is being fulfilled by the IFRS has not been answered conclusively.
Prior literature has particularly focused on the earnings quality aspect of accounting
quality. This paper takes an alternative approach by focusing on the disclosure aspect.
First, compliance with disclosure requirements and disclosure level are compared under
local GAAP (final year prior to IFRS adoption) and under IFRS (transition year). Sec-
ond, determinants driving these measures on a firm level are investigated.

-7-
The results show that compliance is significantly lower and that disclosure level is sig-
nificantly higher under IFRS. Non-compliance under IFRS primarily stems from the
circumstance that virtually no firm fulfills the restrictive demands made on disclosing
qualitative pieces of information. Improvement in the disclosure level primarily stems
from more detailed disclosure in the balance sheet and more quantification in the notes.
Strongly emphasizing the limitations of the approach, the results are consistent with the
notion that IFRS adoption has a positive impact on the disclosure aspect of accounting
quality regarding accounting for provisions. Improvement is more pronounced for firms
where provisions are relatively more important in proportion to the balance sheet and
where IFRS adoption has a higher impact on the provisions. At the same time, positive
changes are stronger for more levered and more closely held firms that typically have
less incentives to provide accounting information for a broad investor base.
The third paper with the title “Multiple board appointments and firm performance -
German evidence” strongly intersects with the field of corporate governance. Drawing
on Denis and McConnell (2003):
“We define corporate governance as the set of mechanisms─both institutional and mar-
ket-based─that induce the self-interested controllers of a company (those that make
decisions regarding how the company will be operated) to make decisions that maxi-
mize the value of the company to its owners (the suppliers of capital).”
The mechanisms referred to comprise internal and external components. Within the pa-
per, the board of directors, which is typically seen as an internal corporate governance
mechanism, is the main object of scrutiny. A firm’s board, also referred to as “the
lynchpin of corporate governance” (Gillan, 2006), has an outstandingly important role

-8-
for firm performance. It is this relationship investigated within the course of the paper.
In Germany, a publicly held firm features a two-tier board. The management board is
responsible for a firm’s operational and strategic alignment. The management board
reports to the supervisory board. The monitoring tasks of the supervisory board com-
prise e.g. appointment of managers or determination of the salary. While a board’s ef-
fectiveness is driven by numerous factors, a board’s structure, composition, activity or
establishment of committees have been identified as central determinants. The focus of
my study lies on multiple board appointments held by board directors. Multiple board
appointments are a relevant topic in corporate governance research since impact on firm
performance is not unequivocally predictable. They are perceived to reduce the effec-
tiveness of monitoring tasks because directors might neglect their corporate duties. On
the other hand, directors are expected to benefit from additional experience and net-
works that can enhance firm performance.
I investigate the effect of multiple board appointments on firm performance for a sam-
ple of publicly listed German firms. Since multiple board appointments can be charac-
terized along numerous dimensions and their effect on firm performance is not un-
equivocally predictable, the incidence of multiple board appointments is investigated
from several angles. First, I contrast the Busyness Hypothesis versus the Reputation
Hypothesis. Busyness is measured by the number of additional board appointments
while several director characteristics are used to measure reputation and skills. Second, I
examine the presence of directors featuring bank affiliations on firm performance. Fi-
nally, I investigate the presence of directors featuring international board appointments
on firm performance, and international activities, respectively. Although my results are
mixed, I cautiously conclude that multiple board appointments negatively affect firm
-9-
performance. Director characteristics that are expected to have a positive influence on
firm performance do not counteract this finding.
Although mixed, the findings still offer some insights on the occurrence of multiple
board appointments. The results do not support the idea that their influence on firm per-
formance is negative per se. Hence, it does not seem appropriate to put restrictions on
the number of multiple board appointments with the argument to increase board effec-
tiveness for all corporate boards. Rather, active board members need to assess in which
form board effectiveness might benefit from appointing a certain director to the board.
At the same time, appointed directors need to assess whether they are able to fulfill all
their responsibilities when taking any additional board appointments. This might seem
like a somewhat naïve statement in the light of self-interests and selfish behavior and
directly leads to the question whether other control mechanisms could be helpful in en-
suring that board directors do not take too many board appointments. On the one hand,
this might be achieved by self-imposed corporate guidelines which offer higher flexibil-
ity. On the other hand, directors need to question board effectiveness constantly and
directors need to assess whether board effectiveness suffers from directors that burden
too many responsibilities on themselves.
-10-
References
Alexander, D. and Nobes, C. (2010), Financial Accounting: An International Introduc-
tion, 4th ed., Financial Times Prentice Hall, London.
Accounting Principles Board (1970), Statement No. 4: Basic Concepts and Accounting
Principles Underlying Financial Statements of Business Enterprises, para. 40,
AICPA, New York.
Ball, R. and Brown, P. (1968), An empirical evaluation of accounting income numbers,
Journal of Accounting Research, Vol. 6, pp. 159-178.
Beaver, W. H. (1968), The information content of annual earnings announcements,
Journal of Accounting Research, Vol. 6, pp. 67-92.
Benston, G. J. (1967), Published corporate accounting data and stock prices, Journal of
Accounting Research, Vol. 5, pp. 22-54.
Cascino, S., Pugliese, A., Mussolino, D. and Sansone, C. (2010), The Influence of Fam-
ily Ownership on the Quality of Accounting Information, Family Business Re-
view, Vol. 23, pp. 246-265.
Denis, D. K. and McConnell, J. J. (2003), International corporate governance, Journal
of Financial and Quantitative Analysis, Vol. 38, pp. 1-38.
Gillan, S. L. (2006), Recent Developments in Corporate Governance: An Overview,
Journal of Corporate Finance, Vol. 12, pp. 381-402.
Fields, T. D., Lys, T. Z. and Vincent, L. (2001), Empirical research on accounting
choice, Journal of Accounting and Economics, Vol. 31, pp. 255-307.
Fülbier, R. U. and Weller, M. (2008), Normative Rechnungslegungsforschung im Ab-
seits? Einige wissenschaftstheoretische Anmerkungen, Journal for General Phi-
losophy of Science, Vol. 39, pp. 351-382.
Kinney, W. R., Jr. (1986), Empirical Accounting Research Design for Ph. D. Students,
The Accounting Review, Vol. 61, pp. 338-350.
Oler, D. K., Oler, M. J. and Skousen, C. J. (2010), Characterizing accounting research,
Accounting Horizons, Vol. 24, pp. 635-670.
-11-
What drives voluntary accounting compliance?
Evidence from German Accounting Standards
Tolga Davarcioglu
Abstract: This paper identifies determinants of voluntary compliance with German Accounting Standards (GAS). During 1998 and 2004, publicly listed German firms had the option to choose among three different accounting regimes in order to prepare their consolidated financial statements: German GAAP, IAS/IFRS and US GAAP. Firms that apply German GAAP were supposed to comply, in addition, with GAS. GAS restrict some of the rule-based options of German GAAP, request more disclosure and demand more standardized disclosure. Compliance with GAS is required but not mandatory. I investigate compliance with four different GAS. My results show that compliance for every standard is decided on a case-to-case basis since compliance is significantly lower for standards that restrict popular rule-based options. The results of an ordered logistic regression show that compliance is driven by size, the auditor’s affiliation to the institu-tion that develops the GAS and debt agency problems. I find no relationship between compliance and public exposure. Additional tests investigating the compliance with standards separately show that peer pressure, the auditor and financing needs influence the compliance decision. A change analysis reveals that firms that newly adopt GAS make only minor changes to their cash flow statements and segment reports. Results also suggest that once firms have decided to comply with GAS, this becomes a routine practice implying that firms comply with GAS out of habit or because it has become a standard process. Keywords: voluntary accounting compliance, compliance determinants, German Ac-counting Standards, public exposure, media coverage, peer pressure, cash flow state-ment, segment report

-12-
1 Introduction
In general, the term corporate compliance refers to the existence of laws and regulations
that have to be followed by firms. Lately, corporate compliance is used in a broader
way, encapsulating all measures guarantying that management and employees act
within legal boundaries (Schneider, 2003). A widely accepted definition of corporate
compliance does not exist. Compliance is considered as part of good corporate govern-
ance (Vetter, 2009). For instance, the German Corporate Governance Codex describes
compliance as follows: “The Management Board ensures that all provisions of law and
the enterprise’s internal policies are abided by and works to achieve their compliance by
group companies (compliance)” (Government Commission, 2009). Assuming that com-
pliance with requirements has positive effects, the concept of voluntary compliance is
appealing from an enforcement perspective since it can help to improve regulatory effi-
ciency by reducing enforcement costs (Scholz, 1984). The concept of voluntary compli-
ance refers to the willingness to comply with laws, rules or regulations without the need
to do so. Voluntary compliance plays a role in various parts of corporate disclosure as
for example with (additional) accounting standards or corporate governance related dis-
closure like codes of conduct. This paper identifies determinants of voluntary compli-
ance with German Accounting Standards (GAS) explicitly addressing effects of public
exposure and compliance pressure.
Within accounting research, compliance with corporate disclosure requirements and
accounting standards is a well established research area. Additionally, researchers inves-
tigate why firms voluntarily go beyond disclosure requirements or adopt a non-domestic
accounting set. For example, Inchausti (1997) investigates determinants that affect dis-
closure of compulsory and voluntary information. Insights into disclosure behavior are

-13-
important in order to assess the extent to which disclosure can be left to the market and
where regulation is necessary to guarantee provision of relevant information to different
users. Also, factors influencing adoption of international accounting standards have
been thoroughly investigated in the light of an ongoing internationalization of account-
ing (e.g. El-Gazzar, Finn and Jacob, 1999; Ashbaugh, 2001; Cuijpers and Buijink,
2005). Knowledge about such determinants can be useful in harmonization endeavors.
However, the mere fact that a firm adopts an accounting set does not necessarily imply
that the firm complies with all its requirements. Several studies pick up this concern
(e.g. Street and Bryant, 2000; Street and Gray, 2001; Glaum and Street, 2003). They
show that compliance is different for firms with and without U.S. listings or filings, or
that the compliance degree among firms following IAS/IFRS differs across standards. A
related issue is that of labeling. Adoption or compliance might be a labeling process
where certain accounting standards or accounting regimes are merely used as a brand
name (Ball, 2006). In these cases, firms do not make real changes to their reporting after
the adoption of a new accounting regime (Daske et al., 2009). Studies investigating
compliance can help in finding triggers that encourage compliance or identify neuralgic
areas where enforcement is needed. If compliance is a necessary condition to guarantee
accounting quality, this might ultimately be used to improve accounting quality. How-
ever, it is acknowledged that accounting quality is a multifaceted concept and that it has
different meanings for different recipients of accounting information. In this paper, I
address the question on which determinants drive voluntary compliance with German
Accounting Standards (GAS). In this endeavor, I particularly borrow from institutional
theory in order to shed light on the relation between public pressures and accounting-
related disclosure. Institutional theory posits that firms do not only maximize profits but
also strive for legitimacy. For a firm to be legitimate, its actions need to be congruent
-14-
within a social system of “norms, values, beliefs and definitions” (Suchman, 1995). Ad-
hering to external pressures can lead to external legitimization which in turn can explain
why organizations tend to pursue homogenous practices (DiMaggio and Powell, 1983).
I exploit the German institutional setting during 1998 and 2004 to identify determinants
of voluntary compliance with German Accounting Standards (GAS). The GAS are
standards that are to be complied with in addition to German GAAP. GAS restrict some
of the rule-based options of German GAAP, request more disclosure and demand more
standardized disclosure. Compliance with GAS is required but not mandatory. Prior
evidence of GAS compliance indicates that companies engage in “standard picking”, i.e.
companies comply with some but not all standards. I investigate compliance with the
four German Accounting Standards GAS 2 (Cash Flow Statements), GAS 3 (Segment
Reporting), GAS 4 (Acquisition Accounting in Consolidated Financial Statements) and
GAS 14 (Foreign Currency Translation). The selection of the standards is based on the
extent to which the standards restrict favored rule-based options of German GAAP.
While compliance with two of the standards is possible without a strong deviation from
German GAAP, the other two restrict popular rule-based options. I assume that firms
decide to comply with GAS if the benefits exceed the costs. In order to measure com-
pliance benefits, I draw on evidence found by prior literature (e.g. Dumontier and Raf-
fournier, 1998; Street and Gray, 2001).
The investigation reveals that compliance is significantly lower for the two standards
that restrict popular rule-based options. Since the number of compliant firms with these
standards is too low, I restrict my analyses to the remaining two standards: GAS 2 and
GAS 3. The first standard deals with the preparation of cash flow statements, the latter
with the preparation of segment reports. Utilizing an ordered logistic regression, my
-15-
main finding suggests that a higher level of compliance is driven by (1) size, (2) the
auditor’s affiliation to the institution that develops the GAS and (3) debt agency prob-
lems. I find no evidence that compliance is driven by public exposure. Additional tests
suggest that compliance determinants differ among the standards. Compliance related to
the preparation of cash flow statements is positively associated with size, peer pressure
and debt agency problems, and negatively associated with being audited by a BIG4 au-
dit firm. Compliance related to the preparation of segment reports is positively associ-
ated with size and debt agency problems, and negatively with financing needs. A
change analysis reveals that firms that newly adopt the standards make only minor
changes to their cash flow statement or segment report. The results also suggest that
firms giving a general statement to comply with all GAS make lesser changes to their
cash flow statement and segment report than firms explicitly stating to comply with the
respective standard. Results also suggest that once firms have decided to comply with
GAS, this becomes a routine practice implying that firms comply with GAS out of habit
or because it has become a standard process.
The study contributes to the existing literature by explicitly addressing the effects of
public exposure and peer pressure on voluntary compliance with accounting standards.
In this respect, I add to several studies dealing with voluntary disclosure (e.g. Chow and
Wong-Boren, 1987; Meek, Roberts and Gray, 1995), voluntary adoption of accounting
standards (e.g. Dumontier and Raffournier, 1998; Ashbaugh, 2001; Cuijpers and Bui-
jink, 2005; Gassen and Sellhorn, 2006) and accounting compliance (e.g. Street and Bry-
ant, 2000; Street and Gray, 2001; Glaum and Street, 2003) and to Lim and McKinnon
(1993), who investigate the relationship of political visibility on voluntary disclosure by
statutory authorities. My results also add to a strand of literature dealing with media

-16-
coverage and its interplay with corporate issues like environmental disclosure (Neu,
Warsame and Pedwell, 1998; Cormier, Magnan and van Velthoven, 2005), corporate
governance (Dyck, Volchkova and Zingales, 2008) or auditor decisions (Frost, 1991;
Mutchler, Hopwood and McKeown, 1997; Joe, 2003).
The remainder of the paper proceeds as follows: Section 2 provides the motivation, dis-
cusses relevant literature and provides information about the institutional setting, the
Accounting Standards Committee of Germany and German Accounting Standards. Sec-
tion 3 presents the sample, describes the research design, and provides the analyses and
the results. Section 4 concludes.
2 Background
2.1 Motivation and related studies
The scope of this study is to document factors that are associated with voluntary com-
pliance with German Accounting Standards. The study enhances existing literature by
investigating whether public exposure and compliance pressure drive companies to-
wards voluntary compliance with accounting standards. I exploit the German institu-
tional setting during 1998 and 2004 to test for such a relationship. During that period,
publicly listed German companies had the option to choose between three different ac-
counting regimes in order to prepare their consolidated financial statements: German
GAAP, IAS/IFRS and US GAAP. Firms following German GAAP were required to
comply with GAS in their consolidated financial statements, but were not penalized for
non-compliance by the German legislator. I follow prior literature on the assumption
that a firm chooses to comply when the benefits exceed the costs (e.g. Meek, Roberts
and Gray, 1995; Ashbaugh, 2001). GAS have been developed to enhance the quality of
-17-
German GAAP consolidated financial statements. A firm that prepares its consolidated
financial statement in accordance with German GAAP faces additional costs by adher-
ing to GAS. At least, that is the case wherever additional compliance leads to more dis-
closure or prevents to exert a rule-based option. Since different GAS cover different
aspects of accounting, each standard exhibits different costs. At the same time, compli-
ance is cheaper for firms that are already devoted to accounting practices as proposed by
GAS. Evidence from Gebhardt and Heilmann (2004a; 2004b) hints at the existence of
cheaper and costlier GAS. Among other things, they assess compliance with GAS 4, a
standard which restricts the numerous possibilities offered in German GAAP related to
acquisition accounting. They do not only find that few firms comply with the standard
but also observe firms that state to comply with GAS except for GAS 4. They denote
this as “standard picking”.
The study is further motivated by prior findings concerning the German Corporate Gov-
ernance Code (GCGC). The code gives recommendations for approved best practice.
Like for the GAS, compliance with the code is not mandatory. It follows a comply-or-
explain philosophy, which means that non-compliers have to disclose why they do not
comply with the code. Werder, Talaulicar and Kolat (2005) identify neuralgic norms of
the code. Similar to this study, they identify requirements that firms prefer to ignore.
These neuralgic norms are predominantly related to board member compensation and
accounting requirements. While they link compliance to size, they encourage more re-
search on this topic. Findings of Goncharov, Werner and Zimmermann (2006) suggest
that compliance with the GCGC is value relevant for the capital market.
I expect the observed standard picking to be related to public exposure and compliance
pressure. Particularly the environmental disclosure literature provides some evidence on

-18-
the connection between public exposure, compliance pressure and corporate disclosure.
Solomon and Lewis (2002) survey three groups1 on their views on possible incentives
and disincentives for voluntary corporate environmental disclosure in the UK. Strik-
ingly, improvement of the company’s corporate image received highest scores among
recipients of corporate environmental disclosure. Lowest scores were given to meeting
demands for environmental information and meeting company ethics, respectively. On
the other hand, acknowledging social responsibility received highest and peer pressure
between firms in the same industry received lowest scores from the company group.
Peer pressure was mid-ranked by the other two groups. These results indicate that the
company respondents viewed their incentives to be more altruistic in comparison to the
other two groups that regarded the incentives to be more marketing, corporate image
and peer pressure related. The survey results are backed for example by Neu, Warsame
and Pedwell (1998) and Cormier, Magnan and van Velthoven (2005). Addressing the
effects of public pressures, they show a positive relationship between media coverage
and environmental disclosure. Rather little is known about the relationship between
public pressure and accounting-related disclosure. Lim and McKinnon (1993) investi-
gate the impact of political visibility and voluntary disclosure of statutory authorities in
New South Wales, Australia. They describe political visibility as an increased attraction
by politicians, organized groups like trade unions and the general public. They find that
a higher political visibility is positively associated with more disclosure of financial and
non-financial information. This association does not hold for information that is sensi-
tive in nature.
1 Solomon and Lewis distinguish between an interested party group, a normative group and a company
group. The first group is considered as users of the provided information. The normative group is not necessarily considered as users but as an expertise group that has a strong opinion about what informa-tion is requested and required by the users. I subsume these groups to recipients of environmental dis-closure.
-19-
Finally, the study relates to literature dealing with effects of media coverage.
Frost (1991), Mutchler, Hopwood and McKeown (1997) and Joe (2003) investigate
media coverage and effects on the auditor and audit opinion. Rather few studies are re-
lated to media coverage and corporate governance. Dyck, Volchkova and Zingales
(2008) study effects of media coverage in Russia. They show that increased media cov-
erage increases the probability to reverse a corporate governance violation.
2.2 The institutional setting in Germany
2.2.1 The Accounting Standards Committee of Germany and German Ac-
counting Standards
Developments concerning accounting in Germany during the 1990’s were characterized
by an ongoing process of internationalization (Nobes, 2006). German companies were
faced by a demand for accounting information by international investors. As a conse-
quence, some companies prepared their consolidated financial statements in compliance
with German GAAP (Handelsgesetzbuch - HGB), while simultaneously complying with
international standards, i.e. IAS/IFRS or US GAAP; this was also known as dual ac-
counting. Dual accounting generally does not result in conformity with both accounting
regimes, but alleviates differences in the accounting regimes. This is predominantly
achieved by exploiting rule-based options. Other companies chose to comply with Ger-
man GAAP in parallel with international standards; this procedure results in two differ-
ent financial statements. One disadvantage of this method is that differing accounting
regimes produce differing accounting figures. These figures can strongly deviate from
each other and result in confusion of potential investors. Ease was brought by the Ger-
man Capital Raising Facilitation Act (Kapitalaufnahmeerleichterungsgesetz - KapAEG)
of 1998, permitting publicly listed companies to prepare a consolidated financial state-
-20-
ment according to international accounting standards (IAS/IFRS or US GAAP) instead
of a German GAAP statement until the end of 2004. As a consequence, German com-
panies were allowed to choose between three different accounting regimes during 1998
and 2004.
This diversity was enriched by the Corporate Sector Supervision and Transparency Act
(Gesetz zur Kontrolle und Transparenz im Unternehmensbereich - KonTraG), passed in
1998. The Act enabled the Federal Ministry of Justice (FMJ) to approve a private or-
ganization to set standards. This led to the Standardization Agreement (Standardis-
ierungsvertrag) of September 1998 between the Federal Ministry of Justice and the Ac-
counting Standards Committee of Germany (ASCG; Deutsches Rechnungslegungs
Standards Committee e.V. - DRSC), the German private standard setter. The ASCG is a
registered association. Among other things, the ASCG became responsible for elaborat-
ing recommendations concerning the application of principles of consolidated financial
statements. Structure and mode of operation of the ASCG are roughly comparable to the
International Accounting Standards Committee Foundation (IASCF). The German Ac-
counting Standards Board (GASB; Deutscher Standardisierungsrat - DSR) is supposed
to achieve the committee’s chartered goals. Like the International Accounting Standards
Board (IASB), the GASB has the responsibility to prepare accounting-related state-
ments like discussion papers or the German Accounting Standards (GAS; Deutsche
Rechnungslegungs Standards - DRS).
The ASCG faced manifold criticism since its foundation (Sing, 2004). A strongly de-
bated topic is the standards’ (missing) binding character, also referred to as ‘missing
grip’ (Küting and Hütten, 1999). This is a crucial point to the investigation and needs to
be considered from a legal perspective. Sometimes, the terms “norm” (Biener, 1996) or

-21-
“qualified norm” (Beisse, 1999) were used in connection with the GAS. These terms are
not to be interpreted in a legal understanding (Paal, 2001). A GAS adopted from the
committee does not deploy a binding character. Rather, a GAS has the characteristic of
a recommendation. It becomes binding only after the Federal Ministry of Justice prom-
ulgates the standards. Consolidated financial statements that comply with promulgated
GAS are subject to the assumption of being in line with rules of orderly bookkeeping
(Grundsätze ordnungsmäßiger Buchführung - GoB) as implied by para. 342
sect. 2 HGB. The necessity to promulgate the standards first is also referred to as “co-
operative solution” (Pellens, Bonse and Gassen, 1998).
Nevertheless, even after promulgation by the Federal Ministry of Justice, the necessity
to comply with GAS needs further assessment. It is widely accepted that promulgation
by the FMJ implies a GAS to be in line with current legislation. This is not only stipu-
lated by the Standardization Agreement (DRSC, 1998), but is also an accepted percep-
tion in the literature (Beisse, 1999). However, complying with the standards leads to the
assumption of being in line with rules of orderly bookkeeping. The GAS do not have
the same authority as laws or ordinances (Ernst, 1998). This is because in the context of
constitutional law, legislation is only incumbent on the legislator (art. 20 sect. 2 sent. 1,
art. 70 Basic Law for the Federal Republic of Germany). The legislator is allowed to
delegate this task under very restrictive conditions. Since the ASCG has not explicitly
been entrusted with this task, the standards are not enacted (Budde and Steuber, 1998;
Förschle, 2006).
Still, the implications of the word assumption remain unclear. Especially in the early
stages of the committee, some authors perceived para 342 sect. 2 HGB to be a legal pre-
sumption (Rechtsvermutung; Paal, 2001). However, the circumstance that a financial
-22-
statement is in line with current regulations cannot be assumed. This circumstance
needs legal assessment (Hommelhoff and Schwab, 1998). Proponents of this perception
argue that the assumption does not relate to a matter of fact but to a behavior. Comply-
ing with GAS (behavior) leads to a financial statement that is in line with rules of or-
derly bookkeeping (legal consequence). But whether that financial statement fulfills
legal requirements needs ultimate clarification by legal assessment (Hellermann, 2000).
The consequence for any individual case is that this assessment remains within the
scope of courts. Thus, a consolidated financial statement prepared in compliance with
GAS should prove to be useful in the case of a legal dispute when facing a court
(Spannheimer, 2000; Hommelhoff and Schwab, 2002). I follow the perception that the
legislator wanted to achieve a factual enforcement of the standards without a legal ne-
cessity to comply with the GAS (Spannheimer, 2000). Hence, complying with GAS
leads to the assumption that the consolidated financial statement is in line with rules of
orderly bookkeeping, but non-compliance does not result in direct legal penalties (Hüt-
ten and Brakensiek, 2000).
Summarizing, the described setting features the particularity that firms following Ger-
man GAAP were also required to comply with an additional set of accounting stan-
dards: the GAS. The GAS have the purpose to enhance the quality of consolidated fi-
nancial statements. Since no direct legal penalties are associated with non-compliance,
following the GAS can be considered voluntary. In this respect, it offers a quasi-
experimental setting that allows an investigation on what drives voluntary compliance
with an additional set of accounting standards.
-23-
2.2.2 Investigated German Accounting Standards
German Accounting Standards predominantly deal with aspects of German consolidated
financial statements. GAS often relate to cases where uniform accounting practice is not
stipulated either because of the existence of rule-based options or because existing rules
are not explicit. I hand-collected data on compliance with GAS 2, GAS 3, GAS 4 and
GAS 14. The standards are presented subsequently.
GAS 2: Cash flow statements
Before 1998, a cash flow statement was not a mandatory part of a German GAAP con-
solidated financial statement. Because of missing regulations, the Accounting and Au-
diting Board (Hauptfachausschuss - HFA)2 together with a working group of the
Schmalenbach Society (Schmalenbach-Gesellschaft für Betriebswirtschaft e.V.) created
a pronouncement on how to prepare cash flow statements (HFA, 1995). Overall, this
pronouncement was very close to SFAS 95 and IAS 7. When the KonTraG was passed,
para. 297 sect. 1 sent. 2 HGB was modified, making cash flow statements a mandatory
part of consolidated financial statements for publicly listed companies. German GAAP
does not state any specifications with regard to content or form. Because of this, GAS 2
features guidelines on how to prepare a cash flow statement. GAS 2 is closely related to
the guidelines published by the HFA. Particularly, it requires the cash flow statement to
be aligned in vertical format, asks for minimum classification requirements and distin-
guishes between cash flows from operating activities, investing activities and financing
activities. Overall, GAS 2 demands more standardized disclosure but does not impose
existing rule-based options.
2 The Accounting and Auditing Board is a permanent board of the Institute of Public Auditors in Ger-
many, Incorporated Association (Institut der Wirtschaftsprüfer in Deutschland e.V. - IDW). The insti-tute fulfills several tasks related to the profession of auditing, among other, developing pronounce-ments to accounting-related topics.
-24-
GAS 3: Segment reporting
Like cash flow statements, segment reports became a mandatory part of consolidated
financial statements in 1998. Similar to cash flow statements, German GAAP provides
no specifications concerning the structure of a segment report. These specifications are
provided by GAS 3. The standard can be seen as a mixture of IAS 14 and SFAS 131
with some additional requirements. Segments are identified by the management ap-
proach. GAS 3 requires disclosure with respect to how segments are identified, segment
descriptions, balance sheet numbers and income numbers like revenues, assets or liabili-
ties. It is notable that GAS 3 exceeds the international regulations in some aspects.
Unlike IAS 14, GAS 3 requires to disclose business with dominant clients or details
with respect to confinement of segments. Similar to GAS 2, compliance with GAS 3
does not restrict rule-based options but gives guidelines on disclosure. Certainly, GAS 3
is more restrictive than mere compliance with German GAAP as it might result in dis-
closure of sensible data to competitors.
GAS 4: Acquisition accounting in consolidated financial statements
GAS 4 deals with acquisition accounting. It provides a more detailed guideline and re-
stricts some of the rule-based options offered by German GAAP. With regard to initial
consolidation of a subsidiary, GAS 4 mandates that it shall be carried out as of the date
of acquisition of the subsidiary. German GAAP also allows later points in time for ini-
tial consolidation of subsidiaries (para. 301 sect. 2 HGB; GAS 4.7; GAS 4.9). Of par-
ticular interest is GAS 4 with regard to the consolidation method. The standard man-
dates the fair value purchase method and abolishes the possibility of using the book
value method. The book value method is popular among German companies since more
hidden reserves are disclosed as compared to using the fair value purchase method

-25-
(Gebhardt and Heilmann, 2004b). Finally, GAS 4 mandates to recognize the goodwill as
an asset that needs to be amortized over its expected useful life. This limits the possibil-
ity to offset the goodwill against retained earnings, which is income neutral and very
popular among German firms (Krämling, 1998).
GAS 14: Foreign Currency Translation
German GAAP requires consolidated financial statements to be disclosed in Euro, but it
does not specify how statements in a foreign currency are to be translated. Over the
years, numerous possible methods were discussed. The HFA announcement of 1998
proposed the use of the current/closing rate method and the temporal principal of trans-
lation depending on the economic situation of the subsidiary (HFA, 1998). Prior results
show that the use of the latter method is unpopular among German companies, which is
interpreted as unwillingness to perform the more complex temporal principal of transla-
tion (Gelhausen and Mujkanovic, 1995; Littkemann and Moedebeck, 2000). GAS 14
requires companies to translate foreign accounting records according to the concept of
functional currency. As a consequence, companies first have to assess whether the cur-
rent/closing rate method or the temporal principal of translation is appropriate for trans-
lation. Overall, GAS 14 is very close to the HFA announcement. GAS 14 restricts the
use of the current/closing rate method which is favored by German companies.
Expectations on compliance
I expect different degrees of compliance because some of the standards cover broader
aspects like disclosure requirements, while other standards restrict popular rule-based
options offered by German GAAP. I expect compliance with GAS 2 and GAS 3 to be
higher than with GAS 4 and GAS 14. Evidence of Gebhardt and Heilmann (2004a;
2004b) supports these expectations. Gebhardt and Heilmann (2004b) investigate com-
-26-
pliance with GAS 4 in the years 2001 (75 companies) and 2002 (53 companies). They
do not only find low compliance with GAS 4, but even observe companies applying
GAS while explicitly ignoring GAS 4. They also report compliance with GAS 2 and
GAS 3, which is significantly higher.
2.3 Prior findings and hypotheses development
As of my knowledge, there is no prior literature on determinants of compliance with
GAS. The German setting between 1998 and 2004 is somewhat unique. I see strong
similarities to voluntary disclosure, voluntary adoption of international accounting stan-
dards and compliance with international accounting standards. Consequently, I draw on
prior findings of these literature streams in order to assess compliance benefits. I add to
prior findings by addressing effects of public exposure and compliance pressure.
An influence of public exposure and compliance pressure on disclosure and compliance
can be particularly expected from the view point of legitimacy theory. Under the legiti-
macy theory, a firm’s management is responsive to community expectations (Patten,
1991). For a firm to be legitimate, its actions need to be congruent within a social sys-
tem of “norms, values, beliefs and definitions” (Suchman, 1995). According to Maurer
(1971) “legitimation is the process whereby an organization justifies to a peer or su-
perordinate system its right to exist”. Consequently, a firm will take actions that are
accepted within the community that the firm is a part of. Applied to corporate disclo-
sure, especially the annual report may give account on whether the management fulfills
community expectations (Wilmshurst and Frost, 2000). Following this line of argu-
ments, the need to legitimize actions should be higher for firms that are more publicly
exposed to a community or when peers take measures that are accepted by the commu-
-27-
nity. Subsequently, I present the measures that are used to capture public exposure and
compliance pressure.
Public exposure
I hypothesize that public exposure positively influences compliance with GAS. Public
exposure is difficult to pinpoint and not necessarily captured by size. Large companies
can stay unnoticed because they operate as suppliers, while small companies might be
popular for special products. Also, companies of certain industries are more exposed
because of their operating activities. For example, the interest in chemical or utility
companies is strong due to their environmental actions or pricing behavior. Earlier stud-
ies draw on media coverage to measure public pressures (e.g. Neu, Warsame and Ped-
well, 1998; Cormier, Magnan and van Velthoven, 2005). I follow prior literature in this
approach by drawing on a firm’s coverage in the German press. I use LexisNexis to find
the number of articles related to a firm. I also propose an alternative approach to meas-
ure public exposure. Press coverage might be biased as a measure for public exposure.
Bias might result from a disproportionate share of business-related press. Larger com-
panies have more business-related news, a circumstance that might bias media coverage
towards larger companies. This is part of public exposure but ignores other factors e.g.
that some companies interact more with customers and clients, or that public interest is
stronger for some companies than for others. Because of this, I propose to capture pub-
lic exposure by the number of produced hits of a search request on the search engine
Google. I see this measure to be more advantageous with regard to the aforementioned
shortcoming because a search query encapsulates hits to business-related topics but for
example also finds company profiles, job advertisements or product presentations on
websites. This method also comes with a disadvantage. Unfortunately, I do not have
-28-
Google hits as of the end of the considered observation year. Hence, I draw on search
results as of the year 2008. In this respect, I assume that public exposure is relatively
stable over time.
Compliance pressure
The findings of Solomon and Lewis (2002) suggest that peer pressure influences com-
pany behavior in terms of corporate disclosure. From another perspective, Gleason,
Jenkins and Johnson (2008) show that investors reassess financial statements within one
industry, when a firm of that industry restates its financial statement. This finding im-
plies that managers should be well aware of corporate decisions made by their competi-
tors. I use the setting at hand to investigate whether peer pressure induces compliance
with GAS. I expect that a non-compliant company which belongs to an industry with
numerous compliers is faced by compliance pressure in order to show that its financial
statements are at least prepared using the same quality standards as those used by its
competitors.
Compliance pressure might also be exerted by affiliations to a group. The ASCG is a
registered association. Individuals that are qualified in the area of accounting can apply
for membership in the association. Membership is also possible for firms under certain
circumstances. Audit firms are found in the membership list, as well. I assess whether
the circumstance that the auditor is a member of the ASCG is associated with GAS
compliance.
Size
Prior results indicate a positive relationship between voluntary disclosure or voluntary
adoption of international accounting standards and size (e.g. Meek, Roberts and Gray,
-29-
1995; Ashbaugh, 2001; Cuijpers and Buijink, 2005). It remains unclear, which mecha-
nism is behind the disclosure and size relationship. The following explanations are con-
sidered in the literature: Disclosure is costly. Bigger firms are believed to have lower
information production costs, benefiting from distributing fix costs associated with dis-
closure to more pieces of information (Firth, 1979). Also, big companies might have
lower costs of competitive disadvantage associated with disclosure of sensitive informa-
tion (Meek, Roberts and Gray, 1995). Another reason for expecting a positive relation
between size and disclosure may root in a relationship between size and political costs
(Watts and Zimmerman, 1986). Accordingly, bigger firms are under higher observation
from the government, regulatory agencies or private sector interest groups like labor
unions. Hence, I expect a positive relationship between size and GAS compliance.
Growth opportunity
Smith and Watts (1992) argue that information asymmetry and agency costs are higher
for growth firms since managers have more knowledge about the firm’s investment op-
portunities and of expected future cash flows. Hence, in the presence of growth oppor-
tunities, firms might increase their disclosure in order to overcome information asym-
metries. This argument is especially prone for voluntary disclosure since mandated dis-
closure might not be sufficiently suitable in order to provide enough quality for the re-
cipients of accounting information (Core, 2001). On the other hand, Glaum and Street
(2003) argue that growth opportunities might have a negative impact on compliance
with disclosure requirements due to more merger and acquisition activities which might
challenge a firm’s accounting practice. Due to the contradicting explanations, I do not
make predictions regarding its effect on compliance with GAS.
-30-
Risk
In the presence of more information asymmetries, the valuation of riskier firms is con-
sidered to be more difficult for investors. In this respect, investors might incorporate the
probability that a firm withholds unfavorable information that might be relevant for the
valuation of a firm or the consideration of a firm’s default risk (Sengupta, 1998). In or-
der to overcome valuation difficulties, investors are expected to collect more informa-
tion, which is costly (Cormier, Magnan and van Velthoven, 2005). Firms can mitigate
these costs by providing more disclosure. Compliance with GAS is subject to this ar-
gument in two ways. First, compliance with GAS is often associated with increased
disclosure. Second, compliance is associated with the establishment of more standard-
ized disclosure that is easier to process. For both reasons, I expect that compliance is
positively associated with more risky firms.
Financing needs
A firm’s financing needs have been associated with disclosure. Firms that have financ-
ing needs exceeding their internal resources might suffer from a shortage of external
funding due to the existence of asymmetric information between the firm and investors
(Petersen and Rajan, 1994). The asymmetric information is caused by the opacity of a
firm. The willingness of investors to invest into a firm is higher when there is more
transparency which reduces the danger of adverse selection. This may be particularly
relevant for voluntary disclosure since mandated disclosure might not suffice to over-
come asymmetric information (Hyytinen and Pajarinen, 2005). A positive association
between financing needs and disclosure is documented by Frankel, McNichols and Wil-
son (1995). Such a relationship is also conceivable in the setting at hand for several rea-
sons. First, GAS have been designed to guarantee or increase disclosure quality. Conse-

-31-
quently, compliance could convey decision-useful information. Second, compliance
could be interpreted as signal that the firm is rule-abiding and consequently, trustwor-
thy. Hence, I expect a positive relationship between compliance and financing needs.
Debt agency problems
Prior literature investigated the effect of higher debt agency problems on disclosure.
The general idea is that increased corporate disclosure allows creditors an easier as-
sessment of a firm’s ability to pay back its debt and whether firms violate debt cove-
nants (Smith and Warner, 1979; Jaggi and Low, 2000). Typically, debt agency problems
are measured by leverage (Chow and Wong-Boren, 1987; Meek, Roberts and Gray,
1995; Raffournier, 1995). While there is agreement that higher debt concentration im-
plies higher agency costs of debt, there is no consensus whether this implies higher or
lower disclosure (compare e.g. Chow and Wong-Boren, 1987; Eng and Mak, 2003).
Higher disclosure would stem from more information especially relating to debt cove-
nants. On the other hand, Zarzeski (1996) argues that companies with a high leverage in
bank-oriented countries have a lower need to disclose information because banks are
insiders to the company, possessing other means of obtaining information. Since theory
and empirical evidence are mixed, I make no predictions between compliance and debt
agency problems.
International activities
With an ongoing internationalization of business, companies are faced by an increased
demand for information by foreign stake- and shareholders. This may be the case even
without a listing on foreign stock exchanges but because international operations are
associated with a higher visibility by customers, suppliers or local authorities (Dumon-
tier and Raffournier, 1998). For example, Raffournier (1995) documents a positive rela-

-32-
tionship between international activity and disclosure for Swiss firms. Dumontier and
Raffournier (1998) find a positive relation between voluntary compliance with IAS and
international activities. While the GAS aim to make German accounting more compara-
ble and compatible with international standards, it seems reasonable that firms that are
really inclined to reach out to international investors would rather choose to adopt inter-
national standards. Because of this, I interpret compliance with GAS mainly as commu-
nication with domestic shareholders. As a consequence, I make no predictions on the
relationship of adopting GAS 2. I expect a positive relationship between international
activities and GAS 3 because multi-national companies have a higher need to commu-
nicate their national and international activities.
Profitability
The disclosure literature argues that profitable companies would want to be recognized
in order to attract potential investors. On the other hand, high disclosure might bear
costs in form of loss of competitive advantages or bargaining power (Admati and Pflei-
derer, 2000). Empirical results on the relationship between profitability and voluntary
disclosure are mixed. Singhvi and Desai (1971) and Wallace and Naser (1995) find a
positive impact on disclosure. Meek, Roberts and Gray (1995) do not find such a rela-
tionship. Dumontier and Raffournier (1998) find no such relationship for IAS compli-
ance. Also, Cormier, Magnan and van Velthoven (2005) do not find a relationship be-
tween firm performance and environmental disclosure. It is important to note that the
studies investigate the impact on different aspects of disclosure. In the light of contra-
dicting theoretical explanations and empirical evidence, no prediction between compli-
ance and profitability is made. Within the course of the investigation, I am not con-
-33-
cerned about tax considerations, since consolidated financial statements are not used as
a tax base in Germany.
Ownership
The structure of ownership is discussed in association with disclosure since it influences
the level of monitoring and hereby the level of disclosure. Generally, the interests be-
tween managers and shareholders are not aligned since managers have incentives to
consume perks or reduce work effort (Jensen and Meckling, 1976). This holds true es-
pecially when managerial ownership is low. If shareholders anticipate such disadvanta-
geous behavior, they will transfer the expected costs to the managers. High stock own-
ership concentration should decrease the need for disclosure because of direct proximity
to the company enabling an easier access to information. Consequently, if ownership is
more disperse, high disclosure can be an instrument to reassure shareholders that man-
agement acts in favor of the shareholders. Following Cuijpers and Buijink (2005), I ex-
pect a negative relationship between compliance and stock ownership concentration.
Complexity
More complex firms might be more difficult to be analyzed by investors (Nagar, Nanda
and Wysocki, 2003). Consequently, more complex firms are more likely to benefit from
increased disclosure. While this argument is valid in the preparation of cash flow state-
ments, it should especially hold true for requirements dealing with segment reporting.
Accordingly, I expect a positive relationship with compliance.
Listing status
Several studies consider the effect of listing and filing requirements on disclosure or
adoption of accounting standards. Because the institutional settings and/or the variables
-34-
of interest differ in the studies, different measures for listing status are used. For exam-
ple, El-Gazzar, Finn and Jacob (1999) and Ashbaugh (2001) draw on the number of
foreign stock exchange listings, while Cuijpers and Buijink (2005) distinguish between
EU and non-EU listings to proxy for international exposure. On the other hand, Cooke
(1989) is interested in differences of non-listed and listed companies in voluntary dis-
closure in Sweden. As I only consider listed companies, a distinction between listed and
not listed companies is irrelevant. Because I consider the use of GAS primarily as a
communication instrument with domestic stakeholders, I measure whether the company
is part of one of the selection indices (1) DAX (blue-chips), (2) MDAX (mid caps) and
(3) SDAX (small caps) within the Frankfurt Stock Exchange, operated by Deutsche
Börse. Being listed in one of these selection indices is associated with restrictions to
size and market capitalization as well as higher disclosure requirements. Also, members
of the selection indices compete for investors, which induces a need to produce high
quality accounting disclosure. As a consequence, I expect a positive relationship be-
tween a listing in the selection indices and GAS compliance. This is in line with prior
findings, e.g. Cooke (1989), Dumontier and Raffournier (1998) or Street and Bryant
(2000). I also control for foreign listings but since I perceive compliance with GAS
mainly as relevant for domestic investors, I make no prediction regarding the sign.
Auditor
Prior literature posits a possible relationship between the auditor and the client’s policy
regarding corporate disclosure or compliance with accounting standards. Particularly,
large audit firms are believed to encourage a higher level of disclosure or compliance.
The IAS/IFRS literature stream argues that large firm auditors have the possibility to
access a broader range of knowledge and have superior training concerning interna-
-35-
tional accounting standards, which positively influences compliance. Dumontier and
Raffournier (1998) find no such relationship, while Street and Gray (2001) find a sig-
nificantly positive relationship between audit firm size and IAS/IFRS compliance.
There is no reason to believe that the former argument should hold for the national set-
ting at hand.
Another argument is related to reputation. Large audit firms are believed to make their
clients comply with disclosure or accounting requirements in order to demonstrate their
independence. Independence is considered as an important factor constituting reputation
(Watts and Zimmerman, 1986). Empirical evidence on this matter is mixed. For exam-
ple, Singhvi and Desai (1971) and Raffournier (1995) find a positive relationship, Hos-
sain, Perera and Rahman (1995) find no relationship while Wallace and Naser (1995)
find a negative relationship. It is important to note that these studies are subject to dif-
ferent institutional settings, definitions of big audit firms (Big 8 vs. Big 6) and depend-
ent variables. I expect a positive relationship with GAS compliance for different rea-
sons. First, GAS were designed to harmonize German GAAP and international stan-
dards of supposed higher quality. If the reputation argument holds, this should work
towards compliance. Second, auditors might want their clients to comply with stan-
dards, which are closer to international standards with regard to mandatory use of
IAS/IFRS after 2004. Third, while usage of GAS is not mandatory, in cases of legal
disputes, a statement adhering to GAS might still be of advantage.
Industry
The disclosure literature argues that membership to a certain industry might affect dis-
closure due to proprietary costs (Verrecchia, 1983). On the one hand, disclosure of cer-
tain pieces of information can be more important in one industry than in another. On the
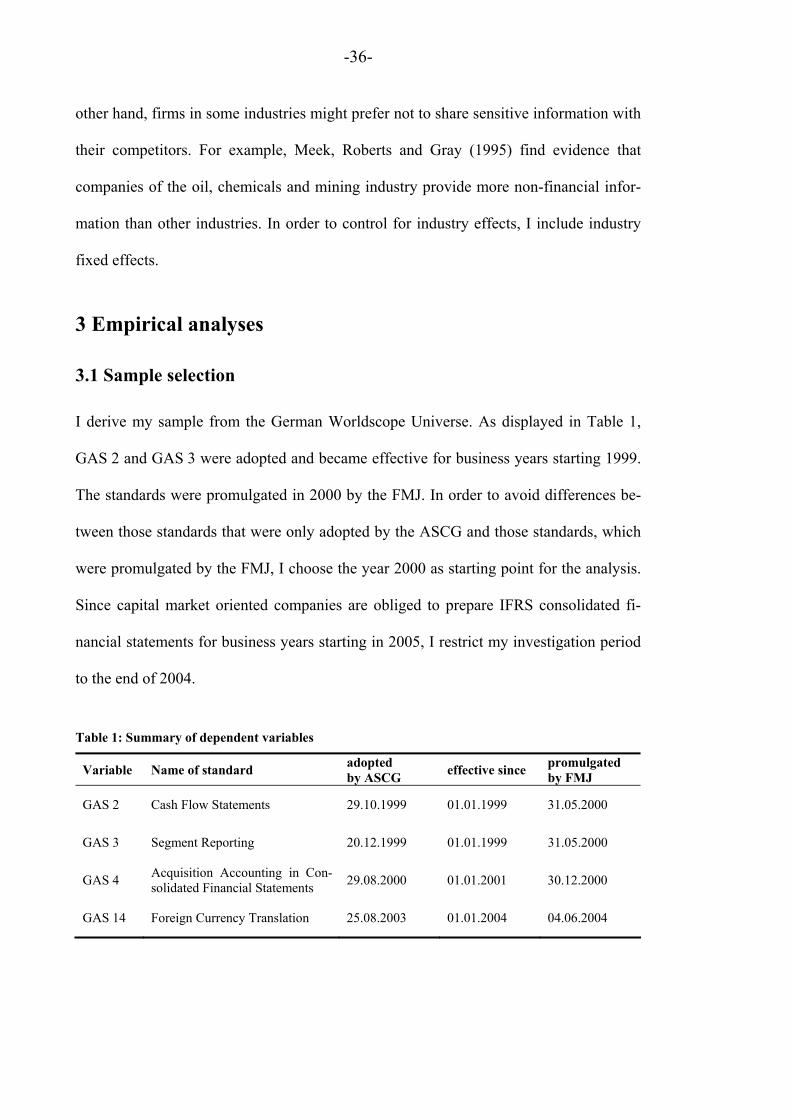
-36-
other hand, firms in some industries might prefer not to share sensitive information with
their competitors. For example, Meek, Roberts and Gray (1995) find evidence that
companies of the oil, chemicals and mining industry provide more non-financial infor-
mation than other industries. In order to control for industry effects, I include industry
fixed effects.
3 Empirical analyses
3.1 Sample selection
I derive my sample from the German Worldscope Universe. As displayed in Table 1,
GAS 2 and GAS 3 were adopted and became effective for business years starting 1999.
The standards were promulgated in 2000 by the FMJ. In order to avoid differences be-
tween those standards that were only adopted by the ASCG and those standards, which
were promulgated by the FMJ, I choose the year 2000 as starting point for the analysis.
Since capital market oriented companies are obliged to prepare IFRS consolidated fi-
nancial statements for business years starting in 2005, I restrict my investigation period
to the end of 2004.
Table 1: Summary of dependent variables
Variable Name of standard adopted by ASCG
effective since promulgated by FMJ
GAS 2 Cash Flow Statements 29.10.1999 01.01.1999 31.05.2000
GAS 3 Segment Reporting 20.12.1999 01.01.1999 31.05.2000
GAS 4 Acquisition Accounting in Con-solidated Financial Statements
29.08.2000 01.01.2001 30.12.2000
GAS 14 Foreign Currency Translation 25.08.2003 01.01.2004 04.06.2004
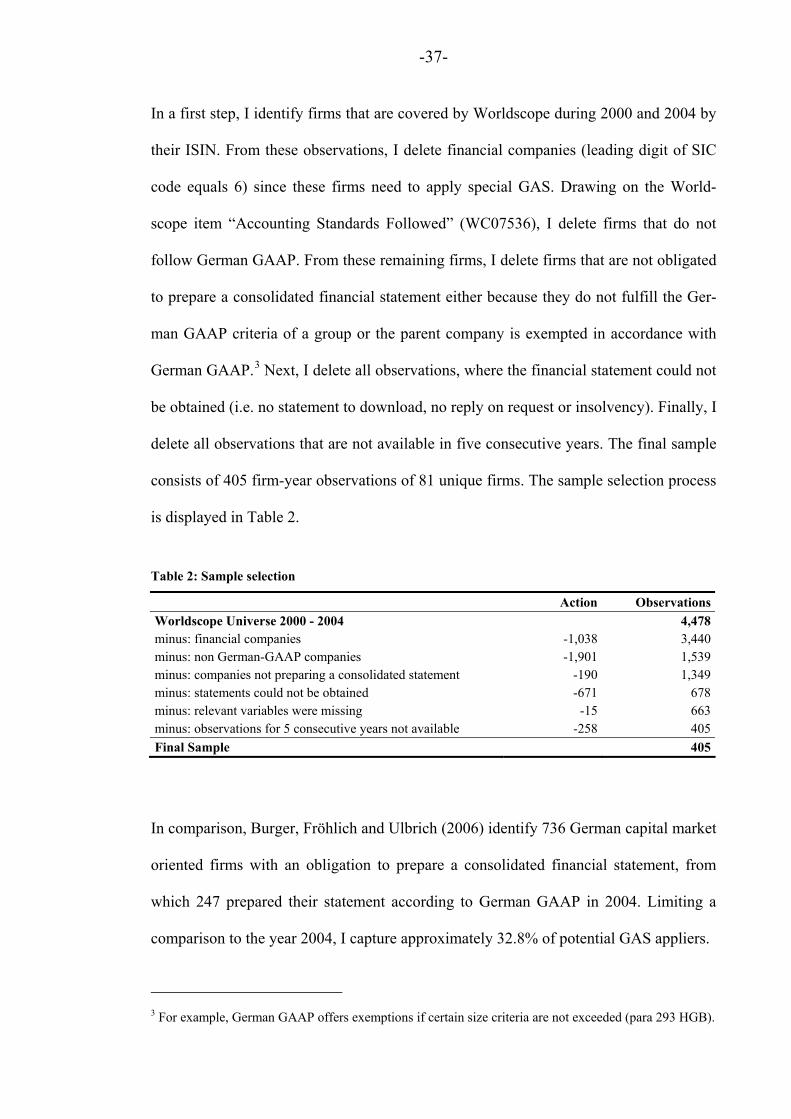
-37-
In a first step, I identify firms that are covered by Worldscope during 2000 and 2004 by
their ISIN. From these observations, I delete financial companies (leading digit of SIC
code equals 6) since these firms need to apply special GAS. Drawing on the World-
scope item “Accounting Standards Followed” (WC07536), I delete firms that do not
follow German GAAP. From these remaining firms, I delete firms that are not obligated
to prepare a consolidated financial statement either because they do not fulfill the Ger-
man GAAP criteria of a group or the parent company is exempted in accordance with
German GAAP.3 Next, I delete all observations, where the financial statement could not
be obtained (i.e. no statement to download, no reply on request or insolvency). Finally, I
delete all observations that are not available in five consecutive years. The final sample
consists of 405 firm-year observations of 81 unique firms. The sample selection process
is displayed in Table 2.
Table 2: Sample selection
Action Observations
Worldscope Universe 2000 - 2004 4,478minus: financial companies -1,038 3,440minus: non German-GAAP companies -1,901 1,539minus: companies not preparing a consolidated statement -190 1,349minus: statements could not be obtained -671 678minus: relevant variables were missing -15 663minus: observations for 5 consecutive years not available -258 405
Final Sample 405
In comparison, Burger, Fröhlich and Ulbrich (2006) identify 736 German capital market
oriented firms with an obligation to prepare a consolidated financial statement, from
which 247 prepared their statement according to German GAAP in 2004. Limiting a
comparison to the year 2004, I capture approximately 32.8% of potential GAS appliers.
3 For example, German GAAP offers exemptions if certain size criteria are not exceeded (para 293 HGB).

-38-
Table 3 shows the distribution of the sample firms by industry. The industry classifica-
tion bases on the SIC division structure. The majority of the sample firms belong to the
manufacturing industry.
Table 3: Distribution of sample firms by industry group (n=81)
Industry group n %
Division A: Agriculture, Forestry, And Fishing 0 0.00%
Division B: Mining 2 2.47%
Division C: Construction 1 1.23%
Division D: Manufacturing 44 54.32%
Division E: Transportation, Communications, Electric, Gas, And Sanitary Services 6 7.41%
Division F: Wholesale Trade 9 11.11%
Division G: Retail Trade 6 7.41%
Division H: Finance, Insurance, And Real Estate 0 0.00%
Division I: Services 13 16.05%
Division J: Public Administration 0 0.00%
Total 81 100.00%
Notes: Industry classification bases on the SIC division structure. No firm belongs to Division H since all Fi-nance, Insurance and Real Estate firms were deleted from the sample.
3.2 Empirical measures
3.2.1 Compliance with GAS in the sample
I first assess compliance with the respective standards. Results are summarized in Ta-
ble 4. Notably, the number of firms complying with GAS 4 and GAS 14 is considerably
low. Only one firm (1.23%) complies with GAS 4 and only nine firms (14.06%) out of
64 possible appliers comply with GAS 14. The number of GAS 14 compliers and non-
compliers does not sum up to 81 because not every firm has foreign subsidiaries. Com-
pared to GAS 2 and GAS 3, a clear difference in the willingness to comply with the
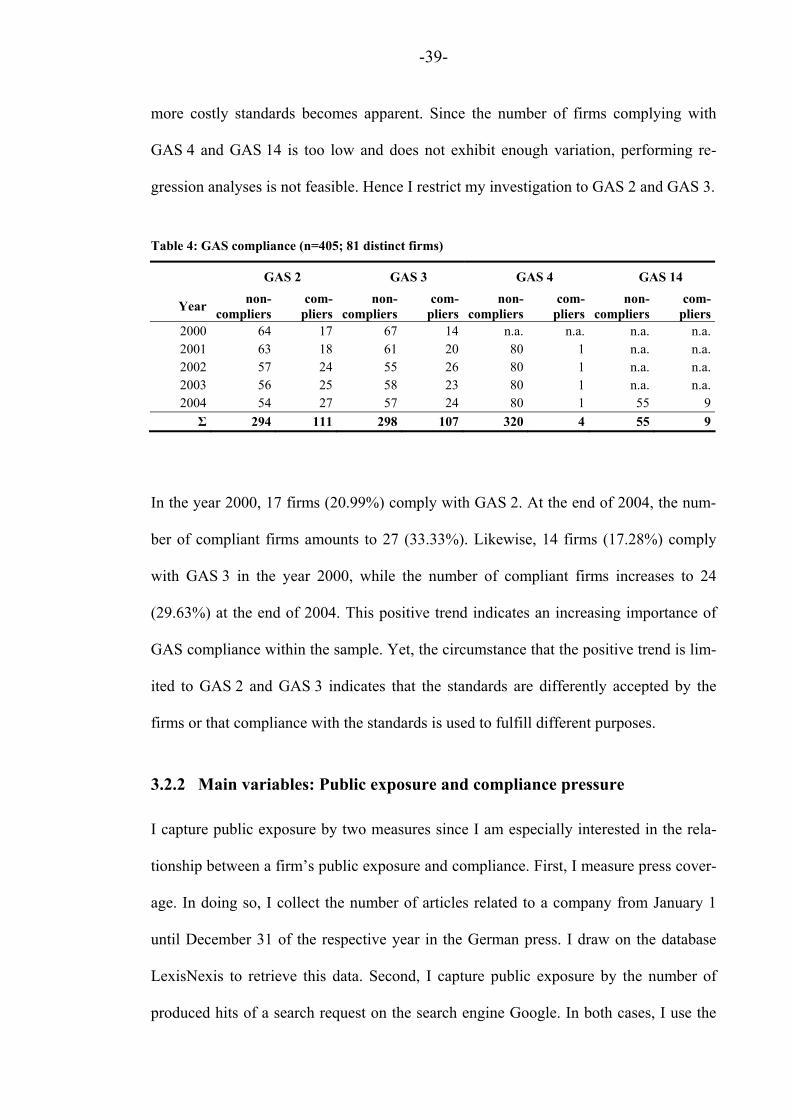
-39-
more costly standards becomes apparent. Since the number of firms complying with
GAS 4 and GAS 14 is too low and does not exhibit enough variation, performing re-
gression analyses is not feasible. Hence I restrict my investigation to GAS 2 and GAS 3.
Table 4: GAS compliance (n=405; 81 distinct firms)
GAS 2 GAS 3 GAS 4 GAS 14
Year non-
compliers com-
pliersnon-
complierscom-
pliersnon-
complierscom-
pliers non-
compliers com-
pliers2000 64 17 67 14 n.a. n.a. n.a. n.a.2001 63 18 61 20 80 1 n.a. n.a.2002 57 24 55 26 80 1 n.a. n.a.2003 56 25 58 23 80 1 n.a. n.a.2004 54 27 57 24 80 1 55 9
Σ 294 111 298 107 320 4 55 9
In the year 2000, 17 firms (20.99%) comply with GAS 2. At the end of 2004, the num-
ber of compliant firms amounts to 27 (33.33%). Likewise, 14 firms (17.28%) comply
with GAS 3 in the year 2000, while the number of compliant firms increases to 24
(29.63%) at the end of 2004. This positive trend indicates an increasing importance of
GAS compliance within the sample. Yet, the circumstance that the positive trend is lim-
ited to GAS 2 and GAS 3 indicates that the standards are differently accepted by the
firms or that compliance with the standards is used to fulfill different purposes.
3.2.2 Main variables: Public exposure and compliance pressure
I capture public exposure by two measures since I am especially interested in the rela-
tionship between a firm’s public exposure and compliance. First, I measure press cover-
age. In doing so, I collect the number of articles related to a company from January 1
until December 31 of the respective year in the German press. I draw on the database
LexisNexis to retrieve this data. Second, I capture public exposure by the number of
produced hits of a search request on the search engine Google. In both cases, I use the
-40-
same query string: a firm’s official name including the abbreviated legal form (i.e. AG,
KGaA, SE). Including the abbreviated legal form prevents that the number of produced
hits is inflated if the firm name has meanings that are used in another context. For ex-
ample a search for Brilliant instead of Brilliant AG might also refer to the adjective bril-
liant, places in the USA and Canada or to several other meanings.
In order to capture peer pressure, I draw on the pressure imposed by compliant compa-
nies in the same industry. The variable accounts for all companies that comply with the
considered GAS within the same industry as the considered company. Inclusion in an
industry is measured by the SIC division structure. The calculation is as follows:
1
*
i
jiij n
GASnAVGGASGASPEER ,
where GASPEER is the peer pressure for the company j, AVGGAS is the average com-
pliance with the considered standard in the industry i including the effect of the com-
pany j under study and n is the number of companies in the industry i, GAS is an indica-
tor variable which is 1 if the company j complies with the considered standard.
GASPEER takes the value 0, if the number of companies in an industry is one or if no
company complies with the respective standard in the industry. This approach accounts
for the pressure induced by the considered company.
Finally, I measure whether compliance is associated with being audited by an audit firm
that is a member of the ASCG. Because the BIG4 audit firms are all members of the
ASCG, the dummy variable ASCGMEM is one if the audit firm is a member but not a
BIG4 audit firm to avoid multicollinearity.
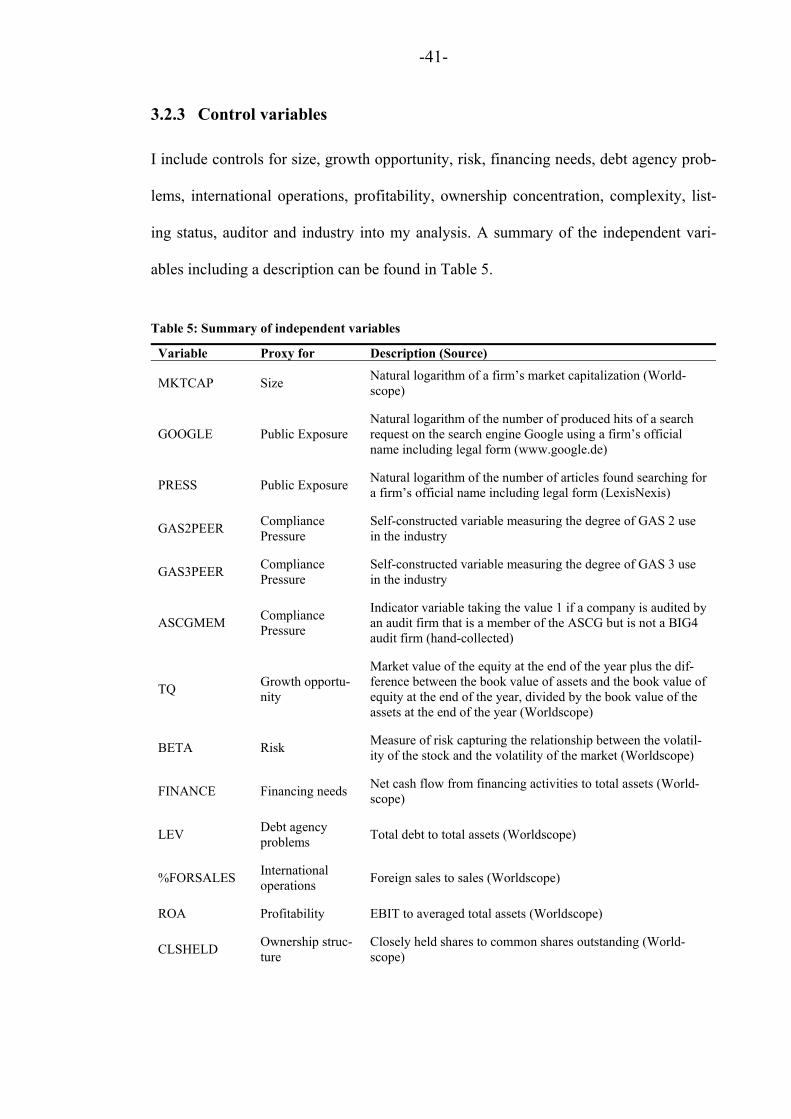
-41-
3.2.3 Control variables
I include controls for size, growth opportunity, risk, financing needs, debt agency prob-
lems, international operations, profitability, ownership concentration, complexity, list-
ing status, auditor and industry into my analysis. A summary of the independent vari-
ables including a description can be found in Table 5.
Table 5: Summary of independent variables
Variable Proxy for Description (Source)
MKTCAP Size Natural logarithm of a firm’s market capitalization (World-scope)
GOOGLE Public Exposure Natural logarithm of the number of produced hits of a search request on the search engine Google using a firm’s official name including legal form (www.google.de)
PRESS Public Exposure Natural logarithm of the number of articles found searching for a firm’s official name including legal form (LexisNexis)
GAS2PEER Compliance Pressure
Self-constructed variable measuring the degree of GAS 2 use in the industry
GAS3PEER Compliance Pressure
Self-constructed variable measuring the degree of GAS 3 use in the industry
ASCGMEM Compliance Pressure
Indicator variable taking the value 1 if a company is audited by an audit firm that is a member of the ASCG but is not a BIG4 audit firm (hand-collected)
TQ Growth opportu-nity
Market value of the equity at the end of the year plus the dif-ference between the book value of assets and the book value of equity at the end of the year, divided by the book value of the assets at the end of the year (Worldscope)
BETA Risk Measure of risk capturing the relationship between the volatil-ity of the stock and the volatility of the market (Worldscope)
FINANCE Financing needs Net cash flow from financing activities to total assets (World-scope)
LEV Debt agency problems
Total debt to total assets (Worldscope)
%FORSALES International operations
Foreign sales to sales (Worldscope)
ROA Profitability EBIT to averaged total assets (Worldscope)
CLSHELD Ownership struc-ture
Closely held shares to common shares outstanding (World-scope)
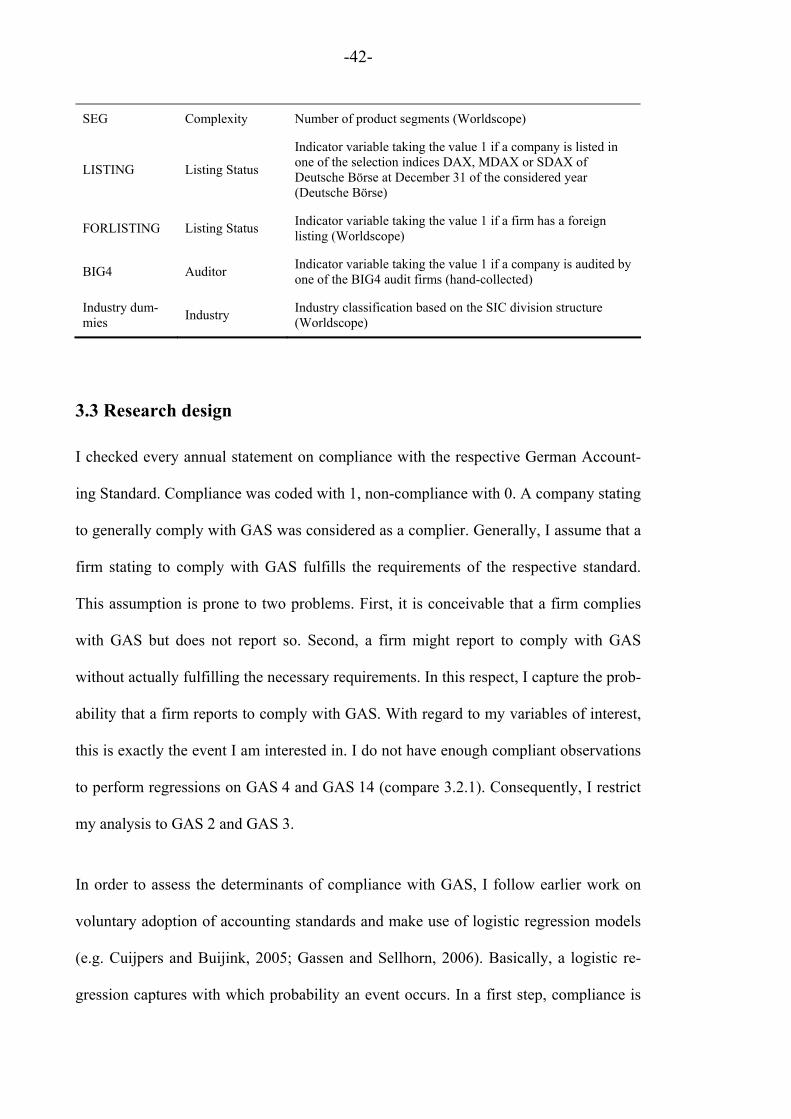
-42-
SEG Complexity Number of product segments (Worldscope)
LISTING Listing Status
Indicator variable taking the value 1 if a company is listed in one of the selection indices DAX, MDAX or SDAX of Deutsche Börse at December 31 of the considered year (Deutsche Börse)
FORLISTING Listing Status Indicator variable taking the value 1 if a firm has a foreign listing (Worldscope)
BIG4 Auditor Indicator variable taking the value 1 if a company is audited by one of the BIG4 audit firms (hand-collected)
Industry dum-mies
Industry Industry classification based on the SIC division structure (Worldscope)
3.3 Research design
I checked every annual statement on compliance with the respective German Account-
ing Standard. Compliance was coded with 1, non-compliance with 0. A company stating
to generally comply with GAS was considered as a complier. Generally, I assume that a
firm stating to comply with GAS fulfills the requirements of the respective standard.
This assumption is prone to two problems. First, it is conceivable that a firm complies
with GAS but does not report so. Second, a firm might report to comply with GAS
without actually fulfilling the necessary requirements. In this respect, I capture the prob-
ability that a firm reports to comply with GAS. With regard to my variables of interest,
this is exactly the event I am interested in. I do not have enough compliant observations
to perform regressions on GAS 4 and GAS 14 (compare 3.2.1). Consequently, I restrict
my analysis to GAS 2 and GAS 3.
In order to assess the determinants of compliance with GAS, I follow earlier work on
voluntary adoption of accounting standards and make use of logistic regression models
(e.g. Cuijpers and Buijink, 2005; Gassen and Sellhorn, 2006). Basically, a logistic re-
gression captures with which probability an event occurs. In a first step, compliance is
-43-
assessed by an ordered logistic regression. I order compliance into three categories.
Compliance with neither of the two standards constitutes the first and lowest category.
Two compliance incidences are conceivable for the second category. First, a firm com-
plies with GAS 2 but not with GAS 3. Second, a firm complies with GAS 3 but not with
GAS 2. I see no qualitative difference between these two incidences. Consequently,
both incidences can be found in the second category. Compliance with both standards
constitutes the third and highest category. In a second step, I assess what drives compli-
ance with GAS 2 and GAS 3 in separate logistic regressions in order to test what drives
compliance with the respective standards.
One of the issues within the investigation is to disentangle public exposure from the
control for size. To address this concern, I specify five different models. I estimate
models with and without proxy variables for public exposure. In the first three models, I
assess the association between compliance and (a) size, (b) public exposure as measured
by the Google hits and (c) public exposure as measured by press coverage. In the model
(a)+(b) I include size and Google hits and in the model (a)+(c) I include size and press
coverage. The last two models are used in order to capture whether one measure is more
suitable to explain compliance while controlling for the other at the same time.
The full model specification of the ordered logistic regression is as follows:
syeardummieummiesindustried
BIGFORLISTINGLISTINGSEGCLSHELD
ROAFORSALESLEVFINANCEBETATQ
ASCGMEMsurePublicExpoMKTCAPGASP
4
%
)(
1413121110
987654
3210

-44-
where GAS takes the value 3 for the lowest ranked category, the value 2 for the middle
ranked category and the value 1 for the highest ranked category.
The full model specification of the logistic regressions is as follows:
syeardummie
BIGFORLISTINGLISTINGSEGCLSHELD
ROAFORSALESLEVFINANCEBETATQ
ASCGMEMGASPEERsurePublicExpoMKTCAPGASP
4
%
)(
1514131211
1098765
43210
where GAS is an indicator variable taking the value 1, if the company states to comply
with the considered standard, MKTCAP is the natural logarithm of a firm’s market
capitalization (Worldscope), PublicExposure is either GOOGLE, which is the natural
logarithm of the number of produced hits of a search request on the search engine
Google using a firm’s official name including legal form (www.google.de) or PRESS,
which is the natural logarithm of the number of articles found searching for a firm’s
official name including legal form (LexisNexis), GASPEER is a self constructed vari-
able capturing peer pressure within an industry (calculation described above), ASCG-
MEM is an indicator variable taking the value 1 if a company is audited by an audit firm
that is a member of the ASCG but is not a BIG4 audit firm (hand-collected), TQ is mar-
ket value of the equity at the end of the year plus the difference between the book value
of assets and the book value of equity at the end of the year, divided by the book value
of the assets at the end of the year (Worldscope), BETA is a measure of risk capturing
the relationship between the volatility of the stock and the volatility of the market
(Worldscope), FINANCE is net cash flow from financing activities to total assets
(Worldscope), LEV is total debt to total assets (Worldscope), %FORSALES is foreign
sales to sales (Worldscope), ROA is EBIT to average total assets (Worldscope),

-45-
CLSHELD is closely held shares to common shares outstanding (Worldscope), SEG is
the number of product segments (Worldscope), LISTING is an indicator variable taking
the value 1 if a company is listed in one of the selection indices DAX, MDAX or SDAX
of Deutsche Börse at December 31 of the considered year (Deutsche Börse), FORLIST-
ING is an indicator variable taking the value 1 if a firm has a foreign listing and BIG4 is
an indicator variable taking the value 1 if a firm is audited by one of the BIG4 audit
firms (hand-collected).
The research design at hand offers several advantages. I draw on cross-section data
where the same firms are observed over time. As pointed out by Inchausti (1997) in a
roughly comparable setting, this captures variation across different individuals and over
time, increasing degrees of freedom and improving the efficiency of econometric esti-
mates. In order to mitigate problems arising from general time trends, I include year
fixed effects into the regressions. Observing the same firms for more than two years
introduces the risk of serial correlation. The effect becomes stronger for longer time
periods. This can result in biased standard errors that can ultimately lead to wrong test
inferences. In order to address this concern, I cluster the standard errors over the firm
(Kézdi, 2004; Petersen, 2009).
Table 6 shows correlations between the dependent and independent variables. The cor-
relations among the size proxies and among the public exposure proxies are very high.
This indicates possible multicollinearity problems in the model specifications (a)+(b)
and (a)+(c). I address this concern within the empirical analyses. Descriptive statistics
for the full sample are displayed in Table 7. All variables, which are not truncated by
definition are winsorized by their 1% and 99% interval.

-46-
Table 6: Pearson/Spearman correlations between dependent/independent variables (n=405)
Variable (1) (2) (3) (4) (5) (6) (7) (8) (9) (10) (11) (12) (13) (14) (15) (16) (17) (18) (19) (20)
(1) GAS2 0.322 0.193 0.199 0.207 0.107 0.154 0.173 0.145 0.070 0.029 0.075 0.132 0.064 0.042 -0.090 0.168 0.108 0.045 -0.156
(2) GAS3 0.322 0.307 0.292 0.157 0.163 0.119 0.188 0.087 0.090 0.126 -0.078 0.184 0.065 0.094 -0.110 0.173 0.214 0.049 0.024
(3) TOTASS 0.112 0.276 0.877 0.591 0.611 0.012 0.173 -0.045 0.043 0.271 -0.094 0.140 0.185 0.258 -0.210 0.258 0.497 0.359 0.210
(4) MKTCAP 0.125 0.242 0.814 0.616 0.620 0.016 0.186 0.021 0.350 0.175 -0.035 -0.114 0.102 0.327 -0.161 0.224 0.514 0.309 0.175
(5) GOOGLE 0.166 0.094 0.473 0.504 0.673 0.063 0.088 0.001 0.169 0.368 0.060 -0.050 0.158 0.056 -0.276 0.153 0.506 0.348 0.076
(6) PRESS 0.068 0.111 0.491 0.507 0.590 -0.038 0.011 0.058 0.268 0.228 0.071 0.037 -0.015 -0.037 -0.271 0.240 0.541 0.315 0.142
(7) GAS2PEER -0.056 0.030 -0.007 -0.022 0.031 -0.039 0.593 -0.111 -0.067 0.104 -0.030 -0.096 0.200 0.061 -0.062 0.000 -0.064 0.027 0.091
(8) GAS3PEER 0.099 0.073 0.096 0.087 0.032 -0.030 0.597 -0.049 0.043 -0.011 -0.062 -0.074 0.116 0.050 0.048 0.146 -0.070 0.000 0.197
(9) ASCGMEM 0.145 0.087 -0.004 0.042 0.020 0.085 -0.090 0.001 0.115 -0.104 -0.034 -0.126 -0.032 -0.089 0.029 0.188 -0.007 -0.059 -0.403
(10) TQ 0.130 0.137 0.088 0.436 0.224 0.285 -0.056 0.076 0.149 0.024 0.152 -0.051 -0.113 0.065 0.079 0.057 0.247 -0.012 0.076
(11) BETA 0.018 0.109 0.311 0.187 0.421 0.217 0.100 -0.045 -0.120 -0.032 0.048 0.245 0.024 0.052 -0.322 0.085 0.287 0.215 -0.038
(12) FINANCE 0.047 -0.088 -0.040 -0.082 0.031 0.052 -0.062 -0.066 -0.031 0.031 -0.002 0.095 -0.097 -0.274 0.009 0.066 0.042 -0.003 -0.078
(13) LEV 0.127 0.156 0.153 -0.129 -0.059 0.025 -0.119 -0.043 -0.128 -0.039 0.225 0.145 0.080 -0.095 -0.055 0.088 0.119 -0.069 0.003
(14) %FORSALES 0.077 0.056 0.134 0.092 0.141 -0.038 0.246 0.170 -0.027 -0.125 0.058 -0.029 0.060 0.212 -0.039 0.040 0.095 0.175 0.192
(15) ROA 0.036 0.144 0.236 0.461 0.142 0.017 0.057 0.046 -0.017 0.272 0.105 -0.263 -0.119 0.199 0.005 -0.168 0.111 0.032 0.037
(16) CLSHELD -0.052 -0.089 -0.197 -0.104 -0.248 -0.258 -0.002 0.124 0.039 0.130 -0.351 0.066 -0.110 -0.073 -0.034 -0.183 -0.383 -0.273 0.003
(17) SEG 0.168 0.186 0.218 0.140 0.056 0.154 -0.051 0.098 0.163 0.075 0.084 0.075 0.129 0.056 -0.078 -0.121 0.102 0.150 0.010
(18) LISTING 0.108 0.214 0.491 0.485 0.477 0.521 -0.165 -0.152 -0.007 0.196 0.284 0.038 0.133 0.097 0.182 -0.404 0.062 0.252 0.002
(19) FORLISTING 0.045 0.049 0.250 0.206 0.255 0.257 0.030 0.012 -0.059 0.026 0.214 -0.002 -0.072 0.176 0.015 -0.223 0.094 0.252 0.147
(20) BIG4 -0.156 0.024 0.166 0.141 0.029 0.113 0.087 0.154 -0.403 0.055 -0.038 -0.045 0.018 0.189 0.001 -0.002 0.031 0.002 0.147
Variable definitions (data source): GAS2 is an indicator variable taking the value 1 if a company states to comply with GAS2 (hand-collected), GAS3 is an indicator variable taking the value 1 if a company states to comply with GAS3 (hand-collected), TO-TASS is the natural logarithm of a firm’s total assets (Worldscope), MKTCAP is the natural logarithm of a firm’s market capitalization (Worldscope), GOOGLE is the natural logarithm of the number of produced hits of a search request on the search engine Google using a firm’s official name including legal form (www.google.de), PRESS is the natural logarithm of the number of articles found searching for a firm’s official name including legal form (LexisNexis), GAS2PEER is a self-constructed variable measuring the degree of GAS2 use in the industry, GAS3PEER is a self-constructed variable measuring the degree of GAS3 use in the industry, ASCGMEM is an indicator variable taking the value 1 if a company is audited by an audit firm that is a member of the ASCG but is not a BIG4 audit firm (hand-collected), TQ is market value of the equity at the end of the year plus the differ-ence between the book value of assets and the book value of equity at the end of the year, divided by the book value of the assets at the end of the year (Worldscope), BETA is a measure of risk capturing the relationship be-tween the volatility of the stock and the volatility of the market (Worldscope), FINANCE is net cash flow from financing activities to total assets (Worldscope), LEV is total debt to total assets (Worldscope), %FORSALES is foreign sales to sales (Worldscope), ROA is EBIT to averaged total assets (Worldscope), CLSHELD is closely held shares to common shares outstanding (Worldscope), SEG is the number of product segments (Worldscope), LISTING is an indicator variable taking the value 1 if a company is listed in one of the selection indices DAX, MDAX or SDAX of Deutsche Börse at December 31 of the considered year (Deutsche Börse), FORLISTING is an indicator variable taking the value 1 if a firm has a foreign listing (hand-collected), BIG4 is an indicator variable taking the value 1 if a company is audited by one of the BIG4 audit firms (hand-collected). Pearson (Spearman) correlations are displayed above (below) the diagonal. Bold typeset denotes significant correlations below the 10 % level.

-47-
Table 7: Descriptive statistics of the full sample (n=405)
Variable Mean Std.dev Minimum 25th percintile Median 75th percintile Maximum Panel A GAS2 0.274 0.447 GAS2PEER 0.257 0.161 0.000 0.209 0.256 0.326 1.000 GAS3 0.264 0.441 GAS3PEER 0.237 0.183 0.000 0.140 0.250 0.279 1.000 GAS4 (n=324) 0.012 0.111 GAS14 (n=64) 0.141 0.350 Panel B
TOTASS 2,282.350 14,693.780 3.703 62.389 147.128 369.716 164,280.000 MKTCAP 1,356.750 8,610.690 0.450 15.780 41.895 133.200 97,164.540 GOOGLE 74.094 361.765 1.050 6.120 13.600 33.200 3,200.000 PRESS 117.884 634.963 0.000 5.000 15.000 43.000 6,320.000 ASCGMEM 0.121 0.327 TQ 1.213 0.490 0.366 0.961 1.124 1.333 5.508 BETA 0.551 0.543 -0.990 0.190 0.460 0.910 1.530 FINANCE -0.011 0.110 -0.746 -0.054 -0.022 0.016 0.760 LEV 0.284 0.203 0.000 0.108 0.283 0.421 1.000 %FORSALES 0.360 0.281 0.000 0.080 0.357 0.579 0.972 ROA 0.049 0.118 -0.502 0.013 0.066 0.101 0.671 CLSHELD 0.641 0.227 0.000 0.500 0.691 0.820 0.988 SEG 3.262 1.745 1.000 2.000 3.000 4.000 9.000 LISTING 0.232 0.423 FORLISTING 0.025 0.155 BIG4 0.541 0.499 Variable definitions (data source): GAS is an indicator variable taking the value 1 if a company states to comply with the respective GAS (hand-collected), GASPEER is a self-constructed variable measuring the degree of GAS use in the industry, TOTASS is a firm’s total assets in M€ (Worldscope), MKTCAP is a firm’s market capitalization in M€ (Worldscope), GOOGLE is the number of produced hits of a search request on the search engine Google using a firm’s official name including legal form in thousand (www.google.de), PRESS is the num-ber of articles found searching for a firm’s official name including legal form (LexisNexis), ASCGMEM is an indicator variable taking the value 1 if a company is audited by an audit firm that is a member of the ASCG but is not a BIG4 audit firm (hand-collected), TQ is market value of the equity at the end of the year plus the difference between the book value of assets and the book value of equity at the end of the year, BETA is a measure of risk capturing the relationship between the volatility of the stock and the volatility of the market (Worldscope), FINANCE is net cash flow from financing activities to total assets (Worldscope), LEV is total debt to total assets (Worldscope), divided by the book value of the assets at the end of the year (Worldscope), %FORSALES is foreign sales to sales (Worldscope), ROA is EBIT to averaged total assets (Worldscope), CLSHELD is closely held shares to common shares outstanding (Worldscope), SEG is the number of product segments (Worldscope), LISTING is an indicator variable taking the value 1 if a company is listed in one of the selection indices DAX, MDAX or SDAX of Deutsche Börse at December 31 of the considered year (Deutsche Börse), FORL-ISTING is an indicator variable taking the value 1 if a firm has a foreign listing (hand-collected), BIG4 is an indicator variable taking the value 1 if a company is audited by one of the BIG4 audit firms (hand-collected).
-48-
3.4 Empirical Results
3.4.1 Findings on compliance
In this section, I present results of determinants of GAS compliance. After showing re-
sults of an ordered logistic regression, I present separate results on compliance with
GAS 2 and GAS 3, respectively. For the latter analyses, I present descriptive statistics,
univariate results and logistic regression results. When reporting univariate tests, I as-
sess differences in mean and median. However, none of the variables are normally dis-
tributed (results of Kolmogorov-Smirnov tests with 1% significance level are not tabu-
lated), indicating that the use of Wilcoxon two-sample tests is more appropriate. Chi-
squared tests are used for nominal variables.
German GAAP violation
Before I deal with GAS compliance, I consider firms that did not prepare cash flow
statements or segment reports. Since all firms in the sample are required to prepare a
consolidated financial statement report, the preparation of both items is mandatory.
Consequently, these firms violate German GAAP. However, German GAAP refers to
the materiality principle. The main idea behind the principle is that all relevant and im-
portant information that is necessary to judge the economic situation of a firm need to
be displayed in the financial statement. The materiality principle is further substantiated
by cost-effectiveness considerations. The usefulness of the conveyed information is
supposed to stand in an appropriate relationship to the invoked costs of conveying them.
Since both principles draw on concepts that are not objectively measurable, it is in the
management’s discretion not to convey certain information. It is hardly possible to rea-
sonably justify not to prepare a cash flow statement. The decision not to prepare a seg-
ment report for a firm that operates in only one product segment and only one geo-
-49-
graphical region might be justified in the light of materiality and cost-effectiveness con-
siderations. In the course of the GAS compliance investigation, I code firms that did not
prepare a cash flow statement or a segment report as GAS non-compliers.
A cash flow statement was not prepared in nine cases. The univariate results (Table 8)
show that preparing firms (1) are bigger, (2) have more media coverage, (3) are riskier
(only t-test), (4) have more debt agency problems, (5) have more international activities,
(6) are less closely held, (7) are more complex, (8) are more often listed in one of the
selection indices of Deutsche Börse and (9) are more often audited by a BIG4 audit
firm.
A segment report was not prepared in 80 cases. The univariate results (Table 9) show
that preparing firms (1) are bigger, (2) are more visible as measured by the Google hits,
(3) have a higher Tobin’s q, (4) have more international activities, (5) are more profit-
able (only Wilcoxon test), (6) are more complex, (7) are more often listed in one of the
selection indices of Deutsche Börse and (8) are more often audited by a BIG4 audit
firm.

-50-
Table 8: Descriptive statistics and univariate analysis of determinants of cash flow statement preparation (n=405)
Cash flow statement=1 (n=396) Cash flow statement=0 (n=9)
Variable Mean Std.dev Median Mean Std.dev Median Expected
sign t-statistic p-value z-statistic p-value
TOTASS 5.065 1.632 5.012 3.701 1.056 3.550 + 2.490 (0.013) 3.005 (0.003) MKTCAP 4.022 1.896 3.763 3.098 0.978 2.751 + 2.720 (0.023) 1.696 (0.090) GOOGLE 2.689 1.424 2.614 2.062 0.967 1.740 + 1.310 (0.190) 1.583 (0.114) PRESS 2.773 1.685 2.708 1.362 2.104 0.000 + 2.470 (0.014) 2.123 (0.034) TQ 1.216 0.492 1.125 1.064 0.339 0.916 +/- 0.920 (0.357) 1.473 (0.141) BETA 0.556 0.547 0.520 0.344 0.316 0.440 +/- 1.940 (0.083) 1.187 (0.235) FINANCE -0.012 0.111 -0.022 0.007 0.094 -0.003 +/- -0.510 (0.607) -0.317 (0.751) LEV 0.289 0.202 0.287 0.059 0.102 0.009 +/- 6.490 (0.000) 3.417 (0.001) %FORSALES 0.365 0.280 0.362 0.137 0.266 0.000 + 2.430 (0.016) 2.564 (0.010) ROA 0.050 0.116 0.066 0.041 0.201 0.024 +/- 0.120 (0.907) 0.871 (0.384) CLSHELD 0.638 0.227 0.679 0.769 0.193 0.779 - -1.710 (0.088) -1.914 (0.056) SEG 3.293 1.740 3.000 1.889 1.453 1.000 + 2.400 (0.017) 2.551 (0.011) LISTING 0.237 0.426 0.000 0.000 + 2.782 (0.095) FORLISTING 0.025 0.157 0.000 0.000 +/- 0.233 (0.629) BIG4 0.548 0.498 0.222 0.441 + 3.760 (0.053) Variable definitions (data source): TOTASS is the natural logarithm of a firm’s total assets (Worldscope), MKTCAP is the natural logarithm of a firm’s market capitalization (Worldscope), GOOGLE is the natural logarithm of the number of produced hits of a search request on the search engine Google using a firm’s official name including legal form (www.google.de), PRESS is the natural logarithm of the number of articles found searching for a firm’s official name including legal form (LexisNexis), TQ is market value of the equity at the end of the year plus the difference between the book value of assets and the book value of equity at the end of the year, divided by the book value of the assets at the end of the year (Worldscope), BETA is a measure of risk capturing the relationship between the volatility of the stock and the volatility of the market (Worldscope), FINANCE is net cash flow from financing activities to total assets (Worldscope), LEV is total debt to total assets (Worldscope), %FORSALES is foreign sales to sales (Worldscope), ROA is EBIT to average total assets (Worldscope), CLSHELD is closely held shares to common shares outstanding (Worldscope), SEG is the number of product segments (Worldscope), LISTING is an indicator variable taking the value 1 if a company is listed in one of the selection indices DAX, MDAX or SDAX of Deutsche Börse at December 31 of the considered year (Deutsche Börse), FORLISTING is an indicator variable taking the value 1 if a firm has a foreign listing (hand-collected), BIG4 is an indicator variable taking the value 1 if a company is audited by one of the BIG4 audit firms (hand-collected). The significance of sample differences is assessed by t-tests and Wilcoxon tests for the means and the medians of non-nominal variables and by Chi-squared tests of nominal variables. Bold typeset denotes significant difference (two-sided) below the 10 % level.
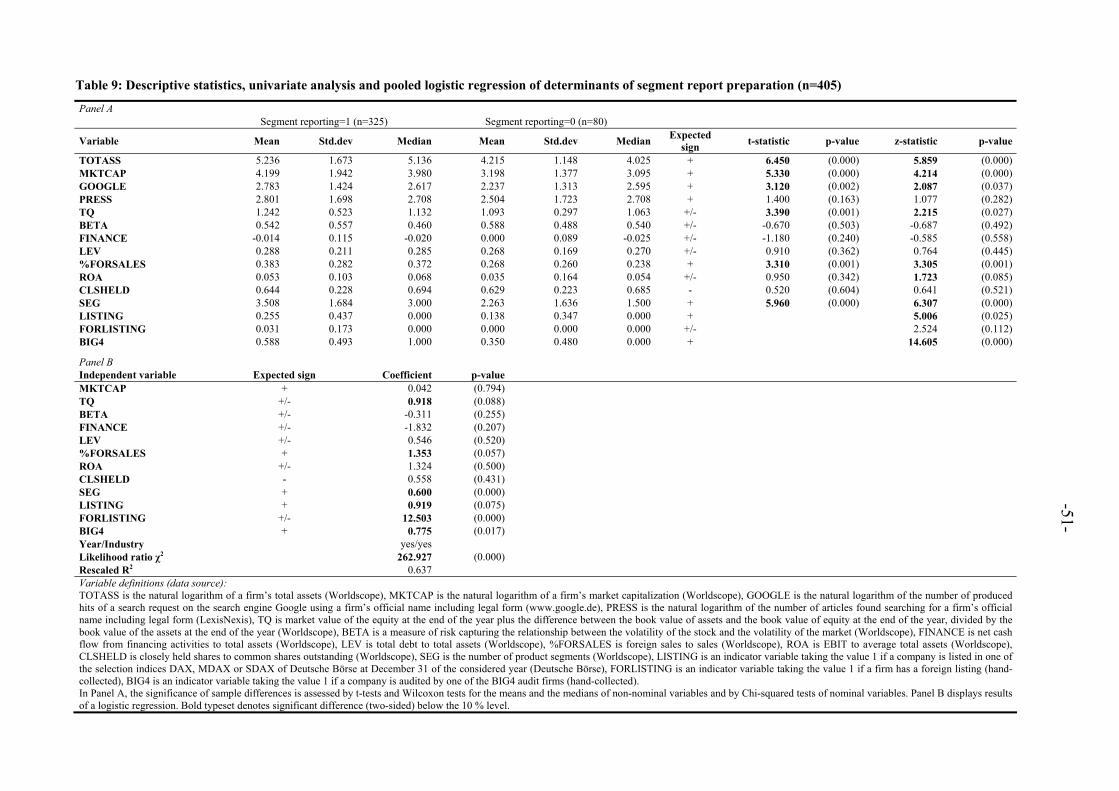
-51-
Table 9: Descriptive statistics, univariate analysis and pooled logistic regression of determinants of segment report preparation (n=405)
Panel A Segment reporting=1 (n=325) Segment reporting=0 (n=80)
Variable Mean Std.dev Median Mean Std.dev Median Expected
sign t-statistic p-value z-statistic p-value
TOTASS 5.236 1.673 5.136 4.215 1.148 4.025 + 6.450 (0.000) 5.859 (0.000) MKTCAP 4.199 1.942 3.980 3.198 1.377 3.095 + 5.330 (0.000) 4.214 (0.000) GOOGLE 2.783 1.424 2.617 2.237 1.313 2.595 + 3.120 (0.002) 2.087 (0.037) PRESS 2.801 1.698 2.708 2.504 1.723 2.708 + 1.400 (0.163) 1.077 (0.282) TQ 1.242 0.523 1.132 1.093 0.297 1.063 +/- 3.390 (0.001) 2.215 (0.027) BETA 0.542 0.557 0.460 0.588 0.488 0.540 +/- -0.670 (0.503) -0.687 (0.492) FINANCE -0.014 0.115 -0.020 0.000 0.089 -0.025 +/- -1.180 (0.240) -0.585 (0.558) LEV 0.288 0.211 0.285 0.268 0.169 0.270 +/- 0.910 (0.362) 0.764 (0.445) %FORSALES 0.383 0.282 0.372 0.268 0.260 0.238 + 3.310 (0.001) 3.305 (0.001) ROA 0.053 0.103 0.068 0.035 0.164 0.054 +/- 0.950 (0.342) 1.723 (0.085) CLSHELD 0.644 0.228 0.694 0.629 0.223 0.685 - 0.520 (0.604) 0.641 (0.521) SEG 3.508 1.684 3.000 2.263 1.636 1.500 + 5.960 (0.000) 6.307 (0.000) LISTING 0.255 0.437 0.000 0.138 0.347 0.000 + 5.006 (0.025) FORLISTING 0.031 0.173 0.000 0.000 0.000 0.000 +/- 2.524 (0.112) BIG4 0.588 0.493 1.000 0.350 0.480 0.000 + 14.605 (0.000)
Panel B
Independent variable Expected sign Coefficient p-value MKTCAP + 0.042 (0.794) TQ +/- 0.918 (0.088) BETA +/- -0.311 (0.255) FINANCE +/- -1.832 (0.207) LEV +/- 0.546 (0.520) %FORSALES + 1.353 (0.057) ROA +/- 1.324 (0.500) CLSHELD - 0.558 (0.431) SEG + 0.600 (0.000) LISTING + 0.919 (0.075) FORLISTING +/- 12.503 (0.000) BIG4 + 0.775 (0.017) Year/Industry yes/yes Likelihood ratio χ2 262.927 (0.000) Rescaled R2 0.637 Variable definitions (data source): TOTASS is the natural logarithm of a firm’s total assets (Worldscope), MKTCAP is the natural logarithm of a firm’s market capitalization (Worldscope), GOOGLE is the natural logarithm of the number of produced hits of a search request on the search engine Google using a firm’s official name including legal form (www.google.de), PRESS is the natural logarithm of the number of articles found searching for a firm’s official name including legal form (LexisNexis), TQ is market value of the equity at the end of the year plus the difference between the book value of assets and the book value of equity at the end of the year, divided by the book value of the assets at the end of the year (Worldscope), BETA is a measure of risk capturing the relationship between the volatility of the stock and the volatility of the market (Worldscope), FINANCE is net cash flow from financing activities to total assets (Worldscope), LEV is total debt to total assets (Worldscope), %FORSALES is foreign sales to sales (Worldscope), ROA is EBIT to average total assets (Worldscope), CLSHELD is closely held shares to common shares outstanding (Worldscope), SEG is the number of product segments (Worldscope), LISTING is an indicator variable taking the value 1 if a company is listed in one of the selection indices DAX, MDAX or SDAX of Deutsche Börse at December 31 of the considered year (Deutsche Börse), FORLISTING is an indicator variable taking the value 1 if a firm has a foreign listing (hand-collected), BIG4 is an indicator variable taking the value 1 if a company is audited by one of the BIG4 audit firms (hand-collected). In Panel A, the significance of sample differences is assessed by t-tests and Wilcoxon tests for the means and the medians of non-nominal variables and by Chi-squared tests of nominal variables. Panel B displays results of a logistic regression. Bold typeset denotes significant difference (two-sided) below the 10 % level.

-52-
For firms that did not prepare a cash flow statement, I do not perform a multivariate
analysis since the number of according observations is too low. A logistic regression of
segment report preparation is displayed in Panel B of Table 9. The results show that
preparing firms (1) have a higher Tobin’s q, (2) have more international activities, (3)
are more complex, (4) are more often listed in one of the selection indices of Deutsche
Börse, (5) have more often a foreign listing and (6) are more often audited by a BIG4
audit firm. These results suggest that the decision to prepare a segment report is driven
by determinants internal and external to the firm. Accordingly, the decision is driven by
whether a firm has information that can be disaggregated, like complexity and foreign
activities. This finding fuels the conjecture that non-preparation might be justified in the
light of the materiality principle. But also external determinants like capital market
pressures and related increased reporting requirements have a positive impact on the
decision to prepare a segment report. The analysis also shows that the auditor plays a
role in this decision, implying that BIG4 audit firms either provide a higher quality in
the statement preparation process or are stronger in making their clients comply with
reporting requirements. The circumstance that growth firms are more compliant can be
seen against the background that these firms need to provide more transparency in order
to attract finance or as a bonding measure in order to reassure stakeholders to comply
with reporting requirements.
GAS compliance
Table 10 provides results of the ordered logistic regression. Results of model (a) show
that higher compliance is driven by (1) size, (2) being audited by an audit firm that has
an affiliation to the ASCG and (3) debt agency problems. In the models (b) and (c),
compliance is driven by (1) being audited by an audit firm that has an affiliation to the
ASCG, (2) debt agency problems and (3) profitability. The public exposure measures

-53-
are positively associated with compliance but only significant in model (b) at common
significance levels. Including size and the number of Google hits in model (a)+(b) ren-
ders both variables to be positive and non-significant. In model (a)+(c), size is better
suitable in explaining compliance than public exposure.
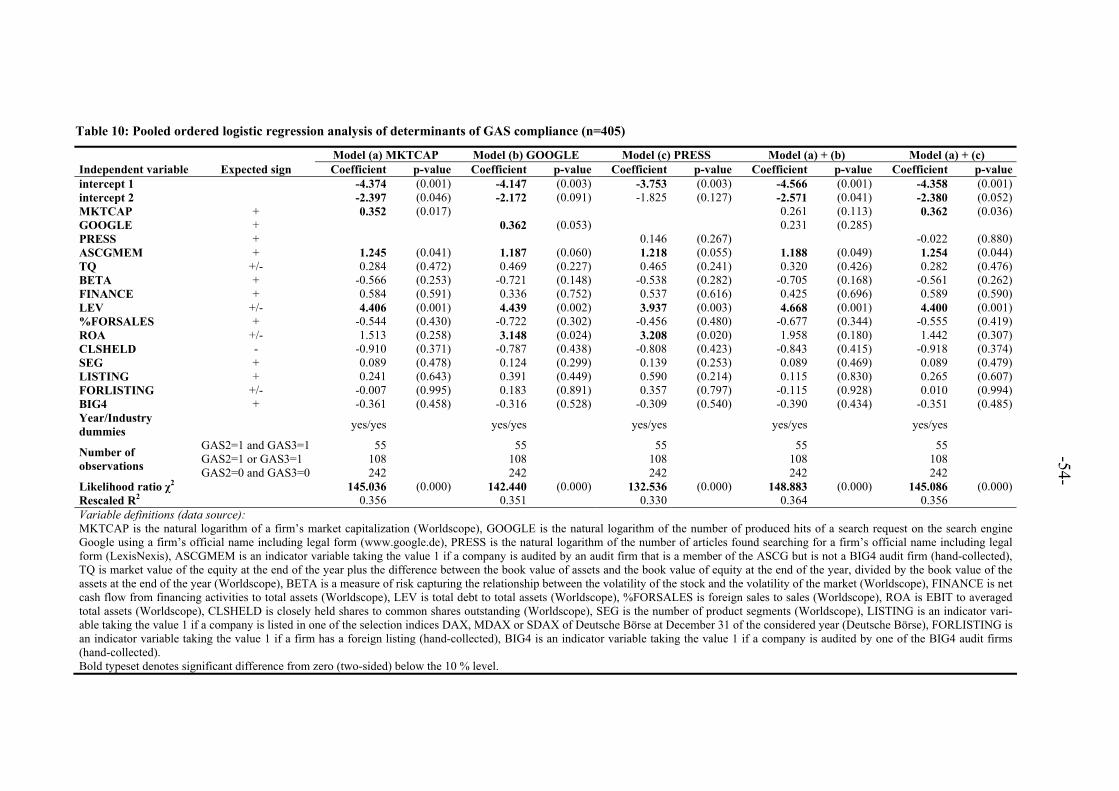
-54-
Table 10: Pooled ordered logistic regression analysis of determinants of GAS compliance (n=405)
Model (a) MKTCAP Model (b) GOOGLE Model (c) PRESS Model (a) + (b) Model (a) + (c) Independent variable Expected sign Coefficient p-value Coefficient p-value Coefficient p-value Coefficient p-value Coefficient p-value intercept 1 -4.374 (0.001) -4.147 (0.003) -3.753 (0.003) -4.566 (0.001) -4.358 (0.001) intercept 2 -2.397 (0.046) -2.172 (0.091) -1.825 (0.127) -2.571 (0.041) -2.380 (0.052) MKTCAP + 0.352 (0.017) 0.261 (0.113) 0.362 (0.036) GOOGLE + 0.362 (0.053) 0.231 (0.285) PRESS + 0.146 (0.267) -0.022 (0.880) ASCGMEM + 1.245 (0.041) 1.187 (0.060) 1.218 (0.055) 1.188 (0.049) 1.254 (0.044) TQ +/- 0.284 (0.472) 0.469 (0.227) 0.465 (0.241) 0.320 (0.426) 0.282 (0.476) BETA + -0.566 (0.253) -0.721 (0.148) -0.538 (0.282) -0.705 (0.168) -0.561 (0.262) FINANCE + 0.584 (0.591) 0.336 (0.752) 0.537 (0.616) 0.425 (0.696) 0.589 (0.590) LEV +/- 4.406 (0.001) 4.439 (0.002) 3.937 (0.003) 4.668 (0.001) 4.400 (0.001) %FORSALES + -0.544 (0.430) -0.722 (0.302) -0.456 (0.480) -0.677 (0.344) -0.555 (0.419) ROA +/- 1.513 (0.258) 3.148 (0.024) 3.208 (0.020) 1.958 (0.180) 1.442 (0.307) CLSHELD - -0.910 (0.371) -0.787 (0.438) -0.808 (0.423) -0.843 (0.415) -0.918 (0.374) SEG + 0.089 (0.478) 0.124 (0.299) 0.139 (0.253) 0.089 (0.469) 0.089 (0.479) LISTING + 0.241 (0.643) 0.391 (0.449) 0.590 (0.214) 0.115 (0.830) 0.265 (0.607) FORLISTING +/- -0.007 (0.995) 0.183 (0.891) 0.357 (0.797) -0.115 (0.928) 0.010 (0.994) BIG4 + -0.361 (0.458) -0.316 (0.528) -0.309 (0.540) -0.390 (0.434) -0.351 (0.485) Year/Industry dummies
yes/yes yes/yes yes/yes yes/yes yes/yes
GAS2=1 and GAS3=1 55 55 55 55 55 GAS2=1 or GAS3=1 108 108 108 108 108 Number of
observations GAS2=0 and GAS3=0 242 242 242 242 242
Likelihood ratio χ2 145.036 (0.000) 142.440 (0.000) 132.536 (0.000) 148.883 (0.000) 145.086 (0.000) Rescaled R2 0.356 0.351 0.330 0.364 0.356 Variable definitions (data source): MKTCAP is the natural logarithm of a firm’s market capitalization (Worldscope), GOOGLE is the natural logarithm of the number of produced hits of a search request on the search engine Google using a firm’s official name including legal form (www.google.de), PRESS is the natural logarithm of the number of articles found searching for a firm’s official name including legal form (LexisNexis), ASCGMEM is an indicator variable taking the value 1 if a company is audited by an audit firm that is a member of the ASCG but is not a BIG4 audit firm (hand-collected), TQ is market value of the equity at the end of the year plus the difference between the book value of assets and the book value of equity at the end of the year, divided by the book value of the assets at the end of the year (Worldscope), BETA is a measure of risk capturing the relationship between the volatility of the stock and the volatility of the market (Worldscope), FINANCE is net cash flow from financing activities to total assets (Worldscope), LEV is total debt to total assets (Worldscope), %FORSALES is foreign sales to sales (Worldscope), ROA is EBIT to averaged total assets (Worldscope), CLSHELD is closely held shares to common shares outstanding (Worldscope), SEG is the number of product segments (Worldscope), LISTING is an indicator vari-able taking the value 1 if a company is listed in one of the selection indices DAX, MDAX or SDAX of Deutsche Börse at December 31 of the considered year (Deutsche Börse), FORLISTING is an indicator variable taking the value 1 if a firm has a foreign listing (hand-collected), BIG4 is an indicator variable taking the value 1 if a company is audited by one of the BIG4 audit firms (hand-collected). Bold typeset denotes significant difference from zero (two-sided) below the 10 % level.

-55-
In a next step, I investigate determinants of GAS 2 compliance. The results are dis-
played in Table 11 and Table 12. The univariate results (Table 11) show that GAS 2
compliers (1) are bigger in terms of total assets and market capitalization, (2) are more
publicly exposed as measured with the Google hits and press coverage (only t-test), (3)
face more usage of GAS 2 (only t-test) and GAS 3 within the respective industry, (4)
are more often audited by audit firms having an affiliation to the ASCG, (5) have a
higher Tobin’s q (only Wilcoxon test), (6) have more debt agency problems, (7) are
more complex, (8) are more often listed in one of the selection indices of Deutsche
Börse and (9) are less often audited by a BIG4 audit firm.
The multivariate results (Table 12) show that compliance is significantly positively as-
sociated with (1) size, (2) peer pressure and (3) debt agency problems and is negatively
associated with (4) being audited by a BIG4 audit firm. In the models (b) and (c), public
exposure is positively associated with compliance while the remaining results do not
materially change. The coefficient is significant in model (b) and non-significant in
model (c). In the mixed model (a)+(b), adding size and public exposure as measured by
the Google hits renders both variables to be positively and non-significantly associated
with GAS 2 compliance while the other results stay unchanged. In the mixed model
(a)+(c), compliance is positively associated with (1) size, (2) peer pressure and (3) debt
agency problems and is negatively associated with (4) being audited by a BIG4 audit
firm.

-56-
Table 11: Descriptive statistics and univariate analysis of determinants of GAS 2 compliance (n=405)
GAS 2=1 (n=111) GAS 2=0 (n=294)
Variable Mean Std.dev Median Mean Std.dev Median Expected
sign t-statistic p-value z-statistic p-value
TOTASS 5.547 1.980 5.164 4.841 1.439 4.909 + 3.430 (0.001) 2.260 (0.012) MKTCAP 4.610 2.318 4.047 3.772 1.640 3.690 + 3.490 (0.001) 2.512 (0.012) GOOGLE 3.151 1.912 3.025 2.496 1.132 2.557 + 3.400 (0.001) 3.345 (0.001) PRESS 3.040 1.954 2.833 2.629 1.591 2.708 + 1.980 (0.050) 1.376 (0.169) GAS2PEER 0.297 0.216 0.302 0.242 0.132 0.256 + 2.530 (0.012) 1.125 (0.261) GAS3PEER 0.289 0.228 0.256 0.218 0.159 0.241 +/- 3.010 (0.003) 1.996 (0.046) ASCGMEM 0.198 0.400 0.092 0.289 0.000 + 8.571 (0.003) TQ 1.268 0.406 1.194 1.192 0.517 1.085 +/- 1.570 (0.119) 2.615 (0.009) BETA 0.576 0.563 0.420 0.541 0.536 0.490 + 0.580 (0.565) 0.364 (0.716) FINANCE 0.002 0.102 -0.019 -0.017 0.113 -0.022 + 1.520 (0.130) 0.946 (0.344) LEV 0.328 0.215 0.336 0.268 0.197 0.257 +/- 2.680 (0.008) 2.550 (0.011) %FORSALES 0.390 0.247 0.381 0.349 0.292 0.347 + 1.390 (0.166) 1.538 (0.124) ROA 0.057 0.088 0.066 0.046 0.127 0.063 +/- 0.990 (0.321) 0.731 (0.465) CLSHELD 0.608 0.265 0.674 0.653 0.210 0.700 - -1.630 (0.105) -1.049 (0.294) SEG 3.739 1.882 4.000 3.082 1.659 3.000 + 3.240 (0.001) 3.377 (0.001) LISTING 0.306 0.463 0.204 0.404 0.000 + 4.724 (0.030) FORLISTING 0.036 0.187 0.020 0.142 0.000 +/- 0.817 (0.366) BIG4 0.414 0.495 0.588 0.493 1.000 + 9.826 (0.002) Variable definitions (data source): TOTASS is the natural logarithm of a firm’s total assets (Worldscope), MKTCAP is the natural logarithm of a firm’s market capitalization (Worldscope), GOOGLE is the natural logarithm of the number of produced hits of a search request on the search engine Google using a firm’s official name including legal form (www.google.de), PRESS is the natural logarithm of the number of articles found searching for a firm’s official name including legal form (LexisNexis), GAS2PEER is a self-constructed variable measuring the degree of GAS2 use in the industry, GAS3PEER is a self-constructed variable measuring the degree of GAS3 use in the industry, ASCGMEM is an indicator variable taking the value 1 if a company is audited by an audit firm that is a member of the ASCG but is not a BIG4 audit firm (hand-collected), TQ is market value of the equity at the end of the year plus the difference between the book value of assets and the book value of equity at the end of the year, divided by the book value of the assets at the end of the year (Worldscope), BETA is a measure of risk capturing the relationship between the volatility of the stock and the volatility of the market (Worldscope), FI-NANCE is net cash flow from financing activities to total assets (Worldscope), LEV is total debt to total assets (Worldscope), %FORSALES is foreign sales to sales (World-scope), ROA is EBIT to averaged total assets (Worldscope), CLSHELD is closely held shares to common shares outstanding (Worldscope), SEG is the number of product segments (Worldscope), LISTING is an indicator variable taking the value 1 if a company is listed in one of the selection indices DAX, MDAX or SDAX of Deutsche Börse at December 31 of the considered year (Deutsche Börse), FORLISTING is an indicator variable taking the value 1 if a firm has a foreign listing (hand-collected), BIG4 is an indicator variable taking the value 1 if a company is audited by one of the BIG4 audit firms (hand-collected). The significance of sample differences is assessed by t-tests and Wilcoxon tests for the means and the medians of non-nominal variables and by Chi-squared tests of nominal variables. Bold typeset denotes significant difference (two-sided) below the 10 % level.
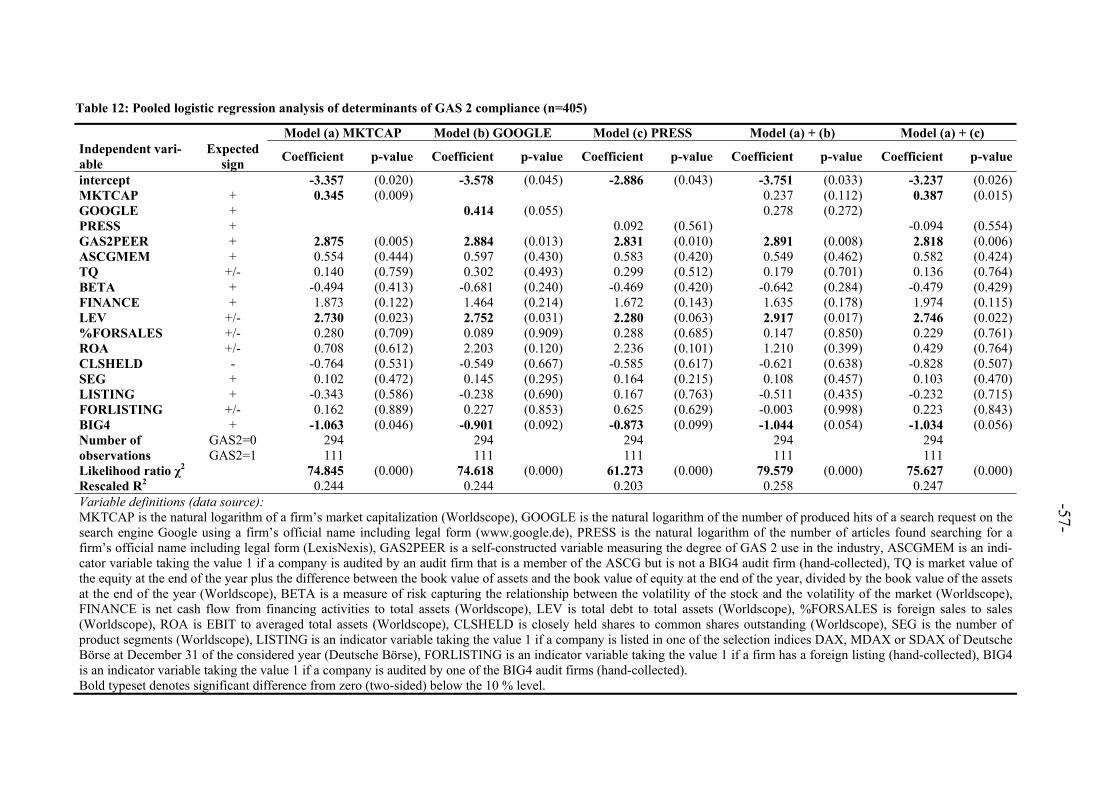
-57-
Table 12: Pooled logistic regression analysis of determinants of GAS 2 compliance (n=405)
Model (a) MKTCAP Model (b) GOOGLE Model (c) PRESS Model (a) + (b) Model (a) + (c) Independent vari-able
Expected sign
Coefficient p-value Coefficient p-value Coefficient p-value Coefficient p-value Coefficient p-value
intercept -3.357 (0.020) -3.578 (0.045) -2.886 (0.043) -3.751 (0.033) -3.237 (0.026) MKTCAP + 0.345 (0.009) 0.237 (0.112) 0.387 (0.015) GOOGLE + 0.414 (0.055) 0.278 (0.272) PRESS + 0.092 (0.561) -0.094 (0.554) GAS2PEER + 2.875 (0.005) 2.884 (0.013) 2.831 (0.010) 2.891 (0.008) 2.818 (0.006) ASCGMEM + 0.554 (0.444) 0.597 (0.430) 0.583 (0.420) 0.549 (0.462) 0.582 (0.424) TQ +/- 0.140 (0.759) 0.302 (0.493) 0.299 (0.512) 0.179 (0.701) 0.136 (0.764) BETA + -0.494 (0.413) -0.681 (0.240) -0.469 (0.420) -0.642 (0.284) -0.479 (0.429) FINANCE + 1.873 (0.122) 1.464 (0.214) 1.672 (0.143) 1.635 (0.178) 1.974 (0.115) LEV +/- 2.730 (0.023) 2.752 (0.031) 2.280 (0.063) 2.917 (0.017) 2.746 (0.022) %FORSALES +/- 0.280 (0.709) 0.089 (0.909) 0.288 (0.685) 0.147 (0.850) 0.229 (0.761) ROA +/- 0.708 (0.612) 2.203 (0.120) 2.236 (0.101) 1.210 (0.399) 0.429 (0.764) CLSHELD - -0.764 (0.531) -0.549 (0.667) -0.585 (0.617) -0.621 (0.638) -0.828 (0.507) SEG + 0.102 (0.472) 0.145 (0.295) 0.164 (0.215) 0.108 (0.457) 0.103 (0.470) LISTING + -0.343 (0.586) -0.238 (0.690) 0.167 (0.763) -0.511 (0.435) -0.232 (0.715) FORLISTING +/- 0.162 (0.889) 0.227 (0.853) 0.625 (0.629) -0.003 (0.998) 0.223 (0.843) BIG4 + -1.063 (0.046) -0.901 (0.092) -0.873 (0.099) -1.044 (0.054) -1.034 (0.056)
GAS2=0 294 294 294 294 294 Number of observations GAS2=1 111 111 111 111 111 Likelihood ratio χ2 74.845 (0.000) 74.618 (0.000) 61.273 (0.000) 79.579 (0.000) 75.627 (0.000) Rescaled R2 0.244 0.244 0.203 0.258 0.247 Variable definitions (data source): MKTCAP is the natural logarithm of a firm’s market capitalization (Worldscope), GOOGLE is the natural logarithm of the number of produced hits of a search request on the search engine Google using a firm’s official name including legal form (www.google.de), PRESS is the natural logarithm of the number of articles found searching for a firm’s official name including legal form (LexisNexis), GAS2PEER is a self-constructed variable measuring the degree of GAS 2 use in the industry, ASCGMEM is an indi-cator variable taking the value 1 if a company is audited by an audit firm that is a member of the ASCG but is not a BIG4 audit firm (hand-collected), TQ is market value of the equity at the end of the year plus the difference between the book value of assets and the book value of equity at the end of the year, divided by the book value of the assets at the end of the year (Worldscope), BETA is a measure of risk capturing the relationship between the volatility of the stock and the volatility of the market (Worldscope), FINANCE is net cash flow from financing activities to total assets (Worldscope), LEV is total debt to total assets (Worldscope), %FORSALES is foreign sales to sales (Worldscope), ROA is EBIT to averaged total assets (Worldscope), CLSHELD is closely held shares to common shares outstanding (Worldscope), SEG is the number of product segments (Worldscope), LISTING is an indicator variable taking the value 1 if a company is listed in one of the selection indices DAX, MDAX or SDAX of Deutsche Börse at December 31 of the considered year (Deutsche Börse), FORLISTING is an indicator variable taking the value 1 if a firm has a foreign listing (hand-collected), BIG4 is an indicator variable taking the value 1 if a company is audited by one of the BIG4 audit firms (hand-collected). Bold typeset denotes significant difference from zero (two-sided) below the 10 % level.

-58-
Finally, I investigate what drives compliance with GAS 3. The results are reported in
Table 13 and Table 14. The univariate results (Table 13) regarding GAS 3 indicate that
compliers (1) are bigger in terms of total assets and market capitalization, (2) are more
publicly exposed as measured by the Google hits and press coverage, (3) face more us-
age of GAS 2 (only t-test) and GAS 3 (only t-test) within the respective industry, (4) are
more often audited by audit firms having an affiliation to the ASCG, (5) have a higher
Tobin’s q, (6) are riskier, (7) have less financing needs, (8) have more debt agency
problems, (9) are more profitable, (10) are less closely held, (11) are more complex and
(12) are more often listed in one of the selection indices of Deutsche Börse.
The multivariate results (Table 14) show that compliance with GAS 3 is positively and
significantly associated with (1) size and (2) debt agency problems and (3) is negatively
associated with financing needs. Similar to the previous results, public exposure is posi-
tively and non-significantly associated with compliance in the models (b) and (c). In the
absence of a control for size, (1) peer pressure, (2) debt agency problems and (3) listing
status are positively and significantly associated with compliance. In the models (a)+(b)
and (a)+(c), size is better suitable in explaining compliance than the public exposure
proxy. The other results are not materially different from model (a).
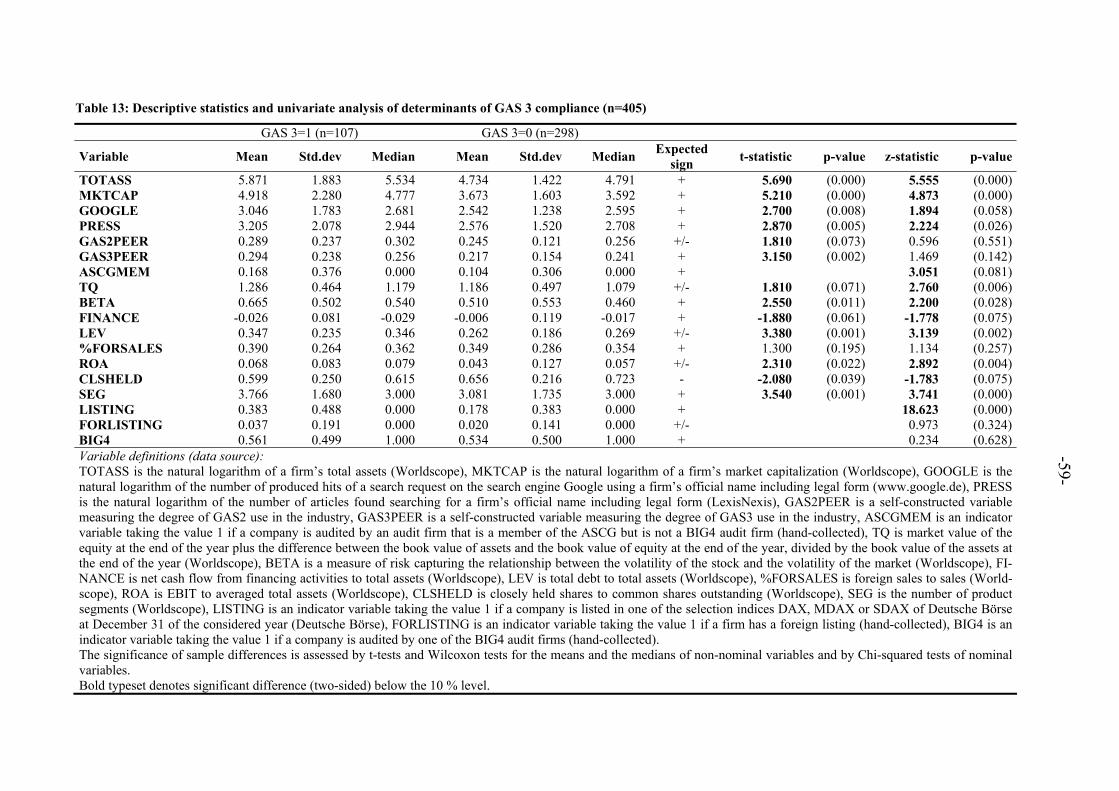
-59-
Table 13: Descriptive statistics and univariate analysis of determinants of GAS 3 compliance (n=405)
GAS 3=1 (n=107) GAS 3=0 (n=298)
Variable Mean Std.dev Median Mean Std.dev Median Expected
sign t-statistic p-value z-statistic p-value
TOTASS 5.871 1.883 5.534 4.734 1.422 4.791 + 5.690 (0.000) 5.555 (0.000) MKTCAP 4.918 2.280 4.777 3.673 1.603 3.592 + 5.210 (0.000) 4.873 (0.000) GOOGLE 3.046 1.783 2.681 2.542 1.238 2.595 + 2.700 (0.008) 1.894 (0.058) PRESS 3.205 2.078 2.944 2.576 1.520 2.708 + 2.870 (0.005) 2.224 (0.026) GAS2PEER 0.289 0.237 0.302 0.245 0.121 0.256 +/- 1.810 (0.073) 0.596 (0.551) GAS3PEER 0.294 0.238 0.256 0.217 0.154 0.241 + 3.150 (0.002) 1.469 (0.142) ASCGMEM 0.168 0.376 0.000 0.104 0.306 0.000 + 3.051 (0.081) TQ 1.286 0.464 1.179 1.186 0.497 1.079 +/- 1.810 (0.071) 2.760 (0.006) BETA 0.665 0.502 0.540 0.510 0.553 0.460 + 2.550 (0.011) 2.200 (0.028) FINANCE -0.026 0.081 -0.029 -0.006 0.119 -0.017 + -1.880 (0.061) -1.778 (0.075) LEV 0.347 0.235 0.346 0.262 0.186 0.269 +/- 3.380 (0.001) 3.139 (0.002) %FORSALES 0.390 0.264 0.362 0.349 0.286 0.354 + 1.300 (0.195) 1.134 (0.257) ROA 0.068 0.083 0.079 0.043 0.127 0.057 +/- 2.310 (0.022) 2.892 (0.004) CLSHELD 0.599 0.250 0.615 0.656 0.216 0.723 - -2.080 (0.039) -1.783 (0.075) SEG 3.766 1.680 3.000 3.081 1.735 3.000 + 3.540 (0.001) 3.741 (0.000) LISTING 0.383 0.488 0.000 0.178 0.383 0.000 + 18.623 (0.000) FORLISTING 0.037 0.191 0.000 0.020 0.141 0.000 +/- 0.973 (0.324) BIG4 0.561 0.499 1.000 0.534 0.500 1.000 + 0.234 (0.628) Variable definitions (data source): TOTASS is the natural logarithm of a firm’s total assets (Worldscope), MKTCAP is the natural logarithm of a firm’s market capitalization (Worldscope), GOOGLE is the natural logarithm of the number of produced hits of a search request on the search engine Google using a firm’s official name including legal form (www.google.de), PRESS is the natural logarithm of the number of articles found searching for a firm’s official name including legal form (LexisNexis), GAS2PEER is a self-constructed variable measuring the degree of GAS2 use in the industry, GAS3PEER is a self-constructed variable measuring the degree of GAS3 use in the industry, ASCGMEM is an indicator variable taking the value 1 if a company is audited by an audit firm that is a member of the ASCG but is not a BIG4 audit firm (hand-collected), TQ is market value of the equity at the end of the year plus the difference between the book value of assets and the book value of equity at the end of the year, divided by the book value of the assets at the end of the year (Worldscope), BETA is a measure of risk capturing the relationship between the volatility of the stock and the volatility of the market (Worldscope), FI-NANCE is net cash flow from financing activities to total assets (Worldscope), LEV is total debt to total assets (Worldscope), %FORSALES is foreign sales to sales (World-scope), ROA is EBIT to averaged total assets (Worldscope), CLSHELD is closely held shares to common shares outstanding (Worldscope), SEG is the number of product segments (Worldscope), LISTING is an indicator variable taking the value 1 if a company is listed in one of the selection indices DAX, MDAX or SDAX of Deutsche Börse at December 31 of the considered year (Deutsche Börse), FORLISTING is an indicator variable taking the value 1 if a firm has a foreign listing (hand-collected), BIG4 is an indicator variable taking the value 1 if a company is audited by one of the BIG4 audit firms (hand-collected). The significance of sample differences is assessed by t-tests and Wilcoxon tests for the means and the medians of non-nominal variables and by Chi-squared tests of nominal variables. Bold typeset denotes significant difference (two-sided) below the 10 % level.

-60-
Table 14: Pooled logistic regression analysis of determinants of GAS 3 compliance (n=405)
Model (a) MKTCAP Model (b) GOOGLE Model (c) PRESS Model (a) + (b) Model (a) + (c)
Independent variableExpected
sign Coefficient p-value Coefficient p-value Coefficient p-value Coefficient p-value Coefficient p-value
intercept -4.405 (0.001) -3.744 (0.004) -3.698 (0.004) -4.121 (0.003) -4.126 (0.002) MKTCAP + 0.399 (0.026) 0.486 (0.041) 0.461 (0.018) GOOGLE + 0.060 (0.756) -0.224 (0.403) PRESS + 0.033 (0.832) -0.167 (0.351) GAS3PEER + 1.848 (0.167) 2.296 (0.077) 2.331 (0.069) 1.784 (0.183) 1.669 (0.210) ASCGMEM + 0.869 (0.270) 0.920 (0.267) 0.925 (0.262) 0.932 (0.236) 0.923 (0.249) TQ +/- -0.102 (0.802) 0.139 (0.732) 0.136 (0.745) -0.114 (0.785) -0.078 (0.845) BETA + 0.111 (0.810) 0.114 (0.812) 0.152 (0.731) 0.281 (0.604) 0.116 (0.804) FINANCE + -2.116 (0.097) -1.776 (0.178) -1.734 (0.189) -2.040 (0.115) -2.224 (0.073) LEV +/- 3.459 (0.016) 2.704 (0.062) 2.649 (0.057) 3.363 (0.019) 3.478 (0.015) %FORSALES + -0.015 (0.985) -0.110 (0.885) -0.056 (0.943) 0.165 (0.843) -0.104 (0.898) ROA +/- 0.384 (0.778) 2.103 (0.126) 2.126 (0.120) 0.056 (0.970) -0.039 (0.979) CLSHELD - -0.315 (0.794) -0.140 (0.903) -0.148 (0.900) -0.507 (0.659) -0.467 (0.696) SEG + 0.035 (0.786) 0.114 (0.347) 0.114 (0.349) 0.017 (0.894) 0.033 (0.803) LISTING + 0.400 (0.454) 0.971 (0.059) 0.984 (0.055) 0.496 (0.345) 0.595 (0.279) FORLISTING +/- -0.850 (0.477) -0.103 (0.937) -0.082 (0.952) -0.722 (0.542) -0.684 (0.561) BIG4 + 0.040 (0.946) 0.171 (0.766) 0.165 (0.774) 0.044 (0.940) 0.092 (0.878)
GAS3=0 298 298 298 298 298 Number of observations GAS3=1 107 107 107 107 107 Likelihood ratio χ2 84.465 (0.000) 69.886 (0.000) 69.705 (0.000) 86.962 (0.000) 86.588 (0.000) Rescaled R2 0.275 0.231 0.231 0.282 0.281 Variable definitions (data source): MKTCAP is the natural logarithm of a firm’s market capitalization (Worldscope), GOOGLE is the natural logarithm of the number of produced hits of a search request on the search engine Google using a firm’s official name including legal form (www.google.de), PRESS is the natural logarithm of the number of articles found searching for a firm’s official name including legal form (LexisNexis), GAS3PEER is a self-constructed variable measuring the degree of GAS 3 use in the industry, ASCGMEM is an indi-cator variable taking the value 1 if a company is audited by an audit firm that is a member of the ASCG but is not a BIG4 audit firm (hand-collected), TQ is market value of the equity at the end of the year plus the difference between the book value of assets and the book value of equity at the end of the year, divided by the book value of the assets at the end of the year (Worldscope), BETA is a measure of risk capturing the relationship between the volatility of the stock and the volatility of the market (Worldscope), FINANCE is net cash flow from financing activities to total assets (Worldscope), LEV is total debt to total assets (Worldscope), %FORSALES is foreign sales to sales (Worldscope), ROA is EBIT to averaged total assets (Worldscope), CLSHELD is closely held shares to common shares outstanding (Worldscope), SEG is the number of product segments (Worldscope), LISTING is an indicator variable taking the value 1 if a company is listed in one of the selection indices DAX, MDAX or SDAX of Deutsche Börse at December 31 of the considered year (Deutsche Börse), FORLISTING is an indicator variable taking the value 1 if a firm has a foreign listing (hand-collected), BIG4 is an indicator variable taking the value 1 if a company is audited by one of the BIG4 audit firms (hand-collected). Bold typeset denotes significant difference from zero (two-sided) below the 10 % level.

-61-
Multicollinearity
Throughout the investigation, multicollinearity might be an issue in the models (a)+(b)
and (a)+(c). I refer to Wooldridge (2009) and Backhaus et al. (2008) for the subsequent
discussion. While multicollinearity does not affect the entire model, inferences from the
affected coefficients might be wrong. Multicollinearity arises from correlated predic-
tors. Higher degrees of multicollinearity result in higher standard errors of the affected
coefficients. Multicollinearity is less of a problem if not the variable of interest is af-
fected but other control variables. In that case, one can still draw correct inferences for
the variable of interest. This is not the case for the investigation at hand because the
multicollinearity issues affect the variables size and the two proxy variables of public
exposure. However, since multicollinearity results in higher standard errors, it leads to
falsely reject the hypothesis that there is no significant relationship between the depend-
ent and independent variable, working against finding significant results.
Multicollinearity can be addressed by increasing the data base or by dropping the corre-
lated variable(s). While the first approach is not feasible for the investigation, the sepa-
rate effects of size and public exposure are investigated in the models (a), (b) and (c). In
the mixed models, I examine whether one of the variables is more suitable to explain
compliance, making it impossible to drop one of the respective variables. For these
models, I calculate the variance inflation factor (VIF) for each independent variable in
an OLS equation with the same specification. The VIF gives an indication about the
severity of multicollinearity. As pointed out by Wooldridge (2009), a cutoff value for
VIF where multicollinearity is considered problematic is arbitrary. A commonly used
cutoff point is 10. In the mixed models, the VIF on market capitalization is higher than
13 in both models, while the VIF on the public exposure proxy variable ranges between
7 and 8. In so far, only the proxy for size would be considered to be problematic using

-62-
the arbitrary cutoff point of 10. However, that variable is significant in three out of four
specifications, hence not indicating the danger to falsely reject the hypothesis that there
is no significant relationship.
Additional tests
The subsequent section provides additional tests on GAS compliance. Tables and vari-
able definitions are provided in the Appendix.
Fixed time and industry effects
When assessing compliance with GAS 2 and GAS 3, I did not include industry effects
since I controlled for peer pressure. Including industry effects and a proxy for peer pres-
sure results in VIF far over ten, indicating that results including industry dummies and
the peer variable are pested by multicollinearity. Results of regressions containing fixed
time and industry effects but not the peer pressure variable are presented in Table A.1.
Compliance with GAS 2 is positively associated with (1) size, (2) financing needs and
(3) debt agency problems, and negatively associated with (4) being closely held and (5)
being audited by a BIG4 company. Compliance with GAS 3 is positively associated
with (1) debt agency problems and negatively associated with (2) financing needs and
(3) being closely held. Again, I find no significant relationship with public exposure.
Auditor
Unexpectedly, the results yield a negative and significant sign on being audited by a
BIG4 audit company. Additional tests on this matter are presented in Table A.2 (GAS2)
and Table A.3 (GAS3).
Ashbaugh and Warfield (2003) point out that considering Ernst & Young, KPMG, PWC
and Deloitte & Touche (and Arthur Andersen) as the largest audit firms might not ap-
-63-
propriately reflect the German auditor market. In order to address this issue, I introduce
the variable BIG5 that is coded one if a firm is audited by any of the aforementioned
audit firms or BDO Deutsche Warentreuhand. A negative sign pertains on the variable
BIG5. The relationship is significant for GAS 2 compliance (Model (1)).
In another step, I additionally introduce a variable that captures affiliation to the ASCG.
Since BDO Deutsche Warentreuhand is also a member of the ASCG, the variable
ASCGMEM_BIG5 is coded 1 if a firm is audited by an audit company that is not a
BIG5 audit company. A positive sign pertains on the variable ASCGMEM_BIG5. It is
significant for GAS 3 compliance (Model (2)).
So far, I distinguished between audit companies that are a member of the ASCG but not
a BIG4/BIG5 audit company. I forego this distinction in a next step (Model (3)). The
variable ASCGMEM is one if a firm is audited by a firm that is a member of the ASCG.
The association on compliance is positive and non-significant for GAS 3 compliance
and negative and non-significant for GAS 2 compliance.
Audits are supposed to enhance the credibility of financial information. In this respect,
audits can be considered as a feature of a firm’s corporate governance and are one in-
strument in enhancing the quality of a firm’s financial reporting (Sloan, 2001; Francis,
Khurana and Pereira, 2003). Ashbaugh and Warfield (2003) argue that the role of audits
in Germany is unclear rooting in the circumstance that reliance on debt and high con-
centrated ownership are distinct features of German firms. This circumstance might be
reflected in the results. In order to shed more light on this observation, I proceed in the
following way: I introduce a dummy variable that is one if CLSHELD is equal or higher
than 51%. I interact the variable with the dummy variable BIG4. The interaction is sup-

-64-
posed to capture two things. First, monitoring is less necessary for firms with higher
concentrated ownership. Second, being audited by BIG4 company might be a stronger
signal that positively reflects on a firm’s corporate governance than actual compliance
with GAS. Consequently, I expect a negative sign on the interacted term. For GAS 2
and GAS 3 compliance, the interacted term BIG4*CLSHELDDUM yields a non-
significant and negative sign (Model (4)).
Overall, the additional tests do not yield materially different results than the prior analy-
sis. The regressions using fixed time and industry effects suggest that higher ownership
concentration has a negative impact on compliance with GAS. This should be seen
against the background that parties which can be considered to be insiders to a firm
have less demand for accounting information provided in annual statements since they
have other means to obtain accounting information. The results also strengthen the find-
ing that the auditor plays an important role in the decision to comply with GAS. Inter-
estingly, being audited by one of the big four audit firms seems to have a compensating
effect on compliance with GAS. On the other hand, when the auditor has an affiliation
to the ASCG, this has a positive effect on compliance.
3.4.2 Anecdotal evidence of GAS compliance
This paragraph gives anecdotal evidence on GAS compliance and moreover, about
some striking statements concerning (non-)compliance with GAS. Most of the cases
concern additional information on GAS 4. Accordingly, six firms explicitly report that
they do not comply with GAS 4. Four firms do so throughout the considered applicable
time of GAS 4, i.e. 2001-2004. One firm does so from 2002-2004. The sixth firm does
so only in 2002. Two firms state not to comply with GAS 4 because it does not materi-
ally affect the economic presentation of the firm. Interestingly, one of these firms stated
-65-
in 2001 not to comply with GAS 4 due to an upcoming listing in SMAX where compli-
ance with international accounting standards was required. After the listing did not take
place, the firm did not start compliance but changed its non-compliance explanation. In
2001, one firm states to recognize goodwills according to GAS 4 but executes the capi-
tal consolidation according to the book value method. This pronouncement was not re-
peated in later financial statements. One firm stands out as it wrongly states not to com-
ply with GAS 5 although obviously GAS 4 was meant within the context. This error
was found in two consecutive years until it was corrected. Finally, one firm reports to
comply with the GAS as long as the standards do not exceed German GAAP require-
ments. This anecdotal evidence further fuels the finding that each standards exhibits
different costs and that firms make a case-to-case decision whether to comply with a
standard or not.
3.4.3 Analysis of changers
In this paragraph I further investigate the incidence of GAS compliance by drawing on
firms that switched from non-compliance to compliance and vice versa. The number of
observations that fulfill this criterion is comparably small. Consequently, I refrain from
reporting results on differences in the mean. This paragraph is especially meant to give
a better understanding which changes are associated for cash flow statements and seg-
ment reports when firms start to report to be GAS compliant or when firms stop to re-
port to be GAS compliant.
GAS 2 changers
Over the observation period, 15 firms switched from non-compliance to compliance
with GAS 2. In order to assess which changes the switch brought to the cash flow
statement, I use a score that consists of the seven items displayed in Table 15.
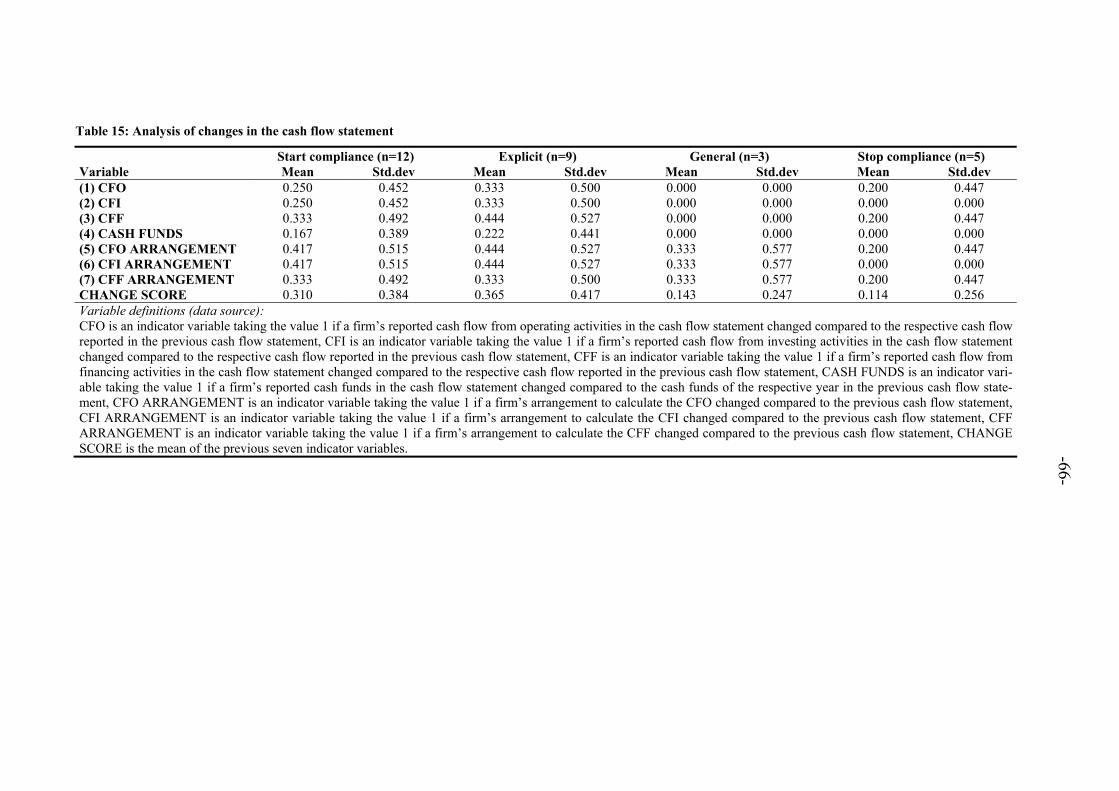
-66-
Table 15: Analysis of changes in the cash flow statement
Start compliance (n=12) Explicit (n=9) General (n=3) Stop compliance (n=5) Variable Mean Std.dev Mean Std.dev Mean Std.dev Mean Std.dev (1) CFO 0.250 0.452 0.333 0.500 0.000 0.000 0.200 0.447 (2) CFI 0.250 0.452 0.333 0.500 0.000 0.000 0.000 0.000 (3) CFF 0.333 0.492 0.444 0.527 0.000 0.000 0.200 0.447 (4) CASH FUNDS 0.167 0.389 0.222 0.441 0.000 0.000 0.000 0.000 (5) CFO ARRANGEMENT 0.417 0.515 0.444 0.527 0.333 0.577 0.200 0.447 (6) CFI ARRANGEMENT 0.417 0.515 0.444 0.527 0.333 0.577 0.000 0.000 (7) CFF ARRANGEMENT 0.333 0.492 0.333 0.500 0.333 0.577 0.200 0.447 CHANGE SCORE 0.310 0.384 0.365 0.417 0.143 0.247 0.114 0.256 Variable definitions (data source): CFO is an indicator variable taking the value 1 if a firm’s reported cash flow from operating activities in the cash flow statement changed compared to the respective cash flow reported in the previous cash flow statement, CFI is an indicator variable taking the value 1 if a firm’s reported cash flow from investing activities in the cash flow statement changed compared to the respective cash flow reported in the previous cash flow statement, CFF is an indicator variable taking the value 1 if a firm’s reported cash flow from financing activities in the cash flow statement changed compared to the respective cash flow reported in the previous cash flow statement, CASH FUNDS is an indicator vari-able taking the value 1 if a firm’s reported cash funds in the cash flow statement changed compared to the cash funds of the respective year in the previous cash flow state-ment, CFO ARRANGEMENT is an indicator variable taking the value 1 if a firm’s arrangement to calculate the CFO changed compared to the previous cash flow statement, CFI ARRANGEMENT is an indicator variable taking the value 1 if a firm’s arrangement to calculate the CFI changed compared to the previous cash flow statement, CFF ARRANGEMENT is an indicator variable taking the value 1 if a firm’s arrangement to calculate the CFF changed compared to the previous cash flow statement, CHANGE SCORE is the mean of the previous seven indicator variables.
-67-
The items (1) to (4) measure whether GAS 2 compliance brought a quantitative change
that causes either the cash flow from operating, from investing or from financing activi-
ties to be calculated differently compared to the prior year. The items (5) to (7) capture
whether the arrangement of each cash flow changed compared to the prior year.
In order to build the score, I need to draw on the cash flow statement prior to the
change. Also, these figures need to be given in the year of change to allow a compari-
son. GAS 2.56 allows firms not to disclose figures for the previous reporting period in
case of initial compliance with GAS 2. Two sample firms make use of this possibility.
For another firm, first time compliance with GAS 2 coincides with first time preparation
of a cash flow statement. I do not calculate change scores for these three firms. This
yields a sample of 12 firms that changed from non-compliance to compliance. On the
other hand, five firms stopped reporting to be compliant with GAS 2.
Table 15 displays the means of the different score items. The scores are shown for all
firms that started compliance (start compliance sample) and stopped compliance (stop
compliance sample). I further divide the start compliance sample into firms that explic-
itly report to comply with GAS 2 (nine firms) and firms that generally state to comply
with GAS (three firms). First, the scores concerning the firms that started to comply
indicate that compliance really was associated with changes in the cash flow statement.
This rules out that the switch was merely a labeling process. This result looks different
when distinguishing between the explicit and general subsample. Within the general
subsample, only one firm actually changed the arrangement of the cash flow statement.
Similarly, only one out of five firms within the stop subsample made modifications to
the cash flow statement. In order to judge whether the decision to start compliance
comes with changes in firm characteristics, I deploy univariate tests for the start compli-

-68-
ance subsample. The results indicate that the firms face significantly more peer pressure
in the year of change and have a smaller Tobin’s q compared to the last non-compliant
business year (Table 16).

-69-
Table 16: Descriptive statistics and univariate analysis of firms starting to comply with GAS 2 (n=12)
Previous year Change year Variable Mean Std.dev Median Mean Std.dev Median p-value TOTASS 3344.360 10836.510 158.349 3217.660 10348.630 176.219 (0.622) MKTCAP 2548.370 8465.790 92.196 2214.090 7308.610 111.161 (0.424) PRESS 72.083 195.300 18.000 67.083 189.442 13.500 (0.217) GAS2PEER 0.174 0.134 0.233 0.316 0.223 0.241 (0.016) GAS3PEER 0.158 0.121 0.140 0.301 0.230 0.241 (0.004) ASCGMEM 0.000 0.000 0.083 0.289 n.a. TQ 1.272 0.350 1.205 1.176 0.277 1.152 (0.021) FINANCE 0.055 0.116 0.053 -0.003 0.106 0.007 (0.233) LEV 0.371 0.170 0.384 0.353 0.196 0.317 (0.470) %FORSALES 0.277 0.274 0.258 0.310 0.275 0.299 (0.359) ROA 0.024 0.163 0.085 0.070 0.082 0.067 (0.204) CLSHELD 0.586 0.310 0.629 0.587 0.301 0.682 (0.438) SEG 3.583 2.109 3.000 4.083 2.021 4.500 (0.500) LISTING 0.417 0.515 0.250 0.452 (0.157) FORLISTING 0.083 0.289 0.083 0.289 n.a. BIG4 0.333 0.492 0.417 0.515 (0.317) Variable definitions (data source): TOTASS is the natural logarithm of a firm’s total assets (Worldscope), MKTCAP is the natural logarithm of a firm’s market capitalization (Worldscope), GOOGLE is the natural logarithm of the number of produced hits of a search request on the search engine Google using a firm’s official name including legal form (www.google.de), PRESS is the natural logarithm of the number of articles found searching for a firm’s official name including legal form (LexisNexis), GAS2PEER is a self-constructed variable measuring the degree of GAS2 use in the industry, GAS3PEER is a self-constructed variable measuring the degree of GAS3 use in the industry, ASCGMEM is an indicator variable taking the value 1 if a company is audited by an audit firm that is a member of the ASCG but is not a BIG4 audit firm (hand-collected), TQ is market value of the equity at the end of the year plus the difference between the book value of assets and the book value of equity at the end of the year, divided by the book value of the assets at the end of the year (Worldscope), FINANCE is net cash flow from financing activities to total assets (Worldscope), LEV is total debt to total assets (Worldscope), %FOR-SALES is foreign sales to sales (Worldscope), ROA is EBIT to averaged total assets (Worldscope), CLSHELD is closely held shares to common shares outstanding (World-scope), SEG is the number of product segments (Worldscope), LISTING is an indicator variable taking the value 1 if a company is listed in one of the selection indices DAX, MDAX or SDAX of Deutsche Börse at December 31 of the considered year (Deutsche Börse), FORLISTING is an indicator variable taking the value 1 if a firm has a foreign listing (hand-collected), BIG4 is an indicator variable taking the value 1 if a company is audited by one of the BIG4 audit firms (hand-collected). The significance of sample differences is assessed by signed rank-tests for non-nominal variables and by McNemar exact tests for nominal variables. N.a. denotes that a 2x2 tables could not be constructed for nominal variables. Bold typeset denotes significant difference (two-sided) below the 10 % level.
-70-
GAS 3 changers
Next, I investigate the incidence of GAS 3 compliance and effects on segment report-
ing. Over the sample period, 15 firms switched from non-compliance to compliance
with GAS 3. In order to assess the impact of compliance with GAS 3 on segment report-
ing, I calculate a change score by drawing on the specification given in GAS 3. Accord-
ing to GAS 3, for each reportable segment the following information shall be given: (a)
revenue from sales to external customers and to other segments, (b) segment result in-
cluding (ba) depreciation, (bb) other non-cash items, (bc) result from investment in as-
sociated enterprises, (bd) income from other investments, (c) assets including invest-
ments, (d) capital expenditure and (e) liabilities. In order to build a change score, a point
is given where the segment report has been extended for one of these items. GAS 3.49
offers the possibility not to provide comparative figures for the previous year in case of
initial compliance with GAS 3. One firm makes use of this possibility. This yields 14
firms that started to comply with GAS 3. Another six firms stopped to comply with
GAS 3.
The means of the different items are tabulated in Table 17. The scores are shown for all
firms that started compliance (start compliance sample) and stopped compliance (stop
compliance sample). Again, I divide the start compliance sample into firms that explic-
itly report to comply with GAS 3 (ten firms) and firms that generally state to comply
with GAS (four firms). The results suggest that firms starting to comply with GAS 3
make only minor changes to their segment reports. Most changes relate to provide more
details concerning assets, capital expenditure and liabilities. Strikingly, firms that state
to generally comply with GAS did not make any changes to their segment reports.
Likewise, only one firm that stopped to report to comply with GAS 3 made changes to
its segment report. Again, I assess whether changes in firm characteristics occurred in

-71-
the change year. The results indicate that firms starting to comply with GAS 3 faced
more peer pressure in the adoption year (Table 18).
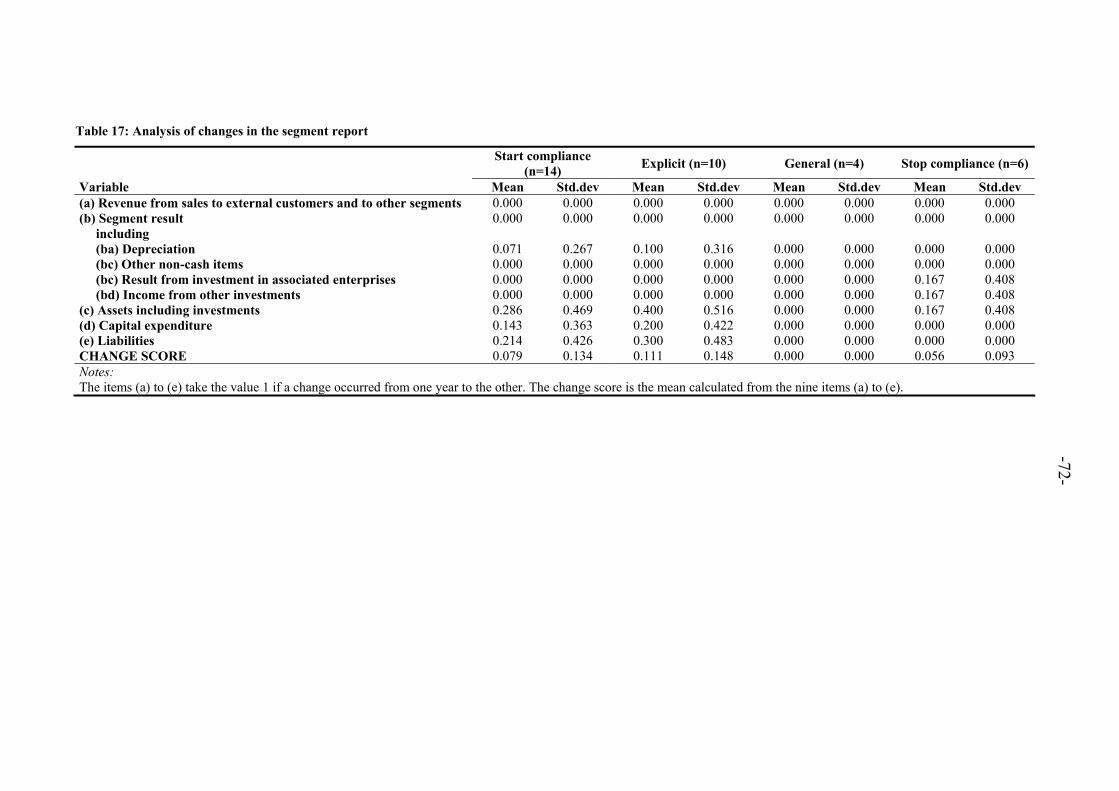
-72-
Table 17: Analysis of changes in the segment report
Start compliance
(n=14) Explicit (n=10) General (n=4) Stop compliance (n=6)
Variable Mean Std.dev Mean Std.dev Mean Std.dev Mean Std.dev (a) Revenue from sales to external customers and to other segments 0.000 0.000 0.000 0.000 0.000 0.000 0.000 0.000 (b) Segment result 0.000 0.000 0.000 0.000 0.000 0.000 0.000 0.000 including (ba) Depreciation 0.071 0.267 0.100 0.316 0.000 0.000 0.000 0.000 (bc) Other non-cash items 0.000 0.000 0.000 0.000 0.000 0.000 0.000 0.000 (bc) Result from investment in associated enterprises 0.000 0.000 0.000 0.000 0.000 0.000 0.167 0.408 (bd) Income from other investments 0.000 0.000 0.000 0.000 0.000 0.000 0.167 0.408 (c) Assets including investments 0.286 0.469 0.400 0.516 0.000 0.000 0.167 0.408 (d) Capital expenditure 0.143 0.363 0.200 0.422 0.000 0.000 0.000 0.000 (e) Liabilities 0.214 0.426 0.300 0.483 0.000 0.000 0.000 0.000 CHANGE SCORE 0.079 0.134 0.111 0.148 0.000 0.000 0.056 0.093 Notes: The items (a) to (e) take the value 1 if a change occurred from one year to the other. The change score is the mean calculated from the nine items (a) to (e).

-73-
Table 18: Descriptive statistics and univariate analysis of firms starting to comply with GAS 3 (n=14)
Previous year Change year Variable Mean Std.dev Median Mean Std.dev Median p-value TOTASS 2980.290 10014.550 210.859 2872.740 9563.400 215.256 (0.626) MKTCAP 2240.320 7828.520 41.830 1967.550 6755.210 38.222 (0.761) PRESS 80.143 184.017 17.000 73.786 175.449 15.000 (0.623) GAS2PEER 0.166 0.135 0.221 0.358 0.285 0.279 (0.002) GAS3PEER 0.127 0.108 0.140 0.330 0.288 0.230 (0.001) ASCGMEM 0.000 0.000 0.000 0.000 n.a. TQ 1.330 0.836 1.073 1.281 0.777 1.071 (0.153) FINANCE 0.019 0.103 -0.022 -0.029 0.074 -0.021 (0.463) LEV 0.292 0.196 0.308 0.293 0.178 0.299 (0.952) %FORSALES 0.442 0.331 0.534 0.459 0.291 0.590 (0.519) ROA 0.059 0.048 0.058 0.074 0.057 0.061 (0.217) CLSHELD 0.635 0.251 0.649 0.619 0.251 0.647 (0.496) SEG 3.500 1.990 3.000 3.714 1.978 3.000 (0.563) LISTING 0.429 0.514 0.286 0.469 (0.157) FORLISTING 0.071 0.267 0.071 0.267 n.a. BIG4 0.429 0.514 0.000 0.500 0.519 0.500 (0.317) Variable definitions (data source): TOTASS is the natural logarithm of a firm’s total assets (Worldscope), MKTCAP is the natural logarithm of a firm’s market capitalization (Worldscope), GOOGLE is the natural logarithm of the number of produced hits of a search request on the search engine Google using a firm’s official name including legal form (www.google.de), PRESS is the natural logarithm of the number of articles found searching for a firm’s official name including legal form (LexisNexis), GAS2PEER is a self-constructed variable measuring the degree of GAS2 use in the industry, GAS3PEER is a self-constructed variable measuring the degree of GAS3 use in the industry, ASCGMEM is an indicator variable taking the value 1 if a company is audited by an audit firm that is a member of the ASCG but is not a BIG4 audit firm (hand-collected), TQ is market value of the equity at the end of the year plus the difference between the book value of assets and the book value of equity at the end of the year, divided by the book value of the assets at the end of the year (Worldscope), FINANCE is net cash flow from financing activities to total assets (Worldscope), LEV is total debt to total assets (Worldscope), %FOR-SALES is foreign sales to sales (Worldscope), ROA is EBIT to averaged total assets (Worldscope), CLSHELD is closely held shares to common shares outstanding (World-scope), SEG is the number of product segments (Worldscope), LISTING is an indicator variable taking the value 1 if a company is listed in one of the selection indices DAX, MDAX or SDAX of Deutsche Börse at December 31 of the considered year (Deutsche Börse), FORLISTING is an indicator variable taking the value 1 if a firm has a foreign listing (hand-collected), BIG4 is an indicator variable taking the value 1 if a company is audited by one of the BIG4 audit firms (hand-collected). The significance of sample differences is assessed by signed rank-tests for non-nominal variables and by McNemar exact tests for nominal variables. N.a. denotes that a 2x2 tables could not be constructed for nominal variables. Bold typeset denotes significant difference (two-sided) below the 10 % level.

-74-
3.4.4 Compliance as a routine process
Routine means that a player repeats actions due to habit or standardized processes
(Cormier, Magnan and van Velthoven, 2005). The aforementioned authors show that
environmental disclosure among German firms follows a routine process. Thinking of
disclosure and compliance behavior as a routine process is appealing. Once initial struc-
tures have been implemented, subsequent changes should require less costs and effort.
Preparing financial statements is less prone to major changes in a steady institutional
setting. The results from the previous section also hint towards a routine process in pre-
paring cash flow statements and segment reports. Cormier, Magnan and van Velthoven
(2005) test whether disclosure follows a routine process by assessing if including lagged
disclosure has a significant incremental explanatory power in their models. I follow this
approach by including the lagged dependent variable into my models. I use a Wald test
and a likelihood ratio test to assess the explanatory power of the lagged dependent vari-
able.
The likelihood ratio test assesses whether the difference in the log-likelihood functions
for an unrestricted and a restricted model is meaningful. I refer to Wooldridge (2009)
for the following explanations. I use this concept to assess whether compliance with
GAS is done in a routine process. In doing so, I estimate a model where the lagged deci-
sion to comply with GAS is included (unrestricted model), and the same model without
the lagged decision to comply with GAS (restricted model). The likelihood ratio statistic
follows a chi-square distribution. The degree of freedom is the number of restrictions in
the restricted model, i. e. one in this case. A likelihood ratio test statistic that is higher
than the critical value indicates that GAS compliance follows a routine process since the
unrestricted model is better suitable to explain compliance. Since I need to lag the deci-
-75-
sion to comply with GAS, I estimate the models for the years 2001-2004. Results of the
likelihood ratio test are displayed in Table 19. The results indicate that the decision to
comply with GAS is done in a routine fashion.
The likelihood ratio test and Wald test should yield the same results. However, both
tests have different assumptions. One assumption of the likelihood ratio test is that the
observations are independent. This assumption is violated at the setting at hand. The
Wald test does not require this assumption. Results of the Wald test are also displayed
in Table 19. These results also suggest that GAS compliance is done in a routine fash-
ion.

-76-
Table 19: Test of GAS compliance as a routine process (n=332)
Dependent variable Model Observations
(non-compliant/compliant) Coefficient of lagged
dependent variable p-value -2 LOG Lr -2 LOG Lu LR p-value
Model (a) 230/94 6.278 (0.000) 314.578 117.776 196.802 (0.000) GAS2
Model (a)+(b) 230/94 6.304 (0.000) 314.068 116.884 197.184 (0.000) Model (a) 231/93 6.115 (0.000) 320.912 132.302 188.610 (0.000)
GAS3 Model (a)+(b) 231/93 6.165 (0.000) 320.264 131.991 188.273 (0.000)
Notes: Significance of the coefficient of the lagged dependent variable in the unrestricted model is assessed by a Wald test. LR equals 2*ln(Lu)-2*ln(Lr).
-77-
4 Summary and conclusions
The purpose of this study is to identify determinants of voluntary compliance with ac-
counting standards. I do this in a unique context, i.e. I study German firms that can
choose to voluntarily follow GAS in addition to German GAAP when preparing their
consolidated financial statements. I explicitly address the influence of public exposure
and compliance pressure proposing two different measures to capture public exposure:
press coverage and the number of hits produced by a search request on Google.
The study reveals a small amount of firms that violate German GAAP by not preparing
cash flow statements or segment reports. A reasonable explanation for not preparing a
cash flow statement that is in line with German GAAP seems unlikely. An analysis of
firms that do not prepare segment reports suggest that the decision to prepare a segment
report is driven by determinants internal and external to the firm. Accordingly, firms do
not prepare a segment report when they have less information that needs to be disaggre-
gated, which is in line with the materiality principle. Results also reveal that external
factors like capital market pressures, the auditor or an elevated need for transparency as
for growth firms have a positive impact on the decision to prepare a segment report.
With respect to GAS compliance, the study reveals the existence of costlier standards
that firms prefer to ignore. In this regard, the study replicates the observation that firms
engage into “standard picking” (Gebhardt and Heilmann, 2004a; 2004b). The results of
an ordered logistic regression indicate that compliance is driven by size, the auditor’s
affiliation to the institution that develops the GAS and debt agency problems. When
analyzing compliance determinants with single standards, the results concerning GAS 2
indicate that size, peer pressure within the industry and debt agency problems is posi-
tively associated with compliance, and negatively with being audited by a BIG4 auditor.
-78-
Compliance with GAS 3 is positively associated with size and debt agency problems,
and negatively with financing needs.
Overall, I find no relationship between compliance and public exposure. The univariate
tests indicate a relationship between public exposure and compliance with GAS. This
relationship does not hold in multivariate analyses. In the mixed models, size and public
exposure are either not significantly associated with compliance or size is better suitable
to explain compliance than public exposure. My results are only to a limited extent
comparable to findings of prior literature. The positive effect of size has been identified
in several studies (e.g. Meek, Roberts and Gray, 1995; Ashbaugh, 2001; Cuijpers and
Buijink, 2005). It is often stated that it is not entirely clear what drives the size effect. I
am not able to attribute public exposure to the size effect. Rather, the size effect domi-
nates my measures for public exposure. Unlike Neu, Warsame and Pedwell (1998) and
Cormier, Magnan and van Velthoven (2005), who find a positive relationship between
media coverage and environmental disclosure or Lim and McKinnon (1993), who find a
positive relationship between political visibility and voluntary disclosure by statutory
authorities, compliance with GAS does not seem to be driven by public exposure.
Continuously, compliance is positively associated with higher debt agency problems. In
this respect, the result suggests that compliance with GAS is used to mitigate debt
agency problems. Compliance with GAS might fulfill this in two ways. First, by provid-
ing better or more reliable accounting information that allow a better assessment of the
financial situation of a firm. Second, by sending a reassuring signal to creditors that the
management prepares accounting information by voluntarily complying to a stricter
accounting set. This might also be taken as a signal that the firm is a trustworthy con-
tract partner. Since Germany can be considered to be a bank-oriented country where
-79-
banks have more direct ways to obtain financial information than from the annual re-
port, the second explanation seems more likely than the first. To some extent, this is
also backed up by the finding that GAS 3 compliance is negatively associated with fi-
nancing needs implying that compliance with GAS 3 is not used to prepare qualitatively
higher accounting information for creditors.
The auditor seems to play an important role in compliance with GAS. First, compliance
is higher for firms that are audited by firms having an affiliation with the ASCG. Taken
together with the circumstance that peer pressure is positively associated with GAS 2
compliance, this finding suggests that influence from outside the firm is an important
factor in the decision to comply with GAS. The finding is further substantiated as the
results reveal a negative relationship with being audited by a BIG4 audit firm. This in-
dicates that firms consider being audited by a big audit firm as a stronger quality signal
than complying with GAS.
A striking point of the investigation is that the results are rather equivocal among the
different standards. This suggests that compliance with different standards fulfills dif-
ferent purposes for the firms and firms decide on a case-to-case basis to comply with
single standards. Anecdotal evidence that is mostly related to GAS 4 further substanti-
ates this finding since firms give rather unconvincing reasons not to comply with the
standard. Once a firm complies with a standard, the decision is repeated in a routine
fashion. This conclusion is fueled by the change analysis. Firms that newly report to
comply with GAS 2 or GAS 3 exhibit only few changes to their prior cash flow state-
ments and segment reports. This is especially true for those firms that only generally
state to comply with GAS. The change analysis gives further evidence that compliance
is associated with peer pressure.
-80-
Taken all together, the study yields little evidence that firms voluntarily commit to
compliance in order to improve their accounting practice. Of course, the underlying
assumption in this context is that compliance with German Accounting Standards really
improves accounting. Taking it from there, this study suggests that firms pick require-
ments that are easy to comply with and report according compliance. In light of low
compliance costs, it seems odd that not more firms choose this practice. This observa-
tion suggests that if the underlying framework is not perceived important enough, even
mere labeling processes do not take place. The implications for institutions that publish
accounting standards or codices that practitioners can choose to apply on a voluntary
basis are fourfold. First, even in the light of a set of rules aiming at improving corporate
disclosure, non-compliance is still prevalent and additional incentives and advantages
for various users need to be provided in order to get the rules accepted by practitioners.
Second, in order to avoid a labeling process, partial compliance to rules should be dis-
closed to the users of accounting information in detail as this might be relevant with
regard to comparability. Third, acceptance of the standards by other firms within the
same industry can have a positive influence on compliance. Fourth, affiliated third par-
ties to the publishing organization that are also affiliated to firms that apply the stan-
dards can enhance compliance and dissemination of the standards.
Every research comes with caveats. This investigation’s purpose is to contribute to the
existing accounting literature by explicitly addressing matters of public exposure and
compliance pressure when investigating voluntary compliance. Measuring public expo-
sure is no easy endeavor. I suspect press coverage to be biased towards larger compa-
nies that are not necessarily more publicly exposed than smaller companies. I alterna-
tively propose to measure public exposure as the number of hits produced by a search
request on the search engine Google. Unfortunately, I do not have these pieces of in-
-81-
formation as for the end of the considered years. Hence, I use data from 2008. It is diffi-
cult to asses how much noise this introduces. However, this means that I consider public
exposure to be relatively stable over time. Notably, both public exposure measures work
into the same direction. Another issue concerns external validity. It is important to note
that the considered sample consists of firms that chose to follow German GAAP instead
of international accounting standards. Prior evidence suggests that companies voluntar-
ily following IAS/IFRS are systematically different from companies that decide not to
do so (Gassen and Sellhorn, 2006). Other research also implies that these IFRS firms
have incentives to provide high quality accounting information (Christensen, Lee and
Walker, 2008). Hence, the sample might be biased towards firms with less incentives to
provide high quality accounting information which in turn might influence the decision
to comply with GAS. Also, the knowledge that IFRS application would become manda-
tory from 2005 onwards might have a suppressing effect on GAS compliance in later
stages of the sample period. In this respect, the institutional setting is quite unique.
While this study benefits from its quasi-experimental design, the generalizability of the
results is to be questioned. The application of results to other non-mandatory accounting
standards, codices and other institutional settings should only be done with caution.

-82-
References
Admati, A. R. and Pfleiderer, P. (2000), Forcing firms to talk: Financial disclosure regu-
lation and externalities, The Review of Financial Studies, Vol. 13, pp. 479-519.
Ashbaugh, H. (2001), Non-US firms’ accounting standard choices, Journal of Account-
ing and Public Policy, Vol. 20, pp. 129-153.
Ashbaugh, H. and Warfield, T. D. (2003), Audits as a corporate governance mechanism:
Evidence from the German market, Journal of International Accounting Re-
search, Vol. 2, pp. 1-21.
Ball, R. (2006), International Financial Reporting Standards (IFRS): Pros and Cons for
Investors, Accounting and Business Research, Vol. 36 (Special Issue), pp. 5-27.
Biener, H. (1996), Fachnormen statt Rechtsnormen, in: Festschrift für Hermann Clemm
zum 70. Geburtstag, pp. 59-79.
Beisse, H. (1999), Normqualität und Normstruktur von Bilanzvorschriften und Stan-
dards, Betriebs-Berater, Vol. 54, pp. 2180-2186.
Backhaus, K., Erichson, B., Plinke, W. and Weiber, R. (2008), Multivariate Analyseme-
thoden: Eine anwendungsorientierte Einführung, 12th ed., Springer, Berlin.
Burger, A., Fröhlich, J. and Ulbrich, P. R. (2006), Kapitalmarktorientierung in Deutsch-
land - Aktualisierung der Studien aus den Jahren 2003 und 2004 vor dem Hin-
tergrund der Änderungen der Rechnungslegung von Emittenten, Zeitschrift für
internationale und kapitalmarktorientierte Rechnungslegung, Vol. 6, pp. 113-
122.
Budde, W. and Steuber, E. (1998), Normsetzungsbefugnis eines deutschen Standard
Setting Body, Deutsches Steuerrecht, Vol. 36, pp. 1181-1187.
Chow, C. W. and Wong-Boren, A. (1987), Voluntary Financial Disclosure by Mexican
Corporations, The Accounting Review, Vol. 62, pp. 533-541.
Christensen, H. B., Lee, E. and Walker, M. (2008), Incentives or standards: What de-
termines accounting quality changes around IFRS adoption?, Working Paper.
Cooke, T. E. (1989), Voluntary Corporate Disclosure by Swedish Companies, Journal
of International Financial Management and Accounting, Vol. 1, pp. 171-195.
-83-
Core, J. E. (2001), A Review of the Empirical Disclosure Literature: Discussion, Jour-
nal of Accounting and Economics, Vol. 31, pp. 441-456.
Cormier, D., Magnan, M. and van Velthoven, B. (2005), Environmental disclosure qual-
ity in large German companies: Economic incentives, public pressures or institu-
tional conditions?, European Accounting Review, Vol. 14, pp. 3-39.
Cuijpers, R. and Buijink, W. (2005), Voluntary adoption of non-local GAAP in the
European Union: A study of determinants and consequences, European Ac-
counting Review, Vol. 14, pp. 487-524.
Daske, H., Hail, L., Leuz, C. and Verdi, R. S. (2009), Adopting a Label: Heterogeneity
in the Economic Consequences of IFRS Adoptions, Working Paper.
DRSC (ed.) (1998), Standardisierungsvertrag vom 03.09.1998,
http://www.standardsetter.de/drsc/docs/verein/Standardisierungsvertrag_BMJ.pd
f (01.02.2011).
DiMaggio, P. and Powell, W. (1983), The iron cage revisited: Institutional isomorphism
and collective rationality in organizational fields, American Sociological Review,
Vol. 48, pp. 147-160.
Dumontier, P. and Raffournier, B. (1998), Why firms comply voluntarily with IAS: An
empirical analysis with Swiss data, Journal of International Financial Manage-
ment and Accounting, Vol. 9, pp. 216-245.
Dyck, A., Volchkova, N. and Zingales, L. (2008), The Corporate Governance Role of
the Media: Evidence from Russia, The Journal of Finance, Vol. 63, pp. 1093-
1135.
El-Gazzar, S. M., Finn, P. M. and Jacob, R. (1999), An empirical investigation of mul-
tinational firms’ compliance with International Accounting Standards, The In-
ternational Journal of Accounting, Vol. 34, pp. 239-248.
Eng, L. L. and Mak, Y. T. (2003), Corporate governance and voluntary disclosure,
Journal of Accounting and Public Policy, Vol. 22, pp. 325-345.
Ernst, C. (1998), KonTraG und KapAEG sowie aktuelle Entwicklungen zur Rechnungs-
legung und Prüfung in der EU, Die Wirtschaftsprüfung, Vol. 51, pp. 1025-1035.

-84-
Firth, M. A. (1979), The impact of size, stock market listing, and auditors on voluntary
disclosure in corporate annual reports, Accounting and Business Research,
Vol. 9, pp. 273-280.
Förschle, G. (2006), § 342, in: Ellrott, H., Förschle, G., Hoyos, M. and Winkeljohann,
N. (ed.), Beck’scher Bilanz-Kommentar: Handels- und Steuerbilanz, Verlag C.
H. Beck, München, pp. 2286-2293.
Francis, J. R., Khurana, I. K. and Pereira, R. (2003), The role of accounting and auditing
in corporate governance and the development of financial markets around the
world, Asian-Pacific Journal of Accounting and Economics, Vol. 10, pp. 1-30.
Frankel, R., McNichols, M. and Wilson, G. P. (1995), Discretionary disclosure and ex-
ternal financing, The Accounting Review, Vol. 70, pp. 135-150.
Frost, C. A. (1991), Loss Contingency Reports and Stock Prices: A Replication and
Extension of Banks and Kinney, Journal of Accounting Research, Vol. 29, pp.
157-169.
Gassen, J. and Sellhorn, T. (2006), Applying IFRS in Germany - Determinants and
Consequences, Betriebswirtschaftliche Forschung und Praxis, Vol. 58, pp. 365-
386.
Gebhardt, G. and Heilmann, A. A. (2004a), Compliance with German and International
Accounting Standards in Germany: Evidence from Cash Flow Statements, in:
Hopwood, A., Leuz, C. and Pfaff, D. (ed.), The Economics and Politics of Ac-
counting, Oxford 2004, pp. 218-238.
Gebhardt, G. and Heilmann, A. A. (2004b), DRS 4 in der Bilanzierungspraxis – ein
Beispiel für die Missachtung Deutscher Rechnungslegungsstandards, Der Kon-
zern, Vol. 2, pp. 109-118.
Gelhausen, W. and Mujkanovic, R. (1995), Auswertung zur Währungsumrechnung im
Konzernabschluß, Deutsches Steuerrecht, pp. 1724-1730.
Glaum, M. and Street, D. L. (2003), Compliance with the Disclosure Requirements of
Germany’s New Market: IAS Versus U.S. GAAP, Journal of International Fi-
nancial Management and Accounting, Vol. 14, pp. 64-100.
-85-
Gleason, C. A., Jenkins, N. T. and Johnson, W. B. (2008), Financial statement credibil-
ity: The contagion effects of accounting restatements, The Accounting Review,
Vol. 83, pp. 83-110.
Goncharov, I., Werner, J. R. and Zimmermann, J. (2006), Does Compliance with the
German Corporate Governance Code Have an Impact on Stock Valuation? An
empirical analysis, Corporate Governance: An International Review, Vol. 14,
pp. 432-445.
Government Commission (2009), German Corporate Governance Code (as amended on
June 18, 2009), available under http://www.corporate-governance-code.de
(01.02.2011).
Hellermann, J. (2000), Private Standardsetzung im Bilanzrecht – öffentlich-rechtlich
gesehen, Neue Zeitschrift für Gesellschaftsrecht, Vol. 3, pp. 1097-1103.
HFA (1995), Die Kapitalflußrechnung als Ergänzungsrechnung des Jahres- und Kon-
zernabschlusses, Die Wirtschaftsprüfung, Vol. 48, pp. 210-213.
HFA (1998), Entwurf einer Stellungnahme zur Währungsumrechnung im Konzer-
nabschluß, Die Wirtschaftsprüfung, Vol. 51, pp. 549-555.
Hommelhoff, P. and Schwab, M. (1998), Gesellschaftliche Selbststeuerung im Bilanz-
recht – Standard Setting Bodies und staatliche Regulierungsverantwortung nach
deutschem Recht, Betriebswirtschaftliche Forschung und Praxis, Vol. 50, pp.
38-56.
Hommelhoff, P. and Schwab, M. (2002), § 342, in: Ulmer, P. (ed.), HGB-Bilanzrecht:
Rechnungslegung, Abschlußprüfung, Publizität – Großkommentar, de Gruyter,
Berlin, pp. 2052-2091.
Hossain, M., Perera, M. H. B. and Rahman, A. R. (1995), Voluntary disclosure in the
annual reports of New Zealand companies, Journal of International Financial
Management and Accounting, Vol. 6, pp. 69-85.
Hütten, C. and Brakensiek, S. (2000), „Deutsche US-GAAP” ohne ein SEC – Auto oh-
ne Bremsen?, Betriebs-Berater, Vol. 55, pp. 870-872.
Hyytinen, A. and Pajarinen, M. (2005), External Finance, Firm Growth and the Benefits
of Information Disclosure: Evidence from Finland, European Journal of Law
and Economics, Vol. 19, pp. 69-93.
-86-
Inchausti, B. G. (1997), The influence of company characteristics and accounting regu-
lation on Information disclosed by Spanish firms, European Accounting Review,
Vol. 6, pp. 45-68.
Jaggi, B. and Low, P. Y. (2000), Impact of Culture, Market Forces and Legal System on
Financial Disclosures, International Journal of Accounting, Vol. 35, pp. 495-
519.
Jensen, M. C. and Meckling, W. H. (1976), Theory of the firm: Managerial behavior,
agency costs, and ownership structure, Journal of Financial Economics, Vol. 3,
pp. 305-360.
Joe, J. R. (2003), Why Press Coverage of a Client Influences the Audit Opinion, Jour-
nal of Accounting Research, Vol. 41, pp. 109-133.
Kézdi, G. (2004), Robust Standard Error Estimation in Fixed-Effects Panel Models,
Hungarian Statistical Review Special, Vol. 9, pp. 96-116.
Küting, K. and Hütten, C. (1999), Warum denn aus Fehlern anderer lernen – Das DRSC
und sein erster Standardentwurf, Steuern und Bilanzen, Vol. 1, pp. 487-489.
Krämling, M. (1998), Der Goodwill aus der Kapitalkonsolidierung: Bestandsaufnahme
der Bilanzierungspraxis und deren Relevanz für die Aktienbewertung, Lang,
Frankfurt am Main.
Lim, S. and McKinnon, J. (1993), Voluntary disclosure by NSW authorities: The influ-
ence of political visibility, Journal of Accounting and Public Policy, Vol. 12, pp.
189-216.
Littkemann, J. and Moedebeck, P. (2000), Währungsumrechnung im Konzern: Ergeb-
nisse einer empirischen Untersuchung, Buchführung, Bilanz, Kostenrechnung,
Fach 14, pp. 67-76.
Maurer, J. G. (1971), Readings in organization theory: Open system approaches, Ran-
dom House, New York.
Meek, G. K., Roberts, C. B. and Gray, S. J. (1995), Factors influencing voluntary an-
nual report disclosures by U.S., U.K. and continental European multinational
corporations, Journal of International Business Studies, Vol. 26, pp. 555-572.

-87-
Mutchler, J. F., Hopwood, W. and McKeown, J. M. (1997), The Influence of Contrary
Information and Mitigating Factors on Audit Opinion Decisions on Bankrupt
Companies, Journal of Accounting Research, Vol. 35, pp. 295-310.
Nagar, V., Nanda, D. and Wysocki, P. (2003), Discretionary disclosure and stock-based
incentives, Journal of Accounting and Economics, Vol. 34, pp. 283-309.
Nobes, C. (2006), The survival of international differences under IFRS: Towards a re-
search agenda, Accounting and Business Research, Vol. 36, pp. 233-245.
Neu, D., Warsame, H. and Pedwell, K. (1998), Managing public impressions: environ-
mental disclosures in annual reports, Accounting, Organizations and Society,
Vol. 23, pp. 265-282.
Paal, B. P. (2001), Rechnungslegung und DRSC, Nomos Verlagsgesellschaft, Baden-
Baden.
Patten, D. M. (1991), Exposure, Legitimacy, and Social Disclosure, Journal of Account-
ing and Public Policy, Vol. 10, pp. 297-308.
Pellens, B., Bonse, A. and Gassen, J. (1998), Perspektiven der deutschen Konzernrech-
nungslegung, Der Betrieb, Vol. 51, pp. 785-792.
Petersen, M. A. (2009), Estimating Standard Errors in Finance Panel Data Sets: Com-
paring Approaches, Review of Financial Studies, Vol. 22, pp. 435-480.
Petersen, M. A. and Rajan, R. G. (1994), The benefits of lending relationships: Evi-
dence from small business data, Journal of Finance, Vol. 49, pp. 3-37.
Raffournier, B. (1995), The determinants of voluntary financial disclosure by Swiss
listed companies, European Accounting Review, Vol. 4, pp. 261-280.
Schneider, U. H. (2003), Compliance als Aufgabe der Unternehmensleitung, Zeitschrift
für Wirtschaftsrecht, Vol. 24, pp. 645-646.
Scholz, J. T. (1984), Voluntary Compliance and Regulatory Enforcement, Law and Pol-
icy, Vol. 6, pp. 385-404.
Sengupta, P. (1998), Corporate disclosure quality and the cost of debt, The Accounting
Review, Vol. 73, pp. 459-474.
Sing, V. (2004), Die Neuorientierung des DRSC im Kontext der internationalen Har-
monisierung der Rechnungslegung, Verlag Dr. Kovac, Hamburg.

-88-
Singhvi, S. S. and Desai, H. B. (1971), An Empirical Analysis of the Quality of Corpo-
rate Financial Disclosure, The Accounting Review, Vol. 46, pp. 129-138.
Sloan, R. G. (2001), Financial Accounting and Corporate Governance: A Discussion,
Journal of Accounting and Economics, Vol. 32, pp. 335-347.
Smith, C. W., Jr. and Warner, J. B. (1979), On financial contracting: An analysis of
bond covenants, Journal of Financial Economics, Vol. 7, pp. 117-161.
Smith, C. W., Jr. and Watts, R. L. (1992), The investment opportunity set and corporate
financing, dividend and compensation policies, Journal of Financial Economics,
Vol. 40, pp. 263-292.
Solomon, A. and Lewis, L. (2002), Incentives and disincentives for corporate environ-
mental disclosure, Business Strategy and the Environment, Vol. 11, pp. 154-169.
Spanheimer, J. (2000), Spezifische Problemfelder des gesetzlichen Standardisierungs-
auftrages an den DSR gemäß § 342 Abs. 1 Nr. 1 HGB, Die Wirtschaftsprüfung,
Vol. 53, pp. 997-1007.
Street, D. L. and Bryant, S. M. (2000), Disclosure Level and Compliance with IASs: A
Comparison of Companies With and Without U.S. Listings and Filings, The In-
ternational Journal of Accounting, Vol. 35, pp. 305-329.
Street, D. L. and Gray, S. J. (2001), Observance of international accounting standards:
Factors explaining non-compliance, ACCA Research Report No. 74.
Suchman, M. C. (1995), Managing legitimacy: Strategic and institutional approaches,
Academy of Management Review, Vol. 20, pp. 571-610.
Verrecchia, R. E. (1983), Discretionary disclosure, Journal of Accounting and Econom-
ics, Vol. 5, pp. 179-194.
Vetter, E. (2009), Compliance in der Unternehmerpraxis, in: Wecker, G. and van Laak,
H., Compliance in der Unternehmerpraxis, 2nd. ed., Gabler Verlag, Wiesbaden.
Wallace, R. S. O. and Naser, K. (1995), Firm-specific determinants of the comprehen-
siveness of mandatory disclosure in the corporate annual reports of firms listed
on the Stock Exchange of Hong Kong, Journal of Accounting and Public Policy,
Vol. 14, pp. 311-368.
-89-
Watts, R. L. and Zimmerman, J. L. (1986), Positive Accounting Theory, Edgewood
Cliffs, Prentice Hall, London.
Werder, A. v., Talaulicar, T. and Kolat, G. L. (2005), Compliance with the German
Corporate Governance Code: an empirical analysis of the compliance statements
by German listed companies, Corporate Governance: An International Review,
Vol. 13, pp. 178-187.
Wilmshurst, T. D. and Frost, G. R. (2000), Corporate environmental reporting: a test of
legitimacy theory, Accounting, Auditing and Accountability Journal, Vol. 13,
10-26.
Wooldridge, J. M. (2009), Introductory Econometrics: A Modern Approach, South-
Western Cengage Learning, Mason, Ohio.
Zarzeski, M. T. (1996), Spontaneous Harmonization Effects of Culture and Market Ac-
counting Disclosure Practices, Accounting Horizons, Vol. 10, pp. 18-37.
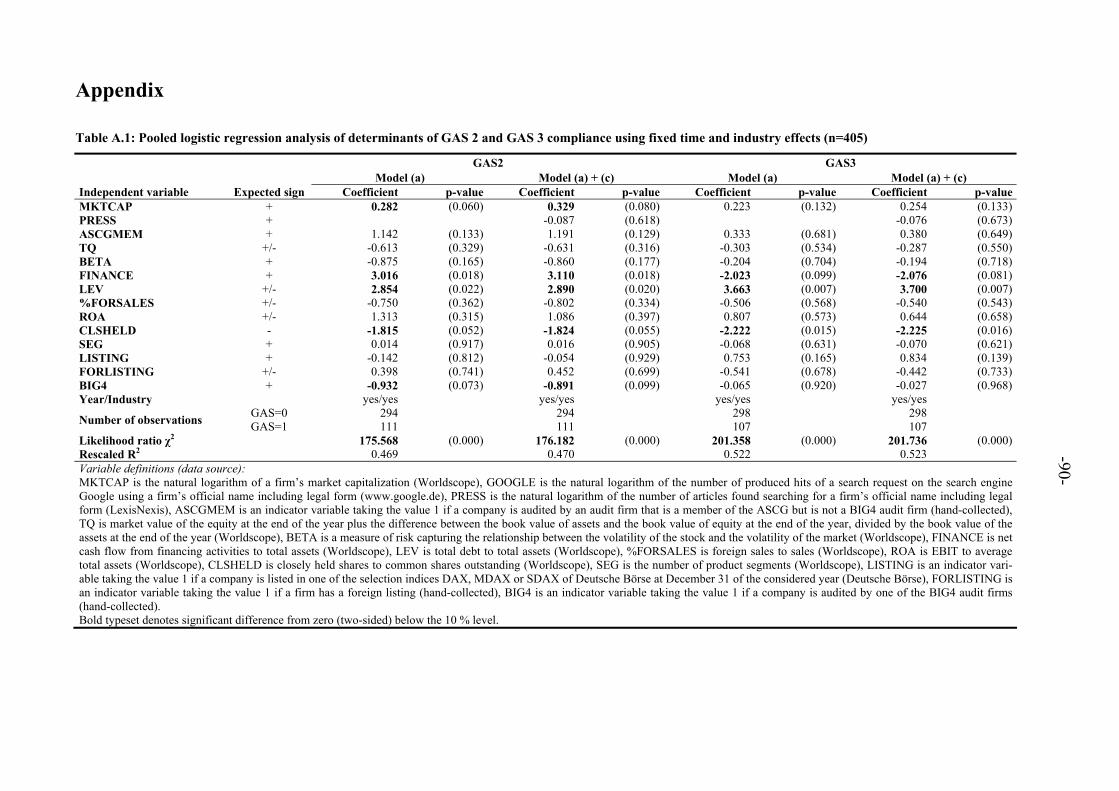
-90-
Appendix
Table A.1: Pooled logistic regression analysis of determinants of GAS 2 and GAS 3 compliance using fixed time and industry effects (n=405)
GAS2 GAS3 Model (a) Model (a) + (c) Model (a) Model (a) + (c) Independent variable Expected sign Coefficient p-value Coefficient p-value Coefficient p-value Coefficient p-value MKTCAP + 0.282 (0.060) 0.329 (0.080) 0.223 (0.132) 0.254 (0.133) PRESS + -0.087 (0.618) -0.076 (0.673) ASCGMEM + 1.142 (0.133) 1.191 (0.129) 0.333 (0.681) 0.380 (0.649) TQ +/- -0.613 (0.329) -0.631 (0.316) -0.303 (0.534) -0.287 (0.550) BETA + -0.875 (0.165) -0.860 (0.177) -0.204 (0.704) -0.194 (0.718) FINANCE + 3.016 (0.018) 3.110 (0.018) -2.023 (0.099) -2.076 (0.081) LEV +/- 2.854 (0.022) 2.890 (0.020) 3.663 (0.007) 3.700 (0.007) %FORSALES +/- -0.750 (0.362) -0.802 (0.334) -0.506 (0.568) -0.540 (0.543) ROA +/- 1.313 (0.315) 1.086 (0.397) 0.807 (0.573) 0.644 (0.658) CLSHELD - -1.815 (0.052) -1.824 (0.055) -2.222 (0.015) -2.225 (0.016) SEG + 0.014 (0.917) 0.016 (0.905) -0.068 (0.631) -0.070 (0.621) LISTING + -0.142 (0.812) -0.054 (0.929) 0.753 (0.165) 0.834 (0.139) FORLISTING +/- 0.398 (0.741) 0.452 (0.699) -0.541 (0.678) -0.442 (0.733) BIG4 + -0.932 (0.073) -0.891 (0.099) -0.065 (0.920) -0.027 (0.968) Year/Industry yes/yes yes/yes yes/yes yes/yes
GAS=0 294 294 298 298 Number of observations GAS=1 111 111 107 107 Likelihood ratio χ2 175.568 (0.000) 176.182 (0.000) 201.358 (0.000) 201.736 (0.000) Rescaled R2 0.469 0.470 0.522 0.523 Variable definitions (data source): MKTCAP is the natural logarithm of a firm’s market capitalization (Worldscope), GOOGLE is the natural logarithm of the number of produced hits of a search request on the search engine Google using a firm’s official name including legal form (www.google.de), PRESS is the natural logarithm of the number of articles found searching for a firm’s official name including legal form (LexisNexis), ASCGMEM is an indicator variable taking the value 1 if a company is audited by an audit firm that is a member of the ASCG but is not a BIG4 audit firm (hand-collected), TQ is market value of the equity at the end of the year plus the difference between the book value of assets and the book value of equity at the end of the year, divided by the book value of the assets at the end of the year (Worldscope), BETA is a measure of risk capturing the relationship between the volatility of the stock and the volatility of the market (Worldscope), FINANCE is net cash flow from financing activities to total assets (Worldscope), LEV is total debt to total assets (Worldscope), %FORSALES is foreign sales to sales (Worldscope), ROA is EBIT to average total assets (Worldscope), CLSHELD is closely held shares to common shares outstanding (Worldscope), SEG is the number of product segments (Worldscope), LISTING is an indicator vari-able taking the value 1 if a company is listed in one of the selection indices DAX, MDAX or SDAX of Deutsche Börse at December 31 of the considered year (Deutsche Börse), FORLISTING is an indicator variable taking the value 1 if a firm has a foreign listing (hand-collected), BIG4 is an indicator variable taking the value 1 if a company is audited by one of the BIG4 audit firms (hand-collected). Bold typeset denotes significant difference from zero (two-sided) below the 10 % level.
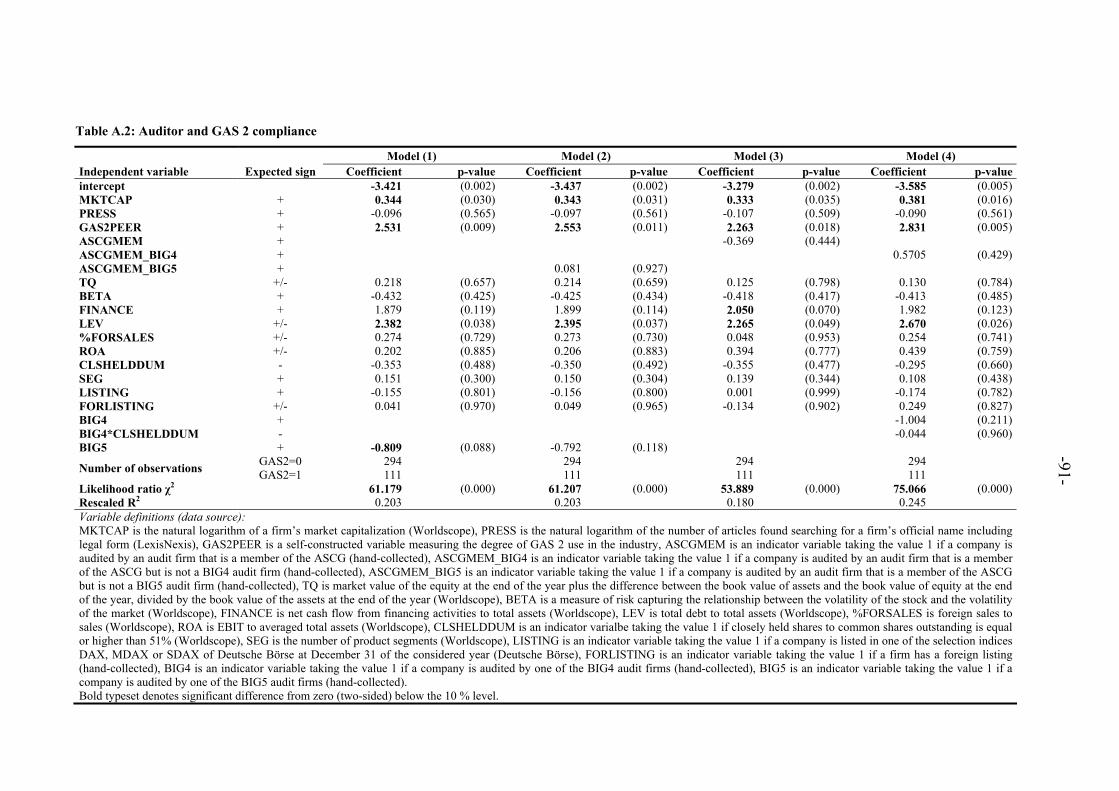
-91-
Table A.2: Auditor and GAS 2 compliance
Model (1) Model (2) Model (3) Model (4) Independent variable Expected sign Coefficient p-value Coefficient p-value Coefficient p-value Coefficient p-value intercept -3.421 (0.002) -3.437 (0.002) -3.279 (0.002) -3.585 (0.005) MKTCAP + 0.344 (0.030) 0.343 (0.031) 0.333 (0.035) 0.381 (0.016) PRESS + -0.096 (0.565) -0.097 (0.561) -0.107 (0.509) -0.090 (0.561) GAS2PEER + 2.531 (0.009) 2.553 (0.011) 2.263 (0.018) 2.831 (0.005) ASCGMEM + -0.369 (0.444) ASCGMEM_BIG4 + 0.5705 (0.429) ASCGMEM_BIG5 + 0.081 (0.927) TQ +/- 0.218 (0.657) 0.214 (0.659) 0.125 (0.798) 0.130 (0.784) BETA + -0.432 (0.425) -0.425 (0.434) -0.418 (0.417) -0.413 (0.485) FINANCE + 1.879 (0.119) 1.899 (0.114) 2.050 (0.070) 1.982 (0.123) LEV +/- 2.382 (0.038) 2.395 (0.037) 2.265 (0.049) 2.670 (0.026) %FORSALES +/- 0.274 (0.729) 0.273 (0.730) 0.048 (0.953) 0.254 (0.741) ROA +/- 0.202 (0.885) 0.206 (0.883) 0.394 (0.777) 0.439 (0.759) CLSHELDDUM - -0.353 (0.488) -0.350 (0.492) -0.355 (0.477) -0.295 (0.660) SEG + 0.151 (0.300) 0.150 (0.304) 0.139 (0.344) 0.108 (0.438) LISTING + -0.155 (0.801) -0.156 (0.800) 0.001 (0.999) -0.174 (0.782) FORLISTING +/- 0.041 (0.970) 0.049 (0.965) -0.134 (0.902) 0.249 (0.827) BIG4 + -1.004 (0.211) BIG4*CLSHELDDUM - -0.044 (0.960) BIG5 + -0.809 (0.088) -0.792 (0.118)
GAS2=0 294 294 294 294 Number of observations GAS2=1 111 111 111 111 Likelihood ratio χ2 61.179 (0.000) 61.207 (0.000) 53.889 (0.000) 75.066 (0.000) Rescaled R2 0.203 0.203 0.180 0.245 Variable definitions (data source): MKTCAP is the natural logarithm of a firm’s market capitalization (Worldscope), PRESS is the natural logarithm of the number of articles found searching for a firm’s official name including legal form (LexisNexis), GAS2PEER is a self-constructed variable measuring the degree of GAS 2 use in the industry, ASCGMEM is an indicator variable taking the value 1 if a company is audited by an audit firm that is a member of the ASCG (hand-collected), ASCGMEM_BIG4 is an indicator variable taking the value 1 if a company is audited by an audit firm that is a member of the ASCG but is not a BIG4 audit firm (hand-collected), ASCGMEM_BIG5 is an indicator variable taking the value 1 if a company is audited by an audit firm that is a member of the ASCG but is not a BIG5 audit firm (hand-collected), TQ is market value of the equity at the end of the year plus the difference between the book value of assets and the book value of equity at the end of the year, divided by the book value of the assets at the end of the year (Worldscope), BETA is a measure of risk capturing the relationship between the volatility of the stock and the volatility of the market (Worldscope), FINANCE is net cash flow from financing activities to total assets (Worldscope), LEV is total debt to total assets (Worldscope), %FORSALES is foreign sales to sales (Worldscope), ROA is EBIT to averaged total assets (Worldscope), CLSHELDDUM is an indicator varialbe taking the value 1 if closely held shares to common shares outstanding is equal or higher than 51% (Worldscope), SEG is the number of product segments (Worldscope), LISTING is an indicator variable taking the value 1 if a company is listed in one of the selection indices DAX, MDAX or SDAX of Deutsche Börse at December 31 of the considered year (Deutsche Börse), FORLISTING is an indicator variable taking the value 1 if a firm has a foreign listing (hand-collected), BIG4 is an indicator variable taking the value 1 if a company is audited by one of the BIG4 audit firms (hand-collected), BIG5 is an indicator variable taking the value 1 if a company is audited by one of the BIG5 audit firms (hand-collected). Bold typeset denotes significant difference from zero (two-sided) below the 10 % level.
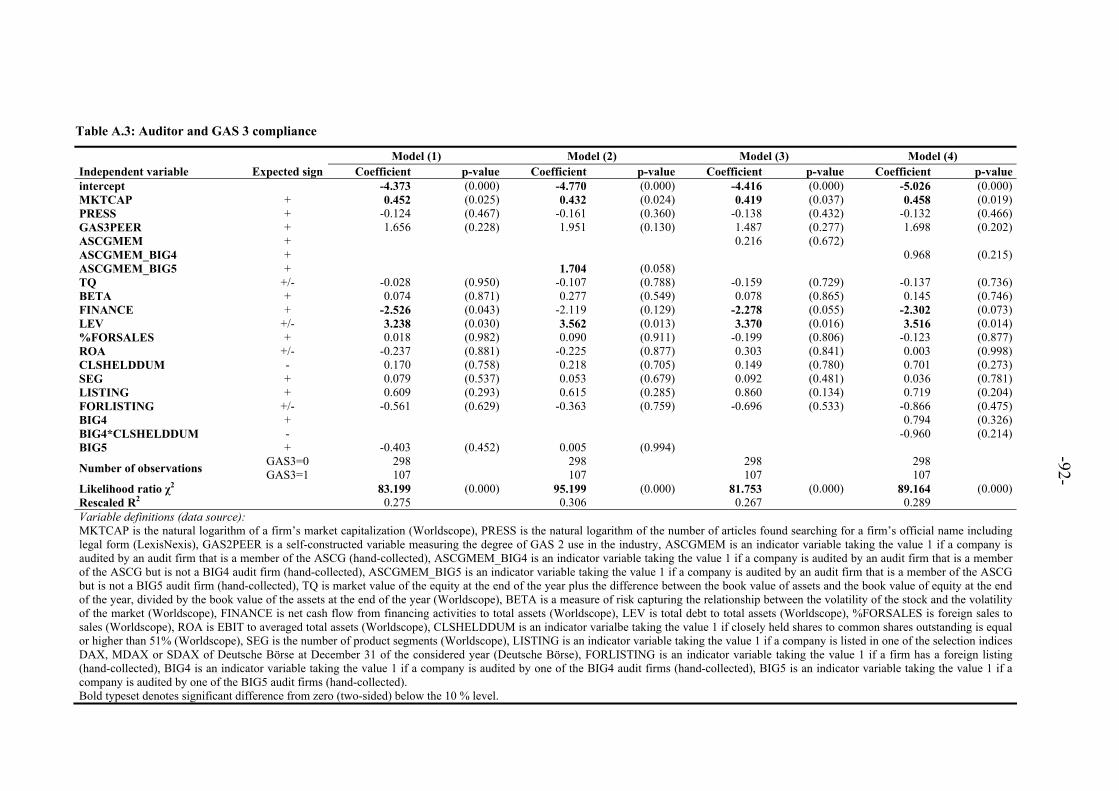
-92-
Table A.3: Auditor and GAS 3 compliance
Model (1) Model (2) Model (3) Model (4) Independent variable Expected sign Coefficient p-value Coefficient p-value Coefficient p-value Coefficient p-value intercept -4.373 (0.000) -4.770 (0.000) -4.416 (0.000) -5.026 (0.000) MKTCAP + 0.452 (0.025) 0.432 (0.024) 0.419 (0.037) 0.458 (0.019) PRESS + -0.124 (0.467) -0.161 (0.360) -0.138 (0.432) -0.132 (0.466) GAS3PEER + 1.656 (0.228) 1.951 (0.130) 1.487 (0.277) 1.698 (0.202) ASCGMEM + 0.216 (0.672) ASCGMEM_BIG4 + 0.968 (0.215) ASCGMEM_BIG5 + 1.704 (0.058) TQ +/- -0.028 (0.950) -0.107 (0.788) -0.159 (0.729) -0.137 (0.736) BETA + 0.074 (0.871) 0.277 (0.549) 0.078 (0.865) 0.145 (0.746) FINANCE + -2.526 (0.043) -2.119 (0.129) -2.278 (0.055) -2.302 (0.073) LEV +/- 3.238 (0.030) 3.562 (0.013) 3.370 (0.016) 3.516 (0.014) %FORSALES + 0.018 (0.982) 0.090 (0.911) -0.199 (0.806) -0.123 (0.877) ROA +/- -0.237 (0.881) -0.225 (0.877) 0.303 (0.841) 0.003 (0.998) CLSHELDDUM - 0.170 (0.758) 0.218 (0.705) 0.149 (0.780) 0.701 (0.273) SEG + 0.079 (0.537) 0.053 (0.679) 0.092 (0.481) 0.036 (0.781) LISTING + 0.609 (0.293) 0.615 (0.285) 0.860 (0.134) 0.719 (0.204) FORLISTING +/- -0.561 (0.629) -0.363 (0.759) -0.696 (0.533) -0.866 (0.475) BIG4 + 0.794 (0.326) BIG4*CLSHELDDUM - -0.960 (0.214) BIG5 + -0.403 (0.452) 0.005 (0.994)
GAS3=0 298 298 298 298 Number of observations GAS3=1 107 107 107 107 Likelihood ratio χ2 83.199 (0.000) 95.199 (0.000) 81.753 (0.000) 89.164 (0.000) Rescaled R2 0.275 0.306 0.267 0.289 Variable definitions (data source): MKTCAP is the natural logarithm of a firm’s market capitalization (Worldscope), PRESS is the natural logarithm of the number of articles found searching for a firm’s official name including legal form (LexisNexis), GAS2PEER is a self-constructed variable measuring the degree of GAS 2 use in the industry, ASCGMEM is an indicator variable taking the value 1 if a company is audited by an audit firm that is a member of the ASCG (hand-collected), ASCGMEM_BIG4 is an indicator variable taking the value 1 if a company is audited by an audit firm that is a member of the ASCG but is not a BIG4 audit firm (hand-collected), ASCGMEM_BIG5 is an indicator variable taking the value 1 if a company is audited by an audit firm that is a member of the ASCG but is not a BIG5 audit firm (hand-collected), TQ is market value of the equity at the end of the year plus the difference between the book value of assets and the book value of equity at the end of the year, divided by the book value of the assets at the end of the year (Worldscope), BETA is a measure of risk capturing the relationship between the volatility of the stock and the volatility of the market (Worldscope), FINANCE is net cash flow from financing activities to total assets (Worldscope), LEV is total debt to total assets (Worldscope), %FORSALES is foreign sales to sales (Worldscope), ROA is EBIT to averaged total assets (Worldscope), CLSHELDDUM is an indicator varialbe taking the value 1 if closely held shares to common shares outstanding is equal or higher than 51% (Worldscope), SEG is the number of product segments (Worldscope), LISTING is an indicator variable taking the value 1 if a company is listed in one of the selection indices DAX, MDAX or SDAX of Deutsche Börse at December 31 of the considered year (Deutsche Börse), FORLISTING is an indicator variable taking the value 1 if a firm has a foreign listing (hand-collected), BIG4 is an indicator variable taking the value 1 if a company is audited by one of the BIG4 audit firms (hand-collected), BIG5 is an indicator variable taking the value 1 if a company is audited by one of the BIG5 audit firms (hand-collected). Bold typeset denotes significant difference from zero (two-sided) below the 10 % level.

-93-
Accounting quality after voluntary IFRS adoption –
Evidence based on provision disclosure of German firms
Tolga Davarcioglu and Ulrich Küting
Abstract: We investigate effects of voluntary IFRS adoption on accounting quality based on provision disclosure using a sample of publicly listed German firms. The in-vestigation primarily draws on compliance with disclosure requirements and on disclo-sure level. We take advantage of a same firm-year approach to assess changes in our accounting quality measures resulting from the transition from German GAAP to IFRS. We find that compliance is significantly lower and that disclosure level is significantly higher under IFRS. Non-compliance under IFRS primarily stems from the circumstance that virtually no firm fulfills the restrictive demands made on disclosing qualitative pieces of information. Improvement in the disclosure level primarily stems from more detailed disclosure in the balance sheet and more quantification in the notes. Emphasiz-ing the limitations of our approach, the results are consistent with the notion that IFRS adoption has a positive impact on the disclosure aspect of accounting quality regarding accounting for provisions. Improvement is more pronounced for firms where provisions are relatively more important in proportion to the balance sheet and where IFRS adop-tion has a higher impact on the provisions. At the same time, positive changes are stronger for more levered and more closely held firms that typically have less incentives to provide accounting information for a broad investor base.
Keywords: International Financial Reporting Standards (IFRS), other provisions, vol-untary adoption, accounting quality, IFRS compliance, disclosure level

-94-
1 Introduction
This paper investigates changes in accounting quality stemming from voluntary Interna-
tional Financial Reporting Standards (IFRS) adoption based on provision disclosure.
The IFRS play an outstandingly important role in the harmonization process of account-
ing worldwide. The increasing number of countries adopting IFRS is a prominent dem-
onstration of this role (PWC, 2009). The IFRS are developed by the IASB with the ob-
jective to create “a single set of high quality, understandable and enforceable accounting
standards to help participants in the world’s capital markets and other users make eco-
nomic decisions” (IASCF, 2009). The dispersion of IFRS in various parts of the world
triggered the necessity to investigate the relationship between the standards and ac-
counting quality. Generally, recipients of accounting information are perceived to ap-
preciate high quality (Francis et al., 2004). Several studies document a positive effect of
IFRS adoption on accounting quality. Most studies draw on the earnings aspect of ac-
counting quality (e.g. Gassen and Sellhorn, 2006; Hung and Subramanyam, 2007;
Barth, Landsman and Lang, 2008). An exemption is Daske and Gebhardt (2006) who
focus on the disclosure aspect of accounting quality and find that disclosure quality has
significantly increased under IFRS. Yet, quality changes on distinct parts of financial
statements or line items of financial statements are rarely considered. This study con-
tributes to this line of literature by addressing changes in provision disclosure after vol-
untary IFRS adoption.
The investigation is carried out for a distinct setting. We examine compliance with dis-
closure requirements and disclosure level related to other provisions of German publicly
listed firms that voluntarily adopted IFRS. The analysis is restricted to the transition
year (so called same firm-year approach) and a single item of the balance sheet: other
-95-
provisions. All our explanations regarding provisions under German GAAP refer to the
legal status before the German Accounting Law Modernization Act (Bilanzrechtsmod-
ernisierungsgesetz). However, concerning provisions, the German Accounting Law
Modernization Act particularly relates to recognition and measurement but not disclo-
sure requirements.
Our methodology is characterized by four underlyings. First, within our investigation,
we focus on voluntary IFRS adopters. The advantage of doing so is that accounting
rules and incentives point towards the same direction. On the one hand, adoption of
IFRS is supposed to increase accounting quality. On the other hand, IFRS adopting
firms are expected to gain advantages from the increased accounting quality. Hence, our
results should be particularly pronounced. In this respect, our setting can be interpreted
to represent an upper bound. If an increase in accounting quality can not be shown for
these firms, it seems unrealistic to expect such an increase for firms that adopt IFRS by
mandate.
The second underlying is that we focus on one balance sheet line item: other provisions.
Limiting the study to accounting for provisions is in a clear contrast to the holistic ap-
proach pursued in related studies. We consider other provisions to be a suitable object
of study because it is an item that features essential scope of discretion and uncertainty.
Hence, explicit and understandable disclosure is particularly important in order to de-
crease information asymmetries and to provide decision-useful information. Under
German GAAP, regulations concerning provisions are of a general nature and guidance
can be especially found in relevant literature and commentaries. In comparison, the
IFRS regulations are more explicit and also offer additional guidance of application in
practice. Hence, we can develop instruments that are able to capture variation between
-96-
German GAAP and IFRS disclosure related to provisions. Additionally, we believe that
focusing on a single balance sheet item is beneficial in at least four respects: (i) Our
approach extents existing literature since other studies primarily investigate imposed
changes in accounting after IFRS adoption by drawing on measures of earnings quality
(e.g. Van Tendeloo and Vanstraelen, 2005; Goncharov and Zimmermann, 2007; Barth,
Landsman and Lang, 2008). Although various studies investigate compliance with IFRS
requirements (Street and Bryant, 2000; Street and Gray, 2001; Glaum and Street, 2003),
not much attention has been paid to disclosure compliance around IFRS adoption (Cas-
cino and Gassen, 2010) and how adoption affects disclosure compared to local GAAP.
Daske and Gebhardt (2006) who investigate perceived disclosure quality induced by
IFRS adoption is an exemption to the studies that focus on properties of earnings as
evaluation metric. (ii) We do not rely on a single “fit it all” score where typically sub
scores are given for categories like content, readability and style, which are then aggre-
gated to an overall score. Rather, we develop two indices that are purposefully designed
to capture compliance and disclosure related to accounting for provision. As pointed out
by Daske and Gebhardt (2006), this is a time-consuming endeavor usually carried out
for comparably small samples. Consequently, generalization of results is restricted. Yet,
it allows us to have a clearer understanding where changes in compliance and disclosure
stem from. (iii) We are able to develop indices that we consider to be appropriate in
assessing the actual degree of compliance with disclosure requirements and level of
disclosure related to accounting for other provisions. German GAAP rules concerning
other provisions are meaningfully different from IFRS in the sample period. Since the
IAS 37 disclosure requirements are more demanding compared to German GAAP rules,
we are able to develop a compliance index and a disclosure index that we consider suit-
able to assess actual disclosed information. This allows us to by-pass the “tick-off men-

-97-
tality problem” (Daske et al., 2009) where firms claim to comply with a standard but do
not do so in every aspect of the standard. However, as the study reveals, this advantage
materialized only partly since index scores are not heterogeneous enough within ac-
counting regimes. We address this concern by drawing on a firm’s written words related
to provisions in the notes to have a more heterogeneous disclosure measure. (iv) We
focus on a single standard that was not prone to essential modifications during our sam-
ple period. Consequently, we avoid problems arising from changes that are continuously
made to the IFRS. This is in the spirit of Paananen and Lin (2009) who argue that IFRS
accounting quality suffered over time due to continuous changes of the standards.
The third underlying is that we deploy a same firm-year analysis. Prior studies exploited
the advantages of conducting same firm-year analyses on IFRS adoption (e.g. Hung and
Subramanyam, 2007; Clarkson et al., 2010; Verriest, Gaeremynck and Thornton, 2009).
The major advantage of this approach lies in the circumstance that firms need to restate
accounting data of their final local GAAP year in their first statement under IFRS (tran-
sition or adoption year) which allows a comparison of accounting data that refers to the
same year. Hence, data is not manipulated by time trends and other firm developments,
rather, changes originate from the treatment effect of adopting a new accounting set.
Finally, the fourth underlying is that we focus on a single country. While cross-country
studies and single country studies both exhibit different advantages and disadvantages
(Barth, Landsman and Lang, 2008), we consider our approach advantageous for our
purpose for several reasons. (i) Under German GAAP, other provisions do not only
comprise obligations towards third parties. Rather, German GAAP mandates or offers
accounting choices to recognize internal obligations in certain cases. This setting guar-
antees enough variability with regard to the adoption of IFRS rules in comparison to

-98-
German GAAP (between accounting regime comparison). (ii) We are interested in com-
pliance with disclosure requirements and the level of disclosure. Both can be driven by
cultural and institutional factors that are constant in our setting. (iii) Germany is consid-
ered to have an efficient judicial system with adequate enforcement of accounting rules.
(iv) The possibility to prepare an IFRS consolidated financial statement instead of a
German GAAP statement was comparably popular (Hung and Subramanyam, 2007).
This circumstance guarantees to obtain a sufficiently large sample.
For a sample of 63 publicly listed German firms, we hand-collected financial statement
data and disclosure items relating to other provisions. The study comprises three parts.
In the first part, we present descriptive results related to accounting for provisions. To
begin, we document quantitative adoption effects. Subsequently, we investigate effects
on disclosure. We document and compare compliance with disclosure requirements
imposed under German GAAP (final year prior to IFRS adoption) and under IFRS
(transition or adoption year). Then, we document and compare the level of disclosure
related to provisions under German GAAP and under IFRS. In doing so, we construct
two indices: a compliance index and a disclosure index. The compliance index is natu-
rally derived from requirements explicitly stated under German GAAP and IFRS. The
disclosure index puts its focus on presentation of mandatory and voluntary disclosure
items. In the second part, we investigate what drives compliance and disclosure on a
firm level. In doing so, we conduct univariate and multivariate analyses. In the third and
final part, we further substantiate our finding by a change analysis. Again, we conduct
univariate and multivariate analyses.
Our descriptive results reveal significant differences in accounting for provisions under
German GAAP and IFRS. Like prior studies, we show that provisions are significantly
-99-
lower under IFRS than under German GAAP. Next, we show that compliance with dis-
closure requirements is higher under German GAAP than under IFRS. However, this
result primarily reflects that German GAAP requirements are considerably less explicit
compared to IFRS. Non-compliance under German GAAP stems primarily from violat-
ing the classification requirements of provisions in the balance sheet. Univariate results
suggest that non-compliers with this requirement are significantly bigger and signifi-
cantly more closely held. Multivariate tests confirm the univariate results and also sug-
gest that compliance is higher when a firm’s provision ratio is higher. Compliance un-
der IFRS needs to be seen in a differentiated light. None of the sample firms comply
with all disclosure requirements of IAS 37 cumulatively. Firms comply with most of the
quantitative disclosure requirements of IAS 37.84. However, compliance with the quali-
tative disclosure requirements of IAS 37.85 presents itself in a completely different light
since compliance is considerably lower. Subsequently, we draw on disclosure related to
other provisions. Our results suggest that disclosure is significantly higher under IFRS
than under German GAAP. Higher disclosure stems for example from the circumstance
that firms provide more quantitative information in the notes under IFRS. Since disclo-
sure measured by the indices exhibits little variation, we draw on a firm’s written words
related to other provisions in the notes as a proxy for the level of disclosure. While size
and being audited by a BIG4 audit firm positively influence the number of written
words under German GAAP, these determinants are not significantly associated with
disclosure under IFRS. Our results show that a positive change in the number of written
words as a proxy for disclosure quality is significantly stronger for more closely held
firms. This is consistent with our multivariate results suggesting that disclosure is sig-
nificantly negatively associated with more closely held firms under German GAAP. We
do not find this association under IFRS anymore.

-100-
Our study can be considered to be of a “boutique” fashion as we shed light on exclusive
issues around accounting for provisions and consequences of IFRS adoption. In this
respect, we add to a well established literature stream around compliance with disclo-
sure requirements (e.g. Street, Gray and Bryant, 1999; Street and Bryant, 2000; Street
and Gray, 2001; Glaum and Street, 2003) and accounting quality after IFRS adoption
(e.g. Daske and Gebhardt, 2006; Gassen and Sellhorn, 2006; Barth, Landsman and
Lang, 2008). We add to existing literature as we do not focus on the earnings aspect of
accounting quality or overall measures of disclosure but on a single balance sheet item.
Our results indicate that firms adopting IFRS have higher accounting quality with re-
gard to their provision disclosure than under German GAAP. The improvement is most
pronounced for those firms where provisions are relatively more important and for firms
that typically have fewer benefits from the provision of accounting information for a
broad investor basis.
The remainder of the paper proceeds as follows. Section 2 gives background informa-
tion on the institutional setting in Germany and on accounting for provisions under
German GAAP and IFRS. Section 3 provides a literature review, hypotheses and a
model development. Section 4 describes the sample and the data. Section 5 presents the
analyses and the results. Section 6 gives the conclusion. Appendix A details the deriva-
tion of the accounting quality measures. Appendix B presents the sample firms and their
quality measure scores.
-101-
2 Background
2.1 Institutional setting
In Germany, the internationalization of accounting began in the early 1990’s (Soder-
strom and Sun, 2007). Several reasons can be identified for this process. First, German
accounting was considered not to be shareholder-oriented but to be prudent in order to
protect creditors (Leuz and Wüstemann, 2004). Also, an increased demand by interna-
tional investors created the necessity to provide internationally accepted accounting
information. Some companies attacked this issue by drawing on so called dual account-
ing. The idea behind dual accounting is to prepare a financial statement under local
GAAP and to align it with international standards (IAS/IFRS or US GAAP) by exploit-
ing rule-based options. Alternatively, companies prepared one statement under local
GAAP and an additional statement under international accounting standards. Second,
companies listed in the USA were required to reconcile their financial statements to US
GAAP. Third, national stock exchange requirements forced some companies to adhere
to internationally accepted accounting standards. This was e.g. the case for companies
listed in Neuer Markt.1
A regulatory reaction on the increased demand for international accounting information
was the German Capital Raising Facilitation Act (Kapitalaufnahmeerleichterungsgesetz
- KapAEG) of 1998. Accordingly, firms were allowed to prepare a consolidated finan-
cial statement under IAS/IFRS or US GAAP instead of a German GAAP statement. In
this respect, two time frames can be distinguished. The first frame denotes the time of
voluntary IFRS adoption and comprises firms that chose to adopt IFRS for fiscal years
1 Reconciliation to IFRS or US GAAP was allowed until the end of 2000. From January 1, 2001 on-
wards, statements had to be prepared according to IFRS or US GAAP (Zwirner, Ranker and Wohlge-muth, 2001).
-102-
starting before January 1, 2005. These firms are subject of the investigation at hand. The
second frame denotes the time of mandatory adoption and comprises firms that refused
to adopt IFRS until that time but are affected by the European Commission’s “IAS
Regulation”.
2.2 Accounting for provisions under German GAAP and IFRS
2.2.1 Basics
Provisions are a subset of liabilities. Within the scope of our investigation, we examine
the effects on so called other provisions. In line with German GAAP, we define other
provisions as provisions except those for taxes and pensions (Jödicke, 2009). Account-
ing for other provisions is strongly associated with assumptions and estimations. The
magnitude of these assumptions and estimations vary with the degree of uncertainty.
The degree of uncertainty is influenced by considerations as whether a firm has a pre-
sent obligation and if so, how to estimate the expenditure required to settle the obliga-
tion.
2.2.2 Recognition
The rules concerning the recognition of other provisions differ between German GAAP
and IFRS. In the course of the next paragraph, we give an overview of the different
types of other provisions under the respective accounting regime. For the sake of brev-
ity, we do not give a detailed description of the recognition criteria of other provisions.
The relevant paragraph dealing with the recognition of other provisions under German
GAAP is para. 249 HGB.2 It offers an exhaustive enumeration of types of other provi-
2 Our explanations are prior to changes caused by the German Accounting Law Modernization Act.

-103-
sions. These types can be classified into external obligations (towards third parties) and
internal obligations. Provisions concerning external obligations comprise provisions for
uncertain liabilities and provisions for onerous contracts. This classification also entails
provisions for restructuring costs. Provisions concerning internal obligations comprise
provisions for maintenance expenses deferred to the next financial year, provisions for
land restoration expenses deferred to the next financial year and provisions for other
expenses. Provisions for restructuring costs can also feature components of internal ob-
ligations.
IAS 37 is the core standard that deals with other provisions under IFRS. However, cir-
cumstances that fall into the scope of other standards might also lead to the recognition
of other provisions (IAS 37.5; Torklus, 2007). Under IFRS, recognition of provisions
for external obligations (provisions for uncertain liabilities, onerous contracts and re-
structuring costs) are mandatory. Table 1 summarizes the recognition of other provi-
sions under German GAAP and IFRS.
Table 1: Recognition of other provisions under German GAAP and IFRS
Type of other provisiona German
GAAP IFRS
External obligations
Provision for uncertain liabilities mandatory mandatory
Provision for onerous contracts mandatory mandatory
Provision for restructuring costsb mandatory mandatory
Internal obligations Provision for maintenance expenses deferred to the first three months of next financial year
mandatory forbidden
Provision for maintenance expenses deferred to a period after the first three months of next financial year
optional forbidden
Provision for land restoration expenses deferred to the next financial year mandatory forbidden
Provision for other expenses optional forbidden
Notes: a The different types of other provisions follow the terminology used in HGB para. 249 and IAS 37. b Provisions for restructuring costs can feature components of external and internal obligations.

-104-
2.2.3 Measurement
Para. 253 sect. 1 sent. 2 HGB (prior to the German Accounting Law Modernization Act)
deals with the measurement of other provisions under German GAAP. Other provisions
are recognized with the value that emerges after reasonable management judgment. Ba-
sically, single obligations are measured on basis of their most likely outcome plus a
prudent component. In the case of a continuous range of possible outcomes where each
point of that range is as likely as any other, the provision must be recognized with the
highest value (Rüdinger, 2004). Large populations of similar obligations (e.g. product
warranties) are measured using the expected value method plus a prudent component.
Only in cases where the underlying obligation features an interest component, the obli-
gation has to be discounted regardless from the effect of the time value of money. Ex-
pected increases in prices and costs are not allowed to be taken into account according
to a BFH (Federal Fiscal Court - Bundesfinanzhof) decision. However, it is not uncom-
mon among firms to take these increases into account if the increases can be reliably
anticipated (German Federal Ministry of Justice, 2008). If the expenditure is expected to
be reimbursed by a third party and the reimbursement has been legally incurred, the
reimbursement needs to be recognized as an asset. A reimbursement that does not fulfill
the criteria to be recognized as an asset might affect the book value of the provision if
the reimbursement is a virtually certain future claim.
Under IFRS, the core standard IAS 37 also deals with the measurement of provisions.
Provisions are measured at the best estimate. In this context, the best estimate is the
amount that a firm “would rationally pay to settle the obligation at the balance sheet
date or to transfer it to a third party” (IAS 37.37). The most likely outcome is regarded
to be the best estimate for single obligations. But also other possible outcomes are con-

-105-
sidered if they are mostly higher or mostly lower than the most likely outcome (Fried-
erich and Schmidt, 2008). Large populations of similar obligations are measured using
the expected value method (Rüdinger, 2004). In cases where the effect of the time value
of money is material, the provision needs to be discounted (Torklus, 2007). Expected
increases in prices and costs need to be considered, if there is sufficient evidence that
they will occur (Förschle, Kroner and Heddäus, 1999). If the expenditure is expected to
be reimbursed by a third party and the reimbursement is virtually certain, the reim-
bursement needs to be recognized as an asset (IAS 37.53).
Summing up, accounting for provisions is essentially different under German GAAP
and IFRS. This applies to recognition criteria as well as to measurement concepts. The
German GAAP principles related to provisions are considered to be strongly driven by
the prudence principle (Leuz and Wüstemann, 2004; Moxter, 1999). Leeways are exis-
tent in both accounting regimes. Overall, most overlap exists with regard to recognition
of obligations towards third parties. Differences are perceived not to be essential on this
matter. Differences in measurement are more pronounced. Notably, it is forbidden to
recognize internal obligations under IFRS (Förschle, Kroner and Heddäus, 1999; Kay-
ser, 2002).
2.2.4 Disclosure
Under German GAAP, para. 266 HGB deals with the balance sheet format. Accord-
ingly, a separate disclosure of other provisions, provisions for taxes and provisions for
pensions between equity (Eigenkapital) and certain liabilities (Verbindlichkeiten) is
required. A more detailed differentiation of each provision (and any other balance sheet
item) is possible but a separation into current and non-current (other) provisions is not
mandatory. Generally, German GAAP does not require to provide more detailed infor-
-106-
mation concerning other provisions in the balance sheet or in the notes. If the firm does
not separately disclose other provisions that are material in the balance sheet, para. 285
Nr. 12 HGB requires the firm to provide explanatory information in the notes. This in-
formation does not need to be quantitative. Also, information regarding the maturity of
other provisions is not mandatory.
Under IFRS, IAS 1 deals with the balance sheet format. Accordingly, the balance sheet
has to include a separate line item presenting provisions. This item does not include tax
provisions since these are included in the tax liabilities. While tax provisions are re-
quired to be included in the line item tax liabilities, provisions for pensions can be sub-
sumed under the line item provisions. If this is the case, the item other provisions can be
derived by disclosure provided in the notes relating to IAS 19 (Employee Benefits).
Generally, a more detailed differentiation of each provision (and any other balance sheet
item) is possible or might even be necessary in cases where it is relevant to an under-
standing of the firm’s financial position (IAS 1.55). In the notes, IAS 37 requires to pre-
sent detailed quantitative and qualitative information for each class of provision. Ac-
cording to IAS 37.84, the quantitative information comprise: (1) the carrying amount at
the beginning and end of the financial period, (2) additional provisions made in the fi-
nancial period including increases to existing provisions, (3) amounts used during the
financial period, (4) unused amounts reversed during the financial period, (5) increase
during the financial period in the discounted amount arising from the passage of time
and the effect of any change in the discount rate. A firm does not need to disclose in-
formation regarding the amount by which a provision was underfunded. According to
IAS 37.85, the qualitative information comprise: (1) a brief description of the nature and
the expected timing of any resulting outflows, (2) an indication of the uncertainties
about the amount or timing of those outflows, (3) the amount of any expected reim-

-107-
bursement plus information regarding an asset that has been recognized for that ex-
pected reimbursement.
IAS 37.11 distinguishes between provisions and accruals. Accruals are liabilities recog-
nized for received goods or services for which no consideration has been given, in-
voiced or formally agreed upon. Consequently, accruals need to be reported separately
from other provisions. German GAAP does not explicitly address accruals. Similar mat-
ters are often treated as other provisions (Förschle, Kroner and Heddäus, 1999).
3 Literature review, hypotheses and model development
3.1 Literature review
The introduction and application of IFRS was subject of manifold research, partially
producing conflicting results. Likewise, documented benefits associated with IFRS are
equivocal. However, studies investigate different angles of IFRS adoption in different
institutional settings. Given the purpose of our study, our literature review concentrates
on studies investigating the effect of IFRS adoption on accounting quality focusing on
Germany or using a cross-country approach, and on compliance with IFRS disclosure
requirements, respectively. To the best of our knowledge, (other) provisions are rarely
the main focus of empirical work. Torklus (2007) empirically investigates the conse-
quences of IFRS adoption on provisions including pensions but puts his focus on quan-
titative effects. Cascino and Gassen (2010) address whether mandatory IFRS adoption
affects comparability of financial accounting information across countries on selected
balance sheet line items. Particularly, they find an increase in comparability of provi-
sions excluding pensions.

-108-
In a cross-country study, Barth, Landsman and Lang (2008) find evidence that applica-
tion of IFRS is associated with higher accounting quality measured by earnings man-
agement, timely loss recognition and value relevance of accounting amounts. Van
Tendeloo and Vanstraelen (2005) and Goncharov and Zimmermann (2007) investigate
the relationship between voluntary IFRS adopters and earnings management. They find
little evidence that earnings management behavior is different between firms reporting
under IFRS or German GAAP. Using a matched sample, results of Gassen and Sellhorn
(2006) indicate that earnings quality of IFRS adopters is higher than of firms reporting
under German GAAP. Overall, studies find rather an improving effect on accounting
quality. Research also implies that effects depend on rigor of IFRS adoption. Results of
Christensen, Lee and Walker (2008) suggest quality effects differ for voluntary IFRS
adopters and firms that adopted IFRS after it became mandatory in 2005 (IFRS resist-
ers). Accordingly, accounting quality measured by earnings management and timely
loss recognition increases with voluntary IFRS adoption. The authors find no improve-
ments for IFRS resisters. Results of Paananen and Lin (2009) substantiate the last study
showing evidence that accounting quality worsened over time. They attribute this de-
velopment to changes in the standards.
Daske and Gebhardt (2006) investigate disclosure quality of Austrian, German and
Swiss firms that voluntarily adopted IFRS. Using quality scores from so called “beauty
contests” that rank the quality of financial reports, their findings suggest that the disclo-
sure quality of the reports increased in all three countries. Verriest, Gaeremynck and
Thornton (2009) investigate which factors are associated with the IFRS adoption quality
of European firms. Their results suggest that adoption quality is driven by a firm’s cor-
porate governance. Results of Bartov, Goldberg and Kim (2005) suggest that IFRS
based earnings are more value relevant than earnings produced under German GAAP.

-109-
Hung and Subramanyam (2007) find that book value restatements are value relevant but
find no similar result for income restatements.
Various studies investigate compliance with disclosure requirements of IFRS. Street,
Gray and Bryant (1999), Street and Bryant (2000), Street and Gray (2001) and Glaum
and Street (2003) document significant non-compliance with IFRS requirements and
that compliance varies across different standards. The results also suggest that the level
of compliance varies with firm characteristics. The importance of compliance with IFRS
disclosure requirements is demonstrated by Hodgdon et al. (2008). Their results indicate
that compliance enhances financial analysts’ ability to provide more accurate forecasts.
3.2 Hypotheses and model development
The focus of our study lies on compliance with disclosure requirements and on disclo-
sure level after IFRS adoption. Therefore, our study intersects with a strand of literature
that deals with IFRS adoption and accounting quality. Accounting quality is an impor-
tant concept. One essential purpose of accounting information is to facilitate transac-
tions between insiders and outsiders of a firm. Theory as well as empirical evidence
support the view that recipients appreciate high quality accounting information (e.g.
Watts and Zimmerman, 1986; Francis et al., 2004). However, an accepted definition of
accounting quality does not prevail in literature. This is certainly attributable to the cir-
cumstance that accounting quality is not easily measurable, and ultimately, users of ac-
counting data need to agree on the quality of provided accounting information (Jonas
and Blanchet, 2000).
Generally stated, accounting quality refers to the circumstance that provided accounting
information might exhibit noise in form of bias or measurement error, or both (Imhoff,

-110-
1992). Noise can stem from uncertainty in accounting data as well as from managing
accounting data. In so far, studies dealing with accounting quality try to operationalize
measures that are suitable to pick up quality along these dimensions. Typically, studies
draw on earnings quality since earnings are believed to be of particular interest for re-
cipients of accounting information (Schipper and Vincent, 2003). Common attributes of
interest are for example persistence, predictability or variability. As a non-earnings
measure, Hribar, Kravet and Wilson (2010) propose to measure accounting quality by
unexplained audit fees. These examples illustrate that accounting quality is an elusive
concept (Chen et. al., 2010) that comprises several components. Our perspective on ac-
counting quality follows Cascino et al. (2010): “The quality of accounting information
refers to: i) the informativeness of reported numbers, ii) the level of disclosure, and iii)
the degree of compliance with generally accepted accounting standards.” Within this
investigation, we focus on ii) the level of disclosure and iii) the degree of compliance
with accounting standards related to accounting for provisions around IFRS adoption. In
this context, we are interested in accounting quality particularly with regard to disclosed
information. We extend the literature by two means. On the one hand, we assess
whether compliance with disclosure requirements and the level of disclosure are differ-
ent under German GAAP and IFRS. On the other hand, we investigate which firm char-
acteristics drive these accounting quality measures.
We propose the application of two indices in order to assess whether compliance with
disclosure requirements and disclosure level are different under German GAAP and
IFRS. In our endeavor, we face the following challenge: “Financial disclosure is an ab-
stract concept that cannot be measured directly” (Cooke and Wallace, 1989). Indices
allow to measure disclosure by drawing on various items and assessing the existence of
these items. Deflation by the number of items results in a value between zero and one.

-111-
The application of indices in order to measure disclosure is widespread (e.g. Singhvi
and Desai, 1971; Robbins and Austin, 1986), but not unanimous. This roots in the cir-
cumstance that more disclosure does not necessarily result in high quality disclosure
(Marston and Shrives, 1991). In this respect, we follow the view that the extent of dis-
closure and quality in disclosed information are positively associated (Botosan, 1997).
Our measures are the following:
Compliance index
We construct an index that captures to which extend a firm complies with mandatory
disclosure requirements related to accounting for provisions in the process of preparing
a consolidated financial statement. The measure is constructed under German GAAP
and IFRS.
German GAAP requests compliance with two requirements. First, the classification of
provisions needs to follow the requirements provided in para. 266 HGB. Second, addi-
tional information concerning other provisions have to be provided in the notes. Re-
quirements are more extensive under IFRS. Accordingly, the preparer is required that
(1) the classification of provisions follows IAS 1, (2) criteria of IAS 37.84 and (3) of
IAS 37.85 are fulfilled. IAS 37.84 demands disclosure of quantitative pieces of informa-
tion, and IAS 37.85 demands disclosure of qualitative pieces of information. The crite-
ria need to be fulfilled cumulatively. A detailed derivation of the index is provided in
Appendix A.
Disclosure index
We construct an index that captures a firm’s disclosure level related to accounting for
provisions in its financial statement. Unlike the first measure, this index does not exclu-
-112-
sively draw on mandatory pieces of information. Rather, the index captures whether a
firm discloses quantitative and qualitative pieces of information with regard to provi-
sions. The index is constructed under German GAAP and IFRS. In order to ensure
comparability between German GAAP and IFRS, both measures comprise five items
and each item has a roughly comparable counterpart under German GAAP and IFRS.
The first three items refer to classification of provisions in the balance sheet. We assess
whether (1) the balance sheet is separated into current and non-current other provisions,
(2) a firm follows the balance sheet classification requirements and (3) whether a firm
exceeds these requirements. The other two items refer to disclosure in the notes: (4) one
item captures whether qualitative information are provided, and (5) one item captures
whether quantitative information are provided. The last two items are particularly less
restrictive than the cumulative requirements under IAS 37.84 and IAS 37.85 for the
compliance index. A detailed derivation of the index is provided in Appendix A.
Number of words in the notes
In addition to the compliance and disclosure indices we draw on a firm’s written words
related to other provisions in the notes in order to measure the disclosure level. This
allows us to capture accompanying information related to other provisions. We count
the number of words that are written in an individual section to other provisions within
the notes.
Appendix B presents the sample firms and their individual accounting quality measure
scores.

-113-
Hypotheses
Within our investigation, we assess whether the compliance index and disclosure index
are higher under IFRS than under German GAAP. We make no prediction with regard
to compliance for two reasons. First, compliance requirements are different among both
accounting regimes. Second, prior literature shows that compliance with IFRS disclo-
sure requirements are driven by firm characteristics (Street and Gray, 2001). We are
interested in the impact of a change in the accounting regime on disclosure for provi-
sions and keep firm characteristics comparatively stable due to the same-firm year ap-
proach. Consequently, making a priori predictions on disclosure compliance resulting
from a switch of the accounting regime faces conflicting explanations. We have no rea-
son to believe that a firm committed to high compliance might change this commitment
with voluntary IFRS adoption. An assessment is more difficult for firms exhibiting low
compliance under German GAAP. Depending on the reasons that cause low compli-
ance, low compliance might prevail under IFRS because compliance mechanisms are
not well pronounced. However, firms voluntarily adopting IFRS might take the switch
as a fresh start to improve their accounting quality and be more inclined to comply with
the new regulations right away. Also, compliance might be lower under IFRS initially
because firms are adopting a new accounting regime and need to adjust to the new com-
pliance rules first.
We expect an increase in the disclosure level under IFRS. It is the proclaimed goal to
provide decision-useful information with the IFRS. Consequently, provided information
shall be of high quality, understandable, transparent and comparable. According to exis-
tent literature, German GAAP is only limitedly suitable in fulfilling these claims. The
expected increase should be especially apparent in our setting since we investigate vol-
untary IFRS adopters.
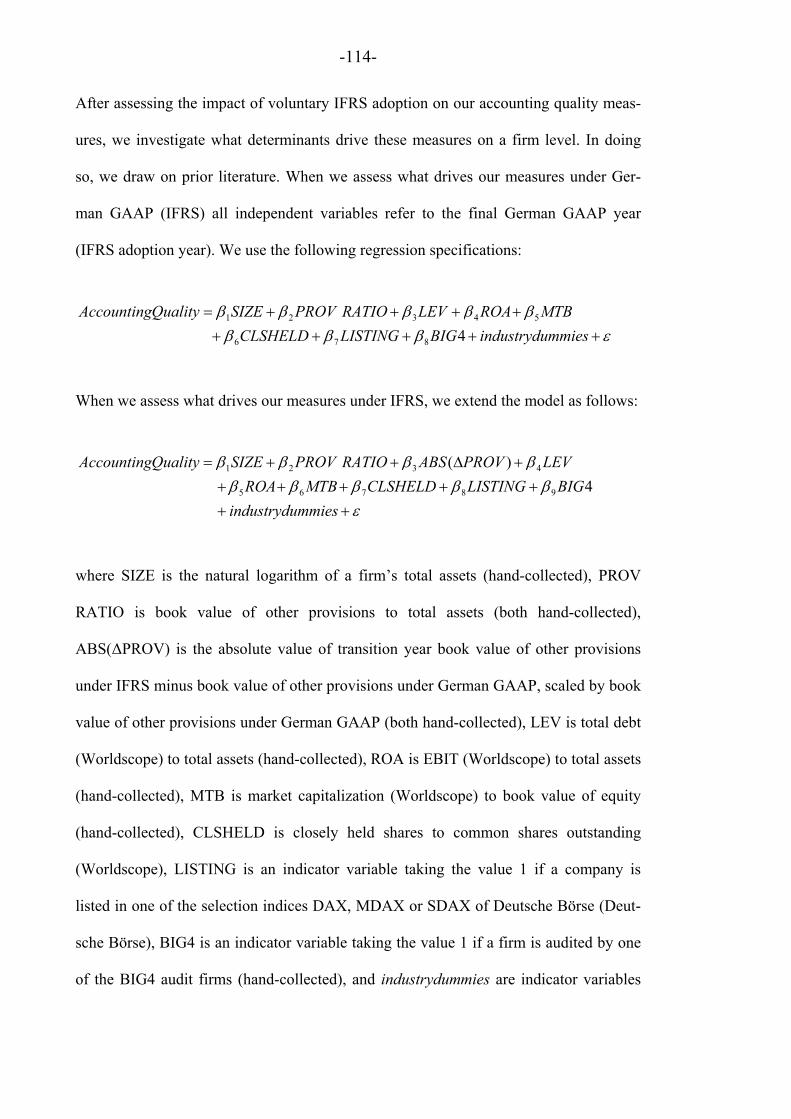
-114-
After assessing the impact of voluntary IFRS adoption on our accounting quality meas-
ures, we investigate what determinants drive these measures on a firm level. In doing
so, we draw on prior literature. When we assess what drives our measures under Ger-
man GAAP (IFRS) all independent variables refer to the final German GAAP year
(IFRS adoption year). We use the following regression specifications:
mmiesindustryduBIGLISTINGCLSHELD
MTBROALEVRATIOPROVSIZEQualityAccounting
4876
54321
When we assess what drives our measures under IFRS, we extend the model as follows:
mmiesindustrydu
BIGLISTINGCLSHELDMTBROA
LEVPROVABSRATIOPROVSIZEQualityAccounting
4
)(
98765
4321
where SIZE is the natural logarithm of a firm’s total assets (hand-collected), PROV
RATIO is book value of other provisions to total assets (both hand-collected),
ABS(ΔPROV) is the absolute value of transition year book value of other provisions
under IFRS minus book value of other provisions under German GAAP, scaled by book
value of other provisions under German GAAP (both hand-collected), LEV is total debt
(Worldscope) to total assets (hand-collected), ROA is EBIT (Worldscope) to total assets
(hand-collected), MTB is market capitalization (Worldscope) to book value of equity
(hand-collected), CLSHELD is closely held shares to common shares outstanding
(Worldscope), LISTING is an indicator variable taking the value 1 if a company is
listed in one of the selection indices DAX, MDAX or SDAX of Deutsche Börse (Deut-
sche Börse), BIG4 is an indicator variable taking the value 1 if a firm is audited by one
of the BIG4 audit firms (hand-collected), and industrydummies are indicator variables

-115-
that base on the first-digit SIC code (Worldscope). AccountingQuality is one of our
three accounting quality measures as described above. See also Appendix A and Ap-
pendix B for the accounting quality measures.
Subsequently, we discuss the control variables used in our model.
Size
We include a control for a firm’s size (TOTASS) in our model. The benefits of high
quality disclosure are expected to be higher for bigger firms. Several reasons are conjec-
tured for this relationship. Bigger firms are supposed to incur relatively less costs from
producing more information (e.g. Raffournier, 1995) and suffer less consequences from
disclosing sensitive information to competitors (Meek, Roberts and Gray, 1995). Con-
sequently, we expect a positive sign on our measures.
Provision ratio
We include a firm’s provision ratio (PROV RATIO) in our model. Provisions represent
a potential outflow of economic resources which is an important piece of information in
assessing a firm’s economic situation. Supposedly, the role of provisions for a firm is
more pronounced when provisions take a relatively higher proportion in a firm’s size.
Hence, interested recipients of accounting information will put more attention on this
line item when the relative importance for the economic situation is higher which in
turn should positively influence disclosed information. Consequently, we expect a posi-
tive relationship between our measures and the provision ratio.
Impact of IFRS adoption (change in provisions)
We control for the impact associated with IFRS adoption on provisions (akin Verriest,
Gaeremynck and Thornton, 2009). In doing so, we include the unsigned impact of IFRS
-116-
adoption on provisions (ABS(ΔPROV)). The association with disclosed information
seems not unanimous. On the one hand, when impact on provisions is high, this might
imply that changes are more complex and providing high quality disclosure might be
more demanding. Thus, a negative association with disclosure might result. On the other
hand, a higher impact implies a higher necessity to disclose information on the changes.
Also, it might indicate a stronger rigor to apply IFRS, which might be associated with a
higher quality in disclosed information. Hence, we make no predictions on the expected
sign.
Leverage
We include leverage (LEV) in our model. The interpretation of leverage on disclosure
quality is not unambiguous. A high debt concentration can imply information needs of
banks which in turn could cause a positive relationship between leverage and disclosure
quality (Chow and Wong-Boren, 1987). On the other hand, banks are perceived as in-
siders to a firm with adequate information channels other than the annual statement
which in turn might even cause a negative relationship with disclosure quality (Cuijpers
and Buijink, 2005). Due to the ambivalent nature of leverage, we make no prediction on
the association with disclosed information.
Profitability
We include a control for profitability (ROA) in our model. When profitability is low,
management might prefer to disclose less information with the goal to suppress bad
news or possible bad developments. On the other hand, when profitability is high, man-
agement might want to provide more disclosure in order to reflect possible good devel-
opments. Yet, there might also be strategic motives to limit disclosure. Disclosed infor-
mation might be very valuable for competitors, giving management reasons for partial

-117-
disclosure (Wagenhofer, 1990). Prior empirical results on the relationship between prof-
itability and disclosure are mixed (Singhvi and Desai, 1971; Meek, Roberts and Gray,
1995; Dumontier and Raffournier, 1998). Due to the ambivalent relationship between
profitability and disclosure, we do not make a prediction on our measures.
Market-to-book ratio
We include a firm’s market-to-book ratio measured as a firm’s market capitalization
over a firm’s book value of equity. This proxy is supposed to capture a firm’s growth
opportunities. Glaum and Street (2003) suggest that growth opportunity and compliance
with disclosure requirements is not determinate. The associated higher future funding
requirements can create an incentive to provide “complete, reliable and timely informa-
tion” (Glaum and Street, 2003). However, challenges imposed by growth might dis-
courage compliance with disclosure requirements. While we deem it important to con-
trol for growth opportunities, it should be kept in mind that the proxy was prone to
strong variation in the market prices for the sample firms due to the stock market down-
turn of 2002. The circumstance that 18 of our sample firms have a market-to-book ratio
smaller than 1 should be seen against this background. 14 of these firms had their IFRS
adoption in 2002.
Ownership structure
Since the ownership structure of a firm influences monitoring activities, it is also impor-
tant for disclosure quality. Where ownership is more condense, it is easier to maintain a
closer relationship with a firm’s manager and to obtain information by other means than
the annual report. On the other hand, firms featuring a more dispersed ownership are
expected to have a higher need to provide their investors with high quality financial
-118-
reporting (Cuijpers and Buijink, 2005). Consequently, we expect a negative sign on our
measures when firms are more closely held (CLSHELD).
Listing status
Capital market pressures have been found to be associated with disclosure (e.g. Cooke,
1989; Dumontier and Raffournier, 1998; Street and Bryant, 2000). We control whether
a firm is listed in one of the selection indices of Deutsche Börse (LISTING). Being
listed in one of these selection indices is associated with requirements to size and mar-
ket capitalization as well as higher disclosure requirements. Also, members of the selec-
tion indices compete for investors, which induces a need to produce high quality ac-
counting disclosure. We expect a positive sign on our measures.
Auditor
Auditors are an important corporate governance instrument in Germany (Ashbaugh and
Warfield, 2003). We include the indicator variable BIG4 that is one if a firm is audited
by Arthur Andersen (only for the years 2000 and 2001), Ernst & Young, KPMG, PWC
or Deloitte & Touche. Several reasons speak for a positive relationship between being
audited by a BIG4 audit firm and disclosure. Larger auditing firms are believed to have
the possibility to access a broader range of knowledge and have superior training con-
cerning international accounting standards. Also, large audit firms are believed to con-
vince their clients to comply with accounting and disclosure requirements in order to
demonstrate their independence (Street and Gray, 2001). We expect a positive sign on
our measures.
-119-
Industry
Membership to a certain industry might affect disclosure for several reasons. First, cer-
tain pieces of information can be more important in one industry than in another. Sec-
ond, firms in some industries might prefer not to share sensitive information with their
competitors. Meek, Roberts and Gray (1995) find that firms belonging to the oil, chemi-
cal and mining industry provide more non-financial information than other industries.
Disclosure concerning provisions might differ across industries in so far that certain
industries need to recognize provisions that are not prevalent in other industries (e.g.
provisions related to environmental restoration). In order to control for industry effects,
we include industry dummies.
4 Sample and data
4.1 Sample selection
Our sample consists of 63 German listed companies that voluntarily adopted IFRS for
the first time. We consider adoption years 2000 until 2004. We start in 2000 because
this was the first full fiscal year in which IAS 37 had to be applied. The final year is
determined by the IAS Regulation that mandates IFRS adoption for fiscal years starting
in 2005. We define the adoption year as the year when IFRS “are applied in full for the
first time as the primary accounting basis” (SIC-8.3). This is contrary to IFRS 1 that
defines the date of transition to IFRS as the “beginning of the earliest period for which
an entity presents full comparative information under IFRSs in its first IFRS financial
statements” (IFRS 1 Appendix 1; emphasis not added).
We identify voluntary IFRS adopters that have their adoption year between 2000 and
2004 using the Worldscope database and the item “accounting standards followed”

-120-
(WS 07536). In order to enhance the identification of voluntary IFRS adopters, we rely
on updated data used in Gassen and Sellhorn (2006). We start with all observations in
the Worldscope Universe between 1999 and 2004. We make the following modifica-
tions to derive our final sample: First, we delete all observations where the Worldscope
item “accounting standards followed” is missing. Second, we delete observations where
the Worldscope item “accounting standards followed” is unavailable for the lagged
year. Third, we delete firms that did not change their accounting regime from German
GAAP to IFRS. Fourth, we delete all financial firms as indicated by their SIC code
since these firms underlie specific accounting requirements (Dumontier and Raf-
fournier, 1998). Finally, we delete all firms, where we could not obtain consolidated
financial statements for the final German GAAP year and the adoption year. This yields
a final sample of 63 firms for which we have the IFRS financial statement of the adop-
tion year including comparative IFRS accounting numbers for the final German GAAP
year and the last financial statement under German GAAP. Table 2 summarizes the
sample selection.
Table 2: Sample selection (in number of distinct firms)
ActionNumber of
firms
Worldscope Universe 1999-2004 1418
minus: firms where the Worldscope item “accounting standards followed” (WS 07536) is missing
-233 1185
minus: firms where the Worldscope item “accounting standards followed” (WS 07536) is unavailable for the previous year
-100 1085
minus: firm that did not change accounting standards from German GAAP to IFRS
-957 128
minus: financial firms -26 102
minus: financial statements were unavailable -39 63
Final Sample 63
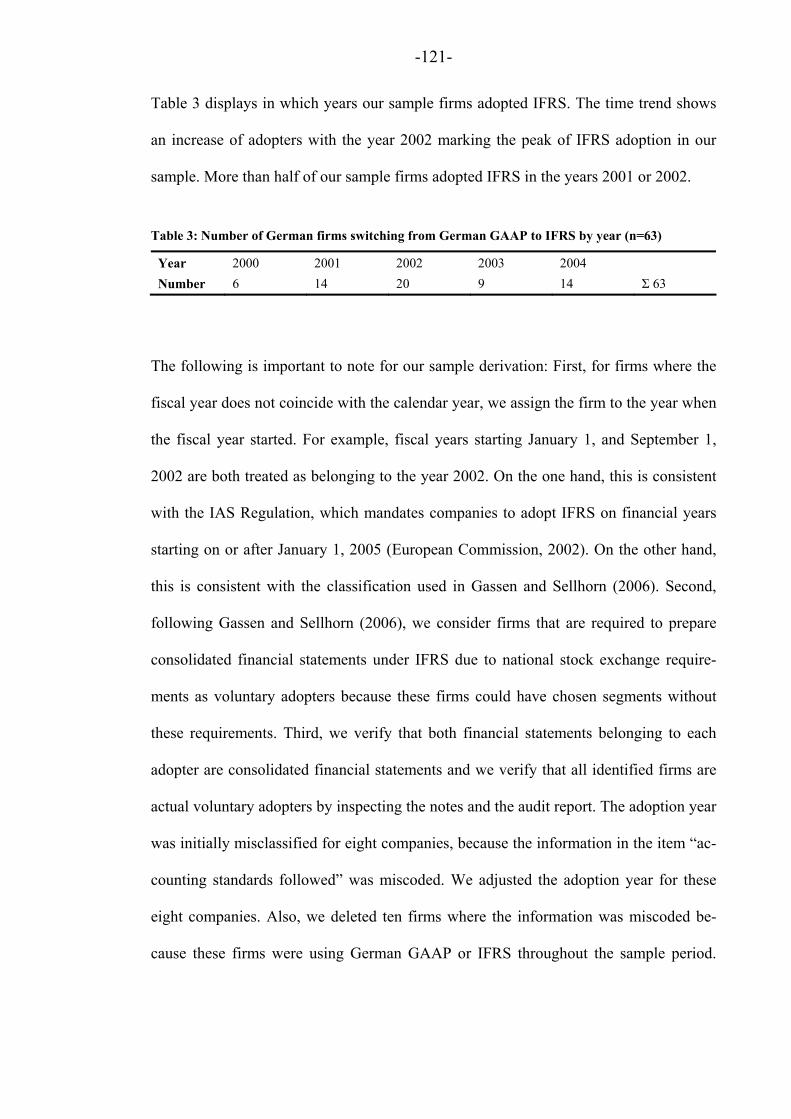
-121-
Table 3 displays in which years our sample firms adopted IFRS. The time trend shows
an increase of adopters with the year 2002 marking the peak of IFRS adoption in our
sample. More than half of our sample firms adopted IFRS in the years 2001 or 2002.
Table 3: Number of German firms switching from German GAAP to IFRS by year (n=63)
Year 2000 2001 2002 2003 2004
Number 6 14 20 9 14 Σ 63
The following is important to note for our sample derivation: First, for firms where the
fiscal year does not coincide with the calendar year, we assign the firm to the year when
the fiscal year started. For example, fiscal years starting January 1, and September 1,
2002 are both treated as belonging to the year 2002. On the one hand, this is consistent
with the IAS Regulation, which mandates companies to adopt IFRS on financial years
starting on or after January 1, 2005 (European Commission, 2002). On the other hand,
this is consistent with the classification used in Gassen and Sellhorn (2006). Second,
following Gassen and Sellhorn (2006), we consider firms that are required to prepare
consolidated financial statements under IFRS due to national stock exchange require-
ments as voluntary adopters because these firms could have chosen segments without
these requirements. Third, we verify that both financial statements belonging to each
adopter are consolidated financial statements and we verify that all identified firms are
actual voluntary adopters by inspecting the notes and the audit report. The adoption year
was initially misclassified for eight companies, because the information in the item “ac-
counting standards followed” was miscoded. We adjusted the adoption year for these
eight companies. Also, we deleted ten firms where the information was miscoded be-
cause these firms were using German GAAP or IFRS throughout the sample period.

-122-
Fourth, we need to acknowledge that we are possibly unable to identify voluntary IFRS
adopters due to other potential existing miscodings.
4.2 Data
Our sample of voluntary IFRS adopters is comparably small. While this is a downside
with respect to the power of statistical tests, it enables us to evasively hand-collect data
from the financial statements. For each firm, we hand-collected the following financial
data from the statements: (1) total assets, (2) equity (including non-controlling inter-
ests), and (3) other provisions. Next, we evasively collected data in order to construct
our accounting quality measures. The collected pieces of information relate to provided
disclosure around other provisions. We also collected information on a firm’s auditor.
In order to complement our analyses, we also draw on information provided by World-
scope.
5 Empirical analyses
5.1 Quantitative effects of IFRS adoption on provisions
Table 4 displays descriptive statistics for the sample firms. Panel A shows firm descrip-
tives for the final German GAAP year and Panel B for the IFRS adoption year. All ac-
counting variables, which are not truncated by definition are winsorized by their 5% and
95% interval to account for outliers. Table 5 shows correlations between the dependent
and independent variables for the final German GAAP year and Table 6 for the IFRS
adoption year.
Our focus on publicly listed firms, coverage on Worldscope and the sample selection
process causes a bias towards bigger and more mature firms. The descriptive statistics

-123-
illustrate that firm characteristics are kept comparable stable due to the same firm-year
approach from Panel A to Panel B. Notably, correlations show a negative correlation
between the quality measures and size except for the number of words in the notes un-
der German GAAP as well as under IFRS. Also, all quality measures are negatively
correlated with a more condensed ownership structure under German GAAP. This rela-
tionship is not that distinct under IFRS. Likewise noteworthy is the circumstance that
compliance under IFRS is positively and significantly correlated with being audited by
a large audit firm while it is not significant under German GAAP.
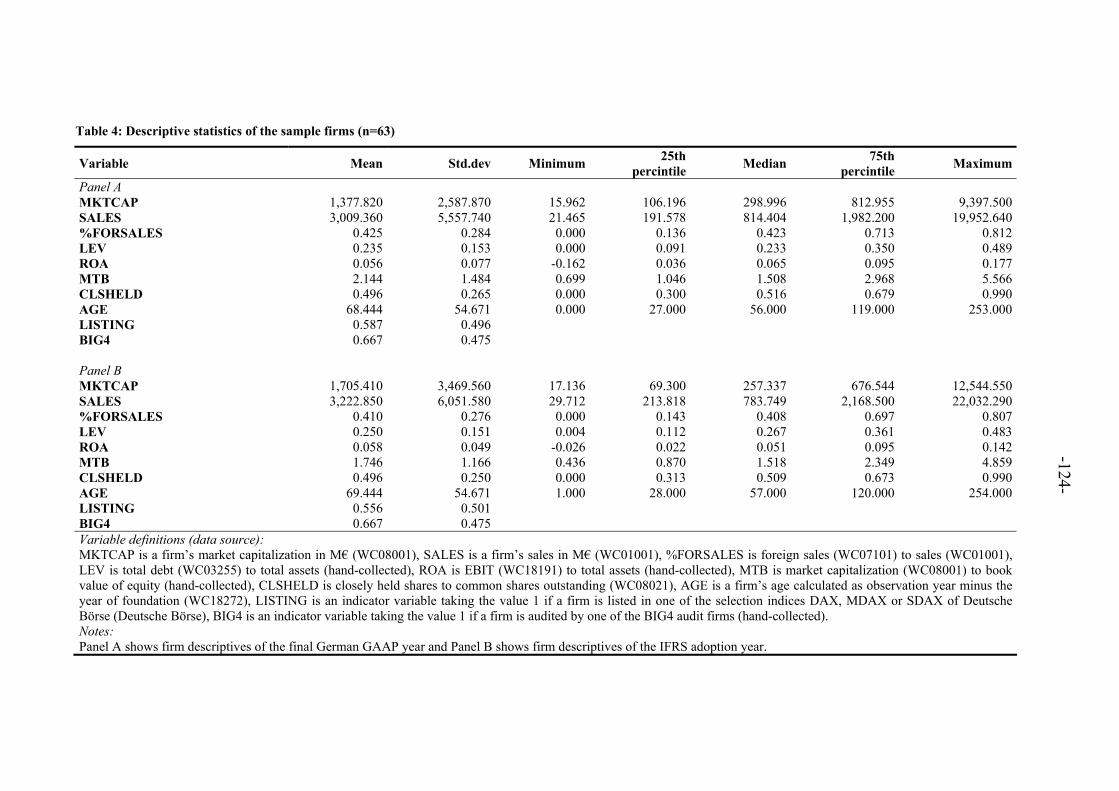
-124-
Table 4: Descriptive statistics of the sample firms (n=63)
Variable Mean Std.dev Minimum25th
percintileMedian
75thpercintile
Maximum
Panel A MKTCAP 1,377.820 2,587.870 15.962 106.196 298.996 812.955 9,397.500 SALES 3,009.360 5,557.740 21.465 191.578 814.404 1,982.200 19,952.640 %FORSALES 0.425 0.284 0.000 0.136 0.423 0.713 0.812 LEV 0.235 0.153 0.000 0.091 0.233 0.350 0.489 ROA 0.056 0.077 -0.162 0.036 0.065 0.095 0.177 MTB 2.144 1.484 0.699 1.046 1.508 2.968 5.566 CLSHELD 0.496 0.265 0.000 0.300 0.516 0.679 0.990 AGE 68.444 54.671 0.000 27.000 56.000 119.000 253.000 LISTING 0.587 0.496 BIG4 0.667 0.475 Panel B
MKTCAP 1,705.410 3,469.560 17.136 69.300 257.337 676.544 12,544.550 SALES 3,222.850 6,051.580 29.712 213.818 783.749 2,168.500 22,032.290 %FORSALES 0.410 0.276 0.000 0.143 0.408 0.697 0.807 LEV 0.250 0.151 0.004 0.112 0.267 0.361 0.483 ROA 0.058 0.049 -0.026 0.022 0.051 0.095 0.142 MTB 1.746 1.166 0.436 0.870 1.518 2.349 4.859 CLSHELD 0.496 0.250 0.000 0.313 0.509 0.673 0.990 AGE 69.444 54.671 1.000 28.000 57.000 120.000 254.000 LISTING 0.556 0.501 BIG4 0.667 0.475 Variable definitions (data source): MKTCAP is a firm’s market capitalization in M€ (WC08001), SALES is a firm’s sales in M€ (WC01001), %FORSALES is foreign sales (WC07101) to sales (WC01001), LEV is total debt (WC03255) to total assets (hand-collected), ROA is EBIT (WC18191) to total assets (hand-collected), MTB is market capitalization (WC08001) to book value of equity (hand-collected), CLSHELD is closely held shares to common shares outstanding (WC08021), AGE is a firm’s age calculated as observation year minus the year of foundation (WC18272), LISTING is an indicator variable taking the value 1 if a firm is listed in one of the selection indices DAX, MDAX or SDAX of Deutsche Börse (Deutsche Börse), BIG4 is an indicator variable taking the value 1 if a firm is audited by one of the BIG4 audit firms (hand-collected). Notes: Panel A shows firm descriptives of the final German GAAP year and Panel B shows firm descriptives of the IFRS adoption year.
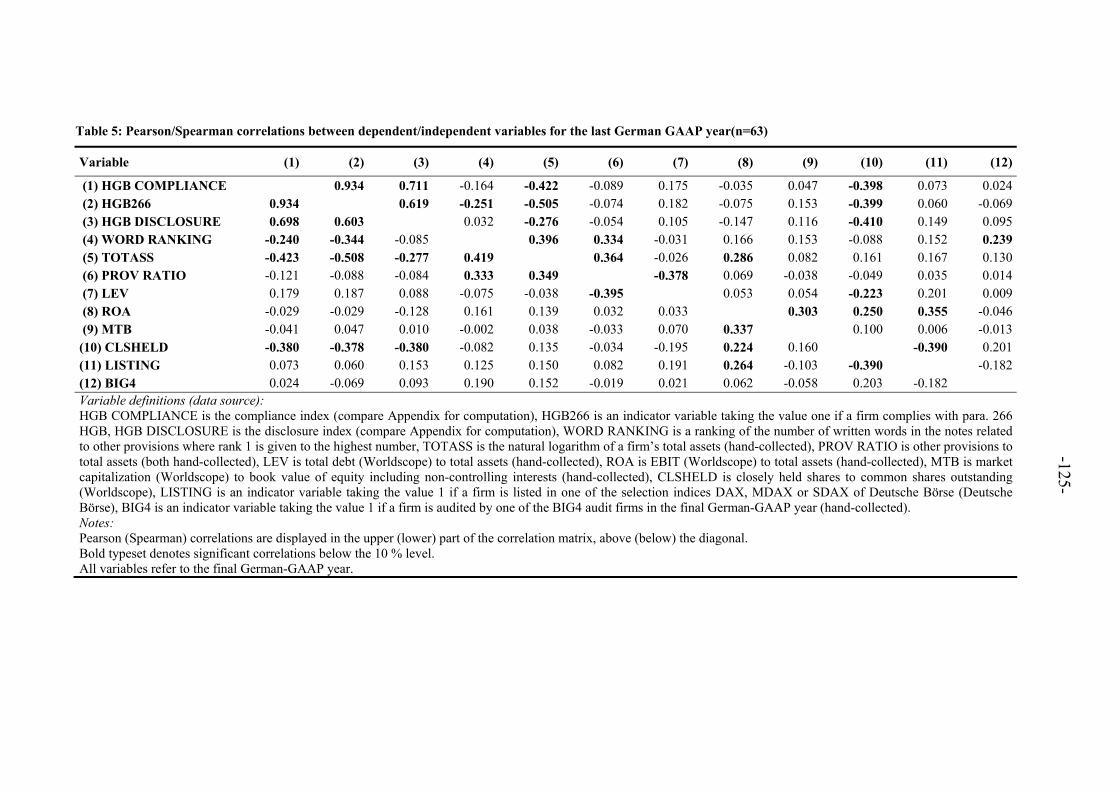
-125-
Table 5: Pearson/Spearman correlations between dependent/independent variables for the last German GAAP year(n=63)
Variable (1) (2) (3) (4) (5) (6) (7) (8) (9) (10) (11) (12)
(1) HGB COMPLIANCE 0.934 0.711 -0.164 -0.422 -0.089 0.175 -0.035 0.047 -0.398 0.073 0.024 (2) HGB266 0.934 0.619 -0.251 -0.505 -0.074 0.182 -0.075 0.153 -0.399 0.060 -0.069 (3) HGB DISCLOSURE 0.698 0.603 0.032 -0.276 -0.054 0.105 -0.147 0.116 -0.410 0.149 0.095 (4) WORD RANKING -0.240 -0.344 -0.085 0.396 0.334 -0.031 0.166 0.153 -0.088 0.152 0.239 (5) TOTASS -0.423 -0.508 -0.277 0.419 0.364 -0.026 0.286 0.082 0.161 0.167 0.130 (6) PROV RATIO -0.121 -0.088 -0.084 0.333 0.349 -0.378 0.069 -0.038 -0.049 0.035 0.014 (7) LEV 0.179 0.187 0.088 -0.075 -0.038 -0.395 0.053 0.054 -0.223 0.201 0.009 (8) ROA -0.029 -0.029 -0.128 0.161 0.139 0.032 0.033 0.303 0.250 0.355 -0.046 (9) MTB -0.041 0.047 0.010 -0.002 0.038 -0.033 0.070 0.337 0.100 0.006 -0.013 (10) CLSHELD -0.380 -0.378 -0.380 -0.082 0.135 -0.034 -0.195 0.224 0.160 -0.390 0.201 (11) LISTING 0.073 0.060 0.153 0.125 0.150 0.082 0.191 0.264 -0.103 -0.390 -0.182 (12) BIG4 0.024 -0.069 0.093 0.190 0.152 -0.019 0.021 0.062 -0.058 0.203 -0.182 Variable definitions (data source): HGB COMPLIANCE is the compliance index (compare Appendix for computation), HGB266 is an indicator variable taking the value one if a firm complies with para. 266 HGB, HGB DISCLOSURE is the disclosure index (compare Appendix for computation), WORD RANKING is a ranking of the number of written words in the notes related to other provisions where rank 1 is given to the highest number, TOTASS is the natural logarithm of a firm’s total assets (hand-collected), PROV RATIO is other provisions to total assets (both hand-collected), LEV is total debt (Worldscope) to total assets (hand-collected), ROA is EBIT (Worldscope) to total assets (hand-collected), MTB is market capitalization (Worldscope) to book value of equity including non-controlling interests (hand-collected), CLSHELD is closely held shares to common shares outstanding (Worldscope), LISTING is an indicator variable taking the value 1 if a firm is listed in one of the selection indices DAX, MDAX or SDAX of Deutsche Börse (Deutsche Börse), BIG4 is an indicator variable taking the value 1 if a firm is audited by one of the BIG4 audit firms in the final German-GAAP year (hand-collected). Notes: Pearson (Spearman) correlations are displayed in the upper (lower) part of the correlation matrix, above (below) the diagonal. Bold typeset denotes significant correlations below the 10 % level. All variables refer to the final German-GAAP year.

-126-
Table 6: Pearson/Spearman correlations between dependent/independent variables for the IFRS adoption year(n=63)
Variable (1) (2) (3) (4) (5) (6) (7) (8) (9) (10) (11) (12) (13) (14)
(1) IFRS COMPLIANCE 0.761 0.646 -0.017 0.118 -0.005 0.067 0.019 -0.004 -0.074 0.142 0.033 -0.300 0.385
(2) IAS1 0.756 0.847 -0.214 0.114 -0.267 -0.033 0.079 -0.147 0.023 0.079 0.002 -0.288 0.114
(3) IFRS DISCLOSURE 0.630 0.838 -0.166 0.144 -0.203 -0.167 0.128 -0.063 0.017 0.088 -0.003 -0.360 0.121
(4) WORD RANKING -0.024 -0.179 -0.139 0.643 0.225 0.186 -0.035 0.093 -0.164 0.068 -0.012 0.013 0.149
(5) CHANGE WORD RANKING 0.106 0.114 0.141 0.729 -0.140 0.012 -0.003 0.198 -0.084 0.087 0.040 -0.087 -0.003
(6) TOTASS 0.043 -0.232 -0.166 0.154 -0.128 0.272 0.019 0.048 0.186 0.147 0.062 0.263 0.203
(7) PROV RATIO 0.052 -0.064 -0.232 0.133 -0.007 0.268 -0.600 -0.138 0.027 -0.093 0.018 0.057 0.068
(8) ABS(ΔPROV) -0.004 0.044 0.134 -0.070 -0.026 0.097 -0.570 -0.134 0.129 0.238 -0.045 0.010 0.061
(9) LEV -0.019 -0.133 -0.047 0.120 0.198 0.010 -0.110 -0.097 -0.183 -0.018 -0.296 0.164 -0.005
(10) ROA -0.062 0.017 -0.022 -0.075 -0.089 0.215 0.070 0.100 -0.176 0.392 0.228 0.104 0.005
(11) MTB 0.145 0.074 0.098 -0.035 0.094 0.081 -0.144 0.154 0.011 0.431 0.196 -0.108 -0.023
(12) CLSHELD 0.041 -0.008 -0.007 -0.033 0.031 0.032 0.014 0.021 -0.273 0.221 0.239 -0.322 0.209
(13) LISTING -0.299 -0.288 -0.367 0.092 -0.087 0.266 0.075 -0.018 0.163 0.115 -0.218 -0.302 -0.090
(14) BIG4 0.391 0.114 0.129 0.118 -0.003 0.232 0.056 0.110 -0.022 0.012 -0.035 0.210 -0.090
Variable definitions (data source): IFRS COMPLIANCE is the compliance index (compare Appendix for computation), IAS1 is an indicator variable taking the value one if a firm complies with IAS 1, IFRS DISCLOSURE is the disclosure index (compare Appendix for computation), WORD RANKING is a ranking of the number of written words in the notes related to other provi-sions where rank 1 is given to the highest number, CHANGE WORD RANKING is a ranking of the relative change in written words in the notes related to other provisions where rank 1 is given to the highest positive change, TOTASS is the natural logarithm of a firm’s total assets (hand-collected), PROV RATIO is other provisions to total assets (both hand-collected), ABS(ΔPROV) is the unsigned value of transition year book value of provisions under IFRS minus book value of provisions under German GAAP scaled by book value of provisions under German GAAP, LEV is total debt (Worldscope) to total assets (hand-collected), ROA is EBIT (Worldscope) to total assets (hand-collected), MTB is market capitalization (Worldscope) to book value of equity including non-controlling interests (hand-collected), CLSHELD is closely held shares to common shares outstanding (Worldscope), LISTING is an indicator variable taking the value 1 if a firm is listed in one of the selection indices DAX, MDAX or SDAX of Deutsche Börse (Deutsche Börse), BIG4 is an indicator variable taking the value 1 if a firm is audited by one of the BIG4 audit firms (hand-collected). Notes: Pearson (Spearman) correlations are displayed in the upper (lower) part of the correlation matrix, above (below) the diagonal. Bold typeset denotes significant correlations below the 10 % level. The number of observations for the variable CHANGE WORD RANKING amounts to 60 since this variable could not be calculated for the full sample. All variables refer to the IFRS adoption year.
-127-
In Panel A of Table 7 we display absolute changes for (1) total assets, (2) equity (in-
cluding non-controlling interests), (3) other provisions, (4) equity ratio and (5) provision
ratio under German GAAP (HGB) and IFRS (IFRS-HGB) for the same fiscal year. As
expected, total assets and equity are on average larger under IFRS than under German
GAAP. This result is comparable to Hung and Subramanyam (2007). Among other, this
is due to the recognition criteria for intangible assets and noticeable more fair value
measurement under IFRS. In contrast, other provisions are smaller under IFRS. All
these results are in line with prior literature (Burger, Fröhlich and Ulbrich, 2004; Burger
et al., 2005; Leker, Mahlstedt and Kehrel, 2008). The results regarding the provision
ratio (deflation by total assets) indicate an average decrease. This effect is driven by the
fact that the numerator decreases while the denominator increases. Equity to total assets
increases on average. All absolute changes except for the equity ratio are significantly
different from zero at conventional significance levels. The non-significance of the ef-
fect on the equity ratio needs to be seen against the background that the numerator as
well as denominator increase on average.
In Panel B of Table 7, we report relative changes for the same items. In line with prior
literature (e.g. Burger, Fröhlich, Ulbrich, 2004; Leker, Mahlstedt and Kehrel, 2008), we
compute the percentage change as the difference of the IFRS value and the German
GAAP value divided by the German GAAP value. The percentage changes show that
on average (1) total assets increase by 11.2%, (2) equity including minority interest in-
creases by 16.3%, (3) other provisions decrease by 29.2%, (4) equity ratio increases by
4.3% and (5) provision ratio decreases by 36.2% under IFRS. All percentage changes
except for the equity ratio are significantly different from zero at conventional signifi-
cance levels.

-128-
Table 7: Descriptive statistics and univariate analysis of balance sheet figures (n=63)
Panel A: Absolute changes
IFRS-HGB HGB
Variable Mean Std.dev Median Mean Std.dev Median Expected
sign t-statistic p-value s-statistic p-value
TOTASS 2,899.350 5,779.760 600.887 2,488.160 4,899.200 590.433 + 2.653 (0.010) 871.500 (0.000) EQUMI 724.029 1,251.090 269.321 649.987 1,158.700 228.431 + 1.736 (0.088) 599.500 (0.000) PROV 184.631 355.670 28.169 310.710 646.060 40.974 - -2.723 (0.008) -804.500 (0.000) EQUMI RATIO 0.365 0.139 0.338 0.361 0.141 0.344 +- 0.583 (0.562) 75.500 (0.601) PROV RATIO 0.069 0.045 0.054 0.108 0.061 0.092 - -6.932 (0.000) -943.500 (0.000) Panel B: Relative changes
Mean Std.dev Median Expected
sign t-statistic p-value s-statistic p-value
ΔTOTASS 0.112 0.106 0.101 + 8.439 (0.000) 853.500 (0.000) ΔEQUMI 0.163 0.296 0.092 + 4.379 (0.000) 638.500 (0.000) ΔPROV -0.292 0.297 -0.243 - -7.801 (0.000) -830.500 (0.000) ΔEQUMI RATIO 0.043 0.232 0.003 +- 1.470 (0.147) 95.500 (0.508) ΔPROV RATIO -0.362 0.271 -0.334 - -10.605 (0.000) -941.500 (0.000) Variable definitions (data source): TOTASS is a firm’s total assets in M€ (hand-collected), EQUMI is a firm’s equity including non-controlling interests in M€ (hand-collected), PROV is a firm’s other provi-sions in M€ (hand-collected), EQUMI RATIO is equity including non-controlling interests to total assets (both hand-collected), PROV RATIO is other provisions to total assets (both hand-collected). Notes: IFRS-HGB denotes the restated final German GAAP year under IFRS. The relative changes in Panel B are computed as the difference of the IFRS value and the German GAAP value scaled by the German GAAP value. The difference in means is based on pairwise t-tests. The difference in medians is based on signed rank-tests. Bold typeset denotes significant difference (two-sided) below the 10 % level.
-129-
5.2 Analysis of accounting quality
5.2.1 Descriptive analysis
Table 8 displays descriptive statistics of the accounting quality measures. In Panel A we
display absolute changes for the (1) compliance index, (2) disclosure index and (3)
number of words for the final German GAAP year and the IFRS adoption year. We re-
port relative changes in our measures in Panel B. The absolute and the relative changes
show that on average (1) compliance significantly decreased and (2) disclosure as well
as (3) the number of words significantly increased. In detail, compliance decreased from
60.3% to 29.6%, the disclosure measure increased from 37.1% to 60.3% and the num-
ber of words increased from 40.9 to 71.7 words on average. Expressed as relative
changes, compliance decreased by 54% while disclosure and the number of words in-
creased by 84.7% and 128.1%, respectively. This results demonstrates that IFRS adop-
tion goes along with an increased disclosure for our sample firms.
Notably, under German GAAP as well as under IFRS, three firms do not report any
words relating to other provisions in an individual section. However, these firms are not
identical. We cannot calculate percentage changes for observations where written words
under German GAAP equal zero, hence we report the change for the remaining 60
firms. The relevant IFRS firms provide their information exclusively in a tabular form.
Words given in a tabular form are not counted as words related to other provisions
within the notes since this results in an overlap with the other disclosure items.
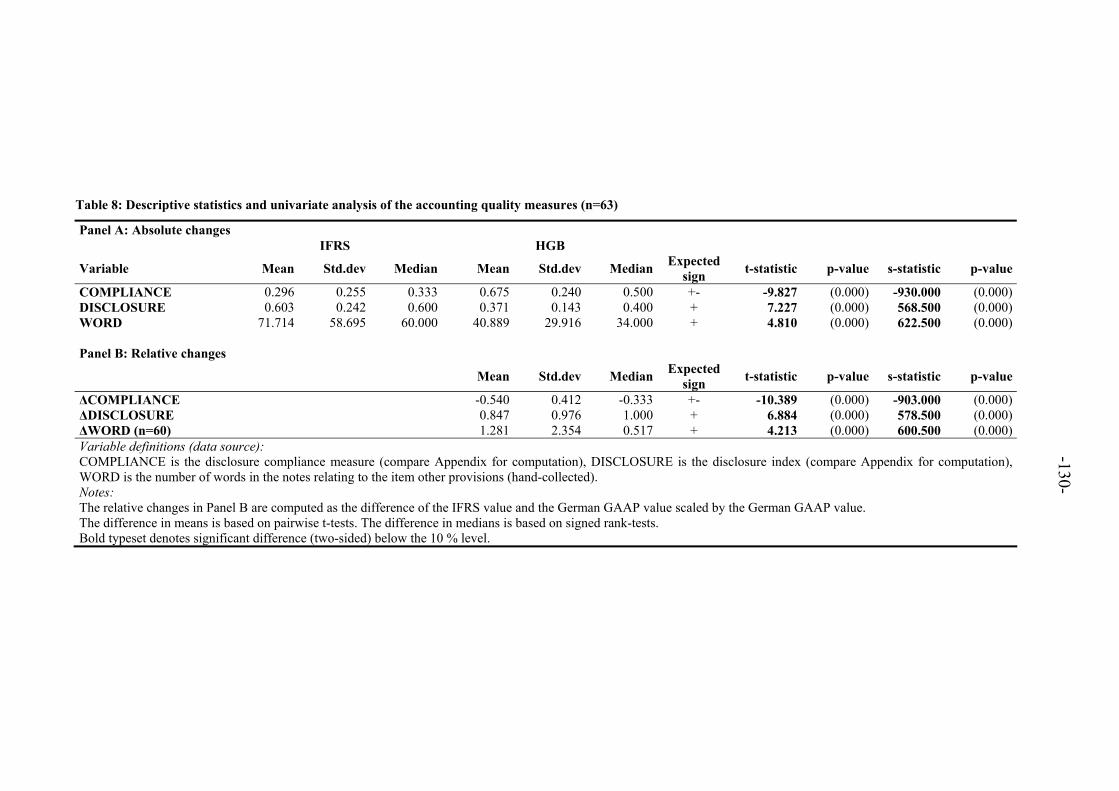
-130-
Table 8: Descriptive statistics and univariate analysis of the accounting quality measures (n=63)
Panel A: Absolute changes IFRS HGB
Variable Mean Std.dev Median Mean Std.dev Median Expected
sign t-statistic p-value s-statistic p-value
COMPLIANCE 0.296 0.255 0.333 0.675 0.240 0.500 +- -9.827 (0.000) -930.000 (0.000) DISCLOSURE 0.603 0.242 0.600 0.371 0.143 0.400 + 7.227 (0.000) 568.500 (0.000) WORD 71.714 58.695 60.000 40.889 29.916 34.000 + 4.810 (0.000) 622.500 (0.000) Panel B: Relative changes
Mean Std.dev Median Expected
sign t-statistic p-value s-statistic p-value
ΔCOMPLIANCE -0.540 0.412 -0.333 +- -10.389 (0.000) -903.000 (0.000) ΔDISCLOSURE 0.847 0.976 1.000 + 6.884 (0.000) 578.500 (0.000) ΔWORD (n=60) 1.281 2.354 0.517 + 4.213 (0.000) 600.500 (0.000) Variable definitions (data source): COMPLIANCE is the disclosure compliance measure (compare Appendix for computation), DISCLOSURE is the disclosure index (compare Appendix for computation), WORD is the number of words in the notes relating to the item other provisions (hand-collected). Notes: The relative changes in Panel B are computed as the difference of the IFRS value and the German GAAP value scaled by the German GAAP value. The difference in means is based on pairwise t-tests. The difference in medians is based on signed rank-tests. Bold typeset denotes significant difference (two-sided) below the 10 % level.
-131-
In Table 9 we show descriptive statistics of the unique items that form our indices.
Panel A displays the composition of the indices. In Panel B, we break down the compli-
ance and disclosure indices. Our results reveal that non-compliance under German
GAAP primarily stems from violating para. 266 which requires a separate disclosure of
other provisions, provisions for taxes and provisions for pensions in the balance sheet.
Non-compliance under IFRS primarily stems from the restrictive requirements of
IAS 37.85. As our results reveal, none of our sample firms fulfill all criteria of
IAS 37.85 cumulatively. Only one firm reports on uncertainties about the amount or
about the timing of outflows.
Breaking down the disclosure index shows that low scores stem from the circumstance
that no firm exceeds the classification requirements of para. 266, and that no firm makes
a separation into current and non-current provisions in the balance sheet. Approximately
only half the sample firms quantify other provisions in the notes. These are the essential
reasons for the difference in the disclosure scores under German GAAP and IFRS. Sig-
nificantly more firms quantify their other provisions in the notes under IFRS than under
German GAAP.
In Panel C we document whether accruals have been subsumed under other provisions.
Accordingly, approximately 59% of the sample firms do not distinguish between provi-
sions and accruals. Furthermore, only one firm reports on underfunded provisions.
We further highlight disclosure under IFRS (Panel A of Table 9). We classify disclosure
into three pieces. The first piece (DISCLOSURE BS) represents the average fulfillment
of possible classifications in the balance sheet. The second piece (DISCLOSURE 37.84)
represents the average fulfillment of the quantitative items required in IAS 37.84 (not
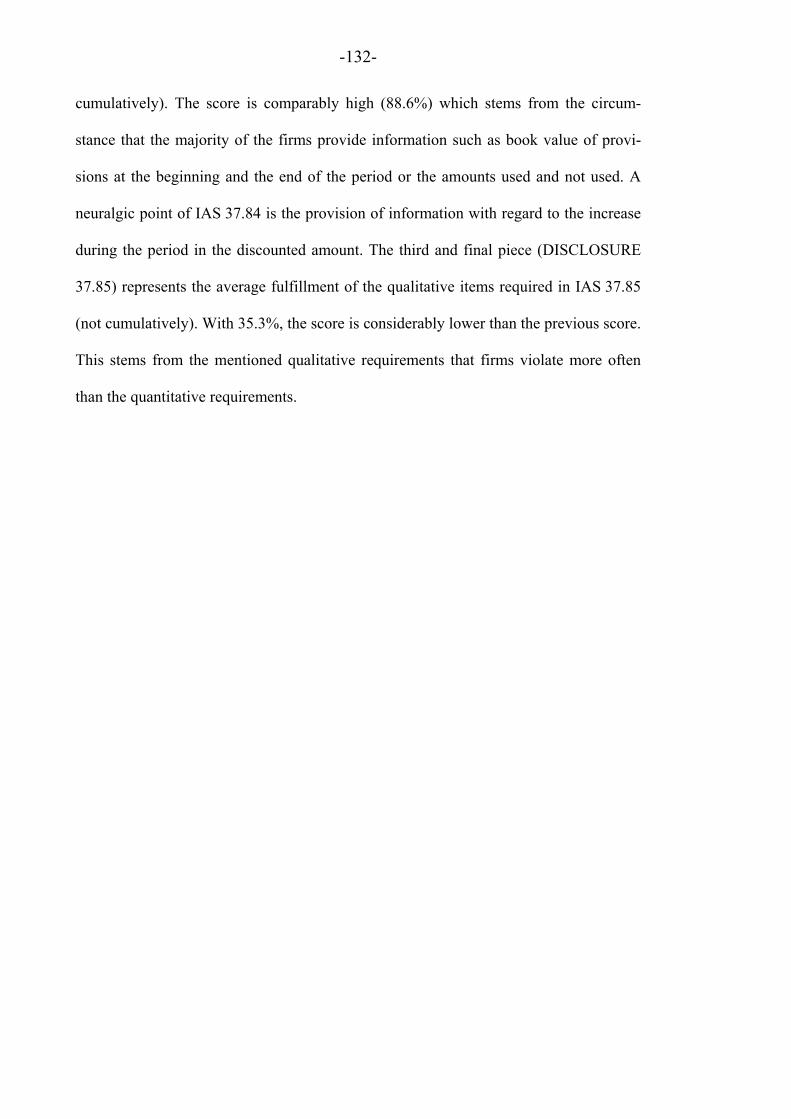
-132-
cumulatively). The score is comparably high (88.6%) which stems from the circum-
stance that the majority of the firms provide information such as book value of provi-
sions at the beginning and the end of the period or the amounts used and not used. A
neuralgic point of IAS 37.84 is the provision of information with regard to the increase
during the period in the discounted amount. The third and final piece (DISCLOSURE
37.85) represents the average fulfillment of the qualitative items required in IAS 37.85
(not cumulatively). With 35.3%, the score is considerably lower than the previous score.
This stems from the mentioned qualitative requirements that firms violate more often
than the quantitative requirements.

-133-
Table 9: Descriptive statistics of indices and index items (n=63)
Panel A Score Mean Description HGB COMPLIANCE 0.675 266, QUALITATIVE IFRS COMPLIANCE 0.296 IAS1, IAS 37.84, IAS 37.85 HGB DISCLOSURE 0.371 CNC, 266, 266+, QUALITATIVE, QUANTITATIVE IFRS DISCLOSURE 0.603 CNC, IAS1, IAS1+, QUALITATIVE, QUANTITATIVE DISCLOSURE BS 0.365 CNC, IAS1, IAS1+ DISCLOSURE 37.84 0.886 BVB, BVE, ADD, USE, NUSE, PV DISCLOSURE 37.85 0.353 NAT, TIM, UNCER, REIM
Panel B Variable (German GAAP) Mean Variable (IFRS) Mean s-statistic p-valueCNC 0.000 CNC 0.397 n.a. n.a.266 0.381 IAS1 0.413 0.200 (0.655)266+ 0.000 IAS1+ 0.286 n.a. n.a.QUALITATIVE 0.968 QUALITATIVE 0.984 0.333 (0.564)QUANTITATIVE 0.508 QUANTITATIVE 0.937 27.000 (0.000) IAS 37.84 0.476 BVB 0.968 BE 0.984 ADD 0.952 USE 0.952 NUSE 0.937 PV 0.524 IAS 37.85 0.000 NAT 0.984 TIM 0.349 UNCER 0.016 REIM 0.063
Panel C
ACC 0.587 UFUND 0.016 Notes: A description of each variable is provided in the Appendix A. The significance of differences is assessed by McNemar exact tests; n.a. denotes that a 2x2 tables could not be constructed. Bold typeset denotes significant difference (two-sided) below the 10 % level.
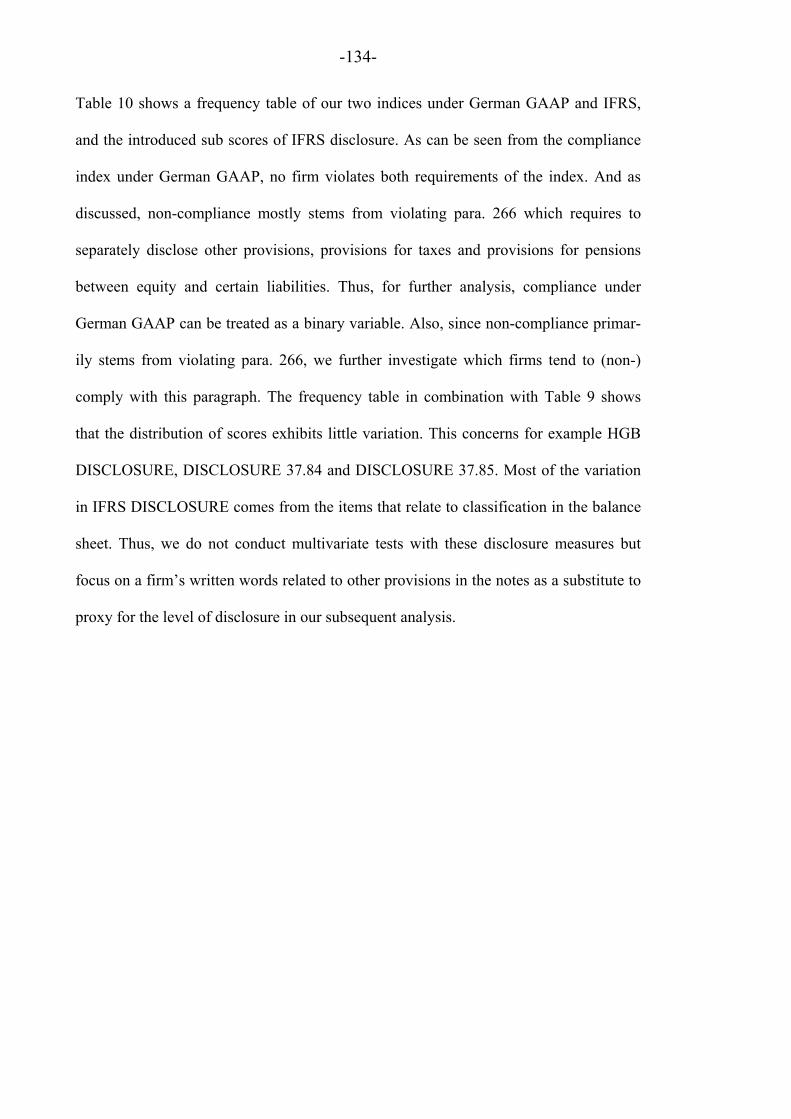
-134-
Table 10 shows a frequency table of our two indices under German GAAP and IFRS,
and the introduced sub scores of IFRS disclosure. As can be seen from the compliance
index under German GAAP, no firm violates both requirements of the index. And as
discussed, non-compliance mostly stems from violating para. 266 which requires to
separately disclose other provisions, provisions for taxes and provisions for pensions
between equity and certain liabilities. Thus, for further analysis, compliance under
German GAAP can be treated as a binary variable. Also, since non-compliance primar-
ily stems from violating para. 266, we further investigate which firms tend to (non-)
comply with this paragraph. The frequency table in combination with Table 9 shows
that the distribution of scores exhibits little variation. This concerns for example HGB
DISCLOSURE, DISCLOSURE 37.84 and DISCLOSURE 37.85. Most of the variation
in IFRS DISCLOSURE comes from the items that relate to classification in the balance
sheet. Thus, we do not conduct multivariate tests with these disclosure measures but
focus on a firm’s written words related to other provisions in the notes as a substitute to
proxy for the level of disclosure in our subsequent analysis.

-135-
Table 10: Frequency table of accounting quality indices (n=63)
Score Frequency Percent Score Frequency Percent HGB COMPLIANCE IFRS COMPLIANCE
0.000 0 0.000 0.000 22 34.920 0.500 41 65.080 0.333 26 41.270 1.000 22 34.920 0.667 15 23.810 Σ 63 100.000 1.000 0 0.000
Σ 63 100.000 HGB DISCLOSURE IFRS DISCLOSURE
0.000 0 0.000 0.000 0 0.000 0.200 21 33.330 0.200 2 3.180 0.400 30 47.620 0.400 28 44.440 0.600 12 19.050 0.600 11 17.460 0.800 0 0.000 0.800 11 17.460 1.000 0 0.000 1.000 11 17.460 Σ 63 100.000 Σ 63 100.000 DISCLOSURE BS 0.000 28 44.440 0.333 12 19.050 0.667 12 19.050 1.000 11 17.460 Σ 63 100.000 DISCLOSURE 37.84 0.000 1 1.590 0.167 0 0.000 0.333 1 1.590 0.500 1 1.590 0.667 0 0.000 0.833 30 47.620 1.000 30 47.620 Σ 63 100.000 DISCLOSURE 37.85 0.000 1 1.590 0.250 37 58.730 0.500 23 36.510 0.750 2 3.170 1.000 0 0.000 Σ 63 100.000
Notes: A description of each variable is provided in Table 9.
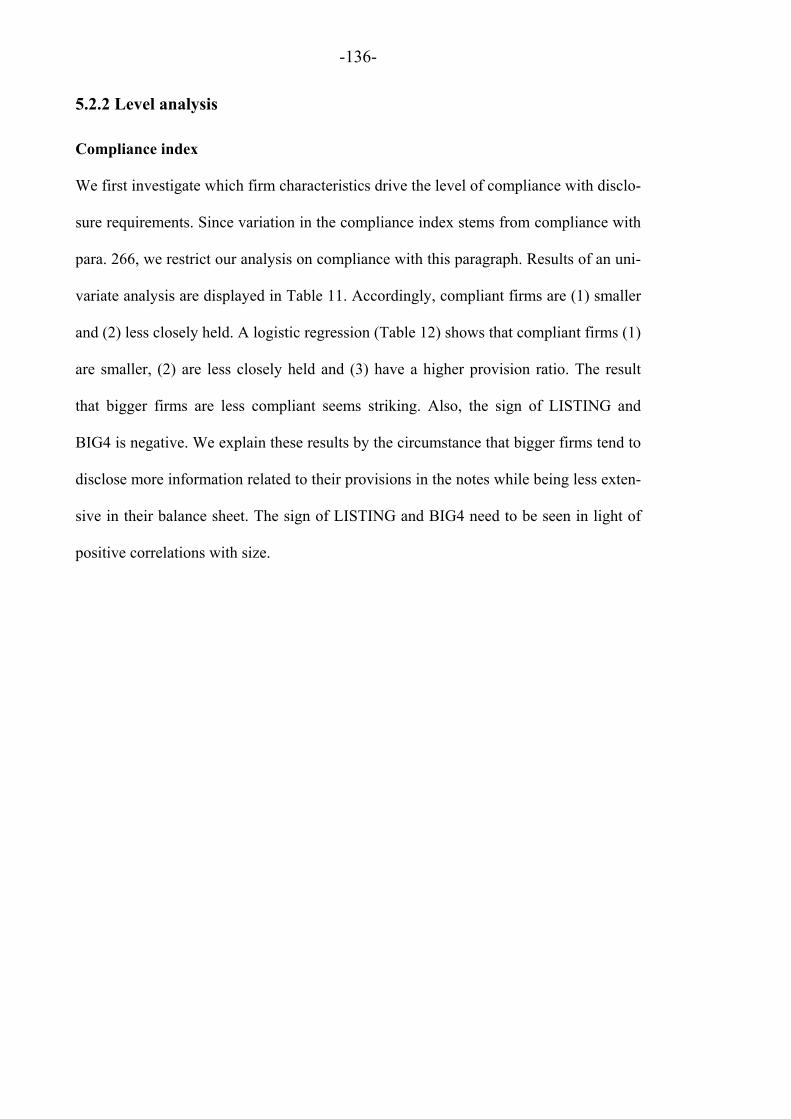
-136-
5.2.2 Level analysis
Compliance index
We first investigate which firm characteristics drive the level of compliance with disclo-
sure requirements. Since variation in the compliance index stems from compliance with
para. 266, we restrict our analysis on compliance with this paragraph. Results of an uni-
variate analysis are displayed in Table 11. Accordingly, compliant firms are (1) smaller
and (2) less closely held. A logistic regression (Table 12) shows that compliant firms (1)
are smaller, (2) are less closely held and (3) have a higher provision ratio. The result
that bigger firms are less compliant seems striking. Also, the sign of LISTING and
BIG4 is negative. We explain these results by the circumstance that bigger firms tend to
disclose more information related to their provisions in the notes while being less exten-
sive in their balance sheet. The sign of LISTING and BIG4 need to be seen in light of
positive correlations with size.
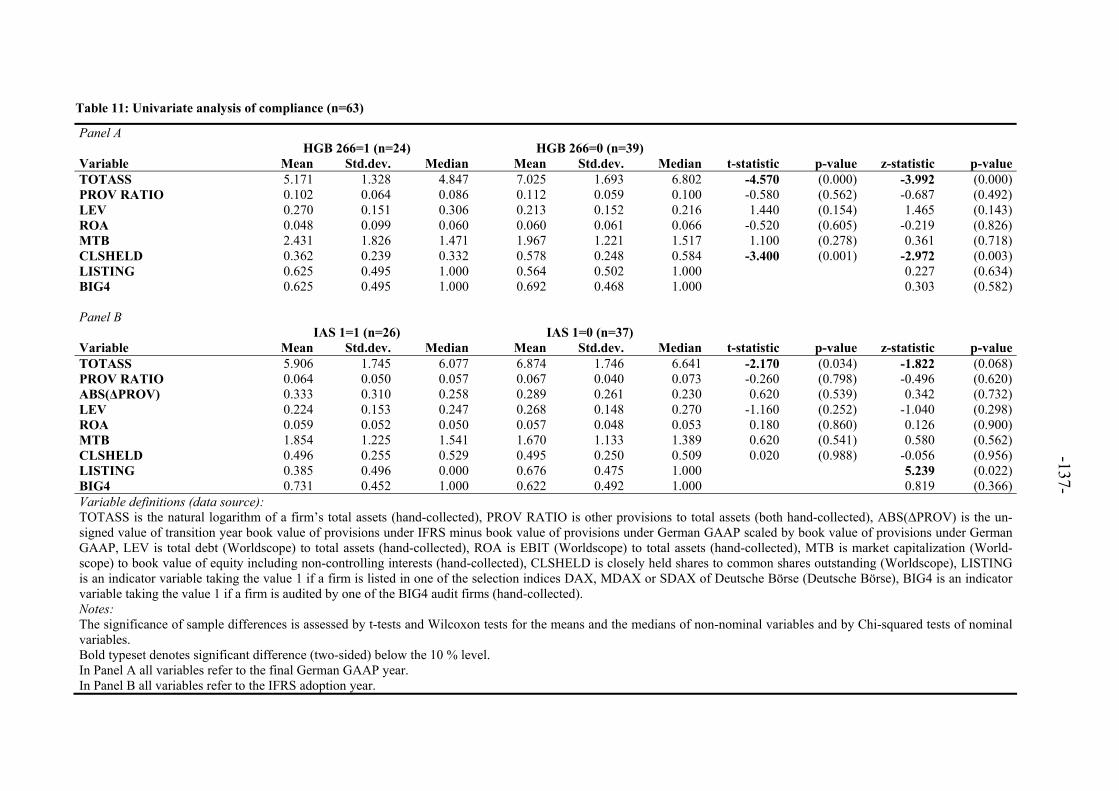
-137-
Table 11: Univariate analysis of compliance (n=63)
Panel A HGB 266=1 (n=24) HGB 266=0 (n=39) Variable Mean Std.dev. Median Mean Std.dev. Median t-statistic p-value z-statistic p-value TOTASS 5.171 1.328 4.847 7.025 1.693 6.802 -4.570 (0.000) -3.992 (0.000) PROV RATIO 0.102 0.064 0.086 0.112 0.059 0.100 -0.580 (0.562) -0.687 (0.492) LEV 0.270 0.151 0.306 0.213 0.152 0.216 1.440 (0.154) 1.465 (0.143) ROA 0.048 0.099 0.060 0.060 0.061 0.066 -0.520 (0.605) -0.219 (0.826) MTB 2.431 1.826 1.471 1.967 1.221 1.517 1.100 (0.278) 0.361 (0.718) CLSHELD 0.362 0.239 0.332 0.578 0.248 0.584 -3.400 (0.001) -2.972 (0.003) LISTING 0.625 0.495 1.000 0.564 0.502 1.000 0.227 (0.634) BIG4 0.625 0.495 1.000 0.692 0.468 1.000 0.303 (0.582) Panel B
IAS 1=1 (n=26) IAS 1=0 (n=37) Variable Mean Std.dev. Median Mean Std.dev. Median t-statistic p-value z-statistic p-value TOTASS 5.906 1.745 6.077 6.874 1.746 6.641 -2.170 (0.034) -1.822 (0.068) PROV RATIO 0.064 0.050 0.057 0.067 0.040 0.073 -0.260 (0.798) -0.496 (0.620) ABS(ΔPROV) 0.333 0.310 0.258 0.289 0.261 0.230 0.620 (0.539) 0.342 (0.732) LEV 0.224 0.153 0.247 0.268 0.148 0.270 -1.160 (0.252) -1.040 (0.298) ROA 0.059 0.052 0.050 0.057 0.048 0.053 0.180 (0.860) 0.126 (0.900) MTB 1.854 1.225 1.541 1.670 1.133 1.389 0.620 (0.541) 0.580 (0.562) CLSHELD 0.496 0.255 0.529 0.495 0.250 0.509 0.020 (0.988) -0.056 (0.956) LISTING 0.385 0.496 0.000 0.676 0.475 1.000 5.239 (0.022) BIG4 0.731 0.452 1.000 0.622 0.492 1.000 0.819 (0.366) Variable definitions (data source): TOTASS is the natural logarithm of a firm’s total assets (hand-collected), PROV RATIO is other provisions to total assets (both hand-collected), ABS(ΔPROV) is the un-signed value of transition year book value of provisions under IFRS minus book value of provisions under German GAAP scaled by book value of provisions under German GAAP, LEV is total debt (Worldscope) to total assets (hand-collected), ROA is EBIT (Worldscope) to total assets (hand-collected), MTB is market capitalization (World-scope) to book value of equity including non-controlling interests (hand-collected), CLSHELD is closely held shares to common shares outstanding (Worldscope), LISTING is an indicator variable taking the value 1 if a firm is listed in one of the selection indices DAX, MDAX or SDAX of Deutsche Börse (Deutsche Börse), BIG4 is an indicator variable taking the value 1 if a firm is audited by one of the BIG4 audit firms (hand-collected). Notes: The significance of sample differences is assessed by t-tests and Wilcoxon tests for the means and the medians of non-nominal variables and by Chi-squared tests of nominal variables. Bold typeset denotes significant difference (two-sided) below the 10 % level. In Panel A all variables refer to the final German GAAP year. In Panel B all variables refer to the IFRS adoption year.
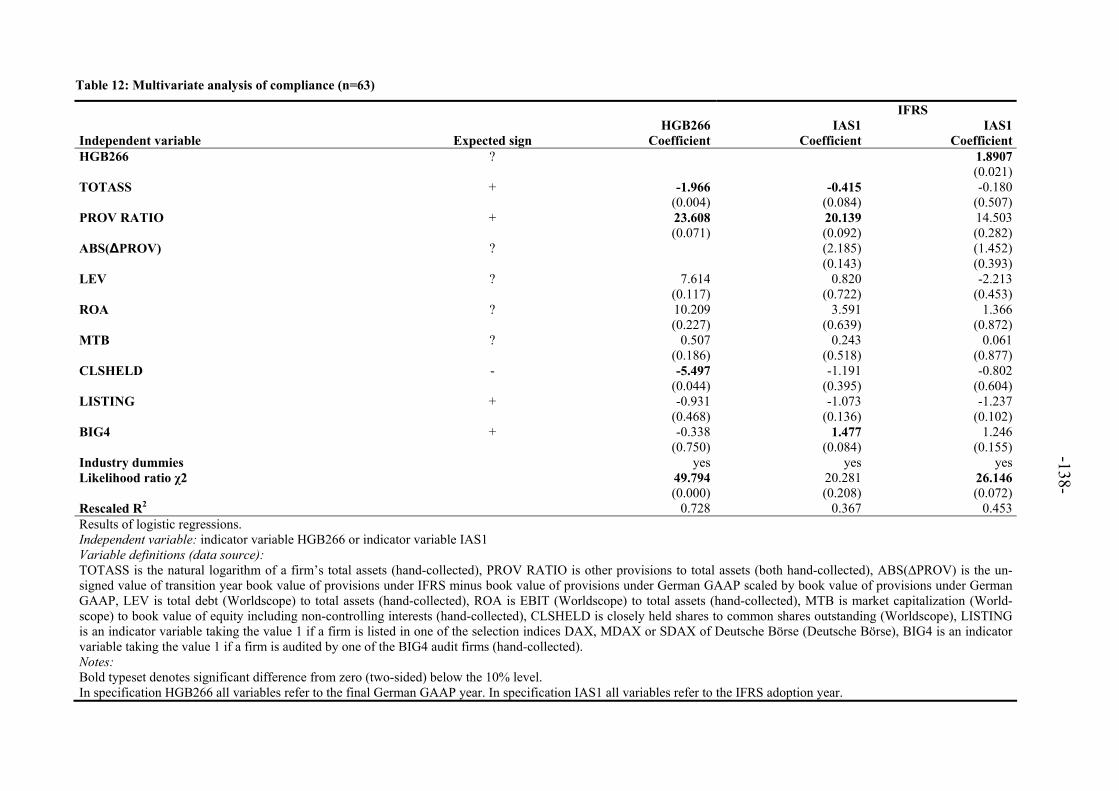
-138-
Table 12: Multivariate analysis of compliance (n=63)
IFRS HGB266 IAS1 IAS1 Independent variable Expected sign Coefficient Coefficient Coefficient HGB266 ? 1.8907 (0.021) TOTASS + -1.966 -0.415 -0.180 (0.004) (0.084) (0.507) PROV RATIO + 23.608 20.139 14.503 (0.071) (0.092) (0.282) ABS(ΔPROV) ? (2.185) (1.452) (0.143) (0.393) LEV ? 7.614 0.820 -2.213 (0.117) (0.722) (0.453) ROA ? 10.209 3.591 1.366 (0.227) (0.639) (0.872) MTB ? 0.507 0.243 0.061 (0.186) (0.518) (0.877) CLSHELD - -5.497 -1.191 -0.802 (0.044) (0.395) (0.604) LISTING + -0.931 -1.073 -1.237 (0.468) (0.136) (0.102) BIG4 + -0.338 1.477 1.246 (0.750) (0.084) (0.155) Industry dummies yes yes yes Likelihood ratio χ2 49.794 20.281 26.146 (0.000) (0.208) (0.072) Rescaled R2 0.728 0.367 0.453 Results of logistic regressions. Independent variable: indicator variable HGB266 or indicator variable IAS1 Variable definitions (data source): TOTASS is the natural logarithm of a firm’s total assets (hand-collected), PROV RATIO is other provisions to total assets (both hand-collected), ABS(ΔPROV) is the un-signed value of transition year book value of provisions under IFRS minus book value of provisions under German GAAP scaled by book value of provisions under German GAAP, LEV is total debt (Worldscope) to total assets (hand-collected), ROA is EBIT (Worldscope) to total assets (hand-collected), MTB is market capitalization (World-scope) to book value of equity including non-controlling interests (hand-collected), CLSHELD is closely held shares to common shares outstanding (Worldscope), LISTING is an indicator variable taking the value 1 if a firm is listed in one of the selection indices DAX, MDAX or SDAX of Deutsche Börse (Deutsche Börse), BIG4 is an indicator variable taking the value 1 if a firm is audited by one of the BIG4 audit firms (hand-collected). Notes: Bold typeset denotes significant difference from zero (two-sided) below the 10% level. In specification HGB266 all variables refer to the final German GAAP year. In specification IAS1 all variables refer to the IFRS adoption year.

-139-
Most firms comply with the requirements of IAS 37.84. On the other hand, no firm cu-
mulatively fulfills requirements of IAS 37.85. Hence, we focus on compliance with
IAS 1. This neatly fits into the preceding analysis of compliance with para. 266 as both
deal with classification requirements in the balance sheet. Similar to our findings under
German GAAP, Table 11 shows that compliant firms are smaller. Also, these firms are
less often listed in one of the selection indices of Deutsche Börse. LISTING again
seems to capture a notion of size. Our multivariate analysis (Table 12) shows that com-
pliant firms are smaller, have a higher provision ratio and are more often audited by a
BIG4 audit firm. Although results under IFRS are quite comparable with those under
German GAAP, the model exhibits a low fit. An additional test suggests that firms that
complied with para. 266 are also more likely to comply with IAS 1. The fit of this speci-
fication is much higher.
Disclosure index
Next, we analyze the disclosure index. For this purpose, we divide the sample into firms
with poor and good disclosure. We define a firm to have good disclosure when the dis-
closure index is equal or higher than 60%. This is equal to fulfilling three out of five
items. Only 12 firms fulfill this criterion under German GAAP. Univariate tests (Ta-
ble 13) suggest that firms with good disclosure are (1) smaller and (2) less closely held.
Of course, this result needs to be seen against the background that the disclosure index
is primarily driven by the requirements of para. 266. Applying the same threshold to the
index under IFRS yields a subsample of 33 firms with good disclosure. Univariate tests
suggest that those firms are significantly (1) smaller, (2) have a lower provision ratio
and (3) are less often listed in one of the selection indices of Deutsche Börse. The IFRS
results are interesting against the background that ownership structure as measured by
closely held shares is not significantly different between the two subsamples under

-140-
IFRS. Again, the results based on our disclosure index as measure for accounting qual-
ity demonstrate that the distribution of the scores only allows a limited interpretation.
Thus, we do not conduct multivariate tests with this disclosure measure but focus on the
written words to other provisions in the notes.
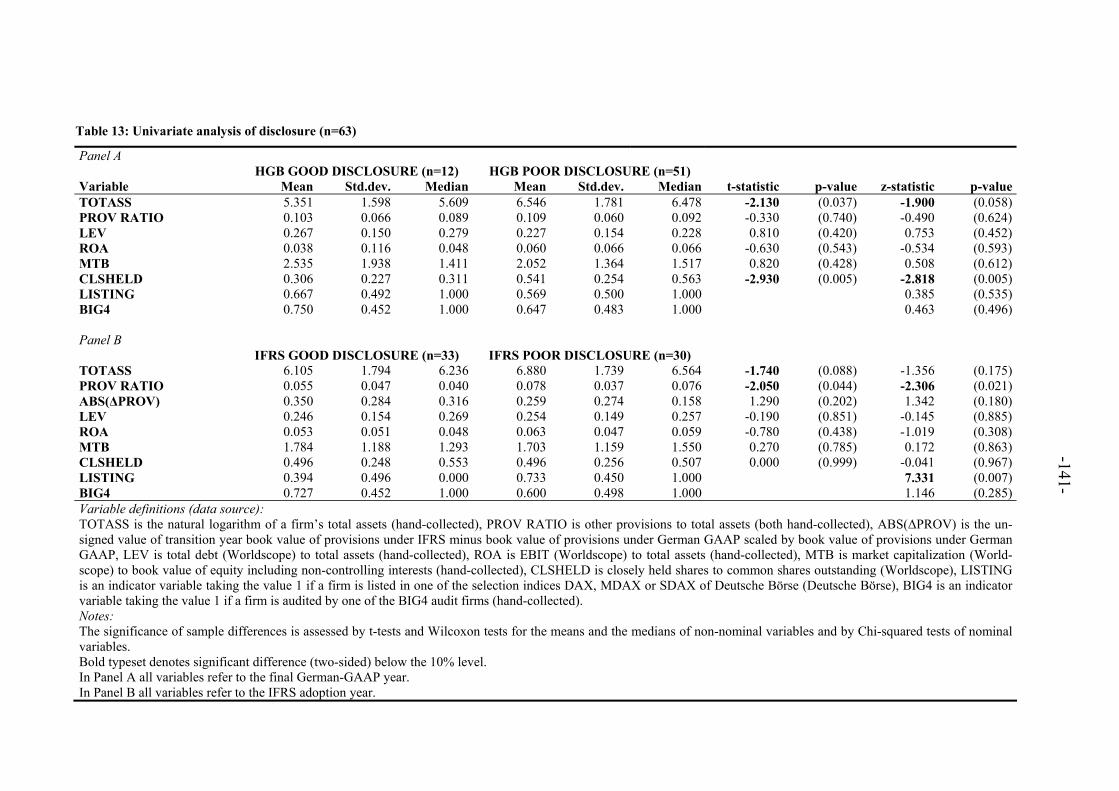
-141-
Table 13: Univariate analysis of disclosure (n=63)
Panel A HGB GOOD DISCLOSURE (n=12) HGB POOR DISCLOSURE (n=51) Variable Mean Std.dev. Median Mean Std.dev. Median t-statistic p-value z-statistic p-value TOTASS 5.351 1.598 5.609 6.546 1.781 6.478 -2.130 (0.037) -1.900 (0.058) PROV RATIO 0.103 0.066 0.089 0.109 0.060 0.092 -0.330 (0.740) -0.490 (0.624) LEV 0.267 0.150 0.279 0.227 0.154 0.228 0.810 (0.420) 0.753 (0.452) ROA 0.038 0.116 0.048 0.060 0.066 0.066 -0.630 (0.543) -0.534 (0.593) MTB 2.535 1.938 1.411 2.052 1.364 1.517 0.820 (0.428) 0.508 (0.612) CLSHELD 0.306 0.227 0.311 0.541 0.254 0.563 -2.930 (0.005) -2.818 (0.005) LISTING 0.667 0.492 1.000 0.569 0.500 1.000 0.385 (0.535) BIG4 0.750 0.452 1.000 0.647 0.483 1.000 0.463 (0.496) Panel B
IFRS GOOD DISCLOSURE (n=33) IFRS POOR DISCLOSURE (n=30) TOTASS 6.105 1.794 6.236 6.880 1.739 6.564 -1.740 (0.088) -1.356 (0.175) PROV RATIO 0.055 0.047 0.040 0.078 0.037 0.076 -2.050 (0.044) -2.306 (0.021) ABS(ΔPROV) 0.350 0.284 0.316 0.259 0.274 0.158 1.290 (0.202) 1.342 (0.180) LEV 0.246 0.154 0.269 0.254 0.149 0.257 -0.190 (0.851) -0.145 (0.885) ROA 0.053 0.051 0.048 0.063 0.047 0.059 -0.780 (0.438) -1.019 (0.308) MTB 1.784 1.188 1.293 1.703 1.159 1.550 0.270 (0.785) 0.172 (0.863) CLSHELD 0.496 0.248 0.553 0.496 0.256 0.507 0.000 (0.999) -0.041 (0.967) LISTING 0.394 0.496 0.000 0.733 0.450 1.000 7.331 (0.007) BIG4 0.727 0.452 1.000 0.600 0.498 1.000 1.146 (0.285) Variable definitions (data source): TOTASS is the natural logarithm of a firm’s total assets (hand-collected), PROV RATIO is other provisions to total assets (both hand-collected), ABS(ΔPROV) is the un-signed value of transition year book value of provisions under IFRS minus book value of provisions under German GAAP scaled by book value of provisions under German GAAP, LEV is total debt (Worldscope) to total assets (hand-collected), ROA is EBIT (Worldscope) to total assets (hand-collected), MTB is market capitalization (World-scope) to book value of equity including non-controlling interests (hand-collected), CLSHELD is closely held shares to common shares outstanding (Worldscope), LISTING is an indicator variable taking the value 1 if a firm is listed in one of the selection indices DAX, MDAX or SDAX of Deutsche Börse (Deutsche Börse), BIG4 is an indicator variable taking the value 1 if a firm is audited by one of the BIG4 audit firms (hand-collected). Notes: The significance of sample differences is assessed by t-tests and Wilcoxon tests for the means and the medians of non-nominal variables and by Chi-squared tests of nominal variables. Bold typeset denotes significant difference (two-sided) below the 10% level. In Panel A all variables refer to the final German-GAAP year. In Panel B all variables refer to the IFRS adoption year.
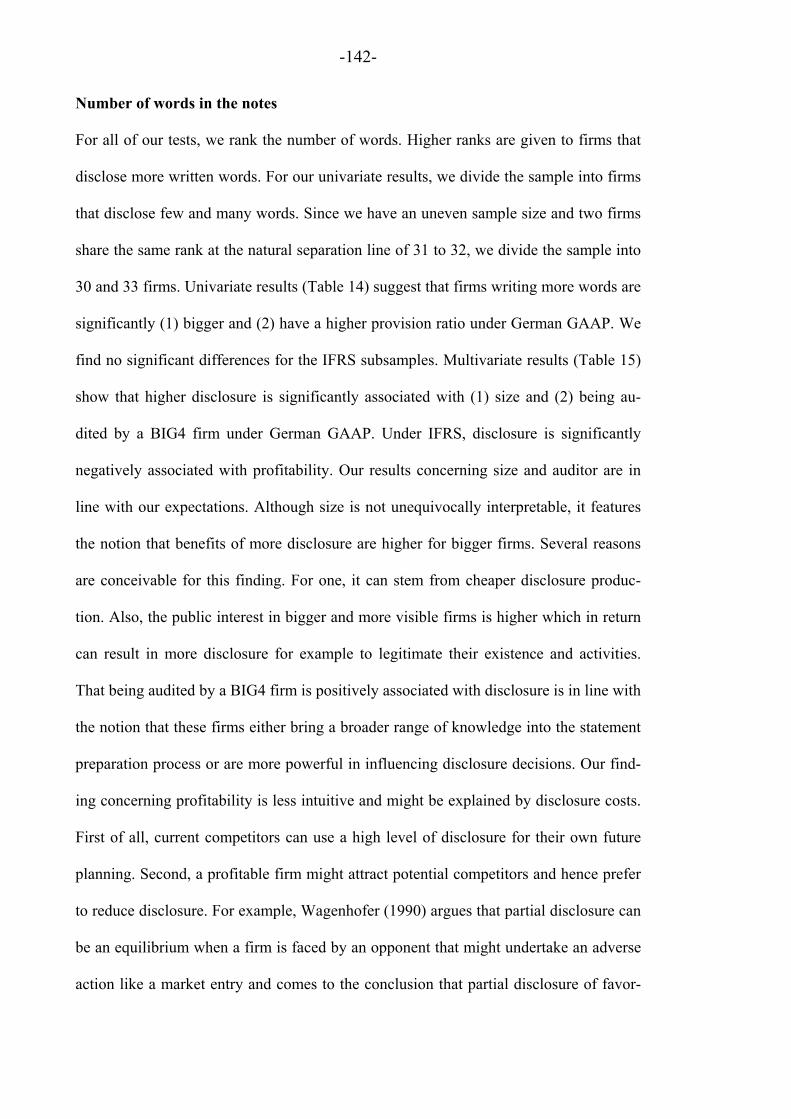
-142-
Number of words in the notes
For all of our tests, we rank the number of words. Higher ranks are given to firms that
disclose more written words. For our univariate results, we divide the sample into firms
that disclose few and many words. Since we have an uneven sample size and two firms
share the same rank at the natural separation line of 31 to 32, we divide the sample into
30 and 33 firms. Univariate results (Table 14) suggest that firms writing more words are
significantly (1) bigger and (2) have a higher provision ratio under German GAAP. We
find no significant differences for the IFRS subsamples. Multivariate results (Table 15)
show that higher disclosure is significantly associated with (1) size and (2) being au-
dited by a BIG4 firm under German GAAP. Under IFRS, disclosure is significantly
negatively associated with profitability. Our results concerning size and auditor are in
line with our expectations. Although size is not unequivocally interpretable, it features
the notion that benefits of more disclosure are higher for bigger firms. Several reasons
are conceivable for this finding. For one, it can stem from cheaper disclosure produc-
tion. Also, the public interest in bigger and more visible firms is higher which in return
can result in more disclosure for example to legitimate their existence and activities.
That being audited by a BIG4 firm is positively associated with disclosure is in line with
the notion that these firms either bring a broader range of knowledge into the statement
preparation process or are more powerful in influencing disclosure decisions. Our find-
ing concerning profitability is less intuitive and might be explained by disclosure costs.
First of all, current competitors can use a high level of disclosure for their own future
planning. Second, a profitable firm might attract potential competitors and hence prefer
to reduce disclosure. For example, Wagenhofer (1990) argues that partial disclosure can
be an equilibrium when a firm is faced by an opponent that might undertake an adverse
action like a market entry and comes to the conclusion that partial disclosure of favor-

-143-
able information can be used to lower the probability that the opponent takes the ad-
verse action. To some extent, this might be applicable for provision disclosure since
profitable firms might try to provide little explicit information, hence allowing for more
leeway for example in the measurement of provisions and making assessments by com-
petitors more difficult.
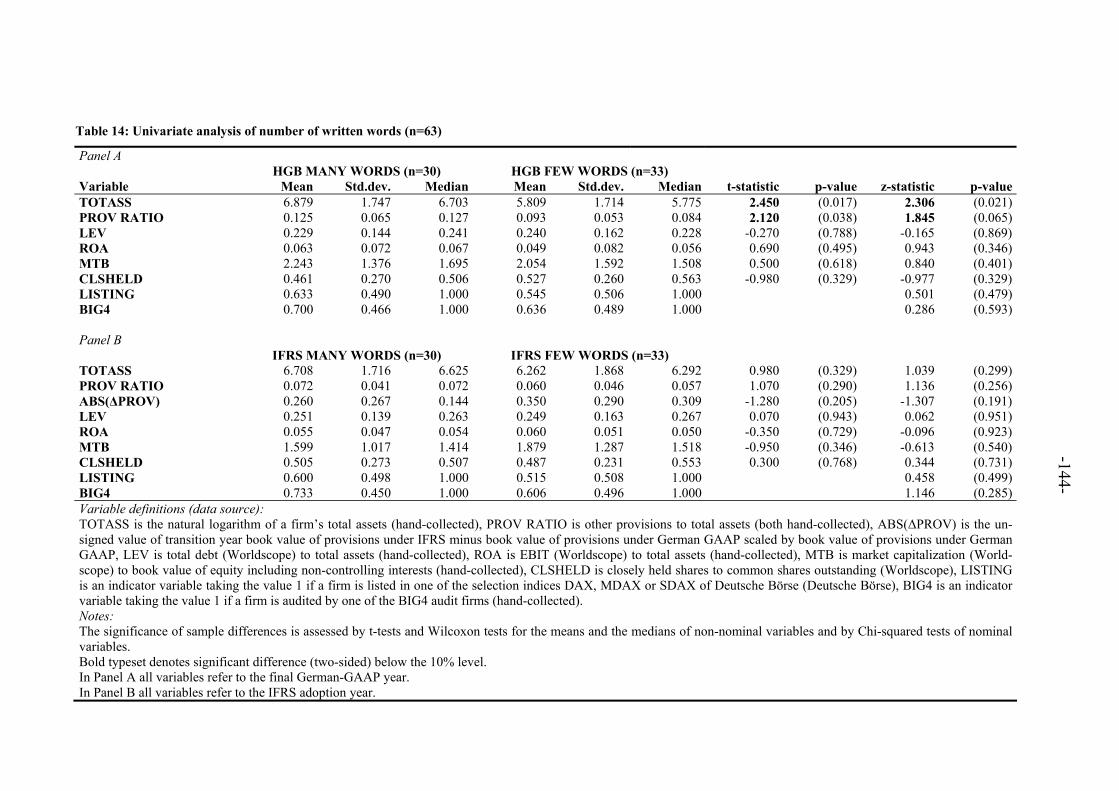
-144-
Table 14: Univariate analysis of number of written words (n=63)
Panel A HGB MANY WORDS (n=30) HGB FEW WORDS (n=33) Variable Mean Std.dev. Median Mean Std.dev. Median t-statistic p-value z-statistic p-value TOTASS 6.879 1.747 6.703 5.809 1.714 5.775 2.450 (0.017) 2.306 (0.021) PROV RATIO 0.125 0.065 0.127 0.093 0.053 0.084 2.120 (0.038) 1.845 (0.065) LEV 0.229 0.144 0.241 0.240 0.162 0.228 -0.270 (0.788) -0.165 (0.869) ROA 0.063 0.072 0.067 0.049 0.082 0.056 0.690 (0.495) 0.943 (0.346) MTB 2.243 1.376 1.695 2.054 1.592 1.508 0.500 (0.618) 0.840 (0.401) CLSHELD 0.461 0.270 0.506 0.527 0.260 0.563 -0.980 (0.329) -0.977 (0.329) LISTING 0.633 0.490 1.000 0.545 0.506 1.000 0.501 (0.479) BIG4 0.700 0.466 1.000 0.636 0.489 1.000 0.286 (0.593) Panel B
IFRS MANY WORDS (n=30) IFRS FEW WORDS (n=33) TOTASS 6.708 1.716 6.625 6.262 1.868 6.292 0.980 (0.329) 1.039 (0.299) PROV RATIO 0.072 0.041 0.072 0.060 0.046 0.057 1.070 (0.290) 1.136 (0.256) ABS(ΔPROV) 0.260 0.267 0.144 0.350 0.290 0.309 -1.280 (0.205) -1.307 (0.191) LEV 0.251 0.139 0.263 0.249 0.163 0.267 0.070 (0.943) 0.062 (0.951) ROA 0.055 0.047 0.054 0.060 0.051 0.050 -0.350 (0.729) -0.096 (0.923) MTB 1.599 1.017 1.414 1.879 1.287 1.518 -0.950 (0.346) -0.613 (0.540) CLSHELD 0.505 0.273 0.507 0.487 0.231 0.553 0.300 (0.768) 0.344 (0.731) LISTING 0.600 0.498 1.000 0.515 0.508 1.000 0.458 (0.499) BIG4 0.733 0.450 1.000 0.606 0.496 1.000 1.146 (0.285) Variable definitions (data source): TOTASS is the natural logarithm of a firm’s total assets (hand-collected), PROV RATIO is other provisions to total assets (both hand-collected), ABS(ΔPROV) is the un-signed value of transition year book value of provisions under IFRS minus book value of provisions under German GAAP scaled by book value of provisions under German GAAP, LEV is total debt (Worldscope) to total assets (hand-collected), ROA is EBIT (Worldscope) to total assets (hand-collected), MTB is market capitalization (World-scope) to book value of equity including non-controlling interests (hand-collected), CLSHELD is closely held shares to common shares outstanding (Worldscope), LISTING is an indicator variable taking the value 1 if a firm is listed in one of the selection indices DAX, MDAX or SDAX of Deutsche Börse (Deutsche Börse), BIG4 is an indicator variable taking the value 1 if a firm is audited by one of the BIG4 audit firms (hand-collected). Notes: The significance of sample differences is assessed by t-tests and Wilcoxon tests for the means and the medians of non-nominal variables and by Chi-squared tests of nominal variables. Bold typeset denotes significant difference (two-sided) below the 10% level. In Panel A all variables refer to the final German-GAAP year. In Panel B all variables refer to the IFRS adoption year.

-145-
Table 15: Multivariate analysis of number of written words (n=63)
HGB IFRS WORD RANKING WORD RANKING WORD RANKING Independent variable Expected sign Coefficient Coefficient Coefficient TOTASS + 0.034 0.024 0.021 (0.079) (0.192) (0.259) PROV RATIO + 0.932 0.625 1.022 (0.130) (0.436) (0.367) ABS(ΔPROV) ? 0.074 (0.615) LEV ? 0.157 -0.058 -0.012 (0.519) (0.808) (0.962) ROA ? 0.352 -1.066 -1.091 (0.455) (0.100) (0.096) MTB ? 0.017 0.012 0.010 (0.424) (0.689) (0.753) CLSHELD - -0.132 0.028 0.044 (0.331) (0.835) (0.753) LISTING + 0.021 -0.002 -0.003 (0.769) (0.971) (0.959) BIG4 + 0.119 -0.005 -0.007 (0.082) (0.940) (0.915) Industry dummies yes yes yes F-Value 10.370 6.760 6.280 (0.000) (0.000) (0.000) Adj. R2 0.360 0.238 0.242 Results of OLS regression. Dependent variable: WORD RANKING (a ranking of the number of written words in the notes related to other provisions where rank 1 is given to the highest number) Variable definitions (data source): TOTASS is the natural logarithm of a firm’s total assets (hand-collected), ABS(ΔPROV) is the unsigned value of transition year book value of provisions under IFRS minus book value of provisions under German GAAP scaled by book value of provisions under German GAAP, PROV RATIO is other provisions to total assets (both hand-collected), LEV is total debt (Worldscope) to total assets (hand-collected), ROA is EBIT (Worldscope) to total assets (hand-collected), MTB is market capitalization (World-scope) to book value of equity including non-controlling interests (hand-collected), CLSHELD is closely held shares to common shares outstanding (Worldscope), LISTING is an indicator variable taking the value 1 if a firm is listed in one of the selection indices DAX, MDAX or SDAX of Deutsche Börse (Deutsche Börse), BIG4 is an indicator variable taking the value 1 if a firm is audited by one of the BIG4 audit firms (hand-collected). Notes: Bold typeset denotes significant difference from zero (two-sided) below the 10% level. In the HGB specification all variables refer to the final German GAAP year. In the IFRS specification all variables refer to the IFRS adoption year.

-146-
5.2.3 Change analysis
We further substantiate our findings by investigating whether certain firm characteris-
tics are associated with particular strong changes in disclosure measured by the number
of words. In doing so, we rank the percentage changes in number of words induced by
the IFRS adoption. Higher ranks are given to firms with higher positive changes. Since
we calculate the percentage change as IFRS words minus German GAAP words de-
flated by German GAAP words, we loose those observations where the German GAAP
value is zero and a percentage change cannot be calculated (three observations).
Univariate results are displayed in Table 16. Although dividing the sample equally into
30 firms would be natural, two firms share the same rank at the natural separation line.
For this reason, we divide the sample into firms with a strong change (n=29) and firms
with a weak change (n=31). We find no significant differences for the firm characteris-
tics of these subsamples. Next, we assess what drives the change in a multivariate test.
Results are displayed in Table 17. Our findings suggest that firms where improvement
is more pronounced have (1) a higher provision ratio, (2) more absolute changes in their
provisions, (3) are more levered and (4) more closely held.
An additional test suggests that changes are less pronounced for firms that had a high
ranking under German GAAP (p-value of 0.225). This implies that IFRS adoption led to
an increase in written words for our sample firms that had fewer written words under
German GAAP. A second additional test suggests a positive association (p-value of
0.304) between higher disclosure and firms that adopted IFRS in 2003 or 2004 (late
adopters).
-147-
Overall, these results suggest that improvement in disclosure is particularly strong for
those firms where the importance of provisions is more important and where the IFRS
adoption has a higher impact on the provisions. In this respect, the analysis reveals that
to some extent disclosure improvement is driven by the relative importance of the line
item in proportion to the balance sheet. However, the findings also show that improve-
ment is more pronounced for firms that are more levered and more closely held. These
are firms that typically are more financed by banks and are owned by large (family)
blockholders, respectively. These groups can be considered to be closer to a firm than
for example an individual investor. As a result, these groups do not primarily need to
rely on financial statements in order to obtain financial information since it is easier for
them to contact the management and get information in a more direct way. Conse-
quently, more levered and more closely held firms have less incentives to provide high
quality disclosure in their financial statements. In that respect, the results suggest that
voluntary IFRS adoption goes along with an increase in disclosure quality for those
firms that typically have less incentives to provide high quality disclosure.
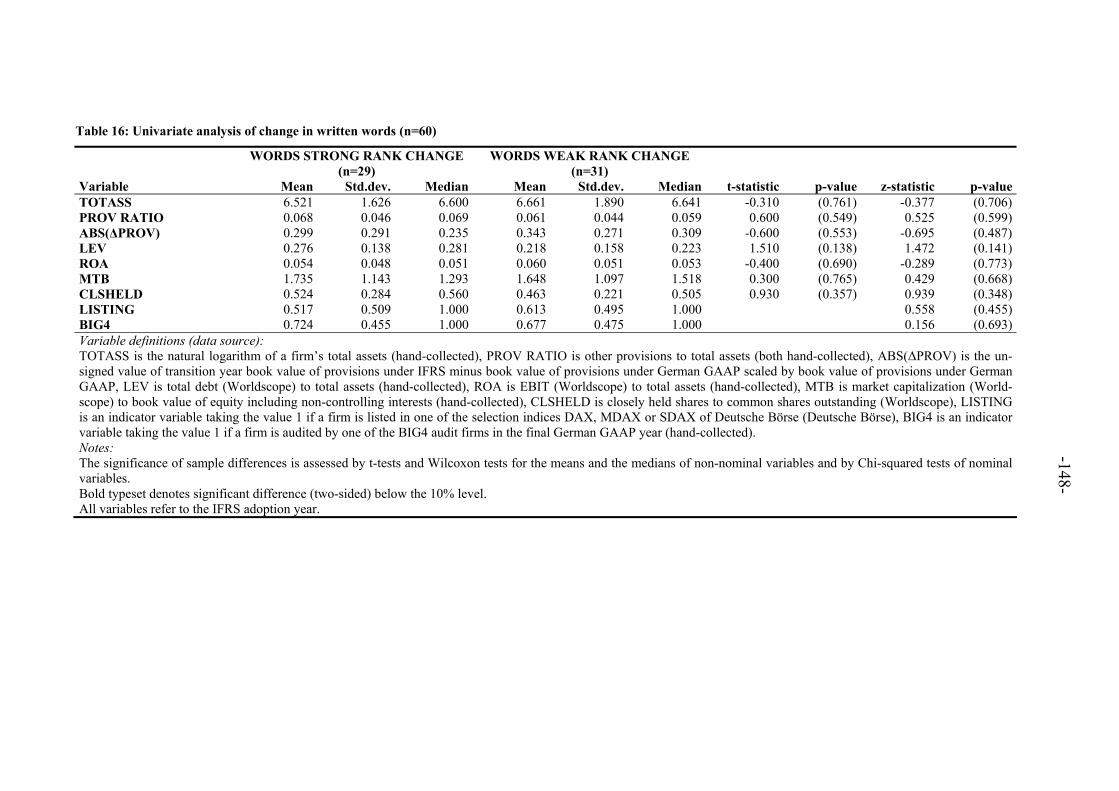
-148-
Table 16: Univariate analysis of change in written words (n=60)
WORDS STRONG RANK CHANGE
(n=29) WORDS WEAK RANK CHANGE
(n=31)
Variable Mean Std.dev. Median Mean Std.dev. Median t-statistic p-value z-statistic p-value TOTASS 6.521 1.626 6.600 6.661 1.890 6.641 -0.310 (0.761) -0.377 (0.706) PROV RATIO 0.068 0.046 0.069 0.061 0.044 0.059 0.600 (0.549) 0.525 (0.599) ABS(ΔPROV) 0.299 0.291 0.235 0.343 0.271 0.309 -0.600 (0.553) -0.695 (0.487) LEV 0.276 0.138 0.281 0.218 0.158 0.223 1.510 (0.138) 1.472 (0.141) ROA 0.054 0.048 0.051 0.060 0.051 0.053 -0.400 (0.690) -0.289 (0.773) MTB 1.735 1.143 1.293 1.648 1.097 1.518 0.300 (0.765) 0.429 (0.668) CLSHELD 0.524 0.284 0.560 0.463 0.221 0.505 0.930 (0.357) 0.939 (0.348) LISTING 0.517 0.509 1.000 0.613 0.495 1.000 0.558 (0.455) BIG4 0.724 0.455 1.000 0.677 0.475 1.000 0.156 (0.693) Variable definitions (data source): TOTASS is the natural logarithm of a firm’s total assets (hand-collected), PROV RATIO is other provisions to total assets (both hand-collected), ABS(ΔPROV) is the un-signed value of transition year book value of provisions under IFRS minus book value of provisions under German GAAP scaled by book value of provisions under German GAAP, LEV is total debt (Worldscope) to total assets (hand-collected), ROA is EBIT (Worldscope) to total assets (hand-collected), MTB is market capitalization (World-scope) to book value of equity including non-controlling interests (hand-collected), CLSHELD is closely held shares to common shares outstanding (Worldscope), LISTING is an indicator variable taking the value 1 if a firm is listed in one of the selection indices DAX, MDAX or SDAX of Deutsche Börse (Deutsche Börse), BIG4 is an indicator variable taking the value 1 if a firm is audited by one of the BIG4 audit firms in the final German GAAP year (hand-collected). Notes: The significance of sample differences is assessed by t-tests and Wilcoxon tests for the means and the medians of non-nominal variables and by Chi-squared tests of nominal variables. Bold typeset denotes significant difference (two-sided) below the 10% level. All variables refer to the IFRS adoption year.
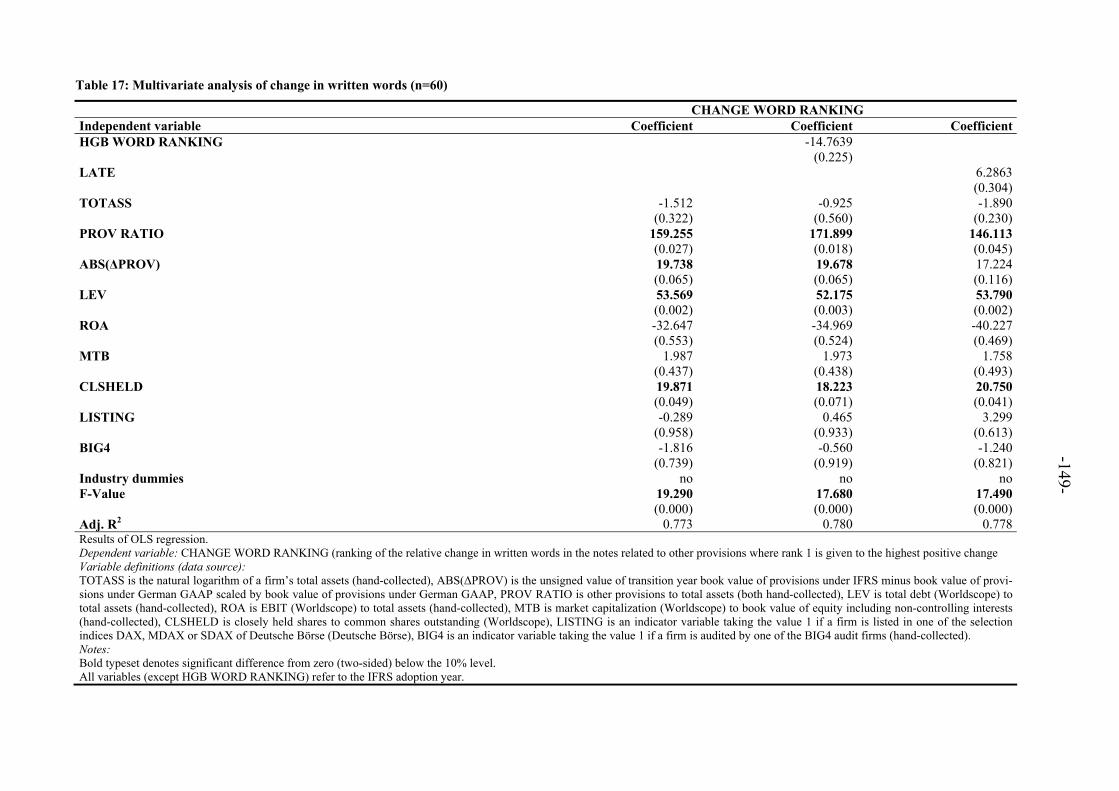
-149-
Table 17: Multivariate analysis of change in written words (n=60)
CHANGE WORD RANKING Independent variable Coefficient Coefficient Coefficient HGB WORD RANKING -14.7639 (0.225) LATE 6.2863 (0.304) TOTASS -1.512 -0.925 -1.890 (0.322) (0.560) (0.230) PROV RATIO 159.255 171.899 146.113 (0.027) (0.018) (0.045) ABS(ΔPROV) 19.738 19.678 17.224 (0.065) (0.065) (0.116) LEV 53.569 52.175 53.790 (0.002) (0.003) (0.002) ROA -32.647 -34.969 -40.227 (0.553) (0.524) (0.469) MTB 1.987 1.973 1.758 (0.437) (0.438) (0.493) CLSHELD 19.871 18.223 20.750 (0.049) (0.071) (0.041) LISTING -0.289 0.465 3.299 (0.958) (0.933) (0.613) BIG4 -1.816 -0.560 -1.240 (0.739) (0.919) (0.821) Industry dummies no no no F-Value 19.290 17.680 17.490 (0.000) (0.000) (0.000) Adj. R2 0.773 0.780 0.778 Results of OLS regression. Dependent variable: CHANGE WORD RANKING (ranking of the relative change in written words in the notes related to other provisions where rank 1 is given to the highest positive change Variable definitions (data source): TOTASS is the natural logarithm of a firm’s total assets (hand-collected), ABS(ΔPROV) is the unsigned value of transition year book value of provisions under IFRS minus book value of provi-sions under German GAAP scaled by book value of provisions under German GAAP, PROV RATIO is other provisions to total assets (both hand-collected), LEV is total debt (Worldscope) to total assets (hand-collected), ROA is EBIT (Worldscope) to total assets (hand-collected), MTB is market capitalization (Worldscope) to book value of equity including non-controlling interests (hand-collected), CLSHELD is closely held shares to common shares outstanding (Worldscope), LISTING is an indicator variable taking the value 1 if a firm is listed in one of the selection indices DAX, MDAX or SDAX of Deutsche Börse (Deutsche Börse), BIG4 is an indicator variable taking the value 1 if a firm is audited by one of the BIG4 audit firms (hand-collected). Notes: Bold typeset denotes significant difference from zero (two-sided) below the 10% level. All variables (except HGB WORD RANKING) refer to the IFRS adoption year.
-150-
6 Summary and conclusion
This study investigates accounting quality based on provision disclosure around volun-
tary IFRS adoption. The topic that we address in this paper is important since the IFRS
play an outstandingly important role worldwide. Adoption of IFRS is particularly dis-
cussed in the light of an increase in accounting quality. Generally spoken, accounting
quality comprises the informativeness of reported numbers, the degree of compliance
with accounting rules and the level of disclosure (Cascino et al., 2010). Within this
study, we put our focus on compliance with disclosure requirements and on the level of
disclosure around accounting for provisions.
Taking advantage of a same firm-year approach reveals that the balance sheet item
‘other provisions’ is significantly smaller under IFRS compared to German GAAP. It is
not possible to clearly pinpoint the causes for this effect. Three causes are conceivable:
First, under IFRS, only obligations towards third parties are allowed to be recognized.
Second, unlike to the IFRS, recognition and measurement of provisions under German
GAAP is considered to be strongly driven by the prudence principle. Third, transactions
that are regularly subsumed as accruals under IFRS are regularly reported as other pro-
visions under German GAAP.
Our main focus lies on disclosure related to other provisions. We are particularly inter-
ested in compliance with disclosure requirements and the level of disclosure. We docu-
ment that compliance is lower under IFRS than under German GAAP. We do not draw
further conclusions from this observation since German GAAP and IFRS requirements
are profoundly different from each other. Non-compliance under German GAAP pri-
marily stems from violating para. 266 which puts restrictions on the classification of
provisions in the balance sheet. This is the reason why we restrict the analysis concern-
-151-
ing compliance to that paragraph. Our results suggest that compliant firms are signifi-
cantly smaller, less closely held and have a higher provision ratio. Non-compliance un-
der IFRS primarily stems from the restrictive requirements of IAS 37.85. As our results
reveal, no firm cumulatively fulfills requirements of IAS 37.85. On the other hand, most
firms comply with the requirements of IAS 37.84. Subsequently, we focus on compli-
ance with IAS 1 that also deals with classification of provisions in the balance sheet.
Our multivariate analysis shows that compliant firms are smaller, have a higher provi-
sion ratio and are more often audited by a BIG4 audit firm. Overall, results under Ger-
man GAAP are quite comparable with those under IFRS. We explain our results by the
circumstance that bigger firms tend to disclose more information related to their provi-
sions in the notes while being less extensive in their balance sheet. An additional test
suggests that firms that complied with para. 266 are also more likely to comply with
IAS 1.
In order to assess disclosure level, we construct an index where each item of the meas-
ure is supposed to capture a comparable counterpart under German GAAP and IFRS.
We find that IFRS adoption leads to a significant increase in the level of disclosure in
our sample. Breaking down the disclosure index shows that under IFRS, more firms
have a higher disclosure index because they exceed the classification requirements in
the balance sheet, make a separation into current and non-current provisions in the bal-
ance sheet and quantify other provisions in the notes. Low variation in the disclosure
index prevents to specify meaningful regressions. Hence, we draw on the number of
words written in the notes related to other provisions in order to find a reasonable proxy
for the level of disclosure. Again, we find a significant increase under IFRS compared
to German GAAP. Disclosure level under German GAAP is positively and significantly
driven by size and being audited by a BIG4 audit firm. Both observations are not un-
-152-
common in the disclosure literature; while the finding concerning size is not unequivo-
cally interpretable, the finding concerning the auditor suggests that bigger audit firms
either provide more profound knowledge into the statement preparation process or are
more powerful in influencing disclosure decisions. The circumstance that disclosure
level is negatively and significantly associated with profitability under IFRS might re-
flect a strategic motive.
Our study gives some interesting insights into accounting for provisions and IFRS adop-
tion. As already suggested by prior literature, our results demonstrate that non-
compliance is a prevalent issue in accounting under IFRS (Street and Bryant, 2000;
Street and Gray, 2001; Glaum and Street, 2003). Compliance with German GAAP dis-
closure requirements is higher for our sample firms. The lower compliance under IFRS
needs to be seen in light of more detailed disclosure requirements. Notably, a closer
look reveals that non-compliance concerning accounting for provisions primarily stems
from missing qualitative information. In stark contrast to the quantitative disclosure
requirements of IAS 37.84, no firm cumulatively fulfills the qualitative requirements of
IAS 37.85. Non-compliance with this item can be traced back to the circumstance that
only 22 firms report on the expected timing of resulting outflows of economic benefits
and only one firm reports on uncertainty about the amount or timing of those outflows.
Only four firms report on the amount of any expected reimbursement. Apparently, firms
are either unwilling to provide these kind of information or it is difficult to do so. With
regard to the level of disclosure, we find an increase with IFRS adoption. In this respect,
it is notable that the increase in the disclosed information can be traced back to the cir-
cumstance that firms disclose more quantitative information and report more words re-
lating to provisions in the notes. In so far, the increase in disclosure level clearly stems

-153-
from the circumstance that the IFRS requirements are more explicit than under German
GAAP.
Accounting quality can be considered under the angle of the informativeness of reported
numbers, the degree of compliance with accounting rules and the level of disclosure.
Against this background, our study puts the focus on compliance with disclosure re-
quirements and the level of disclosure related to other provisions. We find that compli-
ance under IFRS is significantly lower than under German GAAP. This finding points
towards a decrease in accounting quality, particularly with regard to comparability of
disclosure between IFRS firms. This finding needs to be put into perspective against the
finding that disclosure level is significantly higher under IFRS. On a first glance, this
would be in line with the notion that IFRS provide more decision-useful information,
though, our test design does not allow to make such an inference. It should be especially
kept in mind that usefulness of disclosure and disclosure requirements are not necessar-
ily aligned. An example for this is disclosure concerning whether the amount by which
other provisions are underfunded is provided. While several voices in the literature
deem this an important useful piece of information, only one sample firm provides it in
its notes.
Our study suggests that compliance with disclosure requirements and that disclosure
level are negatively associated with being more closely held under German GAAP. This
finding does not persist under IFRS. Furthermore, our change analysis of disclosure
(measured by written words) reveals that positive changes are significantly more pro-
nounced for firms where the importance of provisions is more important and where the
IFRS adoption has a higher impact on provisions. While these findings suggest that im-
provement is driven by the relative importance of the line item, the results also reveal
-154-
that positive changes are stronger for firms that are more closely held and more levered.
Under the assumption that our proxy captures accounting quality and not noise, this
result is in line with the notion that IFRS adoption leads to an increase in accounting
quality especially for those firms that typically have fewer incentives to provide ac-
counting information for a broad investor basis. Yet, particularly this finding might be
driven by a self-selection process of firms inclined to provide more information. Ex-
tending our research to mandatory IFRS appliers would be a natural next step.
Our results need cautious interpretation in the light of some restricting circumstances.
First, our results apply to voluntary IFRS adopters. Prior literature documents that vol-
untary and mandatory adopters are different from each other (Christensen, Lee and
Walker, 2008). This aspect might be particularly important in our setting since IFRS
adoption is regularly discussed in the light to provide more recipients with information
of higher accounting quality. Consequently, our result suggesting that IFRS provide
more information with regard to provision accounting might be much less pronounced
or even non-existent for mandatory IFRS appliers. Second, we examine a single item of
the balance sheet. We consider this as a strength of the study since it allows us to con-
struct clear-cut measures that arise naturally from the standards and to hand-collect data
which guarantees that our data fulfills the criteria that we put on our measures. Yet, this
also implies that all our conclusions are restricted to one balance sheet item: other pro-
visions. Third, we conduct a small sample investigation which clearly reduces the
power of statistical tests. Fourth, the application of our results to other countries might
be restricted especially since Germany was among the first countries to allow voluntary
adoption of IFRS. Fifth, observed adoption effects might be biased because the sample
firms aspired to align German GAAP accounting towards the upcoming IFRS adoption.
However, this would result in finding less differences in our measures. Finally, while it

-155-
is a benefit that accounting for provisions was not subject of changes in our sample pe-
riod, firms could apply SIC-8 or IFRS 1. The latter is less restrictive with regard to the
principle of the retrospective application of all IAS/IFRS. We do not consider possible
effects that arise from following the one or the other.
-156-
References
Ashbaugh, H. and Warfield, T. D. (2003), Audits as a Corporate Governance Mecha-
nism: Evidence from the German Market, Journal of International Accounting
Research, Vol. 2, pp. 1-21.
Barth, M. E., Landsman, W. R. and Lang, M. H. (2008), International Accounting Stan-
dards and Accounting Quality, Journal of Accounting Research, Vol. 46, pp.
467-498.
Bartov, E., Goldberg, S. R. and Kim, M. (2005), Comparative value relevance among
German, U.S. and International Accounting Standards: A German stock market
perspective, Journal of Accounting, Auditing and Finance, Vol. 20, pp. 95-119.
Botosan, C. A. (1997), Disclosure Level and the Cost of Equity Capital, The Accounting
Review, Vol. 72, pp. 323-349.
Burger, A., Fröhlich, J. and Ulbrich, P. (2004), Die Auswirkungen der Umstellung von
HGB auf IFRS auf wesentliche Kennzahlen der externen Unternehmensrech-
nung, Zeitschrift für internationale und kapitalmarktorientierte Rechnungsle-
gung, Vol. 4, pp. 353-366.
Burger, A., Schäfer, S., Ulbrich, P. and Zeimes, M. (2005), Die Umstellung der Rech-
nungslegung nach IFRS 1 – Empirische Analyse und Bewertung der Neurege-
lungen zur Erstanwendung der IFRS –, Die Wirtschaftsprüfung, Vol. 58, pp.
1193-1200.
Cascino, S. and Gassen, J. (2010), Mandatory IFRS adoption and accounting compara-
bility, Working Paper.
Cascino, S., Pugliese, A., Mussolino, D. and Sansone, C. (2010), The Influence of Fam-
ily Ownership on the Quality of Accounting Information, Family Business Re-
view, Vol. 23, pp. 246-265.
Chen, H., Tang, Q., Jiang, Y. and Lin, Z. (2010), The Role of International Financial
Reporting Standards in Accounting Quality: Evidence from the European Union,
Journal of International Financial Management & Accounting, Vol. 21, pp. 220-
278.

-157-
Chow, C. W. and Wong-Boren, Adrian (1987), Voluntary Financial Disclosure by
Mexican Corporations, The Accounting Review, Vol. 62, pp. 533-541.
Christensen, H. B., Lee, E. and Walker, M. (2008), Incentives or standards: What de-
termines accounting quality changes around IFRS adoption?, Working Paper.
Clarkson, P., Hanna, J. D., Richardson, G. D. and Thompson, R. (2010), The Impact of
IFRS Adoption on the Value Relevance of Book Value and Earnings, Working
Paper.
Cooke, T. E. (1989), Voluntary Corporate Disclosure by Swedish Companies, Journal
of International Financial Management and Accounting, Vol. 1, pp. 171-195.
Cooke, T. E. and Wallace, R. S. O. (1989), Global Surveys of Corporate Disclosure
Practices and Audit Firms: A Review Essay, Accounting and Business Research,
Vol. 20, pp. 47-57.
Cuijpers, R. and Buijink, W. (2005), Voluntary adoption of non-local GAAP in the
European Union: A study of determinants and consequences, European Ac-
counting Review, Vol. 14, pp. 487-524.
Dhaliwal, D. S. (1980), The Effect of the Firm’s Capital Structure on the Choice of Ac-
counting Methods, The Accounting Review, Vol. 55, pp. 78-84.
Daske, H. and Gebhardt, G. (2006), International financial reporting standards and ex-
perts’ perceptions of disclosure quality, Abacus, Vol. 42, pp. 461-498.
Daske, H., Hail, L., Leuz, C. and Verdi, R. S. (2009), Adopting a Label: Heterogeneity
in the Economic Consequences of IFRS Adoptions, Working Paper.
Dumontier, P. and Raffournier, B. (1998), Why firms comply voluntarily with IAS: An
empirical analysis with Swiss data, Journal of International Financial Manage-
ment and Accounting, Vol. 9, pp. 216-245.
European Commission (2002), Regulation (EC) No. 1606/2002 of the European Parlia-
ment and of the Council of 19 July 2002 on the Application of International Ac-
counting Standards, Official Journal L 243, 11/09/2002, pp. 1-4.
Francis, J., LaFond, R., Olsson, P. M. and Schipper, K. (2004), Cost of equity and earn-
ings attributes, The Accounting Review, Vol. 79, pp. 967-1010.

-158-
Friederich, R. and Schmidt, J. (2008), Die Bilanzierung von Rückstellungen nach IAS
37, Zeitschrift für internationale Rechnungslegung, Vol. 3, pp. 391-392.
Förschle, G., Kroner, M. and Heddäus, B. (1999), Ungewisse Verpflichtungen nach IAS
37 im Vergleich zum HGB, Die Wirtschaftsprüfung, Vol. 52, pp. 41-54.
Gassen, J. and Sellhorn, T. (2006), Applying IFRS in Germany - Determinants and
Consequences, Betriebswirtschaftliche Forschung und Praxis, Vol. 58, pp. 365-
386.
German Federal Ministry of Justice (2008), Gesetzentwurf der Bundesregierung, Gesetz
zur Modernisierung des Bilanzrechts (Bilanzrechtsmodernisierungsgesetz –
BilMoG).
Ghicas, D. C. (2003), A discussion of the paper “The Quality of Neuer Markt Quarterly
Reports - An Empirical Investigation” by Anne d’Arcy and Sonja Grabensber-
ger, The International Journal of Accounting, Vol. 38, pp. 347-350.
Glaum, M. and Street, D. L. (2003), Compliance with the Disclosure Requirements of
Germany’s New Market: IAS Versus U.S. GAAP, Journal of International Fi-
nancial Management and Accounting, Vol. 14, pp. 64-100.
Goncharov, I. and Zimmermann, J. (2007), Do Accounting Standards Influence the
Level of Earnings Management? Evidence from Germany, Die Unternehmung,
Vol. 61, pp. 371-388.
Hribar, P., Kravet, T. and Wilson, R. (2010), A New Measure of Accounting Quality,
Working Paper.
Hodgdon, C., Tondkar, R. H., Harless, D. W. and Adhikari, A. (2008), Compliance with
IFRS disclosure requirements and individual analysts’ forecast errors, Journal of
International Accounting, Auditing and Taxation, Vol. 17, pp. 1-13.
Hung, M. and Subramanyam, K. R. (2007), Financial statement effects of adopting in-
ternational accounting standards: the case of Germany, Review of Accounting
Studies, Vol. 12, pp. 623-657.
Imhoff, E. A., Jr. (1992), The relation between perceived accounting quality and eco-
nomic characteristics of the firm, Journal of Accounting and Public Policy, Vol.
11, pp. 97-118.

-159-
IASCF (2009), Who we are and what we do, London.
Jonas, G. J. and Blanchet, J. (2000), Assessing Quality of Financial Reporting, Account-
ing Horizons, Vol. 14, pp. 353-363.
Jödicke, D. (2009), Einfluss kultureller Unterschiede auf die Anwendung internationaler
Rechnungslegungsregeln - Eine theoretische und empirische Untersuchung zur
Anwendung der IFRS in Deutschland, Frankreich und UK, Verlag Dr. Kovac,
Hamburg.
Kayser, M. (2002), Ansatz und Bewertung von Rückstellungen nach HGB, US-GAAP
und IAS, Shaker Verlag, Aachen.
Leker, J., Mahlstedt, D. and Kehrel, U. (2008), Auswirkungen der IFRS-
Rechnungslegungsumstellung auf das Jahresabschlussbild, Zeitschrift für inter-
nationale und kapitalmarktorientierte Rechnungslegung, Vol. 8, pp. 379-388.
Leuz, C. and Wüstemann, J. (2004), The Role of Accounting in the German Financial
System, in: Krahnen, J. and Schmidt, R. (ed.), The German Financial System,
Oxford University Press, Oxford, pp. 450-481.
Marston, C. L. and Shrives, P. J. (1991), The use of disclosure indices in accounting
research: A review article, The British Accounting Review, Vol. 23, pp. 195-210.
Meek, G. K., Roberts, C. B. and Gray, S. J. (1995), Factors influencing voluntary an-
nual report disclosures by U.S., U.K. and continental European multinational
corporations, Journal of International Business Studies, Vol. 26, pp. 555-572.
Moxter, A. (1999), Rückstellungen nach IAS: Abweichungen vom geltenden deutschen
Bilanzrecht, Betriebs-Berater, Vol. 54., pp. 519-525.
Paananen, M. and Lin, H. (2009), The Development of Accounting Quality of IAS and
IFRS over Time: The Case of Germany, Journal of International Accounting
Research, Vol. 8, pp. 31-55.
Robbins, W. A. and Austin, K. R. (1986), Disclosure Quality in Governmental Financial
Reports: An Assessment of the Appropriateness of a Compound Measure, Jour-
nal of Accounting Research, Vol. 24, pp. 412-421.
PWC (2009), IFRS adoption by country, http://www.pwc.com/en_US/us/issues/ifrs-
reporting/assets/ifrs_country_adoption.pdf (01.02.2011).

-160-
Raffournier, B. (1995), The determinants of voluntary financial disclosure by Swiss
listed companies, European Accounting Review, Vol. 4, pp. 261-280.
Rüdinger, A. (2004), Regelungsschärfe bei Rückstellungen, Deutscher Universitätsver-
lag, Wiesbaden.
Schipper, K. and Vincent, L. (2003), Earnings quality, Accounting Horizons, Vol. 17,
pp. 97-110.
Singhvi, S. S. and Desai, H. B. (1971), An Empirical Analysis of the Quality of Corpo-
rate Financial Disclosure, The Accounting Review, Vol. 46, pp. 129-138.
Soderstrom, N. S. and Sun, K. J. (2007), IFRS Adoption and Accounting Quality: A
Review, European Accounting Review, Vol. 16, pp. 675-702.
Street, D. L. and Bryant, S. M. (2000), Disclosure Level and Compliance with IASs: A
Comparison of Companies With and Without U.S. Listings and Filings, The In-
ternational Journal of Accounting, Vol. 35, pp. 305-329.
Street, D. L. and Gray, S. J. (2001), Observance of international accounting standards:
Factors explaining non-compliance, ACCA Research Report No. 74.
Street, D. L., Gray, S. J. and Bryant, S. M. (1999), Acceptance and Observance of In-
ternational Accounting Standards: An empirical study of companies claiming to
comply with IASs, The International Journal of Accounting, Vol. 34, pp. 11-48.
Torklus, A. von (2007), Rückstellungen nach internationalen Normen: eine theoretische
und empirische Analyse, IDW-Verlag, Düsseldorf.
Van Tendeloo, B. and Vanstraelen, A. (2005), Earnings management under German
GAAP versus IFRS, European Accounting Review, Vol. 14, pp. 155-180.
Verriest, A., Gaeremynck, A. and Thornton, D. B. (2009), Quality of IFRS Adoption,
Working paper.
Wagenhofer, A. (1990), Voluntary Disclosure with a Strategic Opponent, Journal of
Accounting and Economics, Vol. 12, pp. 341-363.
Watts, R. L. and Zimmerman, J. L. (1986), Positive Accounting Theory, Edgewood
Cliffs, Prentice Hall, London.

-161-
Zwirner, C., Ranker, D. and Wohlgemuth, F. (2001), Rechnungslegung am Neuen
Markt, – Grundlagen, Anforderungen und Auswertung –, Steuer- und Bilanzpra-
xis, Vol. 3, pp. 473-483.
-162-
Appendix A: Derivation of accounting quality indices
Background on the derivation of the accounting quality indices
Following Torklus (2007), we consider several aspects in the derivation of the account-
ing quality indices: First, a possible weighting of each item of the index. We weight
each item of the indices equally because weighting causes a loss of objectivity (Dhali-
wal, 1980; Cooke, 1989). Second, in some cases it is difficult to assess whether the cri-
teria and requirements we demand with regard to voluntary and mandatory disclosure
are met. Generally, variables capturing quantitative information are easier to assess. We
regard these variables to be true if corresponding amounts are presented in the state-
ment. Variables capturing qualitative information are more difficult to assess uniformly.
We attack this issue to some extent by relying on search strings we defined prior to the
data collection.1 Third, we are aware that not provided information does not imply that
accounting rules have been violated. For example, a firm that does not provide informa-
tion about the impact of interest is not considered as a violator when it does not provide
data with regard to the expected timing of outflows in the financial statement or whether
the time value of money is material. In cases of doubt, this procedure is in favor of the
firm (Cooke, 1989; Street and Gray, 2001; Ghicas, 2003; Glaum and Street, 2003). Pos-
sible ambiguous disclosure was discussed among the coders and could be resolved in
any case.
Derivation of the compliance index
Background on the compliance index
The purpose of the compliance index is to capture a firm’s compliance with explicit
requirements under German GAAP as well as under IFRS. These requirements may
1 For example, we use this method when assessing conformity with items of IAS 37.85.

-163-
concern classification requirements of other provisions in the balance sheet or additional
information in the notes. Since IFRS requirements are more explicit under IFRS, the
IFRS index consists of more items than the German GAAP index. An illustration and a
detailed description of each index is provided below.
Compliance index under German GAAP
The compliance index under German GAAP comprises two items and is calculated as
follows:
2
266 EQUALITATIVHGBCOMPLIANCE
German GAAP requires the preparer of a financial statement to provide two mandatory
pieces of information related to other provisions. First, the classification of provisions
needs to follow the classification of para. 266 HGB. Accordingly, a firm’s balance sheet
needs to separately disclose other provisions, provisions for taxes and provisions for
pensions. Further, provisions need to be disclosed between the items equity and certain
liabilities. The indicator variable HGB266 takes the value one if a firm complies with
this requirement.
QUALITATIVE
IAS1
IAS37.84
IAS37.85
Refers to classification in the balance sheet
Refers to disclosure in the notesRefers to quantitative information
as requested in IAS 37.84
Refers to qualitative information
as requested in IAS 37.85
HGB266
GERMAN-GAAP IFRS
QUALITATIVE
IAS1
IAS37.84
IAS37.85
Refers to classification in the balance sheet
Refers to disclosure in the notesRefers to quantitative information
as requested in IAS 37.84
Refers to qualitative information
as requested in IAS 37.85
HGB266
GERMAN-GAAP IFRS
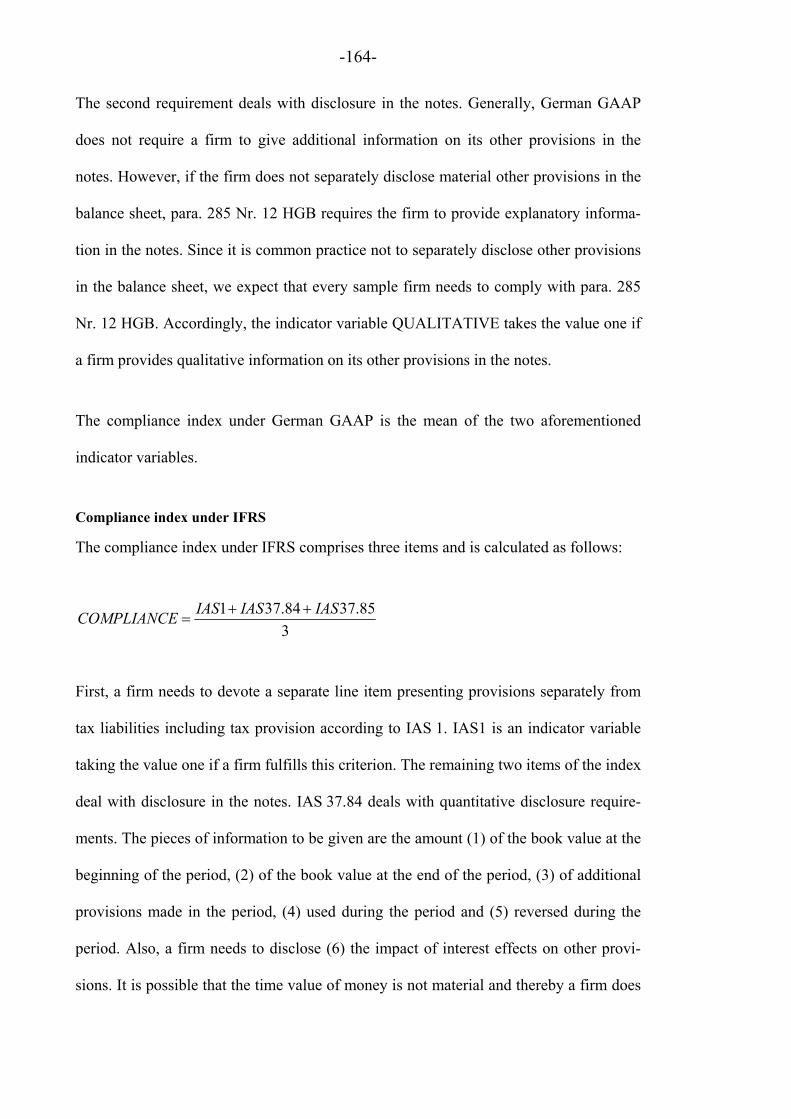
-164-
The second requirement deals with disclosure in the notes. Generally, German GAAP
does not require a firm to give additional information on its other provisions in the
notes. However, if the firm does not separately disclose material other provisions in the
balance sheet, para. 285 Nr. 12 HGB requires the firm to provide explanatory informa-
tion in the notes. Since it is common practice not to separately disclose other provisions
in the balance sheet, we expect that every sample firm needs to comply with para. 285
Nr. 12 HGB. Accordingly, the indicator variable QUALITATIVE takes the value one if
a firm provides qualitative information on its other provisions in the notes.
The compliance index under German GAAP is the mean of the two aforementioned
indicator variables.
Compliance index under IFRS
The compliance index under IFRS comprises three items and is calculated as follows:
3
85.3784.371 IASIASIASCOMPLIANCE
First, a firm needs to devote a separate line item presenting provisions separately from
tax liabilities including tax provision according to IAS 1. IAS1 is an indicator variable
taking the value one if a firm fulfills this criterion. The remaining two items of the index
deal with disclosure in the notes. IAS 37.84 deals with quantitative disclosure require-
ments. The pieces of information to be given are the amount (1) of the book value at the
beginning of the period, (2) of the book value at the end of the period, (3) of additional
provisions made in the period, (4) used during the period and (5) reversed during the
period. Also, a firm needs to disclose (6) the impact of interest effects on other provi-
sions. It is possible that the time value of money is not material and thereby a firm does

-165-
not need to make such a disclosure. Consequently, we distinguish between cases where
disclosure is necessary and given, and disclosure is necessary but not given. We classify
a firm to be compliant with this piece of information where such disclosure is not neces-
sary and where we are not able to ascertain whether such disclosure would be necessary.
Since IAS 37.84 requests all these pieces of information, the indicator variable
IAS37.84 is one if a firm provides all these items.
IAS 37.85 deals with qualitative disclosure requirements. The pieces of information to
be given concern (1) the nature of the obligation, (2) the expected timing of outflows,
(3) uncertainties about the amount or timing of outflows and finally (4) expected reim-
bursements. The indicator variable IAS37.85 takes the value one if a firm provides all
these items.
The compliance index under IFRS is the mean of the three aforementioned indicator
variables.
Derivation of the disclosure index
Background on the disclosure index
The purpose of the disclosure index is to capture a firm’s disclosure level under German
GAAP and under IFRS. While the advantage of the compliance index lies in its prox-
imity to the accounting rules, it has two downfalls in our endeavor to compare both ac-
counting regimes with regard to disclosure level. First, the compliance index under
German GAAP comprises less items than under IFRS. Additionally, the requirements
under German GAAP are less restrictive since the IFRS requirements need to be ful-
filled cumulatively. Consequently, reaching high compliance under German GAAP is
easier than under IFRS. Second, the compliance index does not reflect whether dis-
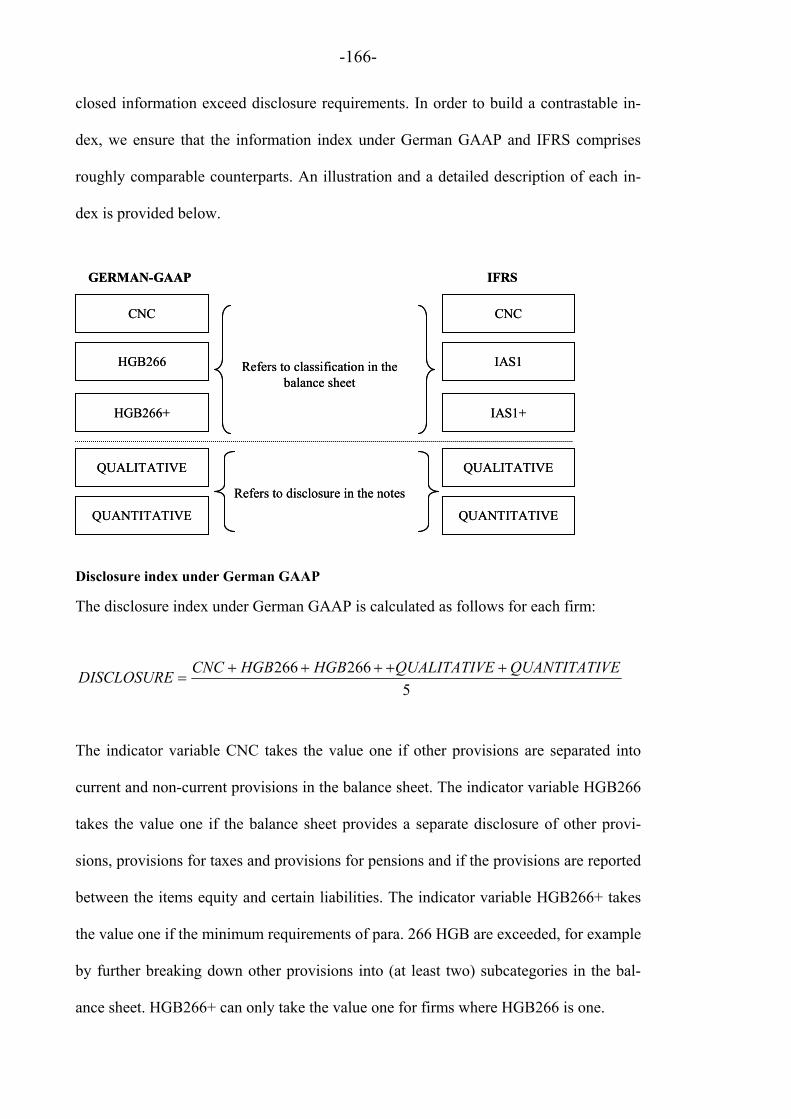
-166-
closed information exceed disclosure requirements. In order to build a contrastable in-
dex, we ensure that the information index under German GAAP and IFRS comprises
roughly comparable counterparts. An illustration and a detailed description of each in-
dex is provided below.
Disclosure index under German GAAP
The disclosure index under German GAAP is calculated as follows for each firm:
5
266266 VEQUANTITATIEQUALITATIVHGBHGBCNCDISCLOSURE
The indicator variable CNC takes the value one if other provisions are separated into
current and non-current provisions in the balance sheet. The indicator variable HGB266
takes the value one if the balance sheet provides a separate disclosure of other provi-
sions, provisions for taxes and provisions for pensions and if the provisions are reported
between the items equity and certain liabilities. The indicator variable HGB266+ takes
the value one if the minimum requirements of para. 266 HGB are exceeded, for example
by further breaking down other provisions into (at least two) subcategories in the bal-
ance sheet. HGB266+ can only take the value one for firms where HGB266 is one.
CNC
HGB266+
Refers to classification in thebalance sheet
Refers to disclosure in the notes
HGB266
QUALITATIVE
QUANTITATIVE
CNC
IAS1+
IAS1
QUALITATIVE
QUANTITATIVE
GERMAN-GAAP IFRS
CNC
HGB266+
Refers to classification in thebalance sheet
Refers to disclosure in the notes
HGB266
QUALITATIVE
QUANTITATIVE
CNC
IAS1+
IAS1
QUALITATIVE
QUANTITATIVE
GERMAN-GAAP IFRS

-167-
The other two items refer to disclosure in the notes. The indicator variable QUALITA-
TIVE takes the value one if a firm provides qualitative information in the notes. The
indicator variable QUANTITATIVE takes the value one if a firm provides quantitative
information in the notes.
DISCLOSURE is the mean of the five aforementioned indicator variables.
Disclosure index under IFRS
The disclosure index under IFRS is calculated as follows:
5
11 VEQUANTITATIEQUALITATIVIASIASCNCDISCLOSURE
The indicator variable CNC takes the value one if other provisions are separated into
current and non-current provisions in the balance sheet. The indicator variable IAS1
takes the value one, if the balance sheet shows at least a separate line item presenting
provisions separately from tax liabilities including tax provisions. The indicator variable
IAS1+ assesses whether the balance sheet classification exceeds requirements of IAS 1.
It takes the value one if a firm exceeds the classification requirements, for example by
providing a separate line item for other provisions and pensions. IAS1+ can only take
the value one for firms where IAS1 is one.
The other two items refer to disclosure in the notes. The indicator variable QUALITA-
TIVE takes the value one if a firm provides qualitative information in the notes. The
indicator variable QUANTITATIVE takes the value one if a firm provides quantitative
information in the notes.
DISCLOSURE is the mean of the five aforementioned indicator variables.
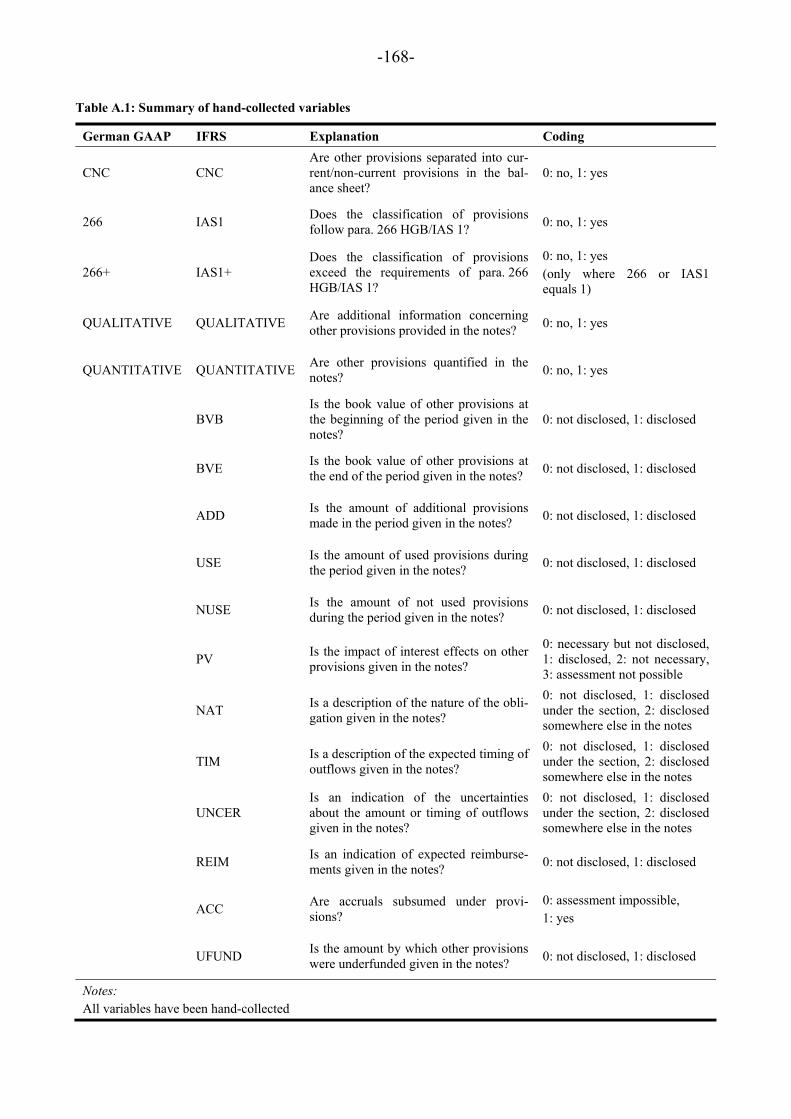
-168-
Table A.1: Summary of hand-collected variables
German GAAP IFRS Explanation Coding
CNC CNC Are other provisions separated into cur-rent/non-current provisions in the bal-ance sheet?
0: no, 1: yes
266 IAS1 Does the classification of provisions follow para. 266 HGB/IAS 1?
0: no, 1: yes
266+ IAS1+ Does the classification of provisions exceed the requirements of para. 266 HGB/IAS 1?
0: no, 1: yes (only where 266 or IAS1 equals 1)
QUALITATIVE QUALITATIVE Are additional information concerning other provisions provided in the notes?
0: no, 1: yes
QUANTITATIVE QUANTITATIVE Are other provisions quantified in the notes?
0: no, 1: yes
BVB Is the book value of other provisions at the beginning of the period given in the notes?
0: not disclosed, 1: disclosed
BVE Is the book value of other provisions at the end of the period given in the notes?
0: not disclosed, 1: disclosed
ADD Is the amount of additional provisions made in the period given in the notes?
0: not disclosed, 1: disclosed
USE Is the amount of used provisions during the period given in the notes?
0: not disclosed, 1: disclosed
NUSE Is the amount of not used provisions during the period given in the notes?
0: not disclosed, 1: disclosed
PV Is the impact of interest effects on other provisions given in the notes?
0: necessary but not disclosed, 1: disclosed, 2: not necessary, 3: assessment not possible
NAT Is a description of the nature of the obli-gation given in the notes?
0: not disclosed, 1: disclosed under the section, 2: disclosed somewhere else in the notes
TIM Is a description of the expected timing of outflows given in the notes?
0: not disclosed, 1: disclosed under the section, 2: disclosed somewhere else in the notes
UNCER Is an indication of the uncertainties about the amount or timing of outflows given in the notes?
0: not disclosed, 1: disclosed under the section, 2: disclosed somewhere else in the notes
REIM Is an indication of expected reimburse-ments given in the notes?
0: not disclosed, 1: disclosed
ACC Are accruals subsumed under provi-sions?
0: assessment impossible, 1: yes
UFUND Is the amount by which other provisions were underfunded given in the notes?
0: not disclosed, 1: disclosed
Notes: All variables have been hand-collected
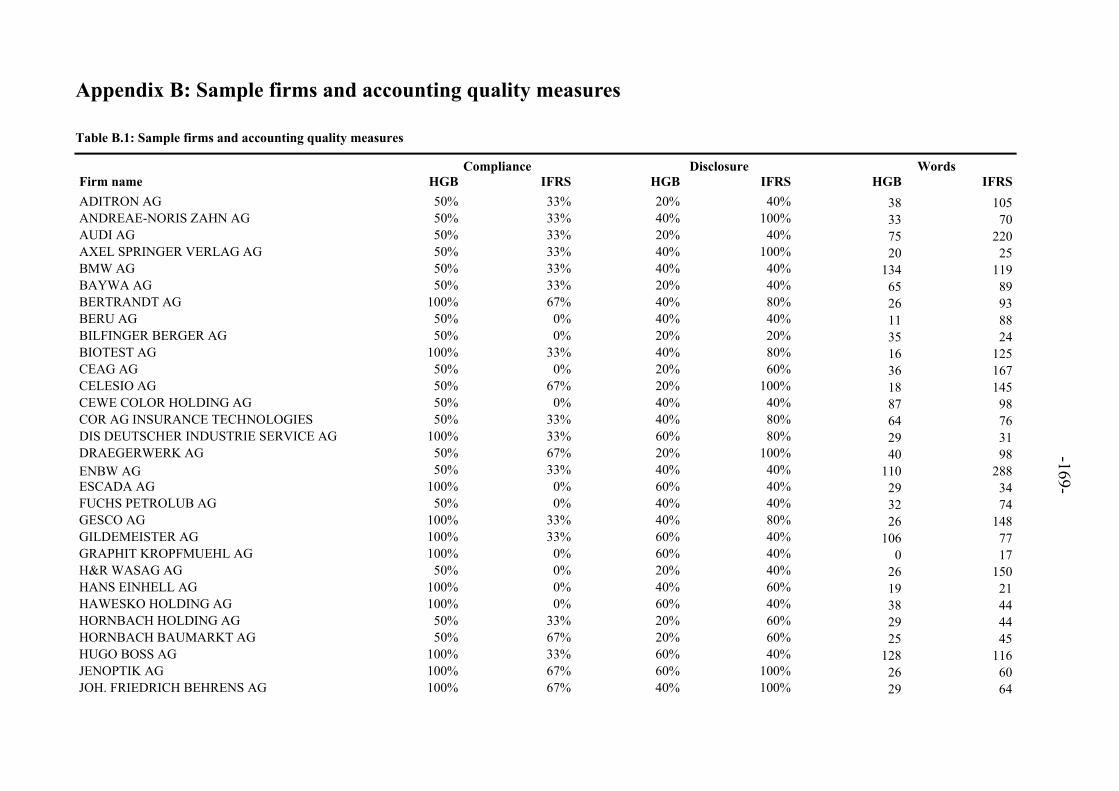
-169-
Appendix B: Sample firms and accounting quality measures
Table B.1: Sample firms and accounting quality measures
Compliance Disclosure Words Firm name HGB IFRS HGB IFRS HGB IFRS
ADITRON AG 50% 33% 20% 40% 38 105 ANDREAE-NORIS ZAHN AG 50% 33% 40% 100% 33 70 AUDI AG 50% 33% 20% 40% 75 220 AXEL SPRINGER VERLAG AG 50% 33% 40% 100% 20 25 BMW AG 50% 33% 40% 40% 134 119 BAYWA AG 50% 33% 20% 40% 65 89 BERTRANDT AG 100% 67% 40% 80% 26 93 BERU AG 50% 0% 40% 40% 11 88 BILFINGER BERGER AG 50% 0% 20% 20% 35 24 BIOTEST AG 100% 33% 40% 80% 16 125 CEAG AG 50% 0% 20% 60% 36 167 CELESIO AG 50% 67% 20% 100% 18 145 CEWE COLOR HOLDING AG 50% 0% 40% 40% 87 98 COR AG INSURANCE TECHNOLOGIES 50% 33% 40% 80% 64 76 DIS DEUTSCHER INDUSTRIE SERVICE AG 100% 33% 60% 80% 29 31 DRAEGERWERK AG 50% 67% 20% 100% 40 98 ENBW AG 50% 33% 40% 40% 110 288 ESCADA AG 100% 0% 60% 40% 29 34 FUCHS PETROLUB AG 50% 0% 40% 40% 32 74 GESCO AG 100% 33% 40% 80% 26 148 GILDEMEISTER AG 100% 33% 60% 40% 106 77 GRAPHIT KROPFMUEHL AG 100% 0% 60% 40% 0 17 H&R WASAG AG 50% 0% 20% 40% 26 150 HANS EINHELL AG 100% 0% 40% 60% 19 21 HAWESKO HOLDING AG 100% 0% 60% 40% 38 44 HORNBACH HOLDING AG 50% 33% 20% 60% 29 44 HORNBACH BAUMARKT AG 50% 67% 20% 60% 25 45 HUGO BOSS AG 100% 33% 60% 40% 128 116 JENOPTIK AG 100% 67% 60% 100% 26 60 JOH. FRIEDRICH BEHRENS AG 100% 67% 40% 100% 29 64
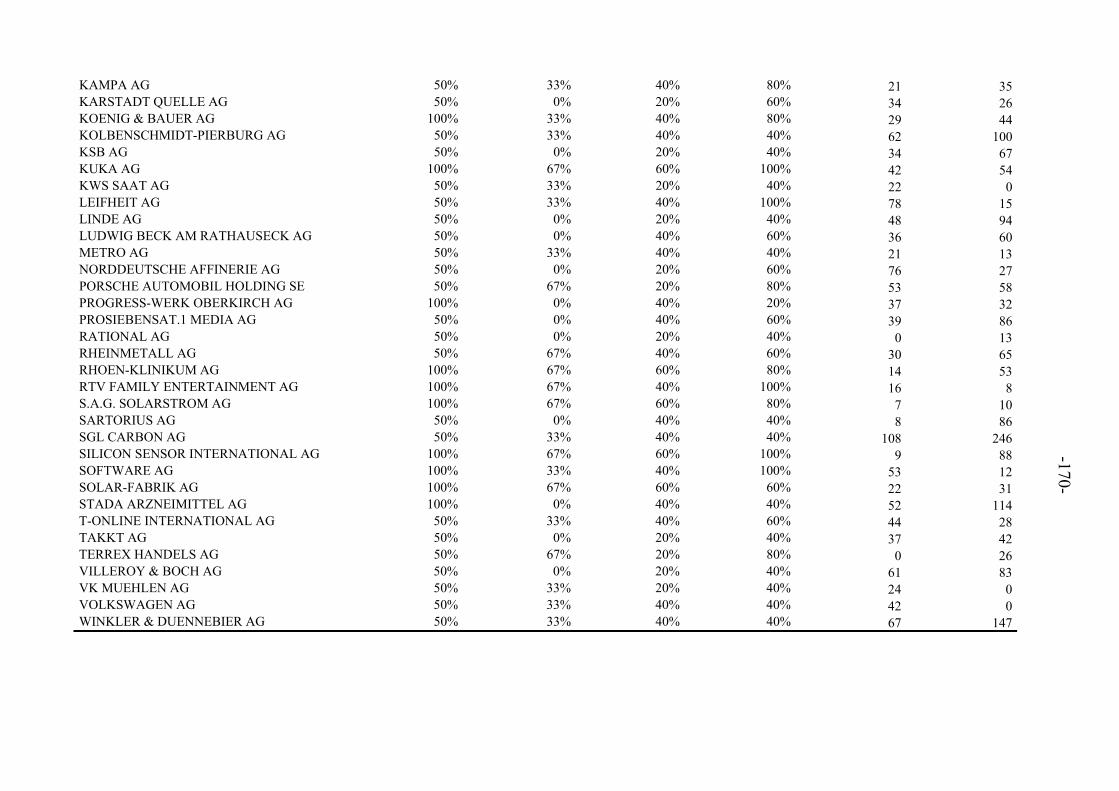
-170-
KAMPA AG 50% 33% 40% 80% 21 35 KARSTADT QUELLE AG 50% 0% 20% 60% 34 26 KOENIG & BAUER AG 100% 33% 40% 80% 29 44 KOLBENSCHMIDT-PIERBURG AG 50% 33% 40% 40% 62 100 KSB AG 50% 0% 20% 40% 34 67 KUKA AG 100% 67% 60% 100% 42 54 KWS SAAT AG 50% 33% 20% 40% 22 0 LEIFHEIT AG 50% 33% 40% 100% 78 15 LINDE AG 50% 0% 20% 40% 48 94 LUDWIG BECK AM RATHAUSECK AG 50% 0% 40% 60% 36 60 METRO AG 50% 33% 40% 40% 21 13 NORDDEUTSCHE AFFINERIE AG 50% 0% 20% 60% 76 27 PORSCHE AUTOMOBIL HOLDING SE 50% 67% 20% 80% 53 58 PROGRESS-WERK OBERKIRCH AG 100% 0% 40% 20% 37 32 PROSIEBENSAT.1 MEDIA AG 50% 0% 40% 60% 39 86 RATIONAL AG 50% 0% 20% 40% 0 13 RHEINMETALL AG 50% 67% 40% 60% 30 65 RHOEN-KLINIKUM AG 100% 67% 60% 80% 14 53 RTV FAMILY ENTERTAINMENT AG 100% 67% 40% 100% 16 8 S.A.G. SOLARSTROM AG 100% 67% 60% 80% 7 10 SARTORIUS AG 50% 0% 40% 40% 8 86 SGL CARBON AG 50% 33% 40% 40% 108 246 SILICON SENSOR INTERNATIONAL AG 100% 67% 60% 100% 9 88 SOFTWARE AG 100% 33% 40% 100% 53 12 SOLAR-FABRIK AG 100% 67% 60% 60% 22 31 STADA ARZNEIMITTEL AG 100% 0% 40% 40% 52 114 T-ONLINE INTERNATIONAL AG 50% 33% 40% 60% 44 28 TAKKT AG 50% 0% 20% 40% 37 42 TERREX HANDELS AG 50% 67% 20% 80% 0 26 VILLEROY & BOCH AG 50% 0% 20% 40% 61 83 VK MUEHLEN AG 50% 33% 20% 40% 24 0 VOLKSWAGEN AG 50% 33% 40% 40% 42 0 WINKLER & DUENNEBIER AG 50% 33% 40% 40% 67 147
-171-
Multiple board appointments and
firm performance - German evidence
Tolga Davarcioglu
Abstract: I investigate the effect of multiple board appointments on firm performance for a sample of publicly listed German firms. The incidence of multiple board appoint-ments is investigated from several angles since multiple board appointments can be characterized along numerous dimensions and their effect on firm performance is not unequivocally predictable. First, I contrast the Busyness Hypothesis versus the Reputa-tion Hypothesis. Busyness is measured by the number of additional board appointments while several director characteristics are used to measure reputation. Second, I examine the presence of directors featuring bank affiliations on firm performance. Directors are classified as bankers when they have an appointment on the board of a bank. Finally, I investigate the presence of directors featuring international board appointments on firm performance, and international activities, respectively. Directors are classified as inter-national when they have an appointment on a non-domestic board. A distinct feature of the study lies in characterizing the same directors along different dimensions. Although my results are mixed, I cautiously conclude that multiple board appointments negatively affect firm performance. Director characteristics that are expected to have a positive influence on firm performance do not counteract this finding.
Keywords: board of directors, multiple board appointments, interlocking directorates, firm performance, foreign sales
-172-
1 Introduction
This paper investigates the effect of multiple board appointments on firm performance
for a sample of publicly listed German firms. Multiple board appointments are per-
ceived to reduce the effectiveness of monitoring tasks (Bernhardt, 1994; Schwalbach,
2004). Brandeis (1914) formulates one reason for this perception as follows: “The prac-
tice of interlocking directorates is the root of many evils. It offends laws human and
divine. Applied to rival corporations, it tends to the suppression of competition and to
violation of the Sherman law. Applied to corporations which deal with each other, it
tends to disloyalty and to violation of the fundamental law that no man can serve two
masters. In either event it tends to inefficiency; for it removes incentive and destroys
soundness of judgment.” The German legislator also seems to regard multiple board
appointments as problematic since the German law restricts the number of appointments
on a supervisory board to ten or fifteen, respectively, if five are intergroup appoint-
ments. Internationally, different organizations propose different numbers of maximum
board appointments. For example, the Council of Institutional Investors suggests that a
director should not serve on more than five for-profit company boards. The number
should not exceed two for directors with full time jobs and one for the CEO (Council of
Institutional Investors, 2009). The Business Roundtable on the other hand does not
specify a limitation on the number of directorships but points towards the necessity to
reason whether accepting an additional board position might compromise present re-
sponsibilities (Business Roundtable, 2005).
Theory suggests competing explanations for the occurrence of directors holding multi-
ple directorships and the impact on firm performance (Loderer and Peyer, 2002). Multi-
ple board appointments come with a conflict of interest and time restraints for the direc-

-173-
tor to execute the job adequately and responsibly. On the other hand, the occurrence of
multiple board appointments might indicate that directors have a good reputation and
can draw on ample work experience and valuable networks that are beneficial for the
firm. The competing theoretical explanations are also reflected in empirical results (Fer-
ris, Jagannathan and Pritchard, 2003; Fich and Shivdasani, 2006).
The purpose of this paper is to investigate the effect of multiple board appointments on
firm performance where different perspectives are taken in order to characterize indi-
viduals holding multiple board appointments. The empirical investigation comprises
three parts. In the first part of the investigation, I contrast the Busyness Hypothesis ver-
sus the Reputation Hypothesis (Core, Holthausen and Larcker, 1999; Ferris, Jaganna-
than and Pritchard, 2003; Fich and Shivdasani, 2006). Under the Busyness Hypothesis,
directors with multiple board appointments are expected to have a negative impact on
firm performance since directors are likely to be overcommitted and thus not able to
fulfill their responsibilities due to time constraints. I follow the established approach to
measure busyness by a director’s number of board appointments. Under the Reputation
Hypothesis, multiple board appointments are the results of firms demanding skilled di-
rectors who are expected to enhance firm performance. I propose different measures in
order to proxy for director skills since director skills are hardly observable. For this pur-
pose, I identify whether an individual has been entrusted with the position to be the
chairman of a supervisory board (COS). I assume that this position is given to particu-
larly skilled and experienced individuals, and assess the impact of having several of
these individuals on a board. Taking into account that the CEO and the COS hold im-
portant positions in a firm, I also examine the effect that the sample firm’s CEO or COS
has multiple board appointments (Loderer and Peyer, 2002) on firm performance. Fi-
nally, I propose two scores in order to capture a board’s busyness and reputation. The
-174-
busyness score is designed with the purpose to account for which individual holds mul-
tiple appointments, i.e. the CEO, other management members, the COS or other super-
visory board members. At the same time, the score reflects the type of position held on
the other board. The reputation score aims at capturing the skills and experience that a
director provides to a board.
In the second part, I examine the relationship between bank representation on a firm’s
board and firm performance. Finding individuals that are a director on a bank’s man-
agement or supervisory board on a non-financial firm’s board is a common observation
(Dittmann, Maug and Schneider, 2010). Yet, reasons for or implications of this observa-
tion are controversial. Following the expertise argument, bank directors might provide
valuable advice especially in the area of financing or investing (Byrd and Miz-
ruchi, 2005). Alternatively, bank representatives might monitor equity or debt. A posi-
tion on a firm’s board allows close supervision of the management, gives access to im-
portant corporate information and thus, permits a better assessment of the firm’s finan-
cial situation (Kroszner and Strahan, 2001). Bank representatives might also use their
board position in order to promote bank related services (Dittmann, Maug and Schnei-
der, 2010). In so far, bank representation on non-financial firms and impact on firm per-
formance is non-trivial.
In the third and final part, I contribute to the existing literature by identifying board
members, who also serve on non-domestic boards and analyze the relationship with firm
performance. Drawing on this characteristic in order to shed light between the relation-
ship of firm performance is interesting as it neatly demonstrates the potential conflict
that is inherent to multiple board appointments (Graybow, 2008): “’Someone who has
exposure to other cultures and countries is probably helpful’ to have on boards, said

-175-
Charles Elson, director of the Weinberg Center for Corporate Governance at the Uni-
versity of Delaware. ‘The problem with it is, frankly, time and space.’” International
appointments are more time consuming since more traveling occurs, especially if trans-
atlantic flights are required. This might increase the chance that a director is not able to
attend board meetings or reduce the likelihood that the director actively participates in
committees. Also, directors will need to go through documents that in many cases will
not be their native language. Additional challenges may arise from differing accounting
and corporate governance rules. On the plus side, international directors might be help-
ful in providing a different and more sophisticated perspective on the economy of their
home country and on related institutional matters. Additionally, they might be helpful in
establishing a network abroad and to facilitate business relations. I assess the occurrence
of directors holding international appointments on firm performance. Furthermore, I
propose a more specific proxy. I examine whether these directors fulfill a strategic goal
by establishing ties to companies abroad and facilitating foreign operations measured by
foreign sales.
In order to answer my research question, I exploit the German setting. I consider it to be
especially suitable when addressing the effects of international board appointments.
Internationalization of the board is not as common as in other countries (Kuck, 2006).
This is partly attributable to the circumstance that a certain percentage of the supervi-
sory board has to consist of employee representatives which often implies that German
is the language of board meetings. Schmid and Daniel (2007) find that the management
and supervisory board’s degree of internationalization of the German DAX-30 firms
does not reflect their extensive international operations. This circumstance helps ensur-
ing enough variability in firms that have more and less internationalized boards. The
sample consists of 151 publicly listed German firms observed during 2004-2006.

-176-
My results do not allow an unequivocal interpretation. In the first part of the analysis, I
find mostly negative signs on my variables of interest. In this respect, my findings sup-
port the Busyness Hypothesis. However, I only find a statistical significant result for
multiple board appointments held by the sample firms’ chairmen. In the second part of
the investigation, I find a positive and non-significant impact of having directors featur-
ing bank affiliations on firm performance. In the last part, I find a negative and margin-
ally non-significant relationship between directors that feature international board ap-
pointments and firm performance. Overall, my results are in line with the notion that
directors having ulterior commitments are harmful for firm performance. However, the
results are not stable for alternative performance measures. Using return on assets and
return on sales partly yields positive signs on my variables of interest. In this respect,
my results suggest a difference in the effect of multiple board appointments on market
and accounting based performance measures.
From a broad perspective, this study contributes to a well-established literature dealing
with board structure (Hermalin and Weisbach, 1988; Fich and White, 2005; Linck, Net-
ter and Yang, 2008), multiple board appointments (Booth and Deli, 1996; Ferris and
Jagannathan, 2001) and consequences of multiple board appointments on corporate is-
sues like CEO compensation (Hallock, 1997; Fich and White, 2003), board meeting
attendance (Jiraporn et al., 2009) or board committee membership (Jiraporn, Singh and
Lee, 2009). More specifically, this study adds to a growing body of literature that inves-
tigates the relationship between firm performance and particular aspects and characteris-
tics of board directors like director diversity (Carter, Simkins and Simpson, 2003), di-
rector busyness (Ferris, Jagannathan and Pritchard, 2003; Fich and Shivdasani, 2006),
directors’ bank affiliations (Booth and Deli, 1999; Dittmann, Maug and Schneider,
2010), directors being employee and union representatives (Fauver and Fuerst, 2006),
-177-
gender diversity (Campbell and Mínguez-Vera, 2008; Adams and Feirrera, 2009), direc-
tors having political ties (Hillman, 2005) or the importance of directors’ social ties
(Hwang and Kim, 2009). Particularly, the paper complements concurrent research of
Masulis, Wang and Xie (2010) who investigate the presence of foreign independent
directors on corporate boards. They focus on the geographic location of directors and
their distance to a firm’s headquarter and how this affects a firm’s corporate governance
and performance. In this respect, the paper also adds to a literature stream highlighting
the importance of geographical distance on corporate aspects like dividend payout be-
havior (John, Knyazeva and Knyazeva, 2011), acquisition decisions (Uysal, Kedia and
Panchapagesan, 2008) or information gathering by board directors (Alam et al., 2010).
The remainder of the paper proceeds as follows. Section 2 reviews prior literature and
presents the research questions. Section 3 provides information regarding the German
setting. Section 4 presents the sample, the data, the research design, the analyses and the
results. Section 5 concludes. The Appendix contains regression results with the board
variables being lagged.
2 Prior literature and research questions
The literature body dealing with multiple board appointments is comparably huge. With
regard to the purpose of this study, I first present perspectives on the occurrence of mul-
tiple board appointments. Subsequently, I present a literature review on relevant studies
that predominantly deal with multiple board appointments and firm performance.
2.1 Perspectives on multiple board appointments
The phenomenon of directors holding multiple board seats has been widely investi-
gated. Multiple board appointments can be considered as a special branch of the board
-178-
of director’s literature.1 I refer to a director as any individual that serves on a board of
directors. Particularly, I do not distinguish between one-tier and two-tier boards, inside
and outside directors or executive and non-executive directors within this section. The
German two-tier system is highlighted in the subsequent section.
A director holding multiple appointments is called an interlock. Because holding multi-
ple board seats connects boards with each other, the term interlocking directorate is also
commonly used. This is different from the occurrence of two directors serving on the
boards of the same two firms who are called mutual, double or dual interlocks (Fich and
White, 2003). Fearing the danger of arrangements between competitors, Section 8 of the
Clayton Act of 1914 prohibited interlocking directorates between competing firms in
the United States. Dooley (1969) is among the early studies that investigate director
interlocks. The academic interest in interlocking can be explained by the vast variety of
possible reasons that can lead to interlocked companies. At the same time, this is the
reason why the interlock literature offers several competing models to explain the exis-
tence of interlocking and why it is not possible to detach the competing models in a
clear cut way. Mizruchi (1996) provides an extensive summary of issues and literature
related to interlocks. Roughly, it is possible to distinguish between three perspectives:
inter-organizational, integrative and individual.
The inter-organizational perspective assumes the existence of a resource dependence
between organizations (e.g. Burt, 1980). Interlocks are considered to allow an exchange
of information or resources between organizations. Models of this perspective empha-
size the importance of capital, which is constantly demanded by non-financial organiza-
1 Zahra and Pearce (1989), Johnson, Daily and Ellstrand (1996) and Adams, Hermalin and Weis-
bach (2010) give a general overview of extant research related to boards of directors.

-179-
tions. As a consequence, a firm wants to access some sort of financial service from a
financial corporation. This creates a dependency of the non-financial firm, giving the
financial corporation the opportunity to place an interlock to monitor the dependent
firm. Co-opting models (e.g. Koenig, Gogel and Sonquist, 1979) emphasize that consti-
tuting interlocks among firms reduces environmental uncertainty e.g. by squeezing out
competitors or fixing prices. Accordingly, interlocks are considered as parts of partial
alliances that facilitate cooperation among firms.
The integrative perspective stresses to think in classes and elites (e.g. Mintz and
Schwartz, 1981; Palmer, 1983). In the context of the Finance Capital Model, financial
and non-financial corporations are assumed to be equally powerful. The presence of
interlocks helps to interconnect these corporations by means of ownership and relation-
ships among the corporations. As a consequence, not single pairs of corporations are
connected but entire economic groups. Similar, the Class Hegemony Model (e.g.
Koenig, Gogel and Sonquist, 1979) assumes the existence of upper and lower classes.
Members of the same classes are thought to share the same views and beliefs, forming a
common code. Regarding the board as a place where members of higher classes meet,
interlocks are considered to allow influential occupations with the objective to support
and achieve mutual goals (comparable to social cohesion as in Mizruchi (1996)). The
Management Control Model stresses that the power lies within the hands of the man-
agement. Directors are considered to be a source of advice or criticism for the manage-
ment, but do not take an active part in directing a firm’s daily business. Consequently,
interlocks are especially attributed for their characteristics.
The individual perspective puts the focus on individual goals and benefits. In the Le-
gitimacy Model, the interlock is perceived to signal investors the firm’s ties to other

-180-
important organizations. The focus does not lie on material resources but on how the
association is publicly perceived. Zajac (1988) proposes another approach, also labeled
Career Advancement Model. Accordingly, a director’s benefits from sitting on a board
are prestige, power and additional income (Bazerman and Schoorman, 1983). This view
puts more emphasis on the individual who chooses to accept additional appointments
and expects companies to select potential directors by their individual characteristics
and not by their contribution to link companies.
2.2 Literature review
This paper builds on prior literature dealing with directors holding multiple board ap-
pointments and their effect on firm performance. The amount of relevant studies in this
area prohibits a complete overview of extant international research. Rather, this section
aims at giving an overview of the topic’s broadness and the underlying complexity of
research in this area; an extensive survey is provided by Mizruchi (1996). The section
on empirical evidence concerning multiple board appointments in Germany aims at be-
ing as complete as possible.
Findings in prior literature suggest a positive (e.g. Pennings, 1980) as well as a negative
(Fligstein and Brantley, 1992) association between interlocking and firm performance.
Dalton et al. (1998) acknowledge that this might be partly attributable to the nature of
the performance measure since the academic literature is discordant with respect to
board decisions and their impact on accounting and market-based measures of perform-
ance. Mizruchi (1996) points out that the ambiguous results might reflect the uncer-
tainty of the causal order between interlocking and performance. Firms might exhibit a
low performance because directors holding multiple appointments are too busy with the
result that their duties for the firms are compromised. However, it is also conceivable
-181-
that firms exhibiting low performance try to attract directors with a wide network. Prior
results suggest that unprofitable firms feature more interlocks (Mizruchi and Stearns,
1988). Also, financial distress might increase the necessity to monitor capital (Richard-
son, 1987).
Results of more recent work on the topic are similarly mixed. Ferris, Jagannathan and
Pritchard (2003) do not find a negative association between the number of board mem-
berships of a director and subsequent firm performance or a negative market reaction to
the appointment of a director with multiple appointments. On the other hand, they show
a significant positive association between prior performance and the number of director-
ships. Fich and Shivdasani (2006) show a significant negative relationship between out-
side directors with multiple board appointments and market-to-book ratios as well as
with measures of operating performance. Results from Perry and Peyer (2005) suggest
that the effect of accepting an additional directorship on firm value depends on whether
the sending firm has higher agency problems, and also, on what kind of firm the ap-
pointment is accepted. Core, Holthausen and Larcker (1999) find that CEO compensa-
tion is higher for firms where outside directors serve on multiple boards. Their results
also suggest that this is part of contracting inefficiencies, which negatively affect firm
performance.
Several studies look on certain director characteristics and how these directors affect
firm performance. For example, Hillman (2005) investigates the presence of politicians
on boards and finds a positive association with market-based performance. Results of
Adams and Ferreira (2009) suggest that gender diversity can have a positive effect on
board effectiveness and firm performance. In a concurrent study, Masulis, Wang and
Xie (2010) put their focus on U.S. directors that have their residence in foreign coun-

-182-
tries. Their findings suggest that these directors can bring valuable expertise with regard
to corporate decisions that involve their home country but are also associated with
monitoring deficiencies. Overall, their findings suggest that firms with these type of
directors have a poorer performance.
Although the occurrence of interlocking in the German institutional setting has been
discussed in numerous studies (Ziegler, 1984; Albach and Kless, 1982; Biehler and
Ortmann, 1985; Heinze, 2002), empirical evidence on the relationship between inter-
locks and firm performance is scarce. Pfannschmidt (1995) finds positive but mostly
insignificant correlations between accounting based performance measures and inter-
locking directorates. Beyer (1996) uses a sample of 694 firms and finds no evidence that
interlocked and not interlocked firms are significantly different from each other with
regard to firm profitability. Balsmeier, Buchwald and Peters (2009) investigate the rela-
tionship between multiple board appointments held by the CEO and the chairman of the
supervisory board and firm performance using panel data of 57 firms for the period
1996-2006 (where data is available for every even year). Their findings suggest a con-
cave relationship between the number of appointments held by the CEO and firm per-
formance. Specifically, they find that more than two additional appointments are nega-
tively associated with firm performance. They also find that chairmen of supervisory
boards who serve on other management boards monitor firms with higher performance.
This finding does not hold for appointments held in other supervisory boards. Miczaika
and Witt (2004) show significant negative correlations between multiple board ap-
pointments and shareholder return. Schreyögg and Papenheim-Tockhorn (1995) investi-
gate whether the supervisory board is an instrument to create inter-organizational ties.
They take the results of their broken-tie analysis as indication that certain ties between
firms are deliberately used in order to facilitate long-term cooperation opportunities.
-183-
Dittmann, Maug and Schneider (2010) put their focus on bankers on German boards.
Their findings between bank representation and firm performance is mixed. They sug-
gest that bankers promote their own business and provide financial expertise. Fauver
and Fuerst (2006) investigate employee representation on German boards. Their find-
ings indicate that employee representation is beneficial as it improves monitoring and
reduces agency costs. Balsmeier and Peters (2009) analyze the relationship between
multiple board appointments and management compensation. They conclude that man-
agement compensation is higher in firms where the management features more personal
ties. Not directly related to interlocking, Bresser and Thiele (2008) investigate executive
continuity, i.e. a CEO’s appointment to be chairman of the supervisory board. They find
no evidence that this affects firm performance.
2.3 Research question
The general research question of this study is whether multiple board appointments
have a positive or negative effect on firm performance. Given the numerous possible
reasons of why individuals might hold multiple board appointments, it seems pointless
to attribute their existence to one single purpose. Rather, it seems more plausible that
holding multiple board appointments fulfills several tasks, which cannot be detached in
a clear-cut way on individual or firm levels. This view is supported by results from
Booth and Deli (1996). In order to reflect these different perspectives on multiple board
appointments, I investigate the incidence of multiple board appointments from several
angles. The primary goal of this study is to contribute to a growing body of literature
that investigates the relationship between firm performance and particular characteris-
tics of board directors by considering directors that have non-domestic appointments. In
order to give a more comprehensive understanding of the effect of multiple board ap-
-184-
pointments on firm performance, I also draw on prior findings of related research. Par-
ticularly, I contrast the Busyness Hypothesis versus the Reputation Hypothesis. Here, I
especially address the measurement of busyness which seems to be an essential driver
of prior mixed results (Fich and Shivdasani, 2006). The investigation is completed by
drawing on directors having bank affiliations and their impact on firm performance.
3 The institutional setting in Germany
I restrain the following explanations to corporations (Aktiengesellschaft) since it is the
legal form of interest within the scope of this investigation. Those firms feature a two-
tier board. German corporations are run by the management board (Vorstand), which is
monitored by the supervisory board (Aufsichtsrat). The two boards are separated which
means that no individual is allowed to serve on both boards of the same firm simultane-
ously.
Regulations concerning the management board can be found in the paragraphs 76-
94 AktG (Stock Corporation Law - Aktiengesetz). Members of the management board
are appointed by the supervisory board for a maximum period of five years. The super-
visory board can agree to a prolongation of the tenure. The management board may
comprise only one individual. Firms that possess more than three million Euro in capital
stock have to appoint at least two individuals unless corporate statutes state otherwise.
If several individuals have been elected to the management board, they lead the firm
conjointly. Management compensation comprises a fixed salary and may be extended
by variable components.
The management board is of essential importance to a firm and its performance since it
is entrusted with its leadership in own responsibility. A catalog of tasks or a legal defi-
-185-
nition of leadership does not exist. In this respect, the management controls and coordi-
nates the firm. It needs to develop corporate strategies and implement these into the
day-to-day operations. However, some duties are legally determined. Particularly, the
management is responsible for the preparation of financial statements and for calling the
annual general meeting. The German law does not state any restrictions with regard to
additional board appointments.
Regulations concerning the supervisory board can be found in the paragraphs 95-
116 AktG. Members of the supervisory board are either a shareholder representative or
an employee representative. The board consists of at least three and a maximum of 21
members (para. 95 AktG). Members of supervisory boards are also allowed to establish
several smaller committees in order to make their work more efficient (para. 107 sect. 3
AktG). The board’s composition depends on the firm’s size. A firm with less than 500
employees features only shareholder representatives. If the number of employees is
more than 500 but less than 2000, the board features two-third shareholder and one-
third employee representatives. A board features the same number of employee and
shareholder representatives in a firm with more than 2000 employees. The tenure is five
years, if not a shorter time period is specified in the firm’s statutes. The board has to
elect one chairman and at least one vice-chairman.
The supervisory board is supposed to act in favor of the firm’s interests. Its tasks can be
classified into monitoring and supervising activities. It has to monitor the management
board with respect to efficiency and correctness and is entrusted with according rights to
ensure this task (para. 111 AktG). Among others, the supervisory board is entitled to
attend annual general meetings, inspect proposed resolutions or to demand reports from
the management. In addition to these activities, today’s supervisory boards are expected

-186-
to give the management advice (Kuck, 2006). Within this scope, the supervisory board
needs a clear idea of the firm’s business goals. Although the supervisory board nomi-
nates and appoints members of the management board, once the management is in
charge, it leads the firm in its own responsibility. It is in the supervisory board’s discre-
tion to choose the intensity of supervision, which generally will depend on the firm’s
economic situation (Kuck, 2006). While the supervisory board is not allowed to engage
into executive decisions, relevant business decisions need the supervisory board’s ap-
proval. In order to fulfill its task, para. 110 sect. 3 AktG specifies the board to meet at
least twice every half-year. According to para. 100 sect. 2 AktG, a member of the su-
pervisory board is allowed to hold a total of ten directorships plus additional five in in-
tergroup companies. Para. 102 sect. 1 AktG restricts the duration of a directorship to a
maximum of five years. There is no maximum number of reelections to the supervisory
board. The law provides no restrictions with regard to compensation. However, the
compensation needs to be adequate with regard to board tasks and the firm’s economic
situation (para. 113 sect. 1 AktG).
The position of the chairman of the supervisory board comes with additional responsi-
bilities. Particularly, he represents the supervisory board towards the management board
and shall be available as contact person between the two parties. He is also responsible
for the coordination and the execution of monitoring activities. For instance, he prepares
and leads board meetings (Lutter and Krieger, 2008). In firms where the board equally
consists of employee and shareholder representatives, the chairman has a double voting
right. Since the chairman in these firms usually is a shareholder representative (para. 29
sect. 2 MitbestG) this allows shareholder representatives to overrule employee represen-
tatives.
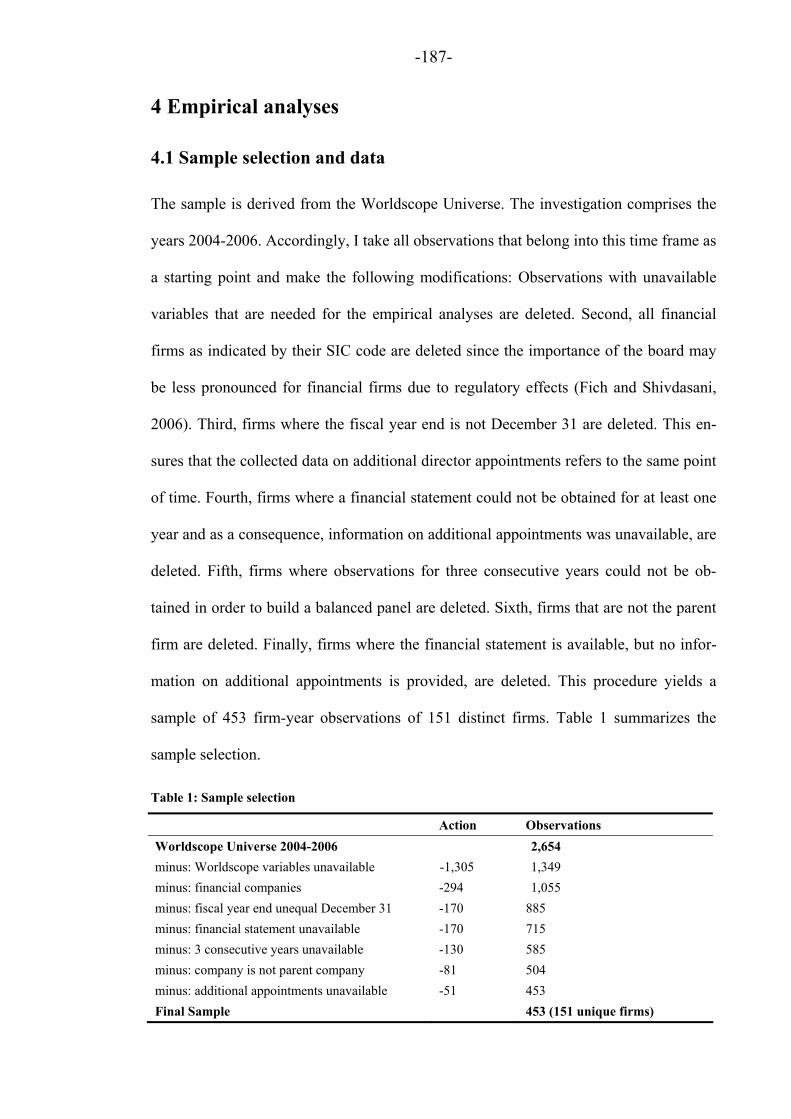
-187-
4 Empirical analyses
4.1 Sample selection and data
The sample is derived from the Worldscope Universe. The investigation comprises the
years 2004-2006. Accordingly, I take all observations that belong into this time frame as
a starting point and make the following modifications: Observations with unavailable
variables that are needed for the empirical analyses are deleted. Second, all financial
firms as indicated by their SIC code are deleted since the importance of the board may
be less pronounced for financial firms due to regulatory effects (Fich and Shivdasani,
2006). Third, firms where the fiscal year end is not December 31 are deleted. This en-
sures that the collected data on additional director appointments refers to the same point
of time. Fourth, firms where a financial statement could not be obtained for at least one
year and as a consequence, information on additional appointments was unavailable, are
deleted. Fifth, firms where observations for three consecutive years could not be ob-
tained in order to build a balanced panel are deleted. Sixth, firms that are not the parent
firm are deleted. Finally, firms where the financial statement is available, but no infor-
mation on additional appointments is provided, are deleted. This procedure yields a
sample of 453 firm-year observations of 151 distinct firms. Table 1 summarizes the
sample selection.
Table 1: Sample selection
Action Observations
Worldscope Universe 2004-2006 2,654
minus: Worldscope variables unavailable -1,305 1,349
minus: financial companies -294 1,055
minus: fiscal year end unequal December 31 -170 885
minus: financial statement unavailable -170 715
minus: 3 consecutive years unavailable -130 585
minus: company is not parent company -81 504
minus: additional appointments unavailable -51 453
Final Sample 453 (151 unique firms)
-188-
4.2 Data description
4.2.1 Director characteristics
All data concerning director characteristics and board appointments are hand-collected
from the annual consolidated financial statements. Table 2 displays summary statistics
for the sample firms’ directors (4,408 director years; 1,838 unique individuals). Ap-
proximately 6.7% of the directors are female and 30.0% have a doctoral and/or profes-
sorial degree, including honorary degrees. 17.2% of the directors hold a position as
chairman of a supervisory board (this can but does not need to be in a sample firm). The
average director holds 2.1 board seats. The number of board seats is counted after dele-
tion of intergroup board appointments. An intergroup appointment materializes if a di-
rector serves on the board of a sample firm and on the board of a firm controlled by the
sample firm at the same time. Also, appointments in charitable institutions or non-for-
profit organizations are eliminated (Fich and Shivdasani, 2006). Although the afore-
mentioned authors provide no explanation for this procedure, it appears reasonable that
such appointments are different with respect to imposed time restrictions. Additionally,
selection criteria in order to serve for example on charitable organizations might be less
competitive.
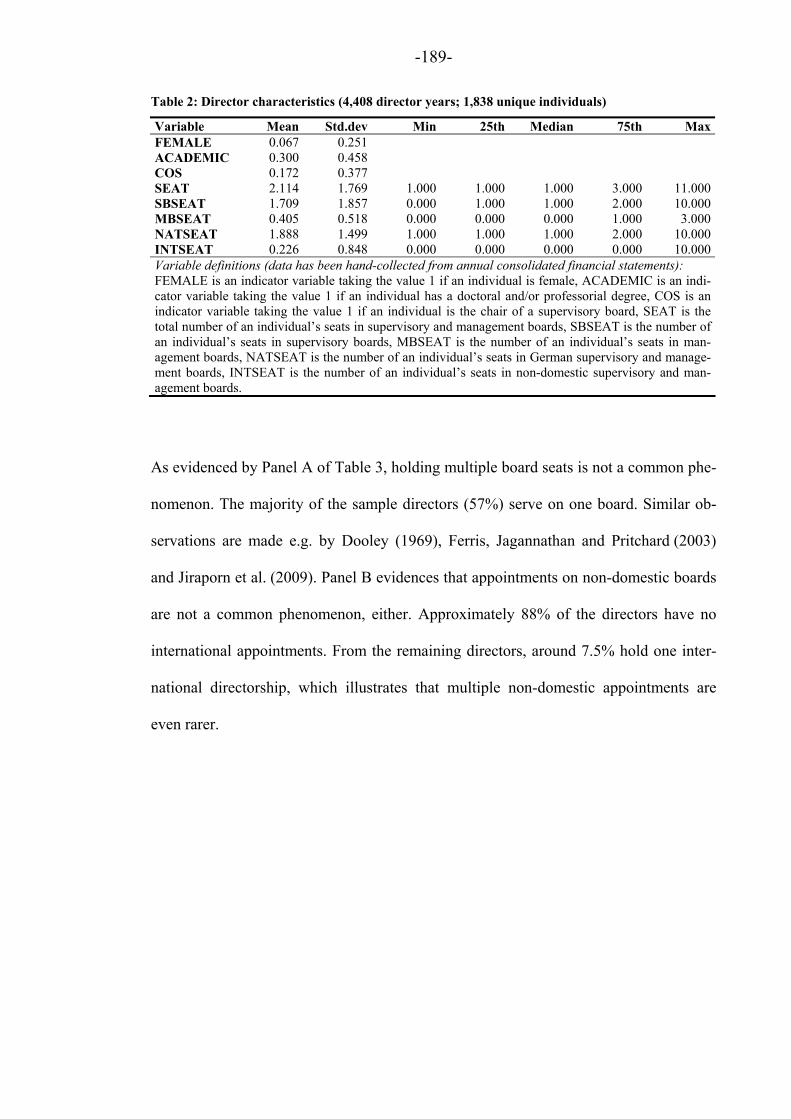
-189-
Table 2: Director characteristics (4,408 director years; 1,838 unique individuals)
Variable Mean Std.dev Min 25th Median 75th MaxFEMALE 0.067 0.251 ACADEMIC 0.300 0.458 COS 0.172 0.377 SEAT 2.114 1.769 1.000 1.000 1.000 3.000 11.000SBSEAT 1.709 1.857 0.000 1.000 1.000 2.000 10.000MBSEAT 0.405 0.518 0.000 0.000 0.000 1.000 3.000NATSEAT 1.888 1.499 1.000 1.000 1.000 2.000 10.000INTSEAT 0.226 0.848 0.000 0.000 0.000 0.000 10.000Variable definitions (data has been hand-collected from annual consolidated financial statements): FEMALE is an indicator variable taking the value 1 if an individual is female, ACADEMIC is an indi-cator variable taking the value 1 if an individual has a doctoral and/or professorial degree, COS is an indicator variable taking the value 1 if an individual is the chair of a supervisory board, SEAT is the total number of an individual’s seats in supervisory and management boards, SBSEAT is the number of an individual’s seats in supervisory boards, MBSEAT is the number of an individual’s seats in man-agement boards, NATSEAT is the number of an individual’s seats in German supervisory and manage-ment boards, INTSEAT is the number of an individual’s seats in non-domestic supervisory and man-agement boards.
As evidenced by Panel A of Table 3, holding multiple board seats is not a common phe-
nomenon. The majority of the sample directors (57%) serve on one board. Similar ob-
servations are made e.g. by Dooley (1969), Ferris, Jagannathan and Pritchard (2003)
and Jiraporn et al. (2009). Panel B evidences that appointments on non-domestic boards
are not a common phenomenon, either. Approximately 88% of the directors have no
international appointments. From the remaining directors, around 7.5% hold one inter-
national directorship, which illustrates that multiple non-domestic appointments are
even rarer.
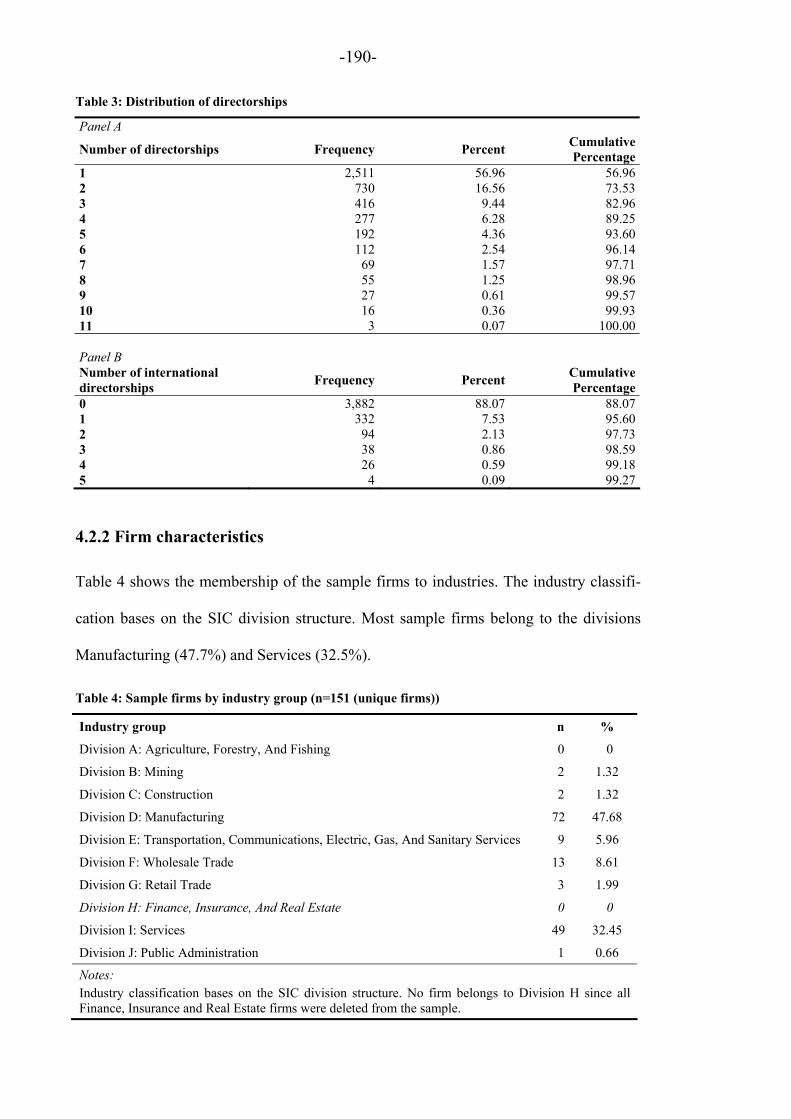
-190-
Table 3: Distribution of directorships
Panel A
Number of directorships Frequency PercentCumulative Percentage
1 2,511 56.96 56.96 2 730 16.56 73.53 3 416 9.44 82.96 4 277 6.28 89.25 5 192 4.36 93.60 6 112 2.54 96.14 7 69 1.57 97.71 8 55 1.25 98.96 9 27 0.61 99.57 10 16 0.36 99.93 11 3 0.07 100.00 Panel B Number of international directorships
Frequency PercentCumulative Percentage
0 3,882 88.07 88.07 1 332 7.53 95.60 2 94 2.13 97.73 3 38 0.86 98.59 4 26 0.59 99.18 5 4 0.09 99.27
4.2.2 Firm characteristics
Table 4 shows the membership of the sample firms to industries. The industry classifi-
cation bases on the SIC division structure. Most sample firms belong to the divisions
Manufacturing (47.7%) and Services (32.5%).
Table 4: Sample firms by industry group (n=151 (unique firms))
Industry group n %
Division A: Agriculture, Forestry, And Fishing 0 0
Division B: Mining 2 1.32
Division C: Construction 2 1.32
Division D: Manufacturing 72 47.68
Division E: Transportation, Communications, Electric, Gas, And Sanitary Services 9 5.96
Division F: Wholesale Trade 13 8.61
Division G: Retail Trade 3 1.99
Division H: Finance, Insurance, And Real Estate 0 0
Division I: Services 49 32.45
Division J: Public Administration 1 0.66
Notes: Industry classification bases on the SIC division structure. No firm belongs to Division H since all Finance, Insurance and Real Estate firms were deleted from the sample.
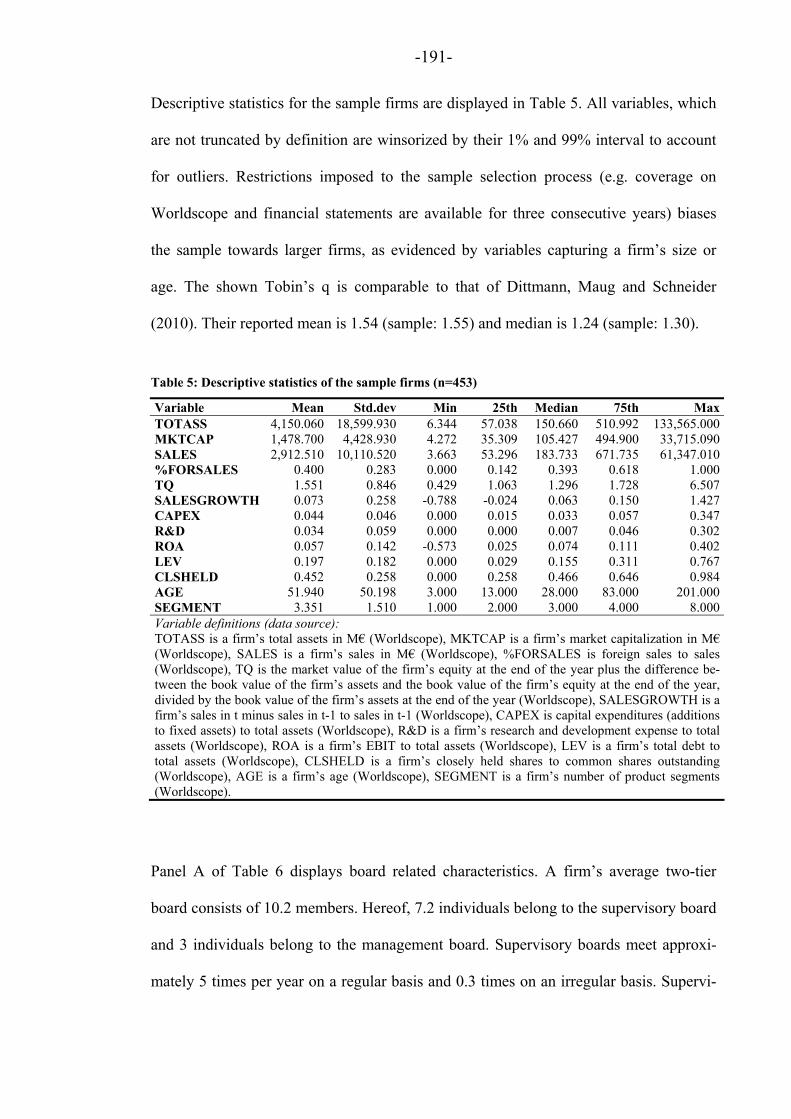
-191-
Descriptive statistics for the sample firms are displayed in Table 5. All variables, which
are not truncated by definition are winsorized by their 1% and 99% interval to account
for outliers. Restrictions imposed to the sample selection process (e.g. coverage on
Worldscope and financial statements are available for three consecutive years) biases
the sample towards larger firms, as evidenced by variables capturing a firm’s size or
age. The shown Tobin’s q is comparable to that of Dittmann, Maug and Schneider
(2010). Their reported mean is 1.54 (sample: 1.55) and median is 1.24 (sample: 1.30).
Table 5: Descriptive statistics of the sample firms (n=453)
Variable Mean Std.dev Min 25th Median 75th MaxTOTASS 4,150.060 18,599.930 6.344 57.038 150.660 510.992 133,565.000MKTCAP 1,478.700 4,428.930 4.272 35.309 105.427 494.900 33,715.090SALES 2,912.510 10,110.520 3.663 53.296 183.733 671.735 61,347.010%FORSALES 0.400 0.283 0.000 0.142 0.393 0.618 1.000TQ 1.551 0.846 0.429 1.063 1.296 1.728 6.507SALESGROWTH 0.073 0.258 -0.788 -0.024 0.063 0.150 1.427CAPEX 0.044 0.046 0.000 0.015 0.033 0.057 0.347R&D 0.034 0.059 0.000 0.000 0.007 0.046 0.302ROA 0.057 0.142 -0.573 0.025 0.074 0.111 0.402LEV 0.197 0.182 0.000 0.029 0.155 0.311 0.767CLSHELD 0.452 0.258 0.000 0.258 0.466 0.646 0.984AGE 51.940 50.198 3.000 13.000 28.000 83.000 201.000SEGMENT 3.351 1.510 1.000 2.000 3.000 4.000 8.000Variable definitions (data source): TOTASS is a firm’s total assets in M€ (Worldscope), MKTCAP is a firm’s market capitalization in M€ (Worldscope), SALES is a firm’s sales in M€ (Worldscope), %FORSALES is foreign sales to sales (Worldscope), TQ is the market value of the firm’s equity at the end of the year plus the difference be-tween the book value of the firm’s assets and the book value of the firm’s equity at the end of the year, divided by the book value of the firm’s assets at the end of the year (Worldscope), SALESGROWTH is a firm’s sales in t minus sales in t-1 to sales in t-1 (Worldscope), CAPEX is capital expenditures (additions to fixed assets) to total assets (Worldscope), R&D is a firm’s research and development expense to total assets (Worldscope), ROA is a firm’s EBIT to total assets (Worldscope), LEV is a firm’s total debt to total assets (Worldscope), CLSHELD is a firm’s closely held shares to common shares outstanding (Worldscope), AGE is a firm’s age (Worldscope), SEGMENT is a firm’s number of product segments (Worldscope).
Panel A of Table 6 displays board related characteristics. A firm’s average two-tier
board consists of 10.2 members. Hereof, 7.2 individuals belong to the supervisory board
and 3 individuals belong to the management board. Supervisory boards meet approxi-
mately 5 times per year on a regular basis and 0.3 times on an irregular basis. Supervi-

-192-
sory boards are allowed to establish several committees in order to make their work
more efficient. Typical examples are the audit committee (deals mostly with account-
ing-related topics) or the compensation committee (deals with management compensa-
tion). On average, the sample firms establish 1.5 committees.
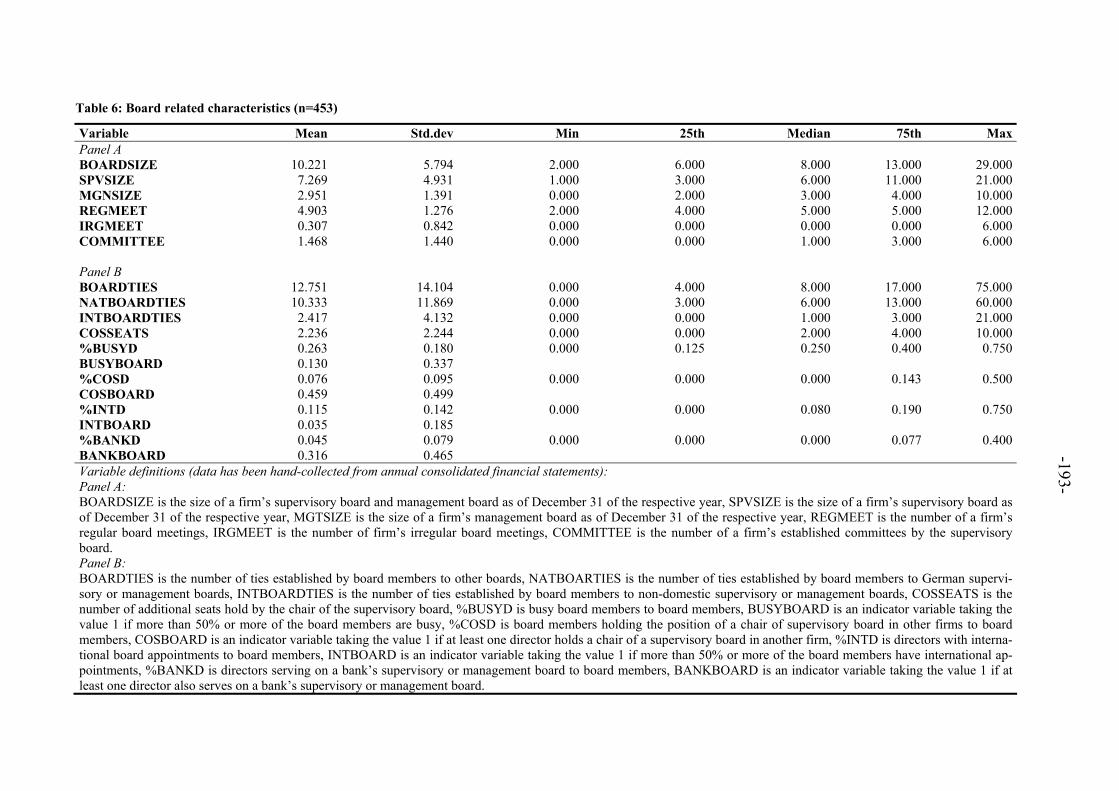
-193-
Table 6: Board related characteristics (n=453)
Variable Mean Std.dev Min 25th Median 75th Max Panel A BOARDSIZE 10.221 5.794 2.000 6.000 8.000 13.000 29.000 SPVSIZE 7.269 4.931 1.000 3.000 6.000 11.000 21.000 MGNSIZE 2.951 1.391 0.000 2.000 3.000 4.000 10.000 REGMEET 4.903 1.276 2.000 4.000 5.000 5.000 12.000 IRGMEET 0.307 0.842 0.000 0.000 0.000 0.000 6.000 COMMITTEE 1.468 1.440 0.000 0.000 1.000 3.000 6.000 Panel B BOARDTIES 12.751 14.104 0.000 4.000 8.000 17.000 75.000 NATBOARDTIES 10.333 11.869 0.000 3.000 6.000 13.000 60.000 INTBOARDTIES 2.417 4.132 0.000 0.000 1.000 3.000 21.000 COSSEATS 2.236 2.244 0.000 0.000 2.000 4.000 10.000 %BUSYD 0.263 0.180 0.000 0.125 0.250 0.400 0.750 BUSYBOARD 0.130 0.337 %COSD 0.076 0.095 0.000 0.000 0.000 0.143 0.500 COSBOARD 0.459 0.499 %INTD 0.115 0.142 0.000 0.000 0.080 0.190 0.750 INTBOARD 0.035 0.185 %BANKD 0.045 0.079 0.000 0.000 0.000 0.077 0.400 BANKBOARD 0.316 0.465 Variable definitions (data has been hand-collected from annual consolidated financial statements): Panel A: BOARDSIZE is the size of a firm’s supervisory board and management board as of December 31 of the respective year, SPVSIZE is the size of a firm’s supervisory board as of December 31 of the respective year, MGTSIZE is the size of a firm’s management board as of December 31 of the respective year, REGMEET is the number of a firm’s regular board meetings, IRGMEET is the number of firm’s irregular board meetings, COMMITTEE is the number of a firm’s established committees by the supervisory board. Panel B: BOARDTIES is the number of ties established by board members to other boards, NATBOARTIES is the number of ties established by board members to German supervi-sory or management boards, INTBOARDTIES is the number of ties established by board members to non-domestic supervisory or management boards, COSSEATS is the number of additional seats hold by the chair of the supervisory board, %BUSYD is busy board members to board members, BUSYBOARD is an indicator variable taking the value 1 if more than 50% or more of the board members are busy, %COSD is board members holding the position of a chair of supervisory board in other firms to board members, COSBOARD is an indicator variable taking the value 1 if at least one director holds a chair of a supervisory board in another firm, %INTD is directors with interna-tional board appointments to board members, INTBOARD is an indicator variable taking the value 1 if more than 50% or more of the board members have international ap-pointments, %BANKD is directors serving on a bank’s supervisory or management board to board members, BANKBOARD is an indicator variable taking the value 1 if at least one director also serves on a bank’s supervisory or management board.
-194-
Panel B of Table 6 provides information with regard to ties established by members of
the board holding multiple directorships. On average, a board establishes about 12.7 ties
to other boards. Only 7.6% of the boards feature directors without any ties, 54.9% of the
boards establish between one and ten ties to other boards, the remaining 37.5% of the
boards have more than ten ties to other boards. From the ties, 10.3 are connections to
domestic boards and 2.4 are connections to non-domestic boards. Notably, 43.7% of the
boards do not feature a tie to a non-domestic board, 41.7% establish between one and
five ties to non-domestic boards and the remaining 14.6% have more than five ties to
non-domestic boards; this indicates that international ties are clustered around a small
group of the sample firms. On average, the chairman of the supervisory board estab-
lishes 2.2 ties to other boards. More specifically, 29.6% of the sample chairmen have no
additional board appointment, 60.5% establish between one and five ties to other boards
and the remaining 9.9% establish more than five ties to other boards.
Prior literature dealing with multiple board appointments typically classifies directors
into “busy” and “non-busy”. A busy director is defined as holding three or more board
appointments (Core, Holthausen and Larcker, 1999; Ferris, Jagannathan and Pritchard,
2003; Fich and Shivdasani, 2006). On average, the percentage of busy directors on a
firm’s board is 26.3%. Fich and Shivdasani (2006) suggest to alternatively assess the
prevalence of busyness within a board by using an indicator variable that is one if 50%
or more of all board directors have been identified as being busy. Using this approach
shows that 13% of the boards are busy.
Next, I assess the presence of chairmen of supervisory boards (COS) on the sample
firms’ boards. On average, 7.6% of the directors (that are not the chairman of a supervi-
sory board of a sample firm) hold at least one chairman position in another firm. As an

-195-
alternative measure, the indicator variable COSBOARD is one if an individual who is
chairman of a supervisory board on another firm sits on the sample firm’s board. Ac-
cordingly, 45.9% of the sample firms have at least one individual on their board who is
the chairman of another supervisory board.
In order to assess a board’s international orientation, I use a similar approach as used for
identifying a board’s busyness. I classify a director as being “international”, if the direc-
tor holds at least one appointment on a non-domestic board. Throughout the study, in-
ternationalization of a director or a board refers to ties abroad. I do not use the same
threshold used for identifying busy directors because having international appointments
is not as prevalent as having multiple board seats. On average, the percentage of interna-
tional directors on a firm’s board is 11.5%. Measuring internationalization of a board by
an indicator variable that is one if 50% or more of all board directors are international
shows that 3.5% of the boards are international.
I classify a board to feature bank representation if an individual on the board also serves
on the supervisory or management board of a bank. Accordingly, the percentage of bank
representatives on the sample firm’s board is 4.5%. In comparison, Dittmann, Maug and
Schneider (2010) find that 8.8% of the directors are bankers. However, they classify a
director to be a banker if the individual is or was a member of the management board of
a bank and calculate their ratio based to the total number of shareholder representatives,
only. Similar to the approach of capturing busyness and internationalization of a board,
I also use an indicator variable to measure bank prevalence. The respective indicator
variable is 1, if at least one director is a bank representative. 31.6% of the sample firms
have at least one bank representative on their board. A comparable approach by the
aforementioned authors yields 46% boards with bank representation.

-196-
4.2.3 Correlations
Table 7 displays correlations between board related variables and firm characteristics.
The figures show a positive and significant correlation between firm and board size and
the occurrence of multiple board appointments. Notably, the correlations show a nega-
tive relationship between the different measures of multiple board appointments and
Tobin’s q except for the percentage of international directors. Likewise, return on assets
is negatively correlated with the measures except for the presence of bank directors.
Overall, the correlations give a first indication of a possible negative relationship be-
tween the occurrence of multiple board appointments and firm performance.

-197-
Table 7: Pearson/Spearman correlations between dependent/independent variables (n=453)
Variable (1) (2) (3) (4) (5) (6) (7) (8) (9) (10) (11) (12) (13) (14) (15) (16) (17) (18)
(1) TQ 0.296 -0.120 -0.052 -0.098 -0.111 0.108 -0.054 -0.014 -0.076 0.254 -0.050 0.290 -0.020 0.205 -0.294 -0.055 0.015
(2) ROA 0.476 0.070 -0.118 -0.115 0.057 -0.143 -0.134 -0.219 0.147 0.356 0.363 0.269 0.147 -0.352 -0.026 0.059 0.126
(3) %FORSALES -0.107 0.055 0.178 0.110 0.117 0.244 0.193 0.221 0.158 0.217 0.289 -0.079 0.014 0.051 0.092 -0.074 0.151
(4) %BUSYD -0.018 -0.043 0.188 0.513 0.358 0.493 0.783 0.747 0.292 0.297 0.281 -0.030 0.044 0.130 0.024 -0.110 0.173
(5) %COSD -0.078 -0.093 0.112 0.514 0.267 0.243 0.562 0.421 0.288 0.241 0.250 -0.067 0.085 0.014 -0.005 -0.113 0.117
(6) %BANKD -0.034 0.070 0.114 0.342 0.298 0.120 0.402 0.285 0.470 0.425 0.481 -0.047 0.081 -0.142 0.117 -0.108 0.274
(7) %INTD 0.019 -0.051 0.273 0.475 0.257 0.173 0.483 0.721 0.168 0.208 0.115 0.023 -0.019 0.312 -0.080 -0.150 0.077
(8) BUSYSCORE -0.011 -0.100 0.216 0.788 0.536 0.378 0.429 0.788 0.311 0.309 0.288 -0.053 0.012 0.104 0.009 -0.138 0.218
(9) REPUTATIONSCORE -0.026 -0.117 0.232 0.747 0.407 0.294 0.616 0.783 0.231 0.260 0.192 -0.040 -0.056 0.294 -0.055 -0.156 0.128
(10) BOARDSIZE 0.032 0.130 0.145 0.283 0.360 0.470 0.287 0.312 0.237 0.766 0.827 0.043 0.186 -0.155 0.099 -0.076 0.254
(11) MKTCAP 0.366 0.412 0.189 0.264 0.257 0.432 0.242 0.271 0.229 0.701 0.863 0.189 0.187 -0.121 -0.039 -0.172 0.293
(12) SALES 0.017 0.380 0.253 0.239 0.265 0.463 0.193 0.255 0.181 0.754 0.821 0.124 0.222 -0.311 0.195 -0.119 0.316
(13) SALESGROWTH 0.307 0.382 -0.025 -0.056 -0.097 -0.045 -0.015 -0.086 -0.087 0.050 0.283 0.158 0.018 0.009 -0.136 -0.089 -0.027
(14) CAPEX 0.043 0.261 0.097 0.116 0.181 0.162 0.067 0.110 0.033 0.379 0.314 0.395 0.075 -0.128 0.236 0.077 0.111
(15) R&D 0.193 -0.083 0.261 0.159 0.040 -0.097 0.175 0.139 0.255 0.022 0.091 -0.099 0.056 -0.065 -0.279 -0.120 -0.097
(16) LEV -0.294 -0.048 0.148 0.076 0.039 0.159 0.017 0.073 0.017 0.172 0.003 0.273 -0.202 0.280 -0.243 -0.013 0.153
(17) CLSHELD -0.105 0.024 -0.069 -0.122 -0.116 -0.086 -0.140 -0.142 -0.142 -0.053 -0.182 -0.085 -0.112 0.066 -0.245 -0.025 -0.123
(18) SEGMENT 0.046 0.166 0.148 0.171 0.120 0.249 0.125 0.217 0.159 0.158 0.268 0.277 0.005 0.141 -0.055 0.181 -0.133
Variable definitions (data source): TQ is the market value of the firm’s equity at the end of the year plus the difference between the book value of the firm’s assets and the book value of the firm’s equity at the end of the year, divided by the book value of the firm’s assets at the end of the year (Worldscope), ROA is a firm’s EBIT to total assets (Worldscope), %FORSALES is foreign sales to sales (Worldscope), %BUSYD is busy board members to board members, %COSD is board members holding the position of a chair of supervisory board to board members, %BANKD is directors serving on a bank’s supervisory or management board to board members, %INTD is directors with international board appointments to board members, BUSYSCORE is a score that captures the busyness of a board (calculation as described), REPUTATIONSCORE is a score that captures the reputation/skill of a board (calculation as described), BOARDSIZE is the size of a firm’s supervisory board and management board as of December 31 of the respective year, MKTCAP is the natural logarithm of a firm’s market capitalization (Worldscope), SALES is the natural logarithm of a firm’s sales (Worldscope), SALESGROWTH is a firm’s sales in t minus sales in t-1 to sales in t-1 (Worldscope), CAPEX is a firm’s capital expenditures (additions to fixed assets) to total assets (Worldscope), R&D is a firm’s research and development expense to total assets (Worldscope), LEV is a firm’s total debt to total assets (Worldscope), CLSHELD is a firm’s closely held shares to common shares out-standing (Worldscope), SEGMENT is a firm’s number of product segments (Worldscope). Notes: Pearson (Spearman) correlations are displayed above (below) the diagonal. Bold typeset denotes significant correlations below the 10 % level.

-198-
4.3 Multiple board appointments and firm performance
4.3.1 Methodology
Throughout the study, I deploy firm and year fixed effects. The inclusion of fixed ef-
fects mitigates effects of unobserved heterogeneity. Fich and Shivdasani (2006) point
towards the importance to estimate firm-fixed effect regressions in a related setting.
Using firm-fixed effects in this setting is a comparable conservative method. Since
board composition is substantially different across firms and strong changes do not oc-
cur from year to year, much of the cross-sectional variation is removed. Hermalin and
Weisbach (1991) point towards the importance to reason whether inferences should be
made within or between firms on the investigation of firm performance and board com-
position. Zhou (2001) suggests that fixed effects estimators might be unsuitable to de-
tect a relationship of managerial ownership on firm performance because changes in
managerial ownership are too small. I consider the firm and year fixed effects specifica-
tions to be more conservative that work against finding a relationship between the board
composition variables and performance.
Endogeneity constitutes a problem throughout the investigation. Directors holding mul-
tiple board appointments might positively or negatively affect firm performance. Like-
wise, poorly performing firms might try to attract directors holding multiple appoint-
ments to draw on their experience and networks. On the other hand, banks might feel a
stronger urge to monitor their loans when firms exhibit poor performance. When inves-
tigating the relationship on foreign sales, an increase might be the result of directors
using their international networks to enhance international activities. On the other hand,
firms that are already in the process of increasing foreign sales might seek directors with
international board appointments. Likewise, directors serving on internationally ori-
-199-
ented firms might be more internationally exposed, resulting in offers to serve on inter-
national boards. I address the endogeneity problem in a separate section.
In order to test my hypotheses, I draw on firm performance measures used in prior lit-
erature. I use Tobin’s q (TQ), which is a commonly used measure in this line of litera-
ture (e.g. Yermack, 1996; Fauver and Fuerst, 2006; Dittman, Maug and Schneider,
2010). Following Fich and Shivdasani (2006), the definition used is “the market value
of the firm’s equity at the end of the year plus the difference between the book value of
the firm’s assets and the book value of the firm’s equity at the end of the year, divided
by the book value of the firm’s assets at the end of the year”.1
The idea behind Tobin’s q is that it puts the expected firm’s market value in relation to
the replacement cost of tangible assets (Lang and Stulz, 1994). When financial markets
are assumed to be efficient, Tobin’s q captures the contribution of intangible assets to
the firm’s market value via market expectations. The intangible assets are composed of
several components like investment opportunities or reputational capital. The board can
directly affect the nominator and the denominator of Tobin’s q as it is responsible for
the firm’s investments. Also, the board can be viewed as an intangible asset itself with a
positive or negative value. Models drawing on this relationship assume that good man-
agement and good corporate governance have a positive impact on Tobin’s q. A draw-
back of Tobin’s q lies in the circumstance that it can also proxy for other firm character-
istics. For example, it can capture a firm’s investment opportunities, especially when
underinvestment prevails due to liquidity shortage. Although a control for investment
opportunities is included in the models, I also use alternative measures of firm perform-
ance which are discussed later.
1 Fich and Shivdasani (2006) closely follow Smith and Watts (1992).
-200-
Studies that investigate boards in the Anglo-American setting often include additional
controls, particularly board size, board committees and board meetings. I do not con-
sider these controls to be suitable in the setting at hand. Board size is strongly driven by
a firm’s size and number of employees. As a matter of fact, board size exhibits a high
correlation with the size measures (Table 7). Including both variables into my model
specifications results in VIFs far over 10, introducing the risk that results are pested by
multicollinearity issues. Also, the number of board meetings and number of board
committees are partly regulatory driven. German supervisory boards meet at least four
times per year by law. The German Corporate Governance Codex stipulates to establish
committees. Overall, including these variables exhibit the danger to include mechanisti-
cally driven controls or to be endogenous. In this respect, my proposed base model is a
comparable parsimonious specification that strongly follows Dittmann, Maug and
Schneider (2010), whose study is also set in a German institutional setting.
The base model specification is as follows:
Model (1)
SEGMENTCLSHELDLEVDR
CAPEXHSALESGROWTSALESOfInterestVariableTQ
876&5
4321
It is conventional to control for several value drivers that can influence Tobin’s q. Spe-
cifically, I control for firm size (SALES), measured as the natural logarithm of sales;
sales growth (SALESGROWTH), measured as sales minus last year’s sales to last
year’s sales; capital expenditures (CAPEX), measured as capital expenditures to prop-
erty, plant and equipment to total assets; research and development intensity (R&D),
measured as research and development expense to total assets; leverage (LEV), meas-
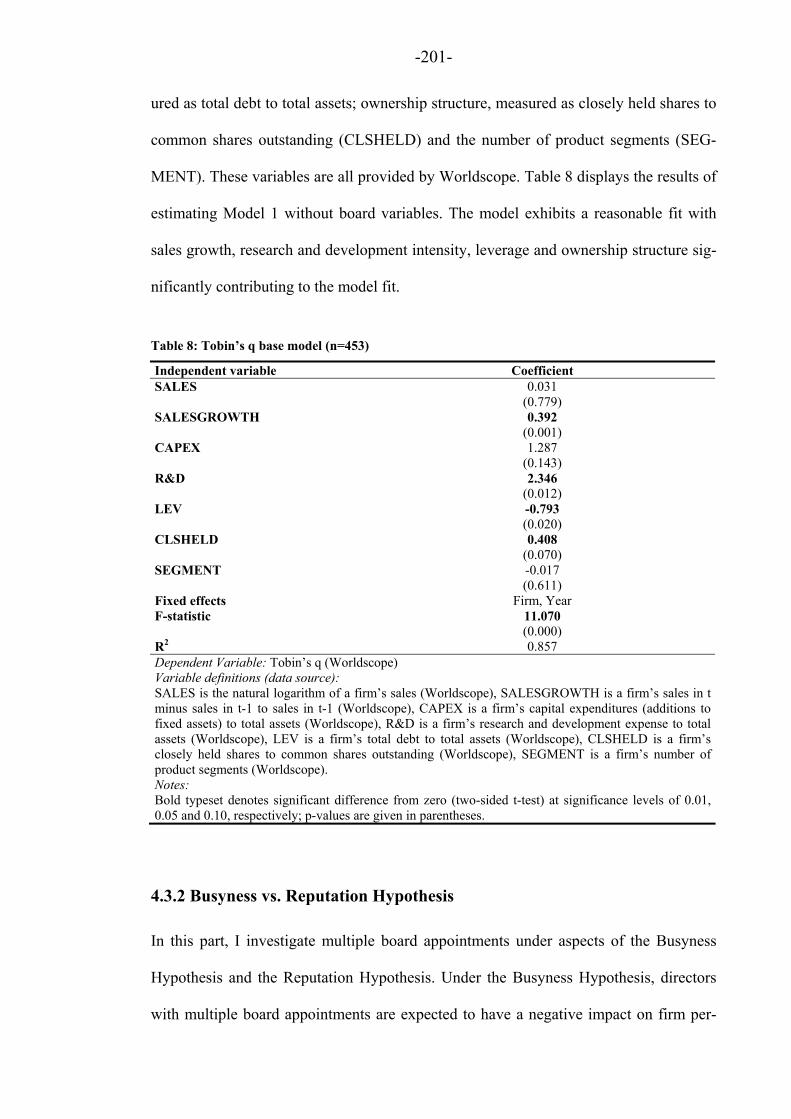
-201-
ured as total debt to total assets; ownership structure, measured as closely held shares to
common shares outstanding (CLSHELD) and the number of product segments (SEG-
MENT). These variables are all provided by Worldscope. Table 8 displays the results of
estimating Model 1 without board variables. The model exhibits a reasonable fit with
sales growth, research and development intensity, leverage and ownership structure sig-
nificantly contributing to the model fit.
Table 8: Tobin’s q base model (n=453)
Independent variable Coefficient SALES 0.031 (0.779) SALESGROWTH 0.392 (0.001) CAPEX 1.287 (0.143) R&D 2.346 (0.012) LEV -0.793 (0.020) CLSHELD 0.408 (0.070) SEGMENT -0.017 (0.611) Fixed effects Firm, Year F-statistic 11.070 (0.000) R2 0.857 Dependent Variable: Tobin’s q (Worldscope) Variable definitions (data source): SALES is the natural logarithm of a firm’s sales (Worldscope), SALESGROWTH is a firm’s sales in t minus sales in t-1 to sales in t-1 (Worldscope), CAPEX is a firm’s capital expenditures (additions to fixed assets) to total assets (Worldscope), R&D is a firm’s research and development expense to total assets (Worldscope), LEV is a firm’s total debt to total assets (Worldscope), CLSHELD is a firm’s closely held shares to common shares outstanding (Worldscope), SEGMENT is a firm’s number of product segments (Worldscope). Notes: Bold typeset denotes significant difference from zero (two-sided t-test) at significance levels of 0.01, 0.05 and 0.10, respectively; p-values are given in parentheses.
4.3.2 Busyness vs. Reputation Hypothesis
In this part, I investigate multiple board appointments under aspects of the Busyness
Hypothesis and the Reputation Hypothesis. Under the Busyness Hypothesis, directors
with multiple board appointments are expected to have a negative impact on firm per-

-202-
formance (Ferris, Jagannathan and Pritchard, 2003). Individuals might be overcommit-
ted and thus not able to fulfill their responsibilities due to time constraints. Jiraporn et
al. (2009) find that multiple directorships negatively affect the probability of attending
board meetings. The consequent reduction in the monitoring function could for example
lead to agency costs in form of increased litigation exposure. Jiraporn, Singh and Lee
(2009) find that directors holding more board appointments serve on fewer board com-
mittees. Board committees are associated with increasing board effectiveness (Klein,
1998). Under the Reputation Hypothesis, directors with multiple board appointments
are expected to enhance firm performance. The director increases his skills and his ex-
perience by sitting on different boards and learns about different management styles and
strategies (Carpenter and Westphal, 2001). Holding multiple board appointments is per-
ceived as a credible signal of the director’s skills (Fama and Jensen, 1983). Conse-
quently, skilled directors hold more board appointments because they are actively
sought by firms for their firm performance improving abilities (Jiraporn, Singh and Lee,
2009).
Drawing on prior literature, I assess director busyness by counting a director’s board
appointments. In order to assess the Reputation Hypothesis, I draw on the presence of
chairmen of supervisory boards of other firms and on the number of appointments held
by the chair of the supervisory board. The chair of the supervisory board has a more
distinguished function on the board. Consequently, this position should be given to
skilled and experienced individuals. Evidence that chairmen of supervisory boards are
different from their fellow colleagues can be found in Table 9. Accordingly, COS (1)
are significantly more often male, (2) hold significantly more often a doctoral and/or
professorial degree and (3) have significantly more directorships. I investigate whether
the presence of several of these individuals enhances firm performance.
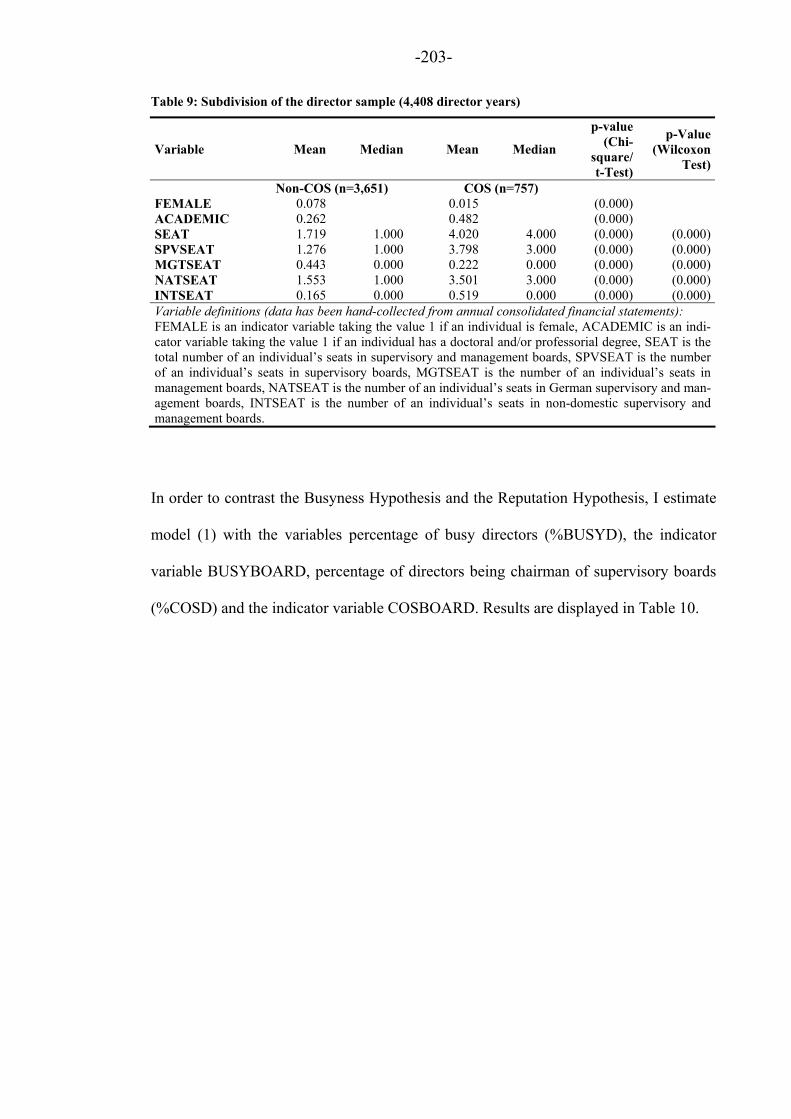
-203-
Table 9: Subdivision of the director sample (4,408 director years)
Variable Mean Median Mean Median
p-value (Chi-
square/ t-Test)
p-Value(Wilcoxon
Test)
Non-COS (n=3,651) COS (n=757) FEMALE 0.078 0.015 (0.000) ACADEMIC 0.262 0.482 (0.000) SEAT 1.719 1.000 4.020 4.000 (0.000) (0.000)SPVSEAT 1.276 1.000 3.798 3.000 (0.000) (0.000)MGTSEAT 0.443 0.000 0.222 0.000 (0.000) (0.000)NATSEAT 1.553 1.000 3.501 3.000 (0.000) (0.000)INTSEAT 0.165 0.000 0.519 0.000 (0.000) (0.000)Variable definitions (data has been hand-collected from annual consolidated financial statements): FEMALE is an indicator variable taking the value 1 if an individual is female, ACADEMIC is an indi-cator variable taking the value 1 if an individual has a doctoral and/or professorial degree, SEAT is the total number of an individual’s seats in supervisory and management boards, SPVSEAT is the number of an individual’s seats in supervisory boards, MGTSEAT is the number of an individual’s seats in management boards, NATSEAT is the number of an individual’s seats in German supervisory and man-agement boards, INTSEAT is the number of an individual’s seats in non-domestic supervisory and management boards.
In order to contrast the Busyness Hypothesis and the Reputation Hypothesis, I estimate
model (1) with the variables percentage of busy directors (%BUSYD), the indicator
variable BUSYBOARD, percentage of directors being chairman of supervisory boards
(%COSD) and the indicator variable COSBOARD. Results are displayed in Table 10.

-204-
Table 10: Busyness vs. Reputation Hypothesis (n=453)
(1) (2) (3) (4) (5) (6) Independent variable Coefficient Coefficient Coefficient Coefficient Coefficient Coefficient %BUSYD -0.347 -0.362 (0.208) (0.191) BUSYBOARD -0.111 -0.111 (0.249) (0.248) %COS 0.258 0.299 (0.541) (0.480) COSBOARD 0.039 0.039 (0.634) (0.627) SALES 0.034 0.028 0.032 0.034 0.035 0.031 (0.758) (0.801) (0.775) (0.761) (0.752) (0.782) SALESGROWTH 0.390 0.396 0.391 0.388 0.388 0.391 (0.001) (0.000) (0.001) (0.001) (0.001) (0.001) CAPEX 1.322 1.266 1.302 1.285 1.340 1.263 (0.133) (0.150) (0.140) (0.145) (0.128) (0.152) R&D 2.280 2.217 2.337 2.338 2.267 2.209 (0.015) (0.019) (0.013) (0.013) (0.016) (0.019) LEV -0.819 -0.792 -0.800 -0.802 -0.829 -0.801 (0.016) (0.020) (0.019) (0.019) (0.015) (0.019) CLSHELD 0.395 0.426 0.398 0.405 0.382 0.423 (0.079) (0.059) (0.078) (0.073) (0.091) (0.061) SEGMENT -0.018 -0.020 -0.015 -0.016 -0.015 -0.019 (0.597) (0.545) (0.658) (0.629) (0.651) (0.562) Fixed effects Firm, Year Firm, Year Firm, Year Firm, Year Firm, Year Firm, Year F-statistic 11.030 11.020 10.980 10.970 10.950 10.930 (0.000) (0.000) (0.000) (0.000) (0.000) (0.000) R2 0.858 0.858 0.857 0.857 0.858 0.858 Dependent Variable: Tobin’s q (Worldscope) Variable definitions (data source): %BUSYD is busy board members to board members, BUSYBOARD is an indicator variable taking the value 1 if more than 50% or more of the board members are busy, %COSD is board members holding the position of a chair of supervisory board to board members, COSBOARD is an indicator variable taking the value 1 if at least one direc-tor holds a chair of a supervisory board in another firm, SALES is the natural logarithm of a firm’s sales (Worldscope), SALESGROWTH is a firm’s sales in t minus sales in t-1 to sales in t-1 (Worldscope), CAPEX is a firm’s capital expenditures (additions to fixed assets) to total assets (Worldscope), R&D is a firm’s research and development expense to total assets (Worldscope), LEV is a firm’s total debt to total assets (Worldscope), CLSHELD is a firm’s closely held shares to common shares outstanding (World-scope), SEGMENT is a firm’s number of product segments (Worldscope). Notes: Bold typeset denotes significant difference from zero (two-sided t-test) at significance levels of 0.01, 0.05 and 0.10, respectively; p-values are given in parentheses.
-205-
In line with the Busyness Hypothesis, I find a negative relationship between Tobin’s q
and busy directors. The relationship is non-significant at common significance levels.
The sign of %COS and COSBOARD, which are both supposed to capture director
skills, are both positive and insignificant. Estimating a full model, the signs are again as
expected and non-significant on common levels. These results give weak evidence for
both the Busyness and the Reputation Hypothesis. Multiple board appointments have a
negative impact on firm performance. This effect does not hold for directors that are
chairman on other supervisory board. This might stem from the circumstance that these
individuals are particularly skilled in fulfilling their tasks on a supervisory board. How-
ever, these results are statistically insignificant.
I further substantiate the previous findings by conducting additional tests. In the previ-
ous test, no distinction is made with respect to which individual is busy. This is a sim-
plification of reality in so far that both the CEO and the COS have a particular impor-
tant role in and for a firm. Consequently, in line with the Busyness Hypothesis, it should
be more harmful for a firm if these two individuals are busy. I address this consideration
by estimating model (1) including the additional number of directorships held by the
COS and the CEO. Results are displayed in Table 11.

-206-
Table 11: Appointments held by COS and CEO and Tobin’s q (n=453)
(1) (2) (3) (4) (5) Independent variable Coefficient Coefficient Coefficient Coefficient Coefficient COSSEATS -0.036 -0.036 -0.024 (0.096) (0.096) (0.629) COSSEATS2 -0.002 (0.796) NONCOSSEATS 0.006 0.005 (0.943) (0.949) CEOSEATS -0.007 -0.005 0.016 (0.889) (0.920) (0.865) CEOSEATS2 -0.006 (0.761) NONCEOSEATS -0.039 -0.040 (0.595) (0.582) NONCOSCEOSEATS 0.001 (0.992) SALES 0.059 0.034 0.060 0.059 0.029 (0.597) (0.763) (0.592) (0.600) (0.799) SALESGROWTH 0.381 0.389 0.380 0.382 0.391 (0.001) (0.001) (0.001) (0.001) (0.001) CAPEX 1.276 1.299 1.281 1.276 1.313 (0.146) (0.141) (0.146) (0.147) (0.138) R&D 2.340 2.294 2.334 2.339 2.294 (0.013) (0.015) (0.014) (0.013) (0.015) LEV -0.847 -0.799 -0.844 -0.842 -0.804 (0.013) (0.019) (0.014) (0.014) (0.019) CLSHELD 0.398 0.406 0.400 0.402 0.408 (0.077) (0.073) (0.077) (0.075) (0.072) SEGMENT -0.021 -0.018 -0.021 -0.021 -0.018 (0.529) (0.586) (0.533) (0.525) (0.598) Fixed effects Firm, Year Firm, Year Firm, Year Firm, Year Firm, Year F-statistic 10.980 10.870 10.880 10.880 10.770 (0.000) (0.000) (0.000) (0.000) (0.000) R2 0.859 0.857 0.859 0.859 0.857 Dependent Variable: Tobin’s q (Worldscope) Variable definitions (data source): COSSEATS is the number of additional seats held by the chair of the supervisory board, COSSEATS2 is the squared number of additional seats held by the chair of the supervisory board, NONCOSSEATS is the num-ber of additional seats held by non-COS members of the board to board size minus one, CEOSEATS is the number of additional seats held by the CEO, CEOSEATS2 is the squared number of additional seats held by the CEO, NONCEOSEATS is the number of additional seats held by non-CEO members of the board to board size minus one, NONCOSCEOSEATS is the number of additional seats held by board members who are not the COS or the CEO to board size minus two, SALES is the natural logarithm of a firm’s sales (Worldscope), SALESGROWTH is a firm’s sales in t minus sales in t-1 to sales in t-1 (Worldscope), CAPEX is a firm’s capital expenditures (additions to fixed assets) to total assets (Worldscope), R&D is a firm’s research and development expense to total assets (Worldscope), LEV is a firm’s total debt to total assets (Worldscope), CLSHELD is a firm’s closely held shares to common shares outstanding (Worldscope), SEGMENT is a firm’s number of product segments (Worldscope). Notes: Bold typeset denotes significant difference from zero (two-sided t-test) at significance levels of 0.01, 0.05 and 0.10, respectively; p-values are given in parentheses.

-207-
In model specification (1), COSSEATS is the number of the COS’s additional director-
ships and NONCOSSEATS is the number of additional seats held by the remaining
board members deflated by board size minus one. In specification (2), CEOSEATS is
the number of the CEO’s additional directorships and NONCEOSEATS is the number
of additional seats held by the remaining board members deflated by board size minus
one. Finally, in specification (3), I include COSSEATS and CEOSEATS; NON-
COSCEOSEATS is the number of additional seats held by the remaining board mem-
bers deflated by board size minus two. Consistent with the Busyness Hypothesis, I find
a negative sign on my variables of interest. The coefficient of COSSEATS is signifi-
cant. While these results also suggest a negative relationship between multiple board
appointments and firm performance, they need a more distinguished interpretation. Ac-
cordingly, the results suggest that it is more harmful for firm performance when the
COS holds multiple board appointments while the negative relationship is not signifi-
cant for additional board seats held by the CEO.
Balsmeier, Buchwald and Peters (2009) argue that the relationship between the number
of board appointments of CEO or COS and firm performance might be non-linear. Par-
ticularly, they conjecture that although additional appointments are given to skilled di-
rectors, imposed time consumption will prevail after a certain number of multiple board
appointments. In order to address this concern, they include the additional number of
board appointments and its squared value. Their results suggest a positive concave rela-
tionship between additional seats held by the CEO and firm performance. In order to
assess a possible non-linear relationship, I follow the aforementioned authors and also
include the squared value of COSSEATS (specification (4)) and CEOSEATS (specifi-
cation (5)). Notably, neither the variables of interest nor their squared values are signifi-
cantly associated with firm performance. In this respect, my results do not indicate that

-208-
the non-linear model specification is more suitable in modeling the relationship between
additional board appointments held by COS or CEO and firm performance. Investigat-
ing the signs of the coefficients, the results suggest a negative convex relationship for
additional board appointments held by the COS since both coefficients of COSSEATS
and COSSEATS2 are negative. As for additional seats held by the CEO, the signs indi-
cate a positive concave relationship, suggesting that there are benefits for firm perform-
ance if the CEO takes multiple board appointments but these are limited and the effect
can turn negative if the number of additional board appointments is too high.
I further assess the previous findings in a final test. I address whether it matters which
of the directors are busy by calculating a busyness score and a reputation score. The
busyness score is calculated as follows:
j
m
SB
l
kkSB
COS
l
kkCOS
n
MGT
l
kkMGT
CEO
l
kkCEO
j
BOARDSIZE
WLWLWLWL
BUSYSCORE
1 1,
1
1 1,
1 1,
1
1 1, *1*2*2*3
BUSYSCORE is calculated for every board of the firm j in the sample for each year.
Each board is subdivided into four elements: CEO, management board (MGT) compris-
ing n board members (excluding CEO), COS and supervisory board (SB) comprising m
board members (excluding COS). The workload (WL) for each of these four elements is
calculated. The workload captures for every individual whether that individual is a
CEO, a member of a management board, a COS or a member of a supervisory board in
another firm. Individuals can have k- up to l-additional appointments where l is only
bounded for members of the supervisory board by ten. The underlying assumption of
the score is that different tasks in a firm exhibit different time restrictions. It is assumed
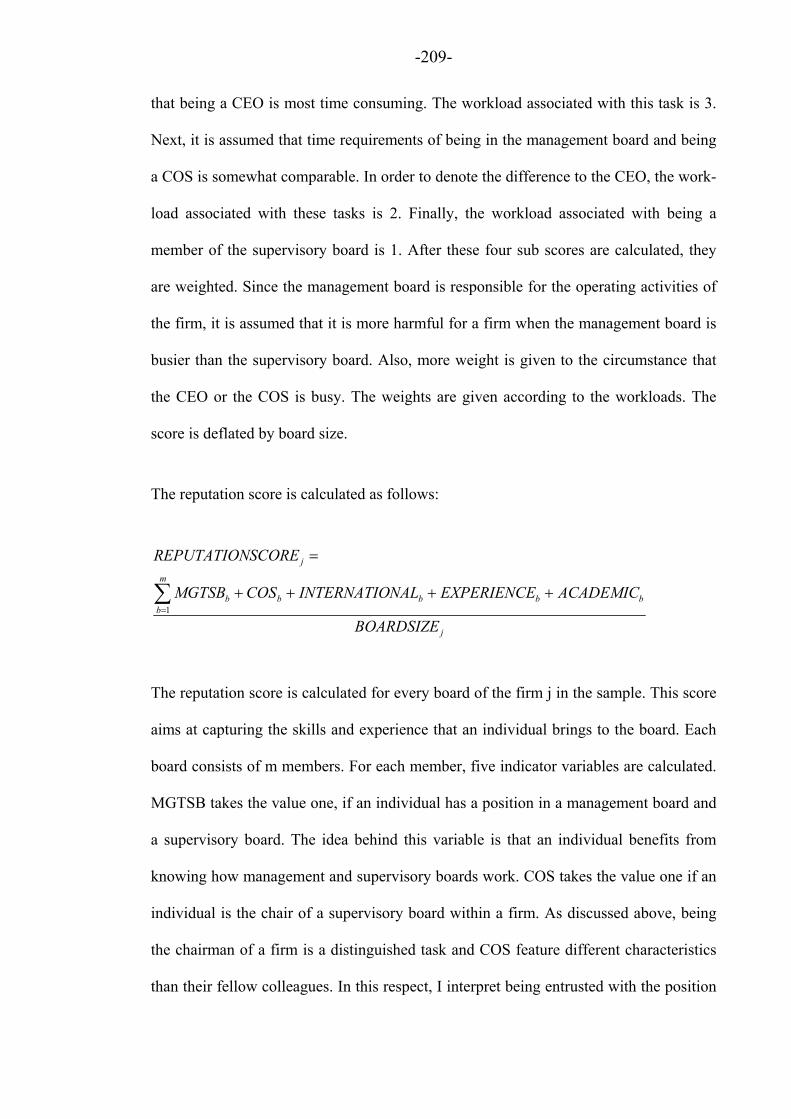
-209-
that being a CEO is most time consuming. The workload associated with this task is 3.
Next, it is assumed that time requirements of being in the management board and being
a COS is somewhat comparable. In order to denote the difference to the CEO, the work-
load associated with these tasks is 2. Finally, the workload associated with being a
member of the supervisory board is 1. After these four sub scores are calculated, they
are weighted. Since the management board is responsible for the operating activities of
the firm, it is assumed that it is more harmful for a firm when the management board is
busier than the supervisory board. Also, more weight is given to the circumstance that
the CEO or the COS is busy. The weights are given according to the workloads. The
score is deflated by board size.
The reputation score is calculated as follows:
j
bbb
m
bbb
j
BOARDSIZE
ACADEMICEXPERIENCENALINTERNATIOCOSMGTSB
SCOREREPUTATION
1
The reputation score is calculated for every board of the firm j in the sample. This score
aims at capturing the skills and experience that an individual brings to the board. Each
board consists of m members. For each member, five indicator variables are calculated.
MGTSB takes the value one, if an individual has a position in a management board and
a supervisory board. The idea behind this variable is that an individual benefits from
knowing how management and supervisory boards work. COS takes the value one if an
individual is the chair of a supervisory board within a firm. As discussed above, being
the chairman of a firm is a distinguished task and COS feature different characteristics
than their fellow colleagues. In this respect, I interpret being entrusted with the position
-210-
to be the chairman of a supervisory board as a signal to be an individual with distin-
guished skills and experience. EXPERIENCE takes the value one if an individual has
more than three directorships. This reflects the known argument of the Reputation Hy-
pothesis that directors benefit from sitting on several boards and are able to improve
their skills. INTERNATIONAL takes the value one if an individual is a member of a
non-German board. Related to the experience argument, I assume that an individual
benefits from being exposed to other cultural influences. Also, this might indicate that
the individual has a broader network that he can rely on. ACADEMIC takes the value
one if an individual has a doctoral and/or professorial degree. This variable is supposed
to capture that an individual might be chosen to a board due to expertise on particular
topics. Likewise, an academic degree might signal a good skill set. However, it needs to
be kept in mind that this is a very crude proxy since neither the absence nor the exis-
tence of a doctoral or professorial degree necessarily shed light on the skill set of an
individual. The reputation score is deflated by board size.
It is important to note that both scores feature highly debatable characteristics. In this
respect, I propose the scores as additional measures to those that I already used in the
two tests before. The difficulty in constructing the two scores clearly reflects the prob-
lems within this line of research. While it seems reasonable to assume that the CEO and
COS are distinguished individuals that are important to the firm, the actual weights
given to the workload are comparably erratic. In this respect, I do not propose that a
CEO works three times more than a member of the supervisory board. Rather, the
weights are meant to symbolize that different tasks exhibit different work loads and that
different board positions can have a stronger impact on a firm’s performance than oth-
ers. Correlations show that both scores are negatively and non-significantly associated
with Tobin’s q. Correlations also show that both scores are highly correlated among

-211-
each other and that the scores are significantly positively correlated with all the other
board variables, especially with %BUSYD. Estimating model (1) with the two board
scores is displayed in Table 12. All specifications exhibit a negative and non-significant
relationship with firm performance. However, the p-value of BUSYSCORE is 0.237
and the p-value of REPUTATIONSCORE is 0.107, indicating a rather strong negative
relationship. The negative association pertains when including both proxy variables into
the model specification. The weaker p-values should be seen in the light of high correla-
tions between the two variables. Overall, these results further substantiate that multiple
board appointments have a negative impact on firm performance and are not counter-
acted by skills or experience.
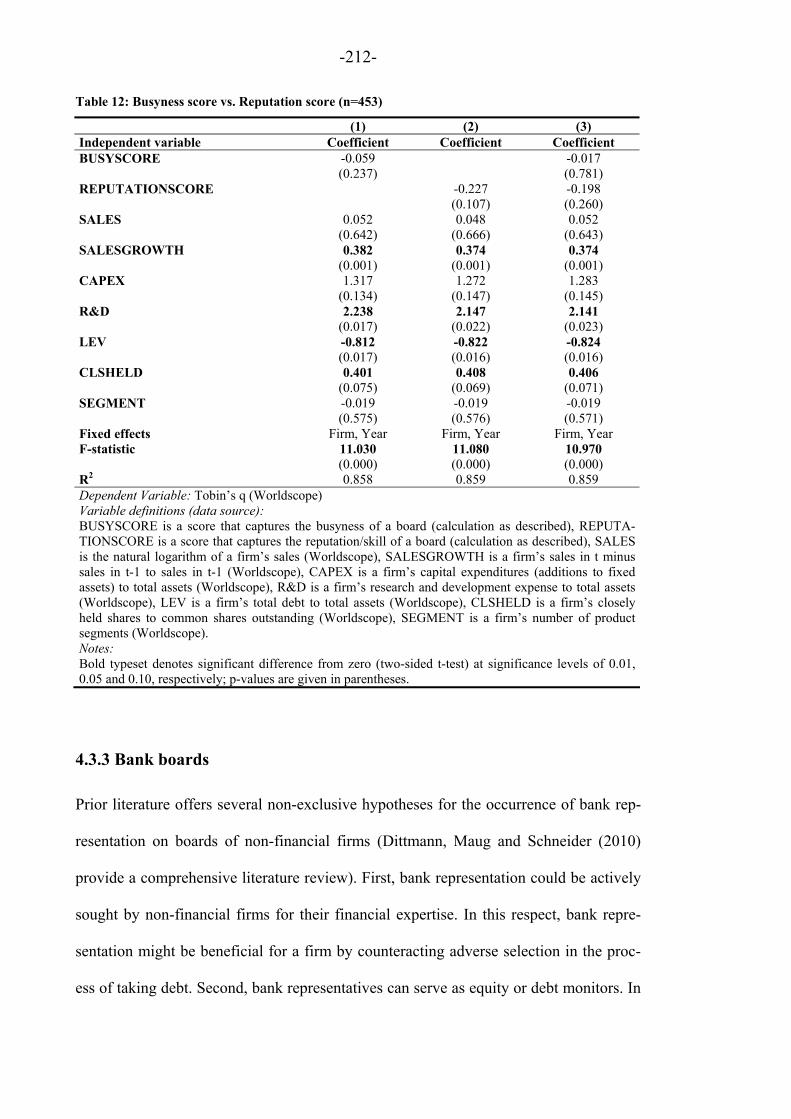
-212-
Table 12: Busyness score vs. Reputation score (n=453)
(1) (2) (3) Independent variable Coefficient Coefficient Coefficient BUSYSCORE -0.059 -0.017 (0.237) (0.781) REPUTATIONSCORE -0.227 -0.198 (0.107) (0.260) SALES 0.052 0.048 0.052 (0.642) (0.666) (0.643) SALESGROWTH 0.382 0.374 0.374 (0.001) (0.001) (0.001) CAPEX 1.317 1.272 1.283 (0.134) (0.147) (0.145) R&D 2.238 2.147 2.141 (0.017) (0.022) (0.023) LEV -0.812 -0.822 -0.824 (0.017) (0.016) (0.016) CLSHELD 0.401 0.408 0.406 (0.075) (0.069) (0.071) SEGMENT -0.019 -0.019 -0.019 (0.575) (0.576) (0.571) Fixed effects Firm, Year Firm, Year Firm, Year F-statistic 11.030 11.080 10.970 (0.000) (0.000) (0.000) R2 0.858 0.859 0.859 Dependent Variable: Tobin’s q (Worldscope) Variable definitions (data source): BUSYSCORE is a score that captures the busyness of a board (calculation as described), REPUTA-TIONSCORE is a score that captures the reputation/skill of a board (calculation as described), SALES is the natural logarithm of a firm’s sales (Worldscope), SALESGROWTH is a firm’s sales in t minus sales in t-1 to sales in t-1 (Worldscope), CAPEX is a firm’s capital expenditures (additions to fixed assets) to total assets (Worldscope), R&D is a firm’s research and development expense to total assets (Worldscope), LEV is a firm’s total debt to total assets (Worldscope), CLSHELD is a firm’s closely held shares to common shares outstanding (Worldscope), SEGMENT is a firm’s number of product segments (Worldscope). Notes: Bold typeset denotes significant difference from zero (two-sided t-test) at significance levels of 0.01, 0.05 and 0.10, respectively; p-values are given in parentheses.
4.3.3 Bank boards
Prior literature offers several non-exclusive hypotheses for the occurrence of bank rep-
resentation on boards of non-financial firms (Dittmann, Maug and Schneider (2010)
provide a comprehensive literature review). First, bank representation could be actively
sought by non-financial firms for their financial expertise. In this respect, bank repre-
sentation might be beneficial for a firm by counteracting adverse selection in the proc-
ess of taking debt. Second, bank representatives can serve as equity or debt monitors. In

-213-
the first case, they represent shareholder interests. In the latter case, they safeguard their
own loans. Third, banks might be interested to place representatives on non-financial
firms for their own interest. In doing so, they could profit from increasing their industry
expertise. The knowledge gained could be used in contracting decisions with other
members of that industry. Alternatively, banks might use the established relationships to
sell other bank related services like M & A advisory services. Against this background,
predictions of bank representation on firm performance are unequivocal and depend on
the potential of conflicts of interest. This leads to the question on how far directors with
bank affiliations are different from their fellow colleagues without bank affiliations.
When safeguarding their loans, bank directors might urge management to be extra cau-
tious, hindering decisions to undertake risky but profitable investments. On the other
hand, they might not necessarily be better monitors but more knowledgeable in reorgan-
izing the management preemptively before problems arise (Fauver and Fuerst, 2006).
Their power might arise from threatening to cut off financing. Gorton and Schmid
(2000) find evidence that suggests an improving effect of bank involvement on firm
performance. Contrary, evidence of Dittmann, Maug and Schneider (2010) is mixed. In
so far, these non-exclusive explanations do not allow a one-directional proposition on
firm performance.
In order to assess the impact of having bank representatives on the board on Tobin’s q, I
estimate model (1) including the variables %BANKD and the indicator variable
BANKBOARD, respectively. Results are displayed in Table 13. Both specifications
show a positive and non-significant relationship. Since I do not further assess the chan-
nels of how bank representatives affect firm performance or other corporate aspects, I
cannot infer on how the positive effect of bank representation positively influences firm
performance for my sample firms. However, this finding at least puts the results from

-214-
the previous section into perspective indicating that multiple board appointments are not
harmful per se. It also features the notion that bank representatives do not solely pursue
bank interests. In this respect, my results are contrary to Dittmann, Maug and Schneider
(2010). However, the aforementioned authors also find a positive and non-significant
relationship between their board representation proxy and firm performance in their
fixed firm and year specification.
Table 13: Bank boards and Tobin’s q (n=453)
(1) (2) Independent variable Coefficient Coefficient %BANKD 0.549 (0.434) BANKBOARD 0.117 (0.287) SALES 0.038 0.035 (0.731) (0.753) SALESGROWTH 0.397 0.401 (0.000) (0.000) CAPEX 1.287 1.248 (0.144) (0.156) R&D 2.321 2.307 (0.013) (0.014) LEV -0.816 -0.808 (0.017) (0.018) CLSHELD 0.407 0.407 (0.071) (0.070) SEGMENT -0.018 -0.017 (0.585) (0.613) Fixed effects Firm, Year Firm, Year F-statistic 10.990 11.010 (0.000) (0.000) R2 0.858 0.858 Dependent Variable: Tobin’s q (Worldscope) Variable definitions (data source): %BANKD is directors serving on a bank’s supervisory or management board to board members, BANKBOARD is an indicator variable taking the value 1 if at least one director also serves on a bank’s supervisory or management board, SALES is the natural logarithm of a firm’s sales (Worldscope), SALESGROWTH is a firm’s sales in t minus sales in t-1 to sales in t-1 (Worldscope), CAPEX is a firm’s capital expenditures (additions to fixed assets) to total assets (Worldscope), R&D is a firm’s research and development expense to total assets (Worldscope), LEV is a firm’s total debt to total assets (Worldscope), CLSHELD is a firm’s closely held shares to common shares outstanding (Worldscope), SEGMENT is a firm’s number of product segments (Worldscope). Notes: Bold typeset denotes significant difference from zero (two-sided t-test) at significance levels of 0.01, 0.05 and 0.10, respectively; p-values are given in parentheses.

-215-
4.3.4 International boards
This part of the analysis focuses on directors that feature appointments on non-domestic
boards. According to the inter-organizational perspective, firms featuring more affilia-
tions to firms in foreign countries would use these networks to enhance their business
activities in these countries. The underlying assumption is that interlocking serves as an
instrument to regulate relationships between firms that are dependent on each other (Al-
len, 1974). This view stresses that interlocks can help to reduce environmental uncer-
tainty in several ways. Schoorman, Bazerman and Atkin (1981) suggest that the organ-
izational benefits arising from interlocking are related to (1) horizontal coordination, (2)
vertical coordination, (3) personal skills and (4) diversity in board composition. This
view emphasizes that board members are able to provide good advice and help to estab-
lish business contacts for the management (e.g. Koenig, Gogel and Sonquist, 1979;
Hermalin and Weisbach, 1988). Accordingly, I expect a positive impact on firm per-
formance. In order to propose a more specific measure of firm performance, I also in-
vestigate the relationship between the existence of additional board appointments in a
foreign country and a firm’s foreign sales, where I accordingly expect a positive rela-
tionship.
In order to assess the impact on firm performance of directors holding international di-
rectorships, I estimate model (1) with the percentage of international directors (%INTD)
and the indicator variable INTBOARD. Results are displayed in Table 14. The coeffi-
cient of %INTD is negative. Although insignificant, the p-value of 0.104 indicates a
strong negative relationship. The coefficient of INTBOARD is negative and non-
significant.
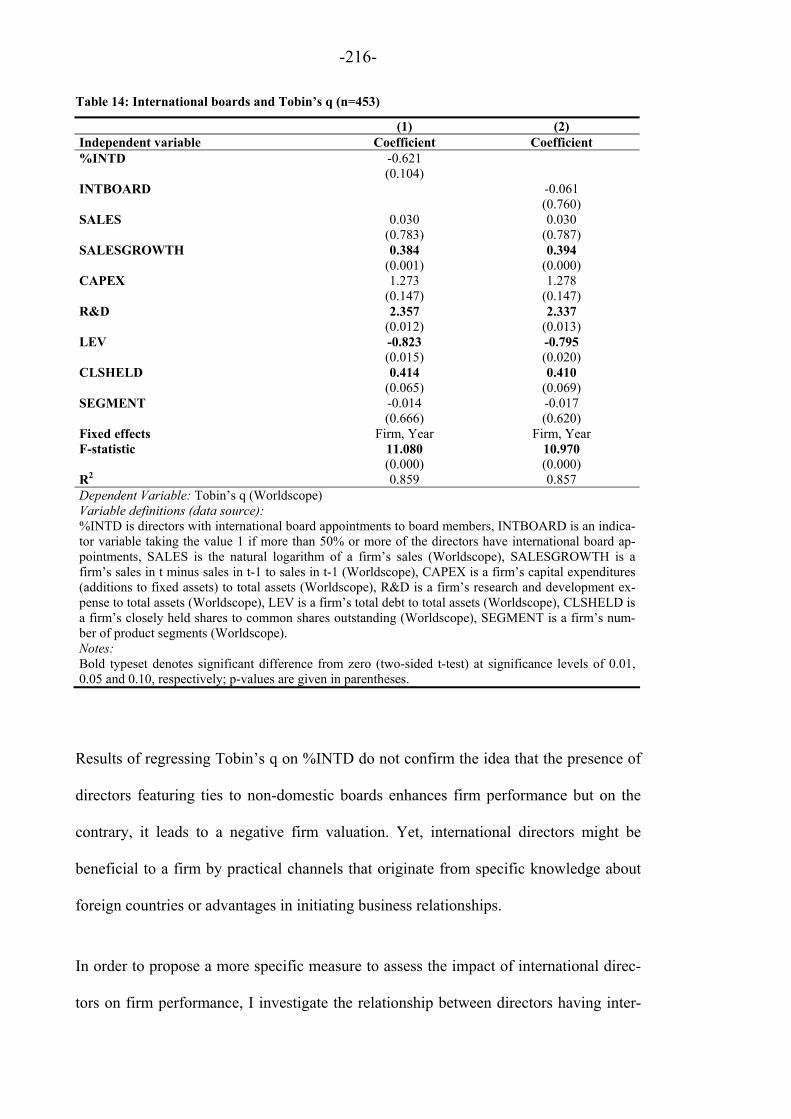
-216-
Table 14: International boards and Tobin’s q (n=453)
(1) (2) Independent variable Coefficient Coefficient %INTD -0.621 (0.104) INTBOARD -0.061 (0.760) SALES 0.030 0.030 (0.783) (0.787) SALESGROWTH 0.384 0.394 (0.001) (0.000) CAPEX 1.273 1.278 (0.147) (0.147) R&D 2.357 2.337 (0.012) (0.013) LEV -0.823 -0.795 (0.015) (0.020) CLSHELD 0.414 0.410 (0.065) (0.069) SEGMENT -0.014 -0.017 (0.666) (0.620) Fixed effects Firm, Year Firm, Year F-statistic 11.080 10.970 (0.000) (0.000) R2 0.859 0.857 Dependent Variable: Tobin’s q (Worldscope) Variable definitions (data source): %INTD is directors with international board appointments to board members, INTBOARD is an indica-tor variable taking the value 1 if more than 50% or more of the directors have international board ap-pointments, SALES is the natural logarithm of a firm’s sales (Worldscope), SALESGROWTH is a firm’s sales in t minus sales in t-1 to sales in t-1 (Worldscope), CAPEX is a firm’s capital expenditures (additions to fixed assets) to total assets (Worldscope), R&D is a firm’s research and development ex-pense to total assets (Worldscope), LEV is a firm’s total debt to total assets (Worldscope), CLSHELD is a firm’s closely held shares to common shares outstanding (Worldscope), SEGMENT is a firm’s num-ber of product segments (Worldscope). Notes: Bold typeset denotes significant difference from zero (two-sided t-test) at significance levels of 0.01, 0.05 and 0.10, respectively; p-values are given in parentheses.
Results of regressing Tobin’s q on %INTD do not confirm the idea that the presence of
directors featuring ties to non-domestic boards enhances firm performance but on the
contrary, it leads to a negative firm valuation. Yet, international directors might be
beneficial to a firm by practical channels that originate from specific knowledge about
foreign countries or advantages in initiating business relationships.
In order to propose a more specific measure to assess the impact of international direc-
tors on firm performance, I investigate the relationship between directors having inter-

-217-
national board appointments and foreign sales. I first assess the relationship in univari-
ate tests. Correlations displayed in Table 7 show a significant positive correlation be-
tween the percentage of foreign sales and the percentage of international directors. Next,
I subdivide the sample into firms with national and international orientation. I classify
firms as nationally oriented if foreign sales are less than 20% of total sales and as inter-
nationally oriented if foreign sales equal or exceed 20% of total sales. The chosen sepa-
ration value follows that used by Loderer and Peyer (2002). Dividing the sample into
firms having and not having foreign sales does not materially change the results dis-
played in Table 15.
Table 15: Subdivision of the sample by foreign sales (n=453)
Variable Mean Median Mean Median p-value (t-Test)
p-Value(Wilcoxon
Test)
National orientation
(n=144) %Foreign sales < 20%
International orientation (n=309)
%Foreign sales >= 20%
MKTCAP 458.611 93.115 1,954.080 116.787 (0.000) (0.021)
BOARDSIZE 9.493 8.000 10.560 8.000 (0.068) (0.035)
BOARDTIES 9.903 5.500 14.078 9.000 (0.002) (0.000)
%BUSY 0.235 0.200 0.276 0.250 (0.032) (0.017)
NATBOARDTIES 8.215 5.000 11.320 7.000 (0.005) (0.002)
INTBOARDTIES 1.688 0.000 2.757 1.000 (0.007) (0.000)
%INTD 0.080 0.000 0.132 0.111 (0.000) (0.000)Variable definitions (data source): MKTCAP is a firm’s market capitalization in M€ (Worldscope), BOARDSIZE is the size of a firm’s supervisory board and management board as of December 31 of the respective year (hand-collected), BOARDTIES is the number of ties established by board members to other boards, %BUSY is busy board members to board members, NATBOARDTIES is the number of ties established by board mem-bers to German supervisory or management boards, INTBOARDTIES is the number of ties established by board members to non-domestic supervisory or management boards, %INTD is international direc-tors to board members.
Accordingly, internationally oriented firms have a higher percentage of directors hold-
ing international board appointments. However, the univariate results also illustrate that
international sales are more prevalent for bigger firms that usually also have bigger
boards. Hence, I test whether this relationship holds in a multivariate setting. In order to
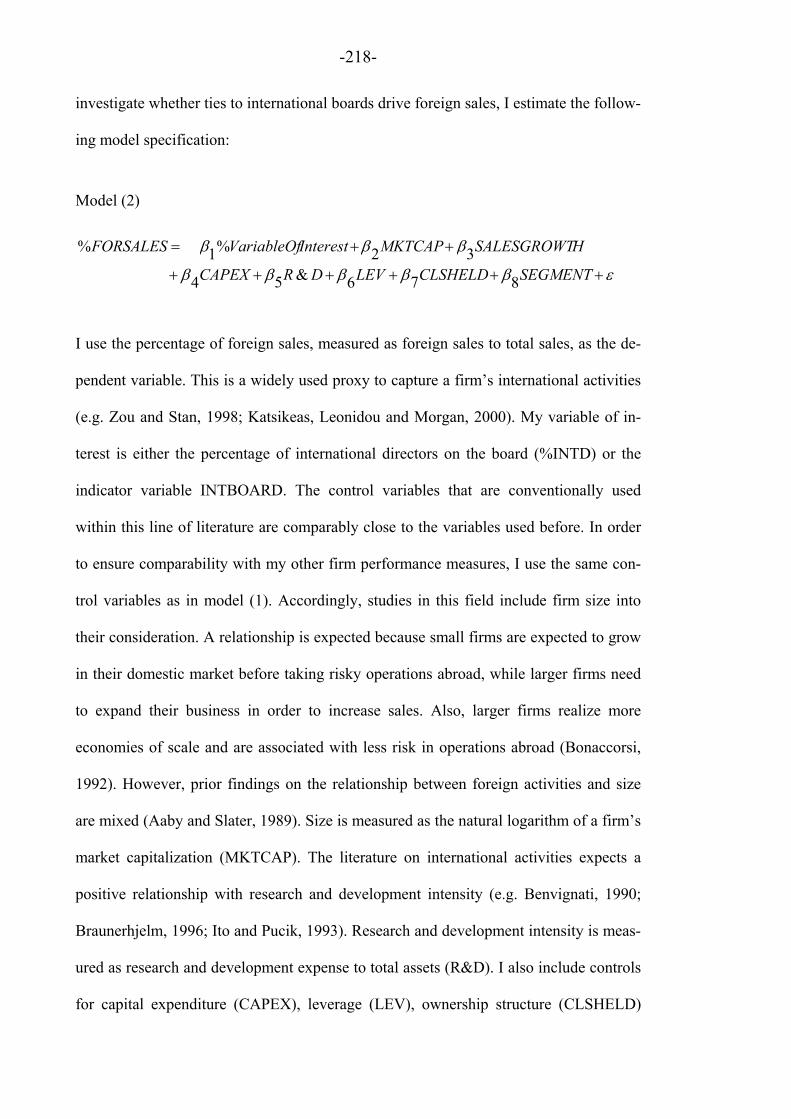
-218-
investigate whether ties to international boards drive foreign sales, I estimate the follow-
ing model specification:
Model (2)
SEGMENTCLSHELDLEVDRCAPEX
HSALESGROWTMKTCAPInterestVariableOfFORSALES
876&54
32%1%
I use the percentage of foreign sales, measured as foreign sales to total sales, as the de-
pendent variable. This is a widely used proxy to capture a firm’s international activities
(e.g. Zou and Stan, 1998; Katsikeas, Leonidou and Morgan, 2000). My variable of in-
terest is either the percentage of international directors on the board (%INTD) or the
indicator variable INTBOARD. The control variables that are conventionally used
within this line of literature are comparably close to the variables used before. In order
to ensure comparability with my other firm performance measures, I use the same con-
trol variables as in model (1). Accordingly, studies in this field include firm size into
their consideration. A relationship is expected because small firms are expected to grow
in their domestic market before taking risky operations abroad, while larger firms need
to expand their business in order to increase sales. Also, larger firms realize more
economies of scale and are associated with less risk in operations abroad (Bonaccorsi,
1992). However, prior findings on the relationship between foreign activities and size
are mixed (Aaby and Slater, 1989). Size is measured as the natural logarithm of a firm’s
market capitalization (MKTCAP). The literature on international activities expects a
positive relationship with research and development intensity (e.g. Benvignati, 1990;
Braunerhjelm, 1996; Ito and Pucik, 1993). Research and development intensity is meas-
ured as research and development expense to total assets (R&D). I also include controls
for capital expenditure (CAPEX), leverage (LEV), ownership structure (CLSHELD)

-219-
and the number of product segments (SEGMENT). All variables are provided by
Worldscope.
Table 16 displays the results of estimating model (2). Specification (1) reports results of
the base model without board variables. The model exhibits a reasonable fit with sales
growth, capital expenditures, research and development intensity and ownership struc-
ture significantly contributing to the model fit. Specifications including the percentage
of international directors (%INTD) and the indicator variable INTBOARD show a posi-
tive and non-significant relationship between the variables of interest and the percentage
of foreign sales. Results might be biased due to a lack of control for a firm’s foreign
orientation. I address this concern by including foreign assets to total assets (World-
scope). I do not include the percentage of foreign assets throughout the investigation
because the number of observations drops to 297 due to missing values for foreign as-
sets. The coefficient of foreign asset intensity is highly significant while the other re-
sults are not materially different. Due to low correlations and VIFs, multicollinearity
does not seem to be a problem when including the percentage of foreign assets.
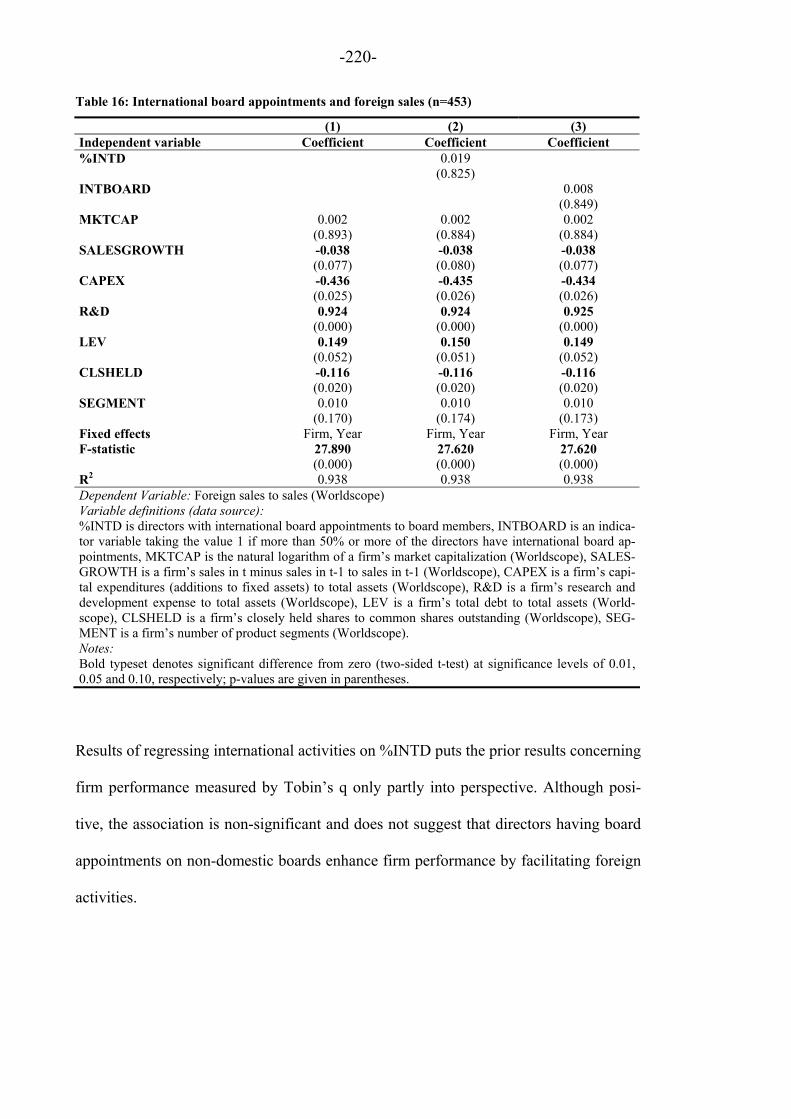
-220-
Table 16: International board appointments and foreign sales (n=453)
(1) (2) (3) Independent variable Coefficient Coefficient Coefficient %INTD 0.019 (0.825) INTBOARD 0.008 (0.849) MKTCAP 0.002 0.002 0.002 (0.893) (0.884) (0.884) SALESGROWTH -0.038 -0.038 -0.038 (0.077) (0.080) (0.077) CAPEX -0.436 -0.435 -0.434 (0.025) (0.026) (0.026) R&D 0.924 0.924 0.925 (0.000) (0.000) (0.000) LEV 0.149 0.150 0.149 (0.052) (0.051) (0.052) CLSHELD -0.116 -0.116 -0.116 (0.020) (0.020) (0.020) SEGMENT 0.010 0.010 0.010 (0.170) (0.174) (0.173) Fixed effects Firm, Year Firm, Year Firm, Year F-statistic 27.890 27.620 27.620 (0.000) (0.000) (0.000) R2 0.938 0.938 0.938 Dependent Variable: Foreign sales to sales (Worldscope) Variable definitions (data source): %INTD is directors with international board appointments to board members, INTBOARD is an indica-tor variable taking the value 1 if more than 50% or more of the directors have international board ap-pointments, MKTCAP is the natural logarithm of a firm’s market capitalization (Worldscope), SALES-GROWTH is a firm’s sales in t minus sales in t-1 to sales in t-1 (Worldscope), CAPEX is a firm’s capi-tal expenditures (additions to fixed assets) to total assets (Worldscope), R&D is a firm’s research and development expense to total assets (Worldscope), LEV is a firm’s total debt to total assets (World-scope), CLSHELD is a firm’s closely held shares to common shares outstanding (Worldscope), SEG-MENT is a firm’s number of product segments (Worldscope). Notes: Bold typeset denotes significant difference from zero (two-sided t-test) at significance levels of 0.01, 0.05 and 0.10, respectively; p-values are given in parentheses.
Results of regressing international activities on %INTD puts the prior results concerning
firm performance measured by Tobin’s q only partly into perspective. Although posi-
tive, the association is non-significant and does not suggest that directors having board
appointments on non-domestic boards enhance firm performance by facilitating foreign
activities.
-221-
4.3.5 Additional tests
Alternative profitability measures
I further scrutinize the relationship between multiple board appointments and firm per-
formance by using other firm profitability measures as dependent variable. Following
prior literature, I use return on assets (ROA) and return on sales (ROS) (Fich and
Shivdasani, 2006; Dittmann, Maug and Schneider, 2010). Results are shown in Ta-
ble 17.
I find a negative relationship between %BUSYD, %COSD and %BANKD and the de-
pendent variables. The coefficients of %COSD (when regressing ROA on %COSD) and
%BANKD are significant. The coefficients of %INTD are positive and significant.
Overall, these results further substantiate the notion that multiple board appointments
are harmful for firm performance. However, the results concerning directors featuring
international board appointments suggest a positive impact on accounting based per-
formance measures.

-222-
Table 17: Multiple board appointments and firm profitability (n=453)
Busy COS Bank International ROA ROS ROA ROS ROA ROS ROA ROS Independent variable Coefficient Coefficient Coefficient Coefficient Coefficient Coefficient Coefficient Coefficient %BUSYD -0.003 -0.066 (0.958) (0.671) %COSD -0.146 -0.348 (0.061) (0.144) %BANKD -0.268 -0.947 (0.038) (0.017) %INTD 0.185 0.909 (0.009) (0.000) SALES 0.030 0.171 0.029 0.170 0.026 0.158 0.030 0.172 (0.146) (0.006) (0.149) (0.007) (0.198) (0.011) (0.139) (0.005) SALESGROWTH 0.044 0.033 0.045 0.035 0.042 0.025 0.046 0.044 (0.033) (0.600) (0.029) (0.576) (0.042) (0.686) (0.024) (0.465) CAPEX 0.091 -0.127 0.083 -0.152 0.091 -0.133 0.095 -0.112 (0.575) (0.799) (0.608) (0.758) (0.573) (0.788) (0.553) (0.816) R&D -0.142 -0.620 -0.136 -0.596 -0.129 -0.564 -0.145 -0.625 (0.413) (0.240) (0.428) (0.257) (0.452) (0.280) (0.397) (0.222) LEV -0.224 -0.518 -0.220 -0.503 -0.213 -0.475 -0.215 -0.469 (0.000) (0.007) (0.001) (0.009) (0.001) (0.013) (0.001) (0.012) CLSHELD -0.017 0.039 -0.011 0.055 -0.016 0.043 -0.019 0.032 (0.683) (0.762) (0.792) (0.664) (0.691) (0.735) (0.650) (0.793) SEGMENT 0.008 0.016 0.007 0.014 0.008 0.019 0.007 0.013 (0.206) (0.387) (0.282) (0.472) (0.170) (0.321) (0.249) (0.492) Fixed effects Firm, Year Firm, Year Firm, Year Firm, Year Firm, Year Firm, Year Firm, Year Firm, Year F-statistic 8.740 9.430 8.860 9.500 8.890 9.640 8.990 10.140 (0.000) (0.000) (0.000) (0.000) (0.000) (0.000) (0.000) (0.000) R2 0.827 0.838 0.829 0.839 0.830 0.841 0.831 0.848 Dependent Variables: ROA is EBIT to total assets (Worldscope), ROS is Sales to total assets (Worldscope). Variable definitions (data source): %BUSYD is busy board members to board members, %COSD is board members holding the position of a chair of supervisory board to board members, %BANKD is direc-tors serving on a bank’s supervisory or management board to board members, %INTD is directors with international board appointments to board members, SALES is the natural logarithm of a firm’s sales (Worldscope), SALESGROWTH is a firm’s sales in t minus sales in t-1 to sales in t-1 (Worldscope), CAPEX is a firm’s capital expendi-tures (additions to fixed assets) to total assets (Worldscope), R&D is a firm’s research and development expense to total assets (Worldscope), LEV is a firm’s total debt to total assets (Worldscope), CLSHELD is a firm’s closely held shares to common shares outstanding (Worldscope), SEGMENT is a firm’s number of product segments (World-scope). Notes: Bold typeset denotes significant difference from zero (two-sided t-test) at significance levels of 0.01, 0.05 and 0.10, respectively; p-values are given in parentheses.
-223-
Endogeneity
As pointed out earlier, endogeneity constitutes a problem throughout the study. One
way to address endogeneity is to use instrumental regressions. In doing so, adequate
instruments need to be found. Roughly, adequate means that the instrument is correlated
with the endogenous regressor but is uncorrelated with the error term of the structural
equation. Utilizing unsuitable instruments will not solve the endogeneity problem. On
the contrary, estimates might be even more biased (Larcker and Rusticus, 2010). Con-
sequently, identifying appropriate instruments is essential. I thought about drawing on
director compensation but results of the first stage were unsatisfactory.
Another way of addressing endogeneity is to include lagged variables. The rationale
behind this idea is that if the lagged variable is able to explain the dependent variable,
the causality runs from the lagged variable to the dependent variable. Using this ap-
proach is comparably common in this line of literature (e.g. Fich and Shivdasani, 2006;
akin Jiraporn et al., 2009). I re-run all regressions and exchange the board variables by
their one year lagged value. Since I do not have board variables for the year 2003, I re-
run the regressions with 302 observations for two cross-sectional years. Since I only
investigate two years, I only include fixed year effects but not fixed firm effects. Alter-
natively, I might have used the t+1 values of all other explanatory variables. Both ap-
proaches come with limitations. When using the t+1 values, I contrast the time period
2005-2007 with my original setting of 2004-2006. In order to maintain comparability, I
favor the alternative. However, this results in loosing observations, which reduces sta-
tistical power. All regressions are provided in the Appendix.
Although the endogeneity tests confirm many of the preceding findings, the tests also
reveal some differences. Particularly, when assessing the Reputation Hypothesis (Ta-
-224-
ble A.1) with the presence of chairmen form other supervisory boards (%COS), I find a
negative and significant relationship (before positive and non-significant). Also, results
from Table A.3 show a negative and significant relationship between Tobin’s q and
BUSYSCORE (before negative and non-significant) and REPUTATIONSCORE (be-
fore negative and marginally non-significant). These results further substantiate a nega-
tive relationship between multiple board appointments and firm performance and that
this relationship is not counteracted by director skills that are expected to have a posi-
tive influence on firm performance.
Notably, the endogeneity tests show differing results in the following cases: The tests
reveal a positive and non-significant relationship between the number of additional
board appointments held by the COS (before negative and significant) and CEO (before
negative and insignificant). The coefficient of %BANKD is now negative and margin-
ally non-significant (before positive and non-significant). The coefficient of %INTD is
now positive and non-significant (before negative and marginally non-significant).
Taken all together, the endogeneity tests further substantiate the notion that multiple
board appointments harm firm performance. Since I include the lagged board variables,
the results suggest that the causality runs from the board variables to firm performance
and not that firms with bad performance attract directors with multiple board appoint-
ments. However, the endogeneity tests also produce some mixed results which indicate
that the results need to be interpreted with caution. Whether the mixed results originate
from lagging the variables or the decreased power of statistical inferences due to the
exclusion of one cross-section cannot be assessed conclusively.
-225-
Employee representation
A particularity of the German board system is the legally coded employee representa-
tion on the supervisory board. Theoretical implications of codetermination rights on
firm value are unclear. Since codetermination is imposed on firms, a firm’s resulting
governance might deviate from its efficient structure that would materialize naturally.
However, legally coded employee representation might mitigate frictions that for exam-
ple arise from coordination problems stemming from unilaterally introduced employee
representation (Fauver and Fuerst, 2006). Gorton and Schmid (2004) find that an in-
crease in employee representation from one-third of the supervisory board size to one-
half destroys firm value. Results of Fauver and Fuerst (2006) suggest the existence of an
inverse U-shaped relationship between employee representation and firm value.
One possibility to test whether employee representation influences my results would be
by introducing a control variable that measures the percentage of employee representa-
tion on the board. However, employee representation is regulatory driven and depends
on a firm’s total employees. Depending on the number of employees, it will be around
zero, one-third and half of the supervisory board’s size. Hence, I follow Dittmann,
Maug and Schneider (2010). In their study that deals with bank representation on the
board, they exclude employee representatives from their analysis. Doing so imposes
restrictions on my sample because unfortunately, not all firms report which of their su-
pervisory directors are employee representatives. This gives rise to the danger to con-
found firms that are not required to have employee representation on their board with
firms that do not disclose it. In order to avoid this problem, I delete all observation that
have more than 500 employees but provide no information on employee representation.
This leads to a sample of 315 firm year observations (before: 453 firm year observa-
tions).
-226-
Of course, this substantially limits comparability with results of my base sample. Con-
sequently, I do not re-run all of my regressions but focus on specifications where I try to
disentangle the Busyness and the Reputation Hypotheses using the busyness and reputa-
tions score. My results are not materially different from the previous results and are
consistent with the notion that multiple board appointments are harmful for firm per-
formance. The coefficients are negative but non-significant at common significance
levels (Table A.8). However, I refrain from over interpreting these results due to the
mentioned shortcomings.
5 Summary and conclusions
I investigate the effect of multiple board appointments on firm performance using a
sample of publicly listed German firms. The incidence of multiple board appointments
is interesting in the light of competing explanations for their existence and differing
implications for firm performance. At the same time, a sound understanding of their
existence and their implications is of relevance in the endeavor to develop appropriate
corporate governance guidelines. The topic has already received a great deal of attention
from the academic side. I deploy measures used in prior literature to classify directors
holding multiple board appointments and contribute to the literature by investigating a
new aspect: board appointments held in non-domestic firms.
I first contrast the Busyness Hypothesis and the Reputation Hypothesis. Explicitly
pointing towards the circumstance that many of my variables of interest are non-
significant at common significance levels, the results of the first part of the analysis
support the Busyness Hypothesis and the notion that multiple board appointments are
harmful for firm performance. This finding is not counteracted by director skills that are
expected to enhance firm performance. These findings can be interpreted in three ways.
-227-
First, it might reflect the inappropriateness of my chosen proxy to reflect director skills.
Second, the result can be seen to be in line with Biehler and Ortmann (1985) who argue
that the (supervisory) board is also perceived as an instrument of representation. Conse-
quently, being the chair of a supervisory board on another firm might be used as a signal
to reassure stakeholders but does not necessarily mean that the individual is particularly
suitable to fulfill its task. Third, it might reflect the circumstance that the individual is
too busy fulfilling its task since being the chairman of a supervisory board is particu-
larly time consuming. The latter argument is partly fuelled by the circumstance that I
find a negative and significant relationship between additional seats held by the sample
firms’ chairman of the supervisory board and firm performance. I find no such associa-
tion between additional seats held by the CEO.
In the second part of the analysis, I investigate the effect of having bank representatives
on the board on firm performance. I find a positive and non-significant relationship, and
a negative and significant relationship between return on assets and return on sales.
Since I do not investigate possible channels of this effect, I refrain from speculating of
how bank representation affects firm performance. Yet, two things should be noted.
First, the finding suggests that multiple board appointment are not harmful for firm per-
formance per se and puts the finding from the first part into perspective. Second, it
should be mentioned that accounting-based measures are less suitable in capturing di-
rector expertise and networks (Hillman, 2005). In this respect, my findings suggest a
positive market valuation but a negative relationship with historical performance.
Hence, a more cautious and a more conservative investing style naturally come into
mind and might be worth to be investigated.
-228-
In the third part of the analysis, I investigate the effect of international directors on firm
performance. I call these individuals “international directors”, although I do not draw on
their nationality but the circumstance that they work on international, i.e. non-domestic
boards. I find a negative and marginally non-significant impact on Tobin’s q. However,
I find a positive and significant relationship with return on assets and return on sales. I
also find a positive but weak relationship with foreign activities. Of course, these mixed
results are puzzling. Yet, they are consistent with my prior findings whereby busy direc-
tors negatively affect firm performance. Directors with international board appointments
might be negatively valued by the market since they are associated with over-
commitment for example due to an increased work load that might stem from preparing
documents that are in a foreign language or from considerable more traveling time. Yet,
the positive relationship with the backward looking profitability measures might be ex-
plained in the light of facilitating operative transactions and contracting by the help of a
broader network. This explanation is also in line with the positive relationship between
international directors and foreign activities. Still, results are too mixed to be over inter-
preted.
Overall, the results of the study are not unequivocal but the majority of the found evi-
dence points towards the notion that multiple board appointments have a negative im-
pact on firm performance as measured by Tobin’s q. Yet, the results also illustrate the
ambiguity of the relationship between multiple board appointments and firm perform-
ance. Although multiple board appointments are negatively connotated, their influence
on firm performance is not negative per se. In this respect, the results support the idea
that board effectiveness cannot be ensured by putting restrictions on multiple board ap-
pointments. Rather, active board members need to assess in which form board effec-
tiveness might benefit from appointing a certain director to the board. At the same time,

-229-
appointed directors need to assess whether they are able to fulfill all their responsibili-
ties when taking any additional board appointments. This might seem like a somewhat
naïve statement in the light of self-interests and selfish behavior and directly leads to the
question whether other control mechanisms could be helpful in ensuring that board di-
rectors do not take too many board appointments. On the one hand, this might be
achieved by self-imposed corporate guidelines. The advantage of self-imposed corpo-
rate guidelines lies in higher flexibility. For example, smaller firms might allow more
multiple board appointments than bigger firms, or the guidelines might be more specific
with regard to activities on other boards. On the other hand, directors need to question
board effectiveness constantly and directors need to assess whether board effectiveness
suffers from directors that burden too many responsibilities on themselves.
My findings are prone to several limitations. An essential step within the investigation
is the classification of the directors and the boards. Several problems arise in this en-
deavor. The Busyness Hypothesis draws on time restrictions of overcommitted direc-
tors. In this respect, classifying directors as busy measured by the number of director-
ships is objectively comprehensible. At the same time, necessary data is available in the
financial statements. The Reputation Hypothesis draws on benefits that materialize from
skills, experience and networks. Finding an objectively comprehensible proxy that re-
flects the aforementioned director characteristics is much more complicated. Conse-
quently, the used proxy variables are prone to noise. Also, work and decision-finding
processes within a board are not observable for outsiders. Hence, it is difficult to assess
whether it is more severe when certain individuals are busy, and also, what additional
work load causes their busyness. To some extent, I address these concerns by building
scores that aim at alleviating the aforementioned shortcomings. Still, these scores can
only cover a limited range of an individual’s characteristics and thus, are prone to in-

-230-
completeness. Also, for the busyness score I use weights that are not chosen with regard
to a clear theoretical basis but feature a certain erratic component in order to symbolize
that different tasks exhibit different time requirements.
Data availability exacerbates test designs. For example, it seems crucial to develop ex-
tensive but thorough measures to classify directors. This does not only comprise educa-
tional background and work experience but more complex measures as inclusion in
networks. This is no easy endeavor. Hwang and Kim (2009) demonstrate that ties also
arise from similar regional or educational origins. Other possible dimensions are prior
membership to the management (Bresser and Thiele, 2008) or union affiliations (Fauver
and Fuerst, 2006). Also, the observation period is of great importance for example in
order to conclude on causality. It is also difficult to assess how long a tie must exist in
order to affect e.g. foreign sales. This points towards the necessity for longitudinal stud-
ies over a reasonably long period. An issue related to this concern is that of broken ties.
It is unclear how long a tie needs to be maintained. After the initial contact has been
established, other means of communication could be used.
Econometric issues exacerbates the validity of inferences. A common difficulty in this
line of research arises from endogeneity. The causality between firm performance and
multiple board appointments can work in both ways. On the one hand, board appoint-
ments can lead to overcommitted directors which can be harmful for the firm. On the
other hand, firms exhibiting poor performance might actively search for skilled directors
and offer them an additional appointment. I try to address the problem of endogeneity
by re-running my regressions including the lag of my variables of interest. Results are
not entirely robust to the alternative model specification, indicating that endogeneity
might confound my results.

-231-
The stream of literature dealing with multiple board appointments is growing. The inci-
dence of multiple board appointments, especially in Germany, still offers ample re-
search questions. With regard to subsequent research, it seems reasonable to take a step
back and get a more sophisticated understanding of what determines the number of seats
held on an individual level. Then, a more sophisticated understanding on what deter-
mines the board composition is needed. As shown in prior literature, it is difficult to
predict the impact of directors holding multiple board appointments on firm characteris-
tics. To some extent, this is due to the manifold possible impacts that are conceivable.
In this respect, it seems vital to propose a specific measure that is able to clearly capture
effects of holding multiple board appointments.

-232-
References
Aaby, N. and Slater, S. F. (1989), Management influence on export performance: A
review of the empirical literature 1978-1988, International Marketing Review,
Vol. 6, pp. 7-22.
Adams, R. B. and Ferreira, D. (2009), Women in the boardroom and their impact on
governance and performance, Journal of Financial Economics, Vol. 94, pp. 291-
309.
Adams, R. B., Hermalin, B. E. and Weisbach, M. S. (2010), The Role of Boards of Di-
rectors in Corporate Governance: A Conceptual Framework and Survey, Journal
of Economic Literature, Vol. 48, pp. 58-107.
Alam, Z. S., Chen, M. A., Ciccotello, C. S. and Ryan H. E. (2010), Does the location of
directors matter? Information acquisition and board decisions, Working Paper.
Albach, H. and Kless, H. (1982), Personelle Verflechtungen bei deutschen Industrieak-
tiengesellschaften, Zeitschrift für Betriebswirtschaft, Vol. 52, pp. 959-977.
Allen, M. P. (1974), The Structure of Interorganizational Elite Cooptation: Interlocking
Corporate Directorates, American Sociological Review, Vol. 39, pp. 393-406.
Balsmeier, B. and Peters, H. (2009), Personelle Unternehmensverflechtung und Vor-
standsgehälter, Zeitschrift für Betriebswirtschaft, Vol. 79, pp. 967-984.
Balsmeier, B., Buchwald, A. and Peters, H. (2009), Auswirkungen von Mehrfachman-
daten deutscher Vorstands- und Aufsichtsratsvorsitzender auf den Unterneh-
menserfolg, Arbeitspapier des Sachverständigenrat zur Begutachtung der ge-
samtwirtschaftlichen Entwicklung.
Bazerman, M. H. and Schoorman, F. D. (1983), A limited rationality model of inter-
locking directorates, Academy of Management Review, Vol. 8, pp. 206-217.
Benvignati, A. M. (1990), Industry determinants and “differences” in U.S. intrafirm and
arms-length exports, The Review of Economics and Statistics, Vol. 72, pp. 481-
488.
Bernhardt, W. (1994), Keine Aufsicht und schlechter Rat? Zum Meinungsstreit um
deutsche Aufsichtsräte, Zeitschrift für Betriebswirtschaft, Vol. 64, pp. 1341-
1350.

-233-
Beyer, J. (1996), Governance Structures – Unternehmensverflechtungen und Unterneh-
menserfolg in Deutschland, Zeitschrift für Betriebswirtschaft, ZfB-
Ergänzungsheft 3/96, pp. 79-101.
Biehler, H. and Ortmann, R. (1985), Personelle Verbindungen zwischen Unternehmen,
Die Betriebswirtschaft, Vol. 45, pp. 4-18.
Bonaccorsi, A. (1992), On the relationship between firm size and export intensity, Jour-
nal of International Business Studies, Vol. 23, pp. 605-635.
Booth, J. and Deli, D. (1996), Factors affecting the number of outside directorships held
by CEOs, Journal of Financial Economics, Vol. 40, pp. 81-104.
Booth, J. and Deli, D. (1999), On executives of financial institutions as outside direc-
tors, Journal of Corporate Finance, Vol. 5, pp. 227-250.
Brandeis, L. D. (1914), Other People’s Money, New York, available under:
http://www.law.louisville.edu/library/collections/brandeis/node/191
(01.02.2011).
Braunerhjelm, P. (1996), The Relation Between Firm-Specific Intangibles and Exports,
Economic Letters, Vol. 53, pp. 213-219.
Bresser, R. K. F. and Thiele, R. V. (2008), Ehemalige Vorstandsvorsitzende als Auf-
sichtsratschefs: Evidenz zu ihrer Effektivität im Falle des erzwungenen Füh-
rungswechsels, Zeitschrift für Betriebswirtschaft, Vol. 78, pp. 175-203.
Burt, R. S. (1980), Cooptive corporate actor networks: A reconsideration of interlocking
directorates involving American manufacturing, Administrative Science Quar-
terly, Vol. 25, pp. 557-582.
Business Roundtable (2005), Principles of Corporate Governance, available under:
http://www.businessroundtable.org/sites/default/files/corporateGovPrinciples.pdf
(01.02.2011)
Byrd, D. T. and Mizruchi, M. S. (2005), Bankers on the board and the debt ratio of
firms, Journal of Corporate Finance, Vol. 11, pp. 129-173.
Campbell, K., and Mínguez-Vera, A. (2008), Gender diversity in the boardroom and
firm financial performance, Journal of Business Ethics, Vol. 81, pp. 435-451.
-234-
Carpenter, M. A. and Westphal, J. D. (2001), The strategic context of external network
ties: Examining the impact of director appointments on board involvement in
strategic decision making, Academy of Management Journal, Vol. 44, pp. 639-
660.
Carter, D. A., Simkins, B. J. and Simpson, W. G. (2003), Corporate governance, board
diversity, and firm value, Financial Review, Vol. 38, pp. 33-53.
Core, J. E., Holthausen, R. W. and Larcker, D. E. (1999), Corporate Governance, Chief
Executive Compensation, and Firm Performance, Journal of Financial Econom-
ics, Vol. 51, pp. 371-406.
Council of Institutional Investors (2009), Corporate Governance Policies, available un-
der:
http://www.cii.org/UserFiles/file/council%20policies/CII%20Full%20Corp%20
Gov%20Policies%205-7-09.pdf (01.02.2011).
Dalton, D. R., Daily, C. M., Ellstrand, A. E. and Johnson, J. L. (1998), Meta-analytic
reviews of board composition, leadership structure, and financial performance,
Strategic Management Journal, Vol. 19, pp. 269-290.
Dooley, P. C. (1969), The interlocking directorate, The American Economic Review,
Vol. 59, pp. 314-323.
Dittmann, I., Maug, E. G. and Schneider, C. (2010), Bankers on the boards of German
firms: What they do, what they are worth, and why they are (still) there, Review
of Finance, Vol. 14, pp. 35-71.
Fama, E. F. and Jensen, M. C. (1983), The separation of ownership and control, Journal
of Law and Economics, Vol. 26, pp. 301-325.
Fauver, L. and Fuerst, M. E. (2006), Does Good Corporate Governance Include Em-
ployee Representation? Evidence from German Corporate Boards, Journal of
Financial Economics, Vol. 82, pp. 673-710.
Ferris, S. P. and Jagannathan, M. (2001), The incidence and determinants of multiple
corporate directorships, Applied Economics Letters, Vol. 8, pp. 31-35.
Ferris, S. P., Jagannathan, M. and Pritchard, A. C. (2003), Too busy to mind the busi-
ness? Monitoring by directors with multiple board appointments, Journal of Fi-
nance, Vol. 58, pp. 1087-1111.

-235-
Fich, E. M. and White, L. J. (2003), CEO compensation and turnover: the effects of
mutually interlocked boards, Wake Forest Law Review, Vol. 38, pp. 935-959.
Fich, E. M. and White, L. J. (2005), Why do CEOs reciprocally sit on each other’s
board?, Journal of Corporate Finance, Vol. 11, pp. 175-195.
Fich, E. M., and Shivdasani, A. (2006), Are busy boards effective monitors?, Journal of
Finance, Vol. 61, pp. 689-724.
Fligstein, N. and Brantley, P. (1992), Bank Control, Owner Control or Organizational
Dynamics: Who Controls the Modern Corporation, American Journal of Sociol-
ogy, Vol. 98, pp. 280-307.
Gorton, G. and Schmid, F. A. (2000), Universal Banking and the Performance of Ger-
man Firms, Journal of Financial Economics, Vol. 58, pp. 29-80.
Gorton, G. and Schmid, F. A. (2004), Capital, labor, and the firm: A study of German
codetermination, Journal of the European Economic Association, Vol. 2, pp.
863-905.
Graybow, M. (2008), Lifting the Lid - Firms struggle to globalize the boardroom,
Reuters, December 2 available under:
http://www.reuters.com/article/2008/12/02/column-lifting-idINN022598022008
1202 (01.02.2011).
Hallock, K. F. (1997), Reciprocally interlocking boards of directors and executive com-
pensation, Journal of Financial and Quantitative Analysis, Vol. 32, pp. 331-344.
Heinze, T. (2002), Die Struktur der Personalverflechtung großer deutscher Aktienge-
sellschaften zwischen 1989 und 2001, Zeitschrift für Soziologie, Vol. 31, pp.
391-410.
Hermalin, B. E. and Weisbach, M. S. (1988), The Determinants of Board Composition,
RAND Journal of Economics, Vol. 19, pp. 589-606.
Hermalin, B. E. and Weisbach, M. S. (1991), The effects of board compensation and
direct incentives on firm performance, Financial Management, Vol. 20, pp. 101-
112.
Hillman, A. J. (2005), Politicians on the Board of Directors: Do Connections Affect the
Bottom Line?, Journal of Management, Vol. 31, pp. 464-481.
-236-
Hwang, B. and Kim, S. (2009), It Pays to Have Friends, Journal of Financial Econom-
ics, Vol. 93, pp. 138-158.
Ito, K. and Pucik, V. (1993), R&D Spending, Domestic Competition, and Export Per-
formance of Japanese Manufacturing Firms, Strategic Management Journal,
Vol. 14, pp. 61-75.
John, K., Knyazeva, A. and Knyazeva, D. (2011), Does Geography Matter? Firm Loca-
tion and Corporate Payout Policy, Journal of Financial Economics, Forthcom-
ing.
Jiraporn, P., Davidson, W. N., DaDalt, P. and Ning, Y. (2009), Too busy to show up?
An analysis of directors’ absences, The Quarterly Review of Economics and Fi-
nance, Vol. 49, pp. 1159-1171.
Jiraporn, P., Singh, M. and Lee, C. I. (2009), Ineffective corporate governance: Director
busyness and board committee memberships, Journal of Banking & Finance,
Vol. 33, pp. 819-829.
Johnson, J. L., Daily, C. M. and Ellstrand, A. E. (1996), Boards of Directors: a review
and research agenda, Journal of Management, Vol. 22, pp. 409-438.
Katsikeas, C. S., Leonidou, L. C. and Morgan, N. A. (2000), Firm-level export perform-
ance assessment: Review, Evaluation, and Development, Journal of the Acad-
emy of Marketing Science, Vol. 28, pp. 493-511.
Klein, A. (1998), Firm Performance and Board Committee Structure, Journal of Law
and Economics, Vol. 41, pp. 275-303.
Koenig, T., Gogel, R. and Sonquist, J. (1979), Models of the significance of interlock-
ing corporate directorates, American Journal of Economics and Sociology, Vol.
38, pp. 173-186.
Kroszner, R. S. and Strahan, P. E. (2001), Bankers on Boards: Monitoring, Conflicts of
Interest, and Lender Liability, Journal of Financial Economics, Vol. 62, pp. 415-
452.
Kuck, D. (2006), Aufsichtsräte und Beiräte in Deutschland: Rahmenbedingungen, An-
forderungen, professionelle Auswahl, Gabler, Wiesbaden.
-237-
Lang, L. H. P. and Stulz, R. M. (1994), Tobin’s q, Corporate Diversification, and Firm
Performance, Journal of Political Economy, Vol. 102, pp. 1248-1280.
Larcker, D. F. and Rusticus, T. O. (2010), On the use of instrumental variables in ac-
counting research, Journal of Accounting and Economics, Vol. 49, pp. 186-205.
Link, J. S., Netter, J. M. and Yang T. (2008), The Determinants of Board Structure,
Journal of Financial Economics, Vol. 87, pp. 308-328.
Loderer, C. and Peyer, U. (2002), Board overlap, seat accumulation and share prices,
European Financial Management, Vol. 8, pp. 165-192.
Lutter, M. and Krieger, G. (2008), Rechte und Pflichten des Aufsichtsrats, 5th ed., O.
Schmidt, Köln.
Masulis, R., Wang, C. and Xie, F. (2010), Globalizing the boardroom – The effects of
foreign directors on corporate governance and firm performance, Working Pa-
per.
Miczaika, J. and Witt, P. (2004), Personelle Verflechtungen, Vorstandsvergütung und
Aktionärsrendite, Conference Paper – Symposium zur Ökonomischen Analyse
der Unternehmung.
Mintz, B. and Schwartz, M. (1981), Interlocking directorates and interest group forma-
tion, American Sociological Review, Vol. 46, pp. 851-869.
Mizruchi, M. S. (1996), What do interlocks do? An analysis, critique and assessment of
research on interlocking directorates, Annual Review of Sociology, Vol. 22, pp.
271-298.
Mizruchi, M. S. and Stearns, L. B. (1988), A Longitudinal Study of the Formation of
Interlocking Directorates, Administrative Science Quarterly, Vol. 33, pp. 194-
210.
Palmer, D. (1983), Broken ties: Interlocking directorates and intercorporate coordina-
tion, Administrative Science Quarterly, Vol. 28, pp. 40-55.
Pennings, J. (1980), Interlocking Directorates, Jossey-Bass, San Francisco.
Perry, T. and Peyer, U. (2005), Board seat accumulation by executives: A shareholder’s
perspective, Journal of Finance, Vol. 60, pp. 2083-2123.

-238-
Pfannschmidt, A. (1995), Mehrfachmandate in deutschen Unternehmen, Zeitschrift für
Betriebswirtschaft, Vol. 65, pp. 177-203.
Richardson, R. J. (1987), Directorship interlocks and corporate profitability, Adminis-
trative Science Quarterly, Vol. 32, pp. 367-386.
Schmid, S. and Daniel, A. (2007), Die Internationalität der Vorstände und Aufsichtsräte
in Deutschland, Bertelsmann Stiftung, Gütersloh.
Schoorman, F. D., Bazerman, M. H. and Atkin, R. S. (1981), Interlocking directorates:
A strategy for reducing environmental uncertainty, Academy of Management
Review, Vol. 6, pp. 243-251.
Schreyögg, G. and Papenheim-Trockhorn, H. (1995), Dient der Aufsichtsrat dem Auf-
bau zwischenbetrieblicher Kooperationsbeziehungen?, Zeitschrift für Betriebs-
wirtschaft, Vol. 65, pp. 205-230.
Schwalbach, J. (2004), Effizienz des Aufsichtsrats, Die Aktiengesellschaft, Vol. 4, pp.
186-190.
Smith, C. W. and Watts, R. L. (1992), The investment opportunity set and corporate
financing, dividend and compensation policies, Journal of Financial Economics,
Vol. 40, pp. 263-292.
Uysal, V. B., Kedia, S. and Panchapagesan, V. (2008), Geography and acquirer returns,
Journal of Financial Intermediation, Vol. 17, pp. 256-275.
Yermack, D. (1996), Higher Market Valuation for Firms with a Small Board of Direc-
tors, Journal of Financial Economics, Vol. 40, pp. 185-211.
Zahra, S. A. and Pearce, J. A. (1989), Boards of directors and corporate financial per-
formance: a review and integrative model, Journal of Management, Vol. 15, pp.
291-334.
Zajac, E. J. (1988), Interlocking directorates as an inter-organizational strategy: A test
of critical assumptions, Academy of Management Journal, Vol. 31, pp. 428-438.
Zhou, X. (2001), Understanding the determinants of managerial ownership and the link
between ownership and performance: comment, Journal of Financial Econom-
ics, Vol. 62, pp. 559-571.

-239-
Ziegler, R. (1984), Das Netz der Personen und Kapitalverflechtungen deutscher und
österreichischer Wirtschaftsunternehmen, Kölner Zeitschrift für Soziologie und
Sozialpsychologie, Vol. 36, pp. 557-584.
Zou, S. and Stan, S. (1998), The Determinants of Export Performance: A Review of the
Empirical Literature Between 1987 and 1997, International Marketing Review,
Vol. 15, pp. 333-356.

-240-
Appendix
Table A.1: Busyness vs. Reputation Hypothesis (n=302)
(1) (2) (3) (4) (5) (6) Independent variable Coefficient Coefficient Coefficient Coefficient Coefficient Coefficient %BUSYD -0.388 -0.069 (0.157) (0.823) BUSYBOARD -0.090 -0.012 (0.528) (0.936) %COS -1.289 -1.231 (0.009) (0.027) COSBOARD -0.213 -0.211 (0.033) (0.042) SALES 0.010 -0.001 0.014 0.018 0.015 0.018 (0.706) (0.960) (0.580) (0.486) (0.556) (0.489) SALESGROWTH 0.791 0.817 0.776 0.773 0.774 0.774 (0.000) (0.000) (0.000) (0.000) (0.000) (0.000) CAPEX 0.271 0.296 0.374 0.534 0.362 0.529 (0.786) (0.767) (0.705) (0.592) (0.714) (0.597) R&D 2.973 2.798 2.957 2.837 2.992 2.847 (0.002) (0.004) (0.002) (0.003) (0.002) (0.003) LEV -1.120 -1.116 -1.139 -1.161 -1.138 -1.160 (0.000) (0.000) (0.000) (0.000) (0.000) (0.000) CLSHELD -0.010 0.009 -0.045 -0.025 -0.046 -0.025 (0.954) (0.962) (0.804) (0.889) (0.802) (0.893) SEGMENT 0.042 0.041 0.045 0.039 0.045 0.040 (0.184) (0.191) (0.152) (0.207) (0.151) (0.207) Fixed effects Year Year Year Year Year Year F-statistic 129.460 128.590 132.140 130.850 119.740 118.550 (0.000) (0.000) (0.000) (0.000) (0.000) (0.000) R2 0.195 0.191 0.208 0.202 0.209 0.202 Dependent Variable: Tobin’s q (Worldscope) Notes: Board variables are lagged by one year. Bold typeset denotes significant difference from zero (two-sided t-test) at significance levels of 0.01, 0.05 and 0.10, respectively; p-values are given in parentheses.

-241-
Table A.2: Appointments held by COS and CEO and Tobin’s q (n=302)
(1) (2) (3) Independent variable Coefficient Coefficient Coefficient COSSEATS 0.003 0.003 (0.895) (0.908) NONCOSSEATS -0.126 (0.087) CEOSEATS -0.024 -0.022 (0.608) (0.645) NONCEOSEATS -0.082 (0.162) NONCOSCEOSEATS -0.101 (0.107) SALES 0.017 0.016 0.017 (0.533) (0.595) (0.567) SALESGROWTH 0.784 0.779 0.783 (0.000) (0.000) (0.000) CAPEX 0.258 0.218 0.214 (0.795) (0.827) (0.831) R&D 3.174 3.088 3.155 (0.001) (0.002) (0.001) LEV -1.107 -1.120 -1.100 (0.000) (0.000) (0.000) CLSHELD -0.020 -0.016 -0.014 (0.913) (0.929) (0.940) SEGMENT 0.042 0.043 0.043 (0.182) (0.174) (0.178) Fixed effects Year Year Year F-statistic 117.870 117.560 107.760 (0.000) (0.000) (0.000) R2 0.198 0.197 0.199 Dependent Variable: Tobin’s q (Worldscope) Notes: Board variables are lagged by one year. Bold typeset denotes significant difference from zero (two-sided t-test) at significance levels of 0.01, 0.05 and 0.10, respectively; p-values are given in parentheses.
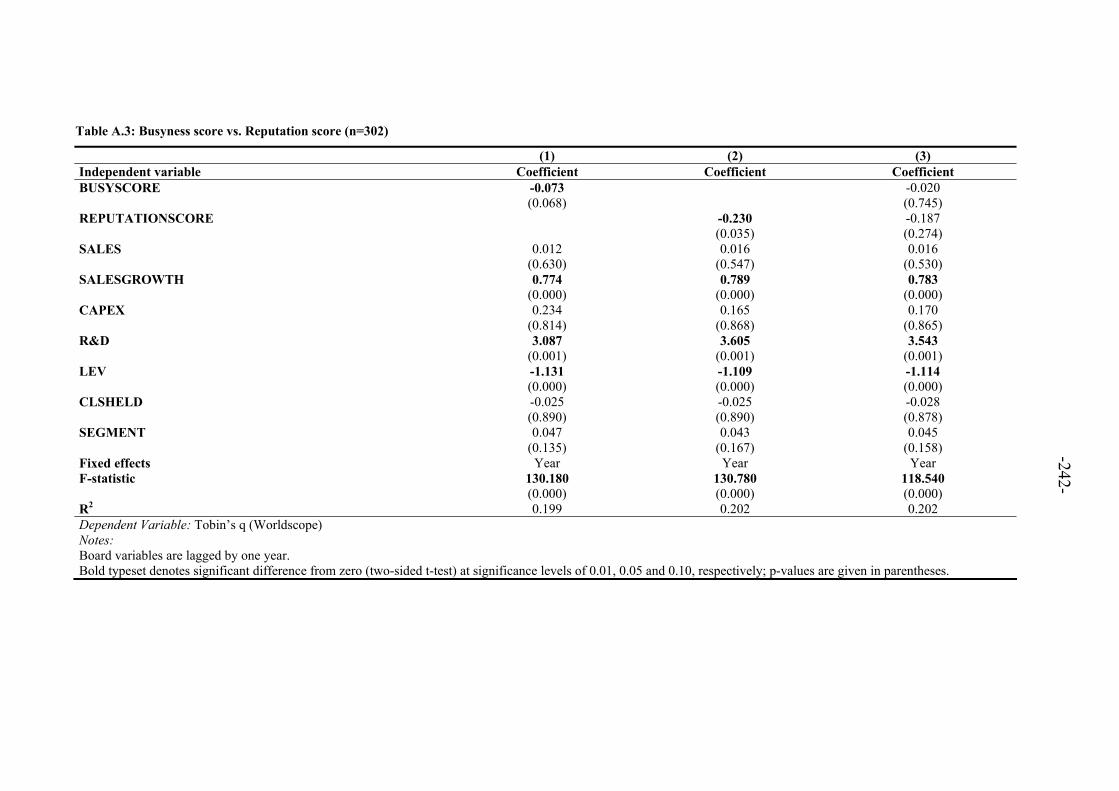
-242-
Table A.3: Busyness score vs. Reputation score (n=302)
(1) (2) (3) Independent variable Coefficient Coefficient Coefficient BUSYSCORE -0.073 -0.020 (0.068) (0.745) REPUTATIONSCORE -0.230 -0.187 (0.035) (0.274) SALES 0.012 0.016 0.016 (0.630) (0.547) (0.530) SALESGROWTH 0.774 0.789 0.783 (0.000) (0.000) (0.000) CAPEX 0.234 0.165 0.170 (0.814) (0.868) (0.865) R&D 3.087 3.605 3.543 (0.001) (0.001) (0.001) LEV -1.131 -1.109 -1.114 (0.000) (0.000) (0.000) CLSHELD -0.025 -0.025 -0.028 (0.890) (0.890) (0.878) SEGMENT 0.047 0.043 0.045 (0.135) (0.167) (0.158) Fixed effects Year Year Year F-statistic 130.180 130.780 118.540 (0.000) (0.000) (0.000) R2 0.199 0.202 0.202 Dependent Variable: Tobin’s q (Worldscope) Notes: Board variables are lagged by one year. Bold typeset denotes significant difference from zero (two-sided t-test) at significance levels of 0.01, 0.05 and 0.10, respectively; p-values are given in parentheses.
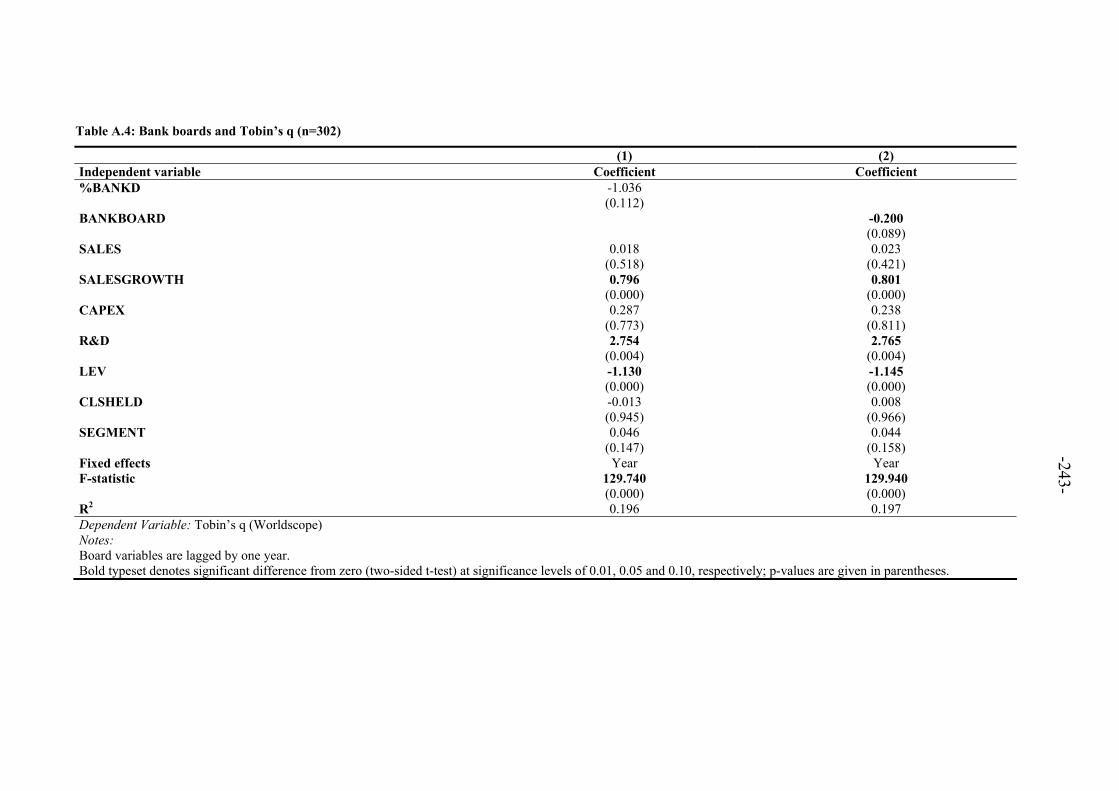
-243-
Table A.4: Bank boards and Tobin’s q (n=302)
(1) (2) Independent variable Coefficient Coefficient %BANKD -1.036 (0.112) BANKBOARD -0.200 (0.089) SALES 0.018 0.023 (0.518) (0.421) SALESGROWTH 0.796 0.801 (0.000) (0.000) CAPEX 0.287 0.238 (0.773) (0.811) R&D 2.754 2.765 (0.004) (0.004) LEV -1.130 -1.145 (0.000) (0.000) CLSHELD -0.013 0.008 (0.945) (0.966) SEGMENT 0.046 0.044 (0.147) (0.158) Fixed effects Year Year F-statistic 129.740 129.940 (0.000) (0.000) R2 0.196 0.197 Dependent Variable: Tobin’s q (Worldscope) Notes: Board variables are lagged by one year. Bold typeset denotes significant difference from zero (two-sided t-test) at significance levels of 0.01, 0.05 and 0.10, respectively; p-values are given in parentheses.
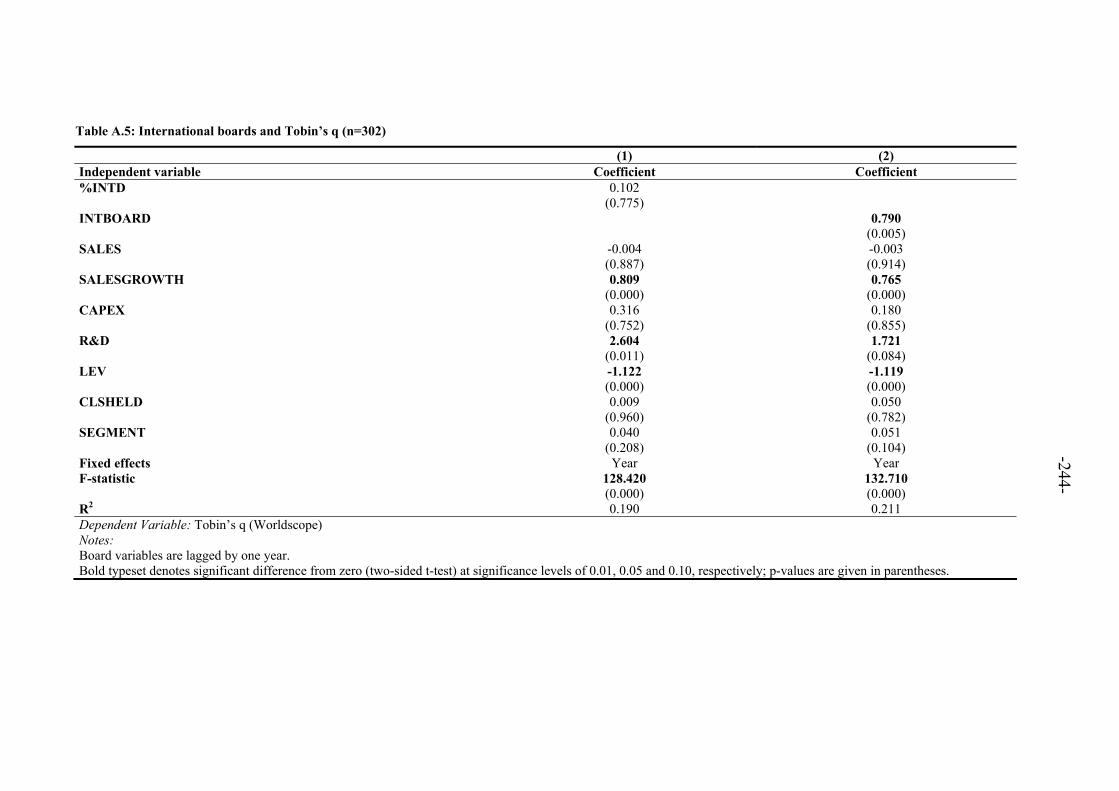
-244-
Table A.5: International boards and Tobin’s q (n=302)
(1) (2) Independent variable Coefficient Coefficient %INTD 0.102 (0.775) INTBOARD 0.790 (0.005) SALES -0.004 -0.003 (0.887) (0.914) SALESGROWTH 0.809 0.765 (0.000) (0.000) CAPEX 0.316 0.180 (0.752) (0.855) R&D 2.604 1.721 (0.011) (0.084) LEV -1.122 -1.119 (0.000) (0.000) CLSHELD 0.009 0.050 (0.960) (0.782) SEGMENT 0.040 0.051 (0.208) (0.104) Fixed effects Year Year F-statistic 128.420 132.710 (0.000) (0.000) R2 0.190 0.211 Dependent Variable: Tobin’s q (Worldscope) Notes: Board variables are lagged by one year. Bold typeset denotes significant difference from zero (two-sided t-test) at significance levels of 0.01, 0.05 and 0.10, respectively; p-values are given in parentheses.

-245-
Table A.6: International board appointments and foreign sales (n=302)
(1) (2) Independent variable Coefficient Coefficient %INTD 0.398 (0.001) INTBOARD 0.108 (0.273) MKTCAP 0.030 0.035 (0.001) (0.000) SALESGROWTH -0.168 -0.171 (0.008) (0.008) CAPEX -0.348 -0.346 (0.310) (0.322) R&D 0.032 0.292 (0.925) (0.392) LEV 0.089 0.105 (0.353) (0.282) CLSHELD 0.020 0.013 (0.747) (0.844) SEGMENT 0.012 0.014 (0.268) (0.211) Fixed effects Firm, Year Firm, Year F-statistic 70.230 67.150 (0.000) (0.000) R2 0.121 0.093 Dependent Variable: Foreign sales to sales (Worldscope) Notes: Board variables are lagged by one year. Bold typeset denotes significant difference from zero (two-sided t-test) at significance levels of 0.01, 0.05 and 0.10, respectively; p-values are given in parentheses.
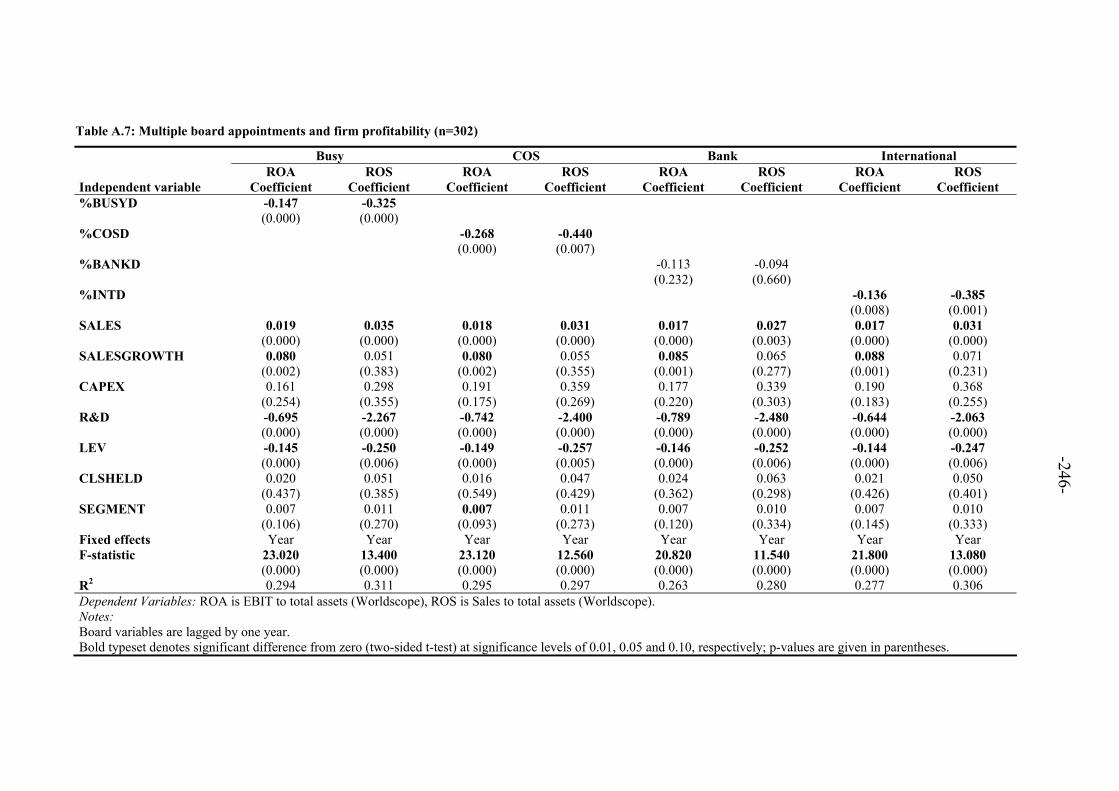
-246-
Table A.7: Multiple board appointments and firm profitability (n=302)
Busy COS Bank International ROA ROS ROA ROS ROA ROS ROA ROS Independent variable Coefficient Coefficient Coefficient Coefficient Coefficient Coefficient Coefficient Coefficient %BUSYD -0.147 -0.325 (0.000) (0.000) %COSD -0.268 -0.440 (0.000) (0.007) %BANKD -0.113 -0.094 (0.232) (0.660) %INTD -0.136 -0.385 (0.008) (0.001) SALES 0.019 0.035 0.018 0.031 0.017 0.027 0.017 0.031 (0.000) (0.000) (0.000) (0.000) (0.000) (0.003) (0.000) (0.000) SALESGROWTH 0.080 0.051 0.080 0.055 0.085 0.065 0.088 0.071 (0.002) (0.383) (0.002) (0.355) (0.001) (0.277) (0.001) (0.231) CAPEX 0.161 0.298 0.191 0.359 0.177 0.339 0.190 0.368 (0.254) (0.355) (0.175) (0.269) (0.220) (0.303) (0.183) (0.255) R&D -0.695 -2.267 -0.742 -2.400 -0.789 -2.480 -0.644 -2.063 (0.000) (0.000) (0.000) (0.000) (0.000) (0.000) (0.000) (0.000) LEV -0.145 -0.250 -0.149 -0.257 -0.146 -0.252 -0.144 -0.247 (0.000) (0.006) (0.000) (0.005) (0.000) (0.006) (0.000) (0.006) CLSHELD 0.020 0.051 0.016 0.047 0.024 0.063 0.021 0.050 (0.437) (0.385) (0.549) (0.429) (0.362) (0.298) (0.426) (0.401) SEGMENT 0.007 0.011 0.007 0.011 0.007 0.010 0.007 0.010 (0.106) (0.270) (0.093) (0.273) (0.120) (0.334) (0.145) (0.333) Fixed effects Year Year Year Year Year Year Year Year F-statistic 23.020 13.400 23.120 12.560 20.820 11.540 21.800 13.080 (0.000) (0.000) (0.000) (0.000) (0.000) (0.000) (0.000) (0.000) R2 0.294 0.311 0.295 0.297 0.263 0.280 0.277 0.306 Dependent Variables: ROA is EBIT to total assets (Worldscope), ROS is Sales to total assets (Worldscope). Notes: Board variables are lagged by one year. Bold typeset denotes significant difference from zero (two-sided t-test) at significance levels of 0.01, 0.05 and 0.10, respectively; p-values are given in parentheses.
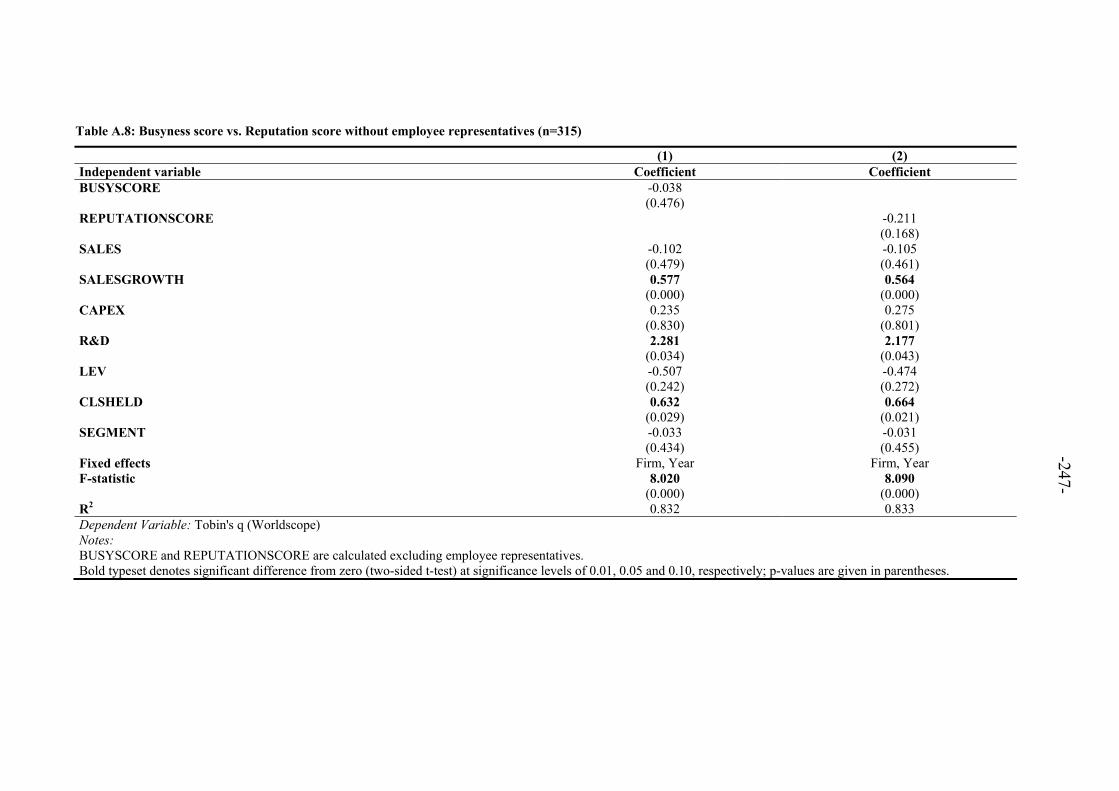
-247-
Table A.8: Busyness score vs. Reputation score without employee representatives (n=315)
(1) (2) Independent variable Coefficient Coefficient BUSYSCORE -0.038 (0.476) REPUTATIONSCORE -0.211 (0.168) SALES -0.102 -0.105 (0.479) (0.461) SALESGROWTH 0.577 0.564 (0.000) (0.000) CAPEX 0.235 0.275 (0.830) (0.801) R&D 2.281 2.177 (0.034) (0.043) LEV -0.507 -0.474 (0.242) (0.272) CLSHELD 0.632 0.664 (0.029) (0.021) SEGMENT -0.033 -0.031 (0.434) (0.455) Fixed effects Firm, Year Firm, Year F-statistic 8.020 8.090 (0.000) (0.000) R2 0.832 0.833 Dependent Variable: Tobin's q (Worldscope) Notes: BUSYSCORE and REPUTATIONSCORE are calculated excluding employee representatives. Bold typeset denotes significant difference from zero (two-sided t-test) at significance levels of 0.01, 0.05 and 0.10, respectively; p-values are given in parentheses.