Emergence of Unconventional LNG and its Implications for LNG … · 2020-04-04 · Nihon...
27
Emergence of Unconventional LNG and its Implications for LNG Buyers in Asia-Pacific * All rights reserved. Northeast Asia Petroleum Forum 2011 October 19th, 2011 Kunio Nohata Senior General Manager Gas Resources Dept. Tokyo Gas Co., Ltd.
Transcript of Emergence of Unconventional LNG and its Implications for LNG … · 2020-04-04 · Nihon...
Emergence of Unconventional LNG
and
its Implications for LNG Buyers in
Asia-Pacific
* All rights reserved.
Northeast Asia Petroleum Forum 2011
October 19th, 2011
Kunio Nohata Senior General Manager
Gas Resources Dept. Tokyo Gas Co., Ltd.

2
Presentation Contents The LNG Market in Japan
Latest trends of Unconventional Gas
Impact of Unconventional Gas on the Asia-
Pacific Market

3
LNG Imports to Japan by Company (FY2010)
TEPCO (20.8)
Tokyo Gas (11.3)
Chubu
(10.4) Osaka
(8.2) Kansai
(4.8)
Tohoku (3.0)
Toho (3.0)
Gas companies
Electric power companies
Kyushu
(2.7)
Chugoku
(1.8)
Unit: Million tons Japan total (70.6)
Saibu Hiroshima
Shizuoka
Sendai
Nihon
電力/ガスの受入比率(10年度)
Source: Trade statistics, FEPC, Sekitsu, etc.
Tokyo Gas & TEPCO first imported LNG to Japan
in 1969
電力会社
ガス会社
62.3%
37.7%
Import shares of electric/ gas companies (FY2010)
Gas companies
Electric power companies
4
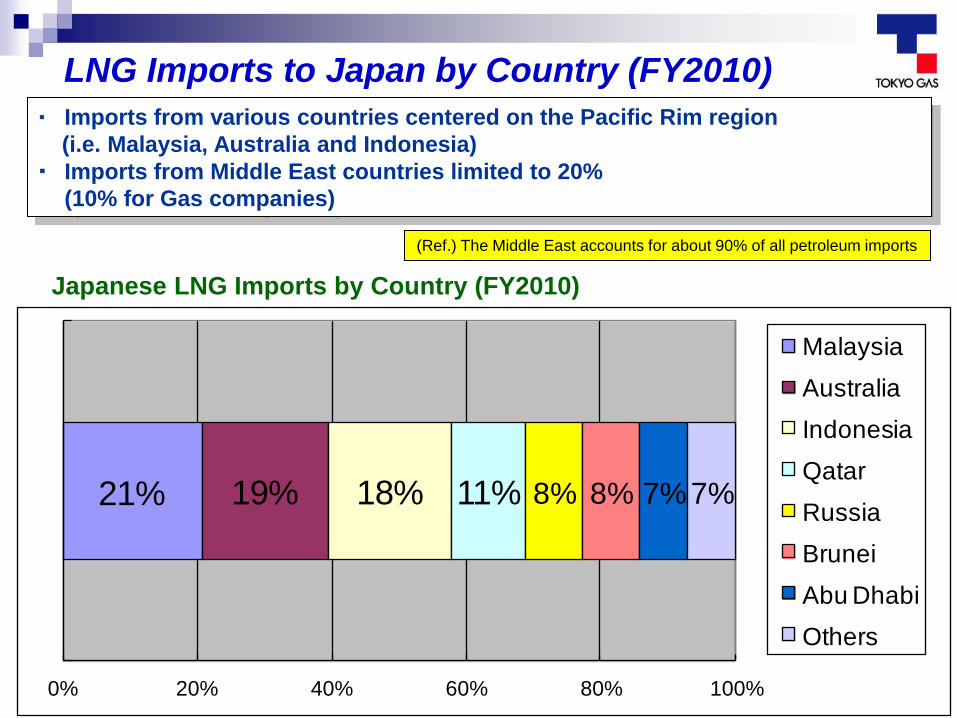
・ Imports from various countries centered on the Pacific Rim region
(i.e. Malaysia, Australia and Indonesia)
・ Imports from Middle East countries limited to 20%
(10% for Gas companies)
出典:貿易統計
Japanese LNG Imports by Country (FY2010)
21% 19% 18% 11% 8% 8% 7%7%
0% 20% 40% 60% 80% 100%
1
Malaysia
Australia
Indonesia
Qatar
Russia
Brunei
Abu Dhabi
Others
LNG Imports to Japan by Country (FY2010)
(Ref.) The Middle East accounts for about 90% of all petroleum imports
0.0
0.2
0.4
0.6
0.8
1.0
1.2
1.4
Jan Feb Mar Apr May Jun Jul Aug Sep Oct Nov Dec
CY2010
CY2011
5
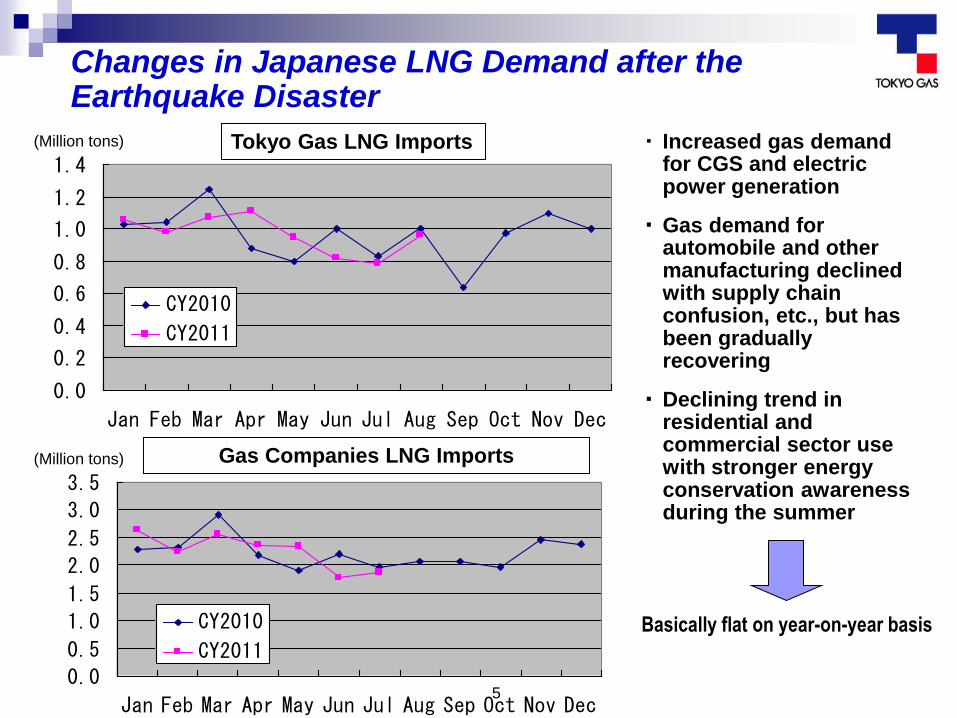
Changes in Japanese LNG Demand after the Earthquake Disaster
0.0
0.5
1.0
1.5
2.0
2.5
3.0
3.5
Jan Feb Mar Apr May Jun Jul Aug Sep Oct Nov Dec
CY2010
CY2011
(Million tons)
(Million tons)
Tokyo Gas LNG Imports
Gas Companies LNG Imports
・ Increased gas demand for CGS and electric power generation
・ Gas demand for automobile and other manufacturing declined with supply chain confusion, etc., but has been gradually recovering
・ Declining trend in residential and commercial sector use with stronger energy conservation awareness during the summer
Basically flat on year-on-year basis
0.0
1.0
2.0
3.0
4.0
5.0
6.0
Jan Feb Mar Apr May Jun Jul Aug Sep Oct Nov Dec
CY2010
CY2011
6
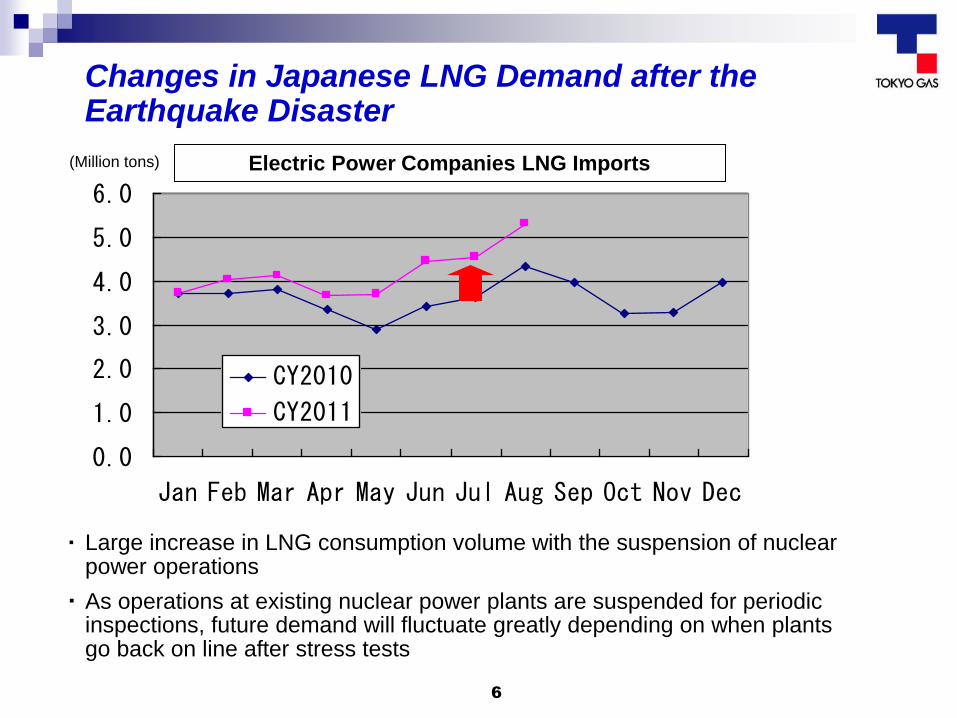
Changes in Japanese LNG Demand after the Earthquake Disaster
(Million tons) Electric Power Companies LNG Imports
・ Large increase in LNG consumption volume with the suspension of nuclear power operations
・ As operations at existing nuclear power plants are suspended for periodic inspections, future demand will fluctuate greatly depending on when plants go back on line after stress tests

7 7
Negishi LNG Terminal
Ohgishima LNG Terminal
Sodegaura LNG TerminalNegishi LNG Terminal
Ohgishima LNG Terminal
Sodegaura LNG Terminal
12.0
12.5
13.0
13.5
14.0
14.5
15.0
15.5
2010 2011 2012 2013 2014 2015
bcm
* All rights reserved.
LNG Demand Outlook for Tokyo Gas
Kashima PL
2012~ Hitachi LNG Terminal
2015~
Reinforcement of infrastructure
to expand LNG demand
<Tokyo Gas supply plan (prior to the disaster) >
Annual growth rate of approx. 3%
between FY2010 and FY2015
Hitachi LNG Terminal
(planned) 2015~
Kashima PL
(under construction)
2012~
(Actual) (FY)
Potential increase in
demand

8
LNG Demand Outlook for Japan
Source: The IEEJ (Prior to the disaster)
0.0
20.0
40.0
60.0
80.0
100.0
2010 2015 2020 2030
ハイケース
ローケース
?
・ While gas companies had assumed an increase in LNG demand prior to the earthquake disaster, the outlook is for an even larger increase from expansion in demand for CGS and gas air conditioning.
・ Electric power companies had projected declining LNG demand from a shift to nuclear power prior to the earthquake disaster, but LNG demand will greatly increase in the short term. Long-term demand will fluctuate widely depending on Japan’s nuclear power and energy policies.
High Demand Case
Low Demand Case
(MTPA)
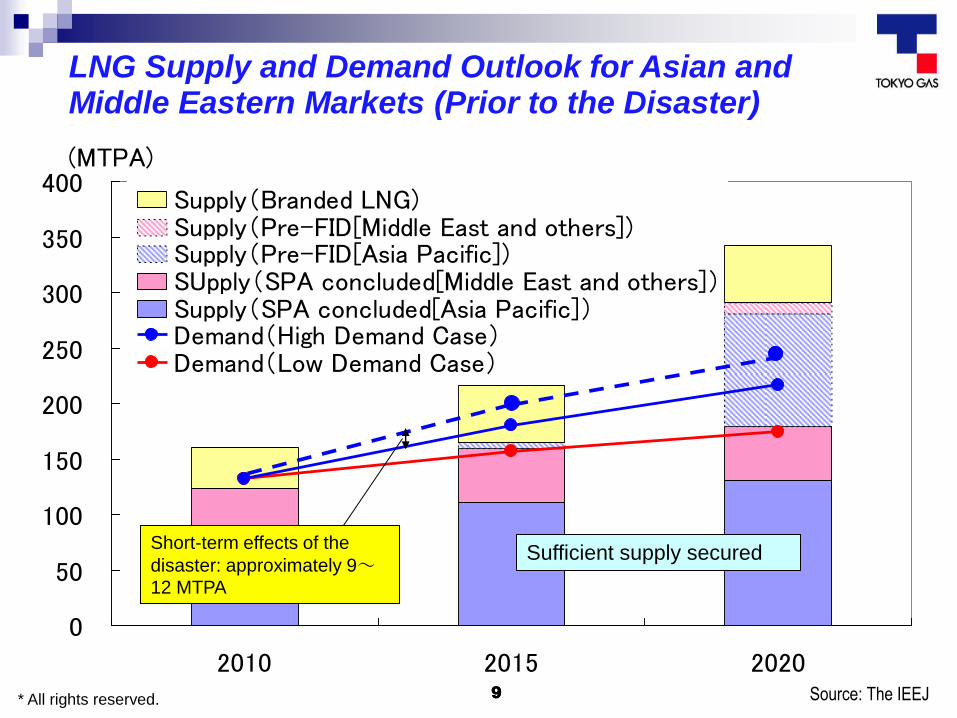
9
0
50
100
150
200
250
300
350
400
2010 2015 2020
Supply(Branded LNG)Supply(Pre-FID[Middle East and others])Supply(Pre-FID[Asia Pacific])SUpply(SPA concluded[Middle East and others])Supply(SPA concluded[Asia Pacific])Demand(High Demand Case)Demand(Low Demand Case)
(MTPA)
9 * All rights reserved. 9 Source: The IEEJ
LNG Supply and Demand Outlook for Asian and Middle Eastern Markets (Prior to the Disaster)
Short-term effects of the
disaster: approximately 9~12 MTPA
Sufficient supply secured
10
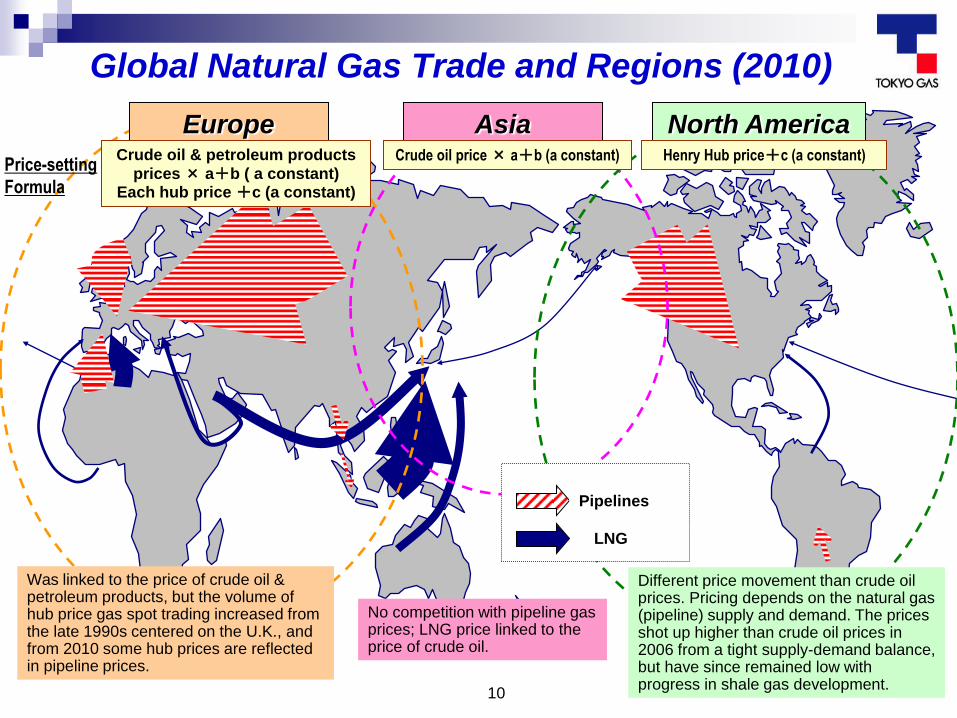
Global Natural Gas Trade and Regions (2010)
Europe Asia North America Crude oil & petroleum products
prices × a+b ( a constant) Each hub price +c (a constant)
Crude oil price × a+b (a constant) Henry Hub price+c (a constant) Price-setting
Formula
LNG
Pipelines
Different price movement than crude oil prices. Pricing depends on the natural gas (pipeline) supply and demand. The prices shot up higher than crude oil prices in 2006 from a tight supply-demand balance, but have since remained low with progress in shale gas development.
Was linked to the price of crude oil & petroleum products, but the volume of hub price gas spot trading increased from the late 1990s centered on the U.K., and from 2010 some hub prices are reflected in pipeline prices.
No competition with pipeline gas prices; LNG price linked to the price of crude oil.
0
6
12
18
24
CL01
CL02
CL03
CL04
CL05
CL06
CL07
CL08
CL09
CL10
CL11
㌦/m
mbt
u
0
18
36
54
72
90
108
126
144
㌦/
バレ
ル
米国(ヘンリーハブ)
原油 (JCC)
日本・アジア (LNG)ロシア→欧州 (PL)
英国 (NBP)
11
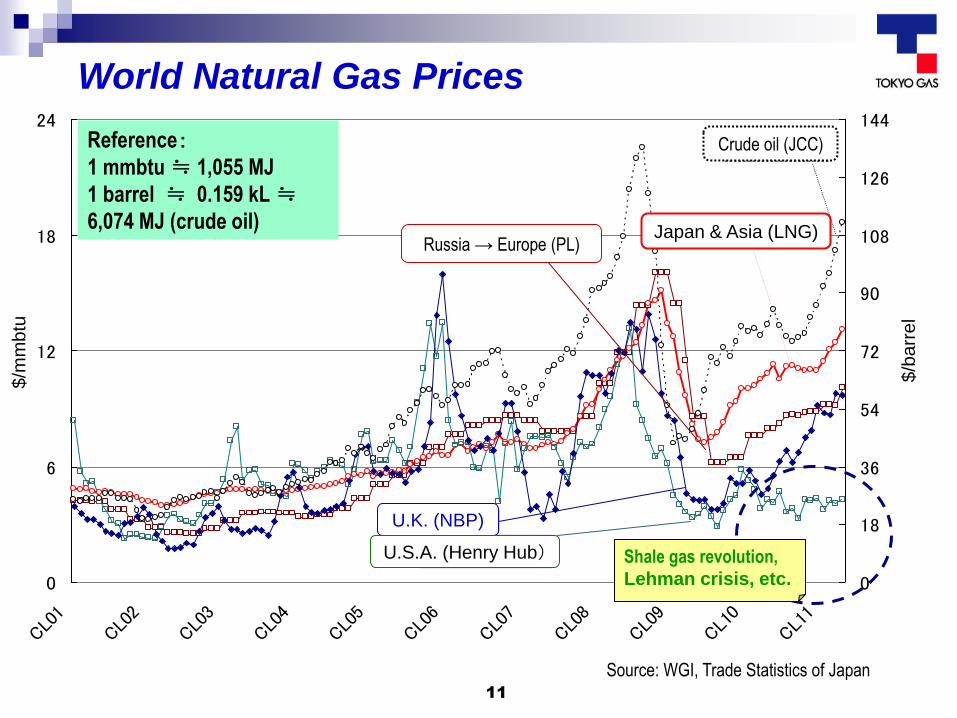
Reference:
1 mmbtu ≒ 1,055 MJ
1 barrel ≒ 0.159 kL ≒
6,074 MJ (crude oil)
Source: WGI, Trade Statistics of Japan
World Natural Gas Prices
Shale gas revolution,
Lehman crisis, etc.
Russia → Europe (PL) Japan & Asia (LNG)
Crude oil (JCC)
U.K. (NBP)
U.S.A. (Henry Hub)
$/b
arr
el
$/m
mb
tu

The LNG Market in Japan
Latest trends of Unconventional Gas
Impact of Unconventional Gas on the Asia-
Pacific Market
12
Presentation Contents
非在来型ガス406兆m3
シェールガス204兆m3
CBM118兆m3
タイトガス84兆m3
在来型ガス404兆m3
従来の確認埋蔵量187兆m3
回収可能な埋蔵量計810兆m3(250年分に相当)
13
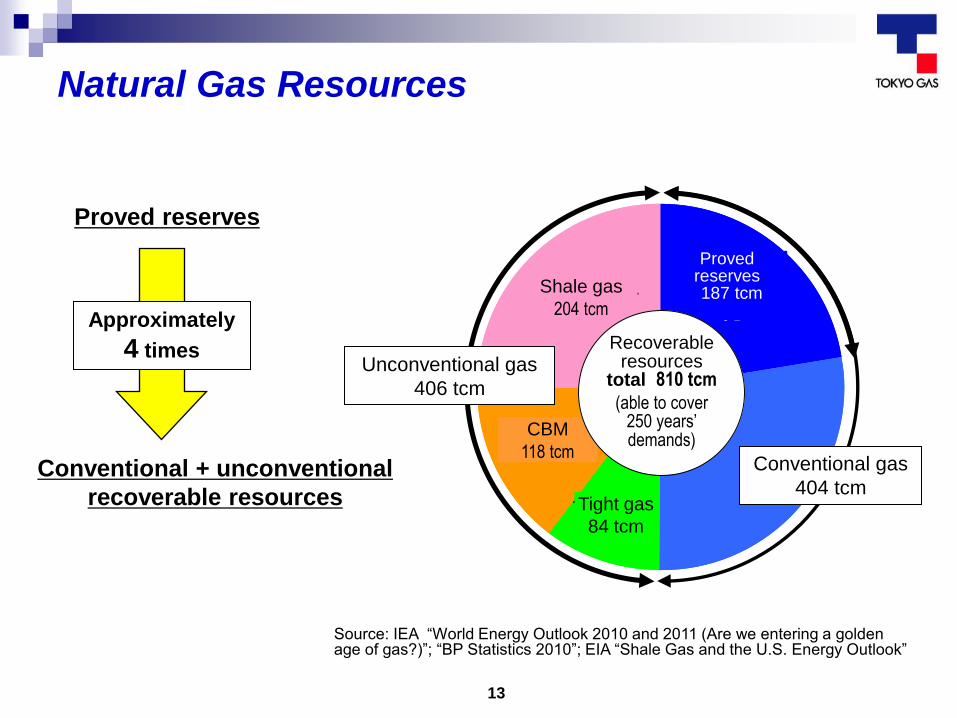
Natural Gas Resources
Proved reserves
Conventional + unconventional
recoverable resources
Approximately
4 times
Source: IEA “World Energy Outlook 2010 and 2011 (Are we entering a golden age of gas?)”; “BP Statistics 2010”; EIA “Shale Gas and the U.S. Energy Outlook”
Unconventional gas
406 tcm
Conventional gas
404 tcm
Shale gas
204 tcm
CBM
118 tcm
Tight gas
84 tcm
Proved reserves 187 tcm
Recoverable resources
total 810 tcm
(able to cover 250 years’ demands)

14
Global Unconventional Gas Distribution
Australia
Source: NPC 2007
China
North America
Europe
Argentina South Africa
Presence of major oil companies (“Majors”)
15 Source: EIA Annual Energy Outlook
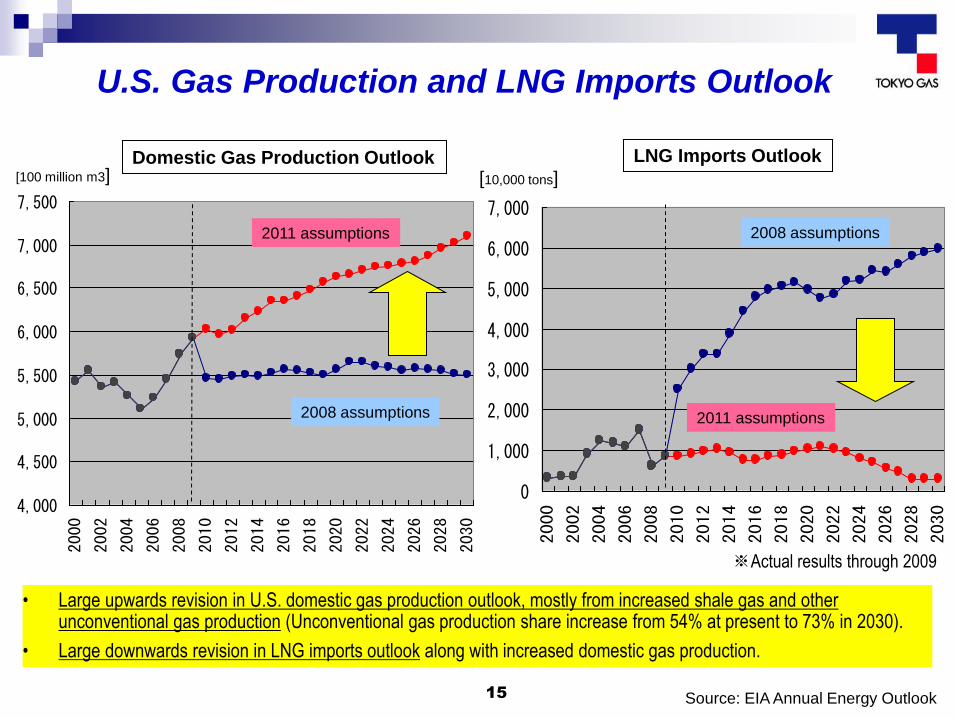
U.S. Gas Production and LNG Imports Outlook
4,000
4,500
5,000
5,500
6,000
6,500
7,000
7,500
2000
2002
2004
2006
2008
2010
2012
2014
2016
2018
2020
2022
2024
2026
2028
2030
• Large upwards revision in U.S. domestic gas production outlook, mostly from increased shale gas and other unconventional gas production (Unconventional gas production share increase from 54% at present to 73% in 2030).
• Large downwards revision in LNG imports outlook along with increased domestic gas production.
Domestic Gas Production Outlook LNG Imports Outlook
※Actual results through 2009
0
1,000
2,000
3,000
4,000
5,000
6,000
7,000
2000
2002
2004
2006
2008
2010
2012
2014
2016
2018
2020
2022
2024
2026
2028
2030
2011 assumptions
2008 assumptions
2008 assumptions
2011 assumptions
[100 million m3] [10,000 tons]
16 16 * All rights reserved.
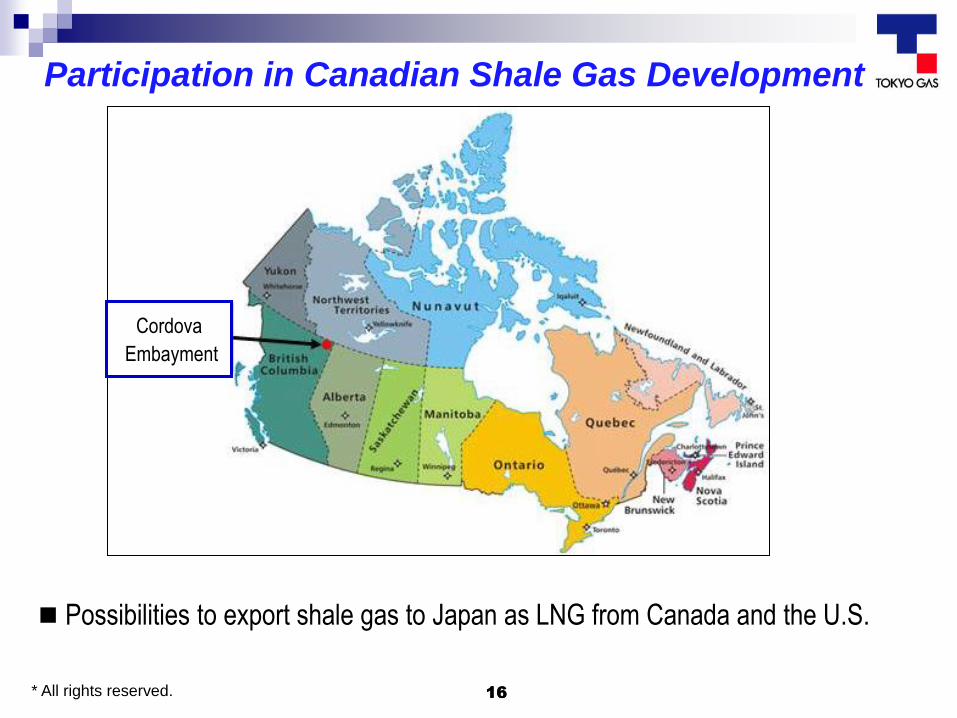
Participation in Canadian Shale Gas Development
Possibilities to export shale gas to Japan as LNG from Canada and the U.S.
Cordova
Embayment

17
North America LNG Export Plan
Kitimat (Canada)
Apache (GN, KOGAS, MC) 10 MTPA; to begin supply in 2015
Shell (Canada)
Partner (CNPC, KOGAS, MC)
Sabin Pass (Louisiana, U.S.; in operation as an LNG receiving terminal)
Free Port (Texas, U.S.; in operation as an LNG receiving terminal)
Sabin PassFree Port
Kitmat
Multiple projects are being advanced to liquefy North American natural gas and export it to Asia and Europe.
* The U.S. was only allowing gas exports to countries that have an FTA with the U.S., but Sabin Pass received permission for exports on May 20.
18
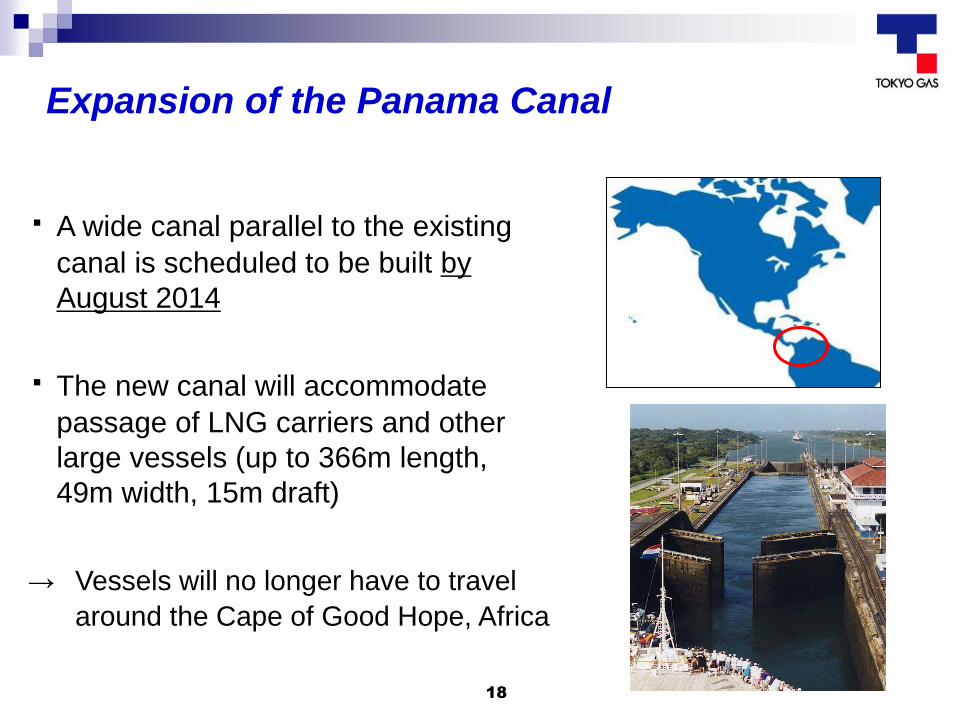
Expansion of the Panama Canal
・ A wide canal parallel to the existing
canal is scheduled to be built by
August 2014
・ The new canal will accommodate
passage of LNG carriers and other
large vessels (up to 366m length,
49m width, 15m draft)
→ Vessels will no longer have to travel
around the Cape of Good Hope, Africa

19 19 * All rights reserved.
Participation in CBM-LNG Projects in Australia
Several CBM-LNG export projects are currently underway in Queensland.
Potential production volume of 50 MTPA after 2014.
SPA for Queensland Curtis LNG with
BG Group plc. (March 2011)
Tokyo Gas is the first Japanese CBM-LNG buyer.
Source: Wood Mackenzie, JOGMEC
20
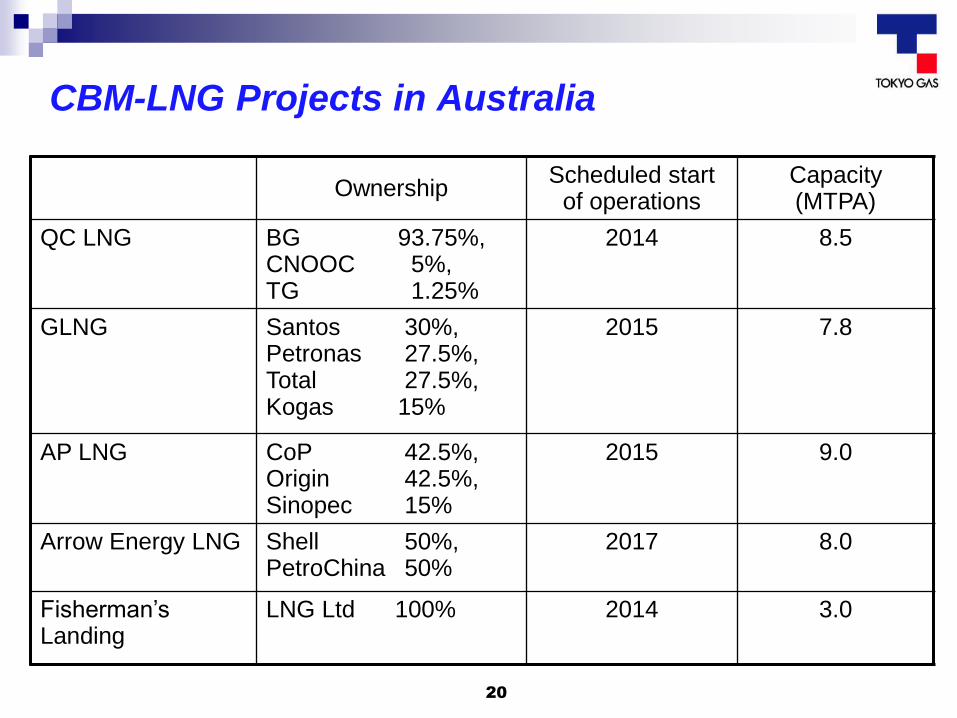
CBM-LNG Projects in Australia
Ownership Scheduled start
of operations Capacity (MTPA)
QC LNG BG 93.75%, CNOOC 5%, TG 1.25%
2014 8.5
GLNG Santos 30%, Petronas 27.5%, Total 27.5%, Kogas 15%
2015 7.8
AP LNG CoP 42.5%, Origin 42.5%, Sinopec 15%
2015 9.0
Arrow Energy LNG Shell 50%, PetroChina 50%
2017 8.0
Fisherman’s Landing
LNG Ltd 100% 2014 3.0
21
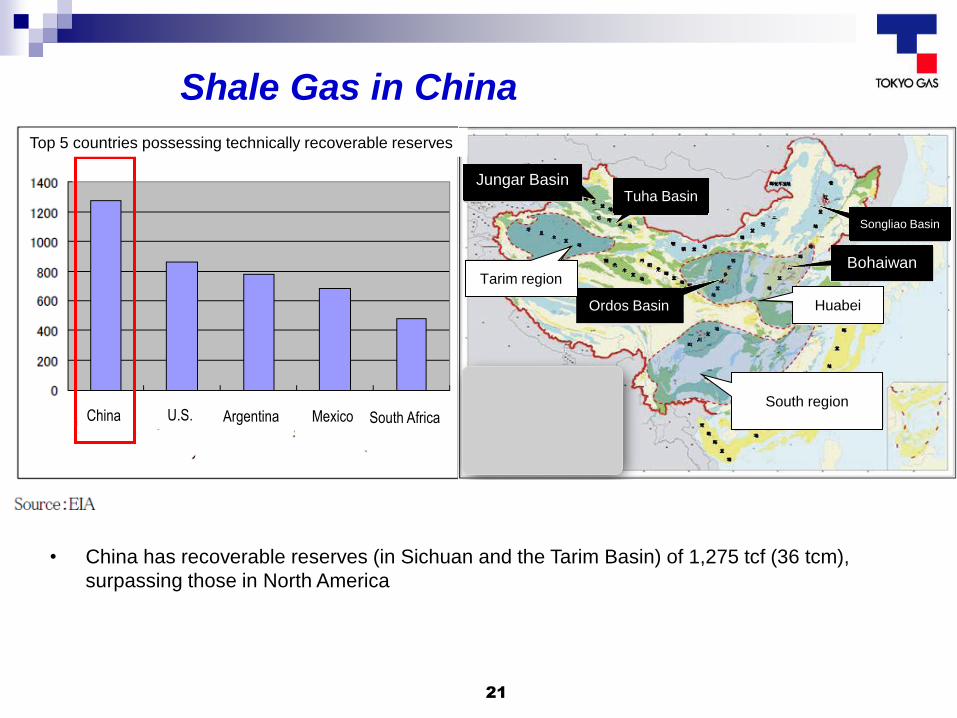
Shale Gas in China
• China has recoverable reserves (in Sichuan and the Tarim Basin) of 1,275 tcf (36 tcm),
surpassing those in North America
Top 5 countries possessing technically recoverable reserves
China U.S. Argentina
Mexico
South Africa
Jungar Basin Tuha Basin
Ordos Basin
Songliao Basin
Bohaiwan Tarim region
Huabei
South region
The LNG Market in Japan
Latest Trends of Unconventional Gas
Impact of Unconventional Gas on the Asia-
Pacific Market
22
Presentation Contents
23
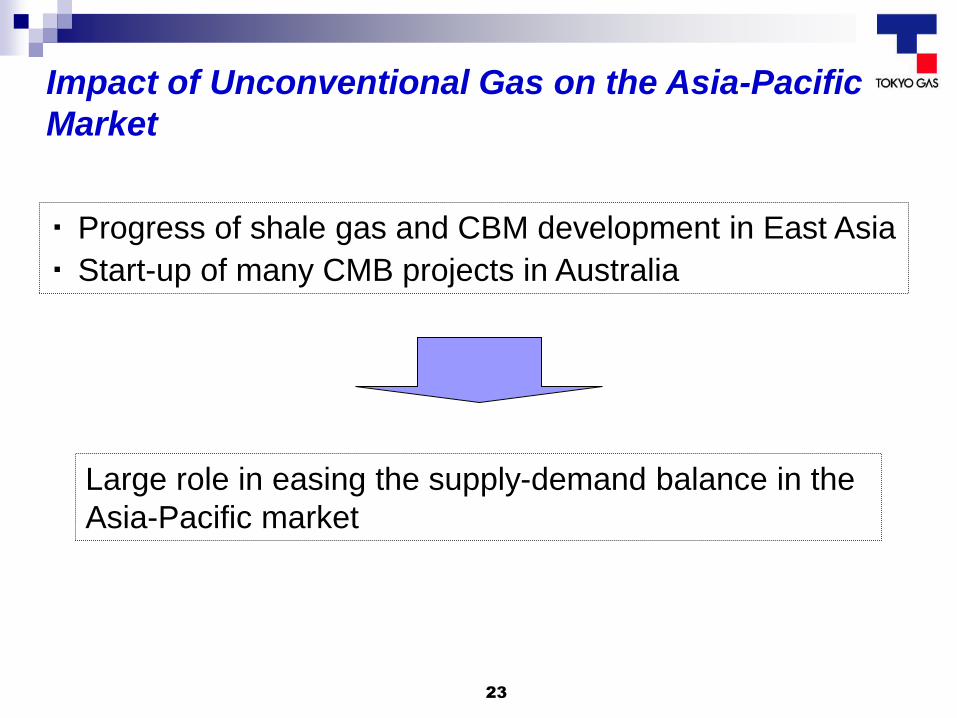
Impact of Unconventional Gas on the Asia-Pacific
Market
・ Progress of shale gas and CBM development in East Asia
・ Start-up of many CMB projects in Australia
Large role in easing the supply-demand balance in the
Asia-Pacific market
24
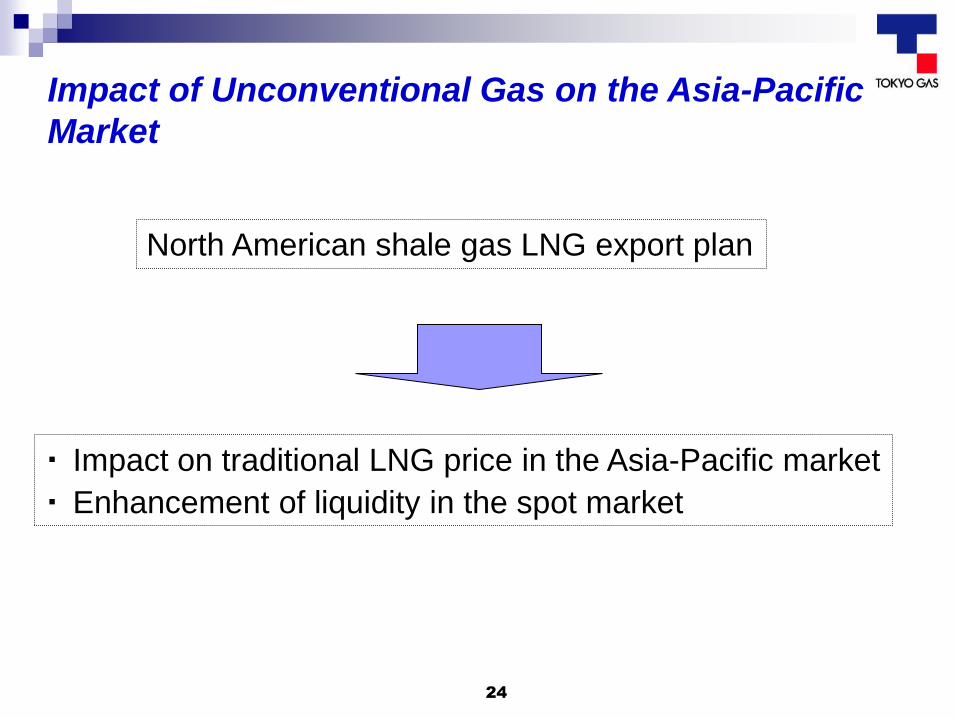
Impact of Unconventional Gas on the Asia-Pacific
Market
North American shale gas LNG export plan
・ Impact on traditional LNG price in the Asia-Pacific market
・ Enhancement of liquidity in the spot market
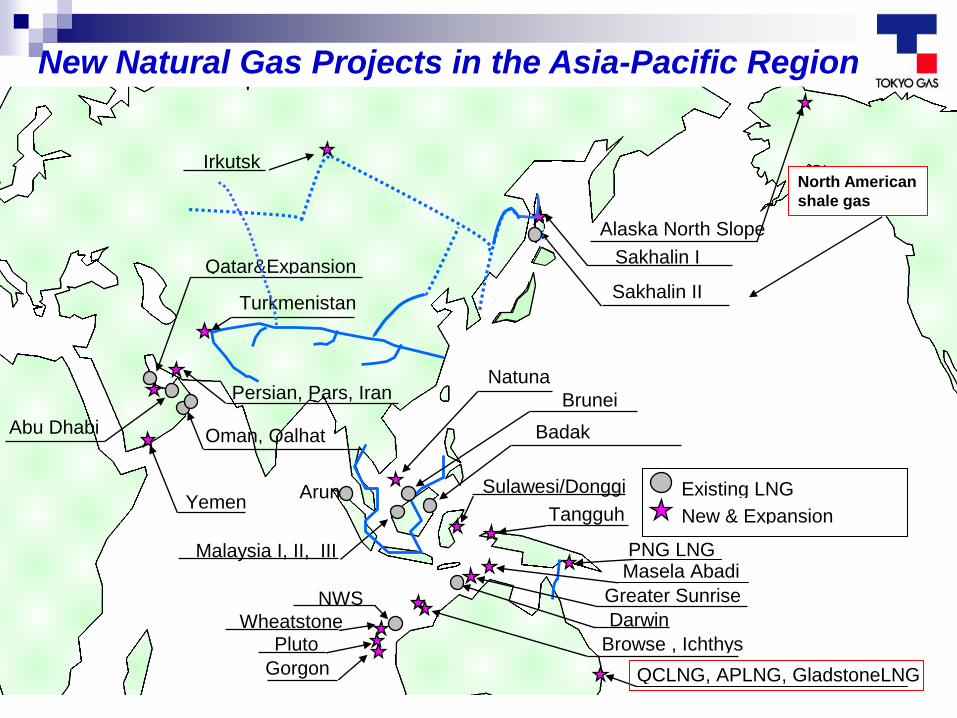
Sakhalin II
Irkutsk
Alaska North Slope
Tangguh
Badak
Qatar&Expansion
Oman, Qalhat
YemenNew & Expansion
Natuna
Turkmenistan
Persian, Pars, Iran
(Iran)
Sulawesi/Donggi Existing LNG Arun
Abu Dhabi
Alaska Kenai
Brunei
Malaysia I, II, III
Darwin
Greater Sunrise
Browse , Ichthys
NWS
Gorgon
PlutoWheatstone
Sakhalin I
QCLNG, APLNG, GladstoneLNG
Masela AbadiPNG LNG
New Natural Gas Projects in the Asia-Pacific Region
North American
shale gas
26
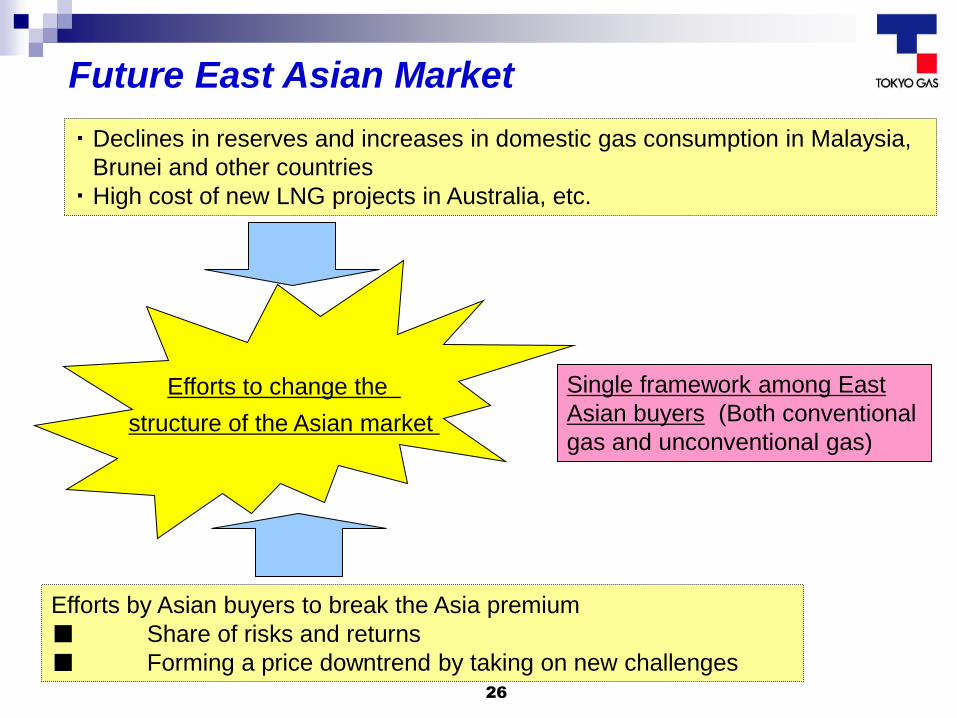
Future East Asian Market
Efforts to change the
structure of the Asian market
・ Declines in reserves and increases in domestic gas consumption in Malaysia,
Brunei and other countries
・ High cost of new LNG projects in Australia, etc.
Efforts by Asian buyers to break the Asia premium
■ Share of risks and returns
■ Forming a price downtrend by taking on new challenges
Single framework among East
Asian buyers (Both conventional
gas and unconventional gas)
27
The “Energy Horizon” (new LNG carrier christened July 6)
Thank you for your kind attention.