Eko 2014-0006
12
Ekológia (Bratislava) 48 COMPARISON OF MODERN AND TRADITIONAL METHODS OF SOILSORPTION COMPLEX MEASUREMENT: THE BASIS OF LONG-TERM STUDIES AND MODELLING ALEŠ KUČERA 1 *, JAROMÍR ŠIKL 2 , FILIP OULEHLE 2 , PAVEL ŠAMONIL 3 , KAREL MA- ROSZ 1 , RUSLAN HLEB 1 , JAKUB HOUŠKA 1 , JAKUB HRUŠKA 2 1 Department of Geology and Pedology, Mendel University in Brno, Zemědělská 1, 613 00 Brno, Czech Republic; e-mail: [email protected] 2 Department of Environmental Geochemistry and Biogeochemistry, Czech Geological Survey, Klárov 3, 118 21 Praha 1, Czech Republic 3 Department of Forest Ecology, e Silva Tarouca Research Institute for Landscape and Ornamental Gardening, Lidická 25/27, 657 20 Brno, Czech Republic * Author for correspondence Abstract Kučera A., Šikl J., Oulehle F., Šamonil P., Marosz K., Hleb R., Houška J., Hruška J.: Comparison of modern and traditional methods of soil sorption complex measurement: e basis of long-term studies and modelling. Ekológia (Bratislava), Vol. 33, No. 1, p. 48–59, 2014. is paper presents the correlations between two different analytical methods of assessing soil nu- trient contents. Soil nutrient content measurements measured using the flame atomic absorption spectrometry (FAAS) method, which uses barium chloride extraction, were compared with those of the now-unused Gedroiz method, which uses ammonium chloride extraction (calcium by ti- tration, magnesium, potassium and sodium by weighing). Natural forest soils from the Ukrainian Carpathians at the localities of Javorník and Pop Ivan were used. Despite the risk of analysis errors during the complicated analytical procedure, the results showed a high level of correlation be- tween different nutrient content measurements across the whole soil profile. is allows concen- tration values given in different studies to be linearly recalculated on results of modern method. In this way, results can be used to study soil’s chemical changes over time from the soil samples that were analysed in the past using labour-intensive and time-consuming methods with a higher risk of analytic error. Key words: Gedroiz, flame atomic absorption spectrometry, base cations, soil analysis, natural forest, sorption complex. Introduction An invaluable type of ecological research is the study of long-term changes in natural ecosys- tems, but only a few studies have been conducted in this field (Billet et al., 1990; Hallbäcken, Tamm, 1986; Smethurst, 2000; Vieira et al., 2009). Long-term assessment requires decades Vol. 33, No. 1, p. 48–59, 2014 doi:10.2478/eko-2014-0006 Unauthenticated Download Date | 12/10/14 2:13 PM
-
Upload
rustan-gleb -
Category
Data & Analytics
-
view
108 -
download
0
Transcript of Eko 2014-0006
Ekológia (Bratislava)
48
COMPARISON OF MODERN AND TRADITIONAL METHODS OF SOILSORPTION COMPLEX MEASUREMENT: THE BASIS OF LONG-TERM STUDIES AND MODELLING
alEŠ KuČEra1*, JaromÍr ŠIKl2, FIlIP oulEhlE2, PavEl ŠamonIl3, KarEl ma-rosz1, ruslan hlEB1, JaKuB houŠKa1, JaKuB hruŠKa2
1 department of geology and Pedology, mendel university in Brno, zemědělská 1, 613 00 Brno, czech republic; e-mail: [email protected]
2 department of Environmental geochemistry and Biogeochemistry, czech geological survey, Klárov 3, 118 21 Praha 1, czech republic
3 department of Forest Ecology, The silva tarouca research Institute for landscape and ornamental gardening, lidická 25/27, 657 20 Brno, czech republic
* author for correspondence
abstract
Kučera a., Šikl J., oulehle F., Šamonil P., marosz K., hleb r., houška J., hruška J.: comparison of modern and traditional methods of soil sorption complex measurement: The basis of long-term studies and modelling. Ekológia (Bratislava), vol. 33, no. 1, p. 48–59, 2014.
This paper presents the correlations between two different analytical methods of assessing soil nu-trient contents. soil nutrient content measurements measured using the flame atomic absorption spectrometry (Faas) method, which uses barium chloride extraction, were compared with those of the now-unused gedroiz method, which uses ammonium chloride extraction (calcium by ti-tration, magnesium, potassium and sodium by weighing). natural forest soils from the ukrainian carpathians at the localities of Javorník and Pop Ivan were used. despite the risk of analysis errors during the complicated analytical procedure, the results showed a high level of correlation be-tween different nutrient content measurements across the whole soil profile. This allows concen-tration values given in different studies to be linearly recalculated on results of modern method. In this way, results can be used to study soil’s chemical changes over time from the soil samples that were analysed in the past using labour-intensive and time-consuming methods with a higher risk of analytic error.
Key words: gedroiz, flame atomic absorption spectrometry, base cations, soil analysis, natural forest, sorption complex.
Introduction
an invaluable type of ecological research is the study of long-term changes in natural ecosys-tems, but only a few studies have been conducted in this field (Billet et al., 1990; hallbäcken, tamm, 1986; smethurst, 2000; vieira et al., 2009). long-term assessment requires decades
vol. 33, no. 1, p. 48–59, 2014doi:10.2478/eko-2014-0006
UnauthenticatedDownload Date | 12/10/14 2:13 PM
49
of measurements and may be confounded by simultaneous changes in other factors affecting the ecosystem, such as climate or disturbance. such studies cannot be fully replaced by either gradient approaches or mathematical modelling. In gradient studies, inferring the temporal sequence requires accepting the assumptions of space-for-time substitution, i.e. processes that occur first in a temporal sequence also occur first along a gradient of the variable ex-amined. mathematical models developed from short-term changes of selected factors are by definition incomplete. one key requirement for research into long-term (on decadal scale) ecosystem development is the standardization of methodologies. In order to obtain relevant results, it is necessary to accurately repeat original methods, or to develop models compar-ing results from original methods (which are usually more time- and labour-intensive) with modern techniques.
In the 1930s, in order to study the dynamics of natural forests, permanent research plots were established in what is now the western ukraine (zlatník et al., 1938). some of these forest ecosystems are now among the last remnants of natural forests in Europe (http://whc.unesco.org). with the aim of elucidating the relations of tree and herb layer vegetation with soil characteristics, comprehensive analyses (for the time) were done of plant species compo-sition, dendromass volume and soil characteristics. The original zlatník et al. (1938) research allows studying the long-term development of well-preserved natural forest ecosystems. In the 1990s, the research on zlatník’s plots was repeated in order to study changes in these nat-ural forest ecosystems after about 60 years (houška, 2007; hrubý, 2001; Šebesta et al., 2011; vrška et al., 2009). however, comparing the changes in soil chemistry and predicting the future developments are hardly possible without exact repetition of the used analytical meth-ods. The ancient methods for analysing soil nutrients were different from those used cur-rently, from the viewpoint of procedures and therefore the results. only results of relatively non-complicated methods such as soil acidity, soil sorption and individual cations bound to the sorption complex have been compared along gradient of time till now (chapman, Kelley, 1930; Brown et al., 1999; Klinka et al., 1980; tamm, hallbäcken, 1988; vranová, 2005). only a few works, especially those published long ago, deal with the comparison of results from dif-ferent methods or with nutrients amount assessing according to gedroiz (Bouyoucos, 1926; Brugess, Breazeale, 1926; cooper, 1930; Ernest, Berg, 1954; Perkins et al., 1932; wilde, 1954). on the other hand, a comprehensive comparison of different methods assessing exchange-able base cations content in soil has not yet been done. however, the comparison of different methods can lead to precision of long-term studies and furthermore to the verification of nutrients amount models, frequently focused on soil pollution, soil acidification or nutri-ent losses (Belyazid et al., 2006; małek et al., 2005; oulehle et al., 2010, 2012). This study focuses on the quantification of soil base cations, with the aim of examining the relationships between current standard methods and those commonly used until the middle of the 20th century. research in the 1930s by zlatník et al. (1938) used a nutrient measurement method according to gedroiz (gedroiz, 1926; maláč, 1933; novák, Klika, 1934), which analysed cal-cium, magnesium, potassium and sodium in an extract of ammonium chloride. Base cation content was measured by barium chloride (gillman, sumpter, 1986; sumner, miller, 1996) using Faas or flame atomic emission spectrometry (FaEs) (haswell, 1991; hoenig, 1996; reynolds, 1996; Thompson, Banerjee, 1991; zbíral, 2002). This method was chosen in terms
UnauthenticatedDownload Date | 12/10/14 2:13 PM
50
of the high precision within routine use. The historic method is based on the extraction of bases by ammonium chloride followed by end-point titration for measuring calcium and mass-based measurement of magnesium, potassium and sodium. we hope that our results will be generally useful for comparing results of historic forest soil analyses with modern results.
Material and methods
Description of localities and soil sampling
The research site Javorník lies close to the slovakian–ukrainian border at an altitude of 850 m above sea level (a.s.l.) (22°31'E; 48°55'n). The natural forest is composed mainly of European beech (Fagus sylvatica l.) with occasional sycamore maple (Acer pseudoplatanus l.). The bedrock is composed of thin-layer clay-sand flysch from mainly oligocennic magura sandstone, characterized by marked heterogeneity in the contents of quartz or the character of cement. The research site is located on a north-east slope of about 26% inclination. Predominant soils are haplic cambisols with dysmull humus form (Baize, girard, 1992; Jabiol et al. 1994; Iuss, 2006).
The research site Pop Ivan is located on the ukrainian–romanian border at an altitude of 1480 m a.s.l. (24°31'E; 47°57'n). The natural forest is composed predominantly of norway spruce (Picea abies l. Karsten). The geologic basement is made up mostly of upper Proterozoic to lower Paleozoic crystalline rocks (shale, gneiss, phyllite), with admixtures of Paleogen flysch and Jurassic crystalline limestone. The research site is located on a southern slope with average inclination of 30%. Predominant soils are cambisols (hyperdystric, skeletic) and Entic Podzols (skel-etic) with dysmoder humus form.
soils were sampled in 2009 in a total of 12 soil profiles (8 at Javorník, 4 at Pop Ivan). soil samples were taken from the organic horizons (l+F, h) and further from the depths 0–10; 10–20; 20–40 and 40–80 cm in the mineral soil. historic analyses of nutrient content using the methods of gedroiz were done at all four profiles at Pop Ivan, and at four profiles at Javorník (a representative four profiles were selected based on the smallest absolute divergence from the overall average of the eight profiles sampled), for horizons h and for all four depths. For the analysis, 40 samples were used in total.
Laboratory analyses
laboratory work consisted of measuring nutrient content using two different extraction methods: all soil samples (40 in total) were extracted with both ammonium chloride and barium chloride. cations were then measured in three ways: (1) by titration and weighing for ammonium chloride extracts (marked in results as ‘gedroiz (original method)’); (2) by Faas for ammonium chloride extracts (marked in results as ‘gedroiz (aas)’); and (3) by Faas for barium chloride extracts (marked in results as ‘Bacl2 (aas)’). samples were assessed as fine soil (<2 mm for mineral horizons, <5 mm for organic horizons).
The chapter is subdivided into items for each method of extraction (ammonium chloride or barium chloride) and each analytical method (gedroiz or aas).
Extraction solutions
(1) ammonium chloride (nh4cl) eluent, 1m (53.49 g nh4cl/l); (19) barium chloride (Bacl2) eluent, 0.1m Bacl2.
Chemical, reagents and special materials
(2) concentrated hydrochloric acid (hcl), 37%; ρ = 1.19 g.cm−3; (3) concentrated nitric acid (hno3), 65%, 14.4 m, ρ = 1.14 g.cm−3; (4) demineralized water (dIw); (5) ammonia (nh3) (h2o/nh3 ratio of 1:1); (6) methyl red (0.1 g free acid dissolved in 100 ml ethanol (w = 0.06) or 0.1 g sodium salt in 100 ml distilled water; (7) ammonium acetate (c2h7no2) solid; (8) ammonium oxalate ((nh4)2c2o4 (saturated solution: 44 g/l); (9) ammonia (nh3), concen-trated 25%; (10) dilute sulphuric acid (h2so4), 24%, ρ = 0.46 g.cm−3; (11) concentrated sulphuric acid (h2so4), 96%, ρ = 1.84 g.cm−3; (12) potassium permanganate (Kmno4) titration solution, 0.02m: 3.16 g dissolved in 1 l dIw; (13)
UnauthenticatedDownload Date | 12/10/14 2:13 PM
51
concentrated ammonium hydroxide (nh4oh); (14) hydroxyquinoline (c9h7no), 2% alcohol solution (2 g of solid dissolved in 100 ml alcohol (prepared fresh)); (15) ammonium carbonate ((nh4)2co3) with an addition of nh3 (about 5 ml of nh3 added to a solution of 50 g (nh4)2co3/500 ml dIw); (16) concentrated perchloric acid (hclo4) (70%); (17) ethanol 96%; (18) ammonia water: about 10 ml concentrated nh3 in 0.5 l dIw; medium density filter paper (e.g. Filtrak 389, macherey nagel mn 640 m, sch & sch s.s 589/2); dense filter paper (e.g. Filtrak 391, mach-erey nagel mn 640 dc, sch & sch s/s 589/3); fritted glass filter or g3 frit (for filtering small crystals).
Extractions
Extraction by NH4Cl
to 25 g of the fine-earth fraction (<2mm, zbíral (2002), add 100 ml of ammonium chloride (1) solution (soil/reagent, 1:4 w/v). after 15 minutes on a horizontal shaker, let it slightly settle and then filter the suspension to a volumetric flask with minimal volume 1000 ml. repeat extraction, shaking and filtering two more times, adding to the same flask. after the last shaking the entire sample volume should be quantitatively poured on the filter and washed with extraction solution until there is no more reaction to calcium (cca 1–2 ml eluate precipitated with hot ammonium oxalate (8)). to the filtrate, add 10 ml concentrated hydrochloric acid (2) and let evaporate till dry. add 2 ml concentrated nitric acid (3) and let evaporate till dry, then repeat (oxidation – removing excess ammonium chloride). add a few drops of concentrated hydrochloric acid (2) and let evaporate, then repeat (removing silicon dioxide by dehydration). add 10 ml concentrated hydrochloric acid (2) and then add 50 ml hot water. silicic acid is removed by filtering and washing with hot water into a 250 ml volumetric flask. after reaching room temperature, fill to the mark and use the mixed solution for measuring calcium, magnesium, sodium and potassium.
Extraction by barium chloride
Barium chloride of 50 ml (19) was added to10 g of fine-filtered soil (as above) (soil/reagent, 1:5, w/v), shaken for 2 hours and filtered through dense filter paper. The container with soil suspension was rinsed with another 50 ml Bacl2 and quantitatively transferred to the filter paper (a total of 100 ml eluent).
Analytical methods
Nutrient content measured according to Gedroiz
General description of the method: From the eluate, calcium is determined as calcium oxalate by titration with potas-sium permanganate (12), magnesium is determined by weighing as the mg(c9h6on)2*2h2o precipitate; potassium is determined by weighing as potassium chloride; and sodium is determined by weighing as sodium chloride. This method of measuring soil nutrient content was recommended for non-carbonate soils.
Measuring of calcium: In a 250 ml volumetric flask, add 100 ml of extract and evaporate to about 50 ml, and with ammonia (5), using methyl red indicator (6), precipitate sesquioxides (aluminium, iron, manganese). after hydroxides become cloudy, filter through medium filter paper to a new 250 ml flask and wash well with hot water to a volume of 150 ml. reduce the volume of the filtrate by evaporation to 50 ml. to the hot solution, add about 0.5 g of ammonium acetate (7) to prevent co-precipitation of magnesium with calcium, and 5 ml of ammonia (9). In the hot solution, precipitate calcium with the saturated ammonium oxalate solution (8) until completely precipitated (about 20 ml) by forming calcium oxalate. Filter the solution with precipitate through dense filter paper to a 250 ml flask (to be used for magnesium determination). wash with hot water. tear up the filter with precipitate and wash with hot water into the original 250 ml flask where it was precipitated. The filter is then dissolved and washed with dilute sulphuric acid (10). wash with hot water. to the solution with dissolved calcium oxalate, acidify with 5 ml concentrated sulphuric acid (11). titrate with potassium permanganate (12) to pink.
calculation: 1 ml 0.02m Kmno4 = 2.0040 mg ca (1)
Measuring of magnesium: Evaporate the filtrate that was filtered from the precipitated calcium oxalate to about 50 ml. add about 2 g of ammonium acetate (7) and 5 ml of ammonium hydroxide (13) (an excess of ammonium salt
UnauthenticatedDownload Date | 12/10/14 2:13 PM
52
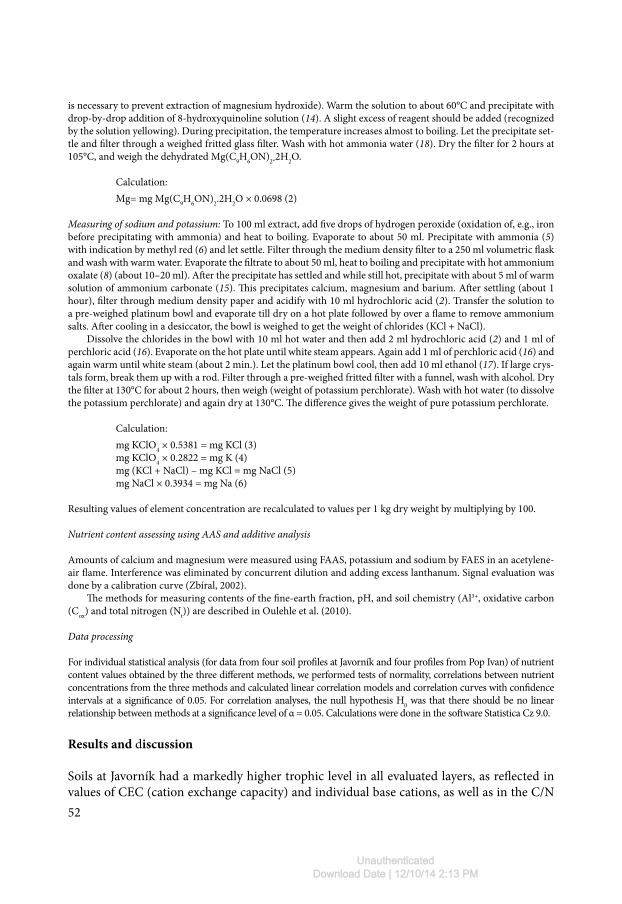
is necessary to prevent extraction of magnesium hydroxide). warm the solution to about 60°c and precipitate with drop-by-drop addition of 8-hydroxyquinoline solution (14). a slight excess of reagent should be added (recognized by the solution yellowing). during precipitation, the temperature increases almost to boiling. let the precipitate set-tle and filter through a weighed fritted glass filter. wash with hot ammonia water (18). dry the filter for 2 hours at 105°c, and weigh the dehydrated mg(c9h6on)2*2h2o.
calculation: mg= mg mg(c9h6on)2.2h2o × 0.0698 (2)
Measuring of sodium and potassium: to 100 ml extract, add five drops of hydrogen peroxide (oxidation of, e.g., iron before precipitating with ammonia) and heat to boiling. Evaporate to about 50 ml. Precipitate with ammonia (5) with indication by methyl red (6) and let settle. Filter through the medium density filter to a 250 ml volumetric flask and wash with warm water. Evaporate the filtrate to about 50 ml, heat to boiling and precipitate with hot ammonium oxalate (8) (about 10–20 ml). after the precipitate has settled and while still hot, precipitate with about 5 ml of warm solution of ammonium carbonate (15). This precipitates calcium, magnesium and barium. after settling (about 1 hour), filter through medium density paper and acidify with 10 ml hydrochloric acid (2). transfer the solution to a pre-weighed platinum bowl and evaporate till dry on a hot plate followed by over a flame to remove ammonium salts. after cooling in a desiccator, the bowl is weighed to get the weight of chlorides (Kcl + nacl).
dissolve the chlorides in the bowl with 10 ml hot water and then add 2 ml hydrochloric acid (2) and 1 ml of perchloric acid (16). Evaporate on the hot plate until white steam appears. again add 1 ml of perchloric acid (16) and again warm until white steam (about 2 min.). let the platinum bowl cool, then add 10 ml ethanol (17). If large crys-tals form, break them up with a rod. Filter through a pre-weighed fritted filter with a funnel, wash with alcohol. dry the filter at 130°c for about 2 hours, then weigh (weight of potassium perchlorate). wash with hot water (to dissolve the potassium perchlorate) and again dry at 130°c. The difference gives the weight of pure potassium perchlorate.
calculation: mg Kclo4 × 0.5381 = mg Kcl (3) mg Kclo4 × 0.2822 = mg K (4) mg (Kcl + nacl) – mg Kcl = mg nacl (5) mg nacl × 0.3934 = mg na (6)
resulting values of element concentration are recalculated to values per 1 kg dry weight by multiplying by 100.
Nutrient content assessing using AAS and additive analysis
amounts of calcium and magnesium were measured using Faas, potassium and sodium by FaEs in an acetylene-air flame. Interference was eliminated by concurrent dilution and adding excess lanthanum. signal evaluation was done by a calibration curve (zbíral, 2002).
The methods for measuring contents of the fine-earth fraction, ph, and soil chemistry (al3+, oxidative carbon (cox) and total nitrogen (nt)) are described in oulehle et al. (2010).
Data processing
For individual statistical analysis (for data from four soil profiles at Javorník and four profiles from Pop Ivan) of nutrient content values obtained by the three different methods, we performed tests of normality, correlations between nutrient concentrations from the three methods and calculated linear correlation models and correlation curves with confidence intervals at a significance of 0.05. For correlation analyses, the null hypothesis h0 was that there should be no linear relationship between methods at a significance level of α = 0.05. calculations were done in the software statistica cz 9.0.
Results and discussion
soils at Javorník had a markedly higher trophic level in all evaluated layers, as reflected in values of cEc (cation exchange capacity) and individual base cations, as well as in the c/n
UnauthenticatedDownload Date | 12/10/14 2:13 PM
53
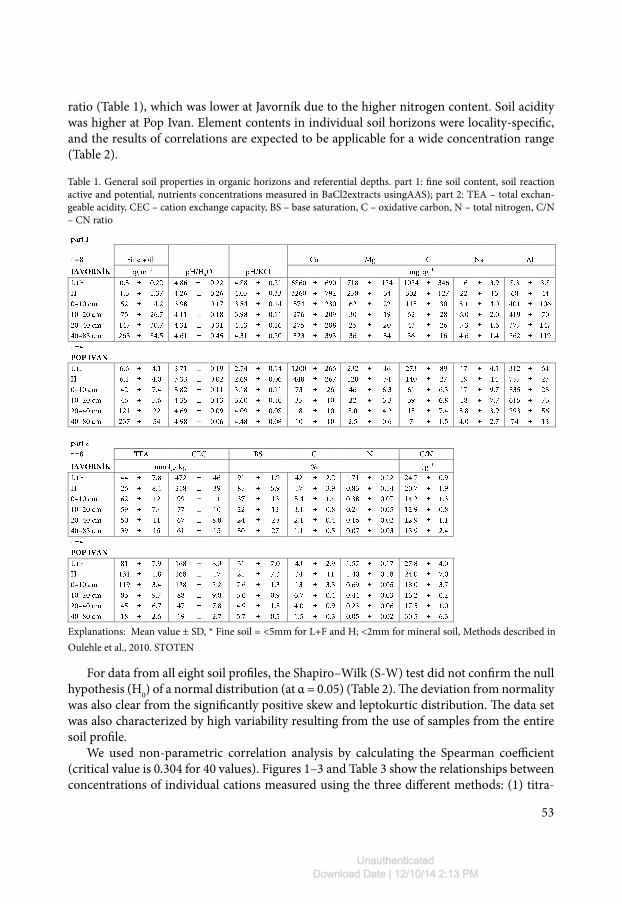
ratio (table 1), which was lower at Javorník due to the higher nitrogen content. soil acidity was higher at Pop Ivan. Element contents in individual soil horizons were locality-specific, and the results of correlations are expected to be applicable for a wide concentration range (table 2).
table 1. general soil properties in organic horizons and referential depths. part 1: fine soil content, soil reaction active and potential, nutrients concentrations measured in Bacl2extracts usingaas); part 2: tEa – total exchan-geable acidity, cEc – cation exchange capacity, Bs – base saturation, c – oxidative carbon, n – total nitrogen, c/n – cn ratio
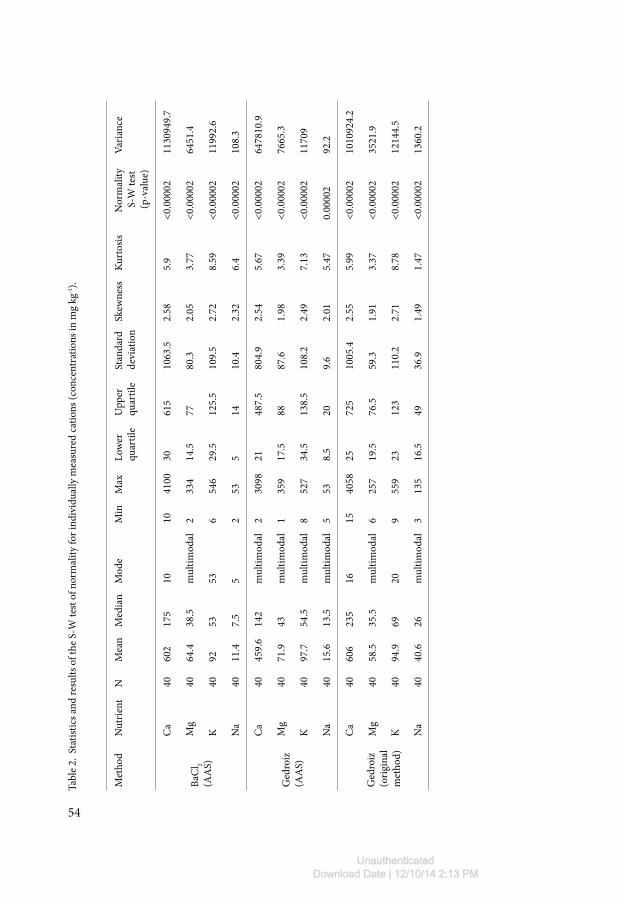
For data from all eight soil profiles, the shapiro–wilk (s-w) test did not confirm the null hypothesis (h0) of a normal distribution (at α = 0.05) (table 2). The deviation from normality was also clear from the significantly positive skew and leptokurtic distribution. The data set was also characterized by high variability resulting from the use of samples from the entire soil profile.
we used non-parametric correlation analysis by calculating the spearman coefficient (critical value is 0.304 for 40 values). Figures 1–3 and table 3 show the relationships between concentrations of individual cations measured using the three different methods: (1) titra-
Explanations: mean value ± sd, * Fine soil = <5mm for l+F and h; <2mm for mineral soil, methods described in oulehle et al., 2010. stotEn
UnauthenticatedDownload Date | 12/10/14 2:13 PM
54
met
hod
nut
rient
nm
ean
med
ian
mod
em
inm
axlo
wer
quar
tile
upp
erqu
artil
est
anda
rd
devi
atio
nsk
ewne
ssKu
rtos
isn
orm
ality
s-w
test
(p-v
alue
)
varia
nce
Bac
l 2(a
as)
ca
4060
217
510
1041
0030
615
1063
.52.
585.
9<0
.000
0211
3094
9.7
mg
4064
.438
.5m
ultim
odal
233
414
.577
80.3
2.05
3.77
<0.0
0002
6451
.4
K40
9253
536
546
29.5
125.
510
9.5
2.72
8.59
<0.0
0002
1199
2.6
na
4011
.47.
55
253
514
10.4
2.32
6.4
<0.0
0002
108.
3
ged
roiz
(a
as)
ca
4045
9.6
142
mul
timod
al2
3098
2148
7.5
804.
92.
545.
67<0
.000
0264
7810
.9
mg
4071
.943
mul
timod
al1
359
17.5
8887
.61.
983.
39<0
.000
0276
65.3
K40
97.7
54.5
mul
timod
al8
527
34.5
138.
510
8.2
2.49
7.13
<0.0
0002
1170
9
na
4015
.613
.5m
ultim
odal
553
8.5
209.
62.
015.
470.
0000
292
.2
ged
roiz
(o
rigin
al
met
hod)
ca
4060
623
516
1540
5825
725
1005
.42.
555.
99<0
.000
0210
1092
4.2
mg
4058
.535
.5m
ultim
odal
625
719
.576
.559
.31.
913.
37<0
.000
0235
21.9
K40
94.9
6920
955
923
123
110.
22.
718.
78<0
.000
0212
144.
5
na
4040
.626
mul
timod
al3
135
16.5
4936
.91.
491.
47<0
.000
0213
60.2
tabl
e 2.
sta
tistic
s and
resu
lts o
f the
s-w
test
of n
orm
ality
for i
ndiv
idua
lly m
easu
red
catio
ns (c
once
ntra
tions
in m
g kg
-1).
UnauthenticatedDownload Date | 12/10/14 2:13 PM
55
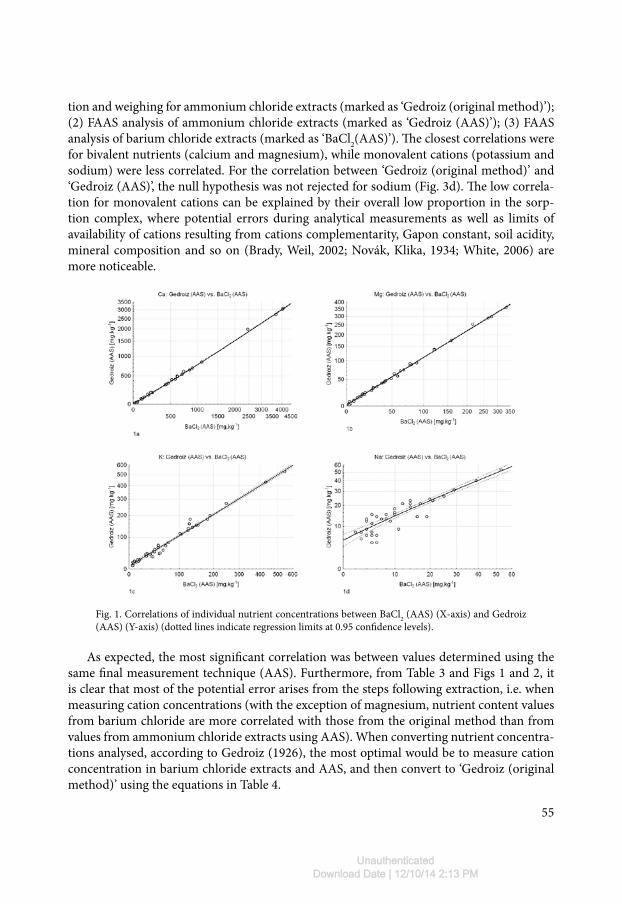
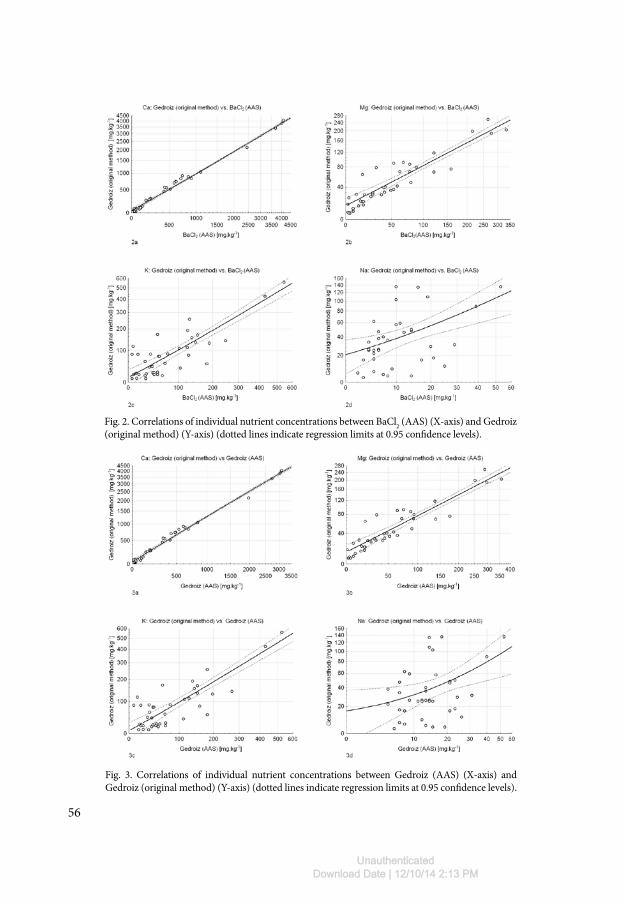
tion and weighing for ammonium chloride extracts (marked as ‘gedroiz (original method)’); (2) Faas analysis of ammonium chloride extracts (marked as ‘gedroiz (aas)’); (3) Faas analysis of barium chloride extracts (marked as ‘Bacl2(aas)’). The closest correlations were for bivalent nutrients (calcium and magnesium), while monovalent cations (potassium and sodium) were less correlated. For the correlation between ‘gedroiz (original method)’ and ‘gedroiz (aas)’, the null hypothesis was not rejected for sodium (Fig. 3d). The low correla-tion for monovalent cations can be explained by their overall low proportion in the sorp-tion complex, where potential errors during analytical measurements as well as limits of availability of cations resulting from cations complementarity, gapon constant, soil acidity, mineral composition and so on (Brady, weil, 2002; novák, Klika, 1934; white, 2006) are more noticeable.
Fig. 1. correlations of individual nutrient concentrations between Bacl2 (aas) (X-axis) and gedroiz (aas) (y-axis) (dotted lines indicate regression limits at 0.95 confidence levels).
as expected, the most significant correlation was between values determined using the same final measurement technique (aas). Furthermore, from table 3 and Figs 1 and 2, it is clear that most of the potential error arises from the steps following extraction, i.e. when measuring cation concentrations (with the exception of magnesium, nutrient content values from barium chloride are more correlated with those from the original method than from values from ammonium chloride extracts using aas). when converting nutrient concentra-tions analysed, according to gedroiz (1926), the most optimal would be to measure cation concentration in barium chloride extracts and aas, and then convert to ‘gedroiz (original method)’ using the equations in table 4.
UnauthenticatedDownload Date | 12/10/14 2:13 PM
56
Fig. 2. correlations of individual nutrient concentrations between Bacl2 (aas) (X-axis) and gedroiz (original method) (y-axis) (dotted lines indicate regression limits at 0.95 confidence levels).
Fig. 3. correlations of individual nutrient concentrations between gedroiz (aas) (X-axis) and gedroiz (original method) (y-axis) (dotted lines indicate regression limits at 0.95 confidence levels).
UnauthenticatedDownload Date | 12/10/14 2:13 PM
57
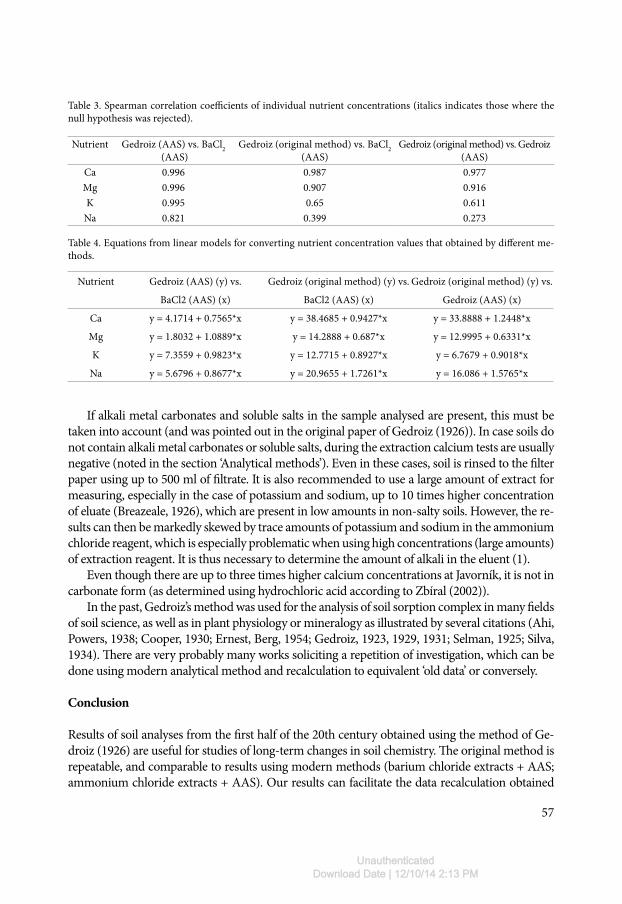
nutrient gedroiz (aas) vs. Bacl2 (aas)
gedroiz (original method) vs. Bacl2 (aas)
gedroiz (original method) vs. gedroiz (aas)
ca 0.996 0.987 0.977mg 0.996 0.907 0.916K 0.995 0.65 0.611
na 0.821 0.399 0.273
table 3. spearman correlation coefficients of individual nutrient concentrations (italics indicates those where the null hypothesis was rejected).
If alkali metal carbonates and soluble salts in the sample analysed are present, this must be taken into account (and was pointed out in the original paper of gedroiz (1926)). In case soils do not contain alkali metal carbonates or soluble salts, during the extraction calcium tests are usually negative (noted in the section ‘analytical methods’). Even in these cases, soil is rinsed to the filter paper using up to 500 ml of filtrate. It is also recommended to use a large amount of extract for measuring, especially in the case of potassium and sodium, up to 10 times higher concentration of eluate (Breazeale, 1926), which are present in low amounts in non-salty soils. however, the re-sults can then be markedly skewed by trace amounts of potassium and sodium in the ammonium chloride reagent, which is especially problematic when using high concentrations (large amounts) of extraction reagent. It is thus necessary to determine the amount of alkali in the eluent (1).
Even though there are up to three times higher calcium concentrations at Javorník, it is not in carbonate form (as determined using hydrochloric acid according to zbíral (2002)).
In the past, gedroiz’s method was used for the analysis of soil sorption complex in many fields of soil science, as well as in plant physiology or mineralogy as illustrated by several citations (ahi, Powers, 1938; cooper, 1930; Ernest, Berg, 1954; gedroiz, 1923, 1929, 1931; selman, 1925; silva, 1934). There are very probably many works soliciting a repetition of investigation, which can be done using modern analytical method and recalculation to equivalent ‘old data’ or conversely.
Conclusion
results of soil analyses from the first half of the 20th century obtained using the method of ge-droiz (1926) are useful for studies of long-term changes in soil chemistry. The original method is repeatable, and comparable to results using modern methods (barium chloride extracts + aas; ammonium chloride extracts + aas). our results can facilitate the data recalculation obtained
nutrient gedroiz (aas) (y) vs. gedroiz (original method) (y) vs. gedroiz (original method) (y) vs.
Bacl2 (aas) (x) Bacl2 (aas) (x) gedroiz (aas) (x)
ca y = 4.1714 + 0.7565*x y = 38.4685 + 0.9427*x y = 33.8888 + 1.2448*x
mg y = 1.8032 + 1.0889*x y = 14.2888 + 0.687*x y = 12.9995 + 0.6331*x
K y = 7.3559 + 0.9823*x y = 12.7715 + 0.8927*x y = 6.7679 + 0.9018*x
na y = 5.6796 + 0.8677*x y = 20.9655 + 1.7261*x y = 16.086 + 1.5765*x
table 4. Equations from linear models for converting nutrient concentration values that obtained by different me-thods.
UnauthenticatedDownload Date | 12/10/14 2:13 PM
58
formerly using gedroiz analysis, and hence for the comparison of soil nutrients amounts in the past and in the present. The linear models of concentration relationships from different methods can be used to compare data sets and recalculate results. In this way, the disadvantages of using historic methods are mostly their difficulty and risk of analytical errors, which can be overcome.
These results can be used to re-calculate values from soils with comparable chemistry to those tested here. unknown factors may arise in analyses of other soils with markedly different chemis-try that could influence the tight correlation seen here between different methods.
Acknowledgements
This study was supported by czech science Foundation (project no. 526/07/1187), by the research plan of the czech geological survey (mzP 0002579801) and by the research plan of The silva tarouca research Institute for landscape and ornamental gardening (project no. msm 6293359101).
References
ahi, s.m. & Powers w.l. (1938). salt tolerance of plants at various temperatures. Plant Physiol., 13(4), 767−789. doI: 10.1104/pp.13.4.767.
Baize, d. & girard m. (Eds.) (1992). Soil classification, principal soils of Europe (in France). Paris : Inra.Belyazid, s., westling, o. & sverdrup h. (2006). modelling changes in forest soil chemistry at 16 swedish coniferous
forest sites following deposition reduction. Environ. Pollut., 144, 596−609. doI: 10.1016/j.envpol.2006.01.018.Billet, m., Parker-Jervis, E., Fitzpatric, E.a. & cresser m.s. (1990). Forest soil chemical changes between 1949/50
and 1987. Eur. J. Soil Sci., 41(1), 133−145. doI: 10.1111/j.1365-2389.1990.tb00051.x.Bouyoucos, g.J. (1926). rapid determination of the moisture content of soils. Science, 64, 651−652. doI: 10.1126/
science.64.1670.65.Brady, n.c. & weil r.r. (2002). The nature and properties of soil. new Jersey : Prentice hall. Brown, h.J., vaz, J.E., Benzo, z. & mejias c. (1999). a comparison of extraction and suspension methods for
determining exchangeable potassium in soils. Applied Clay Science, 14, 245−255. doI: 10.1016/s0169-1317(99)00002-2.
Brugess, P.s. & Breazeale J.F. (1926). methods for the determination of replaceable bases in soils. Science, 64, 69−70. doI: 10.1126/science.64.1646.69.
chapman, h.d. & Kelley w.P. (1930). The determination of the replaceable Bases and the Base-Exchange capacity of soils. Soil Sci., 30, 391−406.
cooper, h.P. (1930). ash constituents of pasture grasses, their standard electrode potentials and ecological signifi-cance. Plant Physiol., 5(2), 193−214. doI: 10.1104/pp.5.2.193.
Ernest, w.s. & Berg E.F.m. (1954). Effect of sewage irrigation upon soils. Sewage and Industrial Wastes, 26(11), 1325−1339.
gedroiz, K.K. (1923). On the absorptive power of soils. From a series of papers published in zhur. opytn. agron. 1919−1923. (English translation from the russian by s.a.waksman).
gedroiz, K.K. (1926). Chemische bodenanalyse. Berlin: verlag von gebrüder Bornträger.gedroiz, K.K. (1929). The soil sorption complex and adsorbed soil cations as a basis for soil classification (in Germany).
dresden-leipzig.gedroiz, K.K. (1931). Exchangeable cations of the soil and the plant. Soil Sci., 32, 51−64.gillman, g.P. & sumpter E.a. (1986). modification to the compulsive exchange method for measuring exchange
characteristics of soils. Aust. J. Soil Res., 24, 61−66. doI: 10.1071/sr9860061. hallbacken, l. & tamm c.o. (1986). changes in soil acidi ty from 1927 to 1982−1984 in a forest area of south-west
sweden. Scand. J. For. Res., 1(1−4), 219−232. doI: 10.1080/02827588609382413.haswell, s.J. (Ed.) (1991). Atomic absorption spectrometry, theory, design and applications. amsterdam: Elsevier.hoenig, m. (1996). sample preparation steps for analysis by atomic spectroscopy methods: present status. Spectro-
chim. Acta Part B, 51, 1297−1307. doI: 10.1016/0584-8547(96)01507-8.houška, J. (2007). Dynamics of soil properties evolutionin natural and close to nature forest ecosystems: Comparison
analysis of selected soil properties (in Czech). dr. sci Thesis. Brno: mzlu.
UnauthenticatedDownload Date | 12/10/14 2:13 PM
59
hrubý, z. (2001). Dynamics of natural forest geobiocenoses evolution in Western Carpathinans (in Czech). dr. sci. thesis. Brno: mzlu.
Iuss working group wrB, world reference Base for soil resources 2006, first update 2007. world soil resources reports no. 103, Fao, rome.
Jabiol, B., Brêthes, a., Ponge, J.F., toutain, F. & Brun J.J. (1994). The humus in all its forms (in France). nancy: En-grEF.
Klinka, K., Feller, m.c., lavkulich, l.m. & Kozak a. (1980). Evaluation of methods of extracting soil cations for for-est productivity studies in southwestern British columbia. Can. J. Soil Sci., 60, 697−705. doI: 10.4141/cjss80-079.
maláč, B. (1933). Contribution to the question of sorption complex of principal Moravian soil types (in Czech). Praha: ministerstvo zemědělství republiky Československé.
małek, s., martinson, l. & sverdrup h. (2005). modelling future soil chemistry at a highly polluted forest site at Istebna in southern Poland using the „saFE“ model. Environ. Pollut., 137, 568−573. doI: 10.1016/j.en-vpol.2005.01.041.
novák, v. & Klika J. (Eds.) (1934). Methods guide of plant sociology and ecology (in Czech). Praha: sborník výzkum-ných ústavů zemědělských.
oulehle, F., hleb, r., houska, J., samonil, P., hofmeister, J. & hruska J. (2010). anthropogenic acidification ef-fects in primeval forests in the transcarpathian mts., western ukraine. Sci. Total Environ., 408, 856−864. doI: 10.1016/j.scitotenv.2009.10.059.
oulehle, F., cosby, B.J., wright, r.F., hruška, J., Kopáček, J., Krám, P., Evans, c.d. & moldan F. (2012). modelling soil nitrogen: The magIc model with nitrogen retention lindek to carbon turnover using decomposer dynamics. Environ. Pollut., 165, 158−166. doI: 10.1016/j.envpol.2012.02.021.
Perkins, a.t., Barhan, h.n. & King h.h. (1932). Exchangeable bases by soxhlet extraction. Trans. Kans. Acad. Sci., 35, 144−145.
reynolds, r.J., aldous, K. & Thompson K.c. (1970). Atomic absorption spectroscopy: A practical guide. new york: Barnes & noble.
selman, a.w. (1925). what is humus? Proc. Natl. Acad. Sci. USA, 11(8), 463−468.silva, B.l.t. (1934). The distribution of „calcicole“ and „calcifuge“ species in relation the the content of the soil in
calcium carbonate and exchangeable calcium, and to soil reaction. J. Ecol., 22(2), 532−553. http://www.jstor.org/stable/2256188
smethurst, P.J. (2000). soil solution and other soil analyses as indicator of nutrient supply: a review. For. Ecol. Manag, 138, 397−411. doI: 10.1016/s0378-1127(00)00426-6.
sumner, m.E. & miller w.P. (1996). cation exchange capacity, and exchange coefficients. In d.l. sparks (Ed.), Meth-ods of soil analysis. Part 2: chemical properties. madison: asa, sssa, cssa.
Šebesta, J., Šamonil, P., lacina, J., oulehle, F., houška, J. & Buček a. (2011). acidification of primeval forests in the ukraine carpathians: vegetation and soil changes over six decades. For. Ecol. Manag., 262, 1265−1279. doI: 10.1016/j.foreco.2011.06.024.
tamm, c.o. & hallbäcken l. (1988). changes in soil acidity in two forest areas with different acid deposition: 1920s to 1980s. Ambio, 17, 56−61.
vieira, m.a., grinberg, P., Bobeda, c.r.r., reyes, m.n.m. & campos r.c. (2009). non-chromatographic atomic spectrometric method in speciation analysis: a review. Spectrochim. Acta Part B, 64, 459−476. doI: 10.1016/j.sab.2009.04.010.
vranová, v. (2005). Influence of species composition on soil sorption properties in imission influenced areas (in Czech). dr. sci. Thesis. Brno: mzlu.
vrška, t., adam, d., hort, l., Kolář, t. & Janík d. (2009). European beech (Fagus sylvatica l.) and silver fir (Abies alba mill.) rotation in the carpathians—a developmental cycle or a linear trend induced by man? For. Ecol. Manag., 258, 347−356. doI: 10.1016/j.foreco.2009.03.007.
white, r.E. (2006). Principles and practice of soil science: the soil as a natural resource. oxford: Blackwell.wilde, s.a. (1954). Facts and fallacies. Ecology, 35(1), 89−92. doI: http://dx.doi.org/10.2307/1931409.zbíral, J. (2002). Soil analysis I. Methods operations (in czech). Brno: ÚKzÚz.zlatník, a., Korsuň, F., Kočetov, F. & Kseneman m. (1938). Natural forests investigatin in Carpathina Ruthenia (In
Czech). Part I. sborník výzkumných ústavů zemědělských věd Čsr, sv.152). Brno: ministerstvo zemědělství republiky Československé.
UnauthenticatedDownload Date | 12/10/14 2:13 PM


![2014 leroy merlin 0006 ope reveil[1]](https://static.fdocument.pub/doc/165x107/568bd5dd1a28ab203499ffe0/2014-leroy-merlin-0006-ope-reveil1.jpg)