Effect of Welding on Gigacycle Fatigue Strength of ...
6
Effect of Welding on Gigacycle Fatigue Strength of Austenitic Stainless Steels Takashi NAOE 1 , Takashi WAKUI 1 , Hiroyuki KOGAWA 1 , Eiichi WAKAI 1 , Katsuhiro HAGA 1 and Hiroshi TAKADA 1 1 J-PARC Center, Japan Atomic Energy Agency, Ibaraki 319-1195, Japan (Received 17 November 2017; received in revised form 9 March 2018; accepted 22 March 2018) Abstract : A mercury target vessel, composed of SUS316L stainless steel, is used for the pulsed spallation neutron source and is assembled via gas tungsten arc welding. While in operation, the target vessel suffers approximately 10 9 loading cycles with a high strain rate of approximately 50 s -1 because of the proton-beam-induced pressure waves in mercury. The gigacycle fatigue strength for solution annealed SUS316L stainless steels and its welded specimens were investigated through ultrasonic fatigue tests. The experimental results showed that an obvious fatigue limit was not observed at fewer than 10 9 cycles for the base metal. In the case of no weld defects observed via penetration tests, the fatigue strength of the removed-weld-bead specimen, in which the weld lines were arranged at the center of the specimen, appeared to be slightly higher than that of the base metal. By contrast, as-welded specimens with the weld bead intact showed apparent degradation of the fatigue strength owing to the stress concentration around the weld toe. Keywords: Gigacycle fatigue, Welding, Ultrasonic fatigue test, Stainless steels 1. Introduction A pulsed spallation neutron source, which generates neutrons via injecting high-intensity 3 GeV proton beams into liquid mercury, is installed in the Japan Proton Accelerator Research Complex (J-PARC). A mercury target vessel, which contains liquid mercury and is composed of SUS316L stainless steels, suffers cyclic impact stress at a strain rate of approximately 50 s -1 caused by proton-beam-induced pressure waves in addition to exposure to proton and neutron irradiation [1]. The target vessel suffers approximately 10 9 stress cycles, a so-called gigacycle, at 25 Hz while in design life, which is decided on the basis of ductility under irradiation. In addition, the target vessel is assembled via gas tungsten arc welding (GTAW), and the vessel has a multiwalled structure, which makes complete removal of the penetration bead difficult [2]. In the gigacycle region, fatigue failure often occurs below the fatigue limit decided on the basis of conventional fatigue tests up to 10 7 cycles. Internal fracture originating from inclusions, so-called fish-eye fracture, occurs in the gigacycle region for high-strength steels [3]. By contrast, in the austenitic stainless steels used in nuclear reactor components, gigacycle fatigue data is insufficient. Fatigue failure originating from the surface has been reported to be dominant in the solution-annealed SUS316L stainless steels [4,5]. In the case of welded austenitic stainless steels, obvious fatigue strength degradation has been reported. Iwata, et al. [6] investigated the effect of the groove shape of SUS316L butt welding joints on the fatigue limit and found that the fatigue limit was reduced by approximately half as a result of a lack of weld penetration regardless of groove shape. Yuri, et al. [7] investigated fatigue strengths of welded SUS316L cut from butt-welded plate, and concluded that the fatigue crack originated from inclusions at the final solidification part of the weld metal. However, in the case of gigacycle fatigue, the fatigue strength of welded stainless steels and the effect of their weld bead have not been reported thus far. In this study, to investigate the effect of welding on the gigacycle fatigue strength of SUS316L stainless steels, ultrasonic fatigue tests were conducted using the weld specimens. Furthermore, the effect of the weld bead on the fatigue strength was investigated via comparing the specimens with and without weld beads. 2. Experiment 2.1 Materials and specimens A commercial SUS316L, which is the structural material of the mercury target vessel used for the pulsed spallation neutron source, was selected as the base metal. The base metal was annealed at 1080°C for 6 min and then water quenched. Two types of weld plates were prepared for the fatigue tests. One was 260L × 90W × 15t mm 3 for hourglass and plate specimens. The other was 370L × 75W × 3t mm 3 for plate specimens to investigate the effect of the weld bead on fatigue. Table 1 shows the chemical compositions of the 15t and 3t plates and the welding rod. GTAW with a V-groove angle of 50° without a root face, which was the same groove shape used to fabricate the target vessel, was Table 1 Chemical composition of SUS316L (wt%) C Si Mn P S Ni Cr Mo 15t 0.011 0.43 0.84 0.027 0.001 12.09 17.55 2.1 3t 0.021 0.72 0.99 0.031 0.000 12.25 17.20 2.09 WR* 0.08 0.39 1.52 0.023 0.001 12.02 18.50 2.13 *WR: YS316L Welding rod (contains 0.19 % of Cu) Fe: balance for each material Table 2 Typical welding conditions for GTAW Layer Path Current [A] Voltage [V] Weld speed [mm/min] Max. Heat input [kJ/cm] 15t 7 11 110-150 11 47~60 21.1 3t 2 2 70-90 10 25~30 21.6 ―123― Advanced Experimental Mechanics, Vol.3 (2018), 123-128 Copyright Ⓒ 2018 JSEM
Transcript of Effect of Welding on Gigacycle Fatigue Strength of ...
1
Effect of Welding on Gigacycle Fatigue Strength of Austenitic Stainless Steels
Takashi NAOE1, Takashi WAKUI1, Hiroyuki KOGAWA1, Eiichi WAKAI1,
Katsuhiro HAGA1 and Hiroshi TAKADA1 1 J-PARC Center, Japan Atomic Energy Agency, Ibaraki 319-1195, Japan
(Received 17 November 2017; received in revised form 9 March 2018; accepted 22 March 2018)
Abstract : A mercury target vessel, composed of SUS316L stainless steel, is used for the pulsed spallation neutron source and is assembled via gas tungsten arc welding. While in operation, the target vessel suffers approximately 109 loading cycles with a high strain rate of approximately 50 s-1 because of the proton-beam-induced pressure waves in mercury. The gigacycle fatigue strength for solution annealed SUS316L stainless steels and its welded specimens were investigated through ultrasonic fatigue tests. The experimental results showed that an obvious fatigue limit was not observed at fewer than 109 cycles for the base metal. In the case of no weld defects observed via penetration tests, the fatigue strength of the removed-weld-bead specimen, in which the weld lines were arranged at the center of the specimen, appeared to be slightly higher than that of the base metal. By contrast, as-welded specimens with the weld bead intact showed apparent degradation of the fatigue strength owing to the stress concentration around the weld toe. Keywords: Gigacycle fatigue, Welding, Ultrasonic fatigue test, Stainless steels 1. Introduction A pulsed spallation neutron source, which generates neutrons via injecting high-intensity 3 GeV proton beams into liquid mercury, is installed in the Japan Proton Accelerator Research Complex (J-PARC). A mercury target vessel, which contains liquid mercury and is composed of SUS316L stainless steels, suffers cyclic impact stress at a strain rate of approximately 50 s-1 caused by proton-beam-induced pressure waves in addition to exposure to proton and neutron irradiation [1]. The target vessel suffers approximately 109 stress cycles, a so-called gigacycle, at 25 Hz while in design life, which is decided on the basis of ductility under irradiation. In addition, the target vessel is assembled via gas tungsten arc welding (GTAW), and the vessel has a multiwalled structure, which makes complete removal of the penetration bead difficult [2]. In the gigacycle region, fatigue failure often occurs below the fatigue limit decided on the basis of conventional fatigue tests up to 107 cycles. Internal fracture originating from inclusions, so-called fish-eye fracture, occurs in the gigacycle region for high-strength steels [3]. By contrast, in the austenitic stainless steels used in nuclear reactor components, gigacycle fatigue data is insufficient. Fatigue failure originating from the surface has been reported to be dominant in the solution-annealed SUS316L stainless steels [4,5]. In the case of welded austenitic stainless steels, obvious fatigue strength degradation has been reported. Iwata, et al. [6] investigated the effect of the groove shape of SUS316L butt welding joints on the fatigue limit and found that the fatigue limit was reduced by approximately half as a result of a lack of weld penetration regardless of groove shape. Yuri, et al. [7] investigated fatigue strengths of welded SUS316L cut from butt-welded plate, and concluded that the fatigue crack originated from inclusions at the final solidification part of the weld metal. However, in the case of gigacycle fatigue, the fatigue strength of welded stainless
steels and the effect of their weld bead have not been reported thus far. In this study, to investigate the effect of welding on the gigacycle fatigue strength of SUS316L stainless steels, ultrasonic fatigue tests were conducted using the weld specimens. Furthermore, the effect of the weld bead on the fatigue strength was investigated via comparing the specimens with and without weld beads. 2. Experiment
2.1 Materials and specimens A commercial SUS316L, which is the structural material of the mercury target vessel used for the pulsed spallation neutron source, was selected as the base metal. The base metal was annealed at 1080°C for 6 min and then water quenched. Two types of weld plates were prepared for the fatigue tests. One was 260L × 90W × 15t mm3 for hourglass and plate specimens. The other was 370L × 75W × 3t mm3 for plate specimens to investigate the effect of the weld bead on fatigue. Table 1 shows the chemical compositions of the 15t and 3t plates and the welding rod. GTAW with a V-groove angle of 50° without a root face, which was the same groove shape used to fabricate the target vessel, was
Table 1 Chemical composition of SUS316L (wt%)
C Si Mn P S Ni Cr Mo 15t 0.011 0.43 0.84 0.027 0.001 12.09 17.55 2.1 3t 0.021 0.72 0.99 0.031 0.000 12.25 17.20 2.09 WR* 0.08 0.39 1.52 0.023 0.001 12.02 18.50 2.13 *WR: YS316L Welding rod (contains 0.19 % of Cu) Fe: balance for each material
Table 2 Typical welding conditions for GTAW Layer Path Current
[A] Voltage
[V] Weld speed [mm/min]
Max. Heat input [kJ/cm]
15t 7 11 110-150 11 47~60 21.1 3t 2 2 70-90 10 25~30 21.6
―123―
Advanced Experimental Mechanics, Vol.3 (2018), 123-128
Copyright Ⓒ 2018 JSEM
2
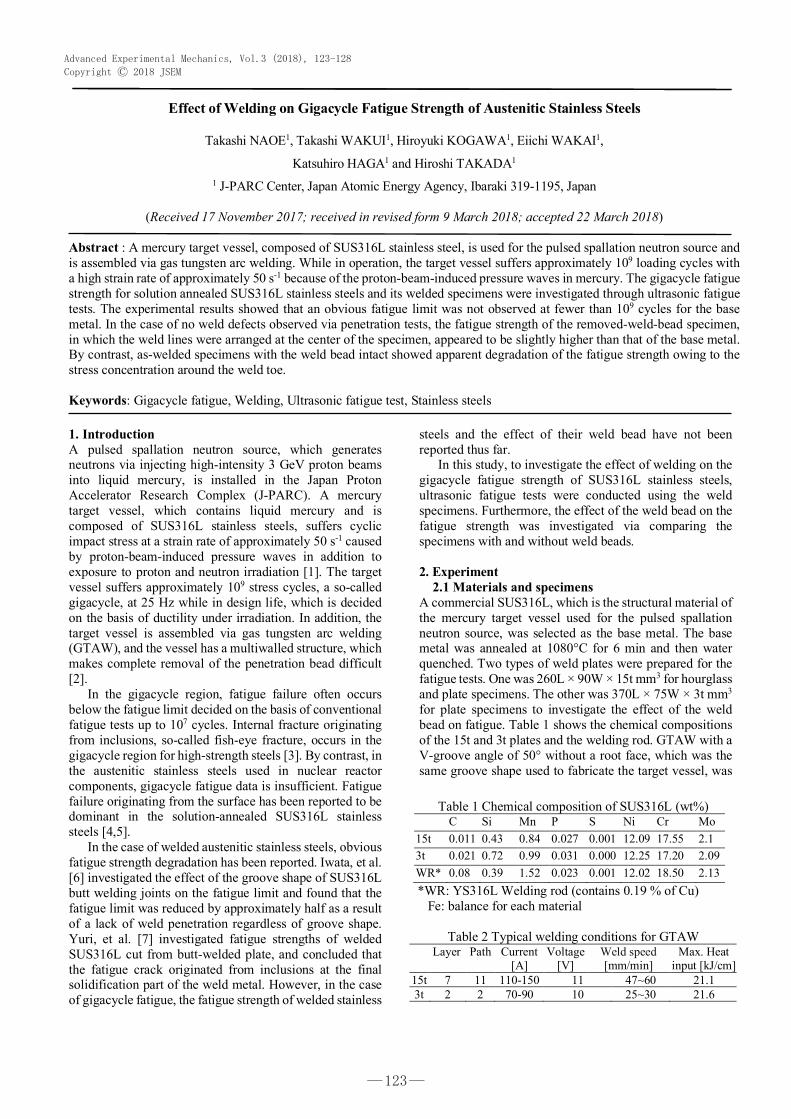
selected for the both plates. Typical welding conditions are shown in Table 2. Penetration testing (PT) was performed to detect welding surface defects. A solvent-removable-dye-penetrant testing method, the so-called VC-S method, was applied to the first and last layers for all welded plates; the results confirmed that the no visible welding surface defects existed. Figure 1 shows the schematics of the arrangement of weld lines and fatigue specimens. Hourglass-shaped specimens were machined from the base metal (hereinafter referred to as hourglass base metal (HBM)) and from the welded plate of 15 mm thickness (hourglass weld (HW)). Plate specimens were cut from 15 mm welded plate (plate weld (PW)), and 3 mm base metal (plate base metal (PBM)), and welded plates (plate with weld bead (PWB)) using wire electric discharge machining. Obvious deformation of specimens owing to the weld residual stress were not recognized. Part of the PWB specimen was ground to remove the weld bead (plate removed-weld-bead (PRB)). The cut surface was finished using #800 SiC paper. The longitudinal direction of the specimen was always made perpendicular to the direction of rolling, i.e., the transverse direction. Weld lines were arranged at the center of the specimens. The testing portions of the weld specimens were inspected by radiographic testing using a 65 kV X-ray tube voltage to locate the weld defects inside welded parts, and we confirmed that no detectable defects in which size is larger than 0.1 mm in diameter were present.
Fig. 1 Schematics of the arrangement of weld lines and fatigue specimens (dimensions in mm)
Fig. 2 Experimental setup for the ultrasonic fatigue tests
2.2 Measurement of mechanical properties To elucidate the mechanical properties of welded specimens, we conducted quasi-static tensile tests using fatigue specimens shown in Fig. 1. The shoulder part of each specimen was chucked, and the tensile stress was applied under a constant crosshead speed of 5 mm/min using a hydraulic testing machine (Shimadzu, 4890-servopulser). Load and elongation curves were obtained from the load cell and the crosshead displacement, respectively. To evaluate the hardness distribution of the weld part, microhardness was measured using a microindenter (Shimadzu, DUH-W201S) equipped with a Berkovich tip. Prior to the hardness measurements, epoxy-molded HW was polished and electrochemically etched with saturated oxalic acid. The universal hardness, Hu, was estimated from the load and depth curve as follows:
(1) wherein Lmax and Dmax are the maximum load and depth, respectively [5]. The maximum load and loading rate were 29.4 mN and 1.47 mN/s, respectively.
2.3 Ultrasonic fatigue tests Gigacycle fatigue tests were conducted using an ultrasonic fatigue testing machine (Shimadzu, USF-2000). Figure 2 shows a photograph of the experimental setup. Stress was applied to a specimen at a rated frequency of 20 kHz through an ultrasonic horn that was fixed to one end of the specimen. The stress amplitude was controlled by adjusting the displacement amplitude of the free end of the specimen. The ratio of stress R = smin / smax = −1, that is tension-compression. The stress applied to an hourglass-shaped specimen, sa, can be estimated on the basis of Webster equation, which as follows [8]:
(2)
(3)
(4) wherein a is the displacement amplitude of the specimen, E is the Young’s modulus, w is the angular velocity, c is the sound speed, l and L are the lengths of the shoulder and the circular parts, and D1 and D2 are the diameters of the shoulder and center parts, respectively. The shoulder length l of specimen was decided the resonance frequency to be 20 kHz based on following equation [8]:
(5) In the case of the plate specimens, because of the lack of suitable equations, the shoulder length was decided through the eigenvalue analysis; in addition, the stress amplitude was
Hu =Lmax
26.43D2max
σa = aEβ cos !l
c
!cosh
bL
2
! 0BBBB@1
2L
sinh β
1CCCCA
b =2L
cosh1
D1
D2
!
β =
rb2✓!
c
◆2
l =c
!tan1
c
!
✓β coth
✓β
L
2
◆ b tanh
✓b
L
2
◆◆�
3
estimated as σa = 12.096a by dynamic stress analysis using the conventional finite element method (FEM) program LS-DYNA [9]. Prior to the fatigue tests, the displacement amplitude for each shape of specimen was checked and calibrated using an eddy current gage (Applied Electronics, PU-05). Fatigue failure in this study was defined as a failure that occurs when the resonance frequency of the specimen exceeds −0.5 kHz of the initial state owing to the occurrence of fatigue crack; typically, in fatigue failure, specimen is not completely fracture. The maximum number of load cycles was 109 cycles. The specimen surface temperature was monitored using an infrared thermometer (Keyence, IT2-02). For the stainless steels, because of the low heat conduction and a large internal friction of specimens, their surface temperature was rapidly increased by the ultrasonic oscillation. In this study, to control the testing temperature, intermittent loading was conducted along with air cooling through a vortex tube (Tohin, AC-60). Intervals of loading and arresting for ultrasonic oscillation were fixed at 0.11 s and 5.0 s, respectively, such that the equivalent testing frequency was approximately 430 Hz. The rise in surface temperature was maintained at around 10°C regardless of specimen shape, in the case of testing at 220 MPa [10]. The strain rate of the specimens, which depends on the stress amplitude, was approximately 102 s-1. After the fatigue tests, fatigue cracks on the surface and those in the cross-section of the failed specimens were observed using a digital microscope and a laser microscope (Keyence, VHX-900 and VK-9510, respectively). A part of the failed PWB specimen was forcedly fractured and the fracture surfaces were observed using by scanning electron microscopy (SEM; Keyence, VE-7800). 3. Results and Discussions
3.1 Mechanical properties 3.1.1 Tensile strength
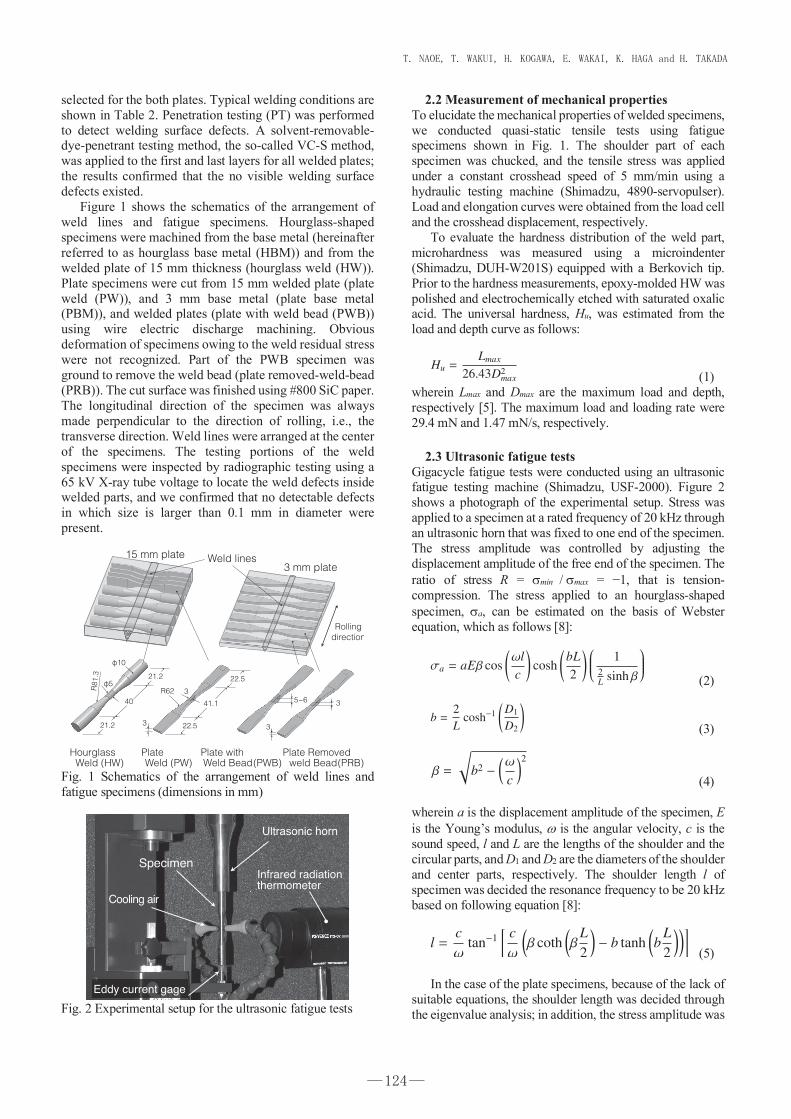
Figure 3 shows the load and crosshead displacement curves for the fatigue specimens before the fatigue tests, as obtained via the quasi-static tensile tests. Because the specimens have no parallel length, engineering strain and yield stress were difficult to estimate from the load and elongation curves. The estimated ultimate tensile strengths (UTSs) for each specimen were HBM 613 MPa, HW 632 MPa, PBM 613 MPa, PW 642 MPa, PWB 721 MPa. Notably, we estimated the stress for PWB while ignoring bead shape. The UTS for welded specimens was slightly higher than that of the corresponding base metal. Furthermore, total elongations for welded specimens were obviously lesser than those of the base metals. Figure 4 shows the photographs of plate specimens after tensile tests. The necking for PWB occurred at a weld toe by stress concentration. Although the cross-sectional image will be shown later, the substrate at the weld toe is base metal, so that total elongation of PWB was nearly equivalent to PBM.
3.1.2 Hardness distribution Figure 5 shows the cross-sectional hardness distribution along with the etched optical microscope image for the HW specimen before the fatigue test. Notably, the universal
hardness in each location is the average value of five data points, and the hardness distribution is assumed to be symmetric about the origin. The solid line in the figure denotes the smoothed curve obtained by applying a Stineman function [11]. The hardness at approximately 4 mm from specimen center (heat-affected zone) is slightly higher than that of weld metal and the substrate of base metal. The weld metal is harder than that of base metal, although the data exhibit a large scatter. The higher UTS than that of the base metal obtained from quasi-static tensile test seems to be attributed to the hardened weld metal and the heat-affected zone.
Fig. 3 Load and crosshead displacement curves for fatigue specimens obtained by quasi-static tensile test
Fig. 4 Photographs of fractured plate specimens after quasi-static tensile tests
Fig. 5 Change in the cross-sectional hardness as a function of the distance from the specimen center for the HW specimen
―124―
T. NAOE, T. WAKUI, H. KOGAWA, E. WAKAI, K. HAGA and H. TAKADA
2
selected for the both plates. Typical welding conditions are shown in Table 2. Penetration testing (PT) was performed to detect welding surface defects. A solvent-removable-dye-penetrant testing method, the so-called VC-S method, was applied to the first and last layers for all welded plates; the results confirmed that the no visible welding surface defects existed. Figure 1 shows the schematics of the arrangement of weld lines and fatigue specimens. Hourglass-shaped specimens were machined from the base metal (hereinafter referred to as hourglass base metal (HBM)) and from the welded plate of 15 mm thickness (hourglass weld (HW)). Plate specimens were cut from 15 mm welded plate (plate weld (PW)), and 3 mm base metal (plate base metal (PBM)), and welded plates (plate with weld bead (PWB)) using wire electric discharge machining. Obvious deformation of specimens owing to the weld residual stress were not recognized. Part of the PWB specimen was ground to remove the weld bead (plate removed-weld-bead (PRB)). The cut surface was finished using #800 SiC paper. The longitudinal direction of the specimen was always made perpendicular to the direction of rolling, i.e., the transverse direction. Weld lines were arranged at the center of the specimens. The testing portions of the weld specimens were inspected by radiographic testing using a 65 kV X-ray tube voltage to locate the weld defects inside welded parts, and we confirmed that no detectable defects in which size is larger than 0.1 mm in diameter were present.
Fig. 1 Schematics of the arrangement of weld lines and fatigue specimens (dimensions in mm)
Fig. 2 Experimental setup for the ultrasonic fatigue tests
2.2 Measurement of mechanical properties To elucidate the mechanical properties of welded specimens, we conducted quasi-static tensile tests using fatigue specimens shown in Fig. 1. The shoulder part of each specimen was chucked, and the tensile stress was applied under a constant crosshead speed of 5 mm/min using a hydraulic testing machine (Shimadzu, 4890-servopulser). Load and elongation curves were obtained from the load cell and the crosshead displacement, respectively. To evaluate the hardness distribution of the weld part, microhardness was measured using a microindenter (Shimadzu, DUH-W201S) equipped with a Berkovich tip. Prior to the hardness measurements, epoxy-molded HW was polished and electrochemically etched with saturated oxalic acid. The universal hardness, Hu, was estimated from the load and depth curve as follows:
(1) wherein Lmax and Dmax are the maximum load and depth, respectively [5]. The maximum load and loading rate were 29.4 mN and 1.47 mN/s, respectively.
2.3 Ultrasonic fatigue tests Gigacycle fatigue tests were conducted using an ultrasonic fatigue testing machine (Shimadzu, USF-2000). Figure 2 shows a photograph of the experimental setup. Stress was applied to a specimen at a rated frequency of 20 kHz through an ultrasonic horn that was fixed to one end of the specimen. The stress amplitude was controlled by adjusting the displacement amplitude of the free end of the specimen. The ratio of stress R = smin / smax = −1, that is tension-compression. The stress applied to an hourglass-shaped specimen, sa, can be estimated on the basis of Webster equation, which as follows [8]:
(2)
(3)
(4) wherein a is the displacement amplitude of the specimen, E is the Young’s modulus, w is the angular velocity, c is the sound speed, l and L are the lengths of the shoulder and the circular parts, and D1 and D2 are the diameters of the shoulder and center parts, respectively. The shoulder length l of specimen was decided the resonance frequency to be 20 kHz based on following equation [8]:
(5) In the case of the plate specimens, because of the lack of suitable equations, the shoulder length was decided through the eigenvalue analysis; in addition, the stress amplitude was
Hu =Lmax
26.43D2max
σa = aEβ cos !l
c
!cosh
bL
2
! 0BBBB@1
2L
sinh β
1CCCCA
b =2L
cosh1
D1
D2
!
β =
rb2✓!
c
◆2
l =c
!tan1
c
!
✓β coth
✓β
L
2
◆ b tanh
✓b
L
2
◆◆�
3
estimated as σa = 12.096a by dynamic stress analysis using the conventional finite element method (FEM) program LS-DYNA [9]. Prior to the fatigue tests, the displacement amplitude for each shape of specimen was checked and calibrated using an eddy current gage (Applied Electronics, PU-05). Fatigue failure in this study was defined as a failure that occurs when the resonance frequency of the specimen exceeds −0.5 kHz of the initial state owing to the occurrence of fatigue crack; typically, in fatigue failure, specimen is not completely fracture. The maximum number of load cycles was 109 cycles. The specimen surface temperature was monitored using an infrared thermometer (Keyence, IT2-02). For the stainless steels, because of the low heat conduction and a large internal friction of specimens, their surface temperature was rapidly increased by the ultrasonic oscillation. In this study, to control the testing temperature, intermittent loading was conducted along with air cooling through a vortex tube (Tohin, AC-60). Intervals of loading and arresting for ultrasonic oscillation were fixed at 0.11 s and 5.0 s, respectively, such that the equivalent testing frequency was approximately 430 Hz. The rise in surface temperature was maintained at around 10°C regardless of specimen shape, in the case of testing at 220 MPa [10]. The strain rate of the specimens, which depends on the stress amplitude, was approximately 102 s-1. After the fatigue tests, fatigue cracks on the surface and those in the cross-section of the failed specimens were observed using a digital microscope and a laser microscope (Keyence, VHX-900 and VK-9510, respectively). A part of the failed PWB specimen was forcedly fractured and the fracture surfaces were observed using by scanning electron microscopy (SEM; Keyence, VE-7800). 3. Results and Discussions
3.1 Mechanical properties 3.1.1 Tensile strength
Figure 3 shows the load and crosshead displacement curves for the fatigue specimens before the fatigue tests, as obtained via the quasi-static tensile tests. Because the specimens have no parallel length, engineering strain and yield stress were difficult to estimate from the load and elongation curves. The estimated ultimate tensile strengths (UTSs) for each specimen were HBM 613 MPa, HW 632 MPa, PBM 613 MPa, PW 642 MPa, PWB 721 MPa. Notably, we estimated the stress for PWB while ignoring bead shape. The UTS for welded specimens was slightly higher than that of the corresponding base metal. Furthermore, total elongations for welded specimens were obviously lesser than those of the base metals. Figure 4 shows the photographs of plate specimens after tensile tests. The necking for PWB occurred at a weld toe by stress concentration. Although the cross-sectional image will be shown later, the substrate at the weld toe is base metal, so that total elongation of PWB was nearly equivalent to PBM.
3.1.2 Hardness distribution Figure 5 shows the cross-sectional hardness distribution along with the etched optical microscope image for the HW specimen before the fatigue test. Notably, the universal
hardness in each location is the average value of five data points, and the hardness distribution is assumed to be symmetric about the origin. The solid line in the figure denotes the smoothed curve obtained by applying a Stineman function [11]. The hardness at approximately 4 mm from specimen center (heat-affected zone) is slightly higher than that of weld metal and the substrate of base metal. The weld metal is harder than that of base metal, although the data exhibit a large scatter. The higher UTS than that of the base metal obtained from quasi-static tensile test seems to be attributed to the hardened weld metal and the heat-affected zone.
Fig. 3 Load and crosshead displacement curves for fatigue specimens obtained by quasi-static tensile test
Fig. 4 Photographs of fractured plate specimens after quasi-static tensile tests
Fig. 5 Change in the cross-sectional hardness as a function of the distance from the specimen center for the HW specimen
―125―
Advanced Experimental Mechanics, Vol.3 (2018)

4
3.2 Fatigue strengths
Figure 6 shows the relationship between the applied stress amplitude and the number of cycles to failure (S–N curve) obtained through the ultrasonic fatigue test for hourglass-shaped specimens. Fatigue failure occurred after a number of cycles greater than 107 cycles; this value was treated as a cycle limit to decide the non-failure stress amplitude in conventional fatigue tests, regardless of the welding. Furthermore, the fatigue limit was obviously not reached for the HBM up to 109 cycles. The fatigue strength of the HW in the low- and high-cycle-number regions (less than 106 cycles) is approximately the same as that of the HBM. By contrast, in the gigacycle region, the fatigue strength of the HW appears to be greater than that of the HBM. This trend is correlated with the results of tensile tests (Fig. 3). The fatigue limit is known to be correlated with the hardness and the ultimate tensile strength [12]. In order to compare with the conventional fatigue test, literature data of SUS304 hourglass base metal (HBM*) and hourglass weld via GTAW (HW*) [13] tested at less than 12 Hz under a stress ratio of -1 are shown in Fig. 6. Although the obvious difference in fatigue limit was not observed in literature, it can be seen that the present data shows the same trend with the literature data.
Figure 7 shows the S–N curves for the plate specimens. Notably, we estimated the stress amplitudes of the PWB while ignoring the bead thickness. The results show that the fatigue strength of the PW is greater than that of the PBM irrespective of the number of cycles. Furthermore, fatigue strength of the PRB is slightly higher than that of the PBM, although the failure data in the gigacycle region are insufficient. The difference in fatigue strength between the PW and the PRB might be caused by the weld residual stress and the difference of the size of the heat-affected zone resulting from the differences in welding conditions.
On the basis of the results of fatigue tests of both hourglass and plate specimens, in the cases where the specimen had no weld defects and a smooth surface, we concluded that the fatigue strength of the weld specimen was higher than that of the base metal. By contrast, in the case of PWB, in which the specimen surface retained the weld bead, an apparent fatigue strength degradation was observed. Literature data of conventional fatigue tests for SUS316L base metal (BM*) and metal active gas (MAG) weld with weld bead (WB*) [6] tested at less than 20 Hz under a stress ratio of 0.1 are shown in Fig. 7. Fatigue strength of BM* is obviously higher than that of HBM*, because the UTS of BM* (642 MPa [6]) was higher than that of HBM* (613 MPa). By contrast, fatigue strength degradation due to weld bead in reference shows the similar trend with the present study.
The reason for this degradation will be discussed further in detail.
3.3 Crack and fracture surface To investigate the crack origin locations, we observed surfaces and cross-sections of fatigue-failed specimens using an optical microscope. Both of the specimen surface and the cross-section were polished and electrochemically etched to enhance the weld metal. Figure 8 shows the typical examples of surface and cross-sectional images of weld specimens.
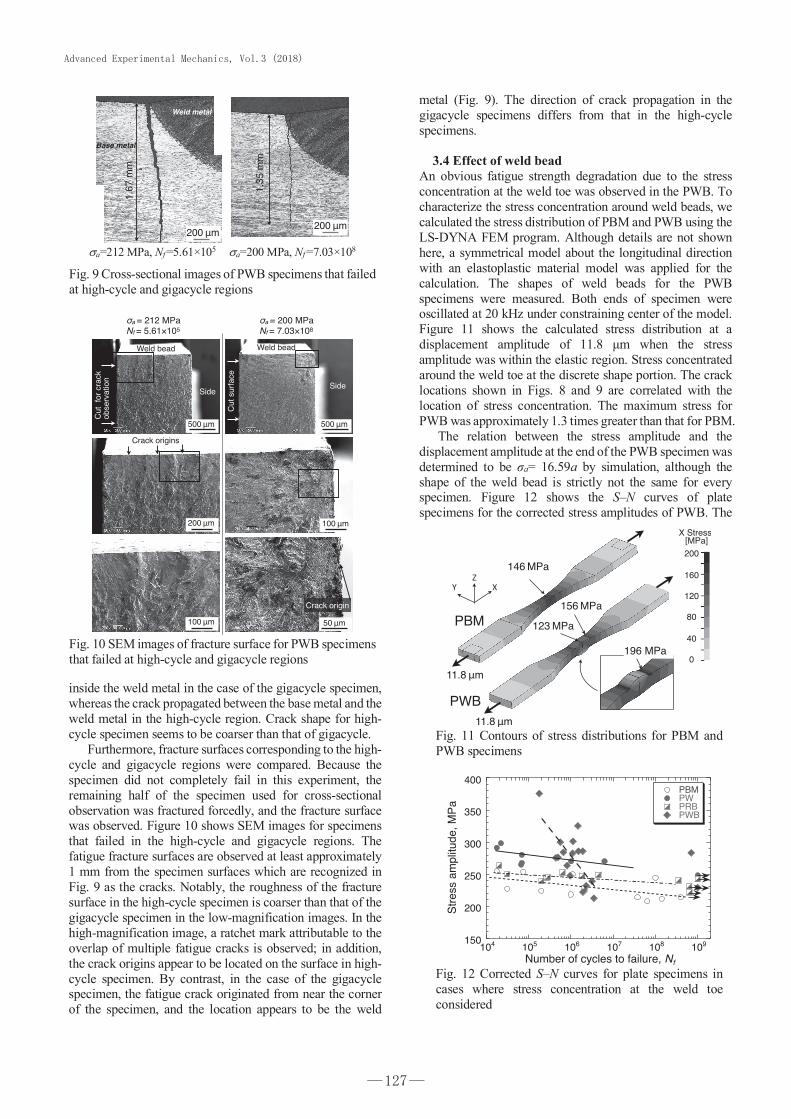
The fatigue cracks are located inside the weld metal except in the case of PWB, because the weld line is arranged at the center of circular and tapered specimens. On the contrary, in the case of PWB, a fatigue crack is recognized at the weld toe. To compare the difference in cracks between the high-cycle and gigacycle regions, cross-sectional images for PWB that failed at 5.61 × 10⁵ and 7.03 × 10⁸ are shown in Fig. 9. Notably, the images show the cross-section around the center of specimen. In both cases, fatigue cracks propagated from around the weld toe toward the bottom side. Furthermore, around the specimen surface, the fatigue crack propagated
Fig. 6 S–N curves for hourglass-shaped base metal and weld metal specimens (note: 304 HBM* and HW* were cited from Ref [13])
Fig. 7 S–N curves for plate specimens (note: stress amplitudes of PWB were estimated with the bead thickness ignored; BM* and WB* were cited from Ref [6])
Fig. 8 Cross-sectional and surface images of fatigue-failed specimens. Arrows in the figure denotes cracks at surfaces
5
inside the weld metal in the case of the gigacycle specimen, whereas the crack propagated between the base metal and the weld metal in the high-cycle region. Crack shape for high-cycle specimen seems to be coarser than that of gigacycle. Furthermore, fracture surfaces corresponding to the high-cycle and gigacycle regions were compared. Because the specimen did not completely fail in this experiment, the remaining half of the specimen used for cross-sectional observation was fractured forcedly, and the fracture surface was observed. Figure 10 shows SEM images for specimens that failed in the high-cycle and gigacycle regions. The fatigue fracture surfaces are observed at least approximately 1 mm from the specimen surfaces which are recognized in Fig. 9 as the cracks. Notably, the roughness of the fracture surface in the high-cycle specimen is coarser than that of the gigacycle specimen in the low-magnification images. In the high-magnification image, a ratchet mark attributable to the overlap of multiple fatigue cracks is observed; in addition, the crack origins appear to be located on the surface in high-cycle specimen. By contrast, in the case of the gigacycle specimen, the fatigue crack originated from near the corner of the specimen, and the location appears to be the weld
metal (Fig. 9). The direction of crack propagation in the gigacycle specimens differs from that in the high-cycle specimens.
3.4 Effect of weld bead An obvious fatigue strength degradation due to the stress concentration at the weld toe was observed in the PWB. To characterize the stress concentration around weld beads, we calculated the stress distribution of PBM and PWB using the LS-DYNA FEM program. Although details are not shown here, a symmetrical model about the longitudinal direction with an elastoplastic material model was applied for the calculation. The shapes of weld beads for the PWB specimens were measured. Both ends of specimen were oscillated at 20 kHz under constraining center of the model. Figure 11 shows the calculated stress distribution at a displacement amplitude of 11.8 µm when the stress amplitude was within the elastic region. Stress concentrated around the weld toe at the discrete shape portion. The crack locations shown in Figs. 8 and 9 are correlated with the location of stress concentration. The maximum stress for PWB was approximately 1.3 times greater than that for PBM. The relation between the stress amplitude and the displacement amplitude at the end of the PWB specimen was determined to be σa= 16.59a by simulation, although the shape of the weld bead is strictly not the same for every specimen. Figure 12 shows the S–N curves of plate specimens for the corrected stress amplitudes of PWB. The
Fig. 11 Contours of stress distributions for PBM and PWB specimens
Fig. 12 Corrected S–N curves for plate specimens in cases where stress concentration at the weld toe considered
sa=212 MPa, Nf =5.61×10⁵ sa=200 MPa, Nf =7.03×10⁸
Fig. 9 Cross-sectional images of PWB specimens that failed at high-cycle and gigacycle regions
Fig. 10 SEM images of fracture surface for PWB specimens that failed at high-cycle and gigacycle regions
―126―
T. NAOE, T. WAKUI, H. KOGAWA, E. WAKAI, K. HAGA and H. TAKADA
4
3.2 Fatigue strengths
Figure 6 shows the relationship between the applied stress amplitude and the number of cycles to failure (S–N curve) obtained through the ultrasonic fatigue test for hourglass-shaped specimens. Fatigue failure occurred after a number of cycles greater than 107 cycles; this value was treated as a cycle limit to decide the non-failure stress amplitude in conventional fatigue tests, regardless of the welding. Furthermore, the fatigue limit was obviously not reached for the HBM up to 109 cycles. The fatigue strength of the HW in the low- and high-cycle-number regions (less than 106 cycles) is approximately the same as that of the HBM. By contrast, in the gigacycle region, the fatigue strength of the HW appears to be greater than that of the HBM. This trend is correlated with the results of tensile tests (Fig. 3). The fatigue limit is known to be correlated with the hardness and the ultimate tensile strength [12]. In order to compare with the conventional fatigue test, literature data of SUS304 hourglass base metal (HBM*) and hourglass weld via GTAW (HW*) [13] tested at less than 12 Hz under a stress ratio of -1 are shown in Fig. 6. Although the obvious difference in fatigue limit was not observed in literature, it can be seen that the present data shows the same trend with the literature data.
Figure 7 shows the S–N curves for the plate specimens. Notably, we estimated the stress amplitudes of the PWB while ignoring the bead thickness. The results show that the fatigue strength of the PW is greater than that of the PBM irrespective of the number of cycles. Furthermore, fatigue strength of the PRB is slightly higher than that of the PBM, although the failure data in the gigacycle region are insufficient. The difference in fatigue strength between the PW and the PRB might be caused by the weld residual stress and the difference of the size of the heat-affected zone resulting from the differences in welding conditions.
On the basis of the results of fatigue tests of both hourglass and plate specimens, in the cases where the specimen had no weld defects and a smooth surface, we concluded that the fatigue strength of the weld specimen was higher than that of the base metal. By contrast, in the case of PWB, in which the specimen surface retained the weld bead, an apparent fatigue strength degradation was observed. Literature data of conventional fatigue tests for SUS316L base metal (BM*) and metal active gas (MAG) weld with weld bead (WB*) [6] tested at less than 20 Hz under a stress ratio of 0.1 are shown in Fig. 7. Fatigue strength of BM* is obviously higher than that of HBM*, because the UTS of BM* (642 MPa [6]) was higher than that of HBM* (613 MPa). By contrast, fatigue strength degradation due to weld bead in reference shows the similar trend with the present study.
The reason for this degradation will be discussed further in detail.
3.3 Crack and fracture surface To investigate the crack origin locations, we observed surfaces and cross-sections of fatigue-failed specimens using an optical microscope. Both of the specimen surface and the cross-section were polished and electrochemically etched to enhance the weld metal. Figure 8 shows the typical examples of surface and cross-sectional images of weld specimens.
The fatigue cracks are located inside the weld metal except in the case of PWB, because the weld line is arranged at the center of circular and tapered specimens. On the contrary, in the case of PWB, a fatigue crack is recognized at the weld toe. To compare the difference in cracks between the high-cycle and gigacycle regions, cross-sectional images for PWB that failed at 5.61 × 10⁵ and 7.03 × 10⁸ are shown in Fig. 9. Notably, the images show the cross-section around the center of specimen. In both cases, fatigue cracks propagated from around the weld toe toward the bottom side. Furthermore, around the specimen surface, the fatigue crack propagated
Fig. 6 S–N curves for hourglass-shaped base metal and weld metal specimens (note: 304 HBM* and HW* were cited from Ref [13])
Fig. 7 S–N curves for plate specimens (note: stress amplitudes of PWB were estimated with the bead thickness ignored; BM* and WB* were cited from Ref [6])
Fig. 8 Cross-sectional and surface images of fatigue-failed specimens. Arrows in the figure denotes cracks at surfaces
5
inside the weld metal in the case of the gigacycle specimen, whereas the crack propagated between the base metal and the weld metal in the high-cycle region. Crack shape for high-cycle specimen seems to be coarser than that of gigacycle. Furthermore, fracture surfaces corresponding to the high-cycle and gigacycle regions were compared. Because the specimen did not completely fail in this experiment, the remaining half of the specimen used for cross-sectional observation was fractured forcedly, and the fracture surface was observed. Figure 10 shows SEM images for specimens that failed in the high-cycle and gigacycle regions. The fatigue fracture surfaces are observed at least approximately 1 mm from the specimen surfaces which are recognized in Fig. 9 as the cracks. Notably, the roughness of the fracture surface in the high-cycle specimen is coarser than that of the gigacycle specimen in the low-magnification images. In the high-magnification image, a ratchet mark attributable to the overlap of multiple fatigue cracks is observed; in addition, the crack origins appear to be located on the surface in high-cycle specimen. By contrast, in the case of the gigacycle specimen, the fatigue crack originated from near the corner of the specimen, and the location appears to be the weld
metal (Fig. 9). The direction of crack propagation in the gigacycle specimens differs from that in the high-cycle specimens.
3.4 Effect of weld bead An obvious fatigue strength degradation due to the stress concentration at the weld toe was observed in the PWB. To characterize the stress concentration around weld beads, we calculated the stress distribution of PBM and PWB using the LS-DYNA FEM program. Although details are not shown here, a symmetrical model about the longitudinal direction with an elastoplastic material model was applied for the calculation. The shapes of weld beads for the PWB specimens were measured. Both ends of specimen were oscillated at 20 kHz under constraining center of the model. Figure 11 shows the calculated stress distribution at a displacement amplitude of 11.8 µm when the stress amplitude was within the elastic region. Stress concentrated around the weld toe at the discrete shape portion. The crack locations shown in Figs. 8 and 9 are correlated with the location of stress concentration. The maximum stress for PWB was approximately 1.3 times greater than that for PBM. The relation between the stress amplitude and the displacement amplitude at the end of the PWB specimen was determined to be σa= 16.59a by simulation, although the shape of the weld bead is strictly not the same for every specimen. Figure 12 shows the S–N curves of plate specimens for the corrected stress amplitudes of PWB. The
Fig. 11 Contours of stress distributions for PBM and PWB specimens
Fig. 12 Corrected S–N curves for plate specimens in cases where stress concentration at the weld toe considered
sa=212 MPa, Nf =5.61×10⁵ sa=200 MPa, Nf =7.03×10⁸
Fig. 9 Cross-sectional images of PWB specimens that failed at high-cycle and gigacycle regions
Fig. 10 SEM images of fracture surface for PWB specimens that failed at high-cycle and gigacycle regions
―127―
Advanced Experimental Mechanics, Vol.3 (2018)
6
fatigue strength of PWB is higher than that of PBM when the number of cycles is less than 106. By contrast, when the number of cycles is greater than 106, the fatigue strength of PWB appears to be the same or smaller than that of PBM. Additional fatigue data for PBM are needed to elucidate the effect of the weld bead on gigacycle fatigue. 4. Conclusions The gigacycle fatigue behavior of SUS316L, which is the structural material used for the mercury target vessel for the spallation neutron source, was investigated through the ultrasonic fatigue tests at room temperature using welded specimens whose weld lines were arranged at the center of the specimen. Prior to the fatigue tests, the mechanical properties of the specimens were measured. The results showed that the ultimate tensile strength and the universal hardness of the weld metal were approximately 3%–5% and 15% higher than those of the base metal, respectively. With respect to the hourglass-shaped specimens, the fatigue strength of the HW in the gigacycle region appeared to be higher than that of the base metal HBM, whereas no remarkable difference was observed in the high-cycle region. In the case of the plate specimens, the fatigue strength of the weld specimen cut PW was slightly greater than that of the PRB. In both cases, the high-cycle fatigue strength was greater than that of the base metal PBM. By contrast, the fatigue strength for the weld bead specimen PWB, wherein we estimated the stress amplitude while ignoring the weld bead, was obviously degraded because of the stress concentration at the weld toe in comparison with the PBM and the removed-weld-bead PRB specimens. In future work, to better clarify the effect of welding in gigacycle fatigue, we will conduct additional fatigue tests focused on samples subjected to more than 107 cycles. Furthermore, the effect of the heat-affected zone on fatigue will be investigated by displacing the arrangement of the weld lines on specimens. Acknowledgement This work was partly supported by JSPS KAKENHI Grant Numbers JP26820016, JP17K14565. The authors thank Messes. H. Kobayashi and D. Fujiya of Nippon Advanced Technology for their assistance with the metallographic and hardness observation.
References [1] Futakawa, M.: Targetry overview -various target
concepts and expectable next generation targets in power frontier applications-, JPS Conf. Proc., 8 (2015), 001002-1–12.
[2] Wakui, T., Kogawa, H., Haga, K., Futakawa, M., Hayashi, R., Uchiyama, N., Okamoto, N. and Nakamura, K.: Fabrication of Mercury Target Vessel, JAEA-Technology 2009–040, Japan Atomic Energy Agency, (2009).
[3] Bathias, C. and Paris, P. C.: Gigacycle Fatigue in Mechanical Practice, CRC Press (2004).
[4] Ogawa, T., Nakane, M., Masaki, K., Hashimoto, S. Ochi, Y. and Asano, K.: Investigation of effect of pre-strain on very high-cycle fatigue strength of austenitic stainless steels, J. Power Energy Sys., 3–1 (2009), 38–50.
[5] Naoe, T., Xiong, Z. and Futakawa, M.: Gigacycle fatigue behavior of austenitic stainless steels used for mercury target vessels, J. Nucl. Mater., 468 (2016), 331–338.
[6] Iwata, T., Matsuoka, K. and Kobayashi, Y.: Fatigue strength of welded joints of SUS316L for chemical tankers, Weld World, 50 (2006), 82–91.
[7] Yuri, T., Ogata, Y., Saitou, M. and Hirayama, Y.: High cycle fatigue properties of austenitic stainless steel welds at cryogenic temperature, Tetsu-to-Hagane, 84–12 (1998) 888–895.
[8] Salama, K. and Lamerand, R. K.: The prediction of fatigue life using ultrasound testing, Proc. 1st International Conference on Fatigue and Corrosion Fatigue Up To Ultrasonic Frequencies (1981), 109–133.
[9] LS-DYNA Theory Manual, Livemore Software Technology Corporation, (2016).
[10] Naoe, T., Xiong, Z. and Futakawa, M.: Temperature measurement for in-situ crack monitoring under high-frequency loading, J. Nucl. Mater., (in press).
[11] KaleidaGraph Version 4.5 User guide, Synergy Software, (2016).
[12] Casagrande, A., Cammarota, G.P. and Micele, L.: Relationship between fatigue limit and Vickers hardness in steels, Mater. Sci. Eng. A, 528 (2011), 3468–3473.
[13] NRIM Fatigue data sheet No. 65, National Research Institute for Metals, (1990).
1
Study on Recycling Method of Waste Gypsum Board Paper:Application of Waste Gypsum Board Paper for Soil Improvement
Yusuke IMAMURA1 , Tomoaki SATOMI1 and Hiroshi TAKAHASHI1
1Graduate School of Environmental Studies, Tohoku University, Sendai 980-8579, Japan
(Received 25 December 2017; received in revised form 19 February 2018; accepted 18 March 2018) Abstract: The authors have developed a new recycling method for high water content mud which is called “Fiber-Cement-Stabilized Soil method”. In this method, paper debris (fragments of old paper) and solidification material are mixed with mud to produce modified soils. The modified soils have several features such as large failure strength, large failure strain, and high durability in wetting and drying condition. However, recently, as the price of old paper is increasing, development of new fiber materials which can substitute for paper debris is strongly desired. In this study, the applicability of gypsum board paper to Fiber-Cement-Stabilized Soil method was investigated. The board paper was cut into small pieces with the same size of conventional paper debris, and they were used to produce modified soils. As a result, modified soils using board paper only did not have enough failure strength compared to modified soils produced by using conventional paper debris. However, when the board paper and paper debris were used together to improve the sludge, the amount of paper debris was reduced to a half of the amount used in conventional Fiber-Cement-Stabilized Soil method to get enough failure strength. Keywords: Gypsum board paper, Fiber-cement-stabilized soil, Soil improvement, Recycling, Unconfined compression test
1. Introduction High water content mud such as construction sludge and water purification sludge is difficult to reuse directly because of its high water content, and most of them are dehydrated or directly discarded at the final disposal site. Consequently, the recycling rate of industrial waste “mud” including construction sludge and other high water content mud is extremely low [1]. Therefore, we have developed a new recycling method for high water content mud by using paper debris (fragments of old paper) and solidification material. This method is called “Fiber-cement-stabilized soil method”. The modified soils have several features such as large failure strength, large failure strain, and high durability in wetting and drying condition [2, 3]. However, recently, as the price of old paper is increasing [4], development of new fiber material which can substitute for paper debris is strongly desired.
By the way, the amount of waste gypsum board discharged from dismantling sites is increasing every year [5]. Gypsum board consists of gypsum and thick paper (board paper), and is widely used as interior construction materials. Although discharging amount of them is huge, most of them are discarded at final disposal sites since it is difficult to process them [5]. Thus, development of the effective recycling method for gypsum board is desired. There are some researches on recycling gypsum from gypsum board [e.g., 6]. However, since gypsum powder is attached on the surface of board paper, they are very difficult to be recycled to the ordinary paper and there are few researches for the method of recycling board paper.
Therefore, in this study, we focused on the board paper as a substitute for paper debris for fiber-cement-stabilized-method. Even if the gypsum powder is attached on the surface of board paper, as this method can restrict the generation of hydrogen sulfide, there are no problems in this new recycling system when they are used for soil improvement. Furthermore, as the recycle plants need to pay the cost to discard the waster gypsum board paper, the waste board paper can be obtained for almost free. Therefore, if
board paper can be applied for fiber-cement-stabilized soil method, a large cost reduction is possible and the increase of recycling rate of gypsum board paper is expected.
Therefore, the purpose of this study is to investigate the possibility of the application of board paper as a substitute for paper debris in the fiber-cement-stabilized soil method. Modified soils produced by using paper debris and board paper were made and the strength characteristic was compared to investigate the applicability of board paper to the fiber-cement-stabilized soil method.
2. Experimental Procedures
2.1 Procedure of crushing board paper Takahashi and Kanahama (2010) applied board paper for fiber-cement-stabilized soil method already [7]. They crushed board paper by using hammer crusher which makes the board paper into cotton state. The modified soil made by using this cotton state board paper showed a superior strength characteristic. However, when the board paper is crushed by hammer crusher, a large quantity of dust occurs and this may cause a dust explosion. Thus this method has not been practically applied. On the other hand, ordinary paper debris is produced by crushing the old newspapers by the crusher like a wood chipper, and the dust explosion is not reported. Therefore, in this study, we crushed board paper assuming that board paper was crushed in the same way that produces the paper debris.
Count Average length of
long side [mm] Average length of narrow side [mm]
Average size
[mm] Paper debris 334 13.92 7.57 10.75
Board paper 105 13.95 9.26 11.60
Table 1 Average size of paper debris and board paper
―128―
T. NAOE, T. WAKUI, H. KOGAWA, E. WAKAI, K. HAGA and H. TAKADA
![Welding Mechanics and Fracture Assessment - 大阪大学 · Recent progress in welding mechanics and fracture assessment ... Performance of Welded Joints [6] - Fatigue Design and](https://static.fdocument.pub/doc/165x107/5af290577f8b9a8b4c90580c/welding-mechanics-and-fracture-assessment-progress-in-welding-mechanics.jpg)