個案報告與討論︰...
11
家 庭 醫 業 261 家庭醫學與基層醫療 第二十六卷 第六期 臨床案例 個案為77歲的已婚婦女,過去病史為 69歲時因右上肢手部僵硬診斷巴金森氏病 開始服用抗巴金森氏病藥物,手抖情況隨 年紀增大而逐漸惡化,1 年半前曾住院並 將抗巴金森藥物加重為 Madopar(250mg) 1 tab q4h及Entacapone 1 tab tid,1年前曾短 暫出現看到像人的黑影,懷疑先生外遇 ,症狀一個星期後改善,10個月前因先生 中風而搬去與女兒同住,9 個月前因行動 不便借助輪椅代步,因睡眠問題半夜會起 來大聲哭泣,5 個月前家人請外勞協助其 生活作息,2 個月前晚上會將錢放在床上 ,認為家人偷她的錢,1 個月前出現視幻 覺及被害妄想,2 個星期前症狀加劇及懷 疑先生有外遇,入院前1 天凌晨時上廁所 因外勞動作慢,生氣打了外勞,被家人送 至急診並住院接受檢查。 入院後身體檢查、一般的神經學檢 查、例行的抽血檢查及甲狀腺功能都沒有 發現異常,腦部電腦斷層無急性出血或是 腫塊壓迫,住院後無明顯觀察到憂鬱相關 症狀,知能篩檢測驗(CASI)結果不能排除 輕度知能障礙的可能性,與神經科醫師討 論後停用Entacapone,因無明顯手抖情況 逐漸將Madopar (250mg)1 tab q4h調降為 0.5 tab qid,並給予 Quetiapine(25mg) 2 tab hs,精神症狀逐漸改善,遂安排出院。 流行病學 根據多篇橫斷面的研究 (cross- sectional study),追蹤數星期到6個月,巴 金森氏病的病人出現視幻覺的盛行率約 40%,聽幻覺為0-22%,其他精神症狀為 17-72%。一篇以門診病患為主追蹤6年的 研究,出現精神症狀的盛行率為33-55% ,另一篇以社區病患為主追蹤4 年的研究 ,盛行率為23-56%。一篇追蹤20 年的研 究結果,出現精神症狀的盛行率為 17- 74%。而一篇回溯性研究的結果指出,終 生的盛行率為50%。 臨床表現及診斷 視幻覺是巴金森氏病患最常出現的 精神症狀,出現精神症狀的病人超過90% 1 彰化基督教醫院家庭醫學科 住院醫師 2 彰化基督教醫院家庭醫學科 主 任 3 彰化基督教醫院家庭醫學科 主治醫師 關鍵字:Parkinson's disease, psychosis, hallucinations, delusions 賴昂廷 1 林益卿 2 楊鈺雯 3 個案報告與討論︰ 巴金森氏病與精神症狀
Transcript of 個案報告與討論︰...

家 庭 醫 業
261家 庭 醫 學 與 基 層 醫 療 第二十六卷 第六期
臨床案例
個案為77歲的已婚婦女,過去病史為69歲時因右上肢手部僵硬診斷巴金森氏病開始服用抗巴金森氏病藥物,手抖情況隨
年紀增大而逐漸惡化,1年半前曾住院並將抗巴金森藥物加重為 Madopar(250mg) 1 tab q4h及Entacapone 1 tab tid,1年前曾短暫出現看到像人的黑影,懷疑先生外遇
,症狀一個星期後改善,10個月前因先生中風而搬去與女兒同住,9個月前因行動不便借助輪椅代步,因睡眠問題半夜會起
來大聲哭泣,5個月前家人請外勞協助其生活作息,2個月前晚上會將錢放在床上,認為家人偷她的錢,1個月前出現視幻覺及被害妄想,2個星期前症狀加劇及懷疑先生有外遇,入院前1天凌晨時上廁所因外勞動作慢,生氣打了外勞,被家人送
至急診並住院接受檢查。
入院後身體檢查、一般的神經學檢
查、例行的抽血檢查及甲狀腺功能都沒有
發現異常,腦部電腦斷層無急性出血或是
腫塊壓迫,住院後無明顯觀察到憂鬱相關
症狀,知能篩檢測驗(CASI)結果不能排除輕度知能障礙的可能性,與神經科醫師討
論後停用Entacapone,因無明顯手抖情況逐漸將Madopar (250mg)1 tab q4h調降為0.5 tab qid,並給予 Quetiapine(25mg) 2 tab hs,精神症狀逐漸改善,遂安排出院。
流行病學
根據多篇橫斷面的研究 ( c r o s s -sectional study),追蹤數星期到6個月,巴金森氏病的病人出現視幻覺的盛行率約
40%,聽幻覺為0-22%,其他精神症狀為17-72%。一篇以門診病患為主追蹤6年的研究,出現精神症狀的盛行率為33-55%,另一篇以社區病患為主追蹤4年的研究,盛行率為23-56%。一篇追蹤20年的研究結果,出現精神症狀的盛行率為17-74%。而一篇回溯性研究的結果指出,終生的盛行率為50%。
臨床表現及診斷
視幻覺是巴金森氏病患最常出現的
精神症狀,出現精神症狀的病人超過90%
1 彰化基督教醫院家庭醫學科 住院醫師
2 彰化基督教醫院家庭醫學科 主 任
3 彰化基督教醫院家庭醫學科 主治醫師
關鍵字:Parkinson's disease, psychosis, hal lucinations, delusions
賴昂廷1 林益卿2 楊鈺雯3
個案報告與討論︰巴金森氏病與精神症狀
家 庭 醫 業
262 家 庭 醫 學 與 基 層 醫 療 第二十六卷 第六期
有過視幻覺的經驗,發生時一次持續幾秒
鐘到幾分鐘,常常一天出現好幾次,在晚
上或是單獨在安靜的環境下容易引發,視
幻覺的內容通常為具體的人或是動物,較
少是不具生命的物體,出現的內容傾向重
複,而聽幻覺的內容很廣,可能從模糊的
耳語聲、音樂聲到威脅的話語,聽幻覺較
常合併視幻覺,約8%到13%,較少獨立出現,另外觸幻覺、嗅幻覺或是味幻覺較
不常見。巴金森氏病常出現視幻覺的情況
,跟典型的精神分裂症出現聽幻覺,可以
有所區分。至於較輕微的精神症狀包括錯
覺、妄想等出現的機會約40%,妄想的形式通常為偏執妄想,懷疑另一伴有外遇
或是被遺棄,而誇大、有關身體、被害或
是宗教妄想,臨床上較少遇到。
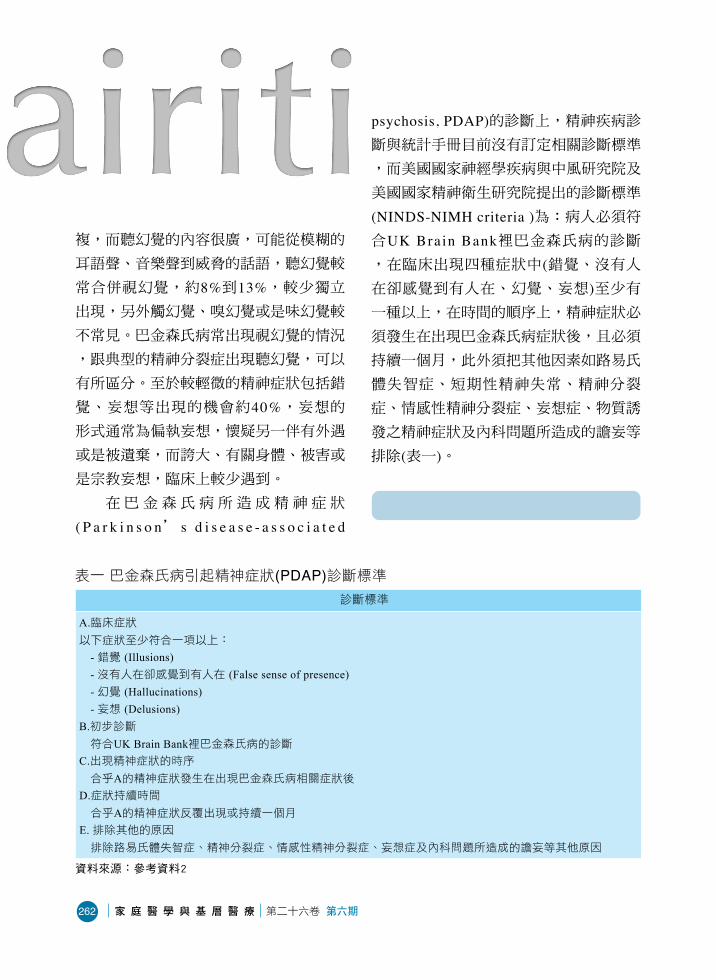
在巴金森氏病所造成精神症狀
( P a r k i n s o n’ s d i s e a s e - a s s o c i a t e d
psychosis, PDAP)的診斷上,精神疾病診斷與統計手冊目前沒有訂定相關診斷標準
,而美國國家神經學疾病與中風研究院及
美國國家精神衛生研究院提出的診斷標準
(NINDS-NIMH criteria )為:病人必須符合UK Brain Bank裡巴金森氏病的診斷,在臨床出現四種症狀中(錯覺、沒有人在卻感覺到有人在、幻覺、妄想)至少有一種以上,在時間的順序上,精神症狀必
須發生在出現巴金森氏病症狀後,且必須
持續一個月,此外須把其他因素如路易氏
體失智症、短期性精神失常、精神分裂
症、情感性精神分裂症、妄想症、物質誘
發之精神症狀及內科問題所造成的譫妄等
排除(表一)。
病理生理
表一 巴金森氏病引起精神症狀(PDAP)診斷標準 診斷標準
A.臨床症狀以下症狀至少符合一項以上:
- 錯覺 (Illusions)- 沒有人在卻感覺到有人在 (False sense of presence)- 幻覺 (Hallucinations)- 妄想 (Delusions)
B.初步診斷符合UK Brain Bank裡巴金森氏病的診斷
C.出現精神症狀的時序合乎A的精神症狀發生在出現巴金森氏病相關症狀後
D.症狀持續時間合乎A的精神症狀反覆出現或持續一個月
E. 排除其他的原因排除路易氏體失智症、精神分裂症、情感性精神分裂症、妄想症及內科問題所造成的譫妄等其他原因
資料來源:參考資料2

家 庭 醫 業
263家 庭 醫 學 與 基 層 醫 療 第二十六卷 第六期
巴金森氏病主要是多巴胺不足所引
起,而精神疾病則是認為多巴胺過多,因
此治療巴金森氏病若藥物過量時,可能產
生精神症狀。現在也有人認為精神症狀跟
巴金森氏病本身疾病進展有關,然而致病
機轉尚未了解,推測可能與神經化學物質
如多巴胺、血清素及乙醯膽鹼出現異常、
腦部顳葉及頂葉皮質病變、視覺功能退
化、睡眠調節異常及抗巴金森氏病藥物有
關,確切的機轉需要未來更多的研究才能
夠釐清。
危險因子
1. 藥物因素在早期的臨床經驗及針對巴金森氏
病的研究認為左多巴(Levodopa)可能跟病人出現精神症狀有所關連,後來發現與每
天使用左多巴的劑量無關。一篇研究認為
所有抗巴金森氏病藥物都有可能會出現精
神症狀,但是使用某幾種藥時出現機會較
高 (表二 )。近年有兩篇綜合分析研究(Stowe RL et al, Baker WL et al)顯示使用多巴胺促進劑比左多巴或是安慰劑,更容
易出現精神症狀。
2. 認知功能受損巴金森氏病的病人罹患失智症的盛
行率近30%,約一般人的4到6倍,其中發病年齡較晚者及家族史有失智症者,有較
高機會有失智症,失智症大都發生於疾病
的晚期,超過10年以上的病人有75%以上有失智症。常用評估老人失智相關量表為
簡易智能評估 ( M i n i - M e n t a l S t a t u s E x a m i n a t i o n )、認知能力篩選工具(Cognitive Abilities Screening Instrument,
表二 抗巴金森氏病藥物造成精神症狀的可能性 抗巴金森氏病藥物 常用藥物 機會由高至低
抗膽鹼藥物 Trihexyphenidyl (Artame)Biperiden (Akineton)
B型單胺酶抑制劑(MAO-B inhibitor)
Selegiline
N-methyl-D-aspartate glutamate接受器拮抗劑
Amantadine
多巴胺促進劑
(dopamine agonist)Pramipexole (Mirapex)Ropinirole (Requip)
Cathechol-O-methyltransferase(COMT)抑制劑
Entacapone (Comtan)
左多巴 + 脫酸酶抑制劑(lovodopa + decarboxylase inhibitor)
Levodopa 100mg + carb idopa 25mg (Sinemet)Levodopa 100mg + beserazide 25mg (Madopar)
資料來源:參考資料3

家 庭 醫 業
264 家 庭 醫 學 與 基 層 醫 療 第二十六卷 第六期
C A S I )及臨床失智評估量表 ( C l i n i c a l Dementia Rating, CDR)。
對於巴金森氏病的病人,評估其認知
功能,常用的篩檢測驗為簡易智能評估及
劍橋認知量表 ( C a m b r i d g e C o g n i t i v e Examination),兩種測驗有相似的敏感性(95% vs 98%),但劍橋認知量表比簡易智能評估更具特異性(94% vs 77%),證據等級為level B(結論來自一個隨機臨床試驗或多個非隨機臨床試驗)。在一篇收集八個縱貫性、總共近一千四百人的研究顯示
,25.8%巴金森氏病的病人有輕度認知障礙(mild cognitive impairment)。當認知功能受損時,容易出現精神症狀,而本身一
開始簡易智能評估所測的分數就比較低時
,之後出現精神症狀的機會也較高。
3. 年紀和罹患巴金森氏病的時間長短 根據多變量變異數分析的研究指出
,罹患巴金森氏病的時間長短才是決定是
否出現精神症狀的獨立預測因子,時間越
久越容易有精神症狀,而非與巴金森氏病
發病時年齡有關。據一篇回溯性研究發現
,出現精神症狀時,好發在疾病的中後段
(以剛發病為0,死亡時為100%,大概落在60-80%)。
4. 疾病的嚴重度評估巴金森氏病的嚴重程度常使用
UPDRS巴金森氏病症狀衡量表(Unified Parkinson Disease Rating Scale)及The Hoehn and Yahr Stages,當疾病嚴重度越
嚴重時,出現精神症狀的機會就越高。
5. 睡眠障礙睡眠時若有逼真的夢 (v iv id d ream
,可清楚記得夢的細節 )或是夢魘(nightmare),可能伴隨視幻覺及精神症狀。當快速動眼期睡眠行為異常 (REM sleep behavior disorder,對夢境做出身體反應,拳打腳踢,吼叫,而正常人在快
速動眼期時,肌肉呈現無力狀態,不會
對夢境做出身體反應),會增加認知障礙的機率,也可能出現視幻覺及精神症狀
。而日間過度嗜睡的人也較易出現精神
症狀。
6. 視覺因素 巴金森氏病的病人可能因眼球運動
不正常,導致視力障礙,當視力變差時
,出現視幻覺的機會增加。
7. 憂鬱 憂鬱是巴金森氏病的病人常伴隨的
症狀,大約有50%的病人有憂鬱的情形,而憂鬱也與巴金森氏病本身的嚴重程
度及失智症有關。評估巴金森氏病的病
人是否有憂鬱,常用的篩檢測驗為貝克
憂鬱量表(Beck Depression Inventory-I)及漢氏憂鬱量表 ( H a m i l t o n D e p r e s s i o n Rating Scale),證據等級為level B,而對於憂鬱嚴重度之變化敏感度較佳的
Montgomery Asberg Depression Rating Scale, MADRS),證據等級為level C(結論

家 庭 醫 業
265家 庭 醫 學 與 基 層 醫 療 第二十六卷 第六期
來自專家意見或是個案研究)。當有嚴重的憂鬱症時,較易併發精神症狀(major d e p r e s s i v e d i s o r d e r w i t h p s y c h o t i c features)。
8. 自律神經機能障礙 自律神經機能障礙可能會出現的症
狀為頭暈、頭痛、記憶力差、口乾、肩頸
痠痛、胸悶、心悸、喘不過氣、腸胃病及
睡眠的障礙,根據一篇回溯性的研究,當
有自律神經機能障礙時,也容易有精神症
狀。
9. 基因 當家族有相關的失智症方面的遺傳
史時,出現精神症狀的機會也較高。另外
在調控膽囊收縮素(Cholecystokinin,一種神經傳導物質)或是調控其受器的基因,與出現視幻覺也有關連性。
治療
在治療方面,所有抗巴金森氏病藥
物其副作用都可能產生精神症狀,若剛使
用藥物或藥物調高劑量時出現精神症狀
,應考慮藥物所引起,治療的方式可調降
藥物的劑量,或換其他藥物。根據研究
,使用左多巴加脫酸酶抑制劑跟其他抗巴
金森氏病的藥物相比,較少出現精神症狀
,因此選擇藥物時可優先考慮。若精神症
狀在嘗試上述方法都無效時,可再加上抗
精神藥物。
在抗精神藥物的選擇上(表三),根據美國神經病學學會的指引,Quetiapine是巴金森氏病病人出現精神症狀的首選用藥
,其治療效果不錯,而且產生錐體外症候
群的副作用機會較低,建議起始劑量為每
天12.5mg,每4到7天增加12.5mg,維持劑量為 2 5 - 1 5 0 m g。第二選擇藥物為Clozapine,建議起始劑量為每天6.25mg,每4到7天增加6 . 2 5 m g,維持劑量為6.25-50mg,其治療效果佳,產生錐體外症候群的副作用機會也較低,但須注意有
表三 巴金森氏病的抗精神病藥物比較 抗精神病藥物 劑量(mg/d) 藥效 出現錐體外症狀的可能性
Aripiprazole 1-10 中 中到高
Clozapine 6.25-50 高 低
Olanzapine 2.5-10 低 高
Quetiapine 25-150 中到低 低
Risperidone 0.5-1.5 中 中
Ziprasidone 目前研究資料有限
資料來源:參考資料8

家 庭 醫 業
266 家 庭 醫 學 與 基 層 醫 療 第二十六卷 第六期
小於1%的機率會發生致命性顆粒性白血球減少的可能性,因此在服藥的前18週,每週需做白血球檢驗,之後每個月追蹤
一次。
另外根據幾篇研究指出,治療巴金
森氏病合併精神症狀及行為問題時,使用
乙 醯 膽 鹼 抑 制 劑 如 D o n e p e z i l或Rivastigmine,能夠有效治療,減輕症狀。美國食品藥物管理局目前只允
許Rivastigmine使用於巴金森氏病合併輕度到中度的失智症。迄今並無指引明確指
出,在巴金森氏病患者出現精神症狀時
,可使用乙醯膽鹼抑制劑。
預後
年紀大、日常功能退化及失智症等
是巴金森氏病患者去安養機構的因素。發
巴金森氏病出現精神症狀
符合PDAP診斷標準
仍有精神症狀
失智症
是否
憂鬱症精神分裂症
阿滋海默症
換藥或減低劑量
給失智症藥物
給抗血小板藥
給抗憂鬱藥
給抗精神病藥
換藥或減低劑量
血管性失智症
加抗精神用藥
妄想症及譫妄等
針對不同疾病給予合適治療
詢問相關病史及藥物史
新增抗巴金森氏病藥物或增加劑量
圖一 巴金森氏病出現精神症狀治療流程圖

家 庭 醫 業
267家 庭 醫 學 與 基 層 醫 療 第二十六卷 第六期
病時的年紀、目前年齡、疾病的嚴重程度
及失智症等會影響巴金森氏病患者的死亡
率。當病人出現精神症狀時,也會增加去
安養機構的機會及死亡率。
結論
臨床上當病人出現精神症狀時,應
先排除瞻妄症,包括進行理學檢查、神經
學檢查、實驗室檢驗,必要時安排影像學
檢查。而巴金森氏病患者一生會出現精神
症狀的機會高達50%,當有精神症狀時,應仔細詢問病史,最近是否有新增藥物
或是調整藥物劑量,另外對於常見的憂
鬱、認知及精神症狀需要釐清先後順序及
症狀的嚴重性,整體評估可能造成精神症
狀的原因,如懷疑抗巴金森氏病藥物引起
的精神症狀,應考慮換藥或是調降劑量
,診斷失智症時應加上失智症相關藥物
,有血管性失智症時加上抗血小板類藥物
如Aspirin,有憂鬱症給予抗憂鬱藥,有睡眠問題時應考慮造成影響睡眠的因素
,當上述原因經治療後仍無效果時,則考
慮加抗精神用藥(圖一)。總而言之,針對造成病人精神症狀的原因加以鑑別診斷
,並做適當的處理,才能給病人最佳的治
療。
參考資料
1. Fénelon G, Alves G: Epidemiology of psychosis in Parkinson's disease. J Neurol Sci 2010; 289:12-7.
2. B e r n a r d R, K a r e n M, H u b e r t H F, e t a l : Diagnostic criteria for psychosis in Parkinson's disease: report of an NINDS, NIMH work group. Mov Disord 2007; 22:1061-8.
3. Schrag A: Psychiatric aspects of Parkinson's disease--an update. J Neurol 2004; 251:795-804.
4. M i y a s a k i J M, S h a n n o n K, Vo o n V, e t a l: Practice parameter: evaluation and treatment of depression, psychosis, and dementia in Parkinson disease (an evidence-based review): report of the Quality Standards Subcommittee of the American Academy of Neurology. Neurology 2006; 66:996-1002.
5. Aarsland D, Kurz MW: The epidemiology of dementia associated with Parkinson disease. J Neurol Sci 2010; 289:18-22.
6. Aarsland D, Bronnick K, Williams-Gray C, et al: Mild cognitive impairment in Parkinson disease: a multicenter pooled analysis. Neurology 2010; 75:1062-9.
7. Josephs KA, Whitwell JL: Parkinson disease and down in the dumps: pumped or stumped? Neurology 2010; 75:846-7.
8. Hasna in M, Vieweg VR, Baron MS, e t a l: Pharmacological management of psychosis in elderly patients with Parkinsonism. Am J Med 2009; 122:614-22.
9. Friedman JH: Recommendations on the drug treatment of psychosis in Parkinson's disease. Am J Med 2010; 123:19.
10. Forsaa EB, Larsen JP, Wentzel-Larsen T, Alves G: What predicts mortality in Parkinson disease: a prospective population-based long-term study. Neurology 2010; 75:1270-6.
ORIGINAL RESEARCH
The presence of malnutrition in community-livingolder adults receiving home nursing servicesndi_1572 46..50
Georgie RIST,1 Gail MILES1 and Leila KARIMI21Royal District Nursing Services, Helen Macpherson Smith Institute of Community Health, and 2School of PublicHealth, Faculty of Health Sciences, La Trobe University, Melbourne, Victoria, Australia
AbstractAim: To determine the extent of malnutrition and malnutrition risk among community-living older people (aged65 years and over) who are receiving care from a metropolitan home nursing service in Victoria, Australia.Method: Over a 3-month period (May–July 2009), 235 clients aged 65 years and over from a community nursingservice providing home nursing care were assessed for malnutrition using the Mini Nutritional Assessment (MNA®,Nestle, Vevey, Switzerland).Results: Thirty-four per cent (34.5%) of clients were identified as being at risk of malnutrition, while 8.1% werefound to be malnourished. There was no significant relationship between nutrition risk and gender, country of birthor living arrangements.Conclusion: Malnutrition and nutrition risk was found to be an issue among this sample of community-living olderadults who were receiving home nursing care in Victoria, Australia. In this study, just over 40% of the participantswere either at risk of malnutrition or malnourished, which highlights the vulnerability of this group of older peopleand the need for routine nutrition screening and a targeted intervention program to address nutrition issues.
Key words: ageing, community health, malnutrition, nutrition screening, nutritional status.
Introduction
Malnutrition is a significant clinical and public health issuethroughout the world and may be particularly prevalent inelderly people living in the community.1–3 Although theextent of malnutrition in the community, including Austra-lia, is not well known, it is widely accepted among healthprofessionals that malnutrition has significant health, socialand economic implications.1,4–9
In a recent review of 21 studies in which malnutrition incommunity-living older adults was assessed using the MiniNutritional Assessment tool (MNA®), prevalence rates thatranged from 0 to 8% and from 8 to 76% of older adults weredeemed to be at risk of malnutrition.10 A further 25 studiesusing samples of elderly people receiving outpatient andhome-based health-care services detected malnutritionprevalence rates ranging from 0 to 30% with risk of malnu-trition being 8–65%. Studies conducted in Australia usingthe MNA® reported that 20–30% of elderly clients living in
the community were malnourished.7,11 In a study using asample of older people receiving domiciliary care, a preva-lence rate of 4.8% was found while 38.4% of this populationwas at risk of malnutrition.5
A knowledge of the prevalence of malnutrition in thecommunity is important as research has shown that thehealth complications associated with malnutrition lead toincreased general practitioner visits, admissions to hospital,prolonged hospital stays, early admission to nursing homeand a 30% increase in the incidence of mortality within1 year.1,4–12 Malnutrition in older people is also associatedwith increased health-care costs.4 Although there is littleresearch on the cost of malnutrition to the community,Lipski stated at a presentation at the 2005 Committee onNutrition for Older Australian conference, that for ‘everydollar spent on better nutrition for the elderly, $5 is saved inhealth care costs’.6
A large metropolitan community nursing service in Vic-toria, Australia was interested in identifying the malnutritionrate among its client group to determine whether any furtheraction is needed to be undertaken to improve the qualityof nursing care in relation to nutrition. Therefore, a studywas conducted to determine the extent of malnutritionand nutrition risk using the MNA®13 among a sample ofcommunity-living older adults receiving home nursingservices in Victoria, Australia.
G. Rist, BND, APD, AN, Project OfficerG. Miles, DN, BAppSci, ResearcherL. Karimi, PhD, MAPS, LecturerCorrespondence: G. Rist, Australia. Email: [email protected]
Accepted May 2011
Nutrition & Dietetics 2012; 69: 46–50 DOI: 10.1111/j.1747-0080.2011.01572.x
© 2012 The AuthorsNutrition & Dietetics © 2012 Dietitians Association of Australia
46

Method
This exploratory study of malnutrition rates employed adescriptive cross-sectional design. Ethical approval wasobtained for this study from the Royal District NursingService Research Ethics Committee.
Study participants were from a community nursingservice located in metropolitan Melbourne in Victoria,Australia. This service predominately provides care to olderpeople in the community that fits the profile of nutritionallyvulnerable older adults susceptible to fluctuations in nutri-tion status.
Sixty per cent of clients admitted to this service were agedover 60 years and had a number of comorbidities. Theirliving arrangements varied, with some clients living alone,others living with their spouse or other family. The majorityof clients received a pension (income less than $30 000)from the Commonwealth Government or Department ofVeterans Affairs (DVA).
Clients of the community nursing service were recruitedby nursing staff throughout the Greater Melbourne metro-politan area from May to July 2009. On admission to thenursing service, the assessment nurse identified clients whomet the eligibility criteria. Eligible clients included thoseaged 65 years and over, clients newly admitted to thenursing service and funded by the Home and CommunityCare (HACC) or DVA programs. All clients sign a consentform for treatment (including assessment) on admission tothe service.
Clients currently undergo a nutrition assessment whenthey are admitted to the service; however, for the purposes ofthis study, the MNA® replaced this nutrition assessment.Only clients with complete assessments were included inthe study.
Before the study commenced, an Accredited PractisingDietitian (APD) provided nursing staff with scales and tapemeasures to take anthropometric measurements, a resourcekit and education on using the screening and assessmenttool.
The MNA® was used to assess the nutrition risk of studyparticipants. It is a valid and reliable tool specifically devel-oped to identify older people who are suffering from mal-nutrition or at risk of malnutrition. The MNA® detects therisk of malnutrition before severe changes in weight orserum proteins occur and can be used in a variety of heath-care settings including the community.13
The tool assesses issues specific to ageing such as func-tionality, depression, and dementia as well as anthropo-metric measures, social situation and food patterns. It iscomprised of 18 questions, 6 screening questions and 12assessment questions.
Part 1 (MNA®-SF screening tool) is designed to detect adecline in food intake or weight in the past 3 months, psy-chological stress or acute disease, current mobility and neu-ropsychological problems, and body mass index (BMI). Afterconsultation with an APD and a review of the literature, BMIcategories in accordance with the recommendations fromthe Australian Nutrition Screening Initiative were used to
describe whether the participants were underweight, over-weight or a healthy weight (see Figure 1).14 Weight andheight were recorded in kilograms (kg) and metres (m),respectively.
A screening score of 12–14 signifies normal nutritionstatus and no need for further assessment, while a score of11 or lower indicates ‘possible malnutrition’, and requiresthe assessment tool (part 2) to be completed. Part 2 of theMNA® assesses polypharmacy, pressure ulcers, food andfluid intake and eating ability, living situation, perceptionof own nutrition and health status, and mid-arm andcalf circumferences. A malnutrition indicator score of �24indicates a well-nourished person. A score of 17–23.5 indi-cates ‘risk of malnutrition’ and a score of <17 indicatesmalnutrition.
Participant’s demographic and socioeconomic data wereextracted from the electronic client database of the commu-nity nursing service.
The Statistical Package for the Social Sciences (SPSS)Version 17 (SPSS Inc., Chicago, IL. USA) was used to checkand analyse the study data in accordance with the studyobjectives. Frequencies were reported for gender, financialstatus, country of birth, language spoken, living arrange-ments and the categorised malnutrition indicator score.Descriptive statistics including mean, range and standarddeviation were reported for age, weight and BMI. An inde-pendent sample t-test was used to compare mean malnutri-tion indicator score and age group. Chi-square tests wereused to compare categorised malnutrition indicator scoreand gender, financial status, country of birth and livingarrangements. An alpha value of 0.05 was chosen to reportlevels of significance.
Results
During the recruitment period, 250 clients consented toundergo MNA® screening for malnutrition risk. Fifteenforms were incomplete, leaving a total sample of 235participants.
The demographic characteristics of the sample are pre-sented in Table 1. The age of participants ranged from 65to 100 with a mean age of 82 (SD = 7.0), and there weresimilar proportions of males (47.2%) and females (52.8%) inthe sample. All participants were receiving a pension. The
Body mass index (BMI kg/m²)
< 22 underweight 22 – 26.9 healthy weight 27 – 29.9 overweight > 30 obese
Figure 1 BMI ranges for older adults (Source: Miller M,Thomas J, Cameron I et al. BMI: a simple, rapid and clini-cally meaningful index of undernutrition in the oldest old?Br J Nutr 2009; 101: 1300–305).
Malnutrition among community-living older adults
© 2012 The AuthorsNutrition & Dietetics © 2012 Dietitians Association of Australia
47

majority of the clients were born in Australia (62.8%) andjust under half were living alone (48.8%).
Participant weights ranged from 31.8 to 135 kg. Themean BMI was 26.4 kg/m2 (SD = 5.5) with a range of 13.2–45.0 kg/m2. Nineteen per cent (19.1%) of participants wereclassified as underweight, 41.3% as healthy weight, 17.0%overweight and 22.6% as obese.
The proportion of participants identified as well nour-ished, at risk of malnutrition or malnourished is outlined inFigure 2. Just over a third of participants (34.5%) were atrisk of malnutrition, 8.1% were identified as malnourishedand 57.4% had no or low nutrition risk.
Further analyses comparing malnourished clients andthose at risk of malnutrition with clients who were not at riskwere carried out to see if there was a relationship with anydemographic characteristics.
The results of independent sample t-tests (for intervaldata) and c2 procedure (for categorical data) comparingdemographic characteristics with the clients’ level of nutri-tion risk showed no significant differences for age, gender,country of birth or living arrangements (P > 0.05) (seeTable 1).
T-test analyses revealed that clients with no risk ofmalnutrition weighed significantly more and had higherBMI and mid-arm circumference scores compared withthe malnourished/at risk of malnutrition group (P < 0.05)(see Table 2).
Discussion
This study used the MNA® to identify the presence of mal-nutrition in a sample of community-living older people
(�65 years) receiving community home nursing services inVictoria, Australia. The extent of malnutrition identified inthe study sample (8.1%) was higher than that found in asimilar population (4.8%) in an Australian study by Visvan-than et al.,5 but was similar to the 9% malnutrition ratereported by Guigoz in a review of the MNA® literature.13
Similar proportions of nutrition risk were observed in thisstudy (34.5%), Visvanthan et al.’s Australian study (38.4%)5
and a recent New Zealand study by Watson et al. (31%).15
The sample included in this study and the Visvanthanet al.’s study5 were similar in that they included frail olderpeople as described above who were receiving home nursingcare and not ‘well’ people. However, Visvanthan’s parti-cipants had been receiving an intervention which could
8.1
57.4
34.5
0.0
10.0
20.0
30.0
40.0
50.0
60.0
70.0
80.0
90.0
100.0
Malnourished
Nutritional status
Per
cen
tag
e
No risk At risk' of malnutrition
Figure 2 Malnutrition and risk of malnutrition among 235community-living older people receiving home nursing care.
Table 1 Comparison of participant demographic characteristics and MNA® groups
Variable
n(a)
(At risk andmalnourished/No risk)
At risk andmalnourished No risk P-value
Age (mean, SD) 99/134 82.4 (7.2) 82.0 (7.0) 0.62Gender (male/female, %) 99/134 40.4/59.6 52.2/47.8 0.08Country of birth (Australia/other, %) 92/123 68.5/31.5 58.5/41.5 0.15Living arrangements (family/alone, %) 88/121 54.5/45.5 48.8/51.2 0.48(a) Sample size varies from 209 to 233 due to missing data for some variables.
Table 2 Comparison of group characteristics based on MNA® score classifications
Variable
n(a)
(At risk andmalnourished/No risk)
At risk and malnourished(Mean, SD)
No risk(Mean, SD) P-value
Height (cm) 97/133 155.8 (24.6) 159.4 (22.0) 0.24Weight (kg) 95/133 59.2 (18.5) 72.1 (17.9) 0.01BMI (mean, SD) 100/135 24.3 (5.0) 27.8 (5.4) 0.001MAC (cm) 96/130 24.8 (6.4) 28.0 (7.2) 0.01(a) Sample size varies from 208 to 234 due to missing data for some variables.BMI, body mass index; MAC, mid-arm circumference.
G. Rist et al.
© 2012 The AuthorsNutrition & Dietetics © 2012 Dietitians Association of Australia
48
explain the lower malnutrition rate. In comparison, similarnumbers of respondents in both studies were at nutritionrisk.
The ongoing demand for community health servicesand the commensurate financial burden on the health-caresystem associated with malnutrition is not known, nor can itbe quantified as malnourished older people are not alwaysrecognised.16 Consequently, community nursing servicesproviding home care need to ensure that nutrition is apriority in care provision.
Targeting malnutrition among older individuals living inthe community needs an integrated approach from commu-nity health agencies, and policy direction and support fromgovernment. Health agencies and government have a role insupporting and prioritising malnutrition screening, treat-ment and prevention by making it a national health priority.
As a starting point, health organisations providing care toolder adults in the community need to adopt or developnutrition policies to not only identify malnutrition but alsosupport the provision of appropriate care to treat malnutri-tion. Any policies need to address the inclusion of a validatednutrition screening and assessment tool such as the MNA®
as part of the health assessment. A number of organisationsincluding the Dietitians Association of Australia16 andNational Institute for Health and Clinical Excellence17 havedeveloped evidence-based practice guidelines that providehealth professionals with comprehensive frameworks toaddress nutrition issues in older people across the con-tinuum of care through an integrated approach to nutritioncare. Using these types of guidelines means that organisa-tions can more rapidly introduce evidence-based nutritioncare.
Bates et al. emphasised that ‘Malnutrition is not a conse-quence of ageing and it should not be allowed to persist asthough it were a “normal” process’.18 Community nurses areideally situated to identify nutrition issues among this popu-lation group as they are at the forefront of client care in thehome. They have an important role to play in the provisionand monitoring of basic nutrition interventions as part of aninterdisciplinary team with direction and guidance from adietitian and/or a dietitian-led program.
The main limitation of the study was that the sample onlyreflected one community nursing service in Victoria. Asthe population being examined was receiving communitynursing services, the results may not be relevant to the totalpopulation of community-living older people in Victoria orAustralia. A nationwide malnutrition prevalence study isrecommended to truly understand the extent of the problemin community-living older people.
Like other studies reported in the literature, this studyidentified the presence of malnutrition and malnutrition riskin a sample of older adults living in the community, andreceiving care from a home nursing service. The findingsfrom this study contribute to the body of evidence thatsuggests that the prevalence of malnutrition in the commu-nity is a problem that needs to be addressed. The need toscreen nutrition status and monitor older people living inthe community has been demonstrated; however, support
through nutrition interventions also needs to follow. There-fore, it is the responsibility of health agencies and govern-ment to ensure that nutrition programs are available toaddress identified nutrition issues.
At the local level, organisations providing care to peoplein the community can develop programs to address thenutrition needs of the populations they service. These pro-grams need to be based on government policy and guidelinesdeveloped by relevant national and international organi-sations. This will ensure that better health outcomes areachieved, thus helping to reduce the burden caused bymalnutrition on the health-care system.
Acknowledgements
This research study would not have been possible withoutfunding and support from the Morris Family Trust and H &L Hecht Trust. The Home and Community Care (HACC)services provided by RDNS are jointly funded by the Victo-rian and Australian Governments. A special thank you isgiven to the clients who participated in the study and theChairperson and reference group members who steered thestudy to its completion.
References
1 Visvanathan R. Under-nutrition in older people: a serious andgrowing global problem! J Postgrad Med 2003; 49: 352–60.
2 Kangansky N, Berner Y, Koren-Morag N et al. Poor nutritionalhabits are predictors of poor outcomes in very old hospitalizedpatients. Am J Clin Nutr 2005; 82: 784–91.
3 Elia M. The ‘Must’ Report: Nutritional Screening of Adults; A Mul-tidisciplinary Responsibility. Redditch, UK: British Association forParental and Enteral Nutrition, 2003.
4 Visvanthan R. Under nutrition and the older person. Australianand New Zealand Society for Geriatric Medicine Position State-ment No 6 September 2007.
5 Visvanthan R, Macintosh C, Callary M et al. The nutritionalstatus of 250 older Australian recipients of domiciliary careservices and its association with outcomes at 12 months. J AmGeriatr Soc 2003; 51: 1007–11.
6 Lipski P. Undernutrition in housebound elderly. Proceedingsfrom the First Nutritional Care of the Housebound ElderlyConference; 4 Nov 2005, The Committee on Nutritionfor Older Australians (CNOA) Sydney University NutritionResearch Foundation.
7 Leggo M, Banks M, Isenring E et al. A quality improvementnutrition screening and intervention program available toHome and Community Care eligible clients. Nutr Diet 2008; 65:162–67.
8 Stratton R, Thompson R, Margetts B et al. Health care utilizationaccording to malnutrition risk in the elderly: an analysis of datafrom the national diet and nutrition survey. Proceedings fromthe Nutrition Society, 2002; 6: 20A.
9 European Nutrition for Health Alliance. Malnutrition amongolder people in the community: policy recommendationsfor change. 2006 (Available from: http://tinyurl.com/5gubvo,accessed 18 November 2008).
10 Guigoz Y. The Mini Nutritional Assessment (MNA) review ofthe literature—what does it tell us? J Nutr Health Aging 2006;10: 466–87.
Malnutrition among community-living older adults
© 2012 The AuthorsNutrition & Dietetics © 2012 Dietitians Association of Australia
49