EE379K/EE394V Smart Grids: Building A Smart Grid...
55
EE379K/EE394V Smart Grids: Building A Smart Grid Architecture – Lecture 2/4 Ross Baldick, Department of Electrical and Computer Engineering 1 Copyright © 2017 CMG Consulting LLC. All Rights Reserved. Andres Carvallo, CMG Consulting Westlake Energy Spring 2017
Transcript of EE379K/EE394V Smart Grids: Building A Smart Grid...
EE379K/EE394V Smart Grids:Building A Smart Grid Architecture – Lecture 2/4
Ross Baldick, Department of Electrical and
Computer Engineering
1Copyright © 2017 CMG Consulting LLC. All Rights Reserved.
Andres Carvallo,
CMG Consulting
Westlake Energy
Spring 2017

Lecture 2 Outline
2.2.2 ISO/RTO-based Utilities .........................................................3 slides
2.2.3 Public Power/Municipal Utilities/Electric Cooperatives……………3 slides
2.3 Markets, Services, and Business/Value Stream Frameworks..........2 slides
2.3.1 Value Stream Structure for Vertically Integrated Markets...........1 slide
2.3.2 Value Stream Structure for Hybrid Markets ..............................1 slide
2.3.3 Value Stream Structure for Texas ...........................................1 slide
2.3.4 Value Stream Structure for Independent Aggregator Markets.....2 slides
2.3.5 Value Attachment....................................................................4 slides
2.4 Electric Structure........................................................................6 slides
2.4.1 Transmission/Bulk Power System Structure................................1 slides
2.4.2 Primary Substations.................................................................3 slides
2.4.3 Distribution Circuits..................................................................8 slides
2.5 Basic Electric Coupling Model ......................................................3 slides
2Copyright © 2017 CMG Consulting LLC. All Rights Reserved.

2.2.2 ISO/RTO-based Utilities (1/3)
In areas where utilities have been structured for centrally-organized wholesale markets, some functions have been disaggregated and new entity classes have been formed; in particular, the system operators.
In regions with wholesale markets, these markets may be operated by the Independent System Operator (ISO) or Regional Transmission Operator (RTO).
Additionally, the system operator performs balancing authority functions such as load frequency control (secondary generator control) and dispatch/balancing (tertiary generator control) for balancing authority areas.
3Copyright © 2017 CMG Consulting LLC. All Rights Reserved.

2.2.2 ISO/RTO-based Utilities (2/3)
Some ISO’s and RTO’s have mechanisms to dispatch Distributed Energy Resources (DER) and Demand Response (DR) assets, including non-utility assets, bypassing local distribution companies (“tier hopping”) in the process. For example, CAISO can dispatch distributed generation that is connected
via the Wholesale Distribution Access Tariff Interconnection Process. Facilities with qualifying CHP assign a portion of their capacity to be dispatched by the ISO. ISO-NE defines Distributed Generation assets that can participate in both Forward Capacity and Energy Markets.
As another example, PJM has developed the means to dispatch water heater control as thermal storage for use in frequency regulation. This is an example of non-bilateral (asymmetric) storage, because electric energy can be put into storage, but the energy cannot be retrieved as electricity.
4Copyright © 2017 CMG Consulting LLC. All Rights Reserved.

2.2.2 ISO/RTO-based Utilities (3/3)
5Copyright © 2017 CMG Consulting LLC. All Rights Reserved.
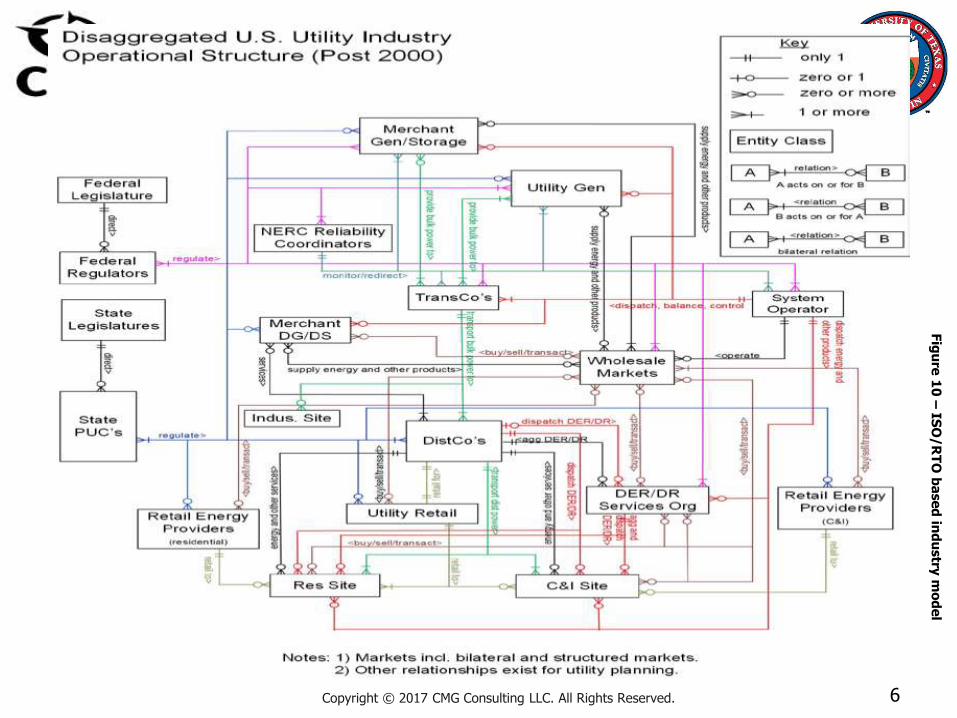
Figure 10 illustrates the structure of an ISO/RTO-based utility set.
There are multiple business entities carrying out functions that would have been handled by departments in an integrated utility.
One such entity is the System Operator, which may provide several functions, including operation of wholesale energy and power markets.
Transmission Operators may or may not be separate entities from Distribution Providers.
The increased number of separate business entities makes the overall structure more complex, and makes it more difficult to modify organizational boundaries and roles than in the integrated case.
Fig
ure
10
–IS
O/R
TO
ba
se
d in
du
stry
mo
de
l
2.2.2 ISO/RTO-based Utilities (3/3)
6Copyright © 2017 CMG Consulting LLC. All Rights Reserved.
Fig
ure
10
–IS
O/R
TO
ba
se
d in
du
stry
mo
de
l
2.2.3 Public Power/Municipal Utilities/Electric Cooperatives (1/3)
7Copyright © 2017 CMG Consulting LLC. All Rights Reserved.
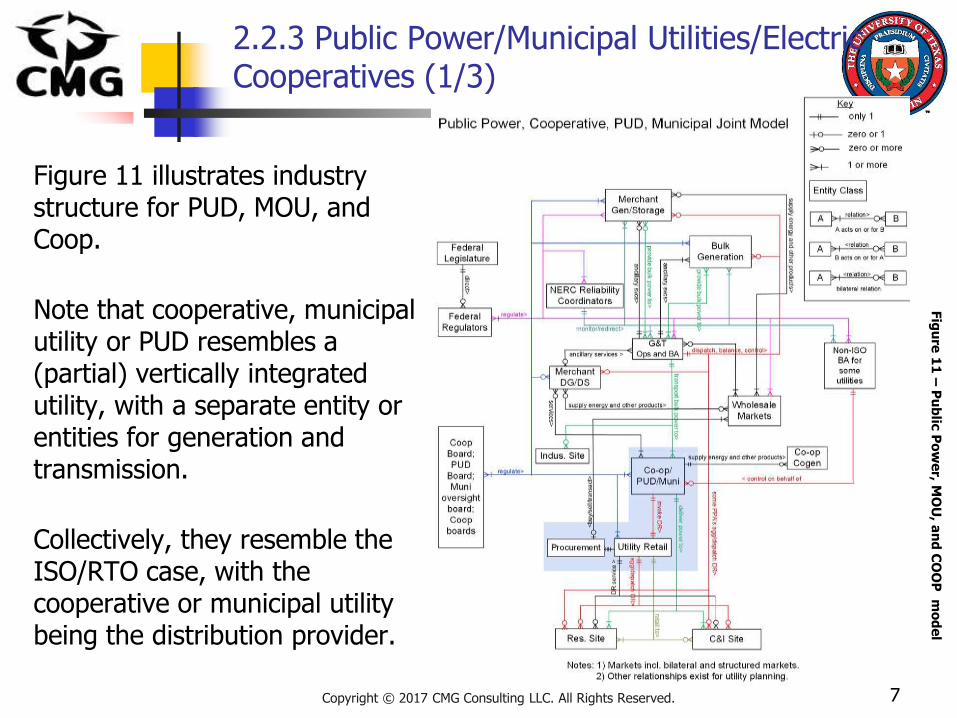
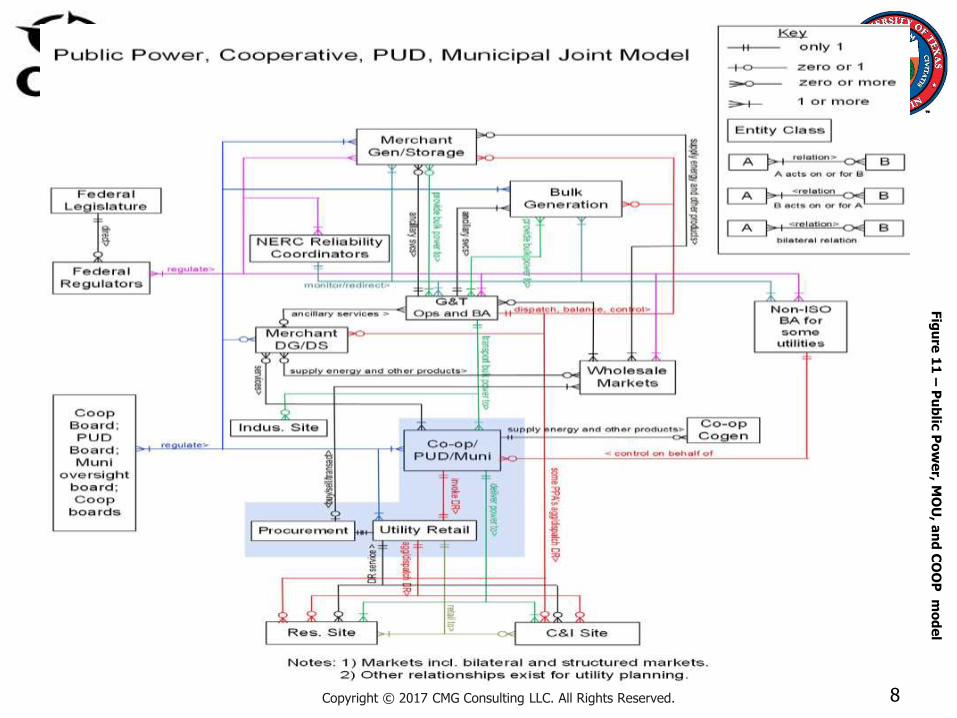
Figure 11 illustrates industry structure for PUD, MOU, and Coop.
Note that cooperative, municipal utility or PUD resembles a (partial) vertically integrated utility, with a separate entity or entities for generation and transmission.
Collectively, they resemble the ISO/RTO case, with the cooperative or municipal utility being the distribution provider.
Fig
ure
11
–P
ub
lic P
ow
er, M
OU
, an
d C
OO
P m
od
el
Public Power/Municipal Utilities/Electric Cooperatives (2/4)
8Copyright © 2017 CMG Consulting LLC. All Rights Reserved.
Fig
ure
11
–P
ub
lic P
ow
er, M
OU
, an
d C
OO
P m
od
el
2.2.3 Public Power/Municipal Utilities/Electric Cooperatives (2/3)
Architectural Insight 4
Noting the red lines in the industry structure diagrams in Figures 10 and 11, the relationships involved are various aspects of system control, and have direct relationships to reliability roles and responsibilities.
Instances exist in the ISO and PUD/Muni/Cooperative cases in particular where bypassing of distribution utilities, instead of working through them in a coordinated fashion, occurs.
9Copyright © 2017 CMG Consulting LLC. All Rights Reserved.

2.2.3 Public Power/Municipal Utilities/Electric Cooperatives (3/3)
Policy Implications 2 The majority of ISO/RTOs and some other industry activities at the
wholesale level are regulated by the Federal Energy Regulatory Commission (FERC), and industry oversight bodies such as the North American Electric Reliability Corporation (NERC). ERCOT is not regulated by FERC.
Investor-owned utility (IOU) and MOU/COOP activities at the distribution level are regulated by state public utility commissions, elected or appointed local boards.
Physical and financial exchanges between these separately regulated entities may involve potentially conflicting interactions and/or priorities on the part of Federal and local or state authorities.
Moreover, local distribution companies retain the responsibility for maintaining reliability and quality of service at the retail level, except for ERCOT. However, increasing number of direct interactions with merchant DERs and consumers, while bypassing distribution utilities, adds complexity to the reliability and resilience-related challenges.
10Copyright © 2017 CMG Consulting LLC. All Rights Reserved.

2.3 Markets, Services, and Business/Value Stream Frameworks (1/2)
11Copyright © 2017 CMG Consulting LLC. All Rights Reserved.
In addition to industry structure, models for the structure of value streams and related flows are needed to understand the impact of changes to the grid, and to trace the accrual of value from investments made in grid infrastructure.
High level versions of these structures are the starting points for such analyses.
In the following slides, the term “markets” does not mean simply the wholesale energy and power markets, but the entire economic ecosystem around the grid.
Also note that in the coming diagrams, the word “intelligence” does not refer to data mining of customer usage data or similar issues; instead it refers to understanding of where value resides in the system and how to access it.
2.3 Markets, Services, and Business/Value Stream Frameworks (2/2)
12Copyright © 2017 CMG Consulting LLC. All Rights Reserved.
Architectural Insight 5
To build value stream models, start with the industry structure diagram, then add the relevant external entities that may participate in the business ecosystem. The resultant flow models can be recursively detailed, and the placement of any investment or new value stream in the architectural model can be analyzed in context to determine such issues as where value accrues, what value stream share may be available, and how a value stream supplier should be coupled to its ecosystem partners.
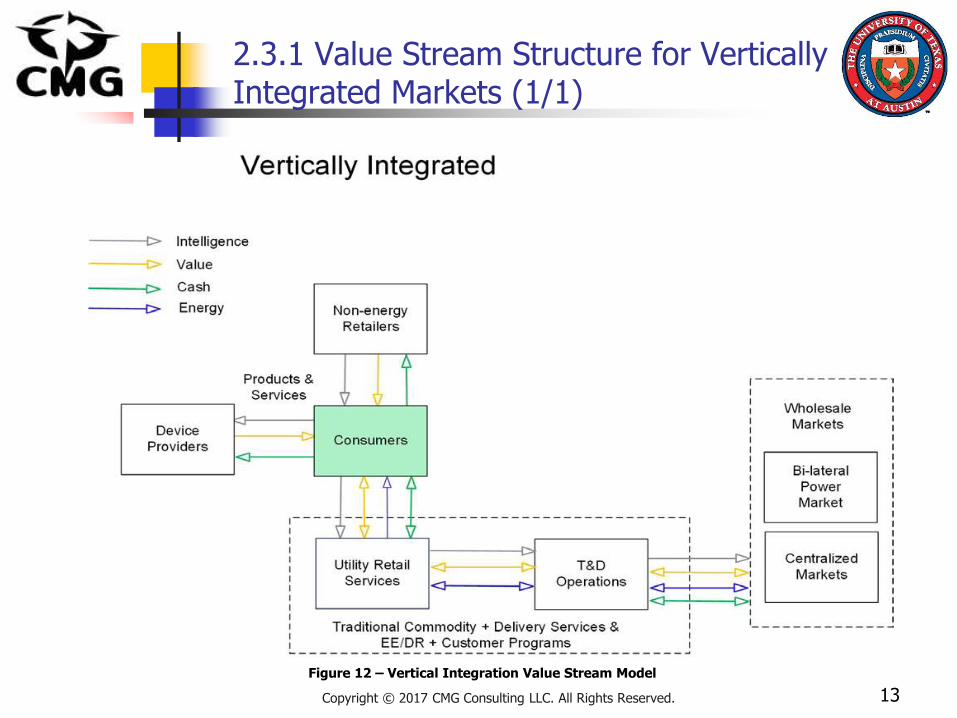
2.3.1 Value Stream Structure for Vertically Integrated Markets (1/1)
13Copyright © 2017 CMG Consulting LLC. All Rights Reserved.
Figure 12 – Vertical Integration Value Stream Model

2.3.2 Value Stream Structure for Hybrid Markets (1/1)
14Copyright © 2017 CMG Consulting LLC. All Rights Reserved.
Figure 13 – Hybrid Markets Value Stream Model

2.3.3 Value Stream Structure forERCOT (1/1)
15Copyright © 2017 CMG Consulting LLC. All Rights Reserved.
Figure 14 – Texas/ERCOT Value Stream Model
ERCOT
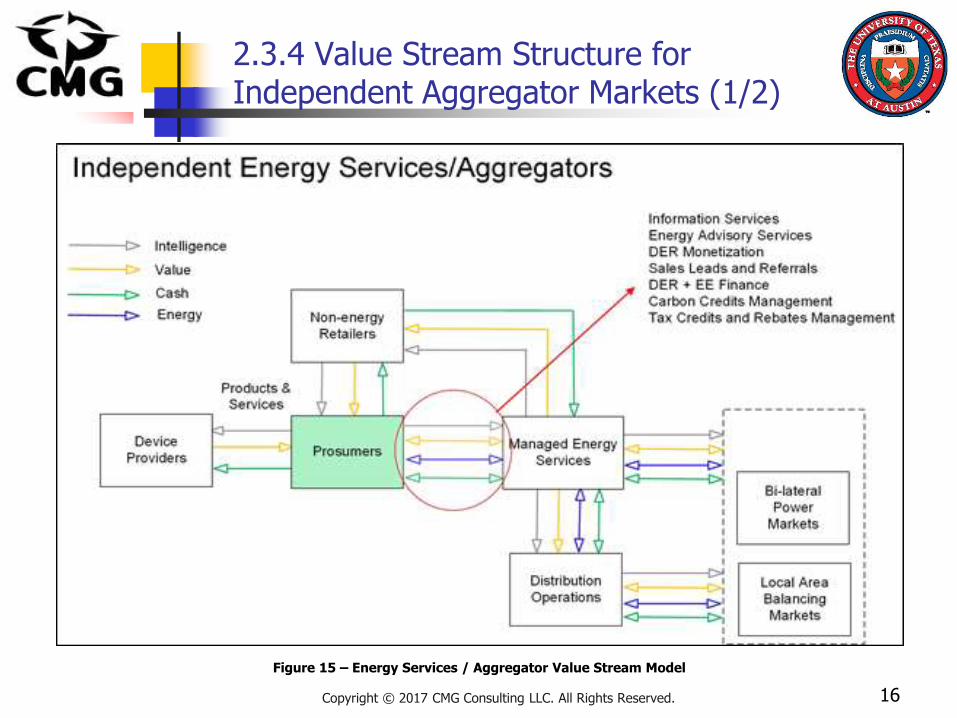
2.3.4 Value Stream Structure forIndependent Aggregator Markets (1/2)
16Copyright © 2017 CMG Consulting LLC. All Rights Reserved.
Figure 15 – Energy Services / Aggregator Value Stream Model

2.3.4 Value Stream Structure forIndependent Aggregator Markets (2/2)
17Copyright © 2017 CMG Consulting LLC. All Rights Reserved.
Architectural Insight 6 It is practical to partition value stream sources (e.g. products and services) into
those with high growth and value production potential, and those with limited potential.
With the exception of the customer/prosumer, any box that touches a commodity stream (blue arrows) should be considered within the limited potential category, because optimization of the energy stream is essentially a zero-sum proposition.
This means that value shifting can occur between entities, but opportunities for new value creation are limited, at best.
In fact, some new device providers (such as solar PV leasing entities) prefer to be classified as offering “net load” rather than as energy producers, in order to stay on the non-regulated side, away from the commodity streams.
The main reason is that state regulatory interconnection rules usually pass interconnection costs for customer side connections to all customers - whereas merchant DER has to pay for the interconnection costs solely.
In addition, the merchant DER providers wish to minimize the amount of regulation they encounter.

2.3.5 Value Attachment (1/4)
Services associated with energy storage attach to different industry entities in the sense that value is determined by those entities, based on the services and their unique requirements.
In fact, this is true of grid services in general, no matter how they are delivered.
18Copyright © 2017 CMG Consulting LLC. All Rights Reserved.
2.3.5 Value Attachment (2/4)
19Copyright © 2017 CMG Consulting LLC. All Rights Reserved.
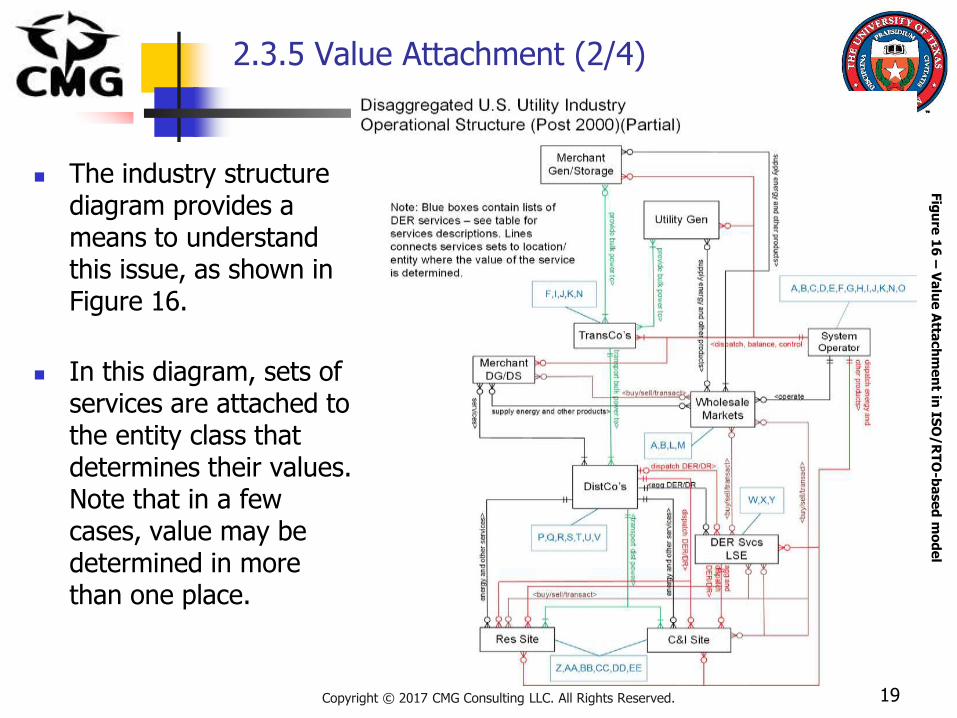
The industry structure diagram provides a means to understand this issue, as shown in Figure 16.
In this diagram, sets of services are attached to the entity class that determines their values. Note that in a few cases, value may be determined in more than one place.
Fig
ure
16
–V
alu
e A
ttach
me
nt in
ISO
/R
TO
-ba
se
d m
od
el

2.3.5 Value Attachment (2/4)
20Copyright © 2017 CMG Consulting LLC. All Rights Reserved.
Fig
ure
16
–V
alu
e A
ttach
me
nt in
ISO
/R
TO
-ba
se
d m
od
el

2.3.5 Value Attachment (3/4)
21Copyright © 2017 CMG Consulting LLC. All Rights Reserved.
Ta
ble
1 –
Po
we
r Syste
ms S
erv
ice
s D
efin
ition
s a
nd
Pro
pe
rties
Table 1 A – U
defines and characterizes the services, based on studies from Sandia National Laboratory and Southern California Edison.
Sandia National Laboratory, "Energy Storage for the Electricity Grid: Benefits and Market Potential Assessment Guide", 2010
Southern California Edison, "Moving Energy Storage from Concept to Reality", 2011

2.3.5 Value Attachment (3/4)
22Copyright © 2017 CMG Consulting LLC. All Rights Reserved.
Ta
ble
1 –
Po
we
r Syste
ms S
erv
ice
s D
efin
ition
s a
nd
Pro
pe
rties
2.3.5 Value Attachment (4/4)
23Copyright © 2017 CMG Consulting LLC. All Rights Reserved.
Ta
ble
1 –
Po
we
r Syste
ms S
erv
ice
s D
efin
ition
s a
nd
Pro
pe
rties
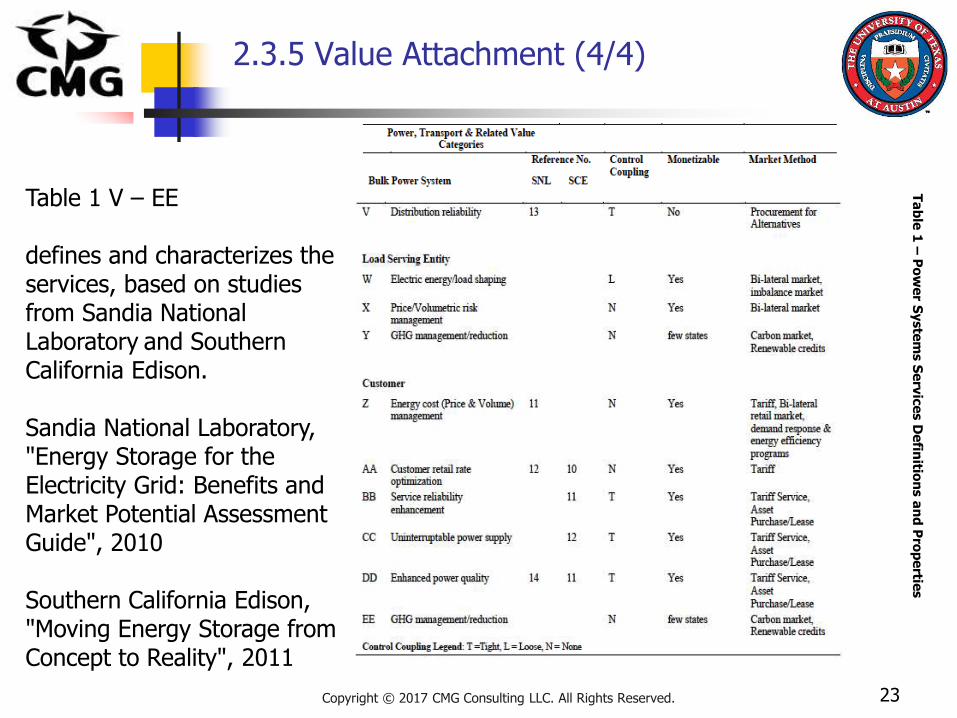
Table 1 V – EE
defines and characterizes the services, based on studies from Sandia National Laboratory and Southern California Edison.
Sandia National Laboratory, "Energy Storage for the Electricity Grid: Benefits and Market Potential Assessment Guide", 2010
Southern California Edison, "Moving Energy Storage from Concept to Reality", 2011

2.3.5 Value Attachment (4/4)
24Copyright © 2017 CMG Consulting LLC. All Rights Reserved.
Ta
ble
1 –
Po
we
r Syste
ms S
erv
ice
s D
efin
ition
s a
nd
Pro
pe
rties

2.4 Electric Structure (1/6)
Electric grid structure is strongly related to industry structure; and like industry structure, it has grown up organically with the electrification of the country over the course of last century.
Traditional electrical structure may be summarized as follows:
one-way energy flow from central station generators, over a transmission network, through substations onto distribution systems, over radial distribution circuits to end-use customers.
25Copyright © 2017 CMG Consulting LLC. All Rights Reserved.
2.4 Electric Structure (2/6)
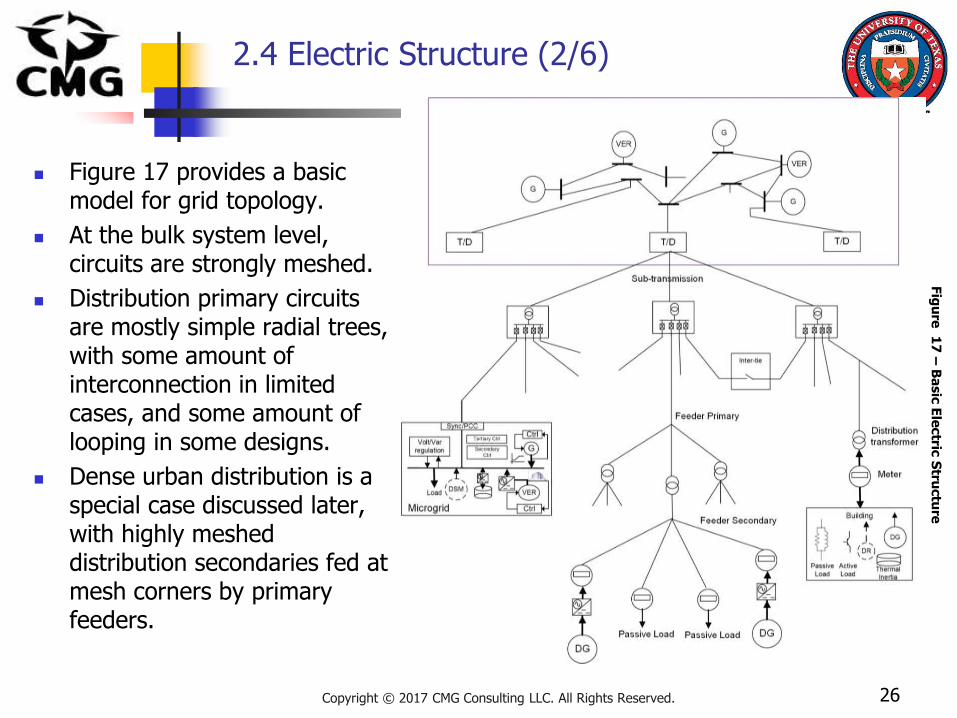
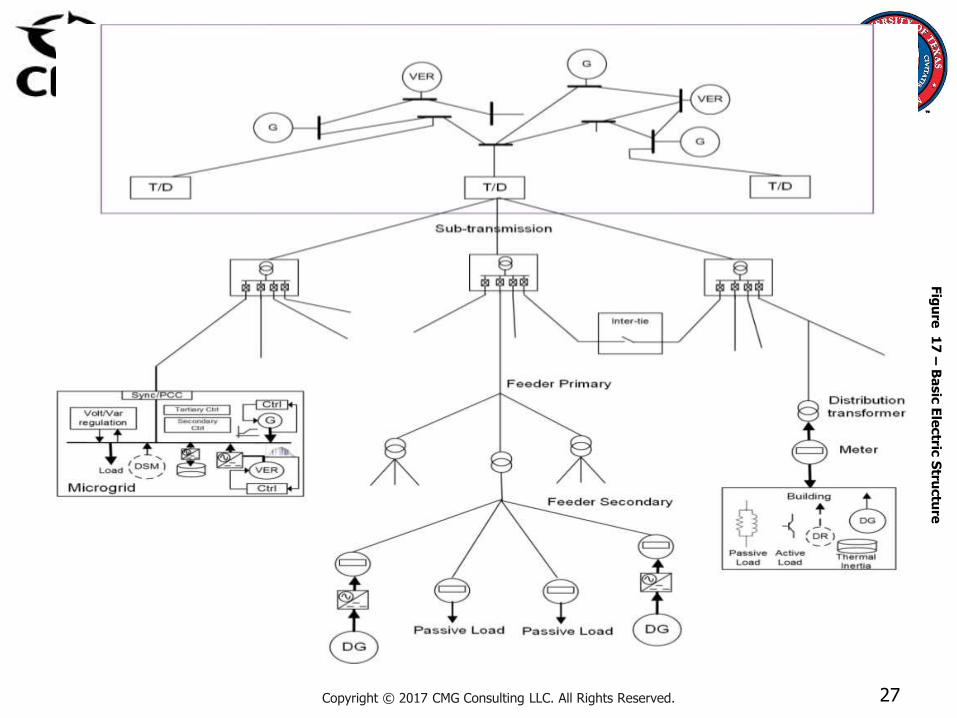
Figure 17 provides a basic model for grid topology.
At the bulk system level, circuits are strongly meshed.
Distribution primary circuits are mostly simple radial trees, with some amount of interconnection in limited cases, and some amount of looping in some designs.
Dense urban distribution is a special case discussed later, with highly meshed distribution secondaries fed at mesh corners by primary feeders.
26Copyright © 2017 CMG Consulting LLC. All Rights Reserved.
Fig
ure
17
–B
asic
Ele
ctric
Stru
ctu
re
2.4 Electric Structure (2/6)
27Copyright © 2017 CMG Consulting LLC. All Rights Reserved.
Fig
ure
17
–B
asic
Ele
ctric
Stru
ctu
re
2.4 Electric Structure (3/6)
Not shown on Figure 17 is the fact that for radial distribution feeders, wire sizes may decrease with distance from the substation.
This means that such feeders have less capacity for handling DER at the far ends of the feeders than they do nearer the substations.
Many of the recent changes to power grids have been conceived and built organically and in a bottom-up manner, as opposed to being designed from a systems standpoint, partly due to the enormous legacy investments in infrastructure. Which has led to a situation where system stability has been a result of large
design and operating margins, as opposed to joint economic/control design.
Such margins have been decreasing and the resulting systems may, in fact, be chaotic.
28Copyright © 2017 CMG Consulting LLC. All Rights Reserved.

2.4 Electric Structure (4/6)
Architectural Insight 7
In the chaos theory view of grid stability, the seeds of wide area blackouts and other manifestations of instability are inherent in basic grid structure.
This viewpoint, which is not universally accepted, arose even before the recognition of stochastic generation and reduction of grid inertia as destabilizing influences.
However, time and again, the structure of the grid determines important system properties and basic limits.
29Copyright © 2017 CMG Consulting LLC. All Rights Reserved.

2.4 Electric Structure (5/6)
Policy Implications 3
Responsibilities for reliability management have historically been established hierarchically, starting with wholesale generation/transmission treated in a semi-integrated fashion, but then separately at a lower level within distribution—where reliability requirements have historically been assigned to single regulated entities.
As previously noted, two-way flows within distribution systems will require greater focus on making more explicit shared responsibilities for reliability management (and supporting investments) between distribution system operators and loads/producers within that distribution system.
30Copyright © 2017 CMG Consulting LLC. All Rights Reserved.

2.4 Electric Structure (6/6)
Key Question 2 - What is Generation Bifurcation?
This term refers to the emerging split of generation between bulk transmission-connected generation and smaller distribution-connected generation, such as rooftop solar PV, CHP, and microgrid generation.
31Copyright © 2017 CMG Consulting LLC. All Rights Reserved.

2.4.1 Transmission/Bulk Power System Structure (1/1)
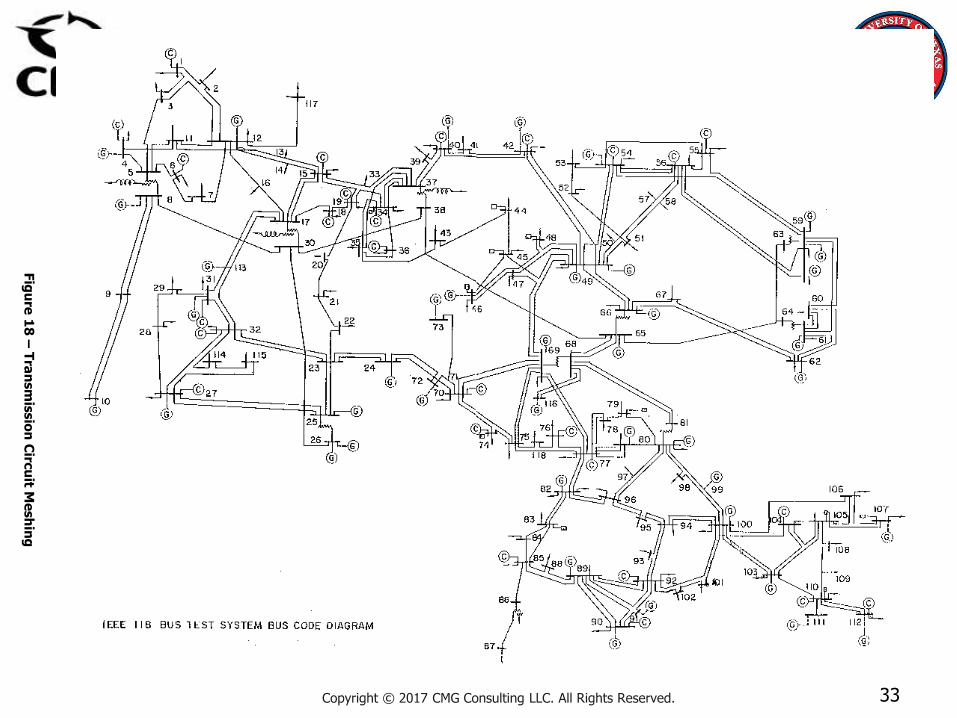
While some radial transmission lines exist, the bulk power system for the most part is strongly meshed. Ex: The IEEE 118 Branch and Bus model. 118 Buses, 186 Branches, 91 load sides, and 54 thermal units.
32Copyright © 2017 CMG Consulting LLC. All Rights Reserved.
Fig
ure
18
–T
ran
sm
issio
n C
ircu
it Me
sh
ing
http://al-roomi.org/power-flow/118-bus-system
2.4.1 Transmission/Bulk Power System Structure (1/1)
33Copyright © 2017 CMG Consulting LLC. All Rights Reserved.
Fig
ure
18
–T
ran
sm
issio
n C
ircu
it Me
sh
ing

2.4.2 Primary Substations (1/3)
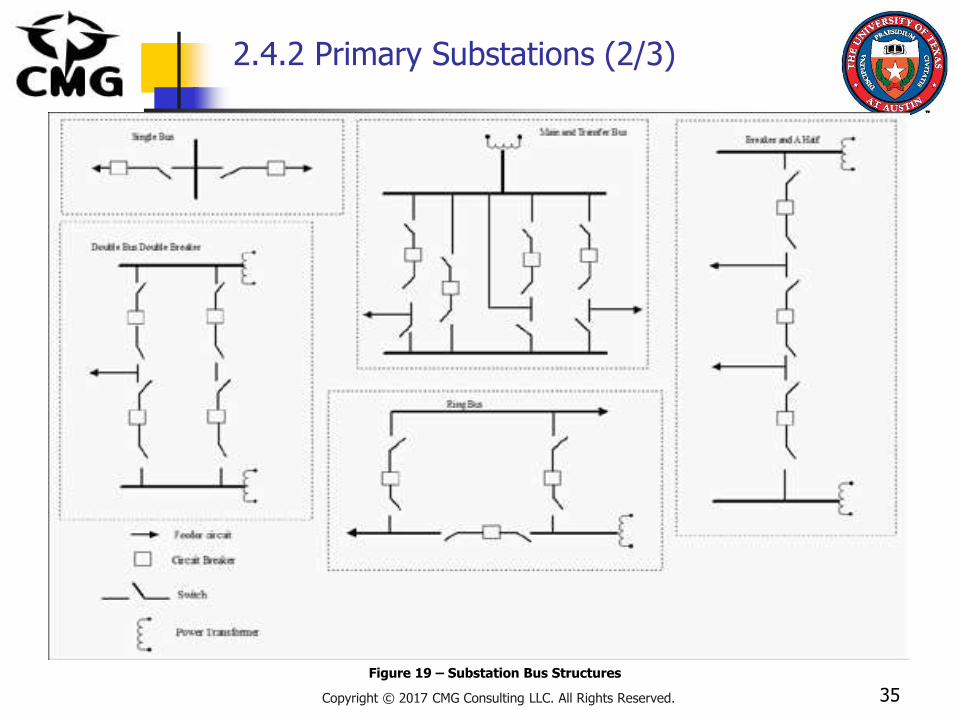
Transmission and distribution substations both have internal structure that may exist in any of several forms. The more common forms are illustrated in Figure 19.
Most of these arrangements allow for use of multiple power transformers, and for isolation of individual transformers and bus sections.
This provides for improved robustness in the face of transformer or bus faults, or attacks on substation equipment.
Many primary substations contain more than one power transformer, sized so that one transformer can handle the full load if necessary.
34Copyright © 2017 CMG Consulting LLC. All Rights Reserved.
2.4.2 Primary Substations (2/3)
35Copyright © 2017 CMG Consulting LLC. All Rights Reserved.
Figure 19 – Substation Bus Structures

2.4.2 Primary Substations (3/3)
Note that, configuration issues aside, feeder circuits are grouped and connected to substation buses.
This is the mechanism for electric coupling in the substation, and is a cause of unwanted interactions between distributed generation connected to distribution feeders and protection elements (breakers) in the substations.
These interactions can lead to sympathetic tripping of one circuit breaker due to a fault on a different feeder.
36Copyright © 2017 CMG Consulting LLC. All Rights Reserved.

2.4.3 Distribution Circuits (1/8)
Most US distribution circuits outside of dense urban areas are radial, with some amount of branching and laterals.
In non-rural areas, it is not uncommon to see some interconnection of feeders via inter-tie switches (manual or remote controlled) for the purposes of re-routing power after sectionalizing a portion of a feeder circuit for fault isolation or for maintenance work as shown in Figure 20.
The structural change from simple radials to sectionalizing and selected inter-ties was necessary to enable some level of “self-healing”distribution circuits.
However, with the exception of circuit sections that can be switched from one feeder to another via inter-ties, real power flow was designed to move in only one direction and was confined to simple tree-structured flow, along lines of decreasing diameter as a function of distance from the substation.
37Copyright © 2017 CMG Consulting LLC. All Rights Reserved.
2.4.3 Distribution Circuits (2/8)
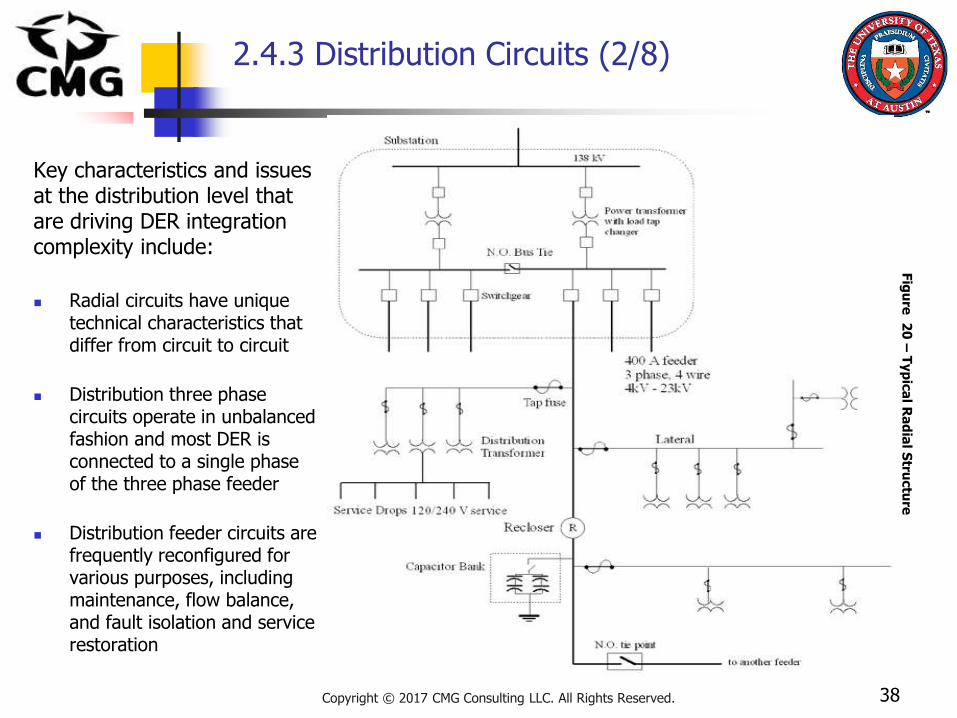
Key characteristics and issues at the distribution level that are driving DER integration complexity include:
Radial circuits have unique technical characteristics that differ from circuit to circuit
Distribution three phase circuits operate in unbalanced fashion and most DER is connected to a single phase of the three phase feeder
Distribution feeder circuits are frequently reconfigured for various purposes, including maintenance, flow balance, and fault isolation and service restoration
38Copyright © 2017 CMG Consulting LLC. All Rights Reserved.
Fig
ure
20
–T
yp
ica
l Ra
dia
l Stru
ctu
re
2.4.3 Distribution Circuits (2/8)
39Copyright © 2017 CMG Consulting LLC. All Rights Reserved.
Fig
ure
20
–T
yp
ica
l Ra
dia
l Stru
ctu
re
2.4.3 Distribution Circuits (3/8)
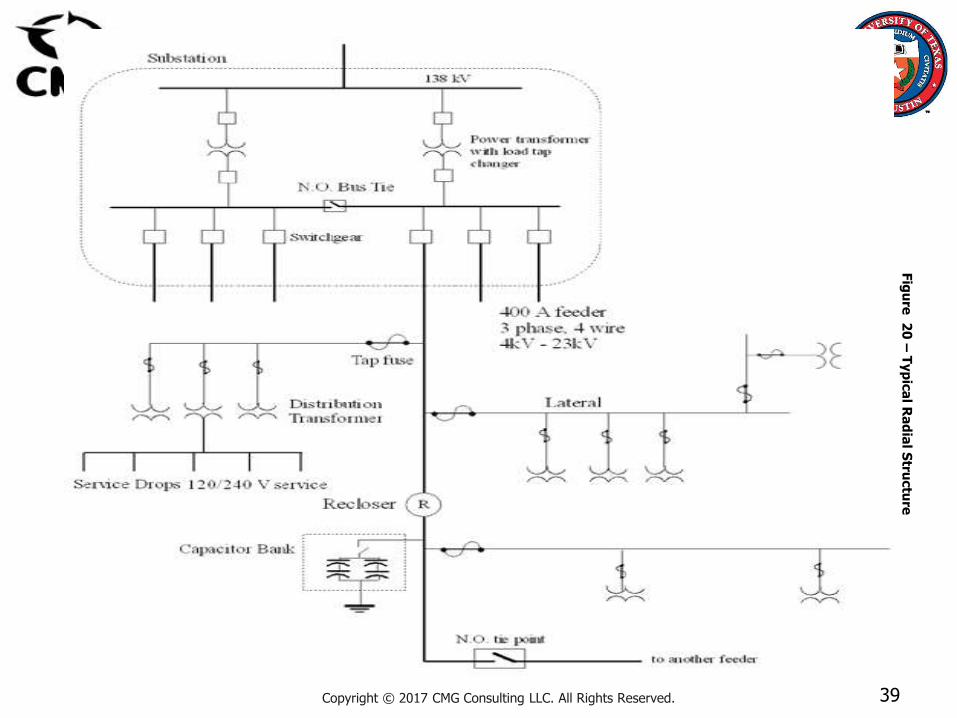
Ordinary distribution circuits have a two-tier structure:
The upper tier is the feeder primary, a three phase circuit operating at medium voltage (4 kV to 36 kV, most commonly 12 kV or 23 kV).
The feeder may have branches. Laterals may also branch off from the feeder primary, and these may be one, two, or three phases, but are most commonly single phase.
The second tier is known as the feeder secondary, and consists of circuits on the secondary sides of distribution transformers (each distribution transformer has a secondary circuit).
40Copyright © 2017 CMG Consulting LLC. All Rights Reserved.

2.4.3 Distribution Circuits (4/8)
In the US, feeder secondaries typically serve five to seven residential loads, although in rural areas it is usually only one load per secondary, and may serve eight to nine loads in some places.
Most distribution transformers have single phase secondaries, although three phase distribution transformers exist.
When three phase service is needed, it is common to group single phase distribution transformers in threes.
While feeder primary circuits are mostly radial, there are looping arrangements as well.
41Copyright © 2017 CMG Consulting LLC. All Rights Reserved.

2.4.3 Distribution Circuits (5/8)
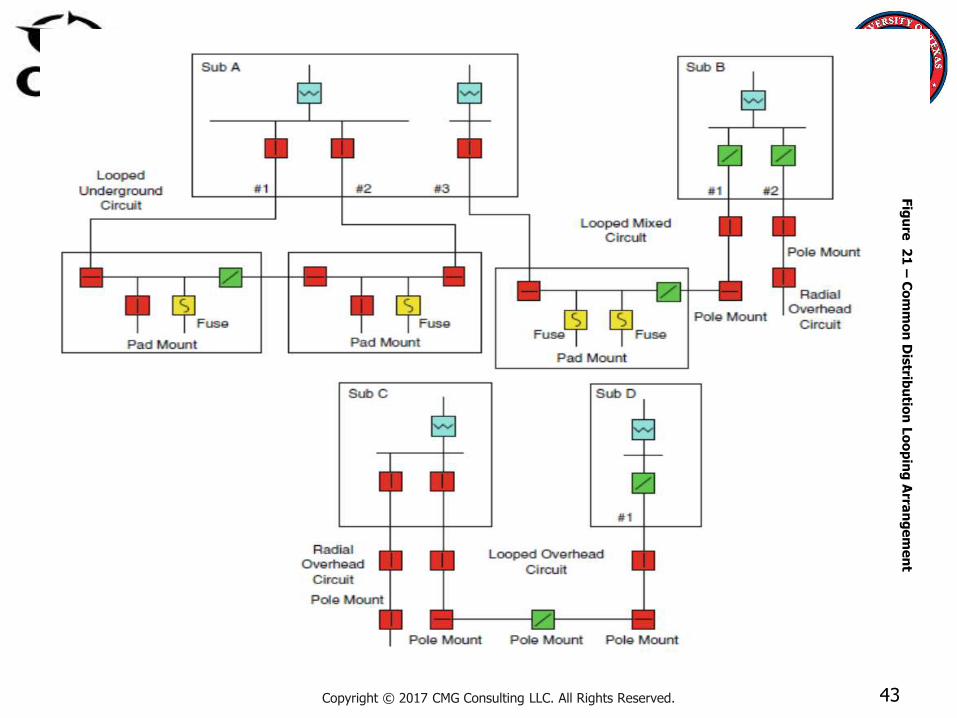
Figure 21 illustrates some commonly used distribution loop arrangements.
The blue boxes represent power transformers in substations, yellow boxes represent fuses, and the green and red boxes represent switchgear.
42Copyright © 2017 CMG Consulting LLC. All Rights Reserved.
Fig
ure
21
–C
om
mo
n D
istrib
utio
n L
oo
pin
g A
rran
ge
me
nt
2.4.3 Distribution Circuits (5/8)
43Copyright © 2017 CMG Consulting LLC. All Rights Reserved.
Fig
ure
21
–C
om
mo
n D
istrib
utio
n L
oo
pin
g A
rran
ge
me
nt
2.4.3 Distribution Circuits (6/8)
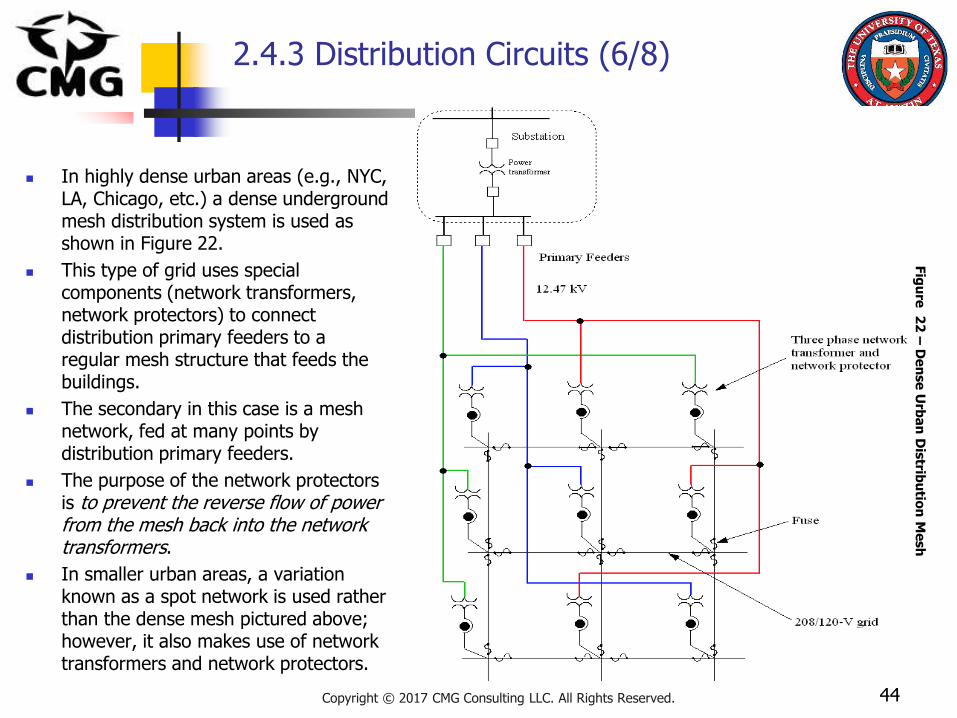
In highly dense urban areas (e.g., NYC, LA, Chicago, etc.) a dense underground mesh distribution system is used as shown in Figure 22.
This type of grid uses special components (network transformers, network protectors) to connect distribution primary feeders to a regular mesh structure that feeds the buildings.
The secondary in this case is a mesh network, fed at many points by distribution primary feeders.
The purpose of the network protectors is to prevent the reverse flow of power from the mesh back into the network transformers.
In smaller urban areas, a variation known as a spot network is used rather than the dense mesh pictured above; however, it also makes use of network transformers and network protectors.
44Copyright © 2017 CMG Consulting LLC. All Rights Reserved.
Fig
ure
22
–D
en
se
Urb
an
Dis
tribu
tion
Me
sh

2.4.3 Distribution Circuits (6/8)
45Copyright © 2017 CMG Consulting LLC. All Rights Reserved.
Fig
ure
22
–D
en
se
Urb
an
Dis
tribu
tion
Me
sh
DEMO
Smart Sectionalizer and DER monitoring DEMOS
By Oracle and V2COM
http://medianetwork.oracle.com/video/player/5013521733001
46Copyright © 2017 CMG Consulting LLC. All Rights Reserved.
2.4.3 Distribution Circuits (7/8)
Architectural Insight 8
The structure of the dense urban mesh limits any services that buildings might supply to grids except for those that reduce net load and thus do not attempt to put power back into the grid.
In these contexts, DG and energy storage cannot push power back into the mesh primary distribution feeders, and thus cannot push power to the grid.
Furthermore, tripping of multiple network protectors can cause a portion of the secondary mesh to island (separate from the rest of the grid).
Since the network protectors are not coordinated, the extent of the island is unpredictable. Where fuses are used in the secondary, some of these may blow, requiring truck rolls to replace before normal operation can be restored.
47Copyright © 2017 CMG Consulting LLC. All Rights Reserved.
2.4.3 Distribution Circuits (8/8)
Policy Implications 4
The enablement of two-way flows within distribution systems in the face of structural limitations such as described above can have costs that go beyond those related to new premises equipment and software.
Some amount of change at the utility level may be needed just to unblock the potential for certain building-to-grid energy/power services.
48Copyright © 2017 CMG Consulting LLC. All Rights Reserved.
2.5 Basic Electric Coupling Model (1/3)
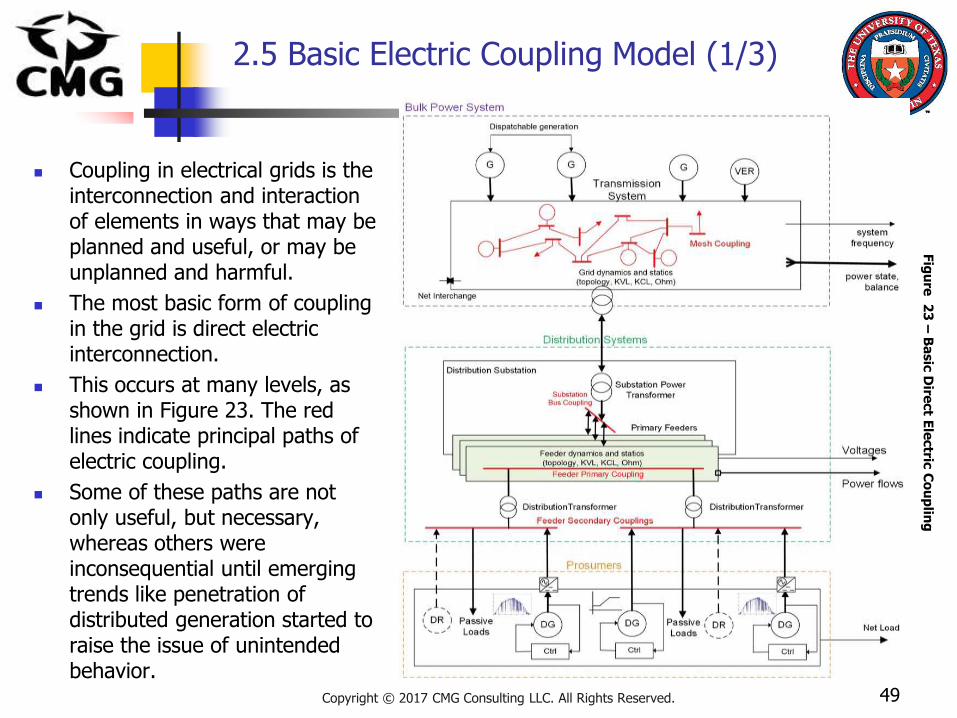
Coupling in electrical grids is the interconnection and interaction of elements in ways that may be planned and useful, or may be unplanned and harmful.
The most basic form of coupling in the grid is direct electric interconnection.
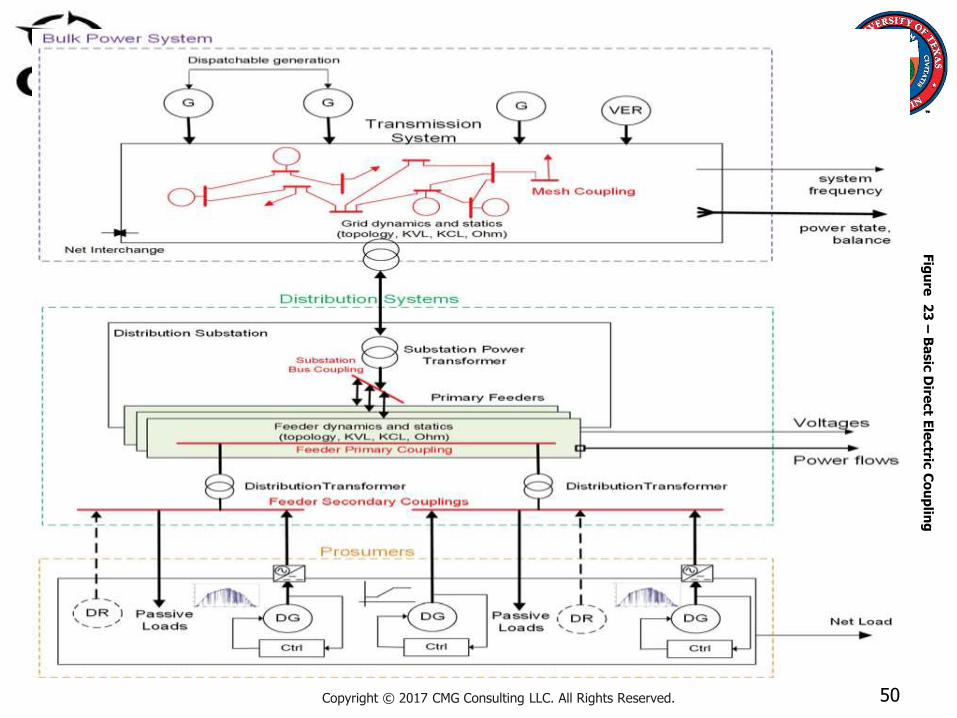
This occurs at many levels, as shown in Figure 23. The red lines indicate principal paths of electric coupling.
Some of these paths are not only useful, but necessary, whereas others were inconsequential until emerging trends like penetration of distributed generation started to raise the issue of unintended behavior.
49Copyright © 2017 CMG Consulting LLC. All Rights Reserved.
Fig
ure
23
–B
asic
Dire
ct E
lectric
Co
up
ling
2.5 Basic Electric Coupling Model (1/3)
50Copyright © 2017 CMG Consulting LLC. All Rights Reserved.
Fig
ure
23
–B
asic
Dire
ct E
lectric
Co
up
ling

2.5 Basic Electric Coupling Model (2/3)
Architectural Insight 9 (1/2)
While basic coupling occurs electrically at multiple levels in the grid, coupling can and does occur in other ways, some of which can be quite subtle.
Coupling can occur through controls, markets, communications networks, fuel systems, loads, and social interactions of customers/prosumers.
Unsuspected coupling is a hazard of increasing grid complexity.
Even basic electric coupling can have subtle consequences.
51Copyright © 2017 CMG Consulting LLC. All Rights Reserved.
2.5 Basic Electric Coupling Model (3/3)
Architectural Insight 9 (2/2)
DG with reverse power flow on a radial feeder can cause false circuit breaker trips on that feeder due to a fault on a different feeder connected to the same substation bus. DG can also interfere with breaker/fuse coordination.
On dense urban meshes, DG can cause unintentional islanding due to tripping of network protectors (islanding is not just for microgrids - DG can cause or support islanding in a variety of ways).
The list of interactions is growing as the penetration of new devices and functionality increases.
52Copyright © 2017 CMG Consulting LLC. All Rights Reserved.

Lecture 1 Summary
53Copyright © 2017 CMG Consulting LLC. All Rights Reserved.
2.2.2 ISO/RTO-based Utilities
2.2.3 Public Power/Municipal Utilities/Electric Cooperatives
2.3 Markets, Services, and Business/Value Stream Frameworks
2.3.1 Value Stream Structure for Vertically Integrated Markets
2.3.2 Value Stream Structure for Hybrid Markets
2.3.3 Value Stream Structure for Texas
2.3.4 Value Stream Structure for Independent Aggregator Markets
2.3.5 Value Attachment
2.4 Electric Structure
2.4.1 Transmission/Bulk Power System Structure
2.4.2 Primary Substations
2.4.3 Distribution Circuits
2.5 Basic Electric Coupling Model

Homework Exercises:Due Feb 2nd, 2017
1
A.Assuming that Austin Energy (AE) produces 6,000 MWh of energy over 120 minutes and that there are EVs with 100 kWh batteries and a rating time of 120 min for this energy in its service territory, how many EVs would it take to store all of AE’s production over the 120 min?
B.Estimate much energy AE delivers to customers in one year, assuming peak demand is 3000MW and that the annual load factor (ratio of average demand over the year to peak demand) is 50%.
C.Assuming $30 per MWh average wholesale cost of energy in the ERCOT market and assuming all retail sales are at $0.08/kWh, what is the margin of retail revenues over wholesale energy costs for the delivered energy calculated in 1b. over one year, ignoring losses?
D.How many EVs with 100 kWh batteries would it take to store 24 hours of AE’s energy production? Assume an average day based on results from 1b.
E.If AE’s service territory has a solar PV rooftop capacity of 2,000 MW, according to a DOE study. How many solar PV systems at 5 kW each could be installed?
F.And how much energy would they create, assuming an 8 hour daily production with average power output of 5kW during those hours, in one year?
G.If the 2,000 MW solar PVs became reality, what would AE need to measure in near real-time to determine the direction of the current in its service territory at any given feeder and transformer?
H.What is the lost revenue to AE of a 45 min system-wide outage, if the AE demand would otherwise be 3000MW?
54Copyright © 2017 CMG Consulting LLC. All Rights Reserved.

Suggested Reading
Price Formation in Organized Wholesale Electric Markets - https://www.ferc.gov/legal/staff-
reports/2014/AD14-14-operator-actions.pdf
https://www.rstreet.org/wp-content/uploads/2016/08/67.pdf
Third Party Grid Architecture Frameworks –
Cisco -http://www.cisco.com/c/dam/en/us/products/collateral/cloud-systems-management/connected-grid-network-management-system/control_architecture.pdf
IBM -http://www.ibm.com/expressadvantage/br/downloads/The_IBM_Solution_Architecture_for_Energy_and_Utilities_Framework.pdf
Microsoft –https://enterprise.microsoft.com/en-us/industries/power-and-utilities/microsofts-smart-energy-reference-architecture/
Gridwise Architecture Council -http://www.gridwiseac.org/pdfs/te_framework_report_pnnl-22946.pdf
55Copyright © 2017 CMG Consulting LLC. All Rights Reserved.
![Técnicas de Visualización para Conocimiento Arquitectónico ...users.ece.utexas.edu/~perry/work/papers/1109-DP-jispd.pdfDescripción de la Arquitectura (LDA, [3]) que permiten, tanto](https://static.fdocument.pub/doc/165x107/5f0224047e708231d402c5d8/tcnicas-de-visualizacin-para-conocimiento-arquitectnico-usersece-perryworkpapers1109-dp-jispdpdf.jpg)