Economic Performance under NAFTA - World Bank
36
Policy Research Working Paper 5661 Economic Performance under NAFTA A Firm-Level Analysis of the Trade-Productivity Linkages Rafael E. De Hoyos Leonardo Iacovone e World Bank Development Research Group Trade and Integration Team May 2011 WPS5661 Public Disclosure Authorized Public Disclosure Authorized Public Disclosure Authorized Public Disclosure Authorized
Transcript of Economic Performance under NAFTA - World Bank

Policy Research Working Paper 5661
Economic Performance under NAFTA
A Firm-Level Analysis of the Trade-Productivity Linkages
Rafael E. De Hoyos Leonardo Iacovone
The World BankDevelopment Research GroupTrade and Integration TeamMay 2011
WPS5661P
ublic
Dis
clos
ure
Aut
horiz
edP
ublic
Dis
clos
ure
Aut
horiz
edP
ublic
Dis
clos
ure
Aut
horiz
edP
ublic
Dis
clos
ure
Aut
horiz
ed

Produced by the Research Support Team
Abstract
The Policy Research Working Paper Series disseminates the findings of work in progress to encourage the exchange of ideas about development issues. An objective of the series is to get the findings out quickly, even if the presentations are less than fully polished. The papers carry the names of the authors and should be cited accordingly. The findings, interpretations, and conclusions expressed in this paper are entirely those of the authors. They do not necessarily represent the views of the International Bank for Reconstruction and Development/World Bank and its affiliated organizations, or those of the Executive Directors of the World Bank or the governments they represent.
Policy Research Working Paper 5661
Did the North American Free Trade Agreement make Mexican firms more productive? If so, through which channels? This paper addresses these questions by deploying an innovative microeconometric approach that disentangles the various channels through which integration with the global markets (via international trade) can affect firm-level productivity. The results show that the North American Free Trade Agreement stimulated the productivity of Mexican plants via: (1) an
This paper is a product of the Trade and Integration Team, Development Research Group. It is part of a larger effort by the World Bank to provide open access to its research and make a contribution to development policy discussions around the world. Policy Research Working Papers are also posted on the Web at http://econ.worldbank.org. The authors may be contacted at [email protected] and [email protected].
increase in import competition and (2) a positive effect on access to imported intermediate inputs. However, the impact of trade reforms was not identical for all integrated firms, with fully integrated firms (i.e. firms simultaneously exporting and importing) benefiting more than other integrated firms. Contrary to previous results, once self-selection problems are solved, the analysis finds a rather weak relationship between exports and productivity growth.

Economic Performance under NAFTA: A Firm-Level
Analysis of the Trade-Productivity Linkages∗
Rafael E. De Hoyos† Leonardo Iacovone‡
∗The authors are grateful to Alejandro Cano, Abigail Duran, Gerardo Leyva and Gabriel Romero
for granting access and showing how to use the industrial data at the offices of INEGI in Aguascalientes.
We also thank Alan Winters, Gustavo Crespi, Sherman Robinson, Beata Javorcik, Valeria Arza, Nick
Von Tunzelmann, Jorge Mattar, and seminar participants at the University of Sussex, SPRU, IADB,
INEGI, ECLAC, and Anahuac University for their valuable comments. Leonardo Iacovone gratefully
acknowledges the ESRC and LENTISCO financial support.†Independent Consultant, email: [email protected]‡Development Research Group, The World Bank, 1818 H Street NW Washington DC 20USA,
email: [email protected]
1
Keywords: Firm-level productivity, Trade Reforms, Mexico

1 Introduction
In the past two or three decades most Latin American countries have redefined their
development strategies, moving away from import-substitution regimes towards poli-
cies promoting integration with the global economy through exports and foreign direct
investments (FDI). This important shift has been accompanied by an intense academic
debate regarding the relationship between integration with the international markets
and domestic growth. Despite the general presumption of a positive impact of trade
liberalization on economic growth, there is still disagreement among economists about
the nature of this relationship (Baldwin 2000). Most of the controversy is explained
by the difficulty in identifying the underlying mechanisms driving this relationship
(Winters 2004). Furthermore, since trade liberalization is often just one element of a
more comprehensive set of market-oriented reforms it is hard to disentangle its effect
from the impact of other policies.
This paper contributes to this debate by developing an innovative microeconometric
approach that can disentangle the various channels through which integration with the
global markets –via international trade– can affect firm-level productivity. Our em-
pirical analysis is based on Mexican firm-level data covering 1993-2002, 1 a period of
economic integration between Mexico, the US, and Canada within the North American
Free Trade Agreement (NAFTA). The present study, defines NAFTA as a process of
economic integration that goes beyond a simple tariff-reduction scheme and, instead,
encompasses a set of institutional rules within which foreign trade and investment take
place. The objective of this paper is to measure the impact of NAFTA on the produc-
tivity of Mexican plants.
The present study is related to various strands of literature. The pioneer set of studies
collected in Roberts and Tybout (1996) analyzed the evolution of firm-level produc-
tivity dynamics in response to trade reforms and economic integralation for various
developing countries. More recently, the interest has moved towards the identifica-
tion of the different channels and mechanisms behind the impact of trade reforms on
productivity (Aghion, Burgess, Redding, and Zilibotti 2004, Girma, Greenaway, and
Kneller 2004, Pavcnik 2002, Tybout 2001, Amiti and Konings 2007, Fernandes 2007).
Our research also draws on the lessons learned from the industrial organisation litera-
1In the paper we refer interchangeably to firm or plant to identify the unit of observation of
our study, however this refers to the unit of observation of our data that is “the manufacturing
establishment where the production takes place”
2

ture examining the impact of increased competition on industry dynamics (Olley and
Pakes 1996). Finally, the present study explicitly builds on the recent theoretical litera-
ture on trade models with heterogeneous firms.2 All of these studies provide important
theoretical underpinnings for understanding the mechanisms through which economic
integration affects productivity dynamics at the firm-level.
The present study builds a conceptual framework to analyze the relationship between
economic integration and firm-level productivity distinguishing four transmission mech-
anisms: (1) enhanced competition, (2) access to intermediate inputs, (3) exports, and
(4) FDI. Following a difference-in-difference estimation procedure, we are able to cap-
ture the productivity growth differentials between integrated and non-integrated firms
during a period before and after NAFTA. Contrary to previous studies, our approach
allows for a heterogeneous productivity impact between firms with different integration
status. In other words, the productivity effects of trade liberalization will be different
between firms whose only link with the international markets is given via the import of
intermediate inputs, firms whose link is though exports of final goods, and firms that
are importing inputs and exporting final produce, i.e. fully integrated firms.
Our results show that NAFTA stimulated the productivity of Mexican plants via:
(1) an increase in import competition and (2) a positive effect on access to imported
intermediate inputs. However, the impact of trade reforms was not identical for all
integrated firms with fully integrated firms benefiting more than other integrated firms.
Contrary to previous results, once self-selection problems are solved, we find a rather
weak relationship between exports and productivity growth.
The paper is organized as follows: Section 2 briefly develops the conceptual framework
describing the different trade-productivity transmission channels. The data used for
the empirical analysis, Mexico’s macroeconomic background, and trends in firm-level
productivity are shown in Section 3. Section 4 describes our econometric approach
and shows the results of various specifications. This Section also discusses potential
endogeneity and selection problems, as well as the difficulties in isolating the impact
of NAFTA from the peso devaluation of 1994. Finally, Section 5concludes.
2Among the most influential studies in this field include the following contributions: Melitz (2003),
Bernard, Eaton, Jenson, and Kortum (2003), Bernard, Redding, and Schott (2007), Yeaple (2005),
Verhoogen (2008), Bustos (2007).
3

2 Trade-Productivity Linkages
Economic theory predicts that trade reforms can affect firm-level productivity through
several channels. This Section describes the theoretical linkages behind these channels,
representing the basis for the empirical analysis. As it is depicted by Figure 1, there
is not a unique and well-defined model capturing the trade and productivity linkages,
but rather a number of different approaches aimed at capturing different mechanisms
through which economic integration can impact firms’ performance. In Figure 1 we
identify four main channels through which trade reforms can influence productivity:
competition, intermediate inputs, exports, FDI. Each one of this channels can affect
both internal restructuring, i.e. productivity changes within the firm, and external
restructuring, i.e. productivity changes due to market shares reallocation between
firms, exit and entry. In the next sub-Sections we discuss in detail each one of these
channels, except the FDI one because, due to data limitations, we are unable to study
this channel in our empirical analysis.
Figure 1: Trade-Productivity Linkages: Conceptual Framework
4

2.1 Competition Channel
Trade liberalization and tariff reductions are expected to increase the competitive pres-
sures to which domestic firms are exposed. This effect is expected to be stronger for
import-competing firms and import-competing sectors than for export-oriented ones.
The first studies to formally explore this argument and relate the increase of the com-
petitive pressures to an improvement of intra-firm efficiency were Martin (1978) and
Martin and Page (1983). These authors argued that an increase in competitive pres-
sures would reduce the “X-inefficiency”, defined as the gap between actual productivity
and the maximum productivity achievable (Leibenstein 1966, Leibenstein 1978). The
intuition behind their argument is that the efficiency of a firm is, ceteris paribus, a
positive function of the managers’ efforts (“internal restructuring” in Figure 1) and
this, in turn, is triggered by the exposure to foreign competitors.
A second productivity effect of increase competition is given by its impact on firm
size and size distribution; in fact, traditional trade models with homogeneous goods
and identical firms assume that scale effects are the principal drivers of productivity
changes following trade liberalization. In a world where firms are heterogenous, the
import-competing channel can explain changes in aggregate economic through “exter-
nal restructuring”, as less efficient firms are forced to contract or exit (Disney, Haskel,
and Heden 2003). This is shown clearly in Melitz and Ottaviano’s (2008) and Bernard,
Redding, and Schott’s (2007) models, where the increased competition leads to the exit
and contraction of less productive firms, while more productive ones expand.
2.2 Intermediate Inputs Channel
Economic theory suggests that liberalization of intermediate inputs will increase pro-
ductivity levels of domestic firms due to an expansion in the menu of available inter-
mediate inputs. This allows individual producers to match more appropriately their
technology or product characteristics with the intermediate input used (Feenstra and
al. 1999).3
Another line of thought, linked to the endogenous growth models, suggests that the
3Formally, economic theory provides us with models where specialised inputs are characterised
by increasing returns (i.e. high initial capital and learning costs) and consequently the degree of
differentiation is limited by the size of the market. In this model, the liberalization of intermediate
inputs will increase the varieties of available inputs, some of them more specialised and closer in terms
of complementarity to the domestic ones.
5

import of “tangible commodities facilitate the exchange of intangible ideas” (Grossman
and Helpman 1991a, Grossman and Helpman 1991b). This model emphasises the
learning effects of imports of intermediate inputs as a mechanism through which trade
will impact productivity growth.
In Bernard, Eaton, Jenson, and Kortum’s (2003) model with heterogenous firms the
impact of trade reforms on productivity is given via a reduction in the price of in-
termediates inputs (i.e. cheaper and higher quality imported inputs replace domestic
ones). All firms benefit from the intermediate inputs price reduction, and this effect
goes in hand with market reallocation from less productive firms to more productive
ones.
2.3 Exports Channel
The literature suggests that the expansion of exports could work as another channel
explaining the positive influence of economic integration on firm-level performance.
Grossman and Helpman (1991a) and Grossman and Helpman (1991b) assume that
domestic entrepreneurs enlarge the stock of domestic knowledge by increasing their
contacts with foreign buyers. Similarly, Fernandes and Isgut (2005), based on Arrow’s
(1962) learning-by-exporting model, show that exporting activities have learning exter-
nalities that decrease over time and increase with the level of exports. Finally, at least
three other hypotheses have been explored to explain productivity improvements as a
consequence of export expansion. First, by having access to foreign markets, a firm
can exploit economies of scale and increase its productivity. Second, relying on foreign
markets can help firms to better absorb the negative shocks deriving from a contraction
in domestic demand. Third, if the foreign markets are characterized by a higher degree
of competition than domestic markets, then exporters will be under higher competitive
pressures in those foreign markets increasing their incentives to innovate and become
more efficient in order to access foreign markets. If the outlined mechanisms are valid,
exporting firms will exhibit higher long-term productivity growth than non-integrated
firms (Wagner 2002). The export channel will be particularly relevant when a country
is granted additional market access as a result of a Regional Trade Agreement (RTA),
such as NAFTA.
As we have seen in this Section, economic theory identifies different channels of trans-
mission between trade reforms and firm-level productivity. If these transmission mech-
anisms are at work, post-reform firm-level productivity performance will be a function
6

of the firm’s integration status. In other words, the productivity path followed by
integrated firms will differ, ceteris paribus, from their non-integrated counterparts.
Furthermore, given the nature of the trade-productivity linkages, we would expect a
heterogeneous post-reform productivity growth pattern even among integrated firms.
For example, firms that are only exporting will bear directly the effects of the ex-
ports channel without experiencing, at least not directly, the positive effects of other
trade-productivity linkages. In order to capture the different channels of transmission,
in the following Sections we will analyze the data categorizing firms into one of four
groups based on their integration status: fully integrated, exporters, importers and
non-integrated firms.
Many of mechanisms behind the channels illustrated in Figure 1 and explained above
will affect all firms regardless of their integration status. For example, the enhanced
market access abroad that stimulates the expansion of export-oriented firms an indirect
impact also on domestic firms through general equilibrium effects. Nevertheless, based
on theoretical considerations, firm’s integration status will determine the magnitude
of its own trade-mandated productivity shock. In other words, a-priori a process of
trade integration would have an asymmetric productivity impact on integrated versus
non-integrated firms, and perhaps this impact could differ between firms in different
integration status.
3 Descriptive Analysis
3.1 Macroeconomic Overview: NAFTA and the Devaluation
The present study covers the period from 1993 to 2002, a time characterized by major
changes in the Mexican economy. In January 1994, NAFTA, a trilateral treaty between
Canada, Mexico and the US, was enacted. In December of that same year, as a
consequence of a balance of payments crisis, the Mexican peso lost more than 60 percent
of its value in terms of US dollars. This was the starting point of a profound economic
crisis where GDP contracted by more than 8 percent and inflation passed from an
annual rate of 7 percent in 1994 to 41 percent in 1995. The huge devaluation together
with the contraction of the domestic market stimulated exports of Mexican produce.
As we can see from Figure 2, between 1994 and 1996, the importance of international
trade in the Mexican economy (measured as the ratio of exports plus imports to GDP)
almost doubled, passing from a pre-crisis/NAFTA level of 38 percent to 63 percent in
1996. The export boom during the period 1994-2002 was led by manufacturing exports,
7

which accounted for 95 percent of total exports.
Figure 2: Mexico - economic integration (Source: Nicita 2004)
Degree of Openess
0
0.1
0.2
0.3
0.4
0.5
0.6
0.7
1985
1986
1987
1988
1989
1990
1991
1992
1993
1994
1995
1996
1997
1998
1999
2000
(I+E
)/G
DP
0
5
10
15
20
25
30
35
Tari
ff %
Openess Tariff (Import w eighted)
GATT NAFTA NEG NAFTA
Degree of Openness
Some important elements emerge from Figure 2. First, the process of trade liberal-
ization in Mexico started in the 1980s. When trade liberalization is measured as a
reduction in tariffs, the most important reforms were undertaken during the second
half of the 1980s (Peters 2000). A second interesting point, is that the response of
the economy to this first wave of liberalization was rather slow, with trade volumes
showing only a modest increase after large tariff reductions. On the other hand, the
relatively small reduction in tariffs observed after NAFTA was followed by a substan-
tial increase in the importance of trade volumes in the Mexican economy. These facts
suggest that the substantial increase in economic integration between the Mexican and
the US economies is explained by a combination of NAFTA and the peso devaluation.
In other words, the peso devaluation pushed Mexican firms into the foreign markets
that were opened via the window of NAFTA; once many of the Mexican manufactur-
ers had absorbed the sunk costs of entering foreign markets, they remained integrated
despite the revaluation of the Mexico peso during the late 1990s. This may explain
the significant increase in the degree of openness that occurred after the devaluation,
which was not reversed even when the real exchange rate revalued. A second comple-
mentary explanation behind the pattern followed by openness is that NAFTA implied
much more than a tariff reduction scheme, involving deep regulatory and institutional
8

changes, representing a successful case of deep integration.4
3.2 Firm Size and Integration Status
In order to see how the post NAFTA/devaluation affected the performance of Mexican
manufacturing firms, we use firm-level data from the Annual Industrial Survey (EIA)
covering the period from 1993 to 2002. EIA surveys more than 5,000 firms covering 85
percent of total industrial production. The survey provides plant-level information on
characteristics such as number of employees, hours worked, wages, value of production
and sales, exports, value of intermediate inputs, inventories, investment, etc. (for more
detail see Iacovone (2008)).
As we mentioned before, using the theoretical considerations discussed in Section 2
we allocate firms into one of the following four mutually exclusive groups according to
their integration status: (1) exporters, (2) importers, (3) fully integrated, and (4) non-
integrated firms. The first group consists of firms that are exporting into the foreign
markets without importing intermediate goods; the second group is made up of firms
whose only link with the global markets is via the import of intermediate inputs. The
third group is formed by all those firms that sell part of their final production in the
foreign markets while importing part of their intermediate inputs. Finally, the last
group consists of firms that do not have any direct link with foreign markets.5
Figures 3 shows information regarding the number of firms and their size by integra-
tion status for a given year (1997). In 1997, 2,372 firms, representing more than 40
percent of the total manufacturing firms in Mexico, had no direct linkage with the
international markets. In that same year, 10 percent of Mexican manufacturing firms
were integrated to international markets via exports, 19 percent via imports, and 28
percent were importing intermediate inputs and exporting their final product (fully
integrated).
4By means of an explicit econometric model linking tariff reduction and household real income,
De Hoyos (2005) finds that measuring NAFTA just as the reduction in tariff brought about by the
agreement would lead to the conclusion that the agreement had almost no impact on real household
incomes in the economy.5Notice that this is not entirely true. For non-integrated firms to be completely isolated from
direct linkages with foreign markets they would have to be part of a sector that does not suffer from
import-competition and at the same time is not receiving FDI. Even using detailed data such as EIA,
it is impossible to define if and to what degree a firm is in an “import-competing” sector. Hence the
import competition channel will have an effect on integrated and non-integrated firms according to
our definition. Nonetheless, a-priori, trade reform will have a smaller impact on non-integrated firms
relatively to integrated firms.
9

Figure 3: Size distribution by integration status
0 500 1,000 1,500 2,000
Fully Integrated
Importing
Exporting
Not Integrated
Source: EIA, 1997
Number of Firms
Micro SmallMedium Large
In 1997, the great majority of the numerous non-integrated firms were micro or small
plants.6 Both exporters and importers have a similar composition in terms of firm
size, with around 40 percent being small and 30 percent being medium firms. Finally,
the fully integrated firms, that simultaneously export and make use of imported in-
termediate inputs, are the largest ones, with virtually no micro firms being part of
this category. In 1997, three and four out of 10 firms had a medium or large size,
respectively.
3.3 Trade Shock, Integration Status, Labor Productivity
As we mentioned above, integration was mainly brought about by a combination of
NAFTA and the peso devaluation. We have also shown that non-integrated and ex-
porting firms tend to be smaller than importing and fully integrated ones. In order to
explore how the patterns of integration may have affected the size of the firms, Figure 4
shows the time trend in the proportion of integrated firms (all three integration status
groups) and their average size (measured as total employees). According to Figure 4,
the proportion of integrated firms increased steadily from 1993 to 1997 (continuous
line). Regarding the size of the firm (measured as the number of employees), apart
from the change occurring between 1993 and 1995, the average size of integrated firms
increased throughout the period. It is interesting to note that 1994 is the only year
6Micro firms are defined as plants with less than 16 employees, small plants have between 16 and
100 employees, medium are those firms with more than 100 but less than 250 employees, while large
have more than 250 employees.
10
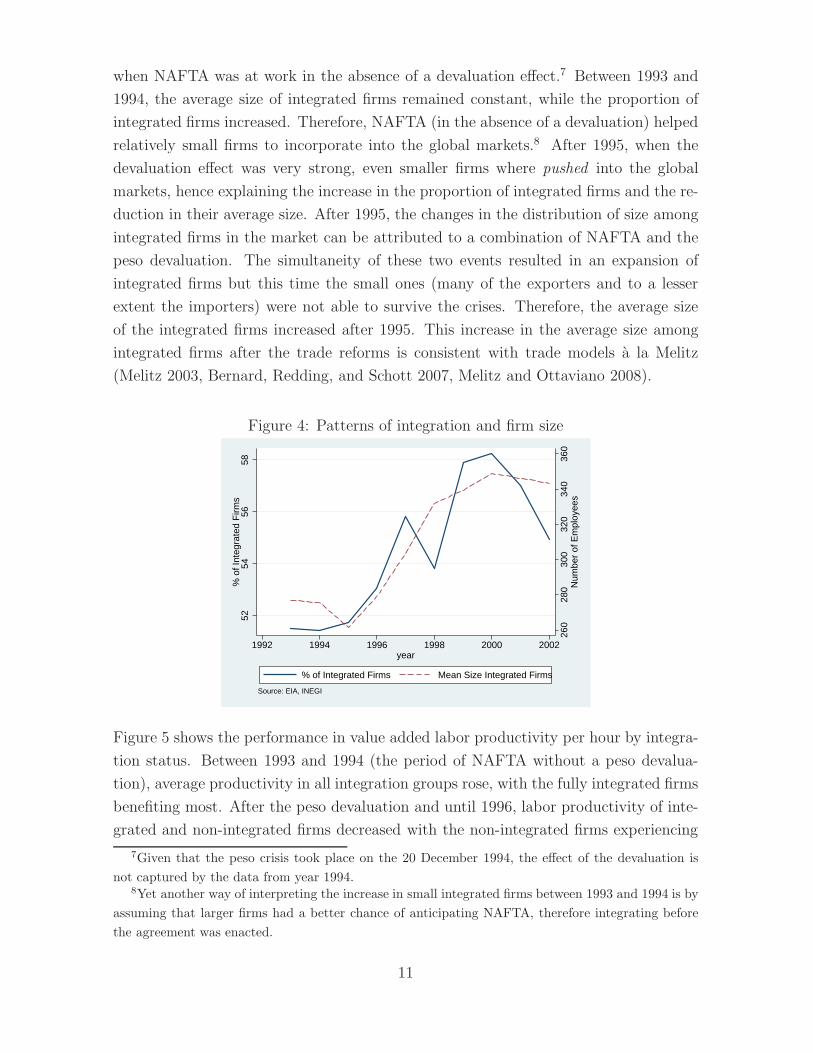
when NAFTA was at work in the absence of a devaluation effect.7 Between 1993 and
1994, the average size of integrated firms remained constant, while the proportion of
integrated firms increased. Therefore, NAFTA (in the absence of a devaluation) helped
relatively small firms to incorporate into the global markets.8 After 1995, when the
devaluation effect was very strong, even smaller firms where pushed into the global
markets, hence explaining the increase in the proportion of integrated firms and the re-
duction in their average size. After 1995, the changes in the distribution of size among
integrated firms in the market can be attributed to a combination of NAFTA and the
peso devaluation. The simultaneity of these two events resulted in an expansion of
integrated firms but this time the small ones (many of the exporters and to a lesser
extent the importers) were not able to survive the crises. Therefore, the average size
of the integrated firms increased after 1995. This increase in the average size among
integrated firms after the trade reforms is consistent with trade models a la Melitz
(Melitz 2003, Bernard, Redding, and Schott 2007, Melitz and Ottaviano 2008).
Figure 4: Patterns of integration and firm size
260
280
300
320
340
360
Num
ber
of E
mpl
oyee
s
5254
5658
% o
f Int
egra
ted
Firm
s
1992 1994 1996 1998 2000 2002year
% of Integrated Firms Mean Size Integrated Firms
Source: EIA, INEGI
Figure 5 shows the performance in value added labor productivity per hour by integra-
tion status. Between 1993 and 1994 (the period of NAFTA without a peso devalua-
tion), average productivity in all integration groups rose, with the fully integrated firms
benefiting most. After the peso devaluation and until 1996, labor productivity of inte-
grated and non-integrated firms decreased with the non-integrated firms experiencing
7Given that the peso crisis took place on the 20 December 1994, the effect of the devaluation is
not captured by the data from year 1994.8Yet another way of interpreting the increase in small integrated firms between 1993 and 1994 is by
assuming that larger firms had a better chance of anticipating NAFTA, therefore integrating before
the agreement was enacted.
11

the largest negative shock. Between 1996 and 2000, all integrated firms experienced
a reduction in labor productivity as opposed to the non-integrated firms, that were
catching up. This strongly suggests that the post NAFTA/devaluation trade expan-
sion had asymmetric effects on firms based on their integration status, in particular in
terms of their productivity performance.
Figure 5: Labor productivity performance by integration status
3.8
44.
24.
44.
64.
8V
alue
Add
ed L
abou
r P
rodu
ctiv
ity
1992 1994 1996 1998 2000 2002year
Non−integrated Fully IntegratedExporters Importers
Data source: EIA
This Section shows that there is a great degree of heterogeneity in size, sector of special-
ization and productivity between firms with a different integration status. Exporting
firms are similar in size to non-integrated firms although their level of labor produc-
tivity is higher with a level closer to the one exhibit by importing firms. Descriptive
statistics also show that importers, as well as fully integrated firms, are concentrated
in two capital intensive sectors: “machinery and equipment” and “chemical products”.
Finally, the labor productivity trends show that NAFTA marked a turning point in
productivity performance between firms with different integration status.
The rest of this paper will try to explore how much of the differential in labor produc-
tivity shown in Figure 5 is attributable to the increase in trade integration observed
between 1993 and 2002. In our empirical strategy we take 1993 as the base year (pe-
riod before NAFTA), compare the productivity growth rate between integrated and
non-integrated firms (controlling for firm-level characteristics and allowing for hetero-
geneous effects across integration status) and attribute these difference to the reforms.
Since many other factors can influence the productivity growth rate differentials, a for-
mal econometric analysis is needed to control for other variables potentially influencing
the patterns observed in Figure 5.
12

4 Empirical Strategy
In this Section we formally evaluate the impact of NAFTA on firm-level productivity.
There are two possible approaches that we can follow to disentangle the relationship
between trade integration and firm-level productivity: (1) link tariff reductions with
firm-level productivity whilst controlling for other possible effects; or (2) compare the
differential of productivity growth rates between integrated and non-integrated firms
before and after the reforms controlling for observables and unobservable fixed effects.
Both approaches have their advantages and limitations hence, in this study, we combine
both of them in order to identify separately all the channels discussed in Section 2.
Identifying the impact of trade reforms exploiting tariff reductions has one important
advantage but also some serious drawbacks. On the positive side, this approach is able
to isolate neatly the impact of an important element of trade reforms, such as tariff
reductions, from all other trade-related exogenous shocks. However, this advantage
can also be a source of weakness. If we believe that trade reforms involve much more
than just a reduction in tariff rates, focusing solely on tariff variations will lead to an
under-estimation of the impact of trade reforms. This appears to be a very important
issue in the case of NAFTA since, as discussed in Section 3, the changes in tariff
rates were relatively modest9 . In fact, as it is argued in Kose, Meredith, and Towe
(2004) and Lederman, Maloney, and Serven (2003), the major changes introduced by
NAFTA took the form of new rules and institutions to promote integration among the
trade partners.10 Exploiting tariff reductions to identify the productivity impact of
trade reforms introduces a further technical problem involving the identification of the
impact of tariffs on intermediate inputs.
Although it is virtually impossible to identify NAFTA’s full productivity impact by fo-
cusing only on tariff variations, the information contained in the post-reform reductions
in import tariffs is enough to identify the effect of the reforms via the import-competing
9During direct interviews conducted with entrepreneurs, academics and policy-makers in Mexico,
the argument that NAFTA’s changes were much larger than those that could be measured by the
change in tariffs came out as a consensus.10An argument supporting the tariff-reduction approach would state that a small tariff change that
is perceived as permanent can have a larger impact than a larger change that is perceived as unstable.
The “bilateral nature” of NAFTA made the tariff change much more credible than the unilateral
tariff liberalization that took place during the second half of the 1980s. Furthermore, NAFTA is
considered by some scholars “as a way of locking in previous policy reforms” (Tomz 1997, Whalley
1993). Therefore, one can argue that the reduction in trade barriers could serve as a proxy for the
legal and institutional change. Nevertheless, the nature of the exact relationship between changes in
tariffs and changes in institutions is not clearly defined.
13

channel. As mentioned in Section 2.1, controlling for everything else, a reduction in
import tariffs should increase domestic competition and hence boost labor productiv-
ity. The present study uses tariff variations to identify the link between NAFTA and
labor productivity via the import-competing channel. Nevertheless, we complement
this approach with a pseudo-experimental procedure that identifies all other trade-
productivity channels discussed in Section 2.
As discussed in Section 2, theoretical models with heterogeneous firms suggest that
trade reforms will impact asymmetrically on different types of firms. We expect inte-
grated firms to be positively affected by the reforms relative to non-integrated firms.
Moreover, the impact within integrated firms could be different depending on a firm’s
integrated status. This idea is not only based on theoretical considerations but also
appears to emerge from the descriptive statistics presented in Section 3 suggesting
that plants within different “integration status” show a different productivity evolution
over time. Hence, a crucial identifying assumption behind the pseudo-experimental ap-
proach adopted in this paper is that the reforms introduced by NAFTA had a different
effect on pre-reform integrated and non-integrated firms.
Our strategy builds on the previous work by Pavcnik (2002) and Lopez-Cordova (2003)
analyzing the impact of trade reforms in Chile and Mexico, respectively. While Lopez-
Cordova (2003) exploits tariff variations Pavcnik (2002) uses a quasi-experimental ap-
proach (i.e. treatment versus control group). The mayor difference between these
two closely related studies and the empirical approach followed in this paper are the
following:
1. Pavcnik (2002) defined a firm as being integrated when it belonged to a “in-
tegrated” sector—at 4 digits of the ISIC classification—regardless of the firm’s
integration status. Thanks to data availability, in this paper we define the inte-
gration status at the firm level.11
2. Within integrated firms, our approach allows for a heterogeneous impact of the
reforms among firms with different integration status, i.e. exporters, importers
or fully integrated.
3. Our econometric approach controls for possible endogeneity problems related to
a firm’s decision to change integration status; and it also attacks the attrition
problem present in the Mexican industrial survey (EIA).
11We evaluated the correlation between the definition used by Pavcnik (2002) and our definition
and found out this is only about .30.
14
4.1 Econometric Approach
The objective of the econometric strategy is to understand the impact of NAFTA on
firm-level productivity. For this purpose we use the value-added per unit of hourly
labor as productivity index.12. The reason of our choice lies in the simplicity in the
interpretation of this index and in its transparency. Moreover, the direct link between
value-added labor productivity and national welfare makes this index attractive from
a policy perspective. However, this index also has some drawbacks, the principal one
being that two firms may differ in their value-added labor productivity based solely on
differences in their capital intensity. In order to address this issue, in our regressions
we control for the stock of capital per worker
Let us define ϕit as the log of the value-added per hourly worker in firm i at time
t. Similarly, let Xijt be a vector containing a set of firm-level characteristics, as well
as industry and location fixed effects. Let τit be the domestic import tariffs under
NAFTA; in other words, τit are the tariffs faced by foreign competitors of firm i in time
t. Productivity is assumed to be a function of a constant, time and integration status,
the interaction between the former and the latter, import tariffs, and the vector with
covariates Xijt:
ϕit = α +2000∑
t=94
δtT imet +4∑
s=2
βsIntegrationsi,t
+2000∑
t=94
4∑
s=2
δt,s · Integrationsit × T imet + θ ·Xijt + ψτit + εit (1)
Where T imet t = (1994, . . . , 2000), are year dummies capturing economy-wide macroe-
conomic shocks; Integrationsit s = (2, 3, 4), are a set of binary or dummy variables
taking zero/one values depending on the integration status of the firm. The reference
category is the group of non-integrated firms in the pre-NAFTA year 1993. Therefore,
the year dummies will capture overall trends affecting productivity with respect to the
base year, 1993. On the other hand, the integration status dummies will pick up the
differences between firms that are integrated versus non-integrated firms (the excluded
category). The interaction term between these two sets of dummy variables is what
is known in the literature as the difference-in-difference (DID) estimator capturing the
12For robustness check we tested all our regressions using a multilateral TFP index following Aw,
Chen, and Roberts (2001) and Caves, Christensen, and Diewert (1982). The results are qualitatively
similar in terms of their size and signs. These results are omitted for reasons of space but are available
upon request.
15

treatment effect, in our case the impact of NAFTA. Finally, all the continuous variables
are expressed in logs.
The flexibility of specification (1) allows the impact of NAFTA to be different across
integration status and these effects are allowed to vary over time. The coefficients
of interest are the treatment effects δt,s and, if correctly estimated, they capture the
differences in productivity growth between treated (integrated firms) and controls (non-
integrated) firms. The treatment effect is capturing what is known in the literature as
ATT or “average treatment on the treated”, that is, the impact of NAFTA on those
firms that are already integrated and hence are being directly affected by the agreement.
Notice that, as we mentioned before, NAFTA is likely to have some general equilibrium
effects on all Mexican firms, including those that are not integrated. Nevertheless,
these are not identified by our DID coefficient. Similarly, our estimates cannot be used
to quantify the impact of NAFTA on non-integrated firms had they been integrated
unless we are willing to accept the assumption that the “average treatment on the
non-treated” is equal to the ATT.
If trade reforms had a positive effect on the productivity of integrated firms the
difference-in-difference coefficients should be positive. Therefore, exploiting the het-
erogeneous impact introduced by NAFTA (both across firms with different integration
status and over time), our coefficients, δt,s, capture the impact of the reforms on pro-
ductivity separating the various trade-productivity channels without restricting the
effect to take place only via tariff reduction. Analytically, the treatment effects are
defined by the following equation:
δIntDID = ∆ϕInt − ∆ϕNInt =
(
ϕafterInt − ϕ
beforeInt
)
−(
ϕafterNInt − ϕ
beforeNInt
)
=(
ϕafterInt − ϕ
afterNInt
)
−(
ϕbeforeInt − ϕ
beforeNInt
)(2)
The DID approach makes two important assumptions that need to hold in order to
properly identify the treatment effect (Wooldridge 2002, Blundell and Costa Dias 2000).
The first assumption is that the treatment is not correlated with time-varying unob-
servables. The second assumption is that the macroeconomic shocks affect all firms in
a similar fashion. The time dummies capture economy-wide macroeconomic changes,
such as the sharp devaluation of the Mexican peso in December 1994. Intuitively, it is
plausible that exchange rate movements will have different impacts on firms with differ-
ent integration status. Hence, this could potentially introduce a bias into our treatment
estimates.13 Assessing the plausibility of the underlying assumptions is complex and
13Formally, as explained by Blundell and Costa Dias (2000), if the macro trends captured by the
16

we will discuss this further when presenting our results.
Bearing all the assumptions and limitations in mind, the DID is a powerful tool able
to identify the impact of a particular policy on a specific outcome variable. The DID
framework captures the impact of policy interventions controlling for status-specific
characteristics that are time-invariant (see equation 2). Therefore, all the time-invariant
initial firm characteristics that may have influenced the selection of the firm into a
specific integration status will not influence our results.
As is clear from equation 1, the DID framework is complemented with a tariff reduction
approach capturing the impact of import competition via coefficient ψ. If lowering
import tariff rates increases domestic competition and this, in turn, has a positive
effect on productivity, then coefficient ψ should be negative.
4.2 Results
4.2.1 Naive OLS
The first set of models use all the firms in our sample to run OLS for two different
specifications of equation (1). All the results presented here correct for potential auto-
correlation across firms using clustered-robust standard errors at the firm-level. Given
the large number of model specifications and coefficients estimated, the detailed results
are presented in Table 1 of Appendix A. We start off with a parsimonious version of
equation 1, which includes only the treatment effects with no controls (model (1) in
Table 1 ). In the second column we add the Mexican tariffs under NAFTA to cap-
ture the competition channel. In the following two specifications we respectively add
industry and location fixed effects – model (3) – and also plant-level controls in model
(4).
A first remark when comparing these four specifications is that, as we would expect,
the inclusion of fixed effects and extra controls tends to decrease the size of the DID
estimates.
year dummy impacts asymmetrically “treated” and “non-treated” firms our estimated difference-in-
difference coefficients, δInt
DID, recovers not only the effect of the treatment on integrated firms but also
the differential effect of the macro-trend across the two groups. If we define this differential effect of
the macro trend as(
kint
− kNint
)
our estimates may be biased in the following way:
δInt
DID= δ
Int
Treatment+
(
kint
− kNint
)
(T imeafter − T imebefore)︸ ︷︷ ︸
Bias
17

Let us first concentrate on the the results for the dummy variables identifying the
productivity effects of the three integration status (βs in equation 1). According to our
parsimonious specification, in 1993, integrated firms (regardless of their integration
status) had an average productivity higher than non-integrated firms. This result
contrasts with the parameter estimated from the full specification with all the controls
(model 4). In fact, once all the control variables are included, it is apparent that
the initial integration premium is actually explained by differences in the values of
the plant-level characteristics between integrated and non-integrated firms and not by
integration per se. Plant characteristics such as size, capital per worker, investment in
research and development, and foreign participation are all positively correlated with
productivity, however, we need to emphasise that these variables may be endogenous
and are not the main focus of our study. Indeed, we are including them here to avoid
an omitted variable bias on our main coefficient of interests that are the δs of the
treatments.
Although a firm’s integration status cannot account for initial productivity differen-
tials, it might still explain differences in productivity growth across firms, which is our
variable of interest. In order to concentrate our discussion on the coefficients captur-
ing the heterogeneity in productivity performance across integration status, i.e. the
treatment effects, in Figure 6 we plot the evolution of δt,s over time.14 Although we
do not report confidence intervals for the plotted coefficients (the significance of the
parameters is reported in Table 1), Figure 6 captures the trends followed by the treat-
ment effects. As is apparent from Figure 6, the treatment effects for importer and fully
integrated firms are positive and significantly different from zero in all post-NAFTA
years, except 2000-2001 for the importers. On the other hand, the effect of NAFTA on
productivity growth of exporters was not significantly different from the agreement’s
effect on non-integrated firms’ productivity performance, the control group, in most
of the years. Another finding that is important to underscore is that the coefficient
for “fully integrated firms” are always larger than the others, this seems to point the
importance of the complementarity between exports and imports activities as channels
to promote productivity growth.
In order to put the treatment effects into context, our results show that during the
post-NAFTA period, annual labor productivity of fully integrated plants grew between
10 and 25 percent faster than labor productivity of non-integrated ones. The treatment
effect was somehow smaller for importers, with an annual growth differential between 12
percent and 20 percent with respect to non-integrated firms. The results from the full
14The coefficients are taken from the full model, i.e. those reported in the fourth column of Table
1 of Appendix ??.
18

Figure 6: Impact of NAFTA on productivity by integration status for all firms
−.1
0.1
.2.3
Tre
atm
ent E
ffect
1994 1996 1998 2000 2002year
Exporter and Importer Just ExportingJust Importing
Source: INEGI, BANXICO and Authors’ Calculations
specification highlight important elements of heterogeneity related to the integration
status of the firm. Hence splitting integrated firms in different groups taking into
account their integration status (i.e. exporter, importer, or fully integrated) allows us
to capture heterogenous treatment effects that would otherwise be ignored if we were
lumping together all integrated firms regardless of their integration status as some
previous studies did (Pavcnik 2002, Lopez-Cordova 2003).
Regarding the import-competing channel, as expected a priori, the coefficient on the
log of import tariffs (ψ in equation 1) is negative. Everything else constant, a firm
facing a tariff reduction equal to, say, 10 percent tends to increase its productivity by
1 percent. Under NAFTA, Mexican tariffs were reduced from an average of 16 percent
to 5 percent, or 11 percentage points, representing a reduction of almost 69 percent on
average tariff. According to our results, this policy decision, fostered competition and
increased firm-level productivity by 6.8 percent (69*0.099).
Another concern that we try to control for is the issue of exit from the sample. Every
year about 5-10 percent of plants exit the sample because of attrition and not taking
this into account may generate a bias. In order to control for this we follow Amiti
and Konings (2007) and re-estimate our equation by adding a dummy that is equal
to one when the plant is going to exit in t + 1 and zero otherwise. The results are
shown in column (5) of Table 1 and confirm that future exiting firms tend indeed to
have a significatively lower productivity than other plants, however our results are
substantially unchanged.
As it was mentioned before, an important methodological difference between the present
19

study and that of (Pavcnik 2002) is that the treatments here are identified at the firm-
level as oppose to (Pavcnik 2002) who identifies it at the sector-level. What kind of
biased was imposed in (Pavcnik 2002) while aggregating different firms in the same sec-
tor? Estimating an specification including Mexican import tariffs as controls, similar to
(2) in Table 1, but identifying treated firms at the 4-digit sector level, shows that sector-
level identification leads to smaller treatment effects. Hence the productivity effects of
Chilean integration is higher than the results presented in (Pavcnik 2002).
4.2.2 Controlling for Potential Endogeneity of Treatment and Evaluating
the Role of Switchers
As mentioned before, if the assumption of exogeneity of the treatment (being integrated
within a trade liberalization period) is violated and our treatments are correlated with
some unobservable characteristics, the OLS estimated coefficients will be biased. So far
we have tried to alleviate this endogeneity problem by including firm-level variables as
controls. If the decision to become integrated (treatment) is correlated with any of the
observable characteristics used as controls, our results are still consistent. However, the
problem of endogenous treatment is especially acute in our case because we have to deal
with what is an established finding in the literature: most efficient (and productive)
firms self-select into export markets (Bernard and Bradford Jensen 1999, Melitz 2003).
It is therefore reasonable to expect a causal relationship from productivity levels to
integration status. If this is true, the coefficients presented in the previous Sections
may be biased.
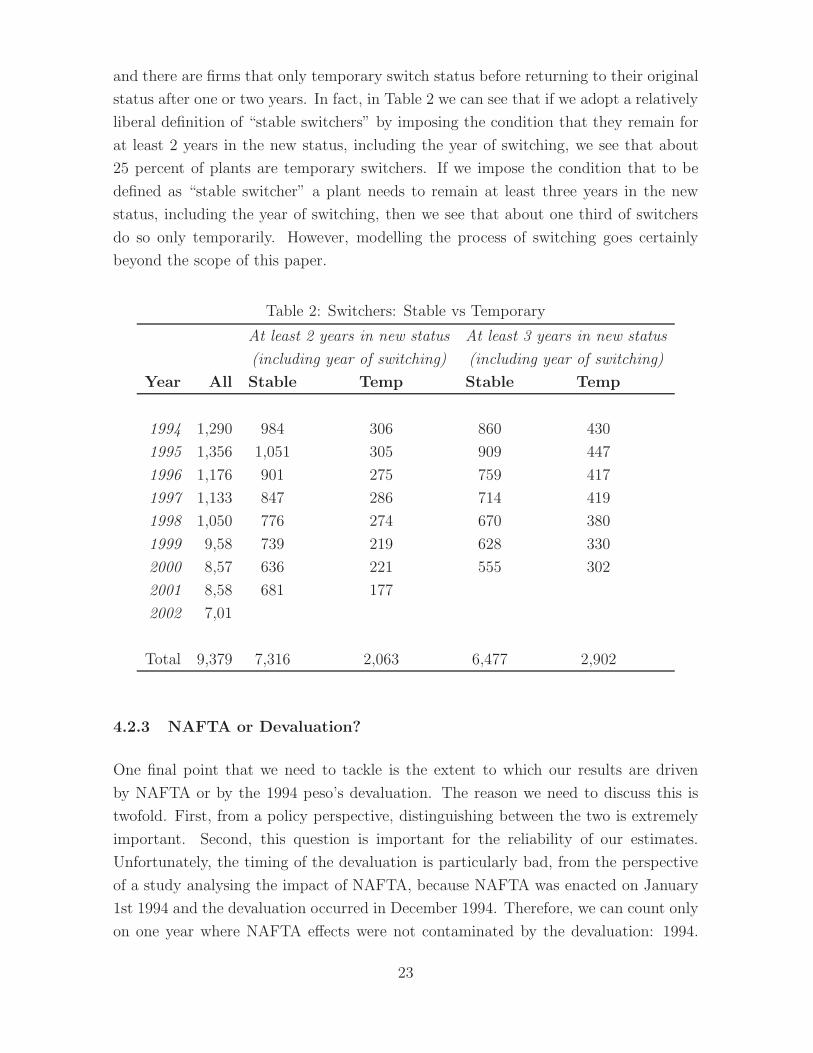
Table 1 presents the number of firms that change status in each of the years of the
sample distinguishing between those that begin importing or exporting and those that
stop importing or exporting. We can see that there is a substantial number of plants,
about 20 percent, that switch integration status every year.
In order to tackle this potential endogeneity problem, we re-estimate our model using a
reduced sample that includes only firms that remain within the same integration status
throughout the period of analysis and exclude “switchers” or firms that at some point
change integration status. By excluding the switchers, we artificially avoid the problem
of self-select into the treatment.
When we re-estimate our main equation by excluding the switchers we also include
a dummy identifying those plants that in t + 1 will switch to a different integration
status. The results are reported in Column (1) of Table 2 and are qualitatively similar
to the results of our basic model discussed previously in Section 4.2.1. The fact that our
20

Table 1: Number of “switchers”
Year Begin Import Begin Export Stop Import Stop Export
1994 341 355 336 343
1995 291 566 432 186
1996 321 399 340 224
1997 359 346 278 249
1998 208 196 404 329
1999 295 296 216 251
2000 220 237 191 277
2001 172 182 277 322
2002 114 128 250 286
Total 2,321 2,705 2,724 2,467
results are robust when excluding switchers is encouraging and seems to point towards
the idea that our findings are indeed not driven by endogenous treatments. However,
by excluding non-random observations we may be potentially biasing our coefficients.
For this reason, we address this selection problem using a Heckman selection model for
switchers. We impose the condition that ϕit is missing for the switcher and estimate
the following model.
ϕit = α′ + β ′ · X′
ijt + ψ′τit + λ′(γ′Z ′
ijt) + ε′it (3)
P (Y ′
it) = κ′ + γ′ · Z′
it + ψ′τit + µ′
it (4)
Where Y ′
it = 1 if firm i is not a switcher
or Y ′
it = 0 if firm i is a switcher
Following Heckman (1979) we proceed in two steps. First, we estimate equation 4 with
a probit. Second, we estimate our main equation 3 using the γ obtained from the first
step to construct the inverse Mills ratio. Equation 4 is the selection equation where
Z′
it is a superset of X′
ijt includes all the explanatory variables in the primary equation
plus the exclusionary restriction. Melitz’s (2003) model suggests that a plant will be
domestic if its productivity is under a certain threshold and will start exporting if its
productivity is above that threshold. In general, a plant will be in a specific integration
status to the extent that its productivity falls within a certain range. We will re-
interpret this model by arguing that we expect a plant is more likely to be a switcher if
21

its productivity is “too different” from the productivity of those plant that are similar
in terms of integration status and sector. Therefore, we calculate the absolute value
of the difference between the productivity of a given plant and the median within the
same status and sector. Hence, the exclusionary restriction (instrument) in system (3)
and (4) is a dissimilarity index which measures the absolute productivity distance from
“similar plants”.
The results are reported in column (2) of Table 2 and confirm that there is evidence
of a selection bias as λ, the coefficient of the Mills Ratio, is statistically significant.
Analyzing the coefficients from column (2), and comparing them with the “naive re-
sults” or column (4) from the previous Table, we can conclude that when we exclude
the switchers and account for the selection bias our coefficients get larger, in particular
the coefficients for “exporters” become significant. Basically, except for the coefficients
of exporters, these results confirm our previous findings. Another interesting point to
observe is the result of the first-stage selection equation, consistently with our expec-
tation we find that an increase in productivity dissimilarity reduces the probability of
selecting into the sample, that is those plants which productivity was in 1993 “distant”
from the median plant with their same integration and within the same sector were
consequently more likely to switch to a different integration status. Interestingly this
relationship between “productivity dissimilarity” and probability of switching is non
linear.
Finally, if we were to think that the “switching” status is some attribute that is not time
varying but instead a fixed characteristic we can re-estimate our model by introducing
a dummy that identifies switchers irrespectively of when these plants actually switch.
We do so in column (3) of Table 2. Even further, we generalize this model by re-
estimating using a fixed-effect estimator which would control for unobservable time
invariant characteristics, and present the results in column (4) of the same Table.
These results are substantially similar to the “naive results” or column (4) from Table
1 and suggest that our main results do not appear to be driven by the self-selection
into the integration status.
Concluding this Section we want to underscore a final regarding how are attempt at
controlling for endogenous self-selection into the treatment. Modeling adequately this
switching process is extremely complex because of two main reasons. First, because it
is very difficult to adequately capture, with a single reduced-form model, all the twelve
different possible processes of switching. Second, even within a single switching process
(e.g. switching from domestic to importer), there are different types of switchers. There
are firms that change status and remain stably in the new status (“stable switchers”)
22
and there are firms that only temporary switch status before returning to their original
status after one or two years. In fact, in Table 2 we can see that if we adopt a relatively
liberal definition of “stable switchers” by imposing the condition that they remain for
at least 2 years in the new status, including the year of switching, we see that about
25 percent of plants are temporary switchers. If we impose the condition that to be
defined as “stable switcher” a plant needs to remain at least three years in the new
status, including the year of switching, then we see that about one third of switchers
do so only temporarily. However, modelling the process of switching goes certainly
beyond the scope of this paper.
Table 2: Switchers: Stable vs Temporary
At least 2 years in new status At least 3 years in new status
(including year of switching) (including year of switching)
Year All Stable Temp Stable Temp
1994 1,290 984 306 860 430
1995 1,356 1,051 305 909 447
1996 1,176 901 275 759 417
1997 1,133 847 286 714 419
1998 1,050 776 274 670 380
1999 9,58 739 219 628 330
2000 8,57 636 221 555 302
2001 8,58 681 177
2002 7,01
Total 9,379 7,316 2,063 6,477 2,902
4.2.3 NAFTA or Devaluation?
One final point that we need to tackle is the extent to which our results are driven
by NAFTA or by the 1994 peso’s devaluation. The reason we need to discuss this is
twofold. First, from a policy perspective, distinguishing between the two is extremely
important. Second, this question is important for the reliability of our estimates.
Unfortunately, the timing of the devaluation is particularly bad, from the perspective
of a study analysing the impact of NAFTA, because NAFTA was enacted on January
1st 1994 and the devaluation occurred in December 1994. Therefore, we can count only
on one year where NAFTA effects were not contaminated by the devaluation: 1994.
23

This is the first piece of evidence that we can use to address this question. The second
piece of evidence is based on economic reasoning: what do we expect to be the impact
of the devaluation on firms with different integration status?
Analysing the results for 1994, we notice that the impact of NAFTA is positive and
statistically significant in all our models for fully integrated plants. During 1994, their
productivity grew by about 15 percent more than the productivity of domestic firms.
The same can be said for firms that made use of imported intermediate inputs even
if the coefficients are smaller compared with that of fully integrated plants in the full
sample but are larger in the restricted sample (e.g. when excluding switchers).15 How-
ever, the opposite result emerges for exporter plants as in all models the coefficients
are statistically non significant. It follows that if we analyze the year immediately
subsequent to the implementation of NAFTA we observe that for plants that are fully
integrated and that make use of imported intermediate inputs their productivity grew
substantially more than that of domestic firms. It could be argued that one year is too
short to evaluate the benefits of NAFTA, and we substantially agree with this interpre-
tation. Having said that, the objective here is just to show that the results previously
presented for a period when NAFTA and the effect of devaluation overlap are consis-
tent with the results in the year when the effects of NAFTA are “non-contaminated”
by the effects of the devaluation.
It is reasonable to expect that the exchange rate devaluation can affect firms with
different integration status differently. In particular, we would expect that the first
order impact on firms that just export will be positive, while the opposite would be
the impact on firms that just import. The first order effect on fully integrated firms is
harder to predict a priori. Based on this reasoning, we can expect that the coefficients
for firms that just export could be upward biased, in particular during the period
1995-1998, and the bias should decrase over time when the exchange rate appreciate.
Figure 7 suggests that our results, if anything, follow the opposite pattern, with the
coefficients becoming increasingly large for this group of firms. It could be said that if
it was not for the devaluation, these coefficients would have otherwise been negative,
but we have no empirical basis to confirm this claim. We can only say that the trend
of our coefficients appears inconsistent with what we would expect if the bias arising
from the devaluation was driving our results. The opposite pattern of bias should be
expected for firms that just import, but also in this case Figure 7 suggests that our
15A caveat to our argument is that to the extent that the exchange rate appreciate between 1993
and 1994 this may have given to users of imported inputs some “unnatural” advantage. However
the figure 7 (b) shows that between 1993 and 1994, if anything, there was a small devaluation of the
exchage rate.
24
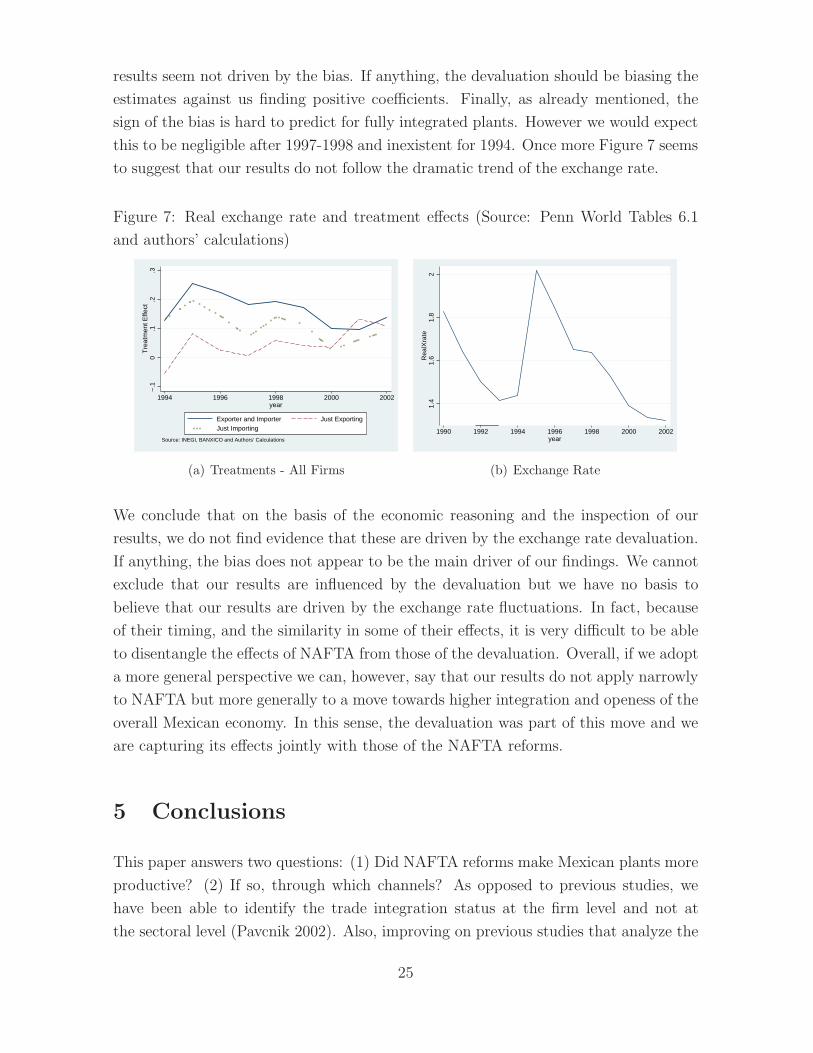
results seem not driven by the bias. If anything, the devaluation should be biasing the
estimates against us finding positive coefficients. Finally, as already mentioned, the
sign of the bias is hard to predict for fully integrated plants. However we would expect
this to be negligible after 1997-1998 and inexistent for 1994. Once more Figure 7 seems
to suggest that our results do not follow the dramatic trend of the exchange rate.
Figure 7: Real exchange rate and treatment effects (Source: Penn World Tables 6.1
and authors’ calculations)
−.1
0.1
.2.3
Tre
atm
ent E
ffect
1994 1996 1998 2000 2002year
Exporter and Importer Just ExportingJust Importing
Source: INEGI, BANXICO and Authors’ Calculations
(a) Treatments - All Firms
1.4
1.6
1.8
2R
ealX
rate
1990 1992 1994 1996 1998 2000 2002year
(b) Exchange Rate
We conclude that on the basis of the economic reasoning and the inspection of our
results, we do not find evidence that these are driven by the exchange rate devaluation.
If anything, the bias does not appear to be the main driver of our findings. We cannot
exclude that our results are influenced by the devaluation but we have no basis to
believe that our results are driven by the exchange rate fluctuations. In fact, because
of their timing, and the similarity in some of their effects, it is very difficult to be able
to disentangle the effects of NAFTA from those of the devaluation. Overall, if we adopt
a more general perspective we can, however, say that our results do not apply narrowly
to NAFTA but more generally to a move towards higher integration and openess of the
overall Mexican economy. In this sense, the devaluation was part of this move and we
are capturing its effects jointly with those of the NAFTA reforms.
5 Conclusions
This paper answers two questions: (1) Did NAFTA reforms make Mexican plants more
productive? (2) If so, through which channels? As opposed to previous studies, we
have been able to identify the trade integration status at the firm level and not at
the sectoral level (Pavcnik 2002). Also, improving on previous studies that analyze the
25

impact of NAFTA, we have attempted to identify an “overall NAFTA impact” (through
the various channels) and not just the impact of tariff changes (Lopez-Cordova 2003).
Furthermore, our empirical analysis overcomes two principal hurdles: endogeneity and
potential sample selection bias. A further complication was generated by the timing
of the peso’s devaluation, which occurred in December 1994 and overlapped with the
period of implementation of NAFTA enacted in January 1994. The papers tries to
tackle all these empirical issues and our results appear to be robust and not driven by
these issues.
The results of this paper confirm the importance of the import-competition channel.
As previously suggested in various empirical studies (Tybout and Westbrook 1995,
Pavcnik 2002, Fernandes 2007), an increase in import competition, measured by a
reduction of import tariffs under NAFTA, had a positive effect on stimulating the
productivity of Mexican plants. We also found that the impact of trade reforms is not
identical for all integrated plants. Consequently, it is important to distinguish between
firms based on the way these are actually integrated to the international markets. In
fact, we found that the benefits to firms that are fully integrated are normally larger
than the benefits accruing to other types of integrated firms. In contrast with the
findings of Lopez-Cordova (2003) but in line with some more recent studies (Amiti and
Konings 2007), our results suggest that imported intermediate inputs can be a crucial
source of productivity growth for firms, and trade reforms that enhance access to these
inputs can be an important source of a country’s competitiveness. As it was the case
in (Pavcnik 2002, Bernard and Bradford Jensen 1999), we cannot find evidence that
exporting is a channel of productivity growth. However, a possible explanation for the
lack of evident improvements in the productivity growth of exporters, as opposed to
importers, could be that the extra market access for Mexican exporters after NAFTA
has been modest given that US tariffs were already low. In contrast, the changes for
importers have been more substantial. Furthermore, with the boom in FDI and the
expansion of exports after NAFTA, many of the importers may have found themselves
in the new situation of having to supply MNCs or exporters with far higher demand
standards. The process of catching up with these new demands may be an important
explanation behind the significant productivity growth of importers. Unfortunately,
we have no hard evidence to support this hypothesis except some facts presented in
our descriptive analysis (Section 3).
Finally, consistent with various previous studies (Djankov and Hoekman 2000, Evenett
and Voicu 2001), the FDI channel also appears to be an important source of productiv-
ity growth for plants acquired, or with participation shares, by MNCs. However, data
limitations do not allow us to investigate this channel in more detail because the data
26
only allow us to identify the foreign ownership of Mexican plants in 1994. For this rea-
son, we decided not to pursue further the study of the impact of FDI and the potential
vertical and horizontal spillovers in this study, even if we are aware of their importance
as drivers of productivity changes in Mexico during the period under analysis.
References
Aghion, P., R. Burgess, S. Redding, and F. Zilibotti (2004): “Entry Liberal-
ization and Inequality in Industrial Performance,” Mimeo, Department of Economics,
Harvard University.
Amiti, M., and J. Konings (2007): “Trade Liberalization, Intermediate Inputs and
Productivity: Evidence from Indonesia,” American Economic Review, 97(5), 1611–
1638.
Arrow, K. J. (1962): “The Economic Implications of Learning by Doing,” The Re-
view of Economic Studies, 29(3), 155–173.
Aw, B. Y., X. Chen, and M. J. Roberts (2001): “Firm-level evidence on productiv-
ity differentials and turnover in Taiwanese manufacturing,” Journal of Development
Economics, 66(1), 51–86.
Baldwin, R. (2000): “Trade and growth: still disagreement about the relationships,”
Working Paper 264, OECD Economics Department.
Bernard, A. B., and J. Bradford Jensen (1999): “Exceptional exporter perfor-
mance: cause, effect, or both?,” Journal of international economics. Supplement. 47,
no. 1, pp. 1 (26 pages) Additional Info North–Holland, ISSN: 0022-1996 CODEN:
JIECBE OCLC No: 9563174 Provider: OCLC.
Bernard, A. B., J. Eaton, J. B. Jenson, and S. Kortum (2003): “Plants and
Productivity in International Trade,” American Economic Review, 93(4), 1268–1290.
Bernard, A. B., S. J. Redding, and P. K. Schott (2007): “Comparative Ad-
vantage and Heterogeneous Firms,” Review of Economic Studies, 74(1), 31–66.
Blundell, R., and M. Costa Dias (2000): “Evaluation Methods for Non-
Experimental Data,” Fiscal Studies, 21(4), 427–68.
Bustos, P. (2007): “Multilateral Trade Liberalization, Exports and Technology Up-
grading: Evidence on the Impact of MERCOSUR on Argentinean Firms,” Mimeo,
CREI and Universitat Pompeu Fabra.
27

Caves, D. W., L. Christensen, and E. Diewert (1982): “Output, Input, and
Productivity Using Superlative Index Numbers,” Economic Journal, 92, 73–96.
De Hoyos, R. E. (2005): “The Microeconomics of Inequality, Poverty and Market
Liberalizing Reforms,” Research Paper 2005/63, UNU-WIDER.
Disney, R., J. Haskel, and Y. Heden (2003): “Restructuring and Productivity
Growth in UK Manufacturing,” Economic Journal, 113(489), 666–94.
Djankov, S., and B. Hoekman (2000): “Foreign Investment and Productivity
Growth in Czech Enterprises,” World Bank Economic Review, 14(1), 49–64.
Evenett, S. J., and A. Voicu (2001): “Picking winners or creating them? Re-
visiting the benefits of FDI in the Czech Republic,” Working paper, University of
St.Gallen.
Feenstra, R. C., and al. (1999): “Testing Endogenous Growth in South Korea
and Taiwan,” Journal of Development Economics, 60(2), 317–41.
Fernandes, A. M. (2007): “Trade Policy, Trade Volumes and Plant-Level Produc-
tivity in Colombian Manufacturing Industries,” Journal of International Economics,
71(1), 52–71.
Fernandes, A. M., and A. E. Isgut (2005): “Learning-by-Doing, Learning-by-
Exporting, and Productivity: Evidence from Colombia,” Research Working Paper
3544, World Banks.
Girma, S., D. Greenaway, and R. Kneller (2004): “Does Exporting Increase
Productivity? A Microeconometric Analysis of Matched Firms,” Review of Interna-
tional Economics, 12(5), 855–66.
Grossman, G., and E. Helpman (1991a): Innovation and growth in the global
economy. MIT Press, Cambridge, Mass. and London.
(1991b): “Trade, knowledge spillovers, and growth,” European Economic
Review, 35(2-3), 517.
Heckman, J. (1979): “Sample selection bias as a specication error,” Econometrica,
47(1), 153–161.
Iacovone, L. (2008): “Exploring Mexican Firm-Level Data,” Mimeo.
Kose, M. A., G. M. Meredith, and C. M. Towe (2004): “How Has NAFTA
Affected the Mexican Economy? Review and Evidence,” Working Paper WP/04/59,
IMF.
28
Lederman, D., W. F. Maloney, and L. Serven (2003): “Lessons from NAFTA
for Latin America and the Caribbean Countries: A Summary of Research Findings,”
Discussion paper, World Bank.
Leibenstein, H. (1966): “Allocative Efficiency vs. ”X-Efficiency”,” The American
Economic Review, 56(3), 392–415.
(1978): “On the Basic Proposition of X-Efficiency Theory,” The American
Economic Review, 68(2), 328–332.
Lopez-Cordova, E. (2003): “NAFTA and Manufacturing Productivity in Mexico,”
Economia: Journal of the Latin American and Caribbean Economic Association,
4(1), 55–88.
Martin, J. P. (1978): “X-Inefficiency, Managerial Effort and Protection,” Econom-
ica, 45(179), 273–286.
Martin, J. P., and J. M. Page (1983): “The Impact of Subsidies on X-Efficiency
in LDC Industry: Theory and an Empirical Test,” The Review of Economics and
Statistics, 65(4), 608–617.
Melitz, M. J. (2003): “The Impact of Trade on Intra-industry Reallocations and
Aggregate Industry Productivity,” Econometrica, 71(6), 1695–1725.
Melitz, M. J., and G. I. P. Ottaviano (2008): “Market Size, Trade, and Produc-
tivity,” Review of Economic Studies, 75(1), 295–316.
Olley, G. S., and A. Pakes (1996): “The Dynamics of Productivity in the Telecom-
munications Equipment Industry,” Econometrica, 64(6), 1263–1297.
Pavcnik, N. (2002): “Trade liberalization, exit and productivity improvements: evi-
dence from Chilean plants,” Review of Economic Studies, 69(1), 245–276.
Peters, E. D. (2000): Polarizing Mexico. The Impact of Liberalization Strategy.
Lynne & Rienner.
Roberts, M. J., and J. R. Tybout (1996): Industrial evolution in developing
countries: Micro patterns of turnover, productivity, and market structure. Oxford
University Press for the World Bank, Oxford and New York.
Tomz, M. (1997): “Do International Agreements Make Reforms More Credible? The
Impact of NAFTA on Mexican Stock Prices,” in Annual Meeting of the American
Political Science Association,.
29

Tybout, J. R. (2001): “Plant- and firm-level evidence on ”new” trade theories,”
Working Paper 9418, NBER.
Tybout, J. R., and M. D. Westbrook (1995): “Trade Liberalization and the
Dimensions of Efficiency Change in Mexican Manufacturing Industries,” Journal of
International Economics, 39(1-2), 53–78.
Verhoogen, E. A. (2008): “Trade, Quality Upgrading and Wage Inequality in the
Mexican Manufacturing Sector,” Quarterly Journal of Economics, 123(2).
Wagner, J. (2002): “The Causal Effects of Exports on Firm Size and Labor Pro-
ductivity: First Evidence from a Matching Approach,” Economics Letters, 77(2),
287–92.
Whalley, J. (1993): “Regional Trade Arrangements in North America: CUSTA
and NAFTA,” in New Dimensions in Regional Integration, ed. by J. D. Melo, and
A. Panagariya. Cambridge University Press., Cambridge.
Winters, A. (2004): “Trade Liberalisation and Economic Performance: An
Overview,” Economic Journal, 114(February), F4–F21.
Wooldridge, J. M. (2002): Econometric analysis of cross section and panel data.
MIT Press, Cambridge and London.
Yeaple, S. R. (2005): “A Simple Model of Firm Heterogeneity, International Trade,
and Wages,” Journal of International Economics, 65(1), 1–20.
30

A Appendix 1: Regression Tables
31
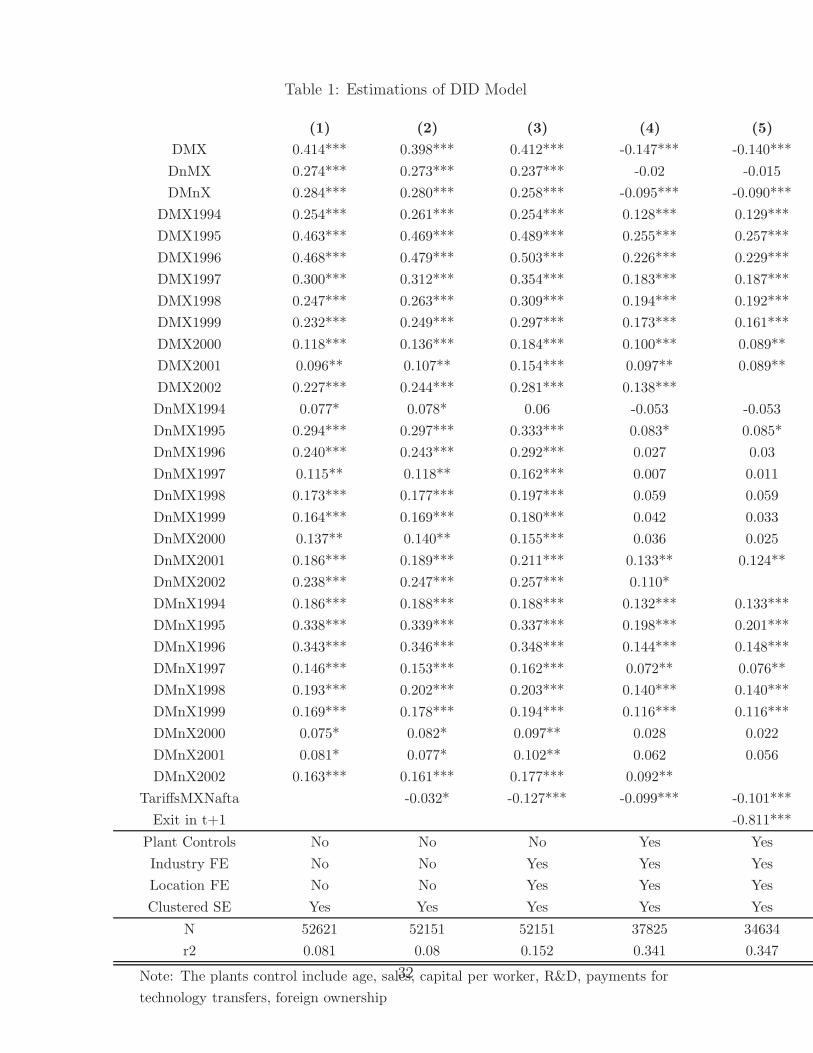
Table 1: Estimations of DID Model
(1) (2) (3) (4) (5)
DMX 0.414*** 0.398*** 0.412*** -0.147*** -0.140***
DnMX 0.274*** 0.273*** 0.237*** -0.02 -0.015
DMnX 0.284*** 0.280*** 0.258*** -0.095*** -0.090***
DMX1994 0.254*** 0.261*** 0.254*** 0.128*** 0.129***
DMX1995 0.463*** 0.469*** 0.489*** 0.255*** 0.257***
DMX1996 0.468*** 0.479*** 0.503*** 0.226*** 0.229***
DMX1997 0.300*** 0.312*** 0.354*** 0.183*** 0.187***
DMX1998 0.247*** 0.263*** 0.309*** 0.194*** 0.192***
DMX1999 0.232*** 0.249*** 0.297*** 0.173*** 0.161***
DMX2000 0.118*** 0.136*** 0.184*** 0.100*** 0.089**
DMX2001 0.096** 0.107** 0.154*** 0.097** 0.089**
DMX2002 0.227*** 0.244*** 0.281*** 0.138***
DnMX1994 0.077* 0.078* 0.06 -0.053 -0.053
DnMX1995 0.294*** 0.297*** 0.333*** 0.083* 0.085*
DnMX1996 0.240*** 0.243*** 0.292*** 0.027 0.03
DnMX1997 0.115** 0.118** 0.162*** 0.007 0.011
DnMX1998 0.173*** 0.177*** 0.197*** 0.059 0.059
DnMX1999 0.164*** 0.169*** 0.180*** 0.042 0.033
DnMX2000 0.137** 0.140** 0.155*** 0.036 0.025
DnMX2001 0.186*** 0.189*** 0.211*** 0.133** 0.124**
DnMX2002 0.238*** 0.247*** 0.257*** 0.110*
DMnX1994 0.186*** 0.188*** 0.188*** 0.132*** 0.133***
DMnX1995 0.338*** 0.339*** 0.337*** 0.198*** 0.201***
DMnX1996 0.343*** 0.346*** 0.348*** 0.144*** 0.148***
DMnX1997 0.146*** 0.153*** 0.162*** 0.072** 0.076**
DMnX1998 0.193*** 0.202*** 0.203*** 0.140*** 0.140***
DMnX1999 0.169*** 0.178*** 0.194*** 0.116*** 0.116***
DMnX2000 0.075* 0.082* 0.097** 0.028 0.022
DMnX2001 0.081* 0.077* 0.102** 0.062 0.056
DMnX2002 0.163*** 0.161*** 0.177*** 0.092**
TariffsMXNafta -0.032* -0.127*** -0.099*** -0.101***
Exit in t+1 -0.811***
Plant Controls No No No Yes Yes
Industry FE No No Yes Yes Yes
Location FE No No Yes Yes Yes
Clustered SE Yes Yes Yes Yes Yes
N 52621 52151 52151 37825 34634
r2 0.081 0.08 0.152 0.341 0.347
Note: The plants control include age, sales, capital per worker, R&D, payments for
technology transfers, foreign ownership
32

Table 2: Controlling for Switchers
Eliminate ALWAYS switchers Eliminate switchers AFTER first switch
OLS heckman heckman B OLS heckman heckman B
(1) (2) (3) (4) (5) (6)
DMX -0.146*** -0.309*** -1.063*** -0.167*** -0.164*** -0.168***
DnMX 0.095 -0.633** -4.008*** -0.029 -0.030 -0.028
DMnX -0.007 -0.719*** -4.020*** -0.092*** -0.100*** -0.086***
DMX1994 0.242*** 0.227*** 0.155 0.189*** 0.230*** 0.162***
DMX1995 0.481*** 0.368*** -0.159 0.373*** 0.497*** 0.293***
DMX1996 0.385*** 0.218** -0.560 0.347*** 0.454*** 0.278***
DMX1997 0.219*** 0.004 -0.997** 0.198*** 0.280*** 0.145***
DMX1998 0.164*** 0.040 -0.536 0.171*** 0.187*** 0.161***
DMX1999 0.135*** -0.021 -0.746* 0.100*** 0.133*** 0.078*
DMX2000 0.026 -0.150 -0.973** 0.025 0.063 0.001
DMX2001 0.032 -0.071 -0.551 0.051 0.060 0.045
DnMX1994 0.133** 0.154 0.245 0.034 0.198*** -0.072
DnMX1995 0.438*** 0.393*** 0.185 0.239*** 0.452*** 0.102
DnMX1996 0.314*** 0.202 -0.319 0.177*** 0.372*** 0.051
DnMX1997 0.203** 0.104 -0.352 0.052 0.225*** -0.059
DnMX1998 0.371*** 0.339** 0.178 0.068 0.177** -0.002
DnMX1999 0.105 0.070 -0.097 0.012 0.142** -0.071
DnMX2000 0.115 0.126 0.172 0.004 0.110 -0.064
DnMX2001 0.208* 0.247 0.422 0.129** 0.227*** 0.067
33

Eliminate ALWAYS switchers Eliminate switchers AFTER first switch
OLS heckman heckman B OLS heckman heckman B
DMnX1994 0.266*** 0.264*** 0.253 0.181*** 0.291*** 0.110***
DMnX1995 0.465*** 0.584*** 1.134*** 0.267*** 0.316*** 0.235***
DMnX1996 0.269*** 0.412*** 1.075*** 0.234*** 0.363*** 0.151***
DMnX1997 0.146** 0.309*** 1.065** 0.049 0.173*** -0.031
DMnX1998 0.167*** 0.448*** 1.755*** 0.087** 0.151*** 0.045
DMnX1999 0.139* 0.389*** 1.553*** 0.041 0.147*** -0.028
DMnX2000 0.034 0.266** 1.341*** -0.017 0.126** -0.109**
DMnX2001 -0.002 0.258* 1.466*** 0.052 0.183*** -0.032
TariffsMXNafta -0.099*** -0.096*** -0.080 -0.102*** -0.103*** -0.101***
lambda 0.912*** 5.142*** -0.783*** 0.502***
FIRST STAGE - LHS: Firm is no Switcher ( = Firm Select into the sample)
Distance from average
productivity similar firms 0.042* 0.016 0.051** 0.008
Distance squared -0.010 -0.017**
Plant controls Yes Yes Yes Yes Yes Yes
Industry FE Yes Yes Yes Yes Yes Yes
Region FE Yes Yes Yes Yes Yes Yes
N 19,010 50,347 50,347 42,266 50,347 50,347
R2 0.411 0.392
Notes: The distance from average productivity of “similar” plants is in absolute value.
34