
Economic Development of Slovakia in 2014 and Outlook … · · 2016-06-10Economic Development of...
129
INSTITUTE OF ECONOMIC RESEARCH Slovak Academy of Sciences Economic Development of Slovakia in 2014 and Outlook up to 2016 Karol Morvay et al. Bratislava 2015
Transcript of Economic Development of Slovakia in 2014 and Outlook … · · 2016-06-10Economic Development of...
INSTITUTE OF ECONOMIC RESEARCH Slovak Academy of Sciences
Economic Development of Slovakia in 2014
and Outlook up to 2016
Karol Morvay et al.
Bratislava 2015

Team of authors: Ing. Karol Frank, PhD. (chapter 6 and 7) Ing. Martin Hudcovský (chapter 5) Ing. Veronika Hvozdíková, PhD. (chapter 8) Ing. Tomáš Jeck, PhD. (chapter 2 and 9) Ing. Karol Morvay, PhD. (chapter 1 and 10) Ing. Ivana Šikulová, PhD. (chapter 3 and 4) Reviewed by: Doc. Ing. Veronika Piovarčiová, CSc. Ing. Štefan Zajac, CSc.
The authors are employees of Institute of Economic Research SAS. The work supported by VEGA Grant Agency in the frame of the projects VEGA no. 2/0070/15. Translation: Ing. Martin Hudcovský
Technical editor: Iveta Balážová
© Institute of Economic Research of Slovak Academy of Sciences Bratislava 2015
e-book ISBN 978-80-7144-247-9
CONTENTS
INTRODUCTION ……………………………………………………………………… 5 1. OVERALL ECONOMIC DEVELOPMENT ………………………………….. 6 2. QUALITATIVE FACTORS OF ECONOMIC DEVELOPMENT …….. 23 3. EXTERNAL ECONOMIC RELATIONS ……………………………………. 32 4. EUROPEAN CENTRAL BANK MONETARY POLICY AND THE EURO AREA DEVELOPMENT FROM THE SLOVAK REPUBLIC POINT OF VIEW ……………………………………………….. 42 5. PRICE DEVELOPMENT ……………………………………………………….. 53 6. DEVELOPMENT OF SELECTED FINANCIAL MARKETS INDICATORS ……………………………………………………………………… 62 7. PUBLIC FINANCE ……………………………………………………………….. 74 8. LABOUR MARKET ………………………………………………………………. 87 9. OVERVIEW OF SELECTED LEGISLATIVE AND ECONOMIC
POLICY MEASURES ………………………………………………………….. 102
10. OUTLOOK FOR 2015 AND 2016 ………………………………………. 109 REFERENCES ………………………………………………………………………. 121


5
INTRODUCTION
Another regular annual assessment of Slovak economic development
comes at time when there is more optimism in the European economy,
whilst some of risk factors that have caused recent debt crisis are still
present. At the time of actual economic recovery, chronic problems of the
Eurozone have overlapped, but have not been eliminated.
The Slovak economy passed through two bottoms of the same crisis:
a deep one in 2009 and shallow one in 2012/2013. There has been re-
ported simultaneous positive development of substantial performance
and stability indicators in 2014. The Slovak economy has accelerated its
growth, while there has been a number of phenomena that are a bit
“new” or “different” compared to current development: Employment has
better responded to macroeconomic development, price level has not
increased, economic growth was not driven by exporters but by domes-
tic market, fiscal policy ceased to dampen the economy after years. Even
insignificant improvements are perceived with optimism after approxi-
mately five years of mistrust and uncertainty. A number of phenomena
occurred which necessarily brings question whether they are able to
persist or if they were just short-term fluctuation in unstable economy.
The analysis of Slovak economic development by Economic Institute,
SAS is regularly published since 1993. It evaluates the level of economic
development and economic performance, internal and external balance,
economic policy, labour and financial markets development as well as
measures that have changed economic environment. The conclusion out-
lines expected development in 2016.
6
1. OVERALL ECONOMIC DEVELOPMENT
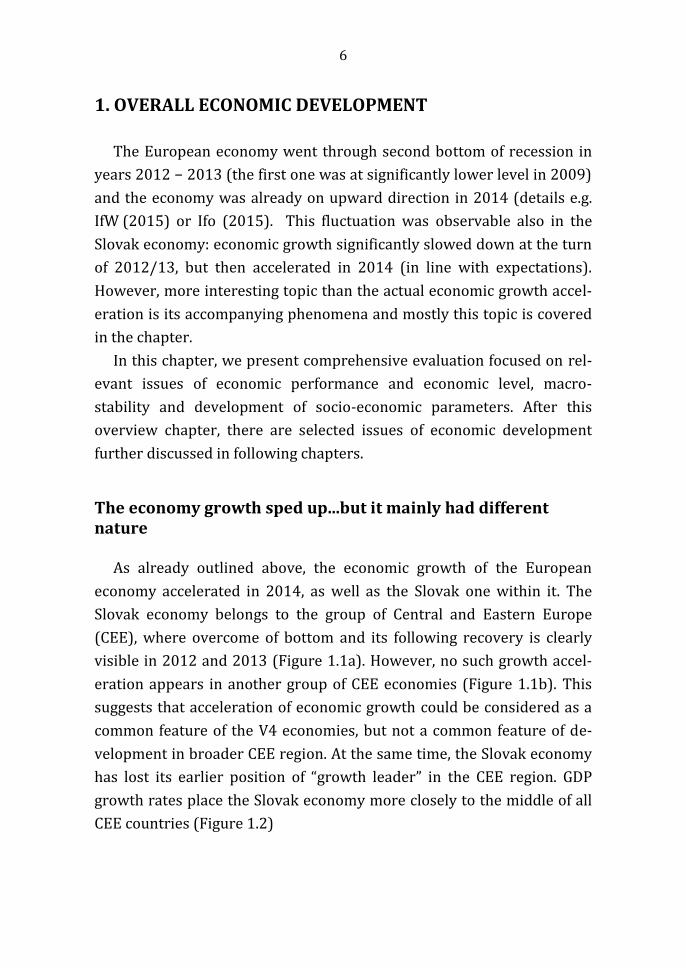
The European economy went through second bottom of recession in
years 2012 − 2013 (the first one was at significantly lower level in 2009)
and the economy was already on upward direction in 2014 (details e.g.
IfW (2015) or Ifo (2015). This fluctuation was observable also in the
Slovak economy: economic growth significantly slowed down at the turn
of 2012/13, but then accelerated in 2014 (in line with expectations).
However, more interesting topic than the actual economic growth accel-
eration is its accompanying phenomena and mostly this topic is covered
in the chapter.
In this chapter, we present comprehensive evaluation focused on rel-
evant issues of economic performance and economic level, macro-
stability and development of socio-economic parameters. After this
overview chapter, there are selected issues of economic development
further discussed in following chapters.
The economy growth sped up...but it mainly had different nature
As already outlined above, the economic growth of the European
economy accelerated in 2014, as well as the Slovak one within it. The
Slovak economy belongs to the group of Central and Eastern Europe
(CEE), where overcome of bottom and its following recovery is clearly
visible in 2012 and 2013 (Figure 1.1a). However, no such growth accel-
eration appears in another group of CEE economies (Figure 1.1b). This
suggests that acceleration of economic growth could be considered as a
common feature of the V4 economies, but not a common feature of de-
velopment in broader CEE region. At the same time, the Slovak economy
has lost its earlier position of “growth leader” in the CEE region. GDP
growth rates place the Slovak economy more closely to the middle of all
CEE countries (Figure 1.2)

7
F i g u r e 1.1 Overcoming of „Second Bottom“ in CEE Countries (changes in real GDP, %) a) Group with bottom overcome b) Group with different development
Source: Eurostat database.
F i g u r e 1.2 Average GDP Growth Rate in 2013 − 2014 in CEE Countries
Source: Own calculations based on Eurostat.
-4
-2
0
2
4
6
2010 2011 2012 2013 2014
Slovakia EU 28Czech Republic HungaryPoland SloveniaBulgaria
-4
-2
0
2
4
6
8
2010 2011 2012 2013 2014
Croatia Latvia
Lithuania Romania
-1
-0,5
0
0,5
1
1,5
2
2,5
3
3,5
Lat
via
Ro
man
ia
Lit
hu
ania
Hu
nga
ry
Po
lan
d
Slo
vak
ia
Est
on
ia
Bu
lgar
ia
Slo
ven
ia
Cze
ch R
epu
bli
c
Cro
atia

8
However, when evaluating data about changes in performance and
economic level, it is necessary to bear in mind ESA 2010 methodology
adaptation, which has changed values of variables (value of GDP mostly
increased). This needs to be born in mind in case of any analysis confron-
tation (or any other current analysis) with the older ones. The problem
may arise only when comparing data regardless methodology change.
Please note that significant part of values and trends being mentioned in
the publication cannot be mechanically compared to those ones in simi-
lar analysis stated earlier.
This phenomenon is captured in figures 1.3 and 1.4. The transition
from reporting in the earlier methodology (ESA 95) to more advanced
one, ESA 2010, has brought increase in nominal GDP in 20131 from 1 % to
5 % (the only exception among the CEE countries is Latvia, where adapta-
tion of new methodology has caused decrease of nominal GDP by 0,5 %;
see Figure 1.4). Even in more advanced EU economies, the adaptation of
ESA 2010 caused shift in GDP values to higher ones (with Luxemburg
being an exception). Such methodological change induced by correction
of GDP data means, among other things, also:
all ratio indicators decline when expressed as percentage of GDP;
there is a risk of misinterpretation of development trends in econom-
ic growth (it is evident when e.g. nominal GDP is compared to real
GDP growth, see Figure 1.4);
there is also a risk of misinterpretation of some structural move-
ments in formation and use of GDP. E. g. use of ESA 2010 data de-
creases export performance of the Slovak economy (ratio of exports
of goods and services on GDP) compared to values presented in pre-
vious methodology.
Due to risks above, it is important to take into account the methodolo-
gy change which leads to improvement of national accounts system,
when interpreting values on economy performance level.
1Such comparison of data is possible only till 2013.

9
F i g u r e 1.3 Differences in Reported Dynamics of GDP by Use of Different Methodologies
Source: Eurostat database.
F i g u r e 1.4 Difference between the Value of Nominal GDP by Use of Different Methodologies for the Year 2013 (%)
Note: Range (in %) in which use of newer methodology of GDP (ESA 2010) exceeds GDP under previous methodology (ESA 95). The value of GDP under the old methodology was higher only in the case of Latvia.
Source: own calculations based on Eurostat.
4.8
2.7
1.6
1.4
2.4
4.4
3.0
1.8
0.9
0
1
2
3
4
5
6
2010 2011 2012 2013 2014
Growth rate based on ESA 2010
Growth rate based on ESA 95
3.45
3.55
2.77
5.21
0.67
1.01
-0.46
0.94
2.64
1.61
1.43
2.46
2.02
-2 0 2 4 6
EU 28
EU 15
Bulgaria
Czech Republic
Estonia
Croatia
Latvia
Lithuania
Hungary
Poland
Romania
Slovenia
Slovakia

10
The economic level of Slovakia (measured as GDP per capita) reached
50,9 % of the economic level of the EU 28 in terms of current prices in
EUR (data for 2014); However, it reached 75.2 % of the EU 28 economic
level in terms of purchasing power standard (data for 20132). It is im-
portant to state, that regardless the measure used, gap between the per-
formance of the Slovak economy and others economies of CEE with the
highest values (Slovenia and Czech Republic – see Figure 1.5a and 1.5b)
was decreasing.
F i g u r e 1.5 Development of Relative Economic Level (GDP per Capita) in CEE Countries; EU 28 = 100 a) EUR, current prices b) Purchasing power standard (PPS)
Source: Eurostat database.
As already indicated, the acceleration of economic growth in Slovakia
was associated with significant changes in the nature of growth, but also
in changes of other macroeconomic parameters. The acceleration of
growth itself is not that interesting phenomenon without consideration
2Data expressed in purchasing power standard takes into account differences in the price levels
of compared economies and it is more suitable for comparison of economic performance. At the time of this text preparation, however, last available value was for year 2013.
0
0,2
0,4
0,6
0,8
1
20
05
20
06
20
07
20
08
20
09
20
10
20
11
20
12
20
13
20
14
Slovakia Czech Republic
Hungary Poland
Slovenia
0
0,2
0,4
0,6
0,8
12
00
5
20
06
20
07
20
08
20
09
20
10
20
11
20
12
20
13
Slovakia Czech Republic
Hungary Poland
Slovenia

11
of these phenomena. Among relevant changes in the nature of growth
and related macroeconomic parameters can be considered:
Significant strengthening of domestic demand (both consuming and investing);
Improvement of several indicators of macroeconomic stability;
Improvement of employment and income indicators development;
Transfer of growth to other branches (compared to the previous pe-riod).
We pay attention to these four phenomena in the following part of this chapter.
Is this the end of domestic demand misery?
After several years of stagnation or even decline in components of
domestic demand, in 2014, the domestic demand was driving force of
economic growth. Vice versa, an external demand (represented by ex-
port of goods and services), which determined economic growth of Slo-
vakia in past years did not play such an important role. As shown in Ta-
ble 1.1, the share of domestic demand contribution to GDP growth was
negative in years 2012 and 2013: thus the GDP growth was accompanied
by a decrease in domestic demand3 (in other words: the GDP grew de-
spite domestic demand was declining, as a result of strong growth im-
pulse provided by external demand). In 2014, the change is very signifi-
cant: a unit of GDP could be accounted with 1.14 units of domestic de-
mand change (bottom row of Table 1.1). This means that domestic de-
mand was the sole driver of GDP growth (when evaluating GDP from its
usage side).
3In our last years’ analysis (Morvay et al., 2014), we have pointed out that “misery of domestic
demand continued” and stated that “The economic growth of SR in the times of recessions (2010 – 2013) was very specific: it has been accompanied with unfavourable development of domestic demand (DD)… a cumulative growth of real GDP has increased by 10.5 %, domestic demand has increased just by 1.2 %. This leads to very adverse ratio between real GDP and DD dynamics…by disaggregation of domestic demand into individual components, extraordinary ratio of household consumption dynamics (CH) to GDP dynamics becomes clearly visible…From all countries in-cluded in comparison, the connection of economic growth and CH growth was the least favoura-ble for consumption in SR (economic growth was connected with decrease of household con-sumption).” (p. 13).

12
Another different thing is clear from the data in Table 1.1: There are
concentrated data only for those CEE countries, which experienced posi-
tive economic growth in 2013 and 2014 (there are excluded economies
where no growth occurred as we are unable to evaluate changes in na-
ture of economic growth). In each of these CEE countries, the role of do-
mestic demand has been underlined. In 2014, the share of domestic de-
mand growth to total GDP growth was higher in all cases compared to
previous year. Thus in all CEE countries which achieved economic
growth in 2013 and 2014, such growth was supported by enhanced do-
mestic demand expansion.
T a b l e 1.1 The Share of Domestic Demand Growth to GDP growth
2011 2012 2013 2014
Bulgaria 0.06 6.80 -1.48 1.65
Estonia 1.46 1.00 0.55 2.22
Latvia 2.12 0.54 0.77 0.85
Lithuania 0.97 -0.05 0.86 1.53
Hungary -0.10 1.90 0.72 1.09
Poland 0.82 -0.21 0.14 1.37
Romania 1.07 -0.76 -0.27 0.97
Slovakia 0.39 -2.56 -0.01 1.14
Note: Year-on-year growth of domestic demand in current prices in EUR / year-on-year growth of GDP in current prices in EUR.
Source: own calculations based on Eurostat.
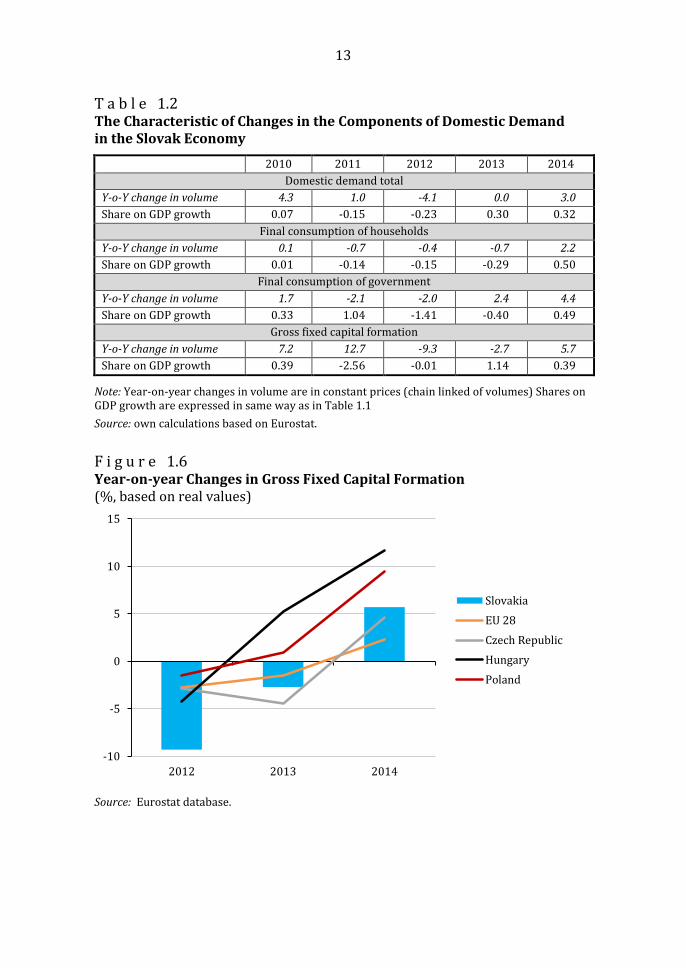
By closer look at domestic demand in the Slovak economy, we can ob-
serve positive turn in development of all three basic components (Table
1.2). However, especially significant was the turn in gross fixed capital
formation. This means after two years of decline in investment activity,
the volume of the fixed investments increased in 2014.
A significant turn in gross fixed capital formation took place in all the
V4 countries. It was an expected phenomenon after previous attenuation
of investment activity supported by improved expectations and pro-
spects for future development.
13
T a b l e 1.2 The Characteristic of Changes in the Components of Domestic Demand in the Slovak Economy
2010 2011 2012 2013 2014
Domestic demand total
Y-o-Y change in volume 4.3 1.0 -4.1 0.0 3.0
Share on GDP growth 0.07 -0.15 -0.23 0.30 0.32
Final consumption of households
Y-o-Y change in volume 0.1 -0.7 -0.4 -0.7 2.2
Share on GDP growth 0.01 -0.14 -0.15 -0.29 0.50
Final consumption of government
Y-o-Y change in volume 1.7 -2.1 -2.0 2.4 4.4
Share on GDP growth 0.33 1.04 -1.41 -0.40 0.49
Gross fixed capital formation
Y-o-Y change in volume 7.2 12.7 -9.3 -2.7 5.7
Share on GDP growth 0.39 -2.56 -0.01 1.14 0.39
Note: Year-on-year changes in volume are in constant prices (chain linked of volumes) Shares on GDP growth are expressed in same way as in Table 1.1
Source: own calculations based on Eurostat.
F i g u r e 1.6 Year-on-year Changes in Gross Fixed Capital Formation (%, based on real values)
Source: Eurostat database.
-10
-5
0
5
10
15
2012 2013 2014
Slovakia
EU 28
Czech Republic
Hungary
Poland

14
Different look at the structure of GDP growth (using structure of gen-
erated revenues) reveals extremely high share of employees compensa-
tions to GDP growth. Such share is exceptional in the environment of the
Slovak economy – the share of employees compensations used to be very
low in the past years 4 (Figure 1.7). High share of employees compensa-
tions to GDP growth appears to be related to relatively strong employ-
ment growth along with enhanced growth of wage levels (see other
chapters, mainly the one elaborating labour market).
G r a f 1.7 The Share of Selected Types of Revenue to GDP growth
Source: Own calculations based on Eurostat.
Enhanced macro stability; in some areas even too much
Basically, a desirable and positive accompanying feature of enhanced
economic growth could be considered the improvement in several pa-
rameters of macroeconomic stability (balance), as shown in Figure 1.8.
4This phenomenon is also interesting due the fact, that acceleration of economic growth use to be
associated with decrease in the share of compensation of employees on GDP (so called “anti-cyclical behaviour of wage quota). Therefore, increase of GDP growth pace associated with in-crease in share of compensation of employees is an unusual phenomenon caused by specific situation described in chapter “Labour market”.
-0,4
-0,2
0
0,2
0,4
0,6
0,8
1
1,2
2010 2011 2012 2013 2014
Share of compensation of employees
Share of gross operational surpluses
Share of taxes on products and imports

15
In 2014, there was a decline in the unemployment rate, a decrease in
inflation rate (close to the deflation threshold), the general government
deficit was kept in acceptable limits and export and import of goods and
services remained positive (net export). An enhanced macroeconomic
stability can be generally considered as a sign of improved quality of
economic growth. However, an interpretation of complete absence of
inflation is problematic. Despite initial fears of economic recovery in-
compatibility with zero inflation (or even deflation), such a low inflation
was rather growth supporting than harming. Postponed consumption
(due to uncertainty in the economy) combined with growing incomes,
improved expectation and retreat of inflation helped to the recovery of
households consumption. It was confirmed, that zero inflation (or weak
deflation) does not necessarily have to be a factor preventing economic
recovery (more details in chapter “Price development”.)
F i g u r e 1.8 The Economic Growth and Selected Parameters of Macro-stability in the Slovak Economy
Source: Eurostat database, MF SR and own calculations.
-10
-5
0
5
10
15
20
2004 2005 2006 2007 2008 2009 2010 2011 2012 2013 2014
Changes in real GDP (%)Net Export (% of GDP)Changes in consumer prices in % (HICP)Unemployment rate (%)General government balance (% of GDP)
The acceleration of growth along with improvement in parameters of macro-stability
16
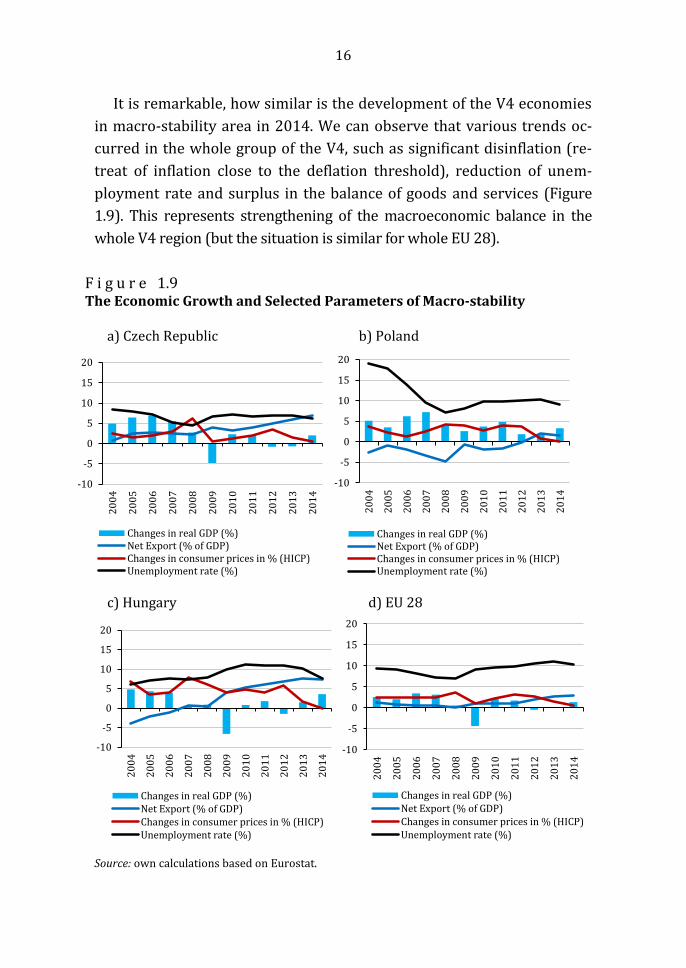
It is remarkable, how similar is the development of the V4 economies
in macro-stability area in 2014. We can observe that various trends oc-
curred in the whole group of the V4, such as significant disinflation (re-
treat of inflation close to the deflation threshold), reduction of unem-
ployment rate and surplus in the balance of goods and services (Figure
1.9). This represents strengthening of the macroeconomic balance in the
whole V4 region (but the situation is similar for whole EU 28).
F i g u r e 1.9 The Economic Growth and Selected Parameters of Macro-stability
a) Czech Republic b) Poland
c) Hungary d) EU 28
Source: own calculations based on Eurostat.
-10
-5
0
5
10
15
20
20
04
20
05
20
06
20
07
20
08
20
09
20
10
20
11
20
12
20
13
20
14
Changes in real GDP (%)Net Export (% of GDP)Changes in consumer prices in % (HICP)Unemployment rate (%)
-10
-5
0
5
10
15
202
00
4
20
05
20
06
20
07
20
08
20
09
20
10
20
11
20
12
20
13
20
14
Changes in real GDP (%)Net Export (% of GDP)Changes in consumer prices in % (HICP)Unemployment rate (%)
-10
-5
0
5
10
15
20
20
04
20
05
20
06
20
07
20
08
20
09
20
10
20
11
20
12
20
13
20
14
Changes in real GDP (%)Net Export (% of GDP)Changes in consumer prices in % (HICP)Unemployment rate (%)
-10
-5
0
5
10
15
20
20
04
20
05
20
06
20
07
20
08
20
09
20
10
20
11
20
12
20
13
20
14
Changes in real GDP (%)Net Export (% of GDP)Changes in consumer prices in % (HICP)Unemployment rate (%)

17
Better impact on employment and income than expected
In 2014, an important feature of economic developments was the im-
provement of labour market and income growth parameters. In particu-
lar, the employment growth was above expectations. In the past, the em-
ployment growth was only weakly tight to the growth performance of
the economy; thus it was quite surprising to see that acceleration of eco-
nomic growth in 2014 was accompanied by relatively strong growth of
employees. The economic growth remained despite an acceleration ra-
ther low (by the standards of the Slovak economy) and far below the lev-
els which used to form so-called threshold for employment growth (see
e.g. Hudcovský, 2015 or Morvay, 2012).
We can presume that an ability of the Slovak economy to expand by
spasmodic increases of labour productivity with little involvement of
additional employees is gradually diminishing. Such capacity was prima-
ry located in export-oriented industries with dominant global compa-
nies. The potential for such growth must necessarily fade out along with
the closure of so-called technological gap (the reduction of technology
lag). Temporary return of such growth can be imaginable only in case of
new large multinationals arrival (regarding to their technology and mar-
ket, Slovak output can expand along with expansion of productivity with
relatively low employment growth). However, this was not the model of
economic growth in 2014. As proven earlier above, the growth was in-
voked primarily by domestic demand and not expansion of exporters. In
comparison to previous years, the growth occurred in other branches of
economy (see below), which are by the nature of their business activities
more labour demanding. Therefore, their growth is more labour inten-
sive. After considering all these contexts, the growth of employment ac-
companied by relative low GDP growth is not so surprising.
The recovered growth of households consumption (considered as in-
dicator of material) can be induced by higher income of household sector
or a higher marginal propensity to consume. In case of Slovak economy,
both reasons were fulfilled.
1. The year-on-year growth of disposable income has increased. Such in-
crease can be attributed to more favorable development of employment

18
and wages. The share of employees’ compensations to increase of
current households’ income proves this fact. (Figure 1.10)
2. The marginal propensity to consume has increased (from additional
unit of household income, the higher share was consumed). That is
indicator of better expectations (retreat of caution) and expression of
delayed consumption compensation.
So the financing source of households consumption increased along
with share which households spend from additional income on con-
sumption.
T a b l e 1.3 Selected Parameters of Income, Consumption and Savings
2011 2012 2013 2014
A) Change in disposable income (EUR
mill.) 784.06 625.36 902.99 1 643.42
B) Change in final consumption of house-
holds (EUR mill.) 1 229.39 1 186.62 225.02 872.40
C) Change in gross savings (EUR mill.) -445.33 -561.27 677.99 771.00
Marginal propensity to consume (B/A) 1.567 1.897 0.249 0.531
Marginal propensity to save(C/A) -0.568 -0.898 0.751 0.469
Note: Change represents year-on-year increase or decrease.
Source: own calculations based on Statistical Office of SR.
F i g u r e 1.10 The structure of current income growth in household sector
Source: own calculations based on Statistical Office of SR.
0
0,1
0,2
0,3
0,4
0,5
0,6
0,7
0,8
0,9
2013 2014
Share of compensation of employeesShare of gross operational surpluses and mixed incomeShare of property incomeShare of social benefitsShare of other current transfers

19
Growth got into other branches
The changed structure of demand naturally reflected also in the dy-
namics of output of sector categories. As at the time of this text prepara-
tion, there were not sufficient detailed data about GDP were available,
we utilize the data on the development of the revenues.
The development of revenues was very different in industry based on
relation to the domestic market or the foreign one. The revenues in the
domestic market rose sharply (which relates to the recovery of domestic
demand mentioned earlier) and the growth of foreign market revenues
was slowing down (Figure 1.11). Also here, it is obvious that it was not
the growth based on exporters (which frequently appeared in the past of
Slovak economy). The growth of final household consumption men-
tioned earlier has its reflection in the improvement of retail revenues.5
Obviously, retail was a branch, which flourished in 2014. In construction,
the drop being present in former years was just reduced.
F i g u r e 1.11 The Development of Revenues in Selected Branches (Year-on-year changes; %, constant prices) a) in manufacturing b) in retail and construction
Source: Eurostat database, Statistical Office of SR database.
5Obviously, retail revenues does not mean the same thing as final consumption of households.
However, the overlap between these categories is apparent.
-2
0
2
4
6
8
10
2012 2013 2014
Revenues from production for domesticmarket
Revenues from production for foreign markets
-20
-15
-10
-5
0
5
2012 2013 2014
Revenues for own performances and goodsin ConstructionRevenues from retail

20
A closer look at development in the industry shows that growth was
driven by branches that produce goods intended for intermediate con-
sumption and durable consumer goods (in both cases, the expansion was
in revenues from domestic market). Less favorable was the development
of those sectors that produce capital goods and non-durable consumer
goods (e.g. negative revenue development of food production).
In conclusion, economic growth formed in 2014 as such, brought most
benefits to manufacturers oriented on domestic market and retail pro-
duction. The development was less favorable for producers who are ex-
port-oriented, as well as for construction.
T a b l e 1.4 Revenues in Manufacturing by Purpose of Goods (year-on-year changes in %, data adjusted by number of work days)
2012 2013 2014
Revenues of goods for intermediate consumption
Domestic market -3.2 -0.1 12.2
Foreign market 1.1 -0.7 3.0
Revenues from the production of capital goods
Domestic market 15.2 7.0 2.3
Foreign market 15.4 6.8 2.5
Revenues of durable consumer goods
Domestic market 43.3 -30.3 10.6
Foreign market 5.9 -0.2 4.6
Revenues of non-durable consumer goods
Domestic market 4.5 -3.3 -2.2
Foreign market 13.4 -7.1 -3.7
Source: Eurostat database.
Summary table 1.5 provides selected parameters of macroeconomic
development (in terms of performance, stability and socio-economic de-
velopment). The main point of the table, and whole chapter as well is cur-
rent improvement of economic dynamics and accompanied indicators of
stability and socio-economic development. The whole range of these phe-
nomena are discussed further in following chapters of this publication.

21
T a b l e 1.5 Socio-economic development of Slovakia in 2005 – 2014
2005 2006 2007 2008 2009 2010 2011 2012 2013 2014
Indicators of economy performance
Index of real GDP ; sppy = 1001 106.5 108.3 110.7 105.4 94.7 104.8 102.7 101.6 101.4 102.4
Relative economic level (GDP per capita in PPS;
EU 28 = 100)
59.5
62.7
67.1
71.4
71.2
73.1
72.7
74.0
75.2
Relative economic level (GDP per capita in EUR;
EU 28 = 100)
31.5
34.4
40.3
46.7
48.6
49.0
50.0
50.6
51.1
50.9
Index of domestic demand; sppy = 100 108.4 106.4 106.6 105.9 92.7 104.3 101.0 95.9 100.0 103.0
Real labour productivity change; index sppy = 1002 104.8 106.1 108.4 102.2 96.6 106.4 100.9 101.6 102.2 101.0
Indicators of stability
Inflation rate; %3 7.5 4.3 1.9 3.9 0.9 0.7 4.1 3.7 1.5 -0.1
General government balance/GDP; % -3.3 -3.4 -1.9 -2.2 -8.0 -7.7 -5.1 -4.3 -2.9 -2.6
Share of government consumption in GDP; % (curr.p.) 18.1 18.5 16.8 17.1 19.7 19.2 18.3 17.8 18.1 18.5
Net lending (+)/borrowing (-) -6.5 -7.9 -5.2 -5.4 -1.7 -2.1 -0.9 3.1 3.9
Net exports of goods and services / GDP; % (curr.p.)
Indicators of social development
Annual index of employment, sppy = 1004 100.3 103.8 102.4 103.2 97.2 98.0 101.9 100.6 100.0 101.4
Change in number of employees; in thousands4 45.8 85.2 55.9 76.5 -68.0 -48.3 .5 13.7 0.3 33.7
unemployment rate; %4 18.1 13.3 11.0 9.6 12.1 14.4 13.6 14.0 14.2 13.2
Annual change of real wages; % 2.5 3.3 4.3 3.3 1.4 2.2 -1.6 -1.2 1.0 4.2
Annual change of disposable income of households; % 5.9 4.3 10.2 5.7 0.4 2.9 -2.1 -2.4 1.7 3.6
Index of real household consumption / population 5.8 5.8 7.5 5.8 -0.8 -0.1 -0.1 -0.6 -0.9 2.1
Share of public expenditure on social protection
in GDP; %
12.1
12.3
10.6
10.2
12.3
12.2
12.0
12.1
12.3
1 Calculated by chain-linked volumes, ESA 2010, sppy – same period of previous year. 2real GDP per 1 employee. 3 Based on Harmonized Index of Con-sumer Prices (HICP); sppy = 100. 4Based on Labour Force Survey (LFS). 5In 2011, the number of employees was corrected, so it is not possible to calcu-late year-on-year increase of employees in period 2010/2011. Source: Statistical Office of SR, MF of SR, Eurostat database.

22
* * * *
Probably the most important of what happened in 2014 in the Slovak
economy is that parallel slight acceleration of economic growth occurred
with favorable changes in macro-stability and especially the parameters
of employment and income. Thereby, we do not consider reached level
as satisfactory or development of these indicators to be smooth; for now,
we can consider it as simultaneous development of some indicators in
favorable direction. The nature of economic growth has changed in com-
parison to previous years: enhanced growth was driven by domestic
market (domestic demand), while in the previous periods was depend-
ent on external demand. Following chapters provide partial views on the
changes in development trends. The outlook at the end of the publication
aims to provide answer to the question whether such trends can be sus-
tainable or they will change in near future.

23
2. QUALITATIVE FACTORS OF ECONOMIC DEVELOPMENT
Technological and innovative development of the Slovak economy,
currently based on the import of foreign technology, should be compen-
sated by more intensive development of domestic innovation capacity. It
should be based on efficient domestic research and development (R&D),
educated and sophisticated labour force, and the use of information and
communication technologies (ICT). These qualitative prerequisites of the
economic development will be crucial condition of national competitive-
ness enhancement, higher evaluation of labour, the economic growth and
employment once the price and costs factors will be exploited. T a b l e 2.1
Selected Indicators of Research and Development, 2008 – 2013
2008 2009 2010 2011 2012 2013
Funding of R&D:
Gross R&D expenditure (% GDP) 0.46 0.47 0.62 0.67 0.81 0.83
Divided by sector of performance (%
GDP):
Government sector 0.15 0.16 0.19 0.18 0.20 0.17
Business enterprise sector 0.20 0.20 0.26 0.25 0.34 0.38
Higher education sector 0.11 0.12 0.17 0.23 0.28 0.27
Divided by source of funds (% GDP):
Government sector 0.24 0.24 0.31 0.33 0.31 0.32
Higher education sector 0 0 0 0.01 0.01 0.02
Business enterprise sector 0.16 0.17 0.22 0.23 0.31 0.33
Abroad 0.06 0.06 0.09 0.1 0.15 0.15
R&D personnel1 23 641 25 388 28 128 28 596 28 880 27 823
Outputs of R&D:
Domestic patent applications2 167 176 235 223 168 184
Number of patent applications2 per
1,000 R&D employees 7.1 6.9 8.4 7.8 5.8 6.6
Number of EPO applications 54 41 53 85 52 51
Number of articles in top 10% journals3 577 611 633 641 723 660
1 Head Count by 31st December. 2 Domestic patent applications filed at the Industrial Property Office of the Slovak Republic. 3 Number of scientific papers in 10 % of most cited world journals by citing database SCOPUS.
Source: IPO SR (2015); OECD (2015); Yearbook of S&T (2014); EPO (2015).

24
Table 2.1 shows the development of selected input indicators (expendi-
tures on R&D and R&D employees) and output indicators (domestic patent
applications and research papers) of Slovak R&D in 2008 – 2013.6
The key indicator of innovative development, gross expenditures on
R&D experienced some stagnation in its growth, amounting to 0.83 % of
GDP7 in 2013. Comparing to relatively optimistic year-on-year growth in
2011/2012, it meant weakening of dynamics in desired increase of R&D
expenditures. Lagging of Slovakia in R&D funding persists and remains
one of the main limiting factors of innovative development. In 2013, the
intensity of Slovak R&D was only 41 % of the EU average.
The structural weakness of Slovak scientific research system is the
high share of public sector (in terms of funds and sources of gross ex-
penditures on R&D). The positive of 2013 (as well of 2012) was contin-
ued growth of expenditures share allocated to business sector (0.38% of
GDP), while both components of the public sector (government + higher
education sector) experienced a fall in R&D intensity.
In terms of sources funding, the share of two sectors – business and
non-business (government, public and higher education) gradually
equalized in 2013. In 2013, after long time (last in 2003), the share of
business funds for R&D (40 %) are higher than funds from public re-
sources (39 %). The share of foreign sources of R&D funding is the same
as in 2012; 0.15 % of GDP, being still relatively low value among the EU
countries. A potential of foreign resources increase might be seen in
higher rates of international cooperation utilization of Slovak R&D and in
increased inflow of business R&D investment from abroad (average
share of foreign funds in R&D financing in the EU is 0.19 % of GDP; in
small open economies of the EU is this value placed higher). The share of
universities resources on R&D still remains low, due to their status, fund-
ing methods, as well as insufficient ability to create their own resources
(e.g. commercialization of research results) that could be used on their
own R&D.
6 Some indicators published in this chapter are 2 years lagged. 7 This value is provided by Eurostat, Statistical Office of SR in Yearbook of Science and Technology
provides a slightly higher intensity; 0.85 %. In this chapter, we utilize data reported by Eurostat.
25
Also in this evaluation year, the dominance of the EU funds in the fi-
nancing of Slovak R&D persists mostly due to implementation of Opera-
tional Programme Research and Development and Operational Pro-
gramme Competitiveness and Economic Growth. The investments main-
ly flow into physical infrastructure development and reducing deficits of
instrument and ICT equipment. Interventions are focused on the devel-
opment of large number of existing or new institutional platforms of
R&D (centers of excellence, competence centers or science parks). The
result is, in terms of Slovakian circumstances, supernumerary institu-
tional R&D network.
Another key factor, beside expenditures on R&D, indicating potential
for development as a driver of innovation is the number of scientific re-
searchers in the economy. A negative phenomenon of 2013 was the de-
cline in R&D personnel, mainly due to the headcount reduction in natu-
ral, technical, medical, pharmaceutical and agricultural sciences. On the
other hand, the number of employees increased in the social and human
sciences. The decrease in total number of researchers was also reflected
in relative decline of its share in employment (5 % decrease compared to
2012; the EU recorded increase by 2 %). Figure 2.1 shows the proportion
of researchers on total employment in selected countries of the EU 28.
The characteristic feature of the Slovak economy, beside low proportion
of researchers in total employment, is also the sector of higher education
being disproportionately represented. The share of business R&D ex-
penditures in employment is still the lowest one in V4.
The main limiting factor, in terms of potential innovative performance
is long-term poor patenting activity. The patenting activity measured by
the number of domestic patent applications slightly increased in 2013
compared to 2012. The number of applications was 184, reflecting the
increase in patent productivity, which came to 6.6 domestic patent appli-
cations per 1,000 R&D staff. R&D performance measured by the number
of publications in the 10% most cited scientific journals decreased, how-
ever, it is still the second highest one in past six years.

26
F i g u r e 2.1 R&D Employees in Slovakia and Selected Economies of the EU in 2013 (total employment share)
Source: Own compilation based on Eurostat database (2015).
Among key determinants of the economic development belongs edu-
cation. In particular, a higher education is a prerequisite for quality hu-
man capital, thus also improvement of innovation performance.
Table 2.2 lists selected non-financial indicators of the education sys-
tem. The first two indicators represents Europa 2020 objectives – reduc-
tion of early leavers in schools and increase the share of population with
tertiary education. A certain downside is slowly increasing population of
early school leavers, it was 6.6 % in 2014 (preliminary data). The target
value for Slovakia is to stabilize this value on 6 % by 2020. On the con-
trary, the growing trend was experienced in the share of 30 – 34 years
population with tertiary education (27 % in 2014; preliminary data). The
target value for Slovakia (and for the EU 28 as well) is 40 %. In terms of
potential human capital creation, it is important that the economy would
have a high proportion of graduates in mathematics, natural and tech-
nical sciences. In this area, Slovakia still slightly lags behind the EU aver-
age (90 %). Slovakia is among the countries with a high proportion of
university students studying in another European country. The share of
0.67
0.16
0.68 0.56 0.19
1.37 1.24 1.2 0.17
0.15
0.24 0.2
0.14
0.06 0.26 0.07
0.4
0.43
0.33
0.21
0.27
0.74 0.64
0.45
0,0
0,5
1,0
1,5
2,0
2,5
EU 28 Slovakia CzechRepublic
Hungary Poland Denmark Finland Sweden
Business sector Government sector Higher education sector

27
Slovakian students studying abroad is several times higher than the EU
average (SVK 14.3 %; EU 3.5 %). Although we have data only up to 2012,
a growing trend is evident. Such a high proportion is specific within the
V4 (other V4 countries have the share even less than the EU average).
T a b l e 2.2 Selected Non-financial Indicators of Education
2006 2007 2008 2009 2010 2011 2012 2013 2014
Share of population with early school leave in cohort 18 – 24 years (%)
EU 28 15.3 14.9 14.7 14.2 13.9 13.4 12.7 11.9 11.3
Slovakia 6.6 6.5 6 4.9 4.7 5.1 5.3 6.4 6.6
Share of 30 – 34 years old population with tertiary education (%)
EU 28 . . 31.2 32.3 33.6 34.7 35.9 36.9 37.6*
Slovakia . . 15.8 17.6 22.1 23.2 23.7 26.9 27.0*
% of mathematic, nature and technological sciences (ISCED 5-6) in total graduates (%)
EU 28 22.3 22.2 21.9 22.1 22.1 22.5 22.8 . .
Slovakia 23.6 23.4 20.8 20.6 20.8 20.3 20.6 . .
% of students studing abroad
EU 28 2.6 2.7 2.7 2.8 3.1 2.9 3.5 . .
Slovakia 10.2 10.2 10.7 11.4 12.5 13.4 14.3 . .
Participation in lifelong education (% of 25 - 74 years old)
EU 28 8.5 8.3 8.4 8.3 8.1 7.9 8.1 9.4 9.5*
Slovakia 3.7 3.6 3.0 2.5 2.5 3.5 2.7 2.6 2.6*
Source: Eurostat database (2015), . – data not available.
In the long term, this cound mean a risk and significant weakening of
development factors in Slovakia (brain drain). Slovakia lags behind the
EU 28 in participation on lifelong education (27 % of educated among 25
– 74 years old). This could be a barrier not only for innovative progress
and desired structural changes, but also for solving the problems of the
labour market.
The development of knowledge based society is largely subject to dy-
namic use of ICT in all spheres of society. Table 2.3 presents some indica-
tors of ICT penetration into society (households, businesses and public
administration). The number of households with internet access in-
creased in Slovakia. In 2014, the growth stopped at the same value as in
2013, 78 % is a value very close to the EU 28 average. Digital literacy,
which can be derived from the share of citizens who frequently (daily)
use internet, slightly grew in 2014 to level of 62 %, almost reaching the

28
EU 28 average (65 %). In terms of new ICT infrastruction creation, Slo-
vakia got closer to the EU 28, when number of households with access to
broadband internet was 76 % (the EU average is 78 %).
T a b l e 2.3 Selected Indicators of ICT penetration into Society (%)
2008 2009 2010 2011 2012 2013 2014 EU
in 2014
Share of households with Internet
access
58
62
67
71
75
78
78
81
Share of citizens who regularly
use the Internet
44
49
58
56
60
61
62
65
Share of households with broadband
Internet connections
35
42
49
55
72
70
76
78
Share of citizens who use the Internet
to interact with public administration
40
38
50
48
42
33
57
47
Share of citizens who use the Internet
banking
24
26
33
34
40
39
41
44
Share of citizens who use the Internet
for e-commerce
13
16
19
23
30
30
31
41
Share of business revenues from
e-commerce in total revenues
8
11
11
16
12
18
13
15
Source: Eurostat database (2012).
ICT use in the business sector, measured as the share of business rev-
enues from e-commerce in total revenues decreased to 13 % in 2014.
However, we may conclude that use of ICT in business sphere in Slovakia
(in internal processes, customer or public administration communica-
tion) is relatively broad and in comparison to the EU 28 is above average
standards. In 2014, ICT use in Slovakia prevails in business sector rather
than in households.
In the annual assessment of national competitiveness, the World Eco-
nomic Forum (WEF, 2015) also evaluates qualitative factors of competi-
tiveness – education, technological readiness, and innovation. According
to latest report of WEF about overall competitiveness, Slovakia ranked
75th out of 148 countries and again, after one year outage returned back
to a group of economies whose development is according to WEF method-
ology driven by innovation (a group of 37 countries). Slovak higher educa-
tion and training ranked 56th (improvement by 2 ranks), Technological

29
readiness 52nd (same as in 2013) and Innovation 78th (improvement by
17 ranks). Within the higher education and training quality pillar, the
highest-ranking indicators were Internet access in schools (31st), Avail-
ability of specialized research and training services (45th) and education
enrollment rate (51th). The lowest ranking indicators were Quality of
education system (125th) and Quality of management schools (102nd).
In the Technological readiness pillar, significant ranking improvement
was in FDI indicators and technology transfer (18th, improvement by 7
ranks). Relatively well performing ranking indicator was Internet use
(26th) and Number of broadband mobile internet (36th). In the Innova-
tion pillar, Slovakia had relatively good international position in PTC pa-
tents (39th) and Quality of scientific research institutions (65th). The
lowest ranking indicators of innovative development were Government
procurement of advanced technology products (117th) and Innovative
capacity (89th). With regards to the Government procurement of ad-
vanced technology products being an active innovation policy instru-
ment, Slovakia ranks among developing economies. In most indicators
about innovation, Slovakia ranks in worse part of evaluated economies.
On the other hand, Technology transfer of FDI is the best evaluated fac-
tor, from the ones listed above. This indicates ongoing model of techno-
logical and economic catching up process of the Slovak economy.
Figure 2.2 shows the evolution of selected indicators of innovation
and technological development in Slovakia by WEF.
The basic overview of the Slovak economy structure in terms of technol-
ogy and knowledge intensive factors is provided in Table 2.4. Despite the
lack of (quantitative and qualitative) national factors (R&D/education), we
can observe quite comparable structure in some ways of the Slovak econ-
omy. In recent period it was mainly the employment in high/medium-
high industries that reached/outperformed the EU 28 average. The dis-
tance between the Slovak export oriented industries with high level
technology decreased compared with the EU 28 average (52 % in 2012
to 62 % in 2013). The share of knowledge-intensive activities (i.e. indus-
tries with at least 33 % share of university graduates), which is one of

30
national objectives of the Europe 2020 was at 85 % level of the EU 28
average.
F i g u r e 2.2 Development of Some WEF Qualitative Indicators of the Slovak Economy
Source: WEF (2015).
T a b l e 2.4 Selected Indicators of Technological Intensity in Slovak economy
2008 2009 2010 2011 2012 2013
Knowledge intensive activities
(% of total employment)
EÚ 28 34.0 35.0 35.2 35.5 35.6 35.6
Slovakia 28.0 29.1 30.3 30.5 29.8 30.1
Knowledge intensive activities – Business
services (% of total employment)
EÚ 28 13.2 13.4 13.4 13.6 13.8 13.8
Slovakia 10.0 10.1 10.1 10.4 10.1 9.6
Employment in high level technolo-
gy sectors
(% of total employment)
EÚ 28 3.7 3.7 3.7 3.8 3.9 3.9
Slovakia
3.6
3.5
3.8
4.1
4.0
3.6
Employment in sectors with high and
medium-high technology
(% of total employment)
EÚ 28 5.9 5.6 5.6 5.6 5.6 5.6
Slovakia
10.2
8.6
8.6
9.7
10.2
9.8
Export industries with high technologies
(% of total exports)
EÚ 28 15.4 17.1 16.1 15.4 15.7 15.3
Slovakia 5.2 5.9 6.6 6.6 8.2 9.5
Source: Eurostat (2012).
* * * *
72 71
81 86 90 97
90
70 65
30 36
56
80 87
104 100 93
84
47 52
46 44 40
49
59
70
50
3 3 3 4 5 6 9
26 18
-
20
40
60
80
100
120
2006 2007 2008 2009 2010 2011 2012 2013 2014
Research institutions quality Universities and industries cooperation
Latest technologies availability FDI and technological transfer
Ran
k
31
When evaluating the previous period, even now, we cannot state any
significant change in the development of qualitative factors of the eco-
nomic development. The negative was a stagnation in the growth of R&D
share and decline in R&D personnel (in absolute and relative terms). The
unsuitable structure of R&D personnel with weak representation of
business sector is persisting structural deficiency of Slovak R&D. A con-
tinuing moderate growth of the business sector in R&D funding might be
the beginning of changes in structure of R&D funding. However, the de-
sired effect will not be achieved without an absolute expenditure growth
(either in business sector or total one). A continuing convergence can be
observed in the field of ICT penetration. In terms of knowledge and tech-
nological intensity of the Slovak economy, a positive development was
noted in share of knowledge-intensive activities and export industries
with high technology. There is also a positive situation in employment
within high and medium-high technology sectors. Such relatively favora-
ble structure is rather due to the impact of FDI than the national quality
factors. In 2014, the economic development indicates (changing the na-
ture of economic growth sources or decline in FDI inflows) possible
weakening of existing innovation and technological catching up factors –
imports of complete technologies from abroad. This can cre-
ate a pressure on efficient domestic R&D and innovation system, which
should become one of the key factors of the economic growth.
32
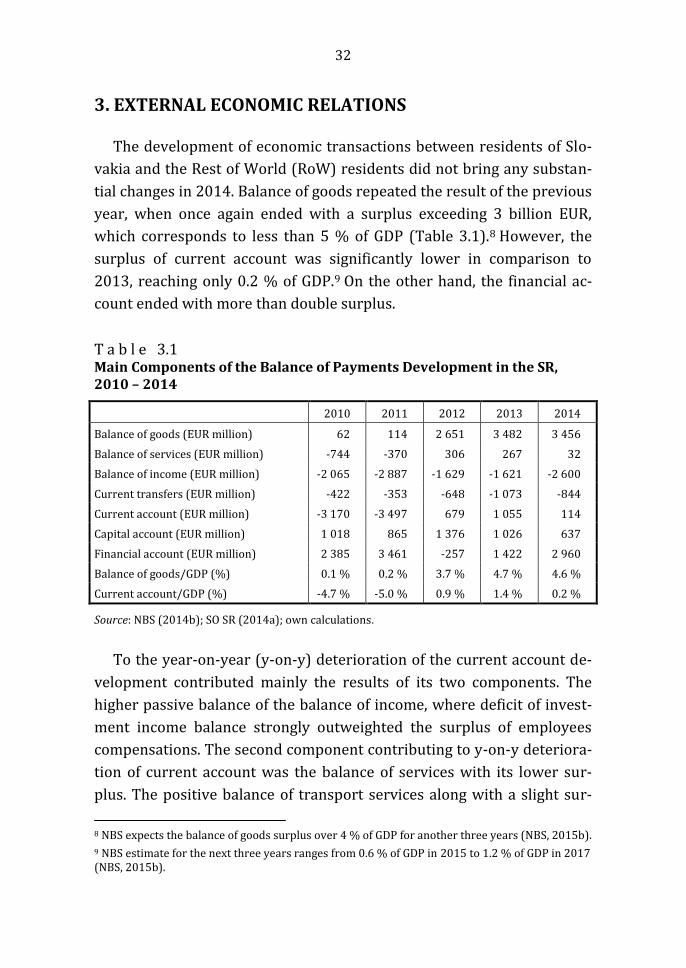
3. EXTERNAL ECONOMIC RELATIONS
The development of economic transactions between residents of Slo-
vakia and the Rest of World (RoW) residents did not bring any substan-
tial changes in 2014. Balance of goods repeated the result of the previous
year, when once again ended with a surplus exceeding 3 billion EUR,
which corresponds to less than 5 % of GDP (Table 3.1).8 However, the
surplus of current account was significantly lower in comparison to
2013, reaching only 0.2 % of GDP.9 On the other hand, the financial ac-
count ended with more than double surplus.
T a b l e 3.1 Main Components of the Balance of Payments Development in the SR, 2010 – 2014
2010 2011 2012 2013 2014
Balance of goods (EUR million) 62 114 2 651 3 482 3 456
Balance of services (EUR million) -744 -370 306 267 32
Balance of income (EUR million) -2 065 -2 887 -1 629 -1 621 -2 600
Current transfers (EUR million) -422 -353 -648 -1 073 -844
Current account (EUR million) -3 170 -3 497 679 1 055 114
Capital account (EUR million) 1 018 865 1 376 1 026 637
Financial account (EUR million) 2 385 3 461 -257 1 422 2 960
Balance of goods/GDP (%) 0.1 % 0.2 % 3.7 % 4.7 % 4.6 %
Current account/GDP (%) -4.7 % -5.0 % 0.9 % 1.4 % 0.2 %
Source: NBS (2014b); SO SR (2014a); own calculations.
To the year-on-year (y-on-y) deterioration of the current account de-
velopment contributed mainly the results of its two components. The
higher passive balance of the balance of income, where deficit of invest-
ment income balance strongly outweighted the surplus of employees
compensations. The second component contributing to y-on-y deteriora-
tion of current account was the balance of services with its lower sur-
plus. The positive balance of transport services along with a slight sur-
8 NBS expects the balance of goods surplus over 4 % of GDP for another three years (NBS, 2015b).
9 NBS estimate for the next three years ranges from 0.6 % of GDP in 2015 to 1.2 % of GDP in 2017 (NBS, 2015b).

33
plus in the balance of tourism almost balanced with the deficit in the cat-
egory of “other services together”. Slightly lower deficit in comparison to
the previous year was noted in the current transfers category mainly due
to the development of government transfers, where the y-on-y growth of
revenue and a decrease of expenditures occurred.
Foreign Trade with No Significant Change
After a gradual slowdown of foreign trade dynamics in the past two
years, only slight y-on-y increase in exports and imports occurred in
2014. Relatively weak GDP growth, similar to year 2013, meant the stabi-
lization of export performance and import intensity of the Slovak econ-
omy (i.e. the ratio of export or import to GDP). The exports and imports
continued in y-on-y growth in the first quarter only; in the following
quarters, a stagnation or even decline were experienced in both cases
(Figure 3.1).
F i g u r e 3.1 Year-on-year Growth Rates of Exports and Imports (left axis, %) and Foreign Trade Balance (right axis, EUR million) in Individual Quarters of 2007 – 2014
-1000
-500
0
500
1000
1500
-40
-30
-20
-10
0
10
20
30
40
50
60
1Q
20
07
2Q
20
07
3Q
20
07
4Q
20
07
1Q
20
08
2Q
20
08
3Q
20
08
4Q
20
08
1Q
20
09
2Q
20
09
3Q
20
09
4Q
20
09
1Q
20
10
2Q
20
10
3Q
20
10
4Q
20
10
1Q
20
11
2Q
20
11
3Q
20
11
4Q
20
11
1Q
20
12
2Q
20
12
3Q
20
12
4Q
20
12
1Q
20
13
2Q
20
13
3Q
20
13
4Q
20
13
1Q
20
14
2Q
20
14
3Q
20
14
4Q
20
14
Balance Exports (year-on-year change) Imports (year-on-year change)
Source: Based on NBS data (2015a).

34
The weakening of EUR/USD10 exchange rate which has occurred in re-
cent months could encourage export from Slovakia to certain countries
outside the Euro area, e.g. in case of Slovakia’s largest car manufacturer
Volkswagen, which exports, beside others markets, also to the USA. The
exchange rate development of single European currency against US dol-
lar will also reflect in increase of import prices; not only from the USA,
but also from other countries, where trades are done in USD.
As shown in Figure 3.2 and 3.3, the EU share in the Slovak foreign trade
(exports and imports) was similar to the previous period in 2014. More
than four fifths of the Slovak export were accounted to the EU member
states (about 84 %). To the Euro area countries (EMU) goes 46 % of the
total SR export, out of which almost half to Germany (Figure 3.2).
F i g u r e 3.2 Development of Teritorial Exports Structure (EUR million)
0
10 000
20 000
30 000
40 000
50 000
60 000
70 000
2002 2003 2004 2005 2006 2007 2008 2009 2010 2011 2012 2013 2014
Total exports EU 28
EMU V3 (CR, Poland, Hungary)
Germany CR
Russia China
Source: Based on NBS data (2015a).
10
The reasons of such development are elaborated in chapter 4.

35
An important place, among export markets of Slovakia, continues to
be neighboring economies of the Czech Republic, Poland and Hungary
(V3) whose share is more or less stable (27 % in 2014) and almost half
of this export goes to the Czech Republic. The share of China in total ex-
ports from Slovakia, as the most important Asian market, is above 2 %,
but does not continue to grow yet. The share of the Russian Federation
decreased to 3.2 % in 2014, while in the second half of the year was kept
below 3 %. This may be result of its economy fall, as well as deteriorating
relations between the EU and Russia .11
F i g u r e 3.3
Development of Territorial Structure of Imports (EUR million)
0
10 000
20 000
30 000
40 000
50 000
60 000
70 000
2002 2003 2004 2005 2006 2007 2008 2009 2010 2011 2012 2013 2014
Total imports EU 28EMU V3 (CR, Poland, Hungary)Germany CRRussia China
Source: Based on NBS data (2015a).
11
In summer of 2014, Russia introduced the embargo on the import of certain groceries from the EU countries, but also from the USA and Canada. It was a retaliation for sanctions that Western countries have imposed on Russia for the annexation of the Crimea and its next moves related to the armed conflict in eastern Ukraine. The Russian market can be classified as major outlet for Slovak production of passenger cars (especially for KIA Motors and Volkswagen), as well as con-sumers electronics. The Slovak economy is dependent on supplies of Russian oil and gas and also very open to other larger European economies, which may experience more direct impact of Russian sanctions than Slovakia. In case of sanctions expansion and their continuation, as a result of tense relations between the EU and Russia, the direct and indirect effects could not become negligible (not only) for SR foreign trade (export and import).

36
The EU has systematically lower share on the total imports of Slovakia
than on total exports. It is less than two-thirds. Imports from the Euro
area accounts for 40 %, of which more than a third is import from Ger-
many (15 % of total imports). The country with the second highest share
of Slovak imports is the Czech Republic (10 % in 2014) and third one is
Russia (8 %).12 China and South Korea are slowly catching up to Russia
in terms of export volumes to Slovakia.
In 2014, the commodity structure of Slovak exports and imports con-
tinued in the trend from the previous years with the highest share of ma-
chinery (33 % share in exports, 31 % in imports) and transport equip-
ment (26 % share in exports, 13 % in imports) in the foreign trade total
(SO SR, 2015). The third highest share of exports reached basic metals
and their products (10 %), and mineral products in imports (12 %). In
year-on-year comparison, the highest growth rate in exports was weapons
and ammunition category and in imports works of art category. A rising
trend was also noted in footwear and textiles categories. However, the
shares of these commodity groups in the SR foreign trade total, and
hence their contributions to the year-on-year growth, are small.
Foreign Capital
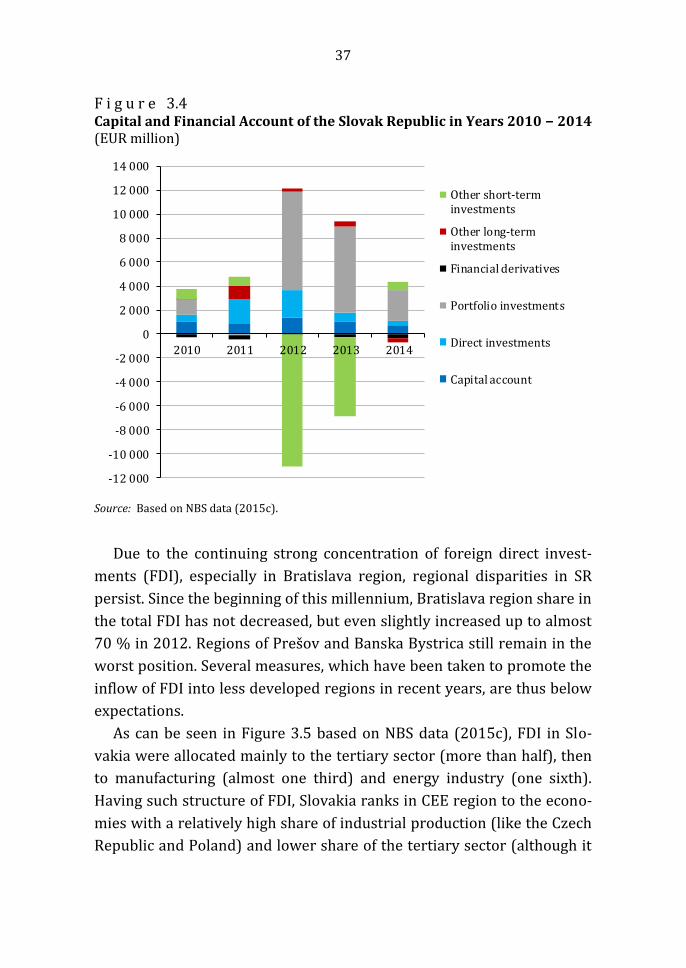
A closer look at the financial account of the balance of payments re-
veals items which contributed to a different development in 2014, com-
pared with previous two years. While other long-term investments expe-
rienced, after a few years, negative balance again, the other short-term
investments ended up with positive balance in contrast to the years
2012 and 2013 (Figure 3.4). Net inflows of direct investments was relat-
ed mainly to relatively high volume of reinvested earnings in the Slovak
Republic probably due to positive expectations of investors. Although
direct or portfolio investments did not overcome the amouth of their
positive balance from the previous year, due to net inflows in other in-
vestment , the financial account ended up with a higher surplus.
12 This fact confirms high risks for Slovakia as a result of tense relations between the EU and Russia.
37
F i g u r e 3.4 Capital and Financial Account of the Slovak Republic in Years 2010 − 2014 (EUR million)
-12 000
-10 000
-8 000
-6 000
-4 000
-2 000
0
2 000
4 000
6 000
8 000
10 000
12 000
14 000
2010 2011 2012 2013 2014
Other short-terminvestments
Other long-terminvestments
Financial derivatives
Portfolio investments
Direct investments
Capital account
Source: Based on NBS data (2015c).
Due to the continuing strong concentration of foreign direct invest-
ments (FDI), especially in Bratislava region, regional disparities in SR
persist. Since the beginning of this millennium, Bratislava region share in
the total FDI has not decreased, but even slightly increased up to almost
70 % in 2012. Regions of Prešov and Banska Bystrica still remain in the
worst position. Several measures, which have been taken to promote the
inflow of FDI into less developed regions in recent years, are thus below
expectations.
As can be seen in Figure 3.5 based on NBS data (2015c), FDI in Slo-
vakia were allocated mainly to the tertiary sector (more than half), then
to manufacturing (almost one third) and energy industry (one sixth).
Having such structure of FDI, Slovakia ranks in CEE region to the econo-
mies with a relatively high share of industrial production (like the Czech
Republic and Poland) and lower share of the tertiary sector (although it

38
represents more than 50 % of Slovak FDI) in total inflow of FDI yet. The
dominant FDI within the service sector is a financial intermediation fol-
lowed by wholesale and retail. Financial and insurance activities
achieved higher share of FDI in tertiary sector among the CEE countries
only in Slovenia and slightly lower share in the Czech Republic. Accord-
ing to Eurostat (2015), FDI oriented on manufacturing are represented
by metals and metal products (one third), a quarter share of petroleum
products, chemicals and pharmaceutical products. Production of motor
vehicles is represented by one fifth.
F i g u r e 3.5 Structure of FDI by Branches (as at 31. 12. 2012)
Manufacturing31.0 %
Electricity, gas, steam and air supply
16.8 %
Construction1.7 %
Wholesale and retail; repair of motor
vehicles and motorcycles
9.9 %
Transportation and storage0.8 %
Information and communication
4.2 %
Financial and insurance activities
23.0 % Real estate activities6.3 %
Professional, scientific and
technical activities3.8 %
Administrative and support services
2.0 %
Others0.6 %
Source: Based on NBS data (2015c); own calculations.
The Increase in Foreign Exchange Reserves of the National Bank of Slovakia
An inseparable part of the annual balance of payments is the change
in foreign exchange reserves of a central bank (reserve assets). They play
a key role in international liquidity and also serve to balance the imbal-
ance. In 2014, NBS foreign exchange reserves grew to more than 2.6 bil-
lion USD (Figure 3.6). Having such a growth, they reached the highest

39
level since 2009, also given the active balance of payments. At the end of
2014, almost 50 % of the reserves accounted for the oldest part of for-
eign reserves – gold reserves.13 A quarter of reserves accounted for
a foreign exchange (mainly securities and in less extent also cash and
deposits), 18 % holdings of SDR (Special Drawing Rights) and 11 % re-
serve position on International Monetary Fund.
F i g u r e 3.6
Development of NBS Foreign Exchange Reserves (USD million)
0
2 000
4 000
6 000
8 000
10 000
12 000
14 000
16 000
18 000
20 000
2004 2005 2006 2007 2008 2009 2010 2011 2012 2013 2014
Gold SDR Hold Reserve position in IMF Securities Cash and deposits
Source: Based on NBS data (2015c).
As it is evident from Figure 3.6, the entry into the Eurozone in 2009
caused significant change in the volume and structure of foreign ex-
change reserves of NBS. With regards to the statistical requirements of
the European Central Bank (ECB) on the European System of Central
Banks (ESCB) in the field of balance of payments and foreign exchange
13
In 2014, the proportion of gold reserves to NBS foreign exchange reserves was the lowest since Slovakia’s integration into the Euro area. The development of its market share more or less mir-rored the development of the gold price, so until 2012 the share grew and then decreased for another two years. At the end of 2014, the NBS foreign exchange reserves contained gold valued at 1.22 billion USD.

40
reserves, NBS changed the methodology of reporting foreign exchange
reserves. As of 1st January 2009, only foreign assets in foreign currency
(i.e. other than the euro) on non-residents of the eurozone could be con-
sidered for foreign exchange reserves of the NBS. Comparing to the
methodology applied in foreign exchange reserves prior the entrance to
the Euro area, there was (regarding previously given high proportion of
assets denominated in the euro) a significant reduction in the volume of
foreign exchange reserves (NBS, 2009).
At the same time, one of the tasks of the Eurosystem (consisting of the
ECB and the national central banks of the EU countries that have adopt-
ed the euro) is to conduct foreign exchange operations, keep and manage
the official reserves of the Euro area countries. Even NBS had to contrib-
ute to the ECB’s foreign reserves (forward to the central bank part of its
own reserves) once the country entered the Euro area. In exchange, NBS
received interest bearing claims on the ECB, denominated in euro, in
volume corresponding to the total amount of its contribution to foreign
exchange reserves.
Ongoing Growth of Foreign Debt
Foreign (external) debt of the SR, i.e. debt of domestic entities to for-
eign ones, is gradualy increasing (Figure 3.7). The adoption of euro in
2009 also reflects on its development by significant increase in short-
term external debt of NBS. It did not use existing foreign exchange re-
serves to cover their liabilities to domestic commercial banks, but bor-
rowed funds from the Eurosystem. Consequently, the share of gross for-
eign debt to GDP exceeded the internationally accepted limit of 60 % in
2009 (Kyjac, 2014).
Gross external debt of Slovakia increased also in the following period,
including 2014, when it reached over 66 billion EUR, representing 88 %
of GDP. Out of it, 70 % consist from long-term debt (mostly government
debt) and the rest of the debt is a short-term one. In comparison with the
previous year in absolute terms, most significant increase of long-term
and short-term debt was recorded in Government and NBS, in relative
terms, also in case of both long-term and short-term debt of banks. The

41
foreign debt of other sectors has stabilized. Given the fact of relatively
fast pace of increase in foreign debt and persisting risks of its future de-
velopment, it is necessary to pay increased attention to all factors that
influence foreign debt. Of course, while assessing the evolution of debt, it
is necessary to take into account the purpose and the usage efficiency of
borrowed resources.
F i g u r e 3.7 Development of Slovakia’s Foreign Debt (EUR million)
0
10 000
20 000
30 000
40 000
50 000
60 000
70 000
2004 2005 2006 2007 2008 2009 2010 2011 2012 2013 2014
Short-term debt – Other sectorsShort-term debt – BanksShort-term debt – Government and NBSLong-term debt – Other sectorsLong-term debt – BanksLong-term debt – Government and NBS
Source: Based on NBS data (2015a).
* * * *
While in the past “post-crisis” years the foreign trade was a growth
driver of the Slovak economy, the export lost its dynamics in 2014, which
resulted in reducing the contribution of foreign trade to GDP growth.
However, the foreign trade contributed to the favorable development of
macroeconomic stability in 2014, when the balance of goods retained
positive balance from the previous years (nearly 5 % of GDP). In the
event that economic recovery in the Euro area occurs in context of ECB
monetary policy, which would positively influence foreign demand of
Slovak business partners, such favorable development of foreign trade
balance could continue in the following years.

42
4. EUROPEAN CENTRAL BANK MONETARY POLICY AND
THE EURO AREA DEVELOPMENT FROM THE SLOVAK
REPUBLIC POINT OF VIEW On January 1st 2014, five years have passed since the adoption of the
single European currency in Slovakia and on May 1st of the same year a
decade from the Slovak Republic entrance into the European Union (EU).
The involvement in the integration process in Europe has brought not
only benefits and a favorable environment for further development of
the Slovakian economy, but also a number of obligations, constraints,
challenges and risks.14
The EU economy has still not overcome crisis and situation in sever-
al of its member states remains extremely unfavorable. Despite the
strongly expansionary monetary policy of the ECB, the euro area econo-
my more or less stagnates after two overcame recessions and experienc-
es low inflation (or deflation). The challenges and problems of different
countries and those at the EU level (indebtedness of government and
private sector, unemployment and others) and new growing risks be-
yond its borders are added, including tense relations with Russia.
The chapter pays attention to monetary policy of the ECB, which sig-
nificantly interferes with development in the euro area and its member
states in recent years. The chapter also deals with expectations and actu-
al problems associated with current, extremely loose monetary policy.
Furthermore, we are dealing with current situation in the Euro area,
which remains fragile and uncertain; a continued deepening of European
integration and approaching, historically the first Slovak presidency in
the EU Council in the second half of 2016.
Loose monetary policy of the ECB
While at the beginning of the financial crisis, the ECB was more or
less in seclusion, later it responded to the situation by taking a number of
14
The analysis of the Slovak membership in the EU and the Euro area is provided in the publica-tion Šikulová et al. (2014).

43
non-standard measures to support sluggish economy of the euro area. In
addition to the changes in interest rates, the longer-term refinancing op-
erations, purchases of selected assets and provision of liquidity to banks
in monetary union was carried out.
During the year 2014, the ECB responded to continuing unfavorable
economic situation in the euro zone accompanied by low inflation (even
deflation) by another two reductions of the key interest rate. The first
reduction, from 0.25 % to 0.15 % was realized in June, the second one,
by a further 10 basis points in September (Figure 4.1). Since then, the
key interest rate is at its lowest level in history of the ECB. It is not just
below the rate of Bank of England, but also below the rate of US Federal
Reserve where, in contrast with the ECB, a gradual tightening of mone-
tary policy is expected.
F i g u r e 4.1 Key Interest Rate development in euro area (ECB), in Great Britain (Bank of England) and in USA (Federal Reserve System)
Source: Based on ECB, BoE, Fed.
0
1
2
3
4
5
6
I.0
7
V.0
7
IX.0
7
I.0
8
V.0
8
IX.0
8
I.0
9
V.0
9
IX.0
9
I.1
0
V.1
0
IX.1
0
I.1
1
V.1
1
IX.1
1
I.1
2
V.1
2
IX.1
2
I.1
3
V.1
3
IX.1
3
I.1
4
V.1
4
IX.1
4
I.1
5
V.1
5
ECB BoE Fed

44
Along with last year’s reductions in the key ECB interest rate, another
reduction of deposit interest rate took place (deposit facility) to a new his-
torical minimum. In June 2014, the deposit interest rate got into negative
numbers for the first time at level -0.10 %, and in September down to -
0.20 %. Thus, the European banks do not just receive any interest if they
deposit their excessive funds in the ECB like in previous two years, but
they have to pay for these safe deposits to the ECB. By this approach, the
ECB tries to motivate commercial banks to lend their excessive funds to
private sector (and stimulate economic growth) and not to deposit them
in the ECB itself. However, this ECB policy of low rates does not produce
desired results.
So far, the ECB tried to boost the economy through a number of non-
standard measures, which will be (or should be) just temporary ones. As
of June 2014, they include also Targeted Longer-Term Refinancing Oper-
ations – TLTRO planned for 2014 - 2016. They are aimed at bank loan
provision to non-financial private sector of the euro area. This is a new
form of LTRO (Long-Term Refinancing Operations) with aim to support
the real economy. In total, eight programs of TLTRO will be implemented
and all will be due in September 2018.
The ECB intended to contribute to the increase of liquidity in the
market and consequently support economic recovery and avert risk of
deflation by purchases of securities (consisting of bank loans packages)
type ABS (Asset Backed Securities). This might be considered as a form
of quantitative easing. This measure was criticized mainly by German
economists, who pointed out to the risk of possible low quality securities
purchase. That would lead to transfer of credit risk from commercial
banks to the ECB.
The existing measures of the central bank to deliver low-cost liquidi-
ty to financial markets did not meet optimistic expectations, as only a small
portion of funds was released into the real economy. Therefore in January
2015, the ECB approved the program of quantitative easing (QE), which
was launched in early March. It can be described as an unprecedented
step in the history. It will be realized via national central banks purchas-
es of government and corporate bonds in the amount up to 60 billion

45
EUR per month. The program should be in place at least until September
2016 (representing 1100 billion EUR of newly created money), or until
price level correction takes place to the level in line with ECB’s inflation
target right below 2 %. The ECB is interested in safe bonds with a ma-
turity from 2 to 30 years. Volumes of bond purchases by member states
will be derived from shares of national banks in ECB’s capital. In case of
Slovakia it is 0.77 %.
The aim of QE is like in previous ECB measures to combat deflation,
boost consumption and investment and thus the real economy, including
the creation of new jobs. While quantitative easing has been carried out
by several central banks (USA, Japan, Great Britain), significant differ-
ences are not just in differences among the economies, but also in timing
of this step, which might be considered in the eurozone as delayed. The
results of QE are highly likely to be different than e.g. in USA and optimis-
tic expectations may remain unfulfilled.
US Fed refrained from QE at the end of 2014 and due to favorable
development of economy, the rise of interest rate could be expected dur-
ing the year 2015. Fed’s monetary policy tightening along with further
monetary easing of the ECB creates a strong pressure on the EUR/USD,
which has dropped to nearly 12-years minimum and gets closer to the
parity where it was last seen in 2002 (Figure 4.2). The depreciation of
the euro might, on the one hand, boost economy through export from the
euro area countries. Many member states are highly opened economies,
but several of them have relatively low share of export to the countries
outside the euro area. This fact reduces the potential positive effects of
the euro's depreciation on the performance of monetary union econo-
my.15 On the other hand, the depreciacion of exchange rate has negative
effect on prices of goods and services imported from USA and some other
countries outside the euro area, which affects not only large importers,
but also regular consumers.
15
In recent years, the EUR/USD has repeatedly fell relatively sharply, while subsequently no significant recovery in the eurozone economy occurred.

46
F i g u r e 4.2 The Exchange Rate of USD/EUR since the Start of the Economic and Monetary Union
Source: Based on Eurostat database (2015).
Quantitative easing, as well as previous ECB measures of expansion-
ary monetary policy contributed to further reduction in interest rates. As
the short-term interest rates are on their technical minimum, currently,
the reduction of long-term interest rates takes place including interest
rates on 10-years government bonds of the euro area countries (Figure
4.3). Greece is an exception, where the situation is extremely tense.
Yields on 10-year bonds of PIGS countries ranged from 0.7 to 1.9 % in
April 2015, Slovak bonds were remunerated at 1.2 %. For some core
countries of the eurozone, especially Germany, but also Luxemburg,
Netherlands, Austria, Finland and France, the rates are very close to zero,
even negative in case of shorter maturities. Slovakia has already taken
place in this group. QE policy could also lead to cheaper loans for corpo-
rations and households in Slovakia, including mortgages, which are still
among the highest ones in the eurozone. Reduction of debt services costs
due to expansionary monetary policy of the ECB is not correspondent
with reality and may act as an disincentive for reform efforts of most
indebted countries in monetary union.
0,8
0,9
1
1,1
1,2
1,3
1,4
1,5
1,6
19
99
M0
1
19
99
M0
8
20
00
M0
3
20
00
M1
0
20
01
M0
5
20
01
M1
2
20
02
M0
7
20
03
M0
2
20
03
M0
9
20
04
M0
4
20
04
M1
1
20
05
M0
6
20
06
M0
1
20
06
M0
8
20
07
M0
3
20
07
M1
0
20
08
M0
5
20
08
M1
2
20
09
M0
7
20
10
M0
2
20
10
M0
9
20
11
M0
4
20
11
M1
1
20
12
M0
6
20
13
M0
1
20
13
M0
8
20
14
M0
3
20
14
M1
0

47
F i g u r e 4.3 Development of Interest Rates on 10-years Government Bonds in Selected Euro Area Members (%)
Source: Based on ECB database (2015).
The risks of QE include the excessive acceleration of inflation and thus
degradation of savings. In case of deposits in EUR, the degradation oc-
curs due to EUR/USD depreciation essentially even today. On the other
hand, savings of depositors denominated in USD are appreciating. Quan-
titative easing can also contribute to economy overheating and create
price bubbles in the markets, e.g. bubbles in the real estate market
through low interest rates on mortgage loans. At the same time, the de-
cline in bond yields can negatively affect the revenues of pension sav-
ings, because the pension companies invest in this type of debt securities
as well. The risks of the QE program also include the time and manner of
its completion and subsequent effect on the monetary union economy.
QE policy implementations have already encountered problems
stemming from the lack of bonds meeting criteria of the ECB, i.e. the
0
5
10
15
20
25
30
20
09
-01
20
09
-04
20
09
-07
20
09
-10
20
10
-01
20
10
-04
20
10
-07
20
10
-10
20
11
-01
20
11
-04
20
11
-07
20
11
-10
20
12
-01
20
12
-04
20
12
-07
20
12
-10
20
13
-01
20
13
-04
20
13
-07
20
13
-10
20
14
-01
20
14
-04
20
14
-07
20
14
-10
20
15
-01
20
15
-04
Cyprus Germany Spain Greece
Ireland Italy Portugal Slovakia

48
bonds should have yield higher than existing deposit interest rate of the
ECB (-0.20 %) with maturity of 2 – 30 years. These criteria reduce the
amount of bonds which qualify for ECB purchase, particularly for Ger-
many. Interests on bonds with two-years maturity is approaching
threshold -0.20 % also in case of Finland, Netherlands, Austria, Belgium
and France. Therefore, it is not certain if the ECB with currently applica-
ble criteria will meet planned volume of bond purchases during the peri-
od of QE program implementation, i.e. until September 2016.
Development in the Euro area Remains Complicated and Uncertain
The euro area is still unable to significantly boost economic growth,
reduce unemployment and stabilize the debt burden. The consolidation
is also complicated by low inflation or even deflation. The European
economy should be stimulated by investment package worth 315 billion
EUR, which was approved by the European Council in December 2014.
The package should involve funds from the European Investment Bank,
the EU, member states and private investors and banks. The investment
plan should be based on the three pillars, the first one is establishment of
the new European fund for strategic investments (June 2015), the sec-
ond one is creation of projects database and the third one the improve-
ment of investment climate. By 2017, funds should be mobilized for in-
vestments at least in amount of 315 billion EUR. They should be directed
to infrastructure, energy, research, innovation and the digital agenda.
However, planned investment package has already faced criticism, par-
ticularly with regard to its efficiency and availability of funds.
Among the member states of the euro area, the main focus in recent
months was on the country with the highest public debt – Greece, which
still faces the risk of insolvency. After two rescue programs worth in total
240 billion EUR realized since 2010, there is a chance it might need a third
package of aid. So far, the euro area agreed on four month extension of
the second rescue program, which was supposed to be completed in Feb-
ruary 2015. The price of negotiated extension for the Greek government
is waiver of a number pre-election promises and submission of reforms

49
list planned to be implemented. In order to release another tranche of
aid, the approval of reforms plan by creditors and start of their imple-
mentation in Greece is necessary. The current situation reflects to some
extent in the evolution of interest rates on the 10-years Greek govern-
ment bonds (Figure 4.3), as well as in intensive discussions about possi-
ble exit of country from the euro area. Any Greek debt relief would mean
that the European Financial Stability Facility (EFSF, the temporary
bailout fund), in which the guarantees include also those of the SR, would
lose resources. If these guarantees apply, Slovakia would have to send to
the EFSF funds which would be used to pay bonds issued in order to help
Greece. However, the public debt of the SR would be not impacted, as the
guarantees are already counted in it.
While in case of Greece, the discussion about its possible exit from the
euro area continues, the euro area keeps on its expansion. After Latvia
has adopted the single European currency in 2014, on 1st January 2015,
Lithuania as the last of the Baltic countries became member of the Eco-
nomic and Monetary Union bringing number of eurozone countries to
nineteen. Its gradual expansion creates not only quantitatively larger,
but also qualitatively different monetary union with a higher degree of
heterogenity. This increases the requirements for implementation of
common monetary policy, coordination of national fiscal policies as well
as coordination in other areas of economic policy. Consequently, this
might change the balance of costs and benefits associated with the mem-
bership of individual countries in the euro area.
The creation of banking union, which represents one of the steps to-
wards to so-called Genuine Economic and Monetary Union, continues
slower than expected. In November 2014, out of three pillars in the
banking union, there was a launch of the first one. The largest European
banking groups had previously undergo comprehensive tests consisting
of asset quality assessment and stress tests. The role of the stress tests
was to determine whether and how banks would withstand another pos-
sible crisis. Eventually, 25 out of 130 failed to pass the stress tests. These
results are not that bad to significantly increase distrust of markets and
led to a renewed increase in bond yields of peripheral countries. The

50
results are also not that favorable, so they would not lead to fundamental
doubts about the credibility of the tests. However, the banks testings
were criticized e.g. because they do not include the scenario of deflation,
which at first did not appeared to be unlikely in 2014 and then it became
a reality. In case of application of such scenario, the test results would be
worse with high probability. Among others, the stress testing conclu-
sions confirmed that the Slovak banking system is in good condition.
Macroeconomic Imbalances in Slovakia from the View of the European Commission
In November 2014, the Commission published its fourth Alert Mecha-
nism Report, which is a part of the European Semester and shall aim to
detect possible external and internal imbalances of member states econ-
omies. Neither this time, the Commision did not include Slovakia among
the countries in which in-depth investigation is necessary. Table 4.1
shows the development of indicators that the European Commision fol-
lows in the evaluation of macroeconomic imbalances. Since the integra-
tion to the euro area in 2009, Slovakia exceeds specified thresholds
(overrun is marked in red) in case of two indicators. Namely, net interna-
tional investment position (threshold of 35 %) and unemployment (10
%). According to the latest available data, the development of these indi-
cators have not improved. In the report from November 2014, the Euro-
pean Commision draws attention not only to long-term unemployment,
but also to the serious problem of youth unemployment in Slovakia.
All other monitored indicators, like in previous two years, do not ex-
ceed the indicative thresholds. In case of the current account balance,
due to repeated surplus a further improvement was recorded in moni-
tored indicator (three-year moving average) in 2013, while Slovakia’s
market share in world exports slightly decreased. The development of
price and cost competitiveness indicators (real effective exchange rate,
nominal unit labour costs) does not invoke any concern. Similarly, the
development of house prices, where prices stabilized in 2013 after sev-
eral years of sharp decline. The indebtness of private and government sec-
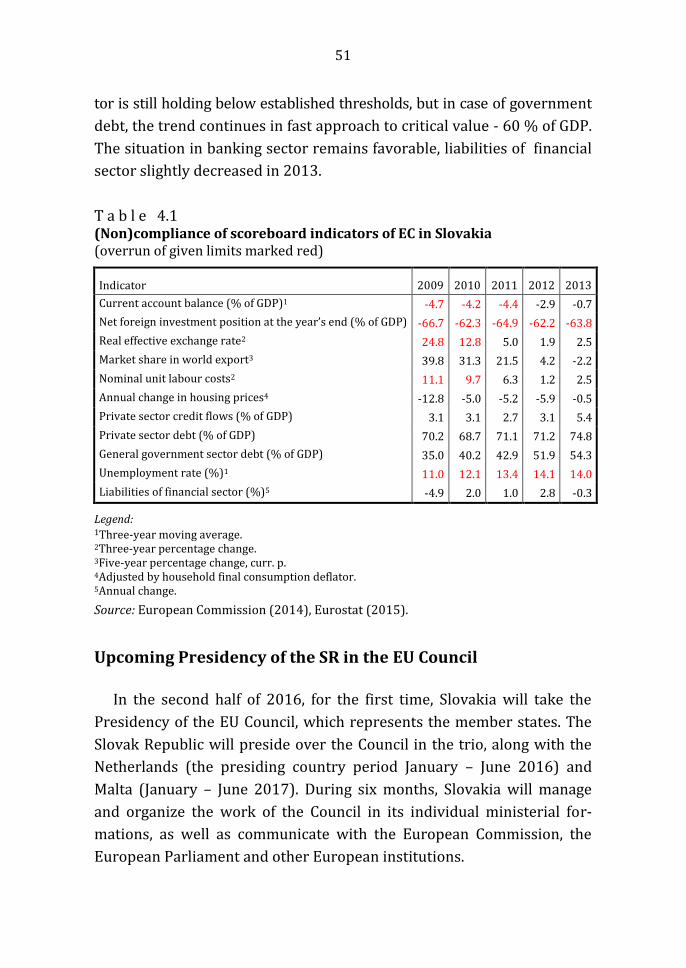
51
tor is still holding below established thresholds, but in case of government
debt, the trend continues in fast approach to critical value - 60 % of GDP.
The situation in banking sector remains favorable, liabilities of financial
sector slightly decreased in 2013.
T a b l e 4.1 (Non)compliance of scoreboard indicators of EC in Slovakia (overrun of given limits marked red)
Indicator 2009 2010 2011 2012 2013
Current account balance (% of GDP)1 -4.7 -4.2 -4.4 -2.9 -0.7
Net foreign investment position at the year’s end (% of GDP) -66.7 -62.3 -64.9 -62.2 -63.8
Real effective exchange rate2 24.8 12.8 5.0 1.9 2.5
Market share in world export3 39.8 31.3 21.5 4.2 -2.2
Nominal unit labour costs2 11.1 9.7 6.3 1.2 2.5
Annual change in housing prices4 -12.8 -5.0 -5.2 -5.9 -0.5
Private sector credit flows (% of GDP) 3.1 3.1 2.7 3.1 5.4
Private sector debt (% of GDP) 70.2 68.7 71.1 71.2 74.8
General government sector debt (% of GDP) 35.0 40.2 42.9 51.9 54.3
Unemployment rate (%)1 11.0 12.1 13.4 14.1 14.0
Liabilities of financial sector (%)5 -4.9 2.0 1.0 2.8 -0.3
Legend: 1Three-year moving average. 2Three-year percentage change. 3Five-year percentage change, curr. p. 4Adjusted by household final consumption deflator. 5Annual change.
Source: European Commission (2014), Eurostat (2015).
Upcoming Presidency of the SR in the EU Council
In the second half of 2016, for the first time, Slovakia will take the
Presidency of the EU Council, which represents the member states. The
Slovak Republic will preside over the Council in the trio, along with the
Netherlands (the presiding country period January – June 2016) and
Malta (January – June 2017). During six months, Slovakia will manage
and organize the work of the Council in its individual ministerial for-
mations, as well as communicate with the European Commission, the
European Parliament and other European institutions.

52
Slovakia has been preparing for this task since 2012. Possible priori-
ties of the Slovak presidency are energy industry, fight against tax eva-
sions or water. The presidency of Slovakia is not only a great challenge,
but also an opportunity to promote country abroad, strengthening the
position of Slovakia in the EU, highlighting and taking forward its nation-
al interests at the EU level.
* * * *
In conclusion, we might say that the eurozone continues in implemen-
tation of measures that fail to address deep economic problems of the
monetary union, and after which sooner or later, further steps will be
required to undertake. With high probability, the quantitative easing
policy will not bring any substantial improvement. An assumption of im-
proved economic development is, along with steps of the ECB, further
reform effort of national governments, which is rather weakened by cur-
rently implemented monetary policy.
At the same time it remains uncertain, whether current composition
of the euro area will be preserved. In the event of voluntarily or involun-
tarily exit of a country from the eurozone, new question arises, namely
which country (countries) will follow. Once the process of the eurozone
shatter would begin, it could become challenging or even unrealistic to
stop this process. This would have serious consequences on all member
states, including Slovakia. The future balance of costs and benefits of
Slovakia’s membership in the EU and the eurozone will not depend only
on factors which are more or less beyond control of the SR (in particular
the overall economic development of the EU). They will also depend on
the ability of Slovakia and its representatives to define the interests of
the SR and subsequently promote them at the European level; given the
small size of the Slovak economy, preferably in cooperation with other
countries.

53
5. PRICE DEVELOPMENT
The inflation rate was one of priority issues not only in Slovakia, but
also in the whole Euro area in 2014. The concerns about its negative im-
pact on economic growth when achieving deflation forced the ECB to
continue in strong monetary expansion and introduction of new non-
standard measures oriented on price level increase in upcoming period.
A strong negative deflation impact did not take place in Slovakia and we
may conclude that stagnant price level was rather supporting economic
growth due to its stimulation of domestic demand.
Total stagnation of consumer prices
In 2014, a consumer prices growth completely stopped and averaged
on marginal deflation value of -0.1 %. Important determinant of such
development can be identified as:
The collapse of oil prices – at the beginning of 2014, oil price was at the
level of 106 USD / barrel. At the end of year it was only 52 USD / bar-
rel, which partly reflected in fuel prices. The price of petrol Natural 95
decreased during the year by 6.1 %, diesel even by 8.9 %.
The decline in regulated industries prices – stagnation at the price level
was driven by drop of regulated industries prices by 0.9 %. So typical-
ly inflationary factor contributed to a decline of price level in 2014. It
was only the second decline in prices of these industries since 2002.
The strong domestic and low foreign demand – domestic demand has
become the main driver of economic growth in all his components.
Thus, concerns about formation of deflationary spiral from last year
were proved wrong and robustness of domestic demand influence
price level positively. In case of inflationary impulses absence from
the side of domestic demand, y-o-y prices development would end up
in bigger deflationary values. On the contrary, the major Euro area
economies experienced very low economic growth16, which reflected
in the size of foreign demand.
16 The German economic growth was gradually declining during the year, Italy was in recession and France on its threshold.

54
The drop in rail transport prices – mainly due to administrative action
of Slovak government17, but also an escalation of competition with a
new private operator arriving to the market by the end of 2014 con-
tributed to a decline in rail transport fares. In November, fare dropped
by 12 %, in December by 7 %.
The decline in food prices – food prices similarly to regulated indus-
tries prices experienced a y-o-y decline by 0.8 %. The importance of
this decline appears by look at weights in consumer basket; food and
soft drinks are the second largest item (16.3 %) in consumer’s basket.
The depreciation of exchange rate EUR / USD – a gradual depreciation
of currency pair EUR/USD has affected the inflation positively. The
depreciation of exchange rate, on the one hand supported competi-
tiveness of domestic exporters outside the Euro area, on the other
hand, import prices have increased which has been reflected in overall
inflation. The exchange rate EUR / USD depreciated from originally 1.35
EUR / USD to 1.12 EUR / USD by the year end. That represents a de-
crease of 17 %. However, other important trading countries outside
the Euro area did not follow this trend and EUR appreciated against
CZK by 1.2 %; PLZ by 3.1 % and HUF by 6.3 %.
The growth rate of nominal wage was 4.1 %, the fastest one since
2008. However, for the first time in Slovakian’s history, the growth rate
of real wages reached a higher value than nominal one – 4.2 %. Of
course, it is necessary to attribute such development to overall price lev-
el, which amounted to a marginal decline of 0.1 %.
The Figure 5.1 shows y-o-y changes in 2014 price level based on dif-
ferent components of CPI indicator.18 The size of each category share is
adequate to weight of category in overall price level change. In cumula-
tive total, almost two-thirds of whole index (62 %) have decreased in
prices while remaining one-third contributed to price level by increase of
prices in its categories. The largest decline was recorded in Transport
category by 1.5 % y-o-y. On the contrary, the most contributing category
to inflation increase was already traditional category Education. Prices
17 As of 17th November 2014, zero fare for students and elder people was introduced on trains of state carrier.
18 CPI – Consumer Price Index.
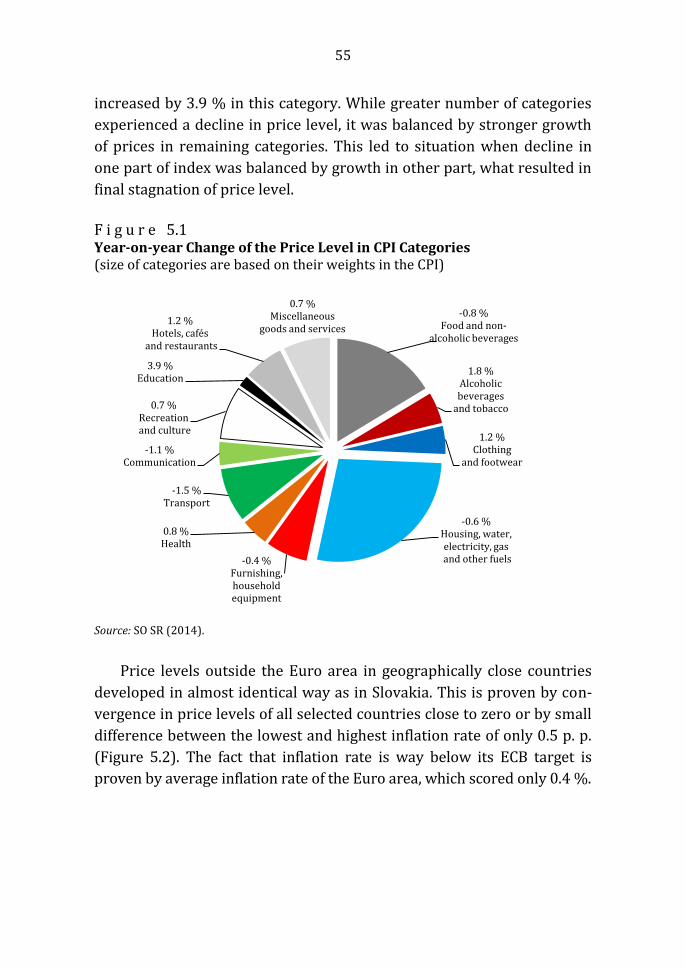
55
increased by 3.9 % in this category. While greater number of categories
experienced a decline in price level, it was balanced by stronger growth
of prices in remaining categories. This led to situation when decline in
one part of index was balanced by growth in other part, what resulted in
final stagnation of price level.
F i g u r e 5.1 Year-on-year Change of the Price Level in CPI Categories (size of categories are based on their weights in the CPI)
Source: SO SR (2014).
Price levels outside the Euro area in geographically close countries
developed in almost identical way as in Slovakia. This is proven by con-
vergence in price levels of all selected countries close to zero or by small
difference between the lowest and highest inflation rate of only 0.5 p. p.
(Figure 5.2). The fact that inflation rate is way below its ECB target is
proven by average inflation rate of the Euro area, which scored only 0.4 %.
-0.8 % Food and non-
alcoholic beverages
1.8 % Alcoholic beverages
and tobacco
1.2 % Clothing
and footwear
-0.6 % Housing, water, electricity, gas
and other fuels -0.4 % Furnishing, household equipment
0.8 % Health
-1.5 % Transport
-1.1 % Communication
0.7 %
Recreation and culture
3.9 % Education
1.2 % Hotels, cafés
and restaurants
0.7 % Miscellaneous
goods and services

56
F i g u r e 5.2 International Comparison of Year-on-year Change in Consumer Prices Level, (%, HICP)
Source: Eurostat (2014).
Producers prices declined significantly
Look at supply side of the economy provides us similar information
about price development as it was on demand side, but it even further
emphasizes prices decline in the economy. Producers prices of agricul-
tural products dropped again. A crucial role in development was played
by above average harvest in 2013. In comparison with previous year, the
harvest increased by 13.4 %, which created enormous pressure on price
decline. In total, prices of agricultural products declined by almost 8 %.
In the construction sector, which is in recession for second year in a
row, price of construction works increased by 1.3 %. That is the only
price increase in all selected sectors of producers prices. On the contrary,
prices of construction material continued to fall, which begun already in
2013 and declined by 3 %.
Prices in the industry decreased in both domestic and foreign goods
after previous stagnation in 2013. In total, a decline amounted to 3.5 %.
In previous year, the main determinant of such development was mostly
decrease in products prices intended for export. However, in 2014, both
types of goods (for domestic and foreign markets) contributed to the
-1
0
1
2
3
4
5
6
7
2008 2009 2010 2011 2012 2013 2014
Slovakia Euro area Czech Republic Hungary Poland

57
decline in price level roughly with the same proportion. On the one hand,
even boosting domestic demand was not sufficient to secure price in-
crease. On the other hand, weak external demand caused by economic
problems of main trade partners did not create sufficient impulse for
price increase of goods intended for export.
T a b l e 5.1 Year-on-year Change in Industrial Producer Prices (index of previous year = 100)
2013 2014
Industrial producers prices – domestic 100.1 97.6
of which: industrial production 100.0 99.0
Industrial producers prices − total 99.0 96.5
Industrial producers prices − export 98.6 96.7
Agriculture products prices 95.1 92.2
Construction material prices – producer prices 99.2 97.3
Construction work prices 100.2 101.3
Source: SO SR (2014).
The price decline accompanied almost entire domestic demand
The development of domestic demand components deflators suggest
that general decline or stagnation of prices is spread across whole econ-
omy. The disinflation trend, which occurred in domestic demand com-
ponents since 2012 was completed by fall into deflation in its two com-
ponents in 2014. The largest decline occurred in a component of private
consumption (1.7 p.p.) followed by decline of capital goods prices (0.9
p.p.). Lower prices of private consumption goods can be associated with
decline of essential goods such as food and housing. In case of capital
goods, certain influence on price decline had low base interest rate,
which was kept at historic minimums in 2014. The only component of
domestic demand which continued in inflationary values was the con-
sumption of government expenditures. However, it also experienced a
drop in prices by 0.9 p.p.

58
F i g u r e 5.1 GDP Deflator and its Selected Components (%)
Source: MF SR (2015).
Prices in international trade declined even faster than in 2013. They
achieved the fastest drop in prices of all deflators when prices of import-
ed goods and services decreased on average by 3.8 % and goods intend-
ed for export by 3.5 %. Such development undermines the original hy-
pothesis of importing inflation from abroad, which should be invoked by
currency depreciation. Thus, the inflation development was not even
“improved” by relatively high import intensity of production due to de-
cline in input prices.
A positive development can be seen in terms of trade which describes
a ratio of export and import prices. For the first time since 2005, there
was a positive development in terms of trade, which is a unique phe-
nomenon in the Slovak economy environment. It means that for the same
amount of export products, a country can import larger amount of an-
other products. Logically, this is a result of development in deflators
when there was a greater fall of import products prices than in export
products prices (the difference between deflators is 0.3 p.p.). It is neces-
sary to remind that the appreciation of USD/EUR exchange rate took
place in late 2014 and continued in 2015, so it was not able to fully re-
flect in terms of trade during analysed year 2014. The exchange rate
-3
-2
-1
0
1
2
3
4
5
2009 2010 2011 2012 2013 2014
GDP deflator Private consumption deflator
Government consumption deflator Fixed investments deflator

59
appreciation is usually accompanied with deterioration in terms of trade
development as import into the country becomes more expensive and
export outside the Euro area cheaper.
F i g u r e 5.4 Export and Import Deflators of Goods and Services (%, left axis); Terms of Trade Development (%, right axis)
Source: MF SR (2015).
The Continuing Price Divergence from the EU 15 Average
Deeply feared price convergence of V4 countries to the average of de-
veloped western countries the EU 15 did not take place even in 2013.19
In contrast, since 2011, this process completely stopped and divergence
in average price levels occurred in each country of V4 group. The great-
est average decrease against the EU 15 average was recorded in Czech
Republic followed by remaining three countries, in which the average
price divergence did not exceed 1 p.p. It will be interesting to observe
how current deflation in SR or price stagnation in CZ, HU and PL will re-
flect in this indicator in the future. The original EU 15 countries recorded
19
The Eurostat publishes results of average price levels with one year’s delay. This is the reason why 2013 data are published as the latest date available.
-1,4
-1,2
-1,0
-0,8
-0,6
-0,4
-0,2
0,0
0,2
0,4
0,6
-6
-4
-2
0
2
4
6
2009 2010 2011 2012 2013 2014
Terms of tradeExport deflator of goods and servicesImport deflator of goods and services

60
mostly very small positive growth in price level, therefore, we can as-
sume that the divergence process continued also in 2014.
T a b l e 5.2 Year-on-year Change of V4 Price Levels (measured by purchasing power parity) to the EU 15 (PPP, EU 15 = 100)
2009 2010 2011 2012 2013
Czech Republic 66,1 68,3 68,2 66,1 64,2
Hungary 56,3 56,4 55,9 54,8 54,2
Poland 54,1 56,4 55,5 54,3 54,0
Slovakia 64,2 63,2 64,9 64,3 63,9
Source: Eurostat (2014).
Non-inflationary Economic Growth?
Long term achievement of inflation low levels, or price level stagna-
tion is expected to gradually reduce positive effects of such development
on household consumption. The residents are gradually getting used to a
non-inflationary environment and lose their motivation to buy goods and
services due to their affordable prices. Similarly, there emerges a discrep-
ancy between perceived and official inflation rate reported in statistics.
Despite the fact that according to official statistics, the average price lev-
el is stagnating or deflating, a perception of inflation rate is differentiated
in population. This reflected in the consumer barometer survey, when
values in survey about current inflation rate were much lower than in
2013 – this means that consumers perceive inflation rate to be higher
than reported.
However, the most important question regarding price developments
remains. It is the role of price stagnation impact on the country economic
growth. Despite initial fears, the deflationary marginal values in 2014 did
not negatively impact consumer behaviour and rather supported the
volume of domestic demand. In 2015, the forecasts predict the stagna-
tion of inflation levels with value close to zero, mainly due to the collapse
of oil prices, which gradually reflects in the economic development. On
the contrary, even more relaxed monetary policy of the ECB along with
positive consumer sentiment (SO SR, 2015) affecting domestic demand is

61
predicted to act pro-inflationary and offset deflationary pressures from
oil and energy prices fall.
A predicted acceleration of economic growth with major trade part-
ners should contribute to growth of foreign demand in 2015. In combina-
tion with domestic demand, they should contribute to return of price
level to a target close to 2 % in upcoming years. We assume that the
prices stagnation, which occurred in 2014 will continue in 2015, particu-
larly due to low oil prices and is expected to have a positive impact on
GDP growth of the country. IFP of Ministry of Finance works with the
assumption that oil price trend is likely to accelerate GDP growth by 0.3
p.p. (MF SR, 2015).
One of main factors, which will affect price level in the future is the
size of households final consumption, but also final consumption of gov-
ernment due to pre-election year. Among other significant factors are the
recovery of main trade partners demand; monetary policy of the ECB
and real wage growth which will play important role in determination of
changes in price level.
* * * *
Price development directly supported economic growth in Slovakia in
2014, mostly by motivating people to realize postponed consumption
from past. The size of final consumption was the main driver of domestic
demand, which in the absence of foreign demand significantly contribut-
ed to the country economic growth. This helped to change the nature of
economic growth, which showed higher quality features in comparison
to previous periods.

62
6. DEVELOPMENT OF SELECTED FINANCIAL MARKETS
INDICATORS
The development in financial markets largely reflects the state of real
economy and without its existence, it would be impossible to allocate
savings for investments in market economy. Recent financial and eco-
nomic crisis has shown how fundamentally the financial market prob-
lems can occur in the real economy. The impacts of financial crisis on the
Slovak economy had just such character, as domestic banking sector was
not exposed to problems with non-performing loans and was not exten-
sively involved in trading with so-called exotic financial market instru-
ments. The crisis showed up in Slovakia with certain lag and was not in-
voked by problems of domestic financial sector as this was the case in
many developed economies. The important stabilizing factor of the Slo-
vak Republic financial sector was the rescue of some commercial banks
by government using public finances at the beginning of new century and
their following privatization by foreign owners.
We paid attention to the development of financial sector in the mono-
graph Economic Development of Slovakia in 2012. We have come to fol-
lowing conclusions in the monograph (Morvay et al., 2013):
A continual growth of household’s deposits endures, but there is a
change in its structure in favour of deposits with a shorter notice pe-
riod. The indebtedness of population increases as well along with
volume of non-performing loans.
The deposits from non-financial sector show signs of volatility, as well
as overall decline in their volume since 2008.
The average level of interest rates on consumer loans is significantly
higher in comparison with the Euro area average. Also the volume of
mortgages showed higher interest rates compared with the Euro area
average.
It is appropriate to analyse changes that have occurred in this area in
last two years with some hindsight, although in a broader perspective
from 2010 or 2011 and confront them with the above mentioned fin-
dings of 2012.

63
Therefore, in the following chapter we will discuss in detail the analy-
sis of following selected indicators:
Changes of interest rates of already granted and new loans to house-
holds in the Euro area average,
Changes in volume and structure of already granted and new loans to
households and non-financial corporations,
Changes in volume and structure of population deposits and non-
financial corporations.
The Development of Interest Rates on Loans in Slovakia and the Euro area
Figure 6.1 and 6.2 shows the development of interest rates on loans
for housing and consumer loans in Slovakia and the Euro area. The de-
velopment of interest rates over the last year confirms the trend of high-
er interest rates for both types of loans in comparison with the Euro area
average.
F i g u r e 6.1 Interest Rates on Loans (stocks) in % p. a. – Housing loans
A. Slovakia B. Euro area
Source: NBS (2014).
3,5
4,0
4,5
5,0
5,5
6,0
6,5
20
10
/01
20
10
/06
20
10
/11
20
11
/04
20
11
/09
20
12
/02
20
12
/07
20
12
/12
20
13
/05
20
13
/10
20
14
/03
20
14
/08
Up to 1 year
More than 1 year – up to 5 years More than 5 years
2,5
3,0
3,5
4,0
4,5
5,0
20
10
/01
20
10
/06
20
10
/11
20
11
/04
20
11
/09
20
12
/02
20
12
/07
20
12
/12
20
13
/05
20
13
/10
20
14
/03
20
14
/08
Up to 1 year
More than 1 year – up to 5 years More than 5 years

64
F i g u r e 6.2 Interest Rates on Loans (stocks) in % p. a. – Consumers Loans
A. Slovakia B. Euro area
Source: NBS (2014).
A closer look at level of interest rates on loans granted to households
reveals that Slovak households are exposed to significantly higher inter-
est rates of loans drawdown in comparison with the Euro area average.
This difference is particularly significant in consumer and other loans,
but also for housing loans. In the period 2011 – 2014, the difference in
interest rates of already granted consumer loans with a maturity of 1-5
years in SR and the Euro area was already 6.6 percentage points (p.p.). In
case of housing loans, the difference represented 2.17 p.p. In case of oth-
er maturities, these differences are lower, but still at level, which is still
not well argued by commercial banks. The interest rates on already
granted loans would require a survey by relevant institutions overseeing
the financial market as well as the antitrust authorities. The loans offer
and interest rates level is in fact still low competitive, the banks are ap-
plying significantly higher interest rates on their branches in Slovakia
than abroad.
8
9
10
11
12
13
14
15
20
10
/01
20
10
/06
20
10
/11
20
11
/04
20
11
/09
20
12
/02
20
12
/07
20
12
/12
20
13
/05
20
13
/10
20
14
/03
20
14
/08
Up to 1 year
More than 1 year – up to 5 years
More than 5 years
4
5
6
7
8
9
20
10
/01
20
10
/06
20
10
/11
20
11
/04
20
11
/09
20
12
/02
20
12
/07
20
12
/12
20
13
/05
20
13
/10
20
14
/03
20
14
/08
Up to 1 year
More than 1 year – up to 5 years
More than 5 years
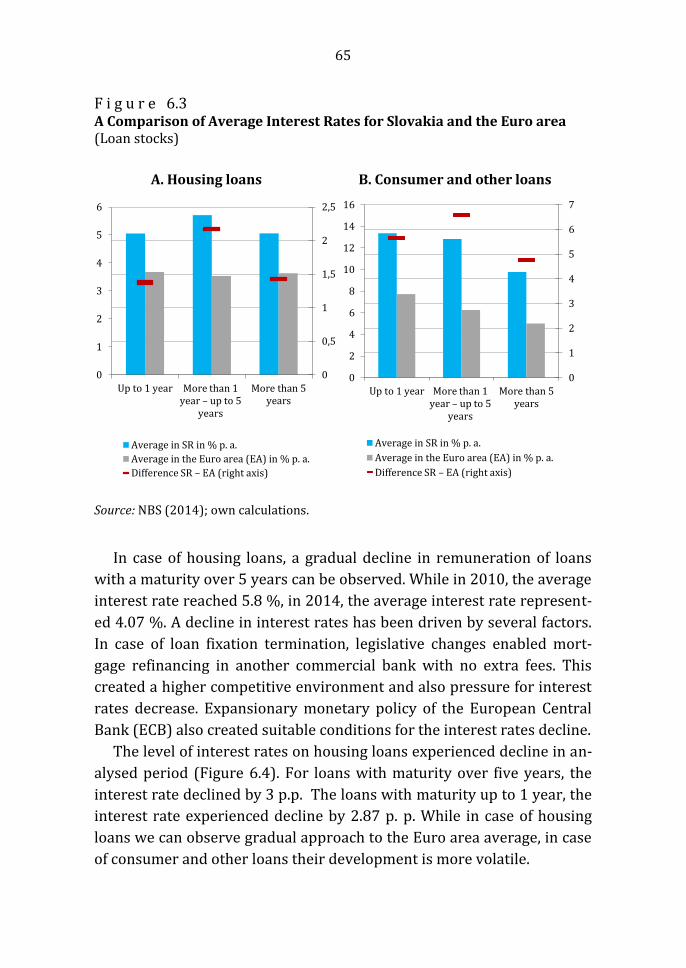
65
F i g u r e 6.3 A Comparison of Average Interest Rates for Slovakia and the Euro area (Loan stocks)
A. Housing loans B. Consumer and other loans
Source: NBS (2014); own calculations.
In case of housing loans, a gradual decline in remuneration of loans
with a maturity over 5 years can be observed. While in 2010, the average
interest rate reached 5.8 %, in 2014, the average interest rate represent-
ed 4.07 %. A decline in interest rates has been driven by several factors.
In case of loan fixation termination, legislative changes enabled mort-
gage refinancing in another commercial bank with no extra fees. This
created a higher competitive environment and also pressure for interest
rates decrease. Expansionary monetary policy of the European Central
Bank (ECB) also created suitable conditions for the interest rates decline.
The level of interest rates on housing loans experienced decline in an-
alysed period (Figure 6.4). For loans with maturity over five years, the
interest rate declined by 3 p.p. The loans with maturity up to 1 year, the
interest rate experienced decline by 2.87 p. p. While in case of housing
loans we can observe gradual approach to the Euro area average, in case
of consumer and other loans their development is more volatile.
0
0,5
1
1,5
2
2,5
0
1
2
3
4
5
6
Up to 1 year More than 1 year – up to 5
years
More than 5years
Average in SR in % p. a.
Average in the Euro area (EA) in % p. a.
Difference SR – EA (right axis)
0
1
2
3
4
5
6
7
0
2
4
6
8
10
12
14
16
Up to 1 year More than 1 year – up to 5
years
More than 5years
Average in SR in % p. a.
Average in the Euro area (EA) in % p. a.
Difference SR – EA (right axis)

66
F i g u r e 6.4 Interest Rates of Loans (New Loans) in % p. a. – Housing loans
A. Slovakia B. Euro area
Source: NBS (2014).
F i g u r e 6.4 Interest Rates of Loans (New Loans) in % p. a. – Consumer loans
A. Slovakia B. Euro area
Source: NBS (2014).
1,5
2,5
3,5
4,5
5,5
6,5
7,5
8,5
9,5
20
10
/01
20
10
/06
20
10
/11
20
11
/04
20
11
/09
20
12
/02
20
12
/07
20
12
/12
20
13
/05
20
13
/10
20
14
/03
20
14
/08
Up to 1 yearMore than 1 year – up to 5 years More than 5 years
1,5
2,0
2,5
3,0
3,5
4,0
4,5
5,0
20
10
/01
20
10
/06
20
10
/11
20
11
/04
20
11
/09
20
12
/02
20
12
/07
20
12
/12
20
13
/05
20
13
/10
20
14
/03
20
14
/08
Up to 1 yearMore than 1 year – up to 5 years More than 5 years
6
8
10
12
14
16
18
20
10
/01
20
10
/06
20
10
/11
20
11
/04
20
11
/09
20
12
/02
20
12
/07
20
12
/12
20
13
/05
20
13
/10
20
14
/03
20
14
/08
Up to 1 year
More than 1 year – up to 5 years
More than 5 years
4
5
6
7
8
9
20
10
/01
20
10
/06
20
10
/11
20
11
/04
20
11
/09
20
12
/02
20
12
/07
20
12
/12
20
13
/05
20
13
/10
20
14
/03
20
14
/08
Up to 1 year
More than 1 year – up to 5 years
More than 5 years

67
In case of consumer loans with maturity up to 1 year, the average in-
terest rate increased from 2010 to 2014 by 2.39 p.p. The loans with ma-
turity of 1-5 years declined mildly by 0.66 p.p. There has been a decline
for loans with maturity more than 5 years by 1.69 p.p. The development
of the average interest rates in the Euro area is declining in comparison
with Slovakia for both type of loans, housing loans and consumer loans.
The average interest rate on housing loans with maturity more than 5
years reached level 2.53 % by the end of 2014 and compared to SR was
lower by 2.11 p.p. In case of consumer loans, the difference is even more
significant.
F i g u r e 6.6 Comparison o Average Interest Rates for the SR and the Euro Area (new loans)
A. Housing loans B. Consumer and other loans
Source: NBS (2014), own calculation.
The difference in interest rates between Slovakia and the Euro area in
case of consumer loans with maturity over 5 years reached 5.38 p.p. For
loans with maturity of 1-5 years, the difference is even greater reaching 8.4
percentage point. In case of loans with maturity up to one year, the differ-
ence is 6.15 p.p. This significant gap is in current situation (historically low
0,0
0,5
1,0
1,5
2,0
2,5
3,0
3,5
0
1
2
3
4
5
6
7
Up to 1 year More than 1 year – up to 5
years
More than 5years
Average in SR in % p. a.
Average in the Euro area (EA) in % p. a.
Difference SR – EA (right axis)
0
1
2
3
4
5
6
7
8
9
10
0
2
4
6
8
10
12
14
16
Up to 1 year More than 1 year – up to 5
years
More than 5years
Average in SR in % p. a.
Average in the Euro area (EA) in % p. a.
Difference SR – EA (right axis)

68
interest rates of the ECB) hardly tenable by specific conditions of the
Slovak market.
The Development of Loans and Deposits in the Years
2011 – 2014
The lending activity largely reflects the state of the economy, especial-
ly of market players willing to take the risk of loan repayment. In case of
Slovakia, we can see a gradual volume growth in all types of tracked
loans. While in 2011, the total volume of loans lent to households
reached 17.1 billion EUR, in 2014, the volume increased to 23 billion
EUR. This increase can be mostly accounted to housing loans which in-
creased in analysed period by 5 billion EUR followed by consumer loans
with increase of 1 billion EUR.
T a b l e 6.1 Status of loans granted in the years 2011 – 2014 – households (EUR million)
Total loans Consumer loans Housing loans Other loans
Households
2011 17 188 3 219 12 320 1 648
2012 18 774 3 517 13 701 1 556
2013 20 550 3 782 15 304 1 465
2014 23 050 4 276 17 364 1 410
Source: NBS database.
T a b u ľ k a 6.2 Status of loans granted in the years 2011 – 2014 – non-financial corporations (EUR million)
Total loans Up to 1 year 1-5 years >5 years
2011 16 194 5 773 3 790 6 631
2012 15 685 5 818 3 553 6 314
2013 15 772 5 982 3 651 6 139
2014 15 707 5 281 3 935 6 491
Source: NBS database.

69
The opposite trend was recorded in the non-financial corporations.
The total volume of loans fell by 487 million EUR from 2011 till 2014,
mainly due to a decrease in loans with maturity up to 1 year by 492 mil-
lion EUR. On the contrary, an increase by 145 million EUR was recorded
for loans with maturity between 1 to 5 years. In case of loans with ma-
turity more than 5 years, there has been a decline in volume by 140 mil-
lion EUR.
F i g u r e 6.7 Annual increase (decrease) in loans between years 2011 – 2014 (in %)
A. Households B. Non-financial corporations
Source: NBS, own calculations.
Households Deposits
Households deposits recorded growth of 3.3 billion EUR in analysed
period (Table 6.3 and Figure 6.8). A closer look at the structure of depos-
its reveals that the highest increase was recorded in deposits repayable
on demand by 3.4 billion EUR, while the highest annual increase was by
12.7 % in 2014. Also a significant increase was recorded in this year in de-
posits with a notice period of 3 months by 20.9 % and deposits with a no-
tice period above 3 months by 5.7 %.
-5
0
5
10
15
20
2011 2012 2013 2014
Total loans Consumer loans
Households loans Other loans
-13
-8
-3
2
7
12
2011 2012 2013 2014
Total loans Up to 1 year
1 to 5 years More than 5 years
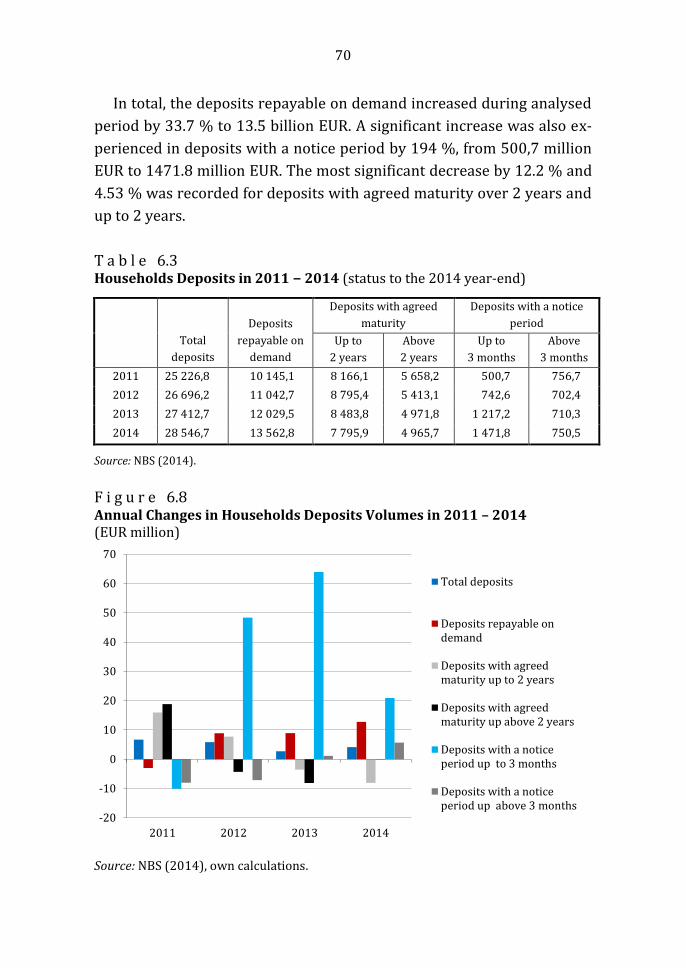
70
In total, the deposits repayable on demand increased during analysed
period by 33.7 % to 13.5 billion EUR. A significant increase was also ex-
perienced in deposits with a notice period by 194 %, from 500,7 million
EUR to 1471.8 million EUR. The most significant decrease by 12.2 % and
4.53 % was recorded for deposits with agreed maturity over 2 years and
up to 2 years.
T a b l e 6.3 Households Deposits in 2011 − 2014 (status to the 2014 year-end)
Total
deposits
Deposits
repayable on
demand
Deposits with agreed
maturity
Deposits with a notice
period
Up to
2 years
Above
2 years
Up to
3 months
Above
3 months
2011 25 226,8 10 145,1 8 166,1 5 658,2 500,7 756,7
2012 26 696,2 11 042,7 8 795,4 5 413,1 742,6 702,4
2013 27 412,7 12 029,5 8 483,8 4 971,8 1 217,2 710,3
2014 28 546,7 13 562,8 7 795,9 4 965,7 1 471,8 750,5
Source: NBS (2014).
F i g u r e 6.8 Annual Changes in Households Deposits Volumes in 2011 – 2014 (EUR million)
Source: NBS (2014), own calculations.
-20
-10
0
10
20
30
40
50
60
70
2011 2012 2013 2014
Total deposits
Deposits repayable ondemand
Deposits with agreedmaturity up to 2 years
Deposits with agreedmaturity up above 2 years
Deposits with a noticeperiod up to 3 months
Deposits with a noticeperiod up above 3 months

71
Deposits from non-financial corporations increased from 2011 to
2014 by 1.3 billion EUR or 14.5 %. There was a gradual decline in the
structure of deposits with an agreed maturity up to two years of 445 mil-
lion EUR, and deposits over two years by 21.8 million EUR. The highest
increase, similarly to households sector, was recorded in deposits repay-
able on demand. In total, these deposits increased by 1.7 billion EUR i.e.
25.5%. The highest increases in this category of deposits were made in
2011 and 2012, largely at the expense of deposits with a three months
notice period.
T a b l e 6.4 Deposits of Non-finacial corporations in 2011 − 2014 (status to the 2014 year-end)
Total
deposits
Deposits
repayable on
demand
Deposits with agreed
maturity
Deposits with
a notice period
Up to 2 years
Above 2 years
Up to
3 months
Above
3 months
2011 9 393.7 7 035.7 2 239.1 86.9 31.6 0.1
2012 9 686.1 7 378.2 2 147.4 84.3 76.2 0.0
2013 10 765.1 8 414.5 2 166.6 97.1 86.7 0.1
2014 10 756.5 8 827.2 1 793.2 65.0 70.9 0.1
Source: NBS (2014).
By look at the level of interest rates on deposits, we can conclude that
the diversion of households and non-financial companies from deposits
with a longer notice period towards deposits repayable upon demand is
understandable, given a small difference in the interest rates of individu-
al deposits. The development of interest rates on deposits in Slovakia,
unlike loans, copies the development in the Euro area with only slight
deviations. Standard deviation of the differences between interest rates
of different types of Slovak household’s deposits and the Euro area aver-
age ranged from 0.07 to 0.43.
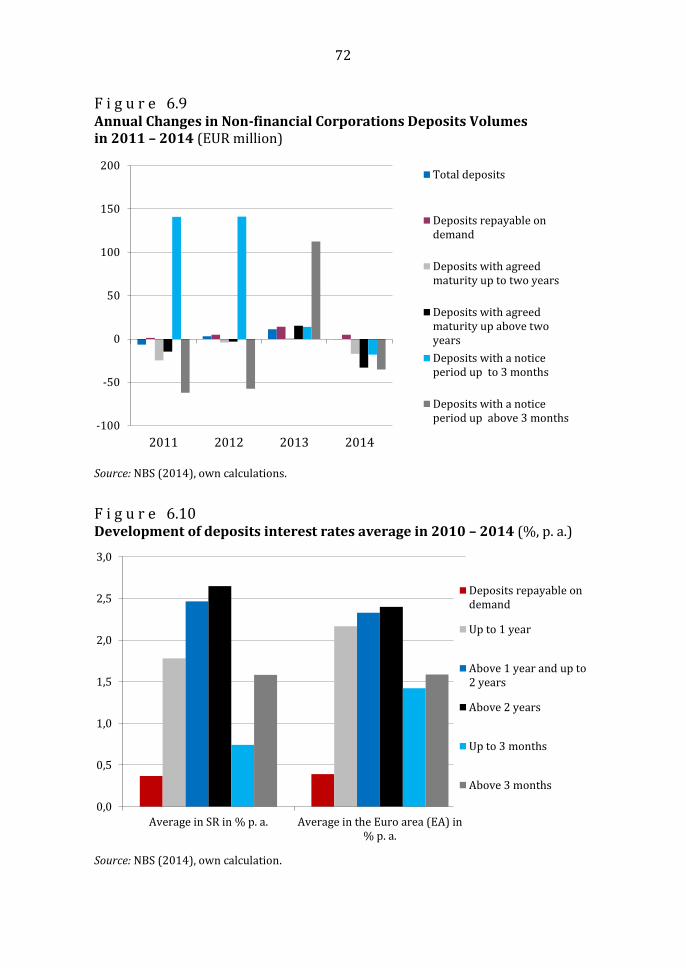
72
F i g u r e 6.9 Annual Changes in Non-financial Corporations Deposits Volumes in 2011 – 2014 (EUR million)
Source: NBS (2014), own calculations.
F i g u r e 6.10 Development of deposits interest rates average in 2010 – 2014 (%, p. a.)
Source: NBS (2014), own calculation.
-100
-50
0
50
100
150
200
2011 2012 2013 2014
Total deposits
Deposits repayable ondemand
Deposits with agreedmaturity up to two years
Deposits with agreedmaturity up above twoyears
Deposits with a noticeperiod up to 3 months
Deposits with a noticeperiod up above 3 months
0,0
0,5
1,0
1,5
2,0
2,5
3,0
Average in SR in % p. a. Average in the Euro area (EA) in% p. a.
Deposits repayable ondemand
Up to 1 year
Above 1 year and up to2 years
Above 2 years
Up to 3 months
Above 3 months

73
F i g u r e 6.11 Development of Non-financial Corporations Deposits Interest Rates Average in 2010 – 2014 (%, p. a.)
Source: NBS (2014), own calculations.
It is clear from the analysis that interest rates on deposits follow the
interest rate developments in the Euro area, while there is still an obvi-
ous imbalance between the interest rate of loans to households in Slo-
vakia, compared with the average of the Euro area rates. Nevertheless,
there is a growing demand for consumer loans from households. We can
also observe a significant increase in volume of housing loans (the part
of this is due to the refinancing of original loan). Increased lending activi-
ty of households is also reflected in the change of economic growth quali-
ty (more in Chapter 1), as part of households consumption is currently
covered by these loans.
In conclusion, we can say that most of the findings that we have indi-
cated at the beginning of this chapter and were based on the conclusions
of Economic Development in 2012 are still valid. There is still a signifi-
cant difference in the borrowing rate between the Slovak Republic and
the Euro area average, this difference is most pronounced especially in
the field of consumer loans to households. In case of interest rates on
deposits, we can observe a departure from deposits with a longer notice
period toward deposits repayable on demand. This is mainly due to the
low interest-bearing deposits with a longer notice period, which does not
encourage savers to store money for a longer period of time.
0,0
0,5
1,0
1,5
2,0
2,5
Average in SR in % p. a. Average in the Euro area (EA) in% p. a.
Repayable ondemand
Up to 1 year
Above 1 year andup to 2 years
Above 2 year

74
7. PUBLIC FINANCE
The development of public finance was influenced by several external
and internal factors in 2014. The major change was the introduction of
new ESA 2010 methodology, which resulted in the revision of basic mac-
roeconomic indicators and naturally affected the data reported with re-
gards to management of public finances. The major changes include (SO
SR, 2015):
Research and development is recognized as capital formation.
Weapon systems in the government sector are recognized as capital
assets.
Sector classification of state, public and private units.
The indexed debt instruments – a new estimation method of accrual
interest. Accrual interest is the difference between the issue price and
the expected price changes on the markets. Deviation is considered as
a gain or loss from debt instruments holding.
Super dividends – the change of dividends comprehension from public
corporations to government sector, which are considered as yield on
assets instead of income transfers from property.
Special Drawing Rights (SDR) of the International Monetary Fund
(IMF) are considered to be assets and liabilities – each country hold-
ing the SDR is reporting them as a liability to other countries repre-
senting their commitment to the IMF.
Current tax loans – the whole amount of loans in this category is rec-
ognized as subsidies or social benefits and other.
The changes mentioned above along with changes in the calculation
of nominal GDP or GNI have been reflected in the public finances. Change
in methodology has brought the growth of nominal debt by 0.3 % of GDP.
The most significant in this increase is the inclusion of the National Mo-
torway Company in the general government sector (increase in debt by
0.5 % of GDP). On the other hand, the reclassification of hospitals and
change in recording of suppliers credits reduced debt by 0.3 % of GDP.
The revision of nominal GDP amount had the most significant impact on

75
the government debt to GDP ratio. The change of GDP calculation con-
tributed to a decline of debt by 1.1 % of GDP. Therefore, the public debt
reached 54.6 % of GDP in 2014, which enabled the government to abol-
ish 3 % binding of expenditures and still to be in accordance with rules
of the Fiscal Responsibility Act. Also the obligation of local governments
not to increase annual expenditures of their budgets was removed due to
this methodology change.
Another important factor setting the framework for assessing the ful-
filment of so-called medium-term objectives of public finances manage-
ment of the Euro area countries (MTO – Medium-Term Budgetary Objec-
tives) was the publication of detailed guidance from the European Com-
mision (EC, 2015).
The guideline was published in January 2015 and explains in details
the assessment of member states fiscal position in terms of investments,
structural reforms and cyclical effects. It is about rules interpretation of
preventive and corrective part of the Stability and Growth Pact (SGP), in
which it is possible to deviate from the MTO.
Investment clause: in terms of interpretation, the investments shall be
eligible within the emerging EU fund for strategic investments as well as
investments (co-financing) of the member states under cohesion policy,
trans-european networks and tool “Connecting Europe”.
The clause of structural reforms defines possible temporary devia-
tions from the MTO under the following conditions (preventive part of
the Stability and Growth Pact):
Reforms must have fundamental character.
They must have direct long-term positive impact on the public financ-
es.
Reforms must be fully implemented.
Activation of this clause is only possible in case that the member state
presents detailed and critical medium-term plan of structural reforms
(as part of the National Reform Programme), which contains credible
deadlines for approval and implementation of reforms. An essential part
is the quantification of reforms impact on medium-term fiscal objectives
and potential economic growth. In case of non-fulfillment of given tar-

76
gets, the EC will pursue with necessary measures – it will issue a warning
followed by draft of recommendations for the EU Council, that member
state should take appropriate corrective measures within 5 months period.
Table 7.1 captures mechanism for assessment of fiscal positions of in-
dividual countries under preventive arm of the SGP and based on given
intervals it provides expected values of fiscal consolidation of relevant
countries within cyclical effects clause application.
T a b l e 7.1 Annual Fiscal Adjustment of the Structural Deficit in Terms of the Medium-term Budgetary Objective (MTO) in the Preventive Part of the Stability and Growth Pact (SGP)
Required yearly fiscal correction
Period Conditions
Debt below 60 % and
no risk of sustainabil-
lity
Debt above 60 % or
the risk of sustaina-
billity
Exceptionally
poor Real growth < 0 or output gap
<-4
No fiscal correction
required
No fiscal correction
required
Very poor -4 ≤ output gap < -3 0 0.25
Poor -3 ≤ output gap < -1.5
0 if growth is below
potential, 0.25 if
growth is above poten-
tial
0.25 if growth is below
potential, 0.5 if growth
is above potential
Normal -1.5 ≤ output gap < 1.5 0.5 > 0.5
Good Output gap above ≥ 1.5 %
> 0.5 if growth is below
potential, ≥ 0.75 if
growth is above poten-
tial
> 0.75 if growth is
below potential, ≥ 1 if
growth is above po-
tential
Source: European Commission (2015).
By look at current development in the budgetary discipline field, we
may conclude that several countries do not respect the medium-term
objectives of fiscal consolidation. On the one hand, the EC guidelines
provide clear rules for member states and introduce an element of flexi-
bility. It takes into account current economic development of member
countries and provides space for automatic stabilizers reaction. On the
other hand, the financial rules adopted in response to the debt crisis in

77
the Euro area are to some extent not that strict and may cause decrease
in consolidation efforts also in other EU countries. A crucial factor affect-
ing the credibility of the EC in assessing fiscal discipline of the member
countries will be strict enforcement of these modified rules without ex-
ception. However, the development in recent years shows that despite
revised SGP rules, some member states are not in a position to consoli-
date public finances at a pace that would serve the MTO.
Development of the public finances in 2014
According to preliminary data, the deficit of Slovak public finance was
2.93 % of GDP in 2014. The deficit was higher by 0.03 p.p compared to
the target (Table 7.2). In terms of the MTO fulfillment, the consolidation
efforts deteriorated by 0.6 according to preliminary data.
T a b l e 7.2 Development of the General Government Budget Deficit in 2008 − 2014
Indicator 2008 2009 2010 2011 2012 2013 2014
Net lending / borrowing EUR
mill.
-1 555
-5 076
-5 032
-2 887
-3 046
-1 933
-2 199
Net lending / borrowing1 % GDP -2.30 -8.00 -7.50 -4.10 -4.20 -2.63 -2.9
Primary balance2 % GDP -1.00 -6.50 -6.20 -2.60 -2.40 -0.70 -1.10
Cyclically adjusted pri-
mary balance3 % GDP . . -6.00 -2.10 -1.60 0.60 0.20
Structural balance4 % GDP . . -6.70 -4.10 -3.50 -1.30 -1.90
Gross general govern-
ment debt
EUR
mill.
19 205
22 923
27 622
30 485
37 618
40 178
40 400
Gross general govern-
ment debt
% GDP
28.2
35.9
41.1
43.5
52.1
54.6
54.1
Net general government
debt5
% GDP
22.8
32.2
37.6
41.3
45.9
48.2
50.9
Note: 2014 data are preliminary. 1 Net lending/borrowing including the second pension pillar costs (Eurostat definition). 2 Primary balance is the public administration balance adjusted for interest paid. 3 Cyclically adjusted primary balance is the primary balance adjusted for cyclical component. 4 Structural balance is the public administration balance adjusted for cyclical component and one-time effects. 5 Net general government debt is the gross general government debt minus liquid financial assets.
Source: MF SR (2015).
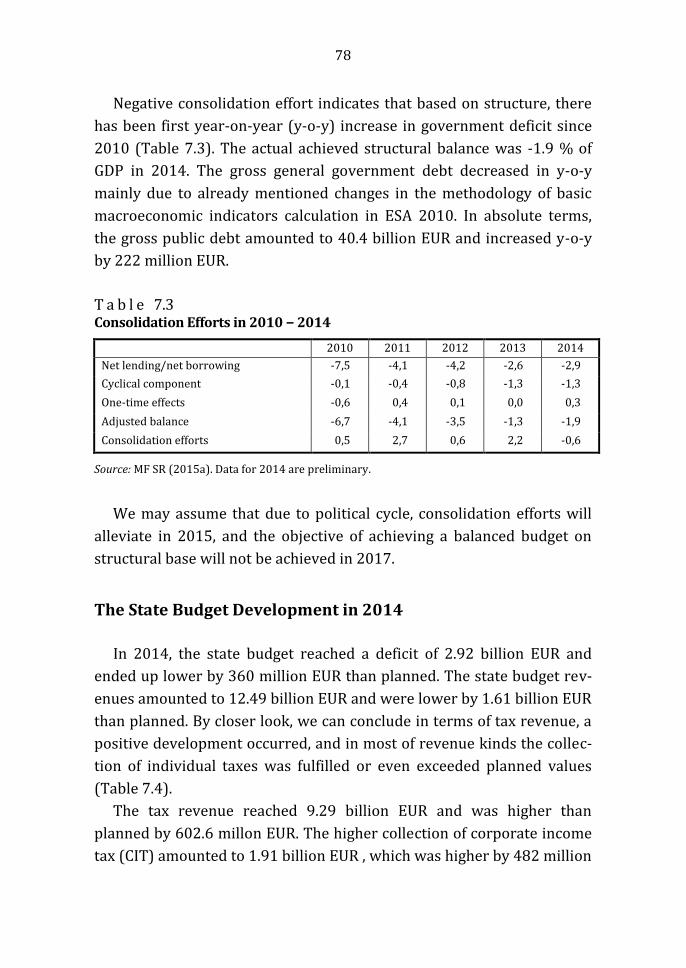
78
Negative consolidation effort indicates that based on structure, there
has been first year-on-year (y-o-y) increase in government deficit since
2010 (Table 7.3). The actual achieved structural balance was -1.9 % of
GDP in 2014. The gross general government debt decreased in y-o-y
mainly due to already mentioned changes in the methodology of basic
macroeconomic indicators calculation in ESA 2010. In absolute terms,
the gross public debt amounted to 40.4 billion EUR and increased y-o-y
by 222 million EUR.
T a b l e 7.3 Consolidation Efforts in 2010 − 2014
2010 2011 2012 2013 2014
Net lending/net borrowing -7,5 -4,1 -4,2 -2,6 -2,9
Cyclical component -0,1 -0,4 -0,8 -1,3 -1,3
One-time effects -0,6 0,4 0,1 0,0 0,3
Adjusted balance -6,7 -4,1 -3,5 -1,3 -1,9
Consolidation efforts 0,5 2,7 0,6 2,2 -0,6
Source: MF SR (2015a). Data for 2014 are preliminary.
We may assume that due to political cycle, consolidation efforts will
alleviate in 2015, and the objective of achieving a balanced budget on
structural base will not be achieved in 2017.
The State Budget Development in 2014
In 2014, the state budget reached a deficit of 2.92 billion EUR and
ended up lower by 360 million EUR than planned. The state budget rev-
enues amounted to 12.49 billion EUR and were lower by 1.61 billion EUR
than planned. By closer look, we can conclude in terms of tax revenue, a
positive development occurred, and in most of revenue kinds the collec-
tion of individual taxes was fulfilled or even exceeded planned values
(Table 7.4).
The tax revenue reached 9.29 billion EUR and was higher than
planned by 602.6 millon EUR. The higher collection of corporate income
tax (CIT) amounted to 1.91 billion EUR , which was higher by 482 million

79
EUR in absolute terms compared to the plan. In case of taxes on goods
and services (VAT, excise taxes) as well as non-tax revenue were higher
than the 2014 budget expected.
T a b l e 7.4 Central Government Budget Development in 2011 – 2014 (EUR million)
Indicator
2011
2012
2013
Planned
2014
Actual
2014
% of com-
pliance
2014
Year-on-
year change,
%
Total revenues 12 002 11 830 12 797 14 108 12 496 88.6% -2.3%
of which:
1.Tax 8 700 8 463 9 135 8 690 9 293 106.9% 1.7%
of which:
Tax on personel income 112 234 214 218 239 109.6% 11.9%
Corporate income tax 1 620 1 733 2 003 1 434 1 917 133.7% -4.3%
Income tax coll.
by deduction 143 167 178 154 175 113.6% -1.6%
VAT 4 753 4307 4 735 4 901 4 919 100.4% 3.9%
Excise taxes 2 002 1979 1 977 1 936 2 009 103.8% 1.6%
2. Non-tax 859 695 1 283 1 397 1 637 117.2% 27.6%
3. Grants and transfers 2 443 2670 2 379 4 020 1 566 39.0% -34.2%
of which:
Income from EU
budget
2 031
2127
2 175
3 173
1 257
39.6%
-42.2%
Total expenditures 15 278 15 640 14 820 17 391 15 420 88.7% 4.1%
of which:
Current expend. 12 783 13 657 12 968 14 863 13 441 90.4% 3.6%
Capital expend. 2 495 1 983 1 854 2 528 1 979 78.3% 6.7%
Deficit/Surplus -3 276 -3810 -2 023 -3 283 -2 923 89.0% 44.5%
Note: Total revenues from tax on personal income is higher, but given the fact it is the revenue
for regional government, the values within the state budget are low.
Source: MF SR (2015c); own calculations.
During the annual budgetary assessments, we may conclude that es-
pecially in component “Grands and transfers from the EU”, there is re-
peating revenue overestimation every year, while real revenue from the
EU budget was substantially lower than planned also in 2014. Total rev-
enues reached the level of 1.25 billion EUR compared to the target one
3.1 billion EUR.
The state budget expenses were lower by 1.97 billion EUR compared
to the target, out of which the current expenditures by 1.42 billion EUR

80
and the capital expenditures by 549.6 million EUR. The highest decrease
in expenditures was experienced in expenditures on goods and services
by 1.06 billion EUR. Mostly, the contraction in the capital expenditures
can be considered negatively.
F i g u r e 7.1 Fulfilment of Selected Revenue and Expenditure of the State Budget in 2014 (%)
Source: MF SR (2015c); own calculations.
Budget deficit and central government debt
In 2014, the state budget deficit represented 2.02 billion EUR and it
was lower by 1 billion EUR compared to planned value. In ratio to GDP, it
reached 2.74 % and in y-o-y decreased by 1.8 p. p (Figure 7.2). This was
mainly due to already traditional overestimation of expenditures required
for operation programs co-financing compared to actual spending.
Gradual fiscal consolidation reflected itself in the growth rate of cen-
tral government debt and its ratio to GDP. Compared to previous years,
the amount of debt has stabilized at level around 40 billion EUR or 52 %
of GDP (Figure 7.3). Despite the decrease of consolidation effort in 2014,
we can observe a decline in debt-to-GDP ratio of the central government,
mainly due to changes recognized in ESA 2010. Given the fact of political
cycle ending and upcoming parliamentary elections in 2016, we do not
0% 20% 40% 60% 80% 100% 120% 140%
Personal income tax
Corporate income tax
Withholding income tax
VAT
Excise taxes
Revenues from the EU budget
Current expenditures
Capital expenditures
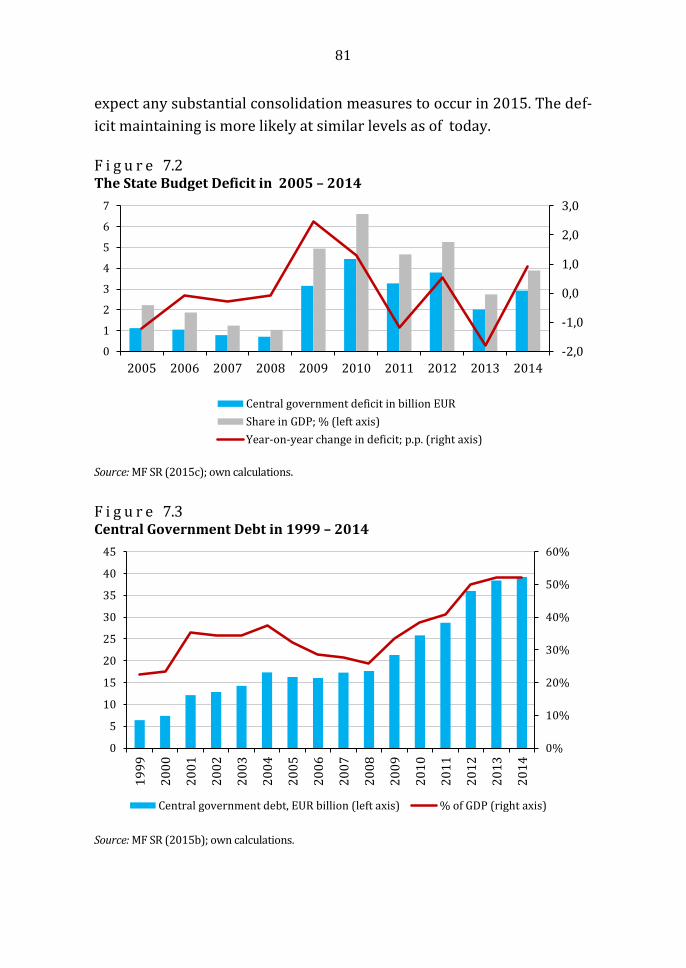
81
expect any substantial consolidation measures to occur in 2015. The def-
icit maintaining is more likely at similar levels as of today.
F i g u r e 7.2 The State Budget Deficit in 2005 – 2014
Source: MF SR (2015c); own calculations.
F i g u r e 7.3 Central Government Debt in 1999 – 2014
Source: MF SR (2015b); own calculations.
-2,0
-1,0
0,0
1,0
2,0
3,0
0
1
2
3
4
5
6
7
2005 2006 2007 2008 2009 2010 2011 2012 2013 2014
Central government deficit in billion EUR
Share in GDP; % (left axis)
Year-on-year change in deficit; p.p. (right axis)
0%
10%
20%
30%
40%
50%
60%
0
5
10
15
20
25
30
35
40
45
19
99
20
00
20
01
20
02
20
03
20
04
20
05
20
06
20
07
20
08
20
09
20
10
20
11
20
12
20
13
20
14
Central government debt, EUR billion (left axis) % of GDP (right axis)
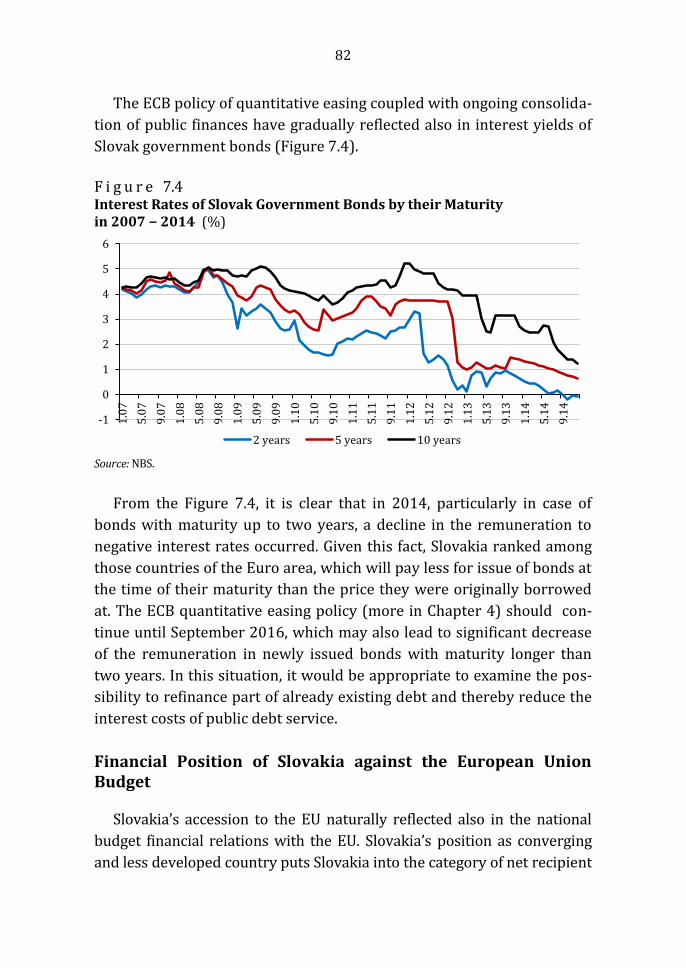
82
The ECB policy of quantitative easing coupled with ongoing consolida-
tion of public finances have gradually reflected also in interest yields of
Slovak government bonds (Figure 7.4).
F i g u r e 7.4 Interest Rates of Slovak Government Bonds by their Maturity in 2007 − 2014 (%)
Source: NBS.
From the Figure 7.4, it is clear that in 2014, particularly in case of
bonds with maturity up to two years, a decline in the remuneration to
negative interest rates occurred. Given this fact, Slovakia ranked among
those countries of the Euro area, which will pay less for issue of bonds at
the time of their maturity than the price they were originally borrowed
at. The ECB quantitative easing policy (more in Chapter 4) should con-
tinue until September 2016, which may also lead to significant decrease
of the remuneration in newly issued bonds with maturity longer than
two years. In this situation, it would be appropriate to examine the pos-
sibility to refinance part of already existing debt and thereby reduce the
interest costs of public debt service.
Financial Position of Slovakia against the European Union Budget
Slovakia’s accession to the EU naturally reflected also in the national
budget financial relations with the EU. Slovakia’s position as converging
and less developed country puts Slovakia into the category of net recipient
-1
0
1
2
3
4
5
6
1.0
7
5.0
7
9.0
7
1.0
8
5.0
8
9.0
8
1.0
9
5.0
9
9.0
9
1.1
0
5.1
0
9.1
0
1.1
1
5.1
1
9.1
1
1.1
2
5.1
2
9.1
2
1.1
3
5.1
3
9.1
3
1.1
4
5.1
4
9.1
4
2 years 5 years 10 years

83
of funds from the EU budget, mainly through the EU cohesion policy.
From 2004 to 2013, the SR gained 8.04 billion EUR from the EU budget.
T a b l e 7.5 Expenditures of EU budget in Slovakia in 2007 – 2013 (EUR million)
2007 2008 2009 2010 2011 2012 2013
1. Sustainable growth 669 852.8 633.5 1208 1096.8 1646 1439.2
1.1 Competitiveness for growth
and employment
33.7
43.3
48.7
11.8
40.9
70.4
58.4
1.2 Cohesion for growth and
employment
635.2
809.5
548.8
1 096.1
1 056
1 575.7
1 380.8
1.2.1 Structural funds 451.9 510.1 385.9 633.7 917.6 1 212.9 812.1
1.2.2 Cohesion fund 183.3 299.4 198.8 462.4 138.2 362.7 568.7
2. Preservation and management
of natural resources
380.5
357
513
676.5
647.9
618
566
3. Citizenship, freedom, security
and justice
13.7
11.1
8.5
8.7
29.2
12.6
11
4. EU as a global partner 9.9 11.5 26.6 0.3 0.5 0.5 0
5. Administration 9.6 9.4 10.8 11.5 10.7 9.7 9.9
6. Compensation 0 0 0 0 0 0 0
Total 1 082.7 1 241.8 1 192.4 1 905 1 785.1 2 286.8 2 026.1
Note: 2014 data were not available at the time of chapter publication.
Source: European Commission (2015).
F i g u r e 7.5 Net Financial Position of the SR vis-à-vis the EU Budget, 2004 – 2013
Note: 2014 data were not available at the time of chapter publication.
Source: European Commission (2015).
0,0%
0,5%
1,0%
1,5%
2,0%
2,5%
0
200
400
600
800
1000
1200
1400
1600
1800
2004 2005 2006 2007 2008 2009 2010 2011 2012 2013
Position vis-à-vis the EU budget, EUR million
Position vis-à-vis the EU budget, % GNI

84
EU Structural Support Implementation in 2007 – 2013 Programming Period
Year 2014 was the penultimate year, in which it was possible to draw
financial resources from the programming period 2007 – 2013. Annual
draw of funds have increased by 12.79 p.p., which was a slowdown ap-
proximately by 1.3 p.p, compared to previous year. Towards the end of
2014, the draw of funds has reached 65.3 % of total. Such low level of
implementation confirmed our critical findings published in previous
editions of Economic Development of Slovakia, that Slovakia cannot
withdraw the overall financial allocation for 2007 – 2013. Despite the
measures that have been taken in recent years at all levels of implemen-
tation, we estimate that by the end of 2015 maximum of 85 % from total
allocation for 2007 – 2013 will be withdrawn. The main factors negative-
ly impacting the utilization of cohesion policy resources include:
Low absorption capacity on demand and supply side,
Insufficient stability of administrative capacity at national and region-
al level,
Public procurement,
Applicant’s lack of experience with projects creation,
Lack of domestic financial resources needed for co-financing projects
Rent-seeking behaviour, lack of transparency,
Change in competences between authorities responsible for the man-
agement and implementations (change of managing bodies, interfer-
ence of ministries responsible for the implementation and agenda
transfer to other managing bodies),
Administrative complexity of realized projects, often beyond the EC
requirements.
The highest increase of resources withdrawal based on year-on-year
comparison was recorded in these operation programs (OP): Informati-
zation of Society (19.96 p. p.), Healthcare (8.39 p. p.), Transportation
(16.27 p. p.) Education (20.22 p. p.), Research and Development (17.04 p.
p.), Regional OP (6.75 p. p.) and Employment and Social Inclusion (13.25
p. p.).

85
The most successful OPs from withdrawal point of view are: OP
Healthcare, Regional OP, OP Employment and Social Inclusion, Bratislava
Region OP and OP Transportation.
F i g u r e 7.6 State of Commitment Withdraw in 2007 – 2013 to 31st December 2013 by Operational Programs
Source: <www.nsrr.sk>; own calculations.
In parallel with the end of programming period, the approval of the fi-
nal form of operational programs for current programming period took
place. Table 7.6 briefly presents the basic structure of operational pro-
grams of Partnership Agreement, responsible managing bodies and the
amount of total allocation (15.3 billion EUR) in years 2014 – 2020.
We can positively evaluate the reduction in number of operational
programs and management bodies. This creates appropriate conditions
for effective and especially faster programs implementation. It is essen-
tial to start with the projects real implementation of current program-
ming period in order to avoid negative phenomena that accompanied
previous period. There have not been withdrawn any funds from current
programming period in the second half of 2015, so it is necessary to max-
imize all efforts in order to start real implementation of operational
0%10%20%30%40%50%60%70%80%90%100%
0
500
1 000
1 500
2 000
2 500
3 000
3 500
Ed
uca
tio
n
Em
plo
ym
ent
and
So
cial
Incl
usi
on
Info
rmat
izat
ion
of
Soci
ety
En
vir
on
men
t
Reg
ion
al O
P
Tra
nsp
ort
atio
n
Hea
lth
care
Co
mp
etit
iven
ess
and
Eco
no
mic
Gro
wth
Tec
hn
ical
ass
ista
nce
Bra
tisl
ava
Reg
ion
Res
earc
h a
nd
Dev
elo
pm
ent
EU
R m
illi
on
Withdrawn (EUR mil.) Allocation (EUR mil.) Drawing, %

86
programs.20 Programming period 2014 – 2020 represents the last op-
portunity for SR to draw such strong support from the EU for moderniza-
tion and structural changes in the Slovak economy. These resources uti-
lization should be a key priority for government majority of any kind.
T a b l e 7.6 Operational Programs and their Allocation within the Program Period 2014 − 2020
Operational Program Managing body Allocation (EUR)
Research and Innovation MŠVVŠ SR 2 266 776 537
Integrated infrastructure MDVRR SR 3 966 645 373
Human resources MPSVR SR 2 204 983 517
Quality of Environment MŽP SR 3 137 900 110
Integrated Regional OP MPRV SR 1 754 490 415
Effective public administration MV SR 278 449 284
Technical Assistance ÚV SR 159 071 912
Rural development program MPRV SR 1 545 272 844
Fisheries MPRV SR 15 785 000
Total
15 329 374 992
Source: <www.partnerskadohoda.gov.sk/operacneprogramy>.
* * * *
The slight acceleration of economic growth in 2014 and its expected
continuation in 2015 should have a positive impact on the public finance
revenues. This is mainly due to the nature of economic growth which is
driven by domestic demand. An approaching end of political cycle is ex-
pected to have slight negative impact on the consolidation efforts and
consolidation pace target will not be met. A significant growth impulse
should be the implementation of projects from ending programming pe-
riod 2007 – 2013 as well as the start of new period. However, no real
funds have been withdrawn from new period even until the end of the
year.
20 It is appropriate to add that the delay is not caused solely by the SR. Without the EC approval of operational programs, it is impossible to withdraw funds.

87
8. LABOUR MARKET
Year 2014 was the one of positive news in terms of labour market.
Employment grew in line with the recovery of economic activity, in the
second half, and especially towards the year end, it grew with an unusu-
al intensity. New employees were arising mainly in industry, trade, in-
formation and communication branch and health care. The growth of
employees even compensated adverse development in case of sole pro-
prietors. A key moment occurred in the development of long-term un-
employment. For the first time in post-crisis period, there is a decrease
in the number of unemployed longer than two years, who represent al-
most half of the total unemployment. A favourable turn could be ob-
served also in development of the youngest unemployment category,
which was impacted by crisis the most. The unemployment rate of youth
decreased below one-third for the first time since the recession. Finally,
the positive development has been reflected also in accelerated growth of
average monthly wage. Real wage has grown at the fastest pace since 2007.
Unexpectedly strong employment growth
A gradual recovery of employment after the recession in 2009 started
to occur at the end of 2010, when employment grew till the end of first
half of 2011. However, it was a very weak growth and on average in
2011 it could be considered rather as a halt of employment decline. Later
on, in 2012, there was just weak growth of employment; as a reaction to
progressive slowdown of economy in 201221, clear decline in employ-
ment occurred in mid-2013. Stagnation of employment in 2013 (total
annual change in employment22 in 2013 was zero) was replaced by an
unusual increase in employment in 2014 (for development during men-
tioned period see Figure 8.1).
21 The growth rate of output declined during all quarters and in last quarter of 2012 the economic growth nearly stopped.
22 Employment according to the Labour Force Survey (LFS) calculated from the total number of employed persosns, thus including those working under agreements, seasonal workers, persons on maternity leave, working abroad for less than a year and persons in activation work.

88
The employment growth rate gradually accelerated during 2014 from
0.2 % in the first quarter to 2.7 in the fourth one. That is an increase of
2.1 p. p. compared to growth rate in last quarter in 2013. Therefore, in
fourth quarter of 2014, there were roughly 64,000 more employed peo-
ple in the economy than a year ago. Compared to previous quarter (third
one), the seasonally adjusted employment increased by 1 % (equivalent
to 24 thousand of people). Over the full year, number of employed per-
sons climbed with year-on-year growth 1.4 % to 2.363 thousand people.
The average year-round value is already higher than the average employ-
ment in the economy in pre-crisis year 2007 and only slightly lower than
in 2009, when employment began to gradually decline due to the crisis.
The only year when employment in Slovakia (calculated from number of
persons employed using LFS method) exceeded 2.4 million people
threshold was the year 2008. The decline in employment after 2008 was
significant and its gradual and discontinuous recovery resulted in fact
that even at the end of 2013, three years after recession, there was 139
thousand less people working in the economy than in same period of
2008. Gradually increasing growth of working people in 2014 lowered
this employment gap by almost a half: in the fourth quarter of 2014,
there were 75 thousand working people less than at the time when the
economic crisis occurred (Figure 8.1). The fact, that this persisting gap in
employment is a consequence of the economic development (and its im-
pact on the labour market) and not a consequence of the demographic
factors is proved by increase in number of economically active persons
which increased in mentioned period by 35.000.
The development of GDP (or output, value added) and employment in
long-term has shown that employment reacts to changes in the devel-
opment of product with approximate delay of three or four quarters.
This indicates that after the recovery of production, there comes a recov-
ery in employment with certain delay and vice versa, after the economy
decline, there comes also the employment decline, but with a time-
shifted bottom drop. Same logic could be found behind our expectations
(introduced in last issue of this publication) that mild improvement in
economic performance during 2013 will bring a gradual recovery in
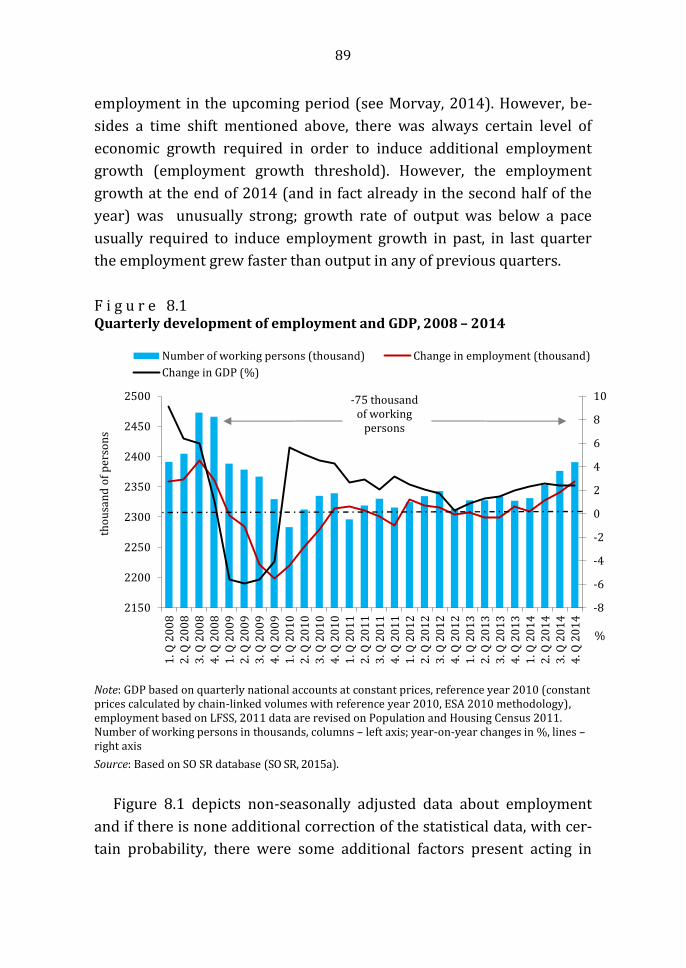
89
employment in the upcoming period (see Morvay, 2014). However, be-
sides a time shift mentioned above, there was always certain level of
economic growth required in order to induce additional employment
growth (employment growth threshold). However, the employment
growth at the end of 2014 (and in fact already in the second half of the
year) was unusually strong; growth rate of output was below a pace
usually required to induce employment growth in past, in last quarter
the employment grew faster than output in any of previous quarters.
F i g u r e 8.1 Quarterly development of employment and GDP, 2008 – 2014
Note: GDP based on quarterly national accounts at constant prices, reference year 2010 (constant prices calculated by chain-linked volumes with reference year 2010, ESA 2010 methodology), employment based on LFSS, 2011 data are revised on Population and Housing Census 2011. Number of working persons in thousands, columns – left axis; year-on-year changes in %, lines – right axis
Source: Based on SO SR database (SO SR, 2015a).
Figure 8.1 depicts non-seasonally adjusted data about employment
and if there is none additional correction of the statistical data, with cer-
tain probability, there were some additional factors present acting in
-75 thousand of working
persons
-8
-6
-4
-2
0
2
4
6
8
10
2150
2200
2250
2300
2350
2400
2450
2500
1. Q
20
08
2. Q
20
08
3. Q
20
08
4. Q
20
08
1. Q
20
09
2. Q
20
09
3. Q
20
09
4. Q
20
09
1. Q
20
10
2. Q
20
10
3. Q
20
10
4. Q
20
10
1. Q
20
11
2. Q
20
11
3. Q
20
11
4. Q
20
11
1. Q
20
12
2. Q
20
12
3. Q
20
12
4. Q
20
12
1. Q
20
13
2. Q
20
13
3. Q
20
13
4. Q
20
13
1. Q
20
14
2. Q
20
14
3. Q
20
14
4. Q
20
14
%
tho
usa
nd
of
per
son
s
Number of working persons (thousand) Change in employment (thousand)
Change in GDP (%)
90
favour of employment growth in this particular period. It is necessary to
bear in mind that there cannot be applied standard development trends
on period of recession as well as the recovery period. There are different
adaptation processes taking place at/or after major fluctuation in eco-
nomic performance. In such cases, it is useful to supplement the view of
development dynamics with indicators in absolute values. Regarding to
this, it is necessary to note than GDP (measured in billion EUR), as well
as GDP per capita (measured in both, current and constant prices – based
on ESA 2010) have exceeded pre-crisis level already in 2011. We can
assume that companies have already exploited standard crisis measures
like usage of their inventories and demand for higher productivity
growth (e. g. a slowdown in fast growth rate of labour productivity in the
largest sector, industry, to almost complete stop in productivity takes
place since 2013). All this aligned with positive sentiment in Europe has
led to a greater determination to restore part of the original employ-
ment. After the period when waiting tactic prevailed as a response to
previous two waves of crisis and option of maximized utilization of each
rational measure was dominant, the economic sentiment indicator
climbed over 100 for the first time since 2007 (it is above long-term av-
erage since May 2014, NBS, 2015). The positive expectations of employ-
ers have been accompanied with other secondary factors. According to
Central Office of Labour, Social Affairs and Family (COLSAF) and Social
Insurance Agency (SIA), there has been 2,500 new job positions created
with government funding in this period (NBS, 2015). However, this rep-
resents only a very small contribution to mentioned employment growth
rate.23 The NBS claimed that mild weather conditions in December could
have supported annual increase in construction activity (NBS, 2015a).
23 According to the European Commission, (EC, 2015) a package of legislative changes with an impact on the labour market since 2015 will keep on in contributing to positive employment development (e. g.., The introduction of tax deduction for health insurance of low-income groups, which reduces some employees and employers health insurance contributions). In addition to changes in health insurance, from 1.1.2015, there are some changes in social insur-ance as well (e. g., The students working on agreement with income lower than 200 EUR will be not included in social contributions obligation and the employer wil pay for them only accident and guarantee insurance contributions.) Also changes in Labor Code take place (in the fight against illegal work, the Code adjusts the definition of depending work – there will be no more the condition of perfoming a work for wage or remuneration; and the amendment also amends several provisions of agency work.)
91
The base for such claim is uncharacteristically low inflow of unem-
ployed from construction branch by COLSAF. However, the data of Statis-
tical Office rather did not confirm such hypothesis. On the contrary,
number of employed (sum of employees and entrepreneurs) in construc-
tions in the fourth quarter declined in year-on-year comparison and
quarter-on-quarter comparison as well. Rather, the assumption of rela-
tive strong impact of robust revenues in trade on employment has been
justified in this sector (the driver of employment growth was mostly
wholesale, which increased revenues from own performances and goods
by 7 % and employment increased by the same value). Another NBS
statement (Karšay, 2014) assigns the contribution to stronger employ-
ment growth in LFS methodology to a stronger inclusion of unemployed
to activation works (already in the third quarter).24 But even according
to quarterly reports, employment soared in the third and the fourth
quarter by dynamics not standard to development of long-term thresh-
old of employment growth.
From sectoral point of view, the employment growth (not only) in the
last quarter of 2014 was most dominant in industry , which was con-
firmed by both methodologies. Number of working people in industry by
LFS grew in the last quarter by 51.1 thousand persons (in manufactur-
ing by 43.8 thousand), number of persons employed (according to quar-
terly statistical reports) compared to the same period of previous year
increased by 7.8 thousand (the highest increase in all sectors). The in-
dustry employs about a quarter of all workers in the SR, so the growth of
employment in industrial sectors was the key factor of turnover in
growth. Even in previous year 2013, we had to conclude that the de-
crease of employment in industry along with decrease in construction
were the main contributors to employment stagnation. According to
quarterly statistical reports, main contributors to the total surplus in
employment in the last quarter of 2014 (already mentioned 45.3 thou-
sand people) were industry and trade – it means (and is crucially im-
portant) two largest sectors (as regards employment) along with sectors
24 LFS methodology compared to quarterly statistical reports really involves e. g. persons paid for activation works, but also those on maternity or parental leave or workers working on agreement.
92
of information and communication, health, accomodation and food ser-
vices provided around three quarters of annual increase. On the contra-
ry, adverse effect on employment growth had construction sector due to
decrease in output for foreign countries and domestic market in terms of
new constructions and reconstructions (the only not decreasing con-
struction activity was section of repairs and maintenance).
Obviously, year-on-year expression is also a reflection of the state in
the same period of previous year. By look at quarter-on-quarter changes,
the strongest recovery in terms of total employment of SR was recorded
in second and third quarters. The overview of whole year confirms gen-
eral trend of improvement in employment (noticeable already since the
second quarter). For example, the index of industrial production grew
quickest in first months and up to first half of year, revenues in industry
have already grown at the turn of 2013/14 – the development in indus-
try is usually a good indicator for expectations of future employment
changes. Unusual year-on-year employment increase in the fourth quar-
ter was rather a reflection of longer development in mentioned sectors
than one timer fluctuation.25
In 2014, number of private enterprises in Slovakia steadily increased
in all quarters but this increase was comparable to the development in
previous years. Therefore, stronger employment growth in the second
half of the year can not be attributed solely to creation of new business
entities, but rather to recruitment efforts of already existing enterprises
in selected sectors. The fact that improvement in employment can be
attributed to employees is verified by development of business entre-
preneurs statistics. The number of entrepreneurs-natural persons de-
clined all over the year, with an exception of January 2014. The decrease
can be attributed to category of sole proprietors (particularly in trade
25
According to recent data for the first two months of 2015, industrial production index contin-ues to grow (but at lower pace than at the beggining of 2014), as well as revenues in some key sectors. Even a year-on-year recovery of construction sector takes place (but no positive effect on employment yet). The expectation of positive employment development thus transferred into the beggining of next year. The employment growth was pulled in first months of 2015 mainly by selected market services and information and communications. Employment growth terminated in the sector of wholesale. In terms of sector size, positive contribution is expected from trans-portation and industry, however, it cannot be assumed that unusually positive growth from last quarter of 2014 will be repeated also in the first quarter of 2015.
93
and industry). The number of those was diminishing (y-o-y) mainly in
the second half of the year (however, more detailed monthly view ad-
justed from comparative base of previous year reveals that number of
sole proprietors notably decreased mainly in first seven months). Any-
way, at the end of 2014, Slovakia had about 12.7 thousand entrepre-
neurs-natural persons26 less than year before; (SO SR, 2015c). Thus, it is
appropriate to considerate whether some proportion of sole proprietors
did not change the character of their employment to regular employees
(therefore positive development of employment would not be just a re-
sult of new employees recruitment, but also change in the employing
form of already working persons). This change of employment type
could be caused due to wane of motives from employers side as it used
to be preferred form of employment during crisis (we have already ana-
lyzed this phenomenon in previous publications) or even as a result of
negative legislative changes (e. g. it might be the effect of amendments
adopted in January 2013, including the tightening of dependent work
definition, the increase of tax base or the introduction of minimal social
contributions for sole proprietors; see Morvay, 2014). Since the intro-
duction of these legislative changes (January 2013), number of sole pro-
prietors in the SR decreased by approximately 22,400 with quicker de-
crease just in year 2014.27
Unlike the previous year, when two-thirds of total annual loss of em-
ployees was due to the employment reduction in small and medium-
sized enterprises, in 2014, there has been an increase of employees in all
three category sizes of SM Es. In every category; micro, small and medi-
um-sized enterprises; the average growth of employment was 3 %. Small
26 Sole proprietors represent 91 % of enterpreneurs – thus we focus mainly on this category.
27 Regards to impacts of legislative changes on the employment forms, a special attention was paid to employment on non-full time agreement basis. Those were impacted the most by recent legislative changes. Since January 2013, this form of employment is subject to full social contribu-tions, which resulted in a dramatic decline of agreements. In January itself, the number dropped by more than half and despite their partial stabilization in following months the total number shrunk between December 2012 (old legislative) and December 2013 by 200,000. At the end of 2013, the Social Insurance Agency recorded 440.3 thousand agreements. Even in 2014, the num-ber of people working on agreement did not restore back to original values, the highest number of agreements in 2014 was recorded in November – 466,700 and by the end of year Social Insur-ance Agency registered 455,200 agreements (all types). That is still almost 190,000 less than in the same period prior the adoption of legislative changes (December 2012).
94
and medium enterprises (250 employees) create more than 40 % of total
Slovak employment (their share in employment has increased compared
to previous year).
The improvement of labour market developments on the supply side
is also reflected in vacancies increase . In 2014, there was around 1000
more reported vacancies than year before.
Even long-term unemployment and youth unemployment is decreasing
We have witnessed positive turnaround in unemployment even be-
fore the end of 2013, when in the last quarter, the growth of unemploy-
ment not only stop, but even a slight decline occurred. Even through it
was slight one percentage y-o-y decline in number of unemployed per-
sons (LFS), the decrease in unemployment rate occurred for the first
time after two years of continuous growth. Throughout the year 2014,
the process of further unemployment decrease progressed, unemploy-
ment was decreasing more and more significantly and in the second half
of the year, number of unemployed was diminishing at 10 % pace. The
result of five quarters lasting drop in unemployment was reduction of
unemployed persons by 42 thousand. This looks even more positively in
longer term view of last four years. While in the first quarter of 2010,
when the post-crisis surge in unemployment reached the peak, there
were more than 400 thousand of unemployed (407,000), in the last
quarter of 2014, Slovakia had around 345 thousand people unemployed
(LFS). Thus, four years after the unemployment peak as a consequence
of economic crisis of 2009, there is about 62,000 unemployed less in SR.
Most of this decline in unemployment was realized in 2014.
In 2014, number of unemployed shrunk on average (y-o-y) by about
27,000 unemployed, which compared to 2013 represents a decrease of
7.1 %. The resulting annual average of unemployed is 358.7 thousand
persons, which is the lowest value for last five years. Unemployment in
SR has returned to the level of 2006 after a significant increase caused by
crisis. However, there are still about 100 thousand persons unemployed
95
more as was in pre-crisis 2008 (see Figure 8.2). The unemployment
showed similarly positive trend in the middle of 2011, when the number
of unemployed persons (as well as in 2014) approached to 350 thou-
sand. However, the second wave of economic problems prevented the
recovery process of labour market and in the first quarter of 2013, num-
ber of unemployed climbed again almost up to 400 thousand. Therefore,
the positive turnaround of unemployment in 2014 needs to be evaluated
with caution.
In 2014, the fastest decrease was recorded in category of persons un-
employed from 3 to 6 months, as well as 6 months up to one year. In the
category of unemployed up to 3 months (the shortest unemployment)
was the inflow and outflow almost even during the year. The highest
contribution to unemployment decrease in 2014 can be attributed to
category of long-term unemployed (and within it, the category of unem-
ployed for period longer than 2 years). As it is the largest group of un-
employed in terms of unemployment duration, from total value of 27,000
unemployed less, this group of being unemployed for longer than 2 years
contributed to this fall by almost a half. The key moment in unemployment
development in 2014 is a drop in the number of persons unemployed for
more than two years. In all other categories of unemployed according to
duration of unemployment the decline was recorded already in 2013 –
however, even a reduction of absolute numbers in all groups of unem-
ployed for less than 2 years failed to offset 10 percent increase in long-
term unemployed then. Therefore, the resulting increase of unemploy-
ment was caused solely by this category in 2013. Not only in 2013, but
also in 2011, after a temporary prospects improvement of the economy,
number of unemployed up to 2 years decreased (in all categories). In
2012, the direct response to the deterioration of economic development
was a slight increase in short-term unemployment. However, it has been
reflected in long-term unemployment (more than 2 years) only in quar-
terly results. The only group of unemployed, which tended to continu-
ously grow since the 2009 recession was a group of persons unemployed
for more than 2 years. The turning point occurred in the second quarter

96
of 2014 and y-o-y decline in the number of longest unemployed people
kept to exacerbate during the rest of the year.
The category of persons unemployed for more than 2 years has a cru-
cial impact on the development of total unemployment. This category
currently includes around half of all unemployed in the SR (48.9 % in
2014; a gradual increase in the share of this group on total unemploy-
ment after 2009 can be read from the Figure 8.2) and prolongation of
jobless period reduces the chance of such persons to integrate into the
workforce. In total, long-term unemployment (defined as unemployment
lasting more than one year) represents (as well as in 2013) about 67 % of
total unemployment, which stands for two-thirds of total unemployment.
As short-term unemployment (up to 1 year) kept decreasing after 2009
in every year (with an exception of 2012), in case of more numerous
long-term unemployment we have been waiting for positive turnover for
5 years. A certain slowdown occurs at the end of 2014, when number of
persons in the category of shortest unemployed (which directly reflects
or indicates the arrival of the changes) increased. In case of unemployed
up to 1 month – its size doubled, and size of unemployed up to 3 months
increased by a quarter.
The fact that unemployment in 2014 dropped the fastest in category
of persons unemployed for less than 6 months (LFS) has been partially
acknowledged by decline in financial demands on Social Insurance
Agency in terms of unemployment insurance. Even though the average
unemployment benefit grew by 11 EUR compared to 2013, total insur-
ance benefits amount paid to unemployed decreased by 18.8 million EUR
compared to year before. In fact, the average monthly number of benefits
recipients declined by 12.6 % compared to previous year (data of the
Social Insurance Agency <www.socpoist.sk>). The average number of
disposable job applicants decreased in 2014 compared to previous year
from 380.7 thousand to 345.2 thousand people according to the Social
Insurance Agency. That means the drop in registered unemployment
rate from 14.1 % (the highest measured value since 2004) to 12.8 %,
representing even more significant decline compared to the one accord-
ing to the LFS methodology. By LFS methodology, unemployment de-

97
creased by 1 p. p., from 14.2 to 13.2 %. Another positive signal where we
can see similar trend in both methodologies is a halt of growth in aver-
age duration of job-applicants registration as unemployed in the Labour
Office. The duration of job-applicant registration in the Labour Office
after crisis rose gradually from 12 months up to 17.4 months in 2013.
Based on preliminary data of COLSAF, the average period of registration
in 2014 remained unchanged (or even slightly shortened). This relates to
stop in long-term unemployment growth (i.e. stop of continuous increase
in the number of persons unemployed for more than 2 years) which we
mentioned in text above.
F i g u r e 8.2 Development of Total Unemployment and Long-term Unemployment as its component (2000 – 2014, thousand persons)
Note: Based on LFSS methodology, data for 2011 are revised on Population and Households Census 2011.
Source: Based on SO SR database (SO SR, 2015a).
In addition to a one p.p. drop in the unemployment rate (LFS), it is
worth to elaborate a deeper insight into its development by age cohorts.
As the development in Europe showed, the most vulnerable group in times
of economic recession was group of young people. The unemployment rate
485 508 487
459 481
428
353
292 258
324
389 365 378 386
359
0
100
200
300
400
500
600
2000 2001 2002 2003 2004 2005 2006 2007 2008 2009 2010 2011 2012 2013 2014
Unemployed persons
In it: Long-term unemployed (more than 1 year)
In it: Unemployed more than 2 years
tho
usa
nd
s

98
of youth (up to 25 years) climbed as a consequence of the crisis to 33 %
immediately after the recession and maintained at this level for 4 years.
Its decline to level just below 30 % is then long-desired positive turn in
2014. In years 2009 – 2011, Slovakia recorded the fourth highest youth
unemployment rate in the EU; In 2014, Slovakia ranked on 7th positon
among the EU members with youth unemployment rate of 29.7 %.
The unemployment rate of young people aged between 25 – 29 de-
clined as well (to 16.1 %, which is also the lowest value in this category
since 2009). This category was initially the largest group of unemployed
broken down by age. And these persons aged 20-24 and 25-29 account-
ed for (even in 2013) two largest groups of unemployed. In 2014, their
number dropped in total of nearly 20,000. This is remarkable fact, as the
total loss of unemployed in SR was 27,300.28 The group of persons aged
up to 30 years was in a long run the only category with unemployment
rate higher than the rate of total unemployment (with exception of last
year 2014, when above-average value of unemployment was experi-
enced also in group 30 – 34 years). Not surprisingly, several labour poli-
cy measures were targeted especially at these age categories. Slovakia
has implemented its own version of the European program “Youth Guar-
antees”, within which the labour offices provided targeted information
and counseling services, assisted students in career choices, prepared
exchanges of information, several project activities were implemented
including nationwide projects enabling employers – entrepreneurs, but
even local governments, to receive a contribution for creation of job po-
sition for job-applicant aged up to 29 years.29 As an example of the
real outcomes of the program, the Ministry of Labour presented these
28 In both age groups occured a decline in a general active population. The fact that demographic factor is not responsible for unemployment decline is proven by improved performance of both groups in terms of unemployment. 29 The governemnt also ratified legislative changes, the amendment to Act on Employment Ser-vices in force in the Slovak Republic since January 2015 introduces a new form of support for young in their first regular paid job – a contribution to employers who employ those young peo-ple (up to 25 or 29 years) registered as unemployed and did not have prior permanently paid job (lasting at least 6 months). This measure is targeted on two groups of unemployed: the youngest groups, but also on persons without any previous work experience. Unemployed with no previ-ous job experience create significant part of total unemployment – up to 24 % of all unemployed (almost a quarter) falls into this category (which represented 86,000 unemployed in 2014). Some of them are young people, graduates, this new measure is targeted on them.

99
projects, undertaken by the ESF, aimed at creation of jobs for job-
applicants up to 29 years. According to Ministry, there were supported
nearly 13,000 job positions with the help of these projects for youth un-
employed. Out of them, 7,000 of young people have been placed and
even after the support of job position was completed in August 2014,
thus the obligatory employment as well, 80 % of them continue to re-
main in employment (MoLSAF, 2015). However, there are still more than
117,000 young people out of work aged under 29 in Slovakia (LFS). Back
in June 2014, the EC (on the occasion of release of specific recommenda-
tions to member states) listed Slovakia in the group of eight countries
where youth unemployment is particularly high and where the EC regis-
ters serious shortcomings in the implementation of the “Youth Guaran-
tees”. The Commision recommends that these countries should use
structural measures such as enlargement of the Labour Offices capaci-
ties, building partnerships in order to reach out to inactive young popu-
lation which is missing in the evidence or improve the system of appren-
ticeship. In 2014, number of youth unemployed under 29 years de-
creased from 9.3 million to 8.6 million in the EU, however, the high rate
of youth unemployment is still considered to be serious and persistent
problem.
Another area highlighted in the Commision´s recommendations is
the need to decrease long-term unemployment. As we have noted
above, in Slovakia long-term unemployment represents two-thirds of
total unemployment, out of which only unemployed for more than two
years corresponds to half of total unemployment (while the EU aver-
age is less than 30 %). Therefore, there is no wonder that the Com-
mision includes Slovakia even in this area among the countries where
the sustainability of these people employability requires improvement
in active labour market policies and improvement of public employ-
ment services performance.
The continuation of favorable development in employment and un-
employment is expected also in near future. This indicates also SO SR
data for the first months of 2015, the expectations of employers, forecast
of NBS or comments of Instute of Financial Policy (IFP) in MF SR. The
NBS even slightly corrected its initial estimate for first quarter of 2015 in

100
its April bulletin due to unexpectedly strong acceleration of employment
growth in February (after January slowdown). Another factor for correc-
tion was the decline in March number of registered unemployed with
pace higher than the average decline for past six months (declining trend
of outflow was attributed to the lower phase out of applicants from reg-
ister for administrative reasons rather than weaker job placement). Last
factor invoking correction was growing number of reported vacancies.
By the end of March, there was the highest number of vacancies available
during whole post-crisis period (NBS, 2015b). The IFP comment (Ha-
brman, 2015) even comes with the hypothesis that developments in
post-crisis period suggests change in the relationship between economic
growth and employment. While before crisis, there was necessary eco-
nomic growth of 3 % in order to move with employment (we deal with
this topic at the beginning of chapter), after the crisis only 1.5 % eco-
nomic growth is required in order to change employment. The hypothe-
sis is based on observation that the response of employment to GDP fluc-
tuations is prolonged (reacts to GDP changes not only for the current and
previous three quarters, but for current one and previous five quarters)
and is twice that strong than before crisis. It means that employers are
more cautious in recruitment efforts and respond to long-term develop-
ment, for short-term changes in performance they use rather change in
number of hours worked.
The favorable development of employment and unemployment trans-
formed also into faster wage growth in 2014. The average nominal wage
increased by 4.1 % in comparison with 2013 and reached level of 858
EUR. This growth rate was higher by 1.7 p. p. compared to the previous
year. Due to the stagnation of price level (for more information see Chap-
ter 5), the growth of real wages was 4.2 % (the highest one since 2007;
see Figure 8.3) with positive impact on houselds disposable income (it
has been also reflected in a higher share of compensation of employees
in growth of household income; see Chapter 1) and thus on domestic
consumption.
The fastest growth in the average monthly wage was recorded in Fi-
nancial and Insurance Activities sector where employees gained in y-o-y
comparison 126 EUR and in Administrative Services sector, where the

101
monthly wage increased by 63 EUR. The growth of wages occurred in
almost all sectors of the economy in 2014 with exception of Accommoda-
tion and Food Services and Construction, thus two sectors of the econo-
my with the lowest average wage. The average monthly wage of employ-
ees in Accomodation and Food Services was 511 EUR which is 3.3 times
lower than the average one in top-earning sector – Information and
Communication.
F i g u r e 8.3
Nominal and Real Monthly Wages in 2006 – 2014
Source: Based on SO SR database.
* * * *
In 2014, we have seen a change in the relationship between economic
growth and employment growth. Naturally, during the period after a sig-
nificant fluctuation in economic performance, adaptation processes usu-
ally occur with distortion of the long-term development trends. Howev-
er, it would be very beneficial for the Slovak economy if the coming years
confirm that the previously tepid relationship between output growth
and employment growth (compensated by high productivity gains) will
be gradually replaced by closer interdependence based on strengthening
position of domestic demand and expansion of labour intensive sectors.
623 669 723 745 769 786 805 824 858 95
96
97
98
99
100
101
102
103
104
105
500
550
600
650
700
750
800
850
900
2006 2007 2008 2009 2010 2011 2012 2013 2014
Average nominal monthly wage (EUR)
Real wage index (sppy = 100)

102
9. OVERVIEW OF SELECTED LEGISLATIVE AND ECONOMIC
POLICY MEASURES
In 2014, as key short-term national economic strategy, we can consid-
er the document National Reform Programme of Slovak Republic 2014.
The document “describes structural measures to achieve sustainable
economic growth, creation of new job positions and improvement of life
quality”. Proclaimed core topic of adopted measures should be employ-
ment in 2014. The priority areas of interest remain (as in previous years)
the consolidation of public finances, the fight against fiscal evasion (im-
provement in VAT collection, strengthening of the tax administration
capacity and linkage of real estate taxation with its market value), the
energy market and increase of public administration efficiency (contin-
ued reforms of ERO). Labour market policies are aimed at employment
services and long-term unemployment, youth unemployment and educa-
tion linkage with practice.
Complex character has adopted medium-term economic policy Strat-
egy of the Slovak Republic – Slovakia 2020+. Its aim is “the synergic im-
plementation of policies for promotion and exploitation of potential
strong areas and competitive advantages of Slovakia and correlation of
policies affecting economy and rural development, research and devel-
opment, human resources, transportation and environment.”
The government adopted the Concept of capital market development.
Its main strategic goal is to restore basic functionality of Slovak capital
market (to link supply of available medium and long-term capital to de-
mand) and increase financing of the real economy by long-term house-
hold savings. The suggested measures concern mainly on the recodifica-
tion of the Act on Bonds, the rules of the Act on venture capital funds,
preparation and administration of mechanisms for retail government
bonds issue, amendments to the Collective Investment Act, amendments
to the Securities Act (investment certificates issuance), development of
supplementary pension savings (personal pension schemes), changes in
the Health Insurance Act and the Income Tax Act (tax and social contribu-
tions burden of financial market trading). The planned measures include

103
also reduction of administrative complexity, regulation and market in-
frastructure.
Based on this concept, the amendment to the Act on Bonds, (No.
206/2015 Coll.) was adopted and brings deregulation in terms of bonds
traded in Slovak capital market. Its aim is to support creation and devel-
opment of new innovative firms through the corporate bonds issuance
(alternative source of financing for small businesses). It simplifies the
issue conditions, e.g. it cancels the NBS supervision over new bonds is-
sues. The amendment strengthened the rights of bondholders by intro-
duction of institutes – a joint meeting of owners and bondholders repre-
sentative.
The financial market operation was adjusted by the amendment to
the Bank Act (No. 213/2014 Coll). It enabled introduction of new inter-
national Basel III standards or changes related to housing loans. The
amendment is aimed at banks functioning, investment firms and security
dealers improvement, but also to ensure better financial stability. It in-
troduces more strict requirements on the regulation and changes compe-
tences of the NBS in terms of supervision.
The business activities of consumer loans providers was changed by
the amendment to the Act on Consumer Loans and Other Loans and Cred-
its for Customers. The licenses for providers of consumer loans, which are
not banks, were introduced. There has been introduced also an obliga-
tion to provide information on consumers loans into registry. This is re-
lated with a new creditor obligation to consult loans provision with at
least one register in order to evaluate consumer’s ability to repay the
loan. The amendment also introduced a new authorization procedure by
the NBS (restricted and unrestricted permission dependent on volume of
provided loans). The tightening of consumer loans provision was aimed
at consumers protection increase on consumer loans market.
The regulation of business environment was adjusted by adoption of
some new legislative standards in 2014. Changes in the protection of
economic competition have been brought by amendment to the Act on
the Protection of Economic Competition (No. 151/2014 Coll.) The
amendment introduces a possibility of financial reward to citizens for

104
submission of evidence proving cartel. The amendment prohibits agree-
ments restricting economic competition consisting of coordination of
entrepreneurs in public procurements or public business competitions.
An introduced institute allows the settlement on fine reduction in case,
that participant pleads guilty or takes responsibility.
The amendment to the Commercial Code allows to establish two types
of limited liability companies – with registered capital of less than
25,000 EUR (i. e. One-Euro Enterprises) and companies with registered
capital above it. A new type of “One-Euro Enterprises” should facilitate
the establishment of start-ups. Its operation has tightened conditions:
the number of partners is fixed at maximum of five, the obligation to in-
dicate amount of registered capital and the scope of its repayment on
commercial documents, the obligation to form higher reserves; some
restrictions are also established in disbursement of profits. The amend-
ment introduces a non-public register of disqualifications (list of indi-
viduals – company statutory with final judgment of prohibiting the oper-
ation). It also introduces a new provision – enterprise crisis (essential for
assessment is ratio of equity and liabilities of the company30). The enter-
prise in crisis can apply “realization replacing own resources”, i. e. addi-
tional external sources funding of critical enterprise state. The aim is to
protect creditors.
The aim of new the Act on Ownership Acquisition of Agricultural Land
(No. 140/2014 Coll.) was to regulate acquisitions of agricultural land and
avoid (or at least make it difficult) speculative purchases of agricultural
land. After EU accession, there was a moratorium on sale of agricultural
land to foreigners in Slovakia. The Slovak government tightened the reg-
ulation of sales by this Act due to expiration of moratorium. The prefer-
ential rights on cultivated land should belong to persons already en-
gaged in agricultural activities in municipality, in which the land is situ-
ated or in adjacent municipality. Only after that, an authorized person for
purchase could be someone who carries out agricultural activities else-
where.
30 The company is in crisis or threatened by crisis if ratio of equity and liabilities is less than 4 to 100 in 2015, less than 6 to 100 in 2016 or less than 8 to 100 from 2017 on.

105
In terms of taxation, there was a number of amendments adopted in
2014. The amendment to Act on Income Tax (No. 333/2004 Coll.) intro-
duces several significant changes. In particular, it changes the approach
of assets depreciation: number of depreciation categories expands from
four to six; special procedure for depreciation of leased tangible assets
was abolished, the conditions were changed for accelerated depreciation
as well as cars depreciation. The increase of R&D support was imple-
mented through this amendment by additional deduction of 25% of R&D
expenditures (i. e. super deduction of R&D expenditures). The amend-
ment changes method of employees benefits taxation, introduces a with-
hold tax on pharmaceutical companies from cash benefits provided to
doctors and self-taxation of doctors from donations and other non-
financial benefits from pharmaceutical companies. The amendment ex-
tends an obligation to use cash registers and reduce an option of taxes
assignation on corporate income tax in favour of non-profit organiza-
tions (it should decrease to 0.5 % by 2019).
The amendment to the Value Added Tax Act (No. 222/2014 Coll.) in-
troduces several changes. (i) For taxpayers providing electronic services,
telecommunication services and radio and television broadcasting sys-
tem, the amendment establishes so-called Mini One Stop Shop. This is
simplified reporting regime of applied foreign VAT in single contact
point of country in which the company is established. (ii) It changes the
deadline for the tax office to register company as a VAT payer. (iii) It
clarifies travel agencies taxation. (iv) It changes submission period of
recapitulative report, (v) refund of excess VAT, (vi) and removal from the
blacklist. The area of local taxes was adjusted by amendment to the Act
on Local Taxes (No. 268/2014 Coll.). The changes occurred in definition
of tax subject and institute of tax determination was extended.
The amendment to the Act on Pension Savings (No. 183/2014 Coll.)
changed conditions for pension payments; recast the area of pension
claims administration or area of proposals to pension management com-
panies or insurance companies for pension payment submission.
The amendment to the Assistance in Material Distress Act (No.
308/2014 Coll.) was adopted with the aim of motivation increase among

106
long-term unemployed or inactive persons in working age for better em-
ployability on labour market. It defines new conditions to eligibility for
special allowance enabling concurrence of special allowance provision
along with assistance in material distress. Basic state benefits 61.6 EUR
will obtain only person in material distress who works 32 hours per
month in minor municipal services or volunteering activities. The
amendment tightens also eligibility to the activation contribution, which
will be available only for persons who works within municipal services
at least 64 up to 80 hours per month.
In the area of energy efficiency, the new Act on Energy Efficiency was
adopted. Its aim is to increase efficiency of energy use, especially in final
consumption areas with great potential of savings (buildings and indus-
try). The Act amends the system of mandatory energy audit (energy au-
dit execution is required only from large enterprises). The Act also estab-
lishes new obligations on building owners and managers with area
above thousand square meters. The new Act is the transposition of Eu-
ropean legislation, which is part of the EU strategy for energy consump-
tion reduction by 20 % in 2020.
Relatively large proportion of public policies is funded by the EU
funds. The status and competences of public authorities in usage contri-
bution from EU funds is regulated by new Contribution from the Europe-
an Structural Funds and Investment Act (No. 292/2014 Coll.). The new
Act regulates legal relations, procedure and conditions for grant provi-
sion as well as the rights and obligations of persons regarding grant pro-
vision, competence of government administration and local authorities
in grant provision and responsibility for grant terms breach.
* * * *
The measures adopted in 2014 were based primarily on the National Re-
form Programme and Action Plan of the National Reform Programme. Pri-
ority areas, which were the subject of new legislation, could be considered a
fiscal consolidation, solving problems of labour market and social sector.
On the other hand, adopted measures are negatively perceived in terms of
their impact on quality and competitiveness of business environment

107
(e. g. an extensive amendment to the Income Tax Act or amendment to
the Protection, Support and Development of Public Health Act). The ef-
fectiveness of innovative tools aimed at business environment improve-
ment and establishment of new enterprises (e. g. An amendment to the
Commercial Code, the Act on the Bonds or Super deduction of R&D ex-
penditures) will be possible to evaluate after a certain time.
Most of new measures is the transposition of European legislation and
follows the implementation of EU economic policy. For example, already
mentioned amendment to the Bank Act is a response to financial crisis or
amendment to the Energy Efficiency Act is a measure of European envi-
ronmental policy. However, domestic law-creative initiative motivated
by phase of electoral cycle also found its space (e.g. free train travel for
selected population groups, raise of minimum wage, the wage limit for
agreements on temporary work or a new the Water Act).
F i g u r e 9.1 Doing Business Indicators – Distance of Slovakia from the Best (%)
Source: World Bank (2015).
0 20 40 60 80 100
Starting a business
Dealing with construction permits
Getting electricity
Registring property
Getting credit
Protecting minority investors
Paying taxes
Trading across borders
Enforcing contracts
Resolving insolvency
2015 2014
108
The influence of policy measures and regulation on the economy and
business environment is annually measured and evaluated through the
World Bank Doing Business Index. In 2014, the Slovak economy ranked
37th (in 2013 ranked 35th) regarding the regulations impact on business
environment. Slovakia has relatively good position (measured by dis-
tance from the value of best countries in indicators – Figure 9.1) in prop-
erty registration legislation and new enterprise establishment legisla-
tion. On the contrary, Slovakia lags behind in minority shareholders pro-
tection.

109
10. OUTLOOK FOR 2015 AND 2016 The outlook is formed at a time when after several years of pessi-
mism in the euro area, there is more favourable development expected
(e.g. European Commission forecast from May, see EC2015). After two
recessions (within the same crisis) in 2009 and 2012-2013, after waves
of mistrust and insecurity, we have seen that since the second half of
2013, a situation calms down after long time and we witness forecasted
macroeconomic parameters of the euro area being corrected towards
more positive values.
There were several arguments in previous chapters that have oc-
curred and are appropriate to recall in the process of outlook formation:
1. The Slovak economy belongs among those EU countries, which have
already overcame so-called second bottom of recession (many coun-
tries still have not overcame it yet). However, the economy dynamics
is still below values, which were used to be in place prior to the first
bottom (i.e. before 2009). The parameters of such growth, however,
belong to unique, already outperformed phase of economic develop-
ment and their repetition can be hardly expected. Slight strengthening
of economic growth has been associated with improvements in sever-
al parameters of macroeconomic stability (balance). In general , en-
hanced macro-stability could be considered as a sign of improved
economic growth quality.
2. Even relatively weak (given the Slovak economy circumstances)
economy growth was associated with improvement in labour market
development. Probably, the model of Slovak economy growth in which
the economy can expand under one-time productivity gains and with
little involvement of additional work force is retreating. This is very
important for the outlook formation: we can probably assume the
growth of employment will occur even with lower economic growth
rate (even in those cases, which we previously considered to be “be-
low threshold values”).
3. The monetary policy in the euro area can boost economic growth in
Slovakia, although this policy might not fulfil expectations associated

110
with it. The quantitative easing policy, further characterized (includ-
ing the potential benefits and risks) in Chapter 4 should fight against
deflation, boost consumption and investment and thus the real econ-
omy including creation of new job positions. However, this policy is
realized at late stage and such policy of cheap money softens envi-
ronment and might weaken the reform efforts of member state gov-
ernments causing postpone of the euro area recovery. Nevertheless,
given the outlined period of this publication, we can expect a positive
impact of monetary policy on current economic growth.
4. The depreciation of EUR against USD could boost exports from Slo-
vakia to certain countries outside the euro area. It is another positive
factor influencing economic growth.
5. The European economy should be supported by investment package
worth 315 billion EUR approved by the European Council with aim to
mobilize investment (the full effect is beyond of our outlook horizon).
6. The government has managed to reduce public finance deficits to tol-
erable limits, however, a motivation for further consolidation has
weakened (see explanation of negative value in the indicator “consol-
idation efforts” in the Chapter 7). Given the political cycle, we can as-
sume, the consolidation efforts will mitigate and the target of achiev-
ing balanced budget on a structural basis in 2017 (the horizon is be-
yond the outlook) is likely to be unfulfilled.
These background information will be incorporated into considera-
tion of development trends – see below. Also a confrontation of last
year’s outlook 2014 with real development in 2014 (Morvay et al., 2014)
will serve as background information for outlook formation.
Comparison of Previous Forecast with Real Development
By critical evaluation of past outlooks, a better formation can be ex-
pected for them in the future. Our last year’s outlook for 2014 expected
recovery of economic growth, employment growth, decrease in unem-
ployment rate and decline in inflation. With such a gross perspective, we
can conclude that the trends were estimated correctly (that is already a
success). However, with a more detailed evaluation, it becomes obvious

111
that last year’s outlook was very cautious; it correctly identified the na-
ture of changes, however, the quantification of their impacts was too
cautious.
For example, the outlook expected a slower growth of price level, but
it did not include total absence of inflation (or even a sign of deflation).
In addition, the outlook correctly anticipated recovery of employment
growth (after previous stagnation), but not to such extent as it actually
happened. Moreover, of course, underestimation of employment growth
is connected with predicted insufficient decrease of unemployment rate.
These “inaccuracies” have a common feature: they are associated with
such phenomena that almost never occurred in past development of the
Slovak economy (deflation and strong employment growth in times of
low GDP growth), so they have been considered as unlikely even in case
of outlook for upcoming years.
A special attention deserves the problem of strong underestimation of
employment growth (it is a problem of all available forecasts from that
period). We did not expect that with still relatively weak (although
stronger in y-o-y comparison) economic growth, there could be achieved
such a high growth in number of workers (Table 10.1). This is related to
the fact that a significant growth in employment was present in past only
if there was very strong economic growth in place as well. It was obvi-
ous that the model in which economic growth is achieved by sharp
productivity gains and little need of additional workers will reach its lim-
its. However, it was very difficult to predict when these limits become
apparent. As already indicated in Chapter 1, the economic growth driven
by massive labour productivity gains (overcoming of productivity gap
between more developed countries and those that are catching up) could
re-appear in the next wave of FDI inflows and the rise of their activity (as
in periods 2003 – 2007). However, we do not expect such scenario to
take place. Economic growth in upcoming years will not be driven by
wave of FDI inflows (however, we do not rule out their possible inflow!)
and significant moves in the level of technology or productivity. It is nec-
essary to take into account in the process of outlook formation that em-
ployment growth may be stronger than we would expect in past given
the rate of economic growth.

112
At first glance, it might seem that the forecast of economic growth rate
was very successful and copied real development. However, also here, we
must take into account the methodological changes mentioned in Chapter
1 (adoption of ESA 2010 methodology system of national accounts). Data
on changes in real GDP (first row in Table 10.1) cannot be directly com-
pared. In time of last year’s outlook, we relied on data measured by ESA 95
methodology. Forecasted y-o-y change in GDP (current prices) proved to
be exaggerated – however, this relates to the fact that we did not expect
price levels decline (as a result, GDP was in our outlook necessarily higher
in current prices than its real growth in constant prices).
T a b l e 10.1 Comparison of Forecast with Real Development
Source: Real data (r) for 2012 - 2014 based on SO SR, forecast (f) based on Morvay et. al (2014).
Effects of External and Domestic Economic Environment
Due to extremely high sensitivity of the Slovak economy to external
influences, the assessment of external conditions is necessary for our
outlook formation. We still need to elaborate a high degree of sensitivity
Parameter 2012 (r) 2013 (r) 2014 (f) 2014(r)
Year-on-year change
in real GDP
%
1.6
1.4
2.2 to 2.7
2.4
Year-on-year change
in GDP, current
prices
%
2.9
2.0
2.7 to 3.8
2.2
Year-on-year change
of workers, LFSS
(%)
%
0.6
0.0
0.3 to 0.8
1.4
Unemployment rate,
LFSS
%
14.0
14.2
13.3 to 13.9
13.2
Average annual
change of inflation
measured by con-
sumers price index
%
3.6
1.4
0.2 to 0.8
-0.1

113
to external influences despite the fact that a key factor in the economic
growth was domestic demand in 2014.
After several years of negative impact of external environment, we
can conclude that external environment is currently not “the barrier” of
the Slovak economy growth. In forecasts of selected institutions, there
are consistently emerging expectations of economic growth acceleration
in the euro area in 2015 and 2016 (Table 10.2). The same applies to the
German economy (the most important trading partner of SR).
The European Commision (EC 2015) states that in spring months of
2015, there are several short-term factors giving additional boost to oth-
erwise mild recovery of the EU. These are relatively low oil prices, stable
global economic growth, euro depreciation against other currencies and
growth oriented economies in the EU (i.e. already mentioned quantita-
tive easing). Despite of quantitative easing policies being perceived as
controversial, in our mostly short-term outlook, we can consider them as
growth stimulating factors.
T a b l e 10.2 Expected Real GDP Change in the Euro Area and Germany
2014 2015 forecast 2016 forecast
Euro area
Real GDP, year-on-
year change, %
0.9
IFW 1.4 1.8
EC 1.3 1.9
MMF 1.2 1.5
Germany
Real GDP, year-on-
year change, %
1.6
IFW 1.8 2.0
EC 1.5 2.0
MMF 1.5 1.7
Source: IfW (2015a; 2015b), March 2015; EC (2015), May 2015; IMF (2015), April 2015.
In addition to relatively favourable expected development (compared
with previous years) in the euro area, we can also talk about the support
of economic growth by domestic factors. Domestic economic policy (i.e.
fiscal) has changed its character. Due to considerable reduction of public
finance deficit, the government could alleviate restrictions upon entry
into the final stage of political cycle. The relatively strong y-o-y growth of

114
government final consumption in 2014 and adoption of the so-called
“Social Packages” are clear manifestation of altered approach to public
finance policy. Such policy supports the economic growth in short-term.
While in 2012 – 2013 there was simultaneously dominating unfa-
vourable impact of external factors and domestic environment (and mu-
tually supported each other in their restrictive effects), in 2014, this con-
figuration changed and in 2015 -2016, the economic growth will be in
short-term supported by external monetary policy and domestic fiscal
policy.
Expected Development of Basic Macroeconomic Parameters
Data which are already available about the Slovak economy for the
first months of 2015 creates relatively complex image about sectors dy-
namics. The recovery is not straightforward or flat across economy.
Since at the time of this text preparation some data on GDP in the sec-
tors31 were not available, we will work with revenues indicators (alt-
hough they have different explanations). From the data shown in Figure
10.1 is obvious that we cannot talk about a clear acceleration of revenue
growth across all sectors in the first months of 2015 (we need to select
individual sectors: e. g. in construction, a clear improvement is visible
there, on the other hand, we may notice a deterioration in trade sector).
However, it is not possible to draw a far-reaching conclusions based on
just several data available from beginning of the year. Anyway, a weaker
dynamics of revenues in some important sectors forces us to remain cau-
tious and conservative even in time when overall optimism is prevailing.
Although the dynamics of exports and imports in the first quarter of
2015 was very low, it is worth to note an increase in accumulated trade
balance (Figure 10.2). It is possible, that net exports will again contribute
to GDP growth and economic growth will be jointly driven by domestic
demand and net exports (with a dominance of domestic demand contri-
bution).
31 There is already a value of y-o-y change in first quarter in 2015 available. It reached 3.1 % (which represents an acceleration of growth).

115
F i g u r e 10.1 Dynamics indicators of selected branches (year-on-year indexes, same period of previous year = 100)
A. Manufacturing sales B. Construction sales
C. Wholesale sales D. Retail sales
Explanation: Figure A is the index of revenues for own performances and goods in industry (sppy
= 10, in constant prices); Figure B is the index of revenues for own performances and goods in
construction (sppy = 100, in constant prices); Figures C and D are a year-on-year index of reve-
nue from own performances and goods in wholesale and retail trade, excluding motor vehicle
sales (sppy = 100), wholesale in current prices, retail in constant prices. Source: SO SR.
85
90
95
100
105
110
115
1. 2. 3. 1. 2. 3. 1. 2. 3.
2013 2014 2015
80
85
90
95
100
105
110
115
120
125
1. 2. 3. 1. 2. 3. 1. 2. 3.
2013 2014 2015
85
90
95
100
105
110
115
1. 2. 3. 1. 2. 3. 1. 2. 3.
2013 2014 2015
94
96
98
100
102
104
106
108
1. 2. 3. 1. 2. 3. 1. 2. 3.
2013 2014 2015

116
F i g u r e 10.2 Exports & Imports Dynamics and Cumulated Balance of Foreign Trade (in first three months of year)
Source: SO SR.
It is very important to deal with expected prices development when
considering development trends in the upcoming period. The question is
whether the unique development of price level in 2014 (i.e. a slight de-
crease in price level) will repeat. Existing evidence suggests that infla-
tion in 2015 will be very similar to year before. Low fuel prices encour-
age deflationary trend, on the other hand, growing demand makes it
weaken. The development of various parameters of price level in the
first quarter of 2015 is similar to previous year (Figure 10.3). If the infla-
tion ratio (HICP) actually keeps around zero level, that means repeated
strong growth of real wages with likely positive effect on households
final consumption.
To reflect a climate and expectations in economy, we utilize the eco-
nomic sentiment indicator (SO SR, Figure 10.4). In the first part of 2015,
most of components in the summary indicator developed more favoura-
bly than in the same period of previous year. It means greater confidence
in economy (particularly significant is the difference in construction or
in consumer confidence). This means expectation of favourable devel-
opment in short-term horizon.
0
200
400
600
800
1000
1200
1400
1600
80
90
100
110
120
130
140
2010 2011 2012 2013 2014 2015
Balance – cumulated, EUR million Total import, index sppy=100, left axisTotal export, index sppy=100, left axis
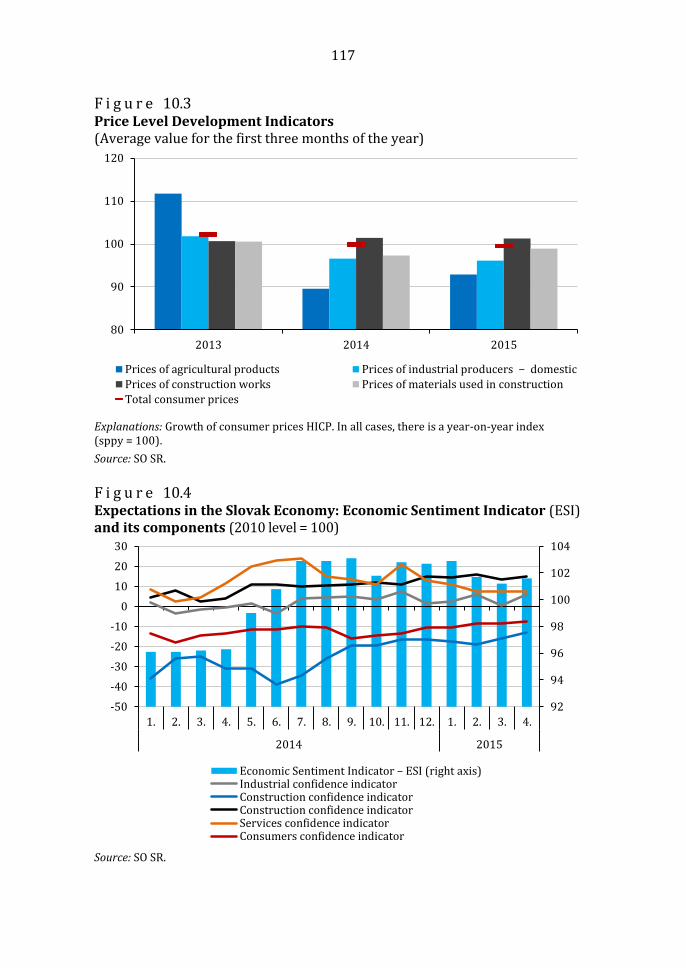
117
F i g u r e 10.3 Price Level Development Indicators (Average value for the first three months of the year)
Explanations: Growth of consumer prices HICP. In all cases, there is a year-on-year index (sppy = 100).
Source: SO SR.
F i g u r e 10.4 Expectations in the Slovak Economy: Economic Sentiment Indicator (ESI) and its components (2010 level = 100)
Source: SO SR.
80
90
100
110
120
2013 2014 2015
Prices of agricultural products Prices of industrial producers − domestic
Prices of construction works Prices of materials used in construction
Total consumer prices
92
94
96
98
100
102
104
-50
-40
-30
-20
-10
0
10
20
30
1. 2. 3. 4. 5. 6. 7. 8. 9. 10. 11. 12. 1. 2. 3. 4.
2014 2015
Economic Sentiment Indicator – ESI (right axis) Industrial confidence indicatorConstruction confidence indicatorConstruction confidence indicatorServices confidence indicatorConsumers confidence indicator

118
The quantification of selected macroeconomic parameters is shown in
Table 10.3:
In 2015 and 2016, real GDP growth is likely to slightly accelerate. Es-
pecially in 2015, it will be driven by domestic demand along with pos-
sible small contribution of net exports. Real GDP growth in 2015 is
likely to be the strongest one since 2010.
We expect the inflation rate will remain at level close to zero in 2015,
but it will not reach the value of what the ECB considers as preferred
(just under 2%) even in 2016. At the time of this outlook formation, it
was impossible to identify significant inflation impulses (as less signif-
icant we consider a policy of QE or growing demand).
Labour market indicators are highly likely to evolve favourably, since
(as we have already mentioned) employment begins to be more re-
sponsive to the economy dynamics. The pace of employment growth
in 2015 and 2016 may be similar to 2014 or slightly lower. According-
ly, the unemployment rate could drop by almost one p. p. in each year.
T a b l e 10.3 Forecast of Selected Macroeconomic Parameters Development
Source: Real data (r) for 2013 - 2014 based on SO SR, forecast (f) based on authors.
Parameter 2013 (r) 2014 (r) 2015 (f) 2016(f)
Year-on-year
change in real
GDP
%
1.4
2.4
2.8 to 3.3
2.9 to 3.7
Year-on-year
change in GDP,
current prices
%
2.0
2.2
2.7 to 3.3
3.3 to 4.1
Number of em-
ployed (year-on-
year change in %,
LFS)
%
0.0
1.4
1.1 to 1.7
0.8 to 1.5
Unemployment
rate, LFS
%
14.2
13.2
12.1 to 12.6
11.3 to 11.9
Average annual
change of infla-
tion measured by
consumers price
index
%
1.4
-0.1
-0.1 to 0.3
0.8 to 1.3

119
If we compare our outlook with forecasts of other institutions (Table
10.4a – 10.4c), we can conclude consensus in expectation of acceleration
in economic growth. However, we chose the interval for expected real
GDP growth in such way that even a scenario with a very slight accelera-
tion of growth would fit in. We take into account that growth of con-
sumption and investment, which drove the economic growth in 2014,
was supported by the compensation effect: the growth was strong due to
couple years lasting postpone of consumption and investment (the in-
centive of prudence in unfavourable expectations). In 2015 and 2016,
such effect should have diminishing importance which may result in
lower than expected dynamics of domestic demand. Furthermore, the
part of household demand increase was covered by loans growth (Chap-
ter 6) which may also reach its limits. These factors are considered as
one of the outlook risks.
T a b l e 10.4a Expected Changes of Real GDP in SR by forecasts of various institutions
2014 2015 forecast 2016 forecast
Year-on-year
change in real GDP
(%)
2.4
External institutions
EC 3.0 3.4
IMF 2.9 3.3
IfW 3.3 4.0
Domestic institutions
IFP 2.9 3.6
NBS 3.2 3.8
Selected banks 2.6 3.1
T a b l e 10.4b Expected Rate of Inflation in SR by forecasts of various institutions
2014 2015 forecast 2016 forecast
Average annual
change of inflation
measured by HICP
(%)
-0.1
External institutions
EC -0.2 1.4
IMF 0.0 1.4
IfW 0.1 1.4
Domestic institutions
IFP 0.0 1.6
NBS -0.3 1.7
Selected banks 0.6 1.7

120
T a b l e 10.4c
Expected Unemployment Rate in SR by forecasts of various institutions
2014 2015 forecast 2016 forecast
Unemployment
rate measured by
LFS (%)
13,2
External institutions
EC 12,1 10,8
IMF 12,4 11,7
IfW 11,8 10,9
Domestic institutions
IFP 12,9 12,2
NBS 12,0 11,0
Selected banks . .
Note: The forecasts were not created at the same time. This should be taken into account in their comparison. For example, at the time of IFP forecast publication, some final data were not availa-ble for 2014, which could affect the forecast.
Source: EC (2015), May 2015; IMF (2015), April 2015; IfW (2015b), March 2015; IFP (2015); forecast of the Committee for the Macroeconomic Forecasts, February 2015; NBS (2015b), mid-term forecast P1Q 2015; Macroeconomic forecasts of selected banks (NBS, 2015a), Banks aver-age, April 2015.
* * * *
Both, internal and external factors are in favour of continued
strengthening growth of the Slovak economy, which has begun in 2014.
It is important that favourable socio-economic development appears
(income, employment) even at relatively milder GDP growth rates, which
was not usual in past. However, it is obvious that the euro area helps it-
self with tools that may cover its chronic problems. No QE and cheapen-
ing of money will provide long-lasting and sustainable growth. If such
policies will cover the need for further consolidation and reforms in the
euro area, the current upward trend could be very short one.

121
REFERENCES
References (1st Chapter):
HUDCOVSKÝ, M. (2015): Väzby makroekonomickej výkonnosti a zamest-nanosti. Disertation thesis. Faculty of National Economy, University of Economics in Bratislava. Ifo (2015): CESifo World Economic Survey. Volume 14, No. 1., February 2015. ISSN 1613-6012. IfW (2015): Konjunktur im Euroraum im Frühjahr 2015. Moderate Erho-lung im Euroraum. In: Kieler Konjunkturberichte 2015/Q1. Institut für Weltwirtschaft, Kiel. Available at: <https://www.ifw-kiel.de/wirtschaftspolitik/konjunkturprognosen/konjunkt/2015/konjunkturprognosen_euroraum_fruhjahr-2015.pdf>. MORVAY, K. (2012): Štruktúrne špecifiká vývoja zamestnanosti a príj-mov v SR a ich súvislosti s povahou ekonomického rastu. In Working pa-pers [EÚ SAV] [online series], 2012, issue 43, p. 1-21. ISSN 1337-5598. MORVAY, K. et al. (2014): Hospodársky vývoj Slovenska v roku 2013 a výhľad do roku 2015. Institute of Economic Research SAS, Bratislava. ISBN 978-80-7144-224-0.
References (2nd Chapter):
IPO (2014): Výročná technická správa Úradu priemyselného vlastníctva Slovenskej republiky. Patenty a úžitkové vzory 2012. Bratislava: Indus-trial Property Office of Slovak Republic. Available at: <https://www.indprop.gov.sk/swift_data/source/pdf/vyrocne_technicke_spravy/patenty_2012.pdf>. SO SR (2014): Ročenka vedy a techniky 2014. Bratislava: Statistical Of-fice of Slovak Republic. 86 p. ISBN 978-80-8121-333-5. OECD (2015): Statistics databaseOECD.
122
EUROSTAT (2015): Statistics database. Available at: <http://ec.europa.eu/eurostat/data/database>. WEF (2013): The Global Competitiveness Report 2012 – 2013. Geneva: World Economic Forum. ISBN-10: 92-95044-35-5. WEF (2014): The Global Competitiveness Report 2013 – 2014. Geneva: World Economic Forum, ISBN-10: 92-95044-73-8. EC (2014): Innovation Union Scoreboard 2014. Brussel: European Com-mision, 94 p. ISBN 978-92-79-34662-0. EPO (2015): European patent filings per country of origin. Available at: <http://www.epo.org/about-us/annual-reports-statistics/statistics/filings.html>.
References (3rd Chapter):
Eurostat (2015): Statistics Database. <http://ec.europa.eu/eurostat/data/database>. KYJAC, P. (2014): Vývoj zahraničnej zadlženosti SR v rokoch 1993 až 2012. In Biatec – banking journal, vol. 22, 4/2014, p. 16 − 20. ISSN 1335-0900. NBS (2009): Nová metodika vykazovania devízových rezerv Národnej banky Slovenska po 1. januári 2009. Bratislava: NBS. Available at: <http://www.nbs.sk/sk/informacie-pre-media/tlacove-spravy/detail-spravy/_nova-metodika-vykazovania-devizovych-rezerv>. NBS (2015a): Makroekonomická databáza. Bratislava: NBS. Available at: <http://www.nbs.sk/sk/menova-politika/makroekonomicka-databaza>. NBS (2015b): Strednodobá predikcia 1Q 2015. Bratislava: NBS. Available at: <http://www.nbs.sk/_img/Documents/_Publikacie/PREDIK/2015/protected/P1Q-2015.pdf>. NBS (2015c). Štatistika platobnej bilancie. Bratislava: NBS. Available at: <http://www.nbs.sk/sk/statisticke-udaje/statistika-platobnej-bilancie>.

123
SO SR (2015). Štatistiky. Makroekonomické štatistiky. Zahraničný ob-chod. Bratislava: Statistical Office of Slovak Republic. <www.statistics.sk>.
References (4th Chapter):
ECB (2015): Monetary and financial statistics. Long-term interest rates. Available at: <https://www.ecb.europa.eu/stats/money/long/html/index.en.html>. EUROPEAN COMMISSION (2014): Report From The Commission to the European Parliament, the Council, the European Central Bank and the European Economic and Social Committee. Alert Mechanism Report 2015. Brussels, 28. 11. 2014, COM(2014) 904 final. Available at: <http://ec.europa.eu/europe2020/pdf/2015/amr2015_en.pdf>. EUROSTAT (2015): Statistics Database. Available at: <http://ec.europa.eu/eurostat/data/database>. EUROPEAN PARLIAMENT (2015). Výsledky volieb do Európskeho par-lamentu 2014. Available at: <http://www.europarl.europa.eu/elections2014-results/sk/turnout.html>. JUNCKER, J.-C. − TUSK, D. − DIJSSELBLOEM, J. − DRAGHI, M. (2015): Pre-paring for Next Steps on Better Economic Governance in the Euro Area. Analytical Note. Available at: <http://ec.europa.eu/priorities/docs/economic-governance-note_en.pdf>. ŠIKULOVÁ, I. et al. (2014): Slovenská ekonomika: desať rokov členstva v Európskej únii : vybrané témy a problémy. Bratislava: Institute of Eco-nomic Research SAS, VEDA publishing house, 2014. 242 p. ISBN 978-80-7144-228-8. <www.bankofengland.co.uk>. <www.ecb.int>. <www.federalreserve.gov>.

124
References (5th Chapter):
MF SR (2015): 35. zasadanie výboru pre makroekonomické prognózy (February 2015). Bratislava: MF SR. Available at: <http://www.finance.gov.sk/Default.aspx?CatID=10080>. NBS (2014a): Rýchly komentár CPI - 12/2014. Bratislava: NBS. Available at: <http://www.nbs.sk/_img/Documents/_komentare/2015/268_CPI_dece mber_2014.pdf>. SO SR (2015): Spotrebiteľský barometer rok 2015. Bratislava: SO SR. SO SR (2014): Slovstat database. EUROSTAT (2014): Statistics database. Available at: <http://ec.europa.eu/eurostat/data/database>.
References (6th Chapter):
NBS (2014): Štatistické údaje peňažných finančných inštitúcií. URL: <http://www.nbs.sk/sk/statisticke-udaje/menova-a-bankova-statistika/statisticke-udaje-penaznych-financnych-institucii>. MORVAY, K. et al. (2013): Hospodársky vývoj Slovenska v roku 2012 a výhľad do roku 2014. Bratislava: Institute of Economic Research SAS. ISBN 978-80-7144-207-3.
References (7th Chapter):
EUROPEAN COMMISSION (2015a): Making the Best Use Of The Flexibil-ity Within The Existing Rules Of The Stability And Growth Pact. Available at:<http://ec.europa.eu/economy_finance/economic_governance/sgp/pdf/2015-01-13_communication_sgp_flexibility_guidelines_en.pdf>. EUROPEAN COMMISSION (2015b): Financial Programming and Budget - Financial Report for Financial Year 2013. Available at: <http://ec.europa.eu/budget/biblio/documents/2013/2013_en.cfm>.

125
MF SR (2015a): Fiškálne indikátory. Bratislava: Ministry of Finance SR. Available at: <https://www.finance.gov.sk/Components/CategoryDocuments/s_LoadDocument.aspx?categoryId=6004&documentId=12880>. MF SR (2015b): Dlh ústrednej správy Slovenskej republiky. Bratislava: Ministry of Finance SR. Available at: <http://www.finance.gov.sk/Default.aspx?CatId=7319&id=2014>. MF SR (2015c): Plnenie štátneho rozpočtu. Bratislava: Ministry of Finan-ce SR. Available at: <http://www.mfsr.sk/Default.aspx?CatID=9933>. CENTRAL COORDINATION AUTHORITY (2015): Stav implementácie ŠF a KF k 31. 12. 2013 Available at: <http://www.nsrr.sk/cerpanie/>. GOVERNMENT OFFICE OF SLOVAK REPUBLIC (2015): Operačné prog-ramy. Available at: <http://www.partnerskadohoda.gov.sk/operacne-programy-2014-2020/>. SO SR(2015): Nová metodika pre národné účty - ESA 2010. Available at: <http://www7.statistics.sk/ExportPdf2/PdfExportSrvlt?Document=1696ac9a-d1e2-4934-b256-3ae94c9f5b58>.
References (8th Chapter):
EC (2015): Slovakia – Domestic demand continues to power the recov-ery. In Eurpean Economic Forecast, Winter 2015. European Commision, s. 109 – 110. HABRMAN, M. (2015): Silný rast zamestnanosti bude pokračovať. Po-hľad na determinanty rastu zamestnanosti. Komentár 2015/11. Bratisla-va: Ministry of Finance SR, Institute for Financial Policy, 27. 4 . 2015. KARŠAY, A. (2014): Zamestnanosť, nezamestnanosť a mzdy: Zamestna-nosť v 3. štvrťroku naďalej rástla, avšak miernejšie. Mzdový rast spoma-lil; absencia rastu produktivity tlmí rast miezd. Rýchly komentár. Brati-slava: NBS, 3rd December 2014.
126
MORVAY, K. et al (2014): Hospodársky vývoj Slovenska v roku 2013 a výhľad do roku 2015. Bratislava: Institute of Economic Research SAS. 2014. 128 p. ISBN 978-80-7144-224-0. NBS (2015a): Mesačný bulletin NBS – February 2015. Bratislava: Natio-nal Bank of Slovakia, 2015, 20 p., ISSN 1337-9496. NBS (2015b): Mesačný bulletin NBS – April 2015. Bratislava: Národná banka Slovenska, 2015, 21 s., ISSN 1337-9496. SOCIAL INSURANCE AGENCY (2015): <www.socpoist.sk>. SO SR (2015a): Slovstat Database. Available at: <www.statistics.sk>. SO SR (2015b): Štatistická správa o základných vývojových tendenciách v hospodárstve SR. 4/2014. Summary publications, Issue: 600-0023/2015. Bratislava: Statistical Office of Slovak Republic, March 2015. SO SR (2015c): Ekonomický monitor stavu hospodárstva Slovenskej re-publiky 1/2015. Issue: 600-001815. Bratislava: Statistical Office of Slo-vak Republic, March 2015. MLSAF SR (2015): Výsledky implementácie Záruky pre mladých ľudí v SR. Ministry of Labour, Social Affairs and Family. Available at: <http://www.employment.gov.sk/files/slovensky/praca-zamestnanost/podpora-zamestnanosti/vysledky-implementacie.pdf>.
References (9th Chapter):
MF SR (2014): Národný program reforiem Slovenskej republiky 2014. Available at: <http://www.finance.gov.sk/Default.aspx?CatID=5197>. MF SR (2014): Koncepcia rozvoja kapitálového trhu. Available at: <http://www.fininfo.sk/sk/oznamy/detail-oznamu/_koncepcia-rozvoja-kapitaloveho-trhu>. GOVERNMENT OFFICE OF SLOVAK REPUBLIC (2014): Stratégia hospodárskej politiky Slovenskej republiky - Slovensko 2020+. Availab-le at: <http://hsr.rokovania.sk/133072014-1000-13708/>.
127
KOLLÁROVÁ, Z. (2014): 8 zmien pre firmy v novele Obchodného zákon-níka. Trend. Available at: <http://www.etrend.sk/podnikanie/8-zmien-pre-firmy-v-novele-obchodneho-zakonnika.html>. BENKO, J. (2015): 15 zmien v zákone o dani z príjmov od roku 2015. Ava-ilable at: <http://www.podnikajte.sk/dane-a-uctovnictvo/c/1707/category/dan-z-prijmov/article/15-zmien-dan-z-prijmov-2015.xhtml>. <www.epi.sk>.
References (10th Chapter):
EK (2015): Spring 2015 Economic Forecast: Tailwinds support the re-covery. European Commission, May 2015. Available at: <http://ec.europa.eu/economy_finance/eu/forecasts/2015_spring_forecast_en.htm>. HABRMAN (2015): Silný rast zamestnanosti bude pokračovať. Pohľad na determinanty rastu zamestnanosti. Institute for Financial Policy, komen-tár 2015/11. Available at: <http://www.finance.gov.sk/Default.aspx?CatID=10157>. IFP (2015): Makroekonomická prognóza. 35. zasadanie výboru pre mak-roekonomické prognózy (February 2015). Available at: <http://www.finance.gov.sk/Default.aspx?CatID=10080>. IfW (2015a): Mittelfristprojektion für Deutschland im Frühjahr 2015. In: Kieler Konjunkturberichte 2015/Q1. Institut für Weltwirtschaft, Kiel. Available at: <https://www.ifw- kiel.de/wirtschaftspolitik/konjunkturprognosen/konjunkt/2015/konjunkturprognosen_mfp_fruehjahr-2015.pdf>. IfW (2015b): Konjunktur im Euroraum im Frühjahr 2015. Moderate Er-holung im Euroraum. In: Kieler Konjunkturberichte 2015/Q1. Institut für Weltwirtschaft, Kiel. Available at: <https://www.ifw- kiel.de/wirtschaftspolitik/konjunkturprognosen/konjunkt/2015/konjunkturprognosen_euroraum_fruhjahr-2015.pdf>.
128
IMF (2015): World Economic Outlook. Uneven Growth: Short- and Long-Term Factors. April 2015. Available at: <http://www.imf.org/external/pubs/ft/weo/2015/01/>. Makroekonomické predikcie vybraných bánk (2015). Published by NBS. Available at: <http://www.nbs.sk/sk/statisticke-udaje/vybrane-makroekonomicke-ukazovatele>. MORVAY, K. et al. (2014): Hospodársky vývoj Slovenska v roku 2013 a výhľad do roku 2015. Institute of Economic Research SAS, Bratislava. ISBN 978-80-7144-224-0. NBS (2015): Strednodobá predikcia P1Q 2015. Available at: <http://www.nbs.sk/sk/publikacie/publikacie-nbs/strednodoba-predikcia/strednodoba-predikcia-2015>.

129
ECONOMIC DEVELOPMENT OF SLOVAKIA
IN 2014 AND OUTLOOK UP TO 2016
Authors: Karol Morvay at al.
Published since 1993.
1st Issue
© Institute of Economic Research SAS
Šancová 56, 811 05 Bratislava 1
Phone: 42-1-2-52 49 54 80, Fax: 42-1-2- 52 49 51 06
E-mail: [email protected]
<http://www.ekonom.sav.sk>