聯發科技 2020年第一季法人說明會 MediaTek 2020-Q1 Investor … › ... › q1 ›...
18
聯發科技 2020 年第二季法人說明會 MediaTek 2020-Q2 Investor Conference July 31, 2020 Copyright © MediaTek Inc. All rights reserved.
Transcript of 聯發科技 2020年第一季法人說明會 MediaTek 2020-Q1 Investor … › ... › q1 ›...

聯發科技2020年第二季法人說明會MediaTek 2020-Q2 Investor Conference
July 31, 2020
Copyright © MediaTek Inc. All rights reserved.
Copyright © MediaTek Inc. All rights reserved. 1
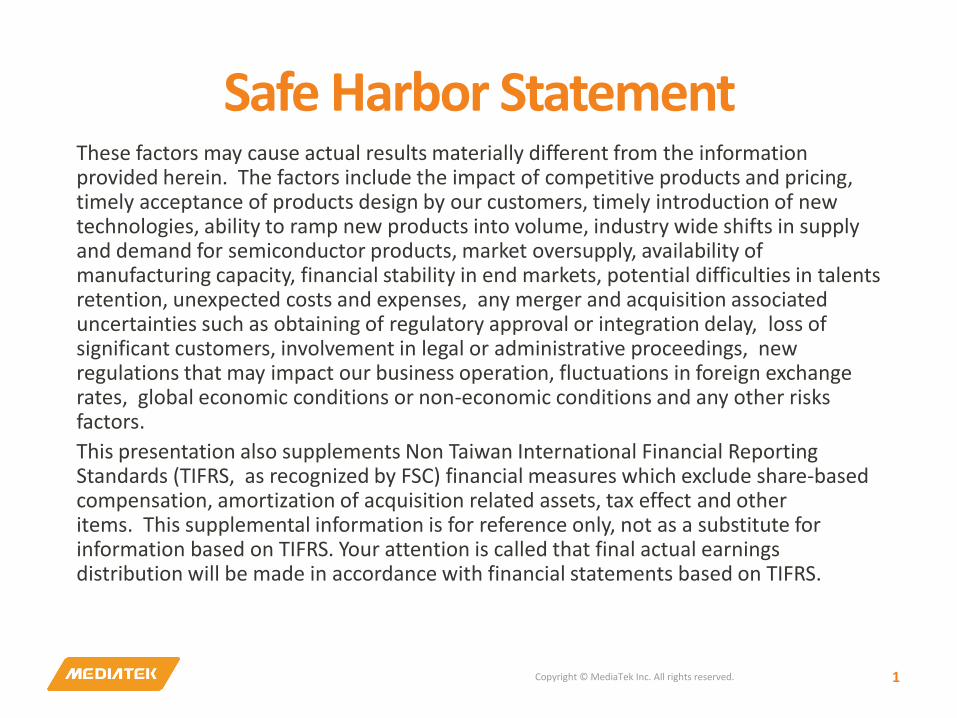
Safe Harbor StatementThese factors may cause actual results materially different from the information provided herein. The factors include the impact of competitive products and pricing, timely acceptance of products design by our customers, timely introduction of new technologies, ability to ramp new products into volume, industry wide shifts in supply and demand for semiconductor products, market oversupply, availability of manufacturing capacity, financial stability in end markets, potential difficulties in talents retention, unexpected costs and expenses, any merger and acquisition associated uncertainties such as obtaining of regulatory approval or integration delay, loss of significant customers, involvement in legal or administrative proceedings, new regulations that may impact our business operation, fluctuations in foreign exchange rates, global economic conditions or non-economic conditions and any other risks factors.
This presentation also supplements Non Taiwan International Financial Reporting Standards (TIFRS, as recognized by FSC) financial measures which exclude share-based compensation, amortization of acquisition related assets, tax effect and other items. This supplemental information is for reference only, not as a substitute for information based on TIFRS. Your attention is called that final actual earnings distribution will be made in accordance with financial statements based on TIFRS.
Copyright © MediaTek Inc. All rights reserved. 2
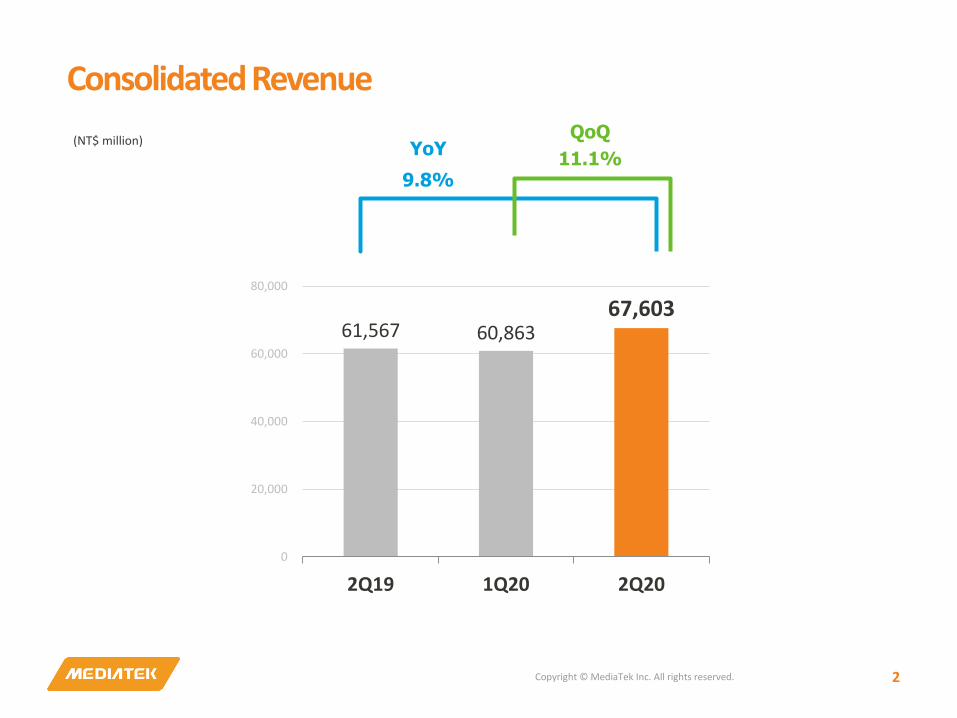
Consolidated Revenue
(NT$ million)
61,567 60,863 67,603
0
20,000
40,000
60,000
80,000
2Q19 1Q20 2Q20
QoQ
11.1%YoY
9.8%
Copyright © MediaTek Inc. All rights reserved. 3
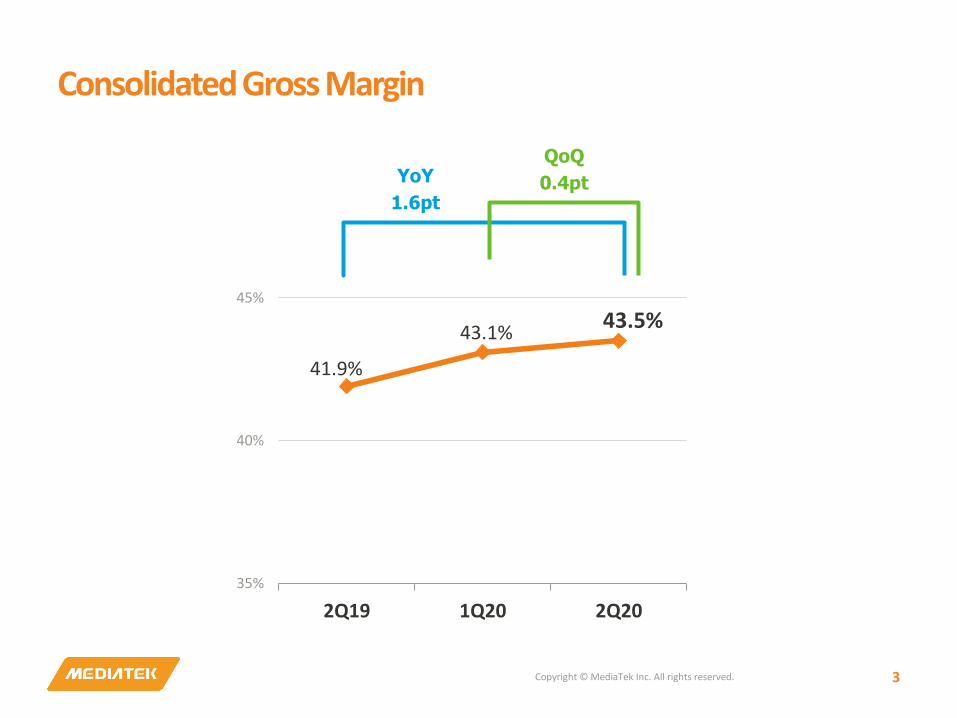
Consolidated Gross Margin
41.9%
43.1%43.5%
35%
40%
45%
2Q19 1Q20 2Q20
QoQ
0.4ptYoY
1.6pt
Copyright © MediaTek Inc. All rights reserved. 4
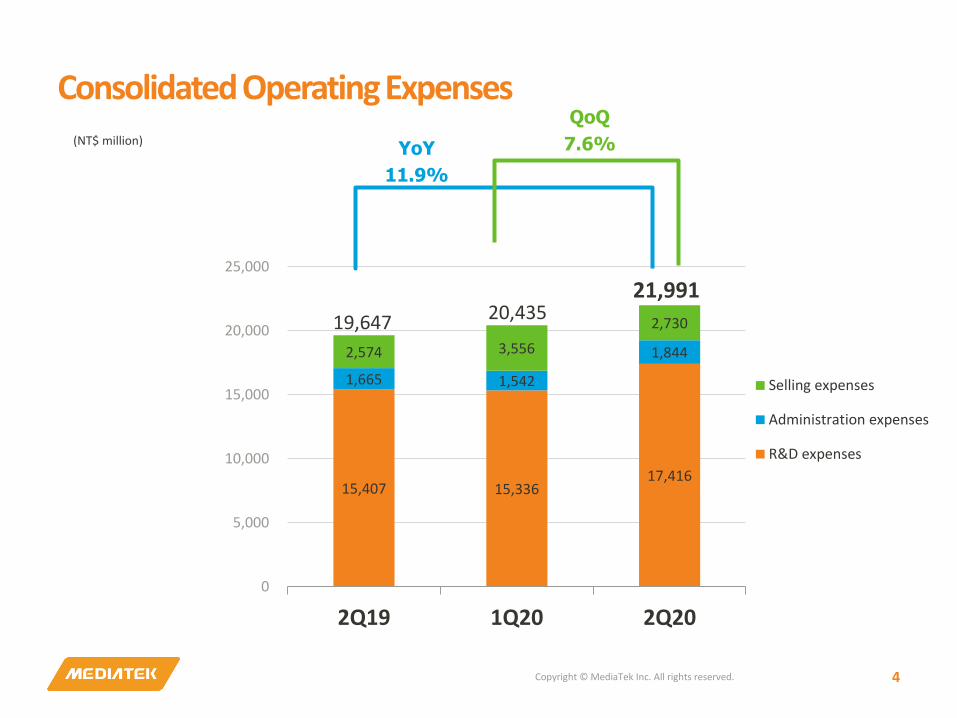
Consolidated Operating Expenses(NT$ million)
15,407 15,336 17,416
1,665 1,542
1,844 2,574 3,556
2,730
0
5,000
10,000
15,000
20,000
25,000
2Q19 1Q20 2Q20
Selling expenses
Administration expenses
R&D expenses
21,99120,43519,647
QoQ
7.6%YoY
11.9%
Copyright © MediaTek Inc. All rights reserved. 5
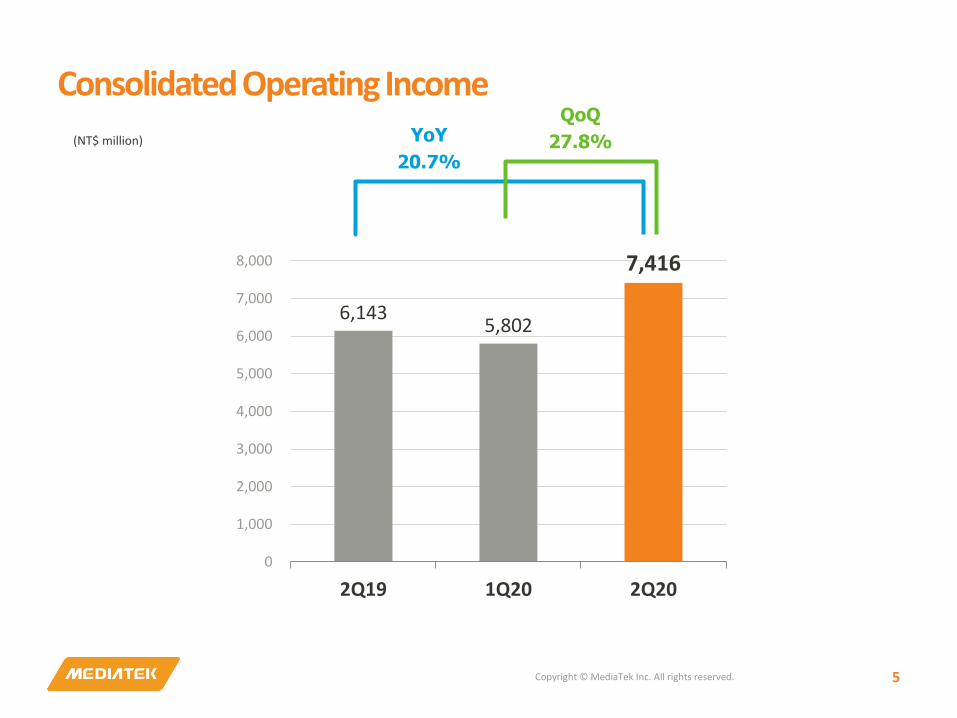
Consolidated Operating Income
(NT$ million)
6,143 5,802
7,416
0
1,000
2,000
3,000
4,000
5,000
6,000
7,000
8,000
2Q19 1Q20 2Q20
QoQ
27.8%YoY
20.7%
Copyright © MediaTek Inc. All rights reserved. 6
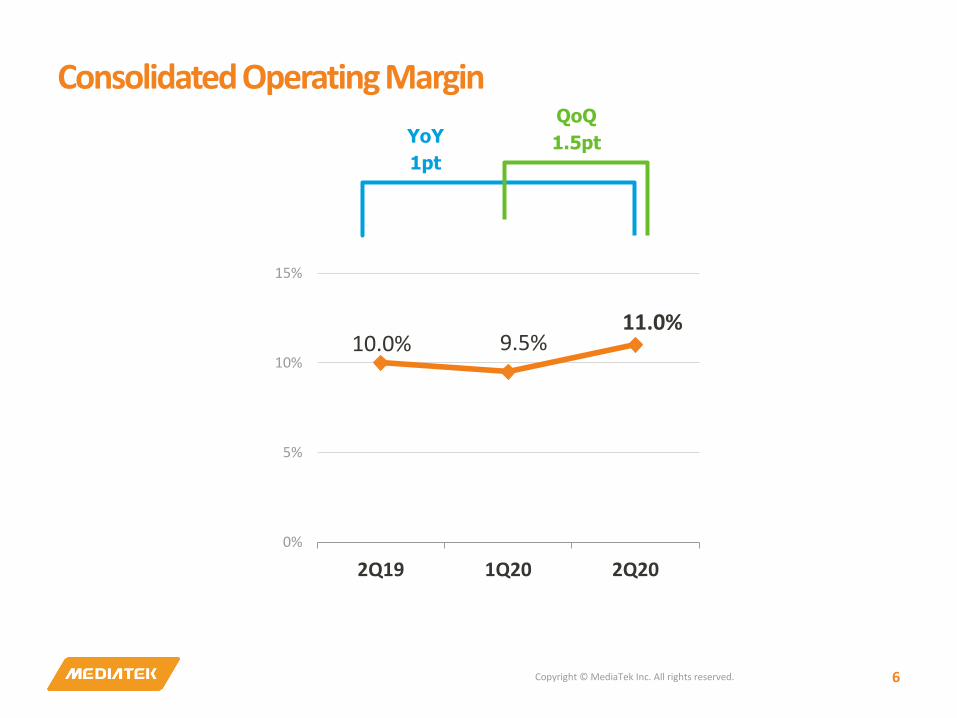
Consolidated Operating Margin
10.0% 9.5%11.0%
0%
5%
10%
15%
2Q19 1Q20 2Q20
QoQ
1.5ptYoY
1pt
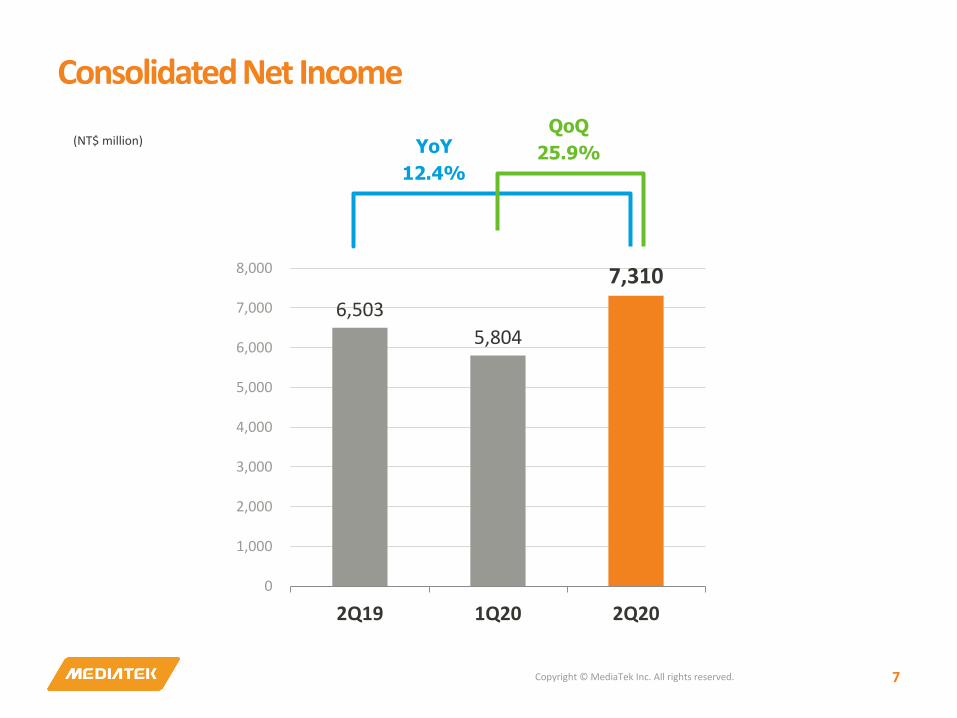
Consolidated Net Income
Copyright © MediaTek Inc. All rights reserved. 7
(NT$ million)
6,503
5,804
7,310
0
1,000
2,000
3,000
4,000
5,000
6,000
7,000
8,000
2Q19 1Q20 2Q20
QoQ
25.9%YoY
12.4%
Copyright © MediaTek Inc. All rights reserved. 8
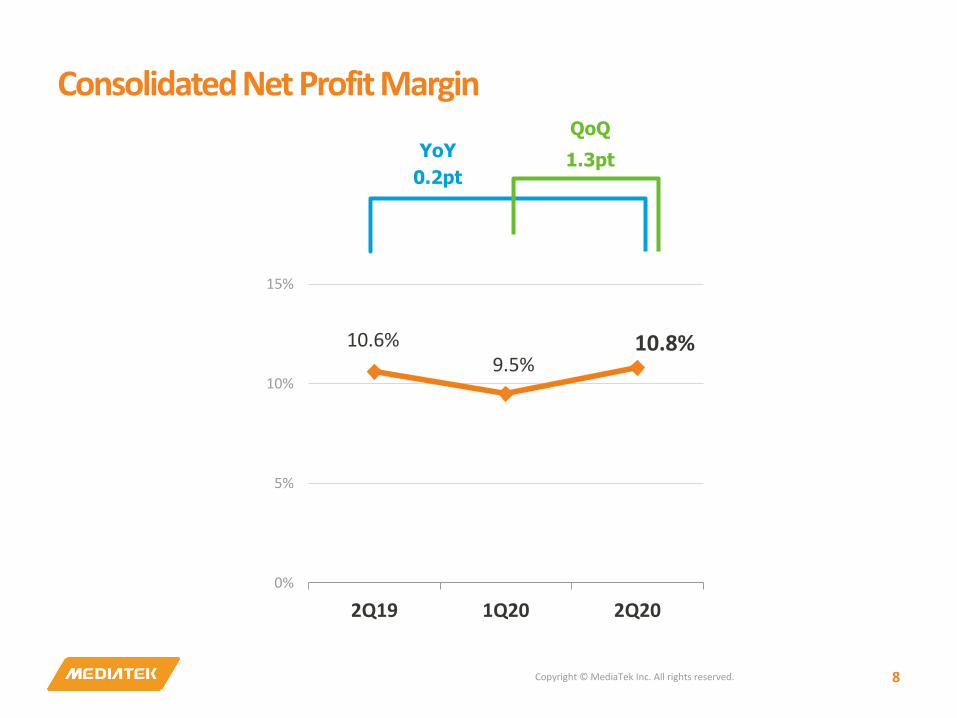
Consolidated Net Profit Margin
10.6%9.5%
10.8%
0%
5%
10%
15%
2Q19 1Q20 2Q20
QoQ
1.3ptYoY
0.2pt
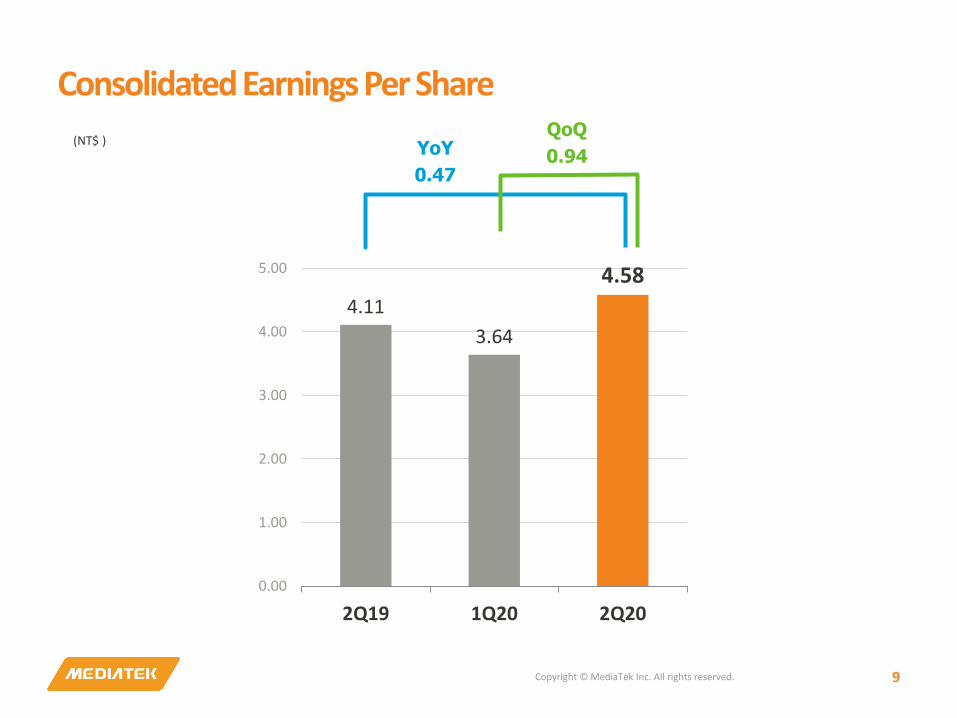
Consolidated Earnings Per Share
Copyright © MediaTek Inc. All rights reserved. 9
(NT$ )
4.11
3.64
4.58
0.00
1.00
2.00
3.00
4.00
5.00
2Q19 1Q20 2Q20
YoY
0.47
QoQ
0.94

Copyright © MediaTek Inc. All rights reserved. 10
Taiwan-International Financial Reporting Standards (TIFRS)
Financial Statements
Copyright © MediaTek Inc. All rights reserved. 11
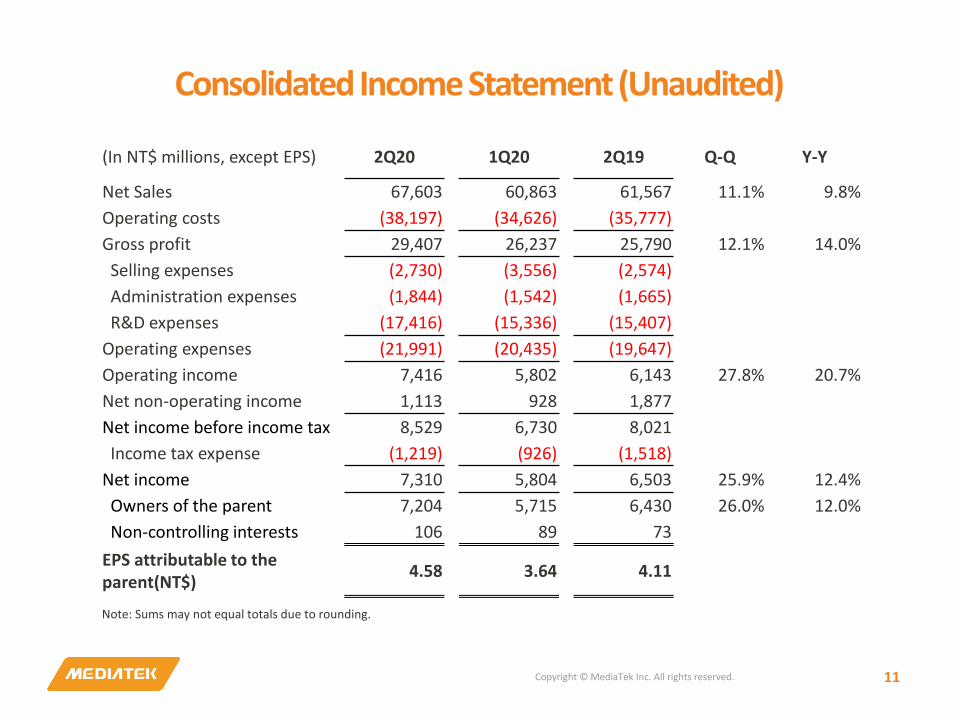
Consolidated Income Statement (Unaudited)
Note: Sums may not equal totals due to rounding.
(In NT$ millions, except EPS) 2Q20 1Q20 2Q19 Q-Q Y-Y
Net Sales 67,603 60,863 61,567 11.1% 9.8%
Operating costs (38,197) (34,626) (35,777)
Gross profit 29,407 26,237 25,790 12.1% 14.0%
Selling expenses (2,730) (3,556) (2,574)
Administration expenses (1,844) (1,542) (1,665)
R&D expenses (17,416) (15,336) (15,407)
Operating expenses (21,991) (20,435) (19,647)
Operating income 7,416 5,802 6,143 27.8% 20.7%
Net non-operating income 1,113 928 1,877
Net income before income tax 8,529 6,730 8,021
Income tax expense (1,219) (926) (1,518)
Net income 7,310 5,804 6,503 25.9% 12.4%
Owners of the parent 7,204 5,715 6,430 26.0% 12.0%
Non-controlling interests 106 89 73
EPS attributable to the parent(NT$)
4.58 3.64 4.11
Copyright © MediaTek Inc. All rights reserved. 12
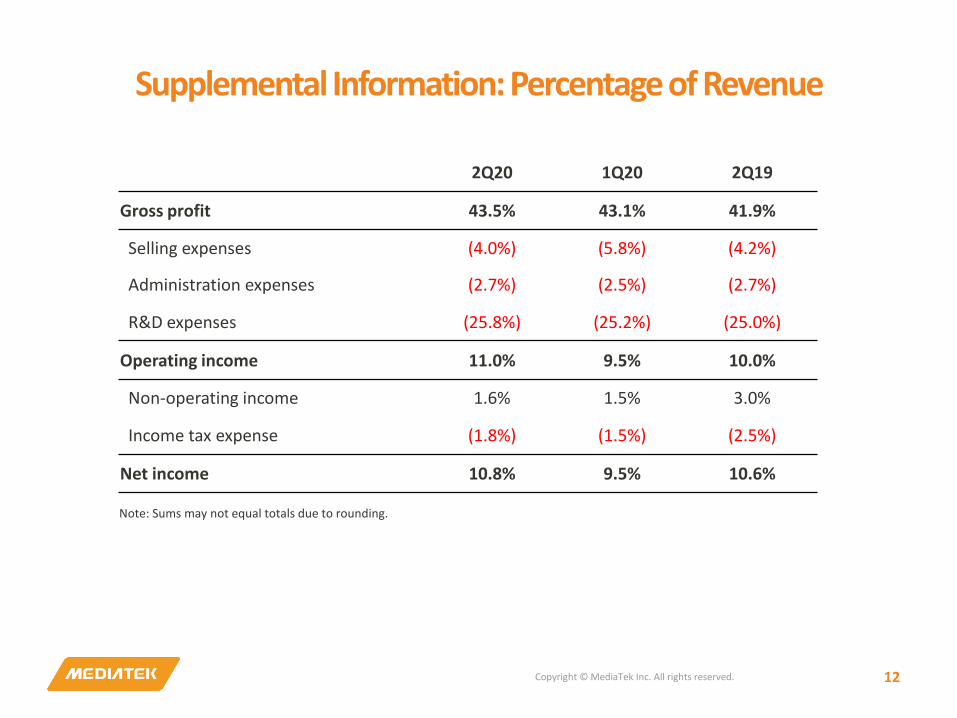
Supplemental Information: Percentage of Revenue
Note: Sums may not equal totals due to rounding.
2Q20 1Q20 2Q19
Gross profit 43.5% 43.1% 41.9%
Selling expenses (4.0%) (5.8%) (4.2%)
Administration expenses (2.7%) (2.5%) (2.7%)
R&D expenses (25.8%) (25.2%) (25.0%)
Operating income 11.0% 9.5% 10.0%
Non-operating income 1.6% 1.5% 3.0%
Income tax expense (1.8%) (1.5%) (2.5%)
Net income 10.8% 9.5% 10.6%

Copyright © MediaTek Inc. All rights reserved. 13
Balance Sheet Summary (Unaudited)
Note: Sums may not equal totals due to rounding.
(In NT$ millions) 2Q20 1Q20 2Q19
Cash & financial assets-current 187,158 198,570 215,522
Accounts receivable 36,101 25,376 27,915
Inventories 36,812 32,669 31,096
Other current assets 7,189 8,661 8,343
Funds and investments 90,066 81,096 48,718
Intangible assets 78,296 74,186 72,765
Other non-current assets 47,259 47,256 47,679
Total assets 482,882 467,814 452,039
Short-term loans 42,557 52,139 67,802
Accounts payable 26,698 23,202 20,905
Other current liabilities 73,712 49,074 63,982
Total non-current liabilities 16,159 14,851 10,843
Total equity 323,756 328,548 288,507

Copyright © MediaTek Inc. All rights reserved. 14
Cash Flow Statement (Unaudited)
Note : Sums may not equal totals due to rounding.
(In NT$ millions) 2Q20 1Q20 2Q19
Net cash provided by (used in) operating activities 7,177 1,931 14,135
Net cash provided by (used in) investing activities (1,863) 562 97
Net cash provided by (used in) financing activities (9,663) (4,615) 8,313
Effect of changes in exchange rate on cash and cash equivalents (1,552) (584) 37
Net increase (decrease) in cash and cash equivalents (5,901) (2,706) 22,582
Cash and cash equivalents at the end of the period 168,938 174,839 174,061
Copyright © MediaTek Inc. All rights reserved. 15
【Supplemental Information】Reconciliations of TIFRS Results to Non-TIFRS Results
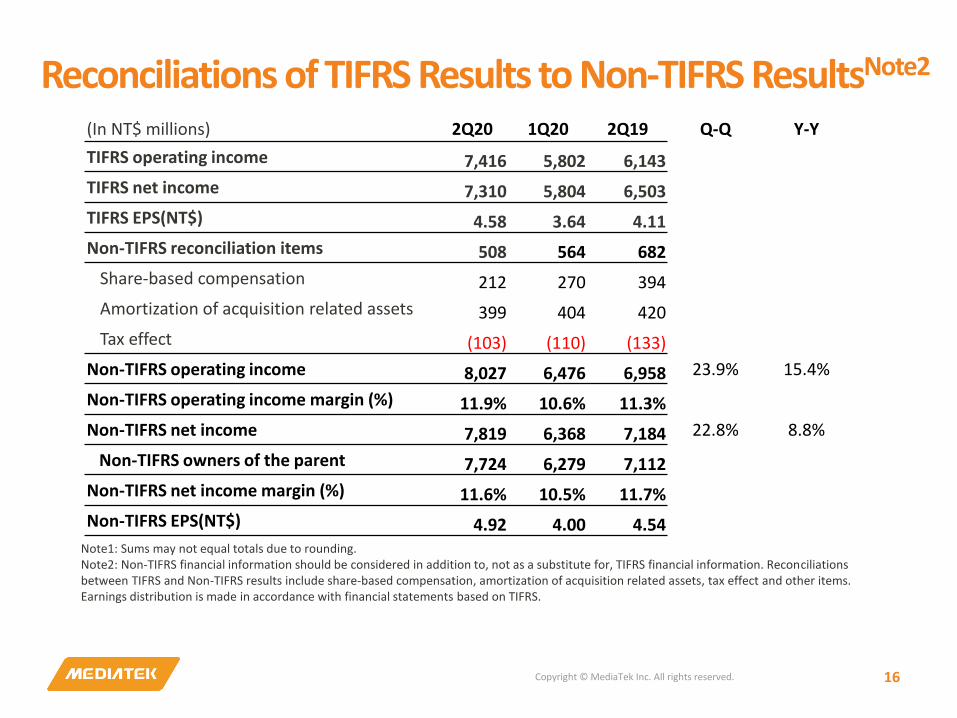
Reconciliations of TIFRS Results to Non-TIFRS ResultsNote2
Copyright © MediaTek Inc. All rights reserved. 16
Note1: Sums may not equal totals due to rounding.Note2: Non-TIFRS financial information should be considered in addition to, not as a substitute for, TIFRS financial information. Reconciliations between TIFRS and Non-TIFRS results include share-based compensation, amortization of acquisition related assets, tax effect and other items. Earnings distribution is made in accordance with financial statements based on TIFRS.
(In NT$ millions) 2Q20 1Q20 2Q19 Q-Q Y-Y
TIFRS operating income 7,416 5,802 6,143
TIFRS net income 7,310 5,804 6,503
TIFRS EPS(NT$) 4.58 3.64 4.11
Non-TIFRS reconciliation items 508 564 682
Share-based compensation 212 270 394
Amortization of acquisition related assets 399 404 420
Tax effect (103) (110) (133)
Non-TIFRS operating income 8,027 6,476 6,958 23.9% 15.4%
Non-TIFRS operating income margin (%) 11.9% 10.6% 11.3%
Non-TIFRS net income 7,819 6,368 7,184 22.8% 8.8%
Non-TIFRS owners of the parent 7,724 6,279 7,112
Non-TIFRS net income margin (%) 11.6% 10.5% 11.7%
Non-TIFRS EPS(NT$) 4.92 4.00 4.54
Copyright © MediaTek Inc. All rights reserved. 17
www.mediatek.com