E. Annual Results Eng · The adoption of revised IAS 27 has had no impact on the current year. IAS...
57
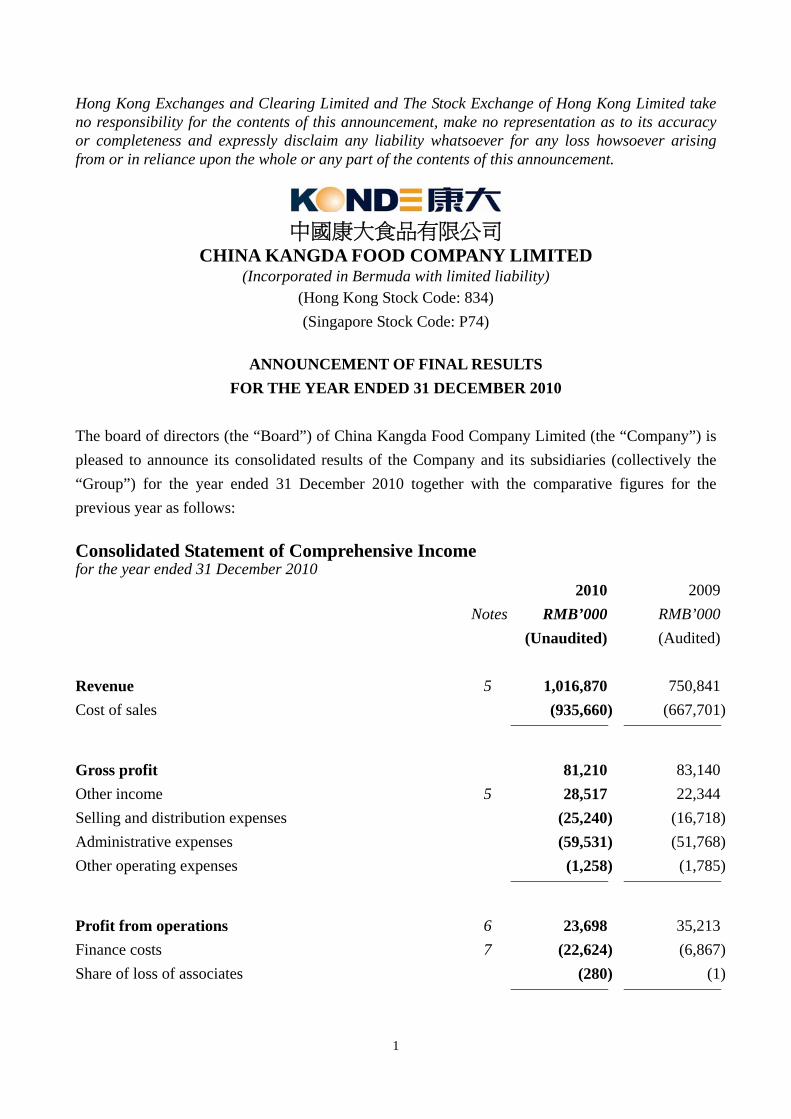
1 Hong Kong Exchanges and Clearing Limited and The Stock Exchange of Hong Kong Limited take no responsibility for the contents of this announcement, make no representation as to its accuracy or completeness and expressly disclaim any liability whatsoever for any loss howsoever arising from or in reliance upon the whole or any part of the contents of this announcement. 中國康大食品有限公司 CHINA KANGDA FOOD COMPANY LIMITED (Incorporated in Bermuda with limited liability) (Hong Kong Stock Code: 834) (Singapore Stock Code: P74) ANNOUNCEMENT OF FINAL RESULTS FOR THE YEAR ENDED 31 DECEMBER 2010 The board of directors (the “Board”) of China Kangda Food Company Limited (the “Company”) is pleased to announce its consolidated results of the Company and its subsidiaries (collectively the “Group”) for the year ended 31 December 2010 together with the comparative figures for the previous year as follows: Consolidated Statement of Comprehensive Income for the year ended 31 December 2010 2010 2009 Notes RMB’000 RMB’000 (Unaudited) (Audited) Revenue 5 1,016,870 750,841 Cost of sales (935,660) (667,701) Gross profit 81,210 83,140 Other income 5 28,517 22,344 Selling and distribution expenses (25,240) (16,718) Administrative expenses (59,531) (51,768) Other operating expenses (1,258) (1,785) Profit from operations 6 23,698 35,213 Finance costs 7 (22,624) (6,867) Share of loss of associates (280) (1)
Transcript of E. Annual Results Eng · The adoption of revised IAS 27 has had no impact on the current year. IAS...
1
Hong Kong Exchanges and Clearing Limited and The Stock Exchange of Hong Kong Limited take no responsibility for the contents of this announcement, make no representation as to its accuracy or completeness and expressly disclaim any liability whatsoever for any loss howsoever arising from or in reliance upon the whole or any part of the contents of this announcement.
中國康大食品有限公司
CHINA KANGDA FOOD COMPANY LIMITED (Incorporated in Bermuda with limited liability)
(Hong Kong Stock Code: 834) (Singapore Stock Code: P74)
ANNOUNCEMENT OF FINAL RESULTS
FOR THE YEAR ENDED 31 DECEMBER 2010 The board of directors (the “Board”) of China Kangda Food Company Limited (the “Company”) is pleased to announce its consolidated results of the Company and its subsidiaries (collectively the “Group”) for the year ended 31 December 2010 together with the comparative figures for the previous year as follows: Consolidated Statement of Comprehensive Income for the year ended 31 December 2010 2010 2009 Notes RMB’000 RMB’000 (Unaudited) (Audited) Revenue 5 1,016,870 750,841 Cost of sales (935,660) (667,701)
Gross profit 81,210 83,140 Other income 5 28,517 22,344 Selling and distribution expenses (25,240) (16,718) Administrative expenses (59,531) (51,768) Other operating expenses (1,258) (1,785)
Profit from operations 6 23,698 35,213 Finance costs 7 (22,624) (6,867) Share of loss of associates (280) (1)

2
2010 2009 Notes RMB’000 RMB’000 (Unaudited) (Audited) Profit before taxation 794 28,345 Income tax credit 8 1,212 2,451
Profit for the year 2,006 30,796 Other comprehensive income - -
Total comprehensive income for the year 2,006 30,796
Profit for the year attributable to: Owners of the Company 3,383 30,355 Non-controlling interests (1,377) 441
2,006 30,796
Total comprehensive income attributable to: Owners of the Company 3,383 30,355 Non-controlling interests (1,377) 441
2,006 30,796
Earnings per share for profit attributable to the owners
of the Company during the year
10
Basic (RMB cents) 0.8 7.0 Diluted (RMB cents) N/A N/A

3
Consolidated Statement of Financial Position as at 31 December 2010 2010 2009 Notes RMB’000 RMB’000
(Unaudited) (Audited) (restated)
ASSETS AND LIABILITIES Non-current assets Property, plant and equipment 559,186 296,978Prepaid premium for land leases 129,031 103,220Intangible assets 8,592 4,085Interest in associates 3,902 682Goodwill 59,428 3,073Biological assets 27,653 20,791Deferred tax assets 13,971 4,960
801,763 433,789Current assets Biological assets 21,598 12,230Inventories 137,039 78,649Trade receivables 11 93,182 87,467Prepayments, other receivables and deposits 51,804 19,787Amount due from a related company 12,795 -Cash and bank balances 116,643 267,884
433,061 466,017
Current liabilities Trade payables 12 73,200 48,076Accrued liabilities and other payables 72,839 43,128Interest-bearing bank borrowings 384,902 109,786Amount due to a related company - 21,585Deferred government grants 791 658Tax payables 2,142 2,243
533,874 225,476
Net current (liabilities)/assets (100,813) 240,541
Total assets less current liabilities 700,950 674,330

4
2010 2009 RMB’000 RMB’000
(Unaudited) (Audited) (restated)
Non-current liabilities Deferred government grants 11,015 9,759
Total non-current liabilities 11,015 9,759
Net assets 689,935 664,571
EQUITY Equity attributable to Company’s owners - Share capital 112,176 112,176- Reserves 540,789 537,406
652,965 649,582Non-controlling interests 36,970 14,989
Total equity 689,935 664,571

5
NOTES TO THE CONSOLIDATED FINANCIAL STATEMENTS for the year ended 31 December 2010 1. CORPORATE INFORMATION
The Company was incorporated in Bermuda as an exempted company with limited liability under the Companies Act 1981 of Bermuda on 28 April 2006. The registered office of the Company is located at Canon’s Court, 22 Victoria Street, Hamilton HM 12, Bermuda. The principal place of business of the Company is located at No. 1, Hainan Road, Economic and Technology Development Zone, Jiaonan City, Qingdao, the People’s Republic of China. The Company’s shares have been listed on the Mainboard of the Singapore Exchange Securities Trading Limited (the “SGX-ST”) and the Stock Exchange of Hong Kong Limited (the “HKEx”) since 9 October 2006 and 22 December 2008 respectively. The principal activity of the Company is investment holding. The principal activities of the Group are production and trading of food products, breeding and sale of livestock, poultry and rabbits. The Group’s operations are principally conducted in the People’s Republic of China (the “PRC”). The financial statements are presented in Renminbi (“RMB”), being the functional currency of the Group.
2 APPLICATIONS OF INTERNATIONAL FINANCIAL REPORTING STANDARDS (“IFRSs”) (a) Adoption of new/revised IFRSs – effective 1 January 2010
IAS 27 (Revised) Consolidated and Separate Financial Statements
IFRS 3 (Revised) Business Combinations
Various Annual improvements to IFRSs 2009
Except as explained below, the adoption of these new/revised standards and interpretations has no significant impact on the Group’s financial statements. IFRS 3 (Revised) – Business Combinations and IAS 27(Revised) – Consolidated and Separate Financial Statements The revised accounting policies are effective prospectively for business combinations effected in financial periods beginning on or after 1 July 2009. Changes in IFRS 3 include the valuation of non-controlling interest, the accounting for transaction costs, the initial recognition and subsequent measurement of a contingent consideration and business combinations achieved in stages. These changes impact the amount of goodwill and the results in the period that an acquisition occurs and future results. The Group has accounted for the acquisition of Shandong Kaijia Food Company Limited (“Kaijia Food”) according to the revised standard.

6
The revised IAS 27 requires that a change in the ownership interest of a subsidiary (without loss of control) is accounted for as a transaction with owners in their capacity as owners, accordingly, such transactions are recognised within equity. When control is lost and any remaining interest in the entity is re-measured to fair value, and a gain or loss is recognised in profit or loss. The adoption of revised IAS 27 has had no impact on the current year. IAS 17 (Amendments) – Leases As part of Improvements to IFRSs issued in 2009, IAS 17 has been amended in relation to the classification of leasehold land. Before the amendment to IAS 17, the Group was required to classify leasehold land as operating leases and to present leasehold land as prepaid lease payments in the statement of financial position. The amendment to IAS 17 has removed such a requirement and requires that the classification of leasehold land should be based on the general principles set out in IAS 17, that is, whether or not substantially all the risks and rewards incidental to ownership of a leased asset have been transferred to the lessee. The Group concluded that the classification of such leases as operating leases continues to be appropriate. These amendments had no impact on the Group’s financial statements.
(b) New/revised IFRSs that have been issued but are not yet effective The following new/revised IFRSs, potentially relevant to the Group’s financial statements, have been issued, but are not yet effective and have not been early adopted by the Group.
IFRSs (Amendments) Improvements to IFRSs 2010 1&2
IAS 24 (Revised) Related Party Disclosures 2
Amendments to IFRS 7 Disclosure – Transfers of Financial Assets 3
IFRS 9 Financial Instruments 4 1Effective for annual periods beginning on or after 1 July 2010 2Effective for annual periods beginning on or after 1 January 2011 3Effective for annual periods beginning on or after 1 July 2011 4Effective for annual periods beginning on or after 1 January 2013 Improvements to IFRSs 2010 set out amendments to a number of IFRSs, including: • IFRS 3 Business Combinations: The amendments limit the measurement choice of non-controlling
interests at fair value or at the proportionate share of the acquiree’s identifiable net assets to components of non-controlling interests that are present ownership interests and entitle their holders to a proportionate share of the entity’s net assets in the event of liquidation. Other components of non-controlling interests are measured at their acquisition date fair value, unless another measurement basis is required by another IFRS.
• IAS 1 Presentation of Financial Statements: Clarifies that an analysis of other comprehensive income
for each component of equity can be presented either in the statement of changes in equity or in the notes to the financial statements.

7
IAS 24 (Revised) clarifies and simplifies the definition of related parties. It also provides for a partial exemption of related party disclosure to government-related entities for transactions with the same government or entities that are controlled, jointly controlled or significantly influenced by the same government. The amendments to IFRS 7 improve the derecognition disclosure requirements for transfer transactions of financial assets and allow users of financial statements to better understand the possible effects of any risks that may remain with the entity on transferred assets. The amendments also require additional disclosures if a disproportionate amount of transfer transactions are undertaken around the end of a reporting period. Under IFRS 9, financial assets are classified into financial assets measured at fair value or at amortised cost depending on the entity’s business model for managing the financial assets and the contractual cash flow characteristics of the financial assets. Fair value gains or losses will be recognised in profit or loss except for those non-trade equity investments, which the entity will have a choice to recognise the gains and losses in other comprehensive income. IFRS 9 carries forward the recognition and measurement requirements for financial liabilities from IAS 39, except for financial liabilities that are designated at fair value through profit or loss, where the amount of change in fair value attributable to change in credit risk of that liability is recognised in other comprehensive income unless that would create or enlarge an accounting mismatch. In addition, IFRS 9 retains the requirements in IAS 39 for derecognition of financial assets and financial liabilities. The Group is in the process of making an assessment of the potential impact of these new/revised IFRSs and the directors so far concluded that the application of these new/revised IFRSs will have no material impact on the Group’s financial statements.
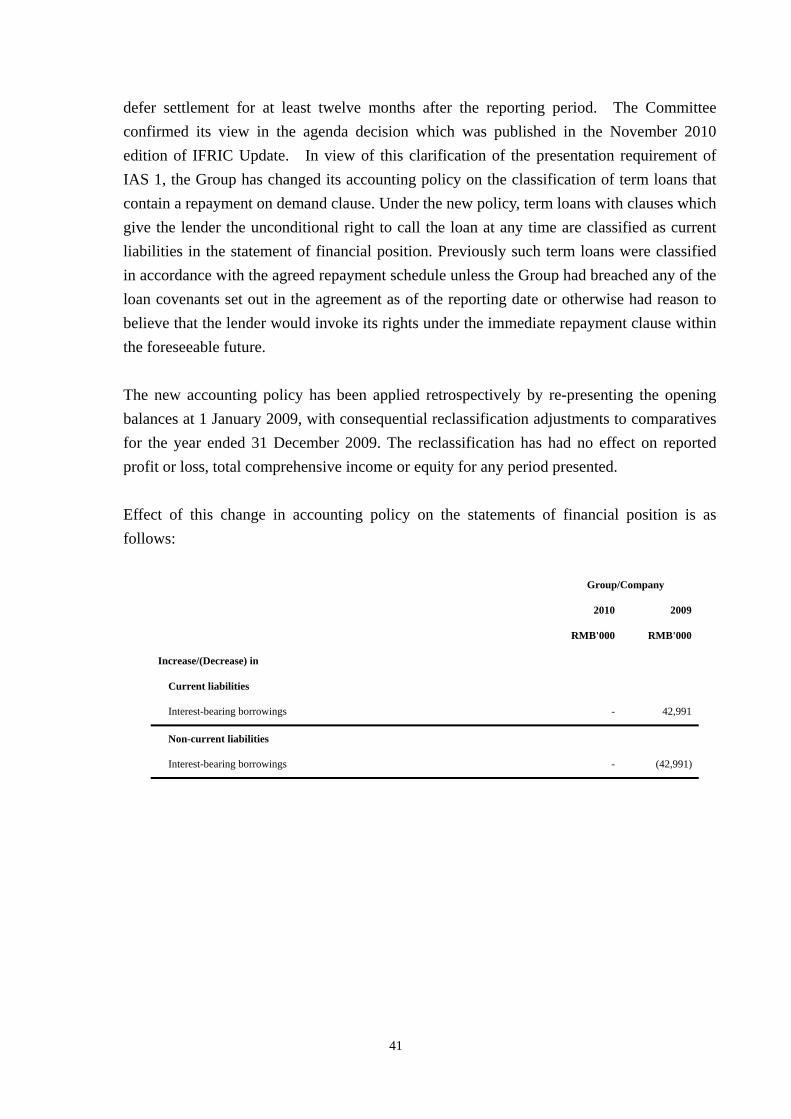
(c) Other changes in accounting policies and disclosures In a meeting in September 2010, the IFRS Interpretations Committee (“the Committee”) discussed the interpretation of paragraph 69(d) of IAS 1 Presentation of Financial Statements. The Committee considered that a liability must be classified as a current liability if the entity does not have the unconditional right at the reporting date to defer settlement for at least twelve months after the reporting period. The Committee confirmed its view in the agenda decision which was published in the November 2010 edition of IFRIC Update. In view of this clarification of the presentation requirement of IAS 1, the Group has changed its accounting policy on the classification of term loans that contain a repayment on demand clause. Under the new policy, term loans with clauses which give the lender the unconditional right to call the loan at any time are classified as current liabilities in the statement of financial position. Previously such term loans were classified in accordance with the agreed repayment schedule unless the Group had breached any of the loan covenants set out in the agreement as of the reporting date or otherwise had reason to believe that the lender would invoke its rights under the immediate repayment clause within the foreseeable future.

8
The new accounting policy has been applied retrospectively by re-presenting the opening balances at 1 January 2009, with consequential reclassification adjustments to comparatives for the year ended 31 December 2009. The reclassification has had no effect on reported profit or loss, total comprehensive income or equity for any period presented. Effect of this change in accounting policy on the statements of financial position is as follows: As a result of the above retrospective reclassification, an additional statement of financial position is presented in accordance with IAS 1 Presentation of Financial Statements.
3. BASIS OF PREPARATION
The financial statements have been prepared in accordance with IFRSs which is a collective term including all applicable individual IFRSs, International Accounting Standards (“IASs”) and Interpretations issued by the International Accounting Standards Board (“IASB”). The financial statements also include the applicable disclosure requirements of the Hong Kong Companies Ordinance and the Rules Governing the Listing of Securities on HKEx and the Listing Manual of the SGX-ST. The financial statements have been prepared on the historical cost basis except for biological assets which are stated at fair values. Disposal groups and non-current assets held for sale are stated at the lower of their carrying amounts and fair values less costs to sell. It should be noted that accounting estimates and assumptions are used in preparation of the financial statements. Although these estimates are based on management’s best knowledge and judgement of current events and actions, actual results may ultimately differ from those estimates. In preparing the financial statements, the directors considered the operations of the Group as a going concern notwithstanding that: 1.The Group’s profit decreased significantly from approximately RMB30.8 million for the year ended 31
December 2009 to approximately RMB2.0 million for the year ended 31 December 2010;
Group/Company
2010 2009 2008
RMB'000 RMB'000 RMB'000
Increase/(Decrease) in
Current liabilities
Interest-bearing borrowings - 42,991 109,839
Non-current liabilities
Interest-bearing borrowings - (42,991) (109,839)

9
2.There was net cash outflow from operating activities of approximately RMB166.8 million for the year ended
31 December 2010; 3.The Group’s current liabilities exceeded its current assets by approximately RMB100.8 million as at 31
December 2010; 4.There was a significant increase in the bank borrowings of the Group from approximately RMB109.8
million as at 31 December 2009 to approximately RMB384.9 million as at 31 December 2010, all of which are due for repayment within one year from 31 December 2010; and
5.Included in the short-term bank borrowings is an outstanding syndicated loan of approximately RMB24.9
million of which the Group had breached certain loan covenants as at 31 December 2010. These conditions indicate the existence of a material uncertainty which may cast significant doubts on the Group’s ability to continue as a going concern and hence, its ability to realise its assets and discharge its liabilities in the normal course of business. Nevertheless, the directors prepare the financial statements based on the assumption that the Group can be operated as a going concern and are of the view that the Group will have sufficient working capital to finance its operations in the next twelve months from 31 December 2010, after taking into consideration of the following: 1.The Group continues to implement measures to tighten cost controls over various operating expenses in
order to improve its profitability and to generate positive cash inflow from its operations in the future; 2.The Group is actively negotiating with the banks to seek for renewal of the outstanding bank borrowings,
except for the syndicated bank loan of RMB24.9 million, and new banking facilities;
3.In February 2011, the Group has negotiated with and successfully obtained from the banks a waiver in relation to the syndicated loan of approximately RMB24.9 million of which the Group had breached certain loan covenants as at 31 December 2010 as mentioned above. In addition, part of the syndicated loan of RMB8.0 million was repaid by the Group in January 2011. The remaining balance of RMB16.9 million of the syndicated loan will be repaid according to the repayment schedule in 2011;
4.The Group is actively exploring the availability of alternative source of financing; and 5.Qingdao Kangda Foreign Trade Group Limited (“KD Group”), which is substantially beneficially owned by
a substantial shareholder of the Company, has agreed to provide continuing financial support to the Group so as to enable the Group to continue its day-to-day operations as a going concern notwithstanding any present or future financial difficulties experienced by the Group.
The directors of the Company believe that the aforementioned financing/business plans and operational measures will be successful, based on the continuous efforts and commitment given by the management.

10
Having regard to the cash flow projection of the Group, which are prepared assuming that these measures are successful, the directors of the Company are of the opinion that, in the light of the measures taken to-date, together with the expected results of the other measures in progress, the Group will have sufficient cash resources to satisfy its future working capital and other financing requirements. Should the Group be unable to continue in business as a going concern, adjustments would have to be made in the financial statements to write down the values of the assets to their recoverable amounts, to provide for any further liabilities which might arise, and to reclassify non-current assets and non-current liabilities as current assets and current liabilities respectively. The effect of these adjustments has not yet been reflected in the financial statements. If the progress or actual outcomes of the aforementioned measures differ unfavourably from the expected results or if there is insufficient evidence to support that the aforementioned measures are successful, the Group’s ability to continue as a going concern will be in doubt, and hence, the use of the going concern basis in the preparation of the financial statements of the Group for the year ended 31 December 2010 may become inappropriate. Accordingly, the Company’s auditor will likely to issue a qualified opinion in this respect for the financial statements of the Group for the year ended 31 December 2010.
4. SEGMENT INFORMATION Information regarding the Group’s reportable segments as provided to the directors is set out below:
2010
Processed
foods
Chilled and
frozen rabbit meat
Chilled and frozen
chicken meat
Other products
Total RMB’000 RMB’000 RMB’000 RMB’000 RMB’000 (Unaudited) (Unaudited) (Unaudited) (Unaudited) (Unaudited) Revenue from external customers 376,497 207,673 261,511 171,189 1,016,870
Reportable segment revenue 376,497 207,673 261,511 171,189 1,016,870
Reportable segment profit 22,431 20,323 4,022 9,194 55,970
Depreciation of property, plant and equipment
12,738
7,129
10,728
1,958
32,553
Amortisation of prepaid premium land leases
914
512
770
141
2,337
Amortisation of intangible assets 5,685 419 - - 6,104
11
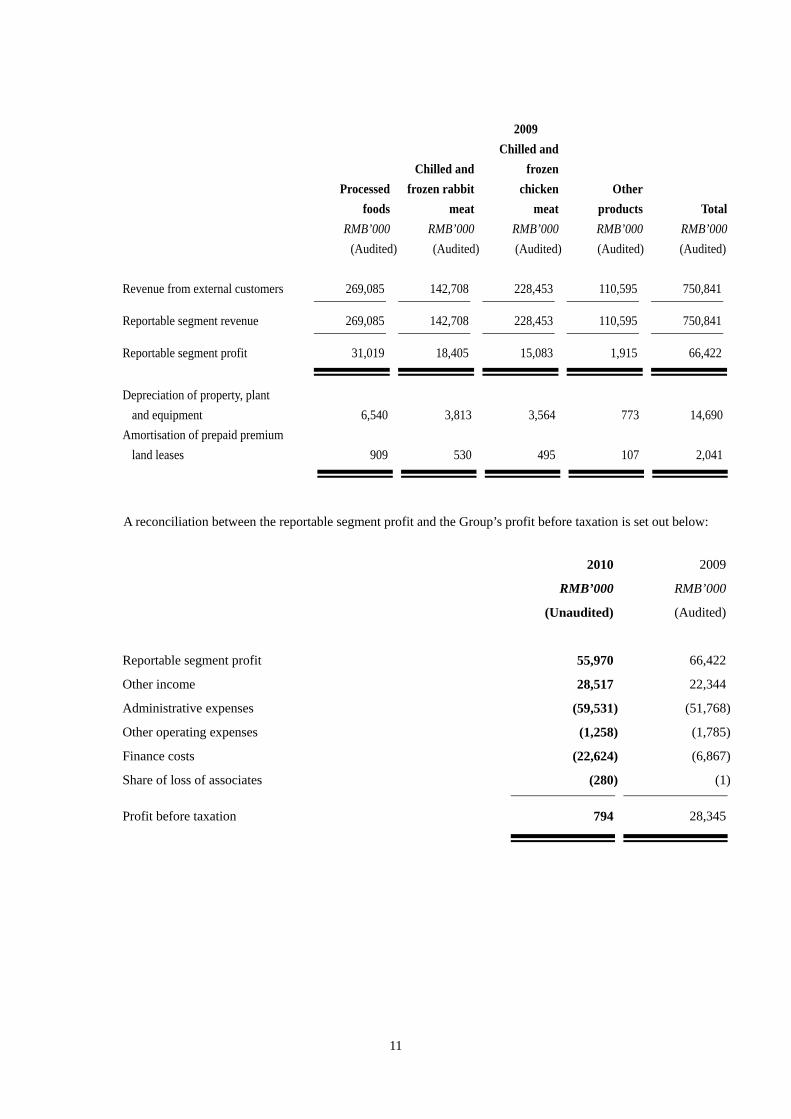
2009
Processedfoods
Chilled andfrozen rabbit
meat
Chilled andfrozen
chickenmeat
Other products Total
RMB’000 RMB’000 RMB’000 RMB’000 RMB’000(Audited) (Audited) (Audited) (Audited) (Audited)
Revenue from external customers 269,085 142,708 228,453 110,595 750,841
Reportable segment revenue 269,085 142,708 228,453 110,595 750,841
Reportable segment profit 31,019 18,405 15,083 1,915 66,422
Depreciation of property, plant and equipment
6,540
3,813
3,564
773
14,690
Amortisation of prepaid premium land leases
909
530
495
107
2,041
A reconciliation between the reportable segment profit and the Group’s profit before taxation is set out below:
2010 2009
RMB’000 RMB’000
(Unaudited) (Audited)
Reportable segment profit 55,970 66,422
Other income 28,517 22,344
Administrative expenses (59,531) (51,768)
Other operating expenses (1,258) (1,785)
Finance costs (22,624) (6,867)
Share of loss of associates (280) (1)
Profit before taxation 794 28,345

12
The following table set out information about the geographical locations of the Group’s revenue from external
customers. The geographical location of customers is determined based on the location at which the goods were
delivered.
2010 2009
RMB’000 RMB’000
(Unaudited) (Audited)
Local (Country of domicile)
PRC 586,329 437,172
Export (Foreign countries)
Japan 222,669 174,096
Europe 135,581 101,177
Others 72,291 38,396
1,016,870 750,841
The Group’s non-current assets are solely located in the PRC (the country of domicile of the Company).
5. REVENUE AND OTHER INCOME
Revenue of the Group, which is also the turnover of the Group, represents the net invoiced value of goods sold,
net of allowances for returns, trade discounts and value-added tax. An analysis of the Group’s revenue and
other income is as follows:
2010 2009
RMB’000 RMB’000
(Unaudited) (Audited)
Revenue
Sale of goods 1,016,870 750,841
13
2010 2009
RMB’000 RMB’000
(Unaudited) (Audited)
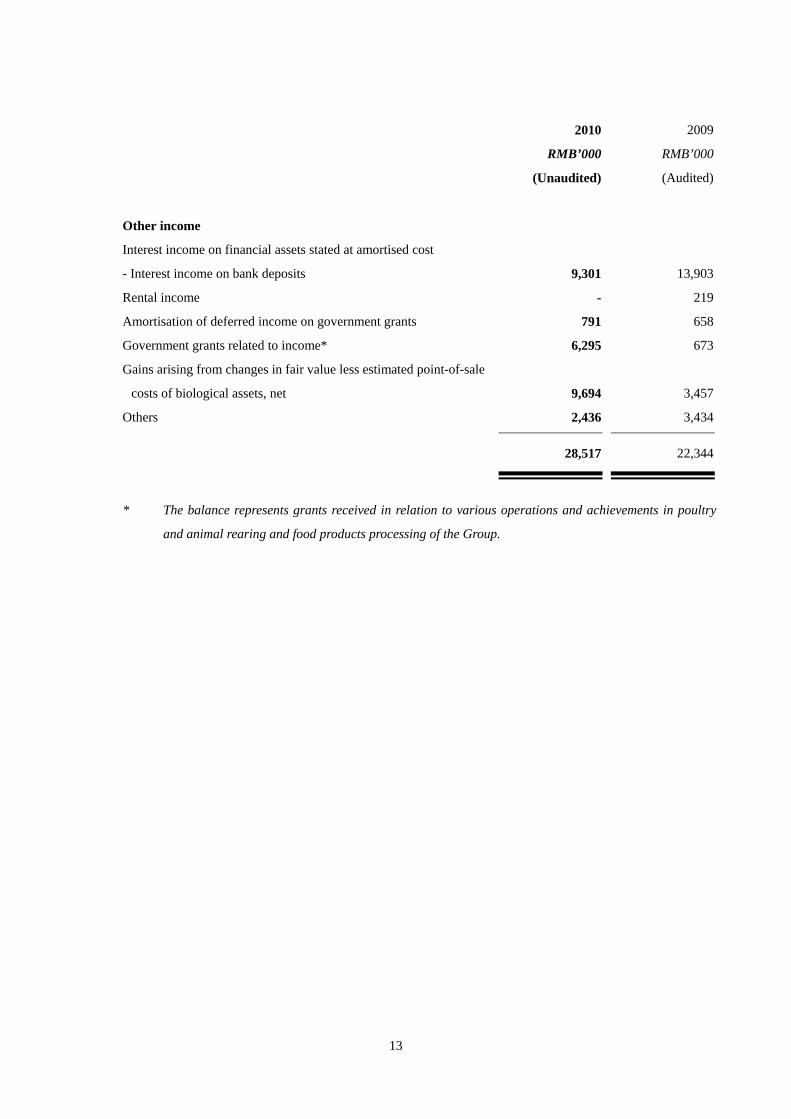
Other income
Interest income on financial assets stated at amortised cost
- Interest income on bank deposits 9,301 13,903
Rental income - 219
Amortisation of deferred income on government grants 791 658
Government grants related to income* 6,295 673
Gains arising from changes in fair value less estimated point-of-sale
costs of biological assets, net
9,694 3,457
Others 2,436 3,434
28,517 22,344 * The balance represents grants received in relation to various operations and achievements in poultry
and animal rearing and food products processing of the Group.

14
6. PROFIT FROM OPERATIONS The Group’s profit from operations is arrived at after charging/(crediting): 2010 2009
RMB’000 RMB’000 (Unaudited) (Audited) Cost of inventories recognised as an expense 770,233 547,551
Depreciation of property, plant and equipment* 32,553 19,400
Amortisation of prepaid premium for land leases** 2,337 2,041
Amortisation of an intangible assets*** 6,104 105
Minimum lease payments under operating leases for production
facilities
2,517 2,296
Gains arising from changes in fair value less estimated
point-of-sale costs of biological assets, net
(9,694) (3,457)
Audit fee 1,206 1,271
Non-audit fee - 885
Staff costs (including directors’ remuneration) 102,241 54,522
Less: Retirement scheme contribution (7,982) (4,206)
94,259 50,316
Loss on disposal of property, plant and equipment 970 839
Exchange loss, net 690 1,874
Impairment on other receivable - 944
Loss on disposal of a subsidiary - 1 * Depreciation of approximately RMB26,357,000 (2009: RMB14,690,000) and approximately
RMB6,196,000 (2009: RMB4,710,000) has been charged to cost of sales and administrative expenses, respectively, for the year ended 31 December 2010.
** Amortisation of prepaid premium for land leases has been charged to cost of sales for the years ended
31 December 2009 and 2010. *** Amortisation of intangible assets has been charged to cost of sales for the years ended 31 December
2009 and 2010.
15
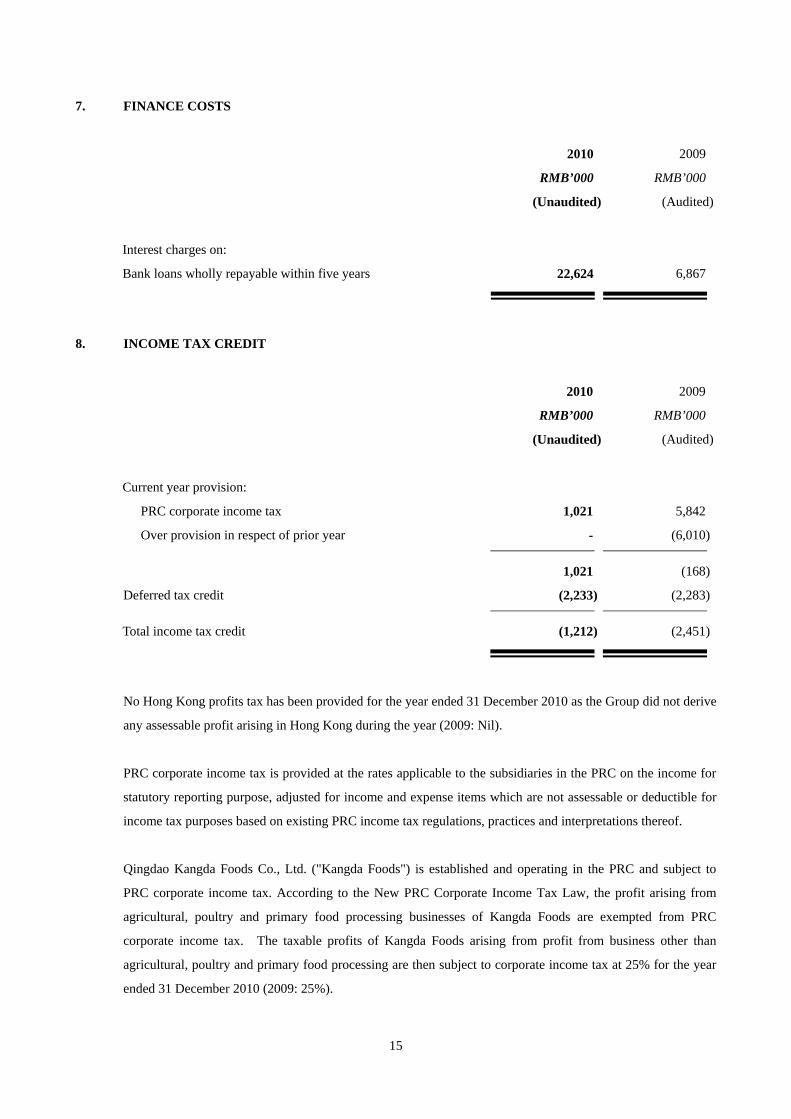
7. FINANCE COSTS
2010 2009
RMB’000 RMB’000
(Unaudited) (Audited)
Interest charges on:
Bank loans wholly repayable within five years 22,624 6,867
8. INCOME TAX CREDIT
2010 2009
RMB’000 RMB’000
(Unaudited) (Audited)
Current year provision:
PRC corporate income tax 1,021 5,842
Over provision in respect of prior year - (6,010)
1,021 (168)
Deferred tax credit (2,233) (2,283)
Total income tax credit (1,212) (2,451)
No Hong Kong profits tax has been provided for the year ended 31 December 2010 as the Group did not derive
any assessable profit arising in Hong Kong during the year (2009: Nil).
PRC corporate income tax is provided at the rates applicable to the subsidiaries in the PRC on the income for
statutory reporting purpose, adjusted for income and expense items which are not assessable or deductible for
income tax purposes based on existing PRC income tax regulations, practices and interpretations thereof.
Qingdao Kangda Foods Co., Ltd. ("Kangda Foods") is established and operating in the PRC and subject to
PRC corporate income tax. According to the New PRC Corporate Income Tax Law, the profit arising from
agricultural, poultry and primary food processing businesses of Kangda Foods are exempted from PRC
corporate income tax. The taxable profits of Kangda Foods arising from profit from business other than
agricultural, poultry and primary food processing are then subject to corporate income tax at 25% for the year
ended 31 December 2010 (2009: 25%).

16
Under the New PRC Corporate Income Tax Law and Implementation Rules, enterprises that engage in
qualifying agricultural business are eligible for certain tax benefits, including full corporate income tax
exemption or half reduction of corporate income tax on profits derived from such business. Qingdao Kangda
Animal Rearing Company Limited, Qingdao Kangda Rabbit Company Limited, Jilin Kang’an Rabbit Co.
Limited, Gaomi Kaijia Rearing Co., Limited, Gaomi Kangda Liuhe Feed Co., Limited and Qingdao Kangda
Modern Agricultural Technology Development Company Limited engaged in qualifying agricultural business,
which include breeding and sales of livestock, and are entitled to full exemption of corporate income tax
during the years ended 31 December 2009 and 2010.
Tax has not been provided by the Company as the Company did not derive any assessable profits during the
year (2009: Nil).
9. DIVIDENDS
The board of directors did not recommend any payment of dividends during the year (2009: Nil).
10. EARNINGS PER SHARE
The calculation of basic earnings per share is based on the loss attributable to owners of the Company of
approximately RMB3,383,000 (2009: RMB30,355,000) and on the weighted average of 432,948,000 (2009:
weighted average of 433,308,000) ordinary shares in issue during the year.
In relation to the years ended 31 December 2009 and 2010, no diluted earnings per share are presented as there
was no potential ordinary share.
11. TRADE RECEIVABLES
Trade receivables are non-interest bearing and are generally on terms of 30 to 90 days. They are recognised at
their original invoice amounts which represent their fair values at initial recognition.
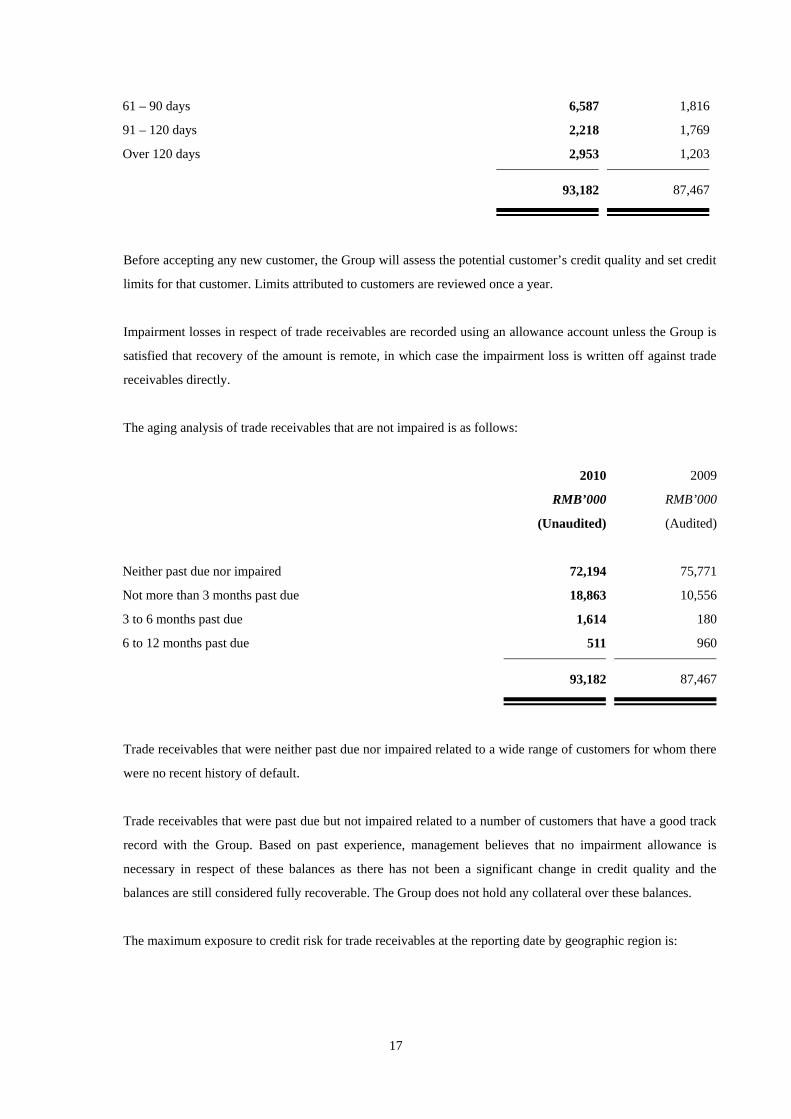
The aging analysis of trade receivables based on invoice days as at the reporting dates are as follows:
2010 2009
RMB’000 RMB’000
(Unaudited) (Audited)
Within 30 days 64,874 70,321
31 – 60 days 16,550 12,358
17
61 – 90 days 6,587 1,816
91 – 120 days 2,218 1,769
Over 120 days 2,953 1,203
93,182 87,467
Before accepting any new customer, the Group will assess the potential customer’s credit quality and set credit
limits for that customer. Limits attributed to customers are reviewed once a year.
Impairment losses in respect of trade receivables are recorded using an allowance account unless the Group is
satisfied that recovery of the amount is remote, in which case the impairment loss is written off against trade
receivables directly.
The aging analysis of trade receivables that are not impaired is as follows:
2010 2009
RMB’000 RMB’000
(Unaudited) (Audited)
Neither past due nor impaired 72,194 75,771
Not more than 3 months past due 18,863 10,556
3 to 6 months past due 1,614 180
6 to 12 months past due 511 960
93,182 87,467
Trade receivables that were neither past due nor impaired related to a wide range of customers for whom there
were no recent history of default.
Trade receivables that were past due but not impaired related to a number of customers that have a good track
record with the Group. Based on past experience, management believes that no impairment allowance is
necessary in respect of these balances as there has not been a significant change in credit quality and the
balances are still considered fully recoverable. The Group does not hold any collateral over these balances.
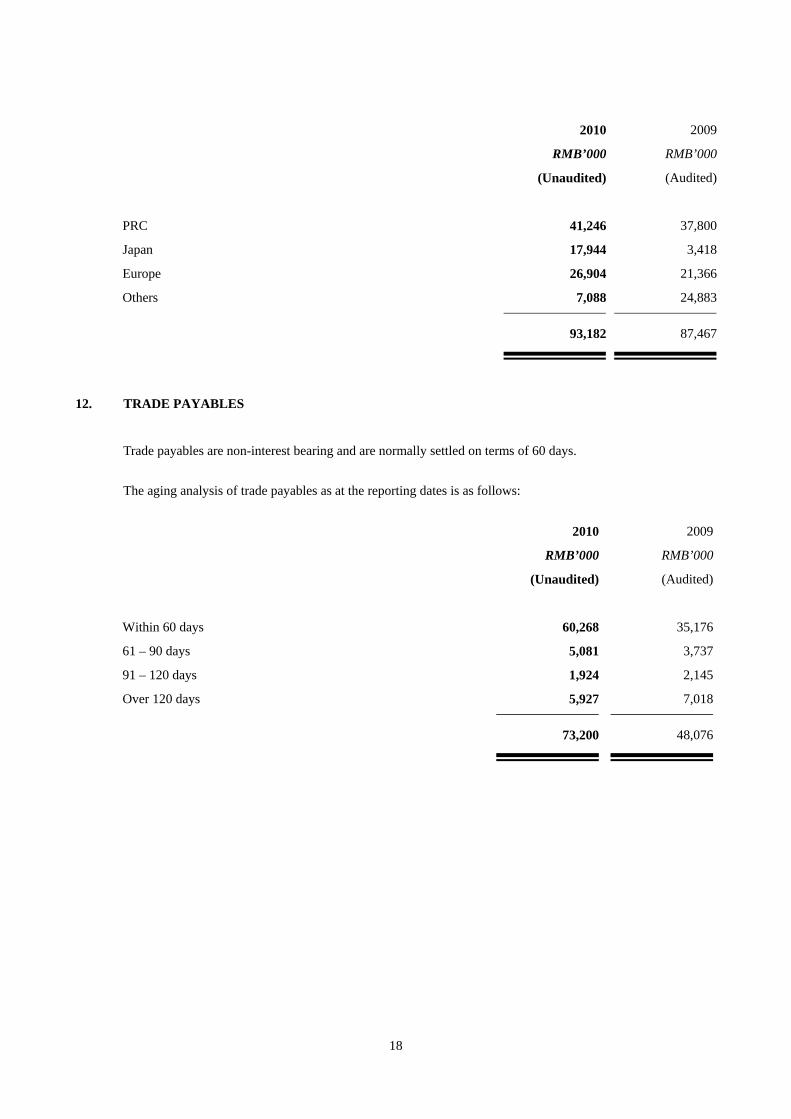
The maximum exposure to credit risk for trade receivables at the reporting date by geographic region is:
18
2010 2009
RMB’000 RMB’000
(Unaudited) (Audited)
PRC 41,246 37,800
Japan 17,944 3,418
Europe 26,904 21,366
Others 7,088 24,883
93,182 87,467
12. TRADE PAYABLES
Trade payables are non-interest bearing and are normally settled on terms of 60 days. The aging analysis of trade payables as at the reporting dates is as follows: 2010 2009
RMB’000 RMB’000
(Unaudited) (Audited)
Within 60 days 60,268 35,176
61 – 90 days 5,081 3,737
91 – 120 days 1,924 2,145
Over 120 days 5,927 7,018
73,200 48,076
19
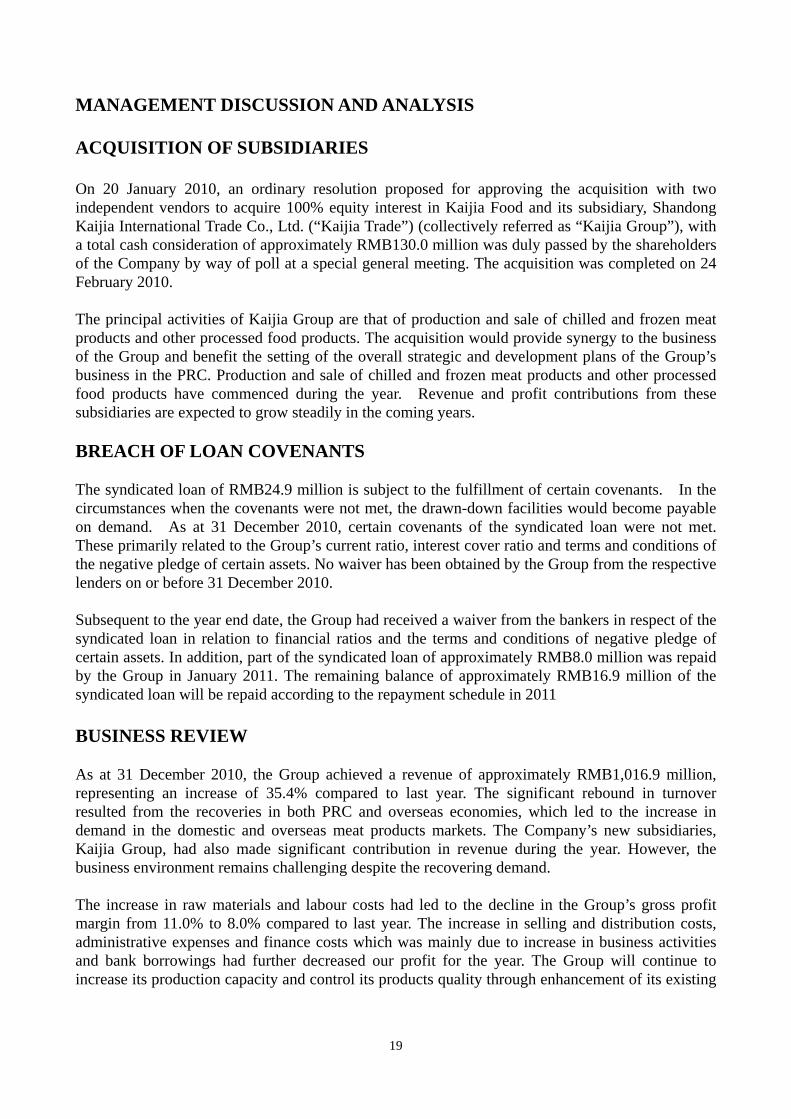
MANAGEMENT DISCUSSION AND ANALYSIS ACQUISITION OF SUBSIDIARIES On 20 January 2010, an ordinary resolution proposed for approving the acquisition with two independent vendors to acquire 100% equity interest in Kaijia Food and its subsidiary, Shandong Kaijia International Trade Co., Ltd. (“Kaijia Trade”) (collectively referred as “Kaijia Group”), with a total cash consideration of approximately RMB130.0 million was duly passed by the shareholders of the Company by way of poll at a special general meeting. The acquisition was completed on 24 February 2010. The principal activities of Kaijia Group are that of production and sale of chilled and frozen meat products and other processed food products. The acquisition would provide synergy to the business of the Group and benefit the setting of the overall strategic and development plans of the Group’s business in the PRC. Production and sale of chilled and frozen meat products and other processed food products have commenced during the year. Revenue and profit contributions from these subsidiaries are expected to grow steadily in the coming years. BREACH OF LOAN COVENANTS The syndicated loan of RMB24.9 million is subject to the fulfillment of certain covenants. In the circumstances when the covenants were not met, the drawn-down facilities would become payable on demand. As at 31 December 2010, certain covenants of the syndicated loan were not met. These primarily related to the Group’s current ratio, interest cover ratio and terms and conditions of the negative pledge of certain assets. No waiver has been obtained by the Group from the respective lenders on or before 31 December 2010. Subsequent to the year end date, the Group had received a waiver from the bankers in respect of the syndicated loan in relation to financial ratios and the terms and conditions of negative pledge of certain assets. In addition, part of the syndicated loan of approximately RMB8.0 million was repaid by the Group in January 2011. The remaining balance of approximately RMB16.9 million of the syndicated loan will be repaid according to the repayment schedule in 2011 BUSINESS REVIEW As at 31 December 2010, the Group achieved a revenue of approximately RMB1,016.9 million, representing an increase of 35.4% compared to last year. The significant rebound in turnover resulted from the recoveries in both PRC and overseas economies, which led to the increase in demand in the domestic and overseas meat products markets. The Company’s new subsidiaries, Kaijia Group, had also made significant contribution in revenue during the year. However, the business environment remains challenging despite the recovering demand. The increase in raw materials and labour costs had led to the decline in the Group’s gross profit margin from 11.0% to 8.0% compared to last year. The increase in selling and distribution costs, administrative expenses and finance costs which was mainly due to increase in business activities and bank borrowings had further decreased our profit for the year. The Group will continue to increase its production capacity and control its products quality through enhancement of its existing
20
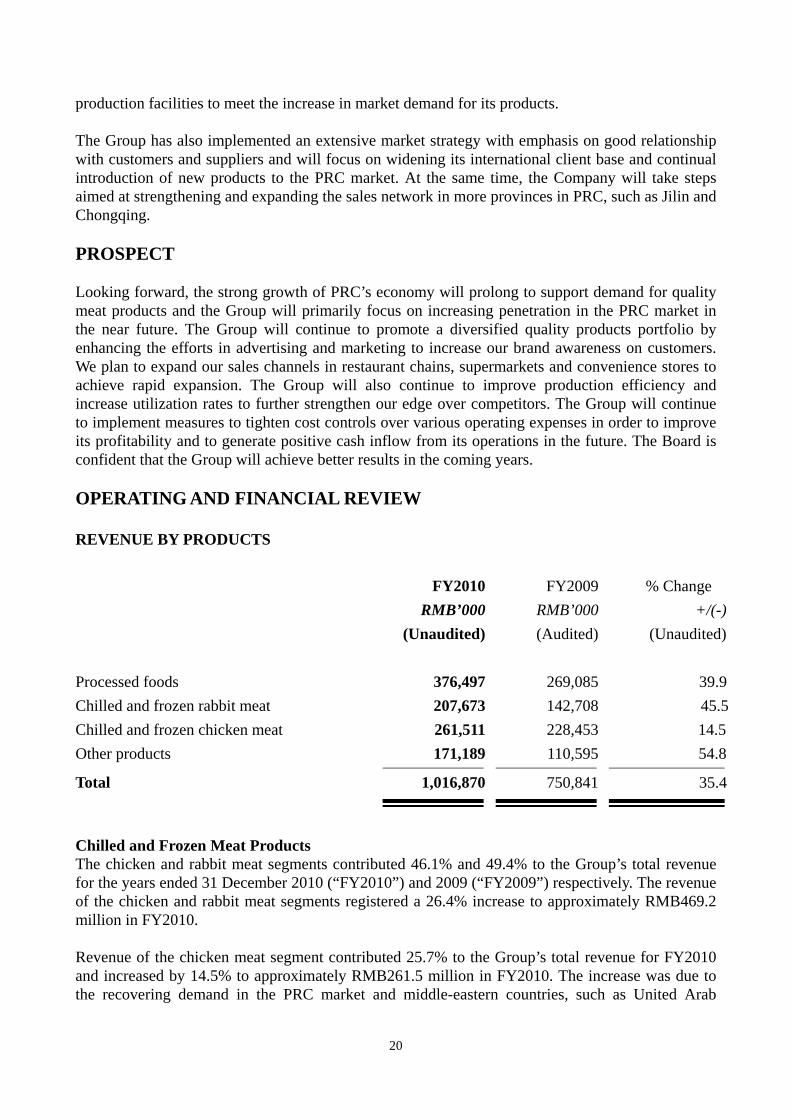
production facilities to meet the increase in market demand for its products. The Group has also implemented an extensive market strategy with emphasis on good relationship with customers and suppliers and will focus on widening its international client base and continual introduction of new products to the PRC market. At the same time, the Company will take steps aimed at strengthening and expanding the sales network in more provinces in PRC, such as Jilin and Chongqing. PROSPECT Looking forward, the strong growth of PRC’s economy will prolong to support demand for quality meat products and the Group will primarily focus on increasing penetration in the PRC market in the near future. The Group will continue to promote a diversified quality products portfolio by enhancing the efforts in advertising and marketing to increase our brand awareness on customers. We plan to expand our sales channels in restaurant chains, supermarkets and convenience stores to achieve rapid expansion. The Group will also continue to improve production efficiency and increase utilization rates to further strengthen our edge over competitors. The Group will continue to implement measures to tighten cost controls over various operating expenses in order to improve its profitability and to generate positive cash inflow from its operations in the future. The Board is confident that the Group will achieve better results in the coming years. OPERATING AND FINANCIAL REVIEW REVENUE BY PRODUCTS FY2010 FY2009 % Change RMB’000 RMB’000 +/(-) (Unaudited) (Audited) (Unaudited) Processed foods 376,497 269,085 39.9Chilled and frozen rabbit meat 207,673 142,708 45.5Chilled and frozen chicken meat 261,511 228,453 14.5Other products 171,189 110,595 54.8 Total 1,016,870 750,841 35.4
Chilled and Frozen Meat Products The chicken and rabbit meat segments contributed 46.1% and 49.4% to the Group’s total revenue for the years ended 31 December 2010 (“FY2010”) and 2009 (“FY2009”) respectively. The revenue of the chicken and rabbit meat segments registered a 26.4% increase to approximately RMB469.2 million in FY2010. Revenue of the chicken meat segment contributed 25.7% to the Group’s total revenue for FY2010 and increased by 14.5% to approximately RMB261.5 million in FY2010. The increase was due to the recovering demand in the PRC market and middle-eastern countries, such as United Arab
21
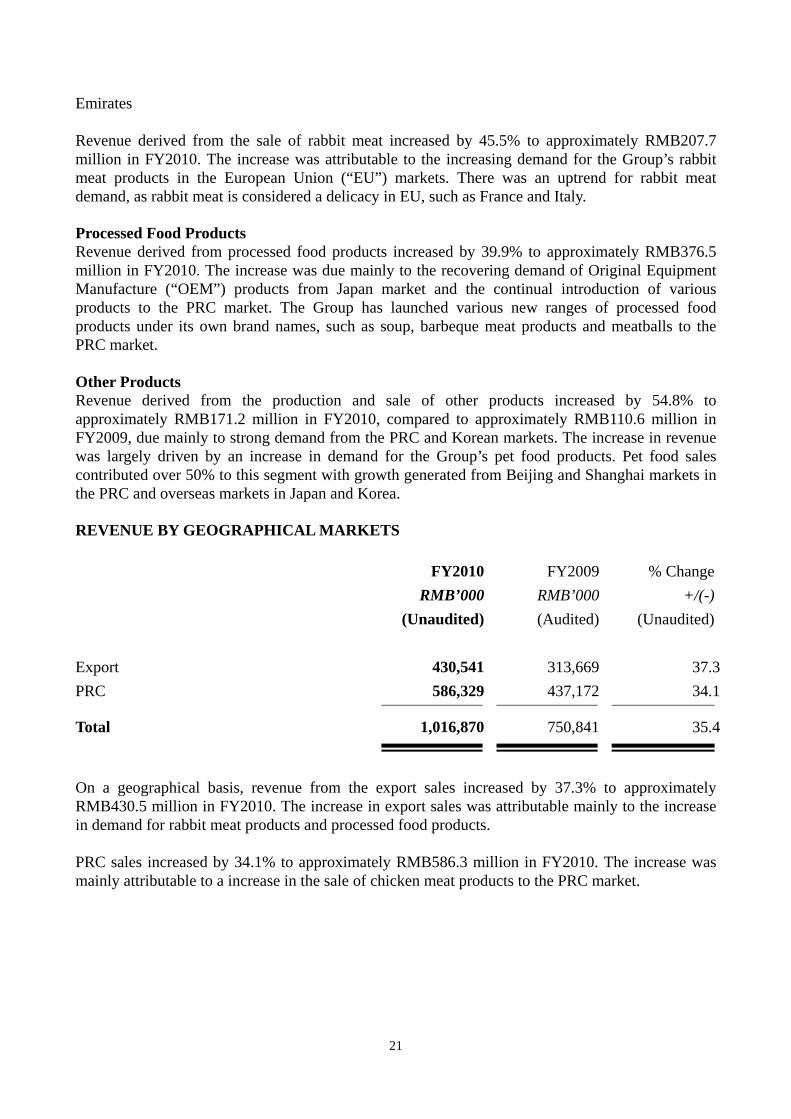
Emirates Revenue derived from the sale of rabbit meat increased by 45.5% to approximately RMB207.7 million in FY2010. The increase was attributable to the increasing demand for the Group’s rabbit meat products in the European Union (“EU”) markets. There was an uptrend for rabbit meat demand, as rabbit meat is considered a delicacy in EU, such as France and Italy. Processed Food Products Revenue derived from processed food products increased by 39.9% to approximately RMB376.5 million in FY2010. The increase was due mainly to the recovering demand of Original Equipment Manufacture (“OEM”) products from Japan market and the continual introduction of various products to the PRC market. The Group has launched various new ranges of processed food products under its own brand names, such as soup, barbeque meat products and meatballs to the PRC market. Other Products Revenue derived from the production and sale of other products increased by 54.8% to approximately RMB171.2 million in FY2010, compared to approximately RMB110.6 million in FY2009, due mainly to strong demand from the PRC and Korean markets. The increase in revenue was largely driven by an increase in demand for the Group’s pet food products. Pet food sales contributed over 50% to this segment with growth generated from Beijing and Shanghai markets in the PRC and overseas markets in Japan and Korea. REVENUE BY GEOGRAPHICAL MARKETS FY2010 FY2009 % Change RMB’000 RMB’000 +/(-) (Unaudited) (Audited) (Unaudited) Export 430,541 313,669 37.3PRC 586,329 437,172 34.1
Total 1,016,870 750,841 35.4
On a geographical basis, revenue from the export sales increased by 37.3% to approximately RMB430.5 million in FY2010. The increase in export sales was attributable mainly to the increase in demand for rabbit meat products and processed food products. PRC sales increased by 34.1% to approximately RMB586.3 million in FY2010. The increase was mainly attributable to a increase in the sale of chicken meat products to the PRC market.
22
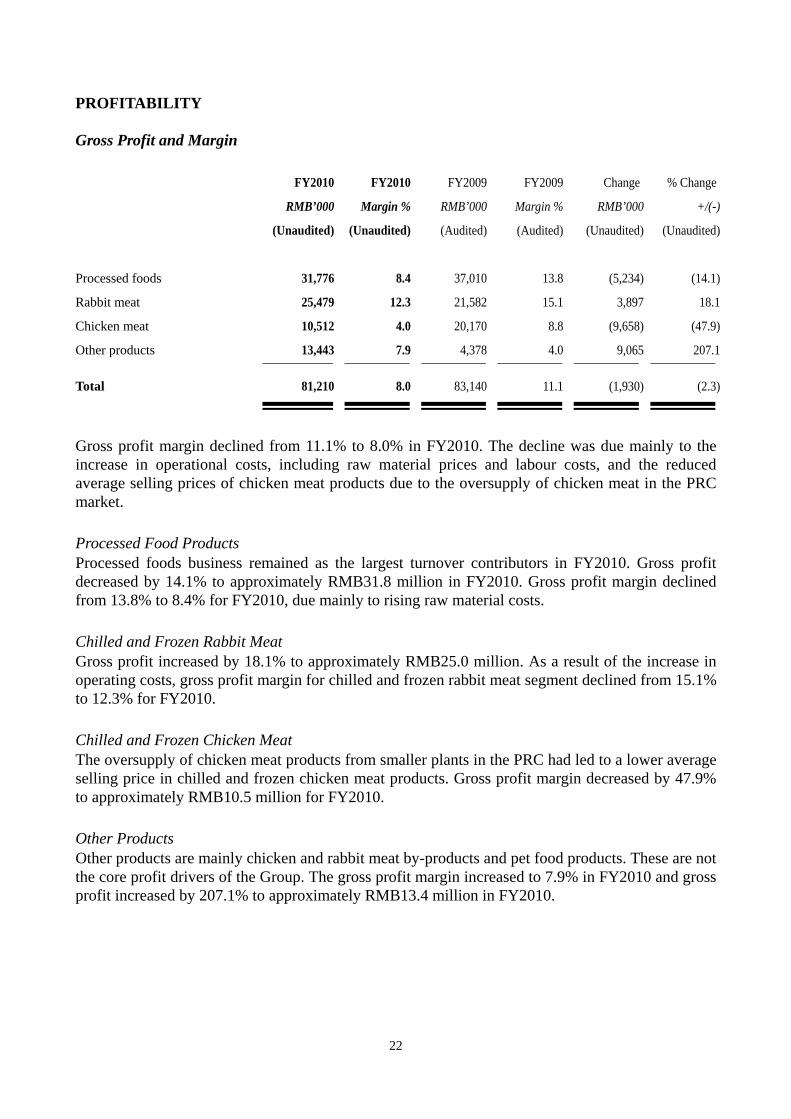
PROFITABILITY Gross Profit and Margin FY2010 FY2010 FY2009 FY2009 Change % Change
RMB’000 Margin % RMB’000 Margin % RMB’000 +/(-)
(Unaudited) (Unaudited) (Audited) (Audited) (Unaudited) (Unaudited)
Processed foods 31,776 8.4 37,010 13.8 (5,234) (14.1)
Rabbit meat 25,479 12.3 21,582 15.1 3,897 18.1
Chicken meat 10,512 4.0 20,170 8.8 (9,658) (47.9)
Other products 13,443 7.9 4,378 4.0 9,065 207.1
Total 81,210 8.0 83,140 11.1 (1,930) (2.3)
Gross profit margin declined from 11.1% to 8.0% in FY2010. The decline was due mainly to the increase in operational costs, including raw material prices and labour costs, and the reduced average selling prices of chicken meat products due to the oversupply of chicken meat in the PRC market. Processed Food Products Processed foods business remained as the largest turnover contributors in FY2010. Gross profit decreased by 14.1% to approximately RMB31.8 million in FY2010. Gross profit margin declined from 13.8% to 8.4% for FY2010, due mainly to rising raw material costs. Chilled and Frozen Rabbit Meat Gross profit increased by 18.1% to approximately RMB25.0 million. As a result of the increase in operating costs, gross profit margin for chilled and frozen rabbit meat segment declined from 15.1% to 12.3% for FY2010. Chilled and Frozen Chicken Meat The oversupply of chicken meat products from smaller plants in the PRC had led to a lower average selling price in chilled and frozen chicken meat products. Gross profit margin decreased by 47.9% to approximately RMB10.5 million for FY2010. Other Products Other products are mainly chicken and rabbit meat by-products and pet food products. These are not the core profit drivers of the Group. The gross profit margin increased to 7.9% in FY2010 and gross profit increased by 207.1% to approximately RMB13.4 million in FY2010.
23
Other Income Other income comprised mainly government grants and interest income from bank deposits amounting to approximately RMB6.3 million and approximately RMB9.3 million respectively. The rest were rental income, recovery of gas, electricity from customers and gain on change in fair value of biological assets. Selling and Distribution Expenses The increase in selling and distribution expenses by 51.0% to approximately RMB25.2 million in FY2010 was primarily due to higher transportation, quality inspection, advertising cost and more salesperson being employed from the increased business activity level. Administrative Expenses Administrative expenses comprised mainly staff costs, professional fees, travelling expenses and etc. The increase of 15.0% amounting to approximately RMB59.5 million for FY2010 was due mainly to the acquisition of subsidiaries in 2010 which resulted in higher administrative expenses and more employees being employed by the Group. Finance Costs Finance costs increased by 229.5% to approximately RMB22.6 million for FY2010 resulted from (1) the consolidation of Kaijia Group which incurred the bank loans interest amounting to approximately RMB5.3 million; (2) the increase of bank borrowing due to the business expansion in FY2010; and (3) the amortization of arrangement fee and upfront fee of the syndicated loan amounting to approximately RMB4.7 million. Taxation Tax credit of approximately RMB1.2 million recorded in FY2010 was due mainly to the provision of deferred tax liability in the course of the acquisition of Kaijia Group. Exchange loss, net Since some of the Group’s purchase transactions were originally invoiced in foreign currency, such as Japanese yen and US dollar, the appreciation of RMB against those currencies and the increase of purchase in FY2010 decreased the exchange loss significantly. Review of the Group’s Financial Position as at 31 December 2010 The increase in property, plant and equipment represented the Group’s addition of facility and construction in progress, mainly the acquisition of Kaijia Group, amounting to approximately RMB212.9 million and depreciation amounting to approximately RMB12.6 million. The prepaid premium for land leases increased by approximately RMB25.8 million as at 31 December 2010 was mainly as a result of the acquisition of Kaijia Group. Goodwill arising from the acquisitions of Kaijia Group, Qingdao Kangda Modern Agricultural Technology Development Co., Ltd and Qingdao Pu De Food Co., Ltd. amounted to approximately RMB56.3 million, RMB0.4 million and RMB2.7 million respectively.
24
The intangible assets refer to the export licences and hygiene registration certificates awarded by the relevant authorities in Japan and EU, where the registered products produced by the Group are allowed to be exported to these countries. The increase in intangible assets by approximately RMB4.5 million as at 31 December 2010 arose from the acquisition of Kaijia Group. Biological assets refer to progeny rabbits and progeny chickens for sale and breeder rabbits and chickens for breeding purpose. These biological assets were valued by an independent professional valuer as at 31 December 2010 with reference to the market-determined prices. Inventories increased by approximately RMB58.4 million to approximately RMB137.0 million in anticipation of an increase in demand in the first quarter of 2011. The inventory turnover day for FY2010 was 42 days compared to 38 days for FY2009. Trade receivables increased by approximately RMB5.7 million or 6.5% to approximately RMB93.2 million as at 31 December 2010 in line with the increase in business volume. The trade receivables turnover days decreased to 32 days in FY2010 compared with 41 days FY2009 due to the stepping up of collection efforts. Prepayments, other receivables and deposits increased by approximately RMB32.0 million and to approximately RMB51.8 million as at 31 December 2010 due mainly to the increase of deposits placed with the Group’s suppliers for construction in progress which arose from the enhancement of the Group’s production facilities scheduled for completion in 2011. Trade payables increased by approximately RMB25.1 million from approximately RMB48.1 million as at 31 December 2009 to approximately RMB73.2 million as at 31 December 2010 due to the increase in purchase of raw materials to cater to the anticipated increase in demand in the first quarter of 2011. Accrued liabilities and other payables received represented payables for construction and facilities, salary and welfare payables, accrued expenses and deposit received. The increase was due to the increase of deposits placed by customers compared to balance as at 31 December 2009. In order to support the business expansion in FY2010, the interest-bearing bank borrowings increased significantly from approximately RMB109.8 million to RMB384.9 million. Tax payables decreased slightly from approximately RMB2.2 million as at 31 December 2009 to approximately RMB2.1 as at 31 December 2010. This was due to income tax paid during FY2010. CAPITAL STRUCTURE During the year under review, the Group had net assets of approximately RMB689.9 million (31 December 2009: RMB664.6 million), comprising non-current assets of approximately RMB801.8 million (31 December 2009: RMB433.8 million), and current assets of approximately RMB433.1 million (31 December 2009: RMB466.0 million). The Group recorded a net current liability position of approximately RMB100.8 million (31 December 2009: net current asset position of RMB240.5 million) as at 31 December 2010, which primarily consist of cash and bank balances amounted to approximately RMB116.6 million (31 December 2009: RMB267.9 million). Moreover, inventories amounted to approximately RMB137.0 million (31 December 2009: RMB78.6 million)
25
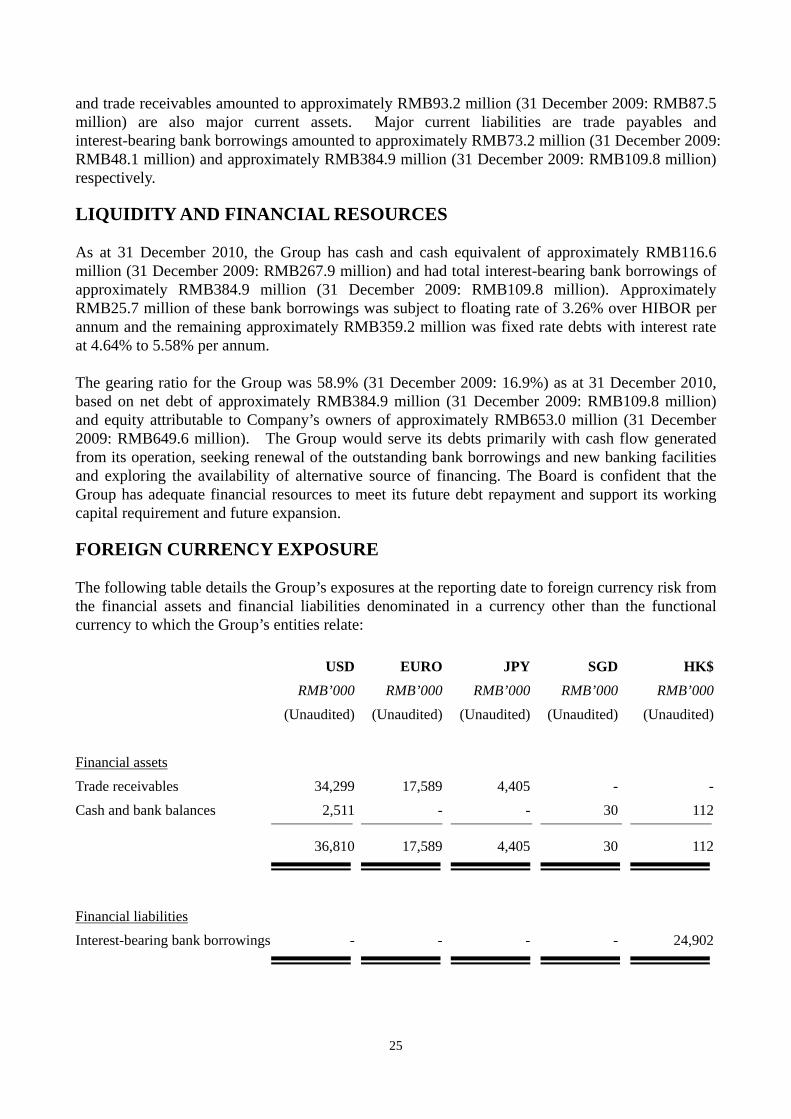
and trade receivables amounted to approximately RMB93.2 million (31 December 2009: RMB87.5 million) are also major current assets. Major current liabilities are trade payables and interest-bearing bank borrowings amounted to approximately RMB73.2 million (31 December 2009: RMB48.1 million) and approximately RMB384.9 million (31 December 2009: RMB109.8 million) respectively. LIQUIDITY AND FINANCIAL RESOURCES As at 31 December 2010, the Group has cash and cash equivalent of approximately RMB116.6 million (31 December 2009: RMB267.9 million) and had total interest-bearing bank borrowings of approximately RMB384.9 million (31 December 2009: RMB109.8 million). Approximately RMB25.7 million of these bank borrowings was subject to floating rate of 3.26% over HIBOR per annum and the remaining approximately RMB359.2 million was fixed rate debts with interest rate at 4.64% to 5.58% per annum. The gearing ratio for the Group was 58.9% (31 December 2009: 16.9%) as at 31 December 2010, based on net debt of approximately RMB384.9 million (31 December 2009: RMB109.8 million) and equity attributable to Company’s owners of approximately RMB653.0 million (31 December 2009: RMB649.6 million). The Group would serve its debts primarily with cash flow generated from its operation, seeking renewal of the outstanding bank borrowings and new banking facilities and exploring the availability of alternative source of financing. The Board is confident that the Group has adequate financial resources to meet its future debt repayment and support its working capital requirement and future expansion. FOREIGN CURRENCY EXPOSURE The following table details the Group’s exposures at the reporting date to foreign currency risk from the financial assets and financial liabilities denominated in a currency other than the functional currency to which the Group’s entities relate: USD EURO JPY SGD HK$ RMB’000 RMB’000 RMB’000 RMB’000 RMB’000 (Unaudited) (Unaudited) (Unaudited) (Unaudited) (Unaudited) Financial assets Trade receivables 34,299 17,589 4,405 - -Cash and bank balances 2,511 - - 30 112
36,810 17,589 4,405 30 112
Financial liabilities Interest-bearing bank borrowings - - - - 24,902

26
In view of the nature of the Group’s business, which spans several countries, foreign exchange risks will continue to be an integral aspect of its risk profile in the future. Currently, the Group neither has a formal foreign currency hedging policy nor conducts hedging exercise to reduce foreign currency exposure. The Group will continue to monitor its foreign exchange exposure should it be necessary. CAPITAL COMMITMENTS As at 31 December 2010, the capital commitment of the Group which had been contracted for but not provided in the financial statements was in the total amount of approximately RMB11.6 million (2009: RMB160.6 million). CHARGE ON ASSETS A syndicated loan of approximately RMB24.9 million was guaranteed and secured against the Company’s interests in its two subsidiaries, Perfect Good Group Limited and Spiritzone Group Limited. Approximately RMB170.0 million of the secured bank loan was borrowed during the year and secured by the pledge of certain of the Group’s property, plant and equipment with an aggregate carrying amount of approximately RMB63.5 million and land use rights with an aggregate carrying amount of approximately RMB17.5 million. CONTINGENT LIABILITIES As at 31 December 2010, the Group did not have any material contingent liabilities (31 December 2009: Nil). EMPLOYEES AND EMOLUMENT POLICY As at 31 December 2010, the Group employed a total of 4,056 employees (2009: 3,586 employees) in PRC. The Group’s emolument policy is formulated based on the industry practices and performance of individual employee. During the year under review, the total staff costs (including Directors’ emoluments) were in the amount of approximately RMB102.2 million (2009: RMB54.5 million). The Company does not have share option scheme for its employees. PURCHASE, SALE OR REDEMPTION OF THE COMPANY’S LISTED SECURITIES There was no purchase, sale or redemption of the Company’s listed securities by the Company or any of its subsidiaries during the year under review. AUDIT COMMITTEE The audit committee of the Company consists of the independent non-executive directors, namely Mr. Sim Wee Leong, Mr. Kuik See Juan and Mr. Yu Chung Leung and the non-executive director of the Company, Mr. Zhang Qi. The audit committee has reviewed with management the accounting principles and standards adopted by the Group, and discussed auditing, internal control and
27
financial reporting matters including the review of the annual results for the year ended 31 December 2010. CODE ON CORPORATE GOVERNANCE PRACTICE In the opinion of the Directors, the Company has adopted and complied with the code provisions of the Code on Corporate Governance Practice, as set out in Appendix 14 of the Listing Rules for the year ended 31 December 2010. MODEL CODE FOR SECURITIES TRANSACTIONS The Company has adopted the Model Code for Securities Transactions by Directors of Listed Issuers as set out in Appendix 10 of the Listing Rules (the “Model Code”). Having made specific enquiry of the directors of the Company, all the directors confirmed that they had complied with the required standards as set out in the Model Code for the year ended 31 December 2010. PUBLICATION OF RESULTS FOR THE YEAR ENDED 31 DECEMBER 2010 ANNOUNCEMENT AND ANNUAL REPORT This final results announcement is published on the websites of the Stock Exchange at www.hkex.com.hk and the Company at www.kangdafood.com. The Company’s Annual Report 2010 will also be published on the aforesaid websites in due course. STATUTORY INFORMAITON An annual general meeting of the Company will be held on 29 April 2011. The register of members of the Company will be closed from 26 April 2011 to 29 April 2011, both days inclusive, during which no transfer of shares will be registered. In order to qualify for attending the Annual General Meeting, all transfers accompanied by the relevant share certificates must be lodged with the Company’s branch share registrar, Tricor Investor Services Limited at 26th Floor, Tesbury Centre, 28 Queen’s Road East, Hong Kong, not later than 4:00 p.m. on 23 April 2011. SCOPE OF WORK OF THE AUDITOR The figures in respect of the preliminary announcement of the Group’s results for the year ended 31 December 2010 have been agreed by the Group’s auditor, BDO Limited, to the amounts set out in the Group’s draft consolidated financial statements for the year. The work performed by BDO Limited in this respect did not constitute an assurance engagement in accordance with Hong Kong Standards on Auditing, Hong Kong Standards on Review Engagements or Hong Kong Standards on Assurance Engagements issued by the Hong Kong Institute of Certified Public Accountants and consequently no assurance has been expressed by BDO Limited on the preliminary announcement.

28
APPRECIATION On behalf of the Board, I would like to express my sincere gratitude to our shareholders, customers, business partners for their unwavering support. I would also like to take this opportunity to thank all my colleagues and staff for their contribution and commitment to the Group.
On behalf of the Board China Kangda Food Company Limited
Gao Sishi Chairman
Hong Kong, 25 February 2011 As at the date of this announcement, the executive Directors of the Company are Mr. Gao Yanxu and Mr. An Fengjun, the non-executive Directors are Mr. Gao Sishi (Chairman) and Mr. Zhang Qi, the independent non-executive Directors are Mr. Kuik See Juan, Mr. Sim Wee Leong and Mr. Yu Chung Leung.
29
The following announcement is a reproduction of the announcement made by China Kangda Food Company Limited (the “Company”) regarding the annual results of the Company and its subsidiaries for the year ended 31 December 2010 pursuant to the Listing Manual of the Singapore Exchange Securities Trading Limited. In compliance with Rule 13.09(2) of the Listing Rules (which requires a listed issuer to ensure that if securities of the listed issuer are also listed on other stock exchanges, the Stock Exchange of Hong Kong Limited is simultaneously informed of any information released to any of such other stock exchanges and that such information is released to the market in Hong Kong at the same time as it is released on the other markets), the following announcement is announced by the Company simultaneously in Hong Kong and in Singapore on 25 February 2011.
FULL YEAR FINANCIAL STATEMENT ANNOUNCEMENT FOR THE YEAR ENDED 31 DECEMBER 2010
PART I - INFORMATION REQUIRED FOR ANNOUNCEMENTS OF FULL YEAR RESULTS
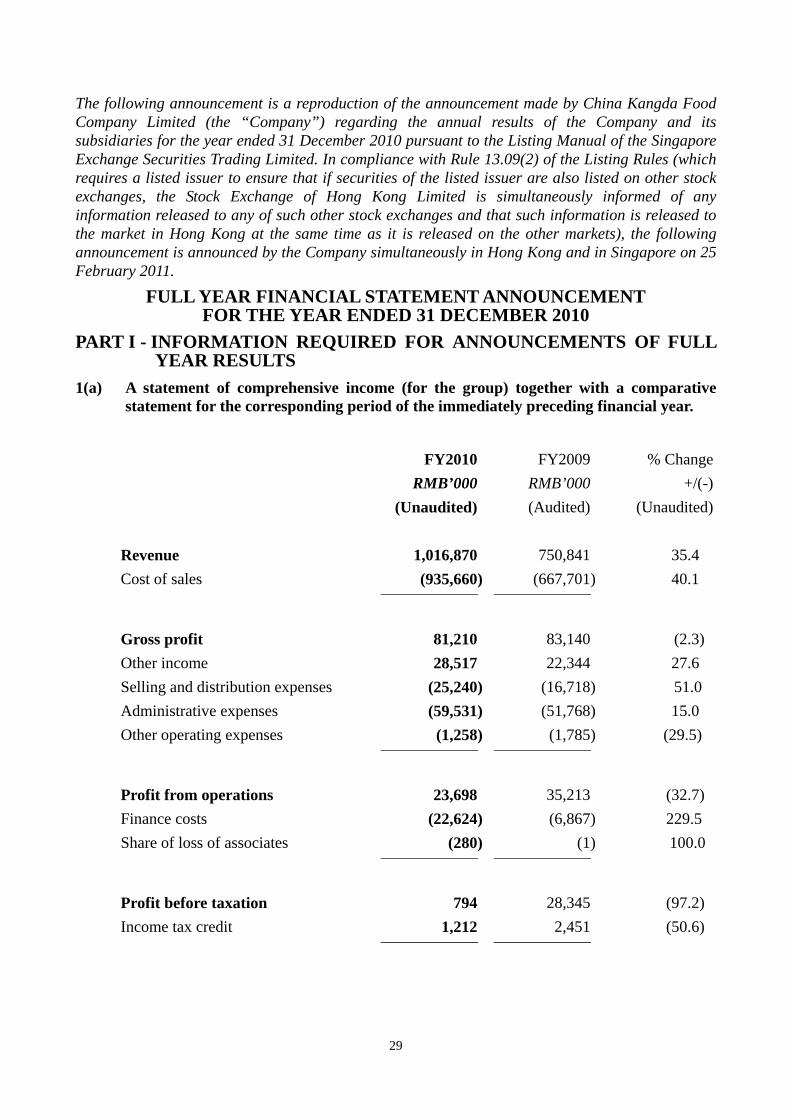
1(a) A statement of comprehensive income (for the group) together with a comparative statement for the corresponding period of the immediately preceding financial year.
FY2010 FY2009 % Change RMB’000 RMB’000 +/(-) (Unaudited) (Audited) (Unaudited) Revenue 1,016,870 750,841 35.4 Cost of sales (935,660) (667,701) 40.1
Gross profit 81,210 83,140 (2.3) Other income 28,517 22,344 27.6 Selling and distribution expenses (25,240) (16,718) 51.0 Administrative expenses (59,531) (51,768) 15.0 Other operating expenses (1,258) (1,785) (29.5)
Profit from operations 23,698 35,213 (32.7) Finance costs (22,624) (6,867) 229.5 Share of loss of associates (280) (1) 100.0
Profit before taxation 794 28,345 (97.2) Income tax credit 1,212 2,451 (50.6)
30
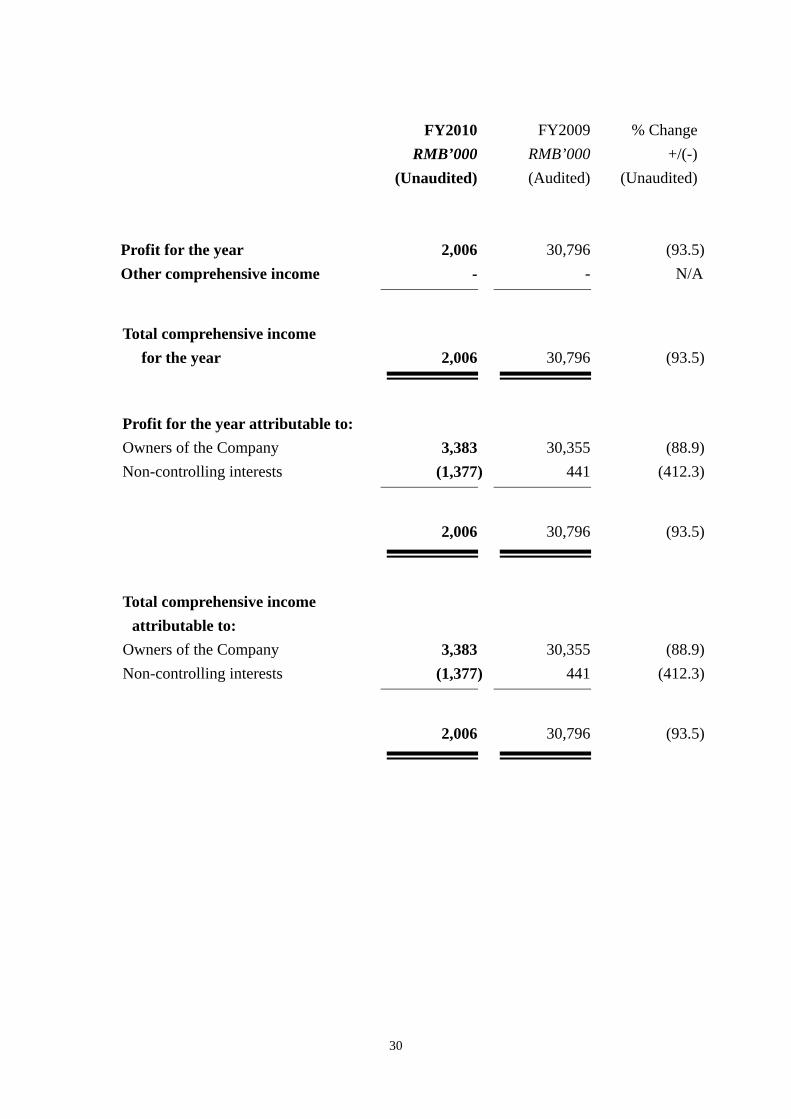
FY2010 FY2009 % Change RMB’000 RMB’000 +/(-)
(Unaudited) (Audited) (Unaudited) Profit for the year 2,006 30,796 (93.5) Other comprehensive income - - N/A
Total comprehensive income
for the year
2,006
30,796
(93.5)
Profit for the year attributable to: Owners of the Company 3,383 30,355 (88.9) Non-controlling interests (1,377) 441 (412.3)
2,006 30,796 (93.5)
Total comprehensive income attributable to:
Owners of the Company 3,383 30,355 (88.9) Non-controlling interests (1,377) 441 (412.3)
2,006 30,796 (93.5)
31
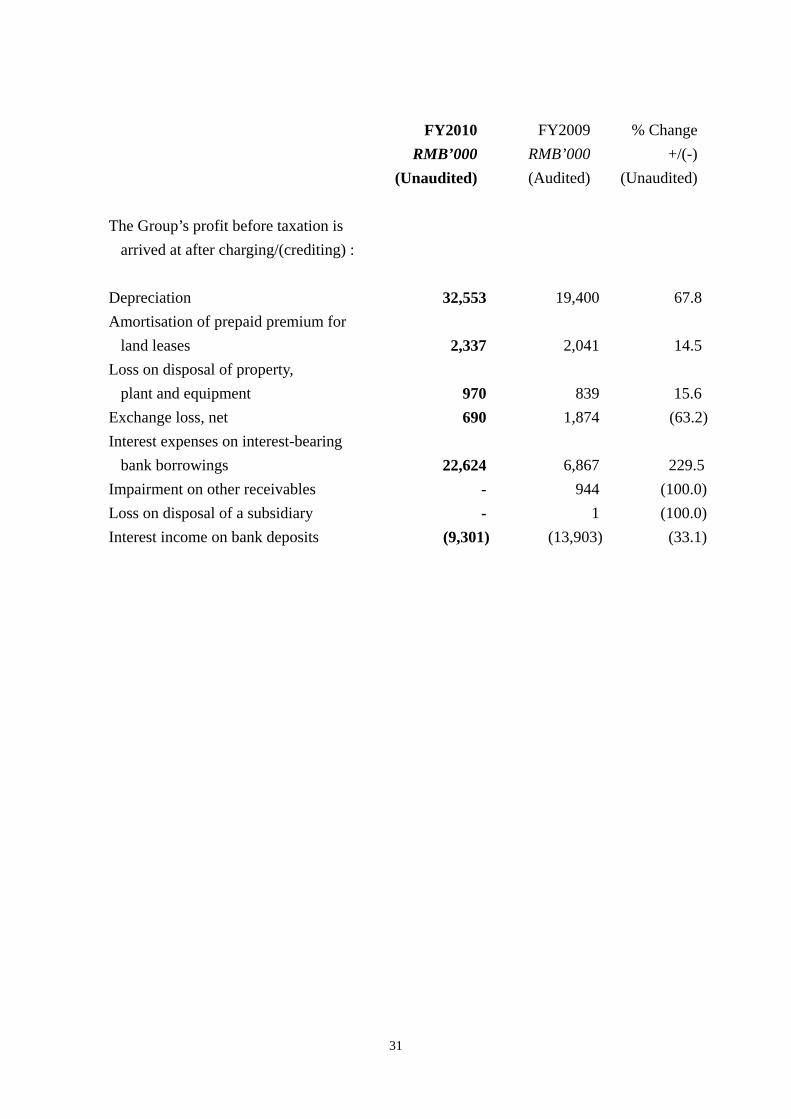
FY2010 FY2009 % Change RMB’000 RMB’000 +/(-)
(Unaudited) (Audited) (Unaudited) The Group’s profit before taxation is
arrived at after charging/(crediting) :
Depreciation 32,553 19,400 67.8 Amortisation of prepaid premium for
land leases 2,337
2,041
14.5 Loss on disposal of property,
plant and equipment 970
839
15.6 Exchange loss, net 690 1,874 (63.2) Interest expenses on interest-bearing
bank borrowings 22,624
6,867
229.5 Impairment on other receivables - 944 (100.0) Loss on disposal of a subsidiary - 1 (100.0) Interest income on bank deposits (9,301) (13,903) (33.1)

32
1(b)(i)Statements of financial position (for the issuer and group), together with a comparative statement as at the end of the immediately preceding financial year.
Group Company 2010 2009 2010 2009 RMB’000 RMB’000 RMB’000 RMB’000 (Unaudited) (Audited) (Unaudited) (Audited) (restated) (restated)ASSETS AND LIABILITIES Non-current assets Property, plant and equipment 559,186 296,978 10 12Prepaid premium for land leases 129,031 103,220 - -Intangible assets 8,592 4,085 - -Investments in subsidiaries - - 84,144 84,144Interest in associates 3,902 682 - -Goodwill 59,428 3,073 - -Biological assets 27,653 20,791 - -Deferred tax assets 13,971 4,960 - -
801,763 433,789 84,154 84,156 Current assets Biological assets 21,598 12,230 - -Inventories 137,039 78,649 - -Trade receivables 93,182 87,467 - -Prepayments, other receivables and
deposits 51,804 19,787
88 88Amounts due from subsidiaries - - 277,982 369,046Amount due from a related company 12,795 - - -Cash and bank balances 116,643 267,884 306 6,190 433,061 466,017 278,376 375,324 Current liabilities Trade payables 73,200 48,076 - -Accrued liabilities and other payables 72,839 43,128 652 2,340Interest-bearing bank borrowings 384,902 109,786 24,902 109,786Amount due to a related company - 21,585 - -Deferred government grants 791 658 - -Tax payables 2,142 2,243 - -
533,874 225,476 25,554 112,126
Net current (liabilities)/assets (100,813) 240,541 252,822 263,198
Total assets less current liabilities 700,950 674,330 336,976 347,354
33
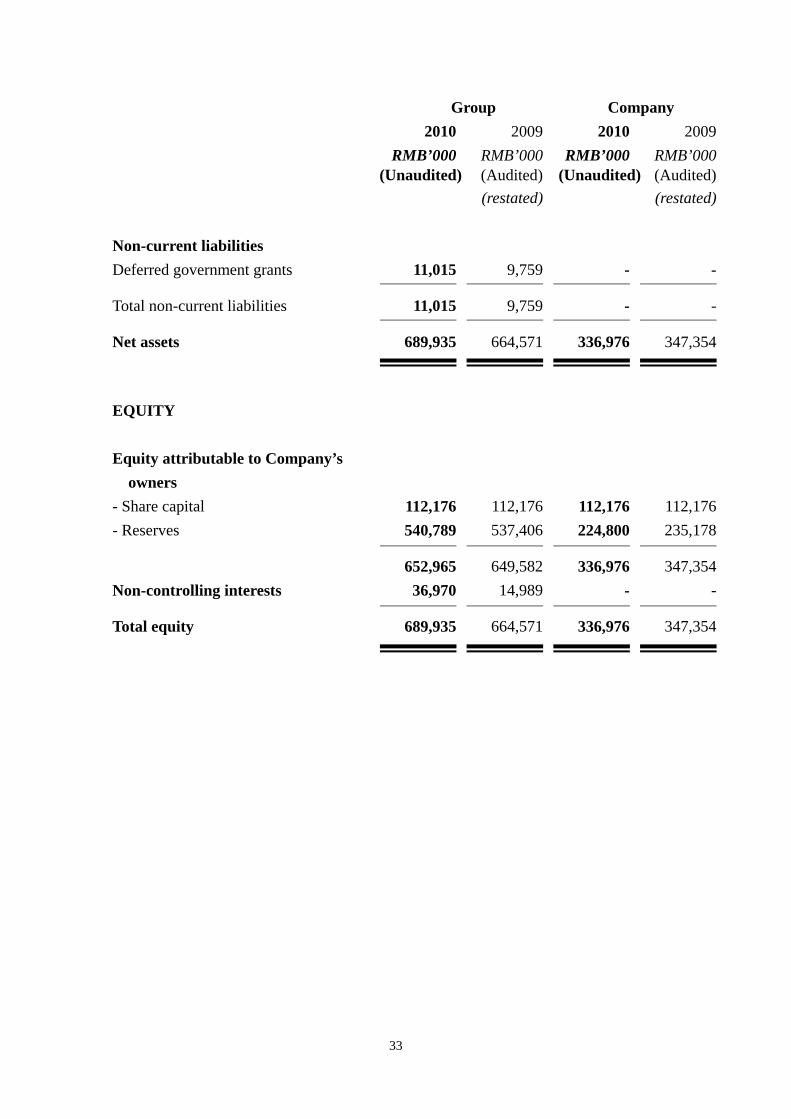
Group Company 2010 2009 2010 2009 RMB’000 RMB’000 RMB’000 RMB’000 (Unaudited) (Audited) (Unaudited) (Audited) (restated) (restated) Non-current liabilities Deferred government grants 11,015 9,759 - -
Total non-current liabilities 11,015 9,759 - -
Net assets 689,935 664,571 336,976 347,354
EQUITY Equity attributable to Company’s
owners
- Share capital 112,176 112,176 112,176 112,176- Reserves 540,789 537,406 224,800 235,178
652,965 649,582 336,976 347,354Non-controlling interests 36,970 14,989 - -
Total equity 689,935 664,571 336,976 347,354

34
1(b)(ii)Aggregate amount of Group’s borrowings and debt securities.
Amount repayable in one year or less, or on demand
FY2010 FY2009 (Restated) Secured Unsecured Secured Unsecured
RMB’000 RMB’000 RMB’000 RMB’000(Unaudited) (Unaudited) (Audited) (Audited)
194,902 190,000 85,982 23,804
Amount repayable after one year
FY2010 FY2009 (Restated)
Secured Unsecured Secured UnsecuredRMB’000 RMB’000 RMB’000 RMB’000
(Unaudited) (Unaudited) (Audited) (Audited)
- - - -
Details of any collateral A syndicated loan of approximately RMB24.9 million was guaranteed and secured against the Company’s interests in its two subsidiaries, Perfect Good Group Limited and Spiritzone Group Limited. Approximately RMB170.0 million of the secured bank loan was borrowed during the year and secured by the pledge of certain of the Group’s property, plant and equipment with an aggregate carrying amount of approximately RMB63.5 million and land use rights with an aggregate carrying amount of approximately RMB17.5 million.

35
1(c) A statement of cash flows (for the group), together with a comparative statement for the corresponding period of the immediately preceding financial year.
2010 2009 RMB’000 RMB’000 (Unaudited) (Audited) Cash flows from operating activities Profit before taxation 794 28,345
Adjustments for : Interest income (9,301) (13,903)Interest expenses 22,624 6,867Gains arising from changes in fair value less estimated
point-of-sale costs of biological assets, net
(9,694) (3,457)Depreciation of property, plant and equipment 32,553 19,400Loss on disposal of property, plant and equipment 970 839Loss on disposal of a subsidiary - 1Amortisation of prepaid premium for land leases 2,337 2,041Amortisation of deferred income on government grants (791) (658)Amortisation of intangible assets 6,104 105Impairment on other receivables - 944Share of loss of associates 280 1
Operating profit before working capital changes 45,876 40,525
Increase in inventories (43,251) (15,495)Decrease/(increase) in trade receivables 3,970 (3,944)(Increase)/decrease in amounts due from related
companies (12,795) 13,299
(Increase)/decrease in prepayments, other receivables and deposits
(25,500)
8,923
Increase in biological assets (6,536) (5,165)Increase/(decrease) in trade payables 9,651 (35,927)Decrease in accrued liabilities and other payables (92,887) (2,064)(Decrease)/increase in amount due to a related company (21,607) 20,538
Cash (used in)/generated from operations (143,079) 20,690Interest paid (22,624) (6,867)Income taxes paid (1,122) (4,479) Net cash (used in)/generated from operating activities (166,825) 9,344

36
2010 2009 RMB’000 RMB’000 (Unaudited) (Audited) Cash flows from investing activities Purchases of property, plant and equipment (94,064) (60,603)Additions to prepaid premium for land leases - (56,578)Proceeds from disposal of property, plant and equipment 190 569Arising from acquisition of subsidiaries (net of cash and
cash equivalents acquired)
(123,891) (21,881)Investment in an associate (3,500) (683)Proceeds from sale of a subsidiary (net of cash and cash
equivalents disposal) - 7,775
Receipt of deferred government grants 2,180 8,860Interest received 9,301 13,903 Net cash used in investing activities (209,784) (108,638) Cash flows from financing activities New bank borrowings 305,512 -Repayment of bank borrowings (84,884) (87,880)Capital contribution from non-controlling interests 4,740 -Repurchase of shares - (6,127) Net cash generated from/(used in) financing activities 225,368 (94,007) Net decrease in cash and cash equivalents (151,241) (193,301) Cash and cash equivalents at 1 January 267,884 461,185 Cash and cash equivalents at 31 December 116,643 267,884
Analysis of balances of cash and cash equivalents Cash and bank balances 116,643 267,884
37
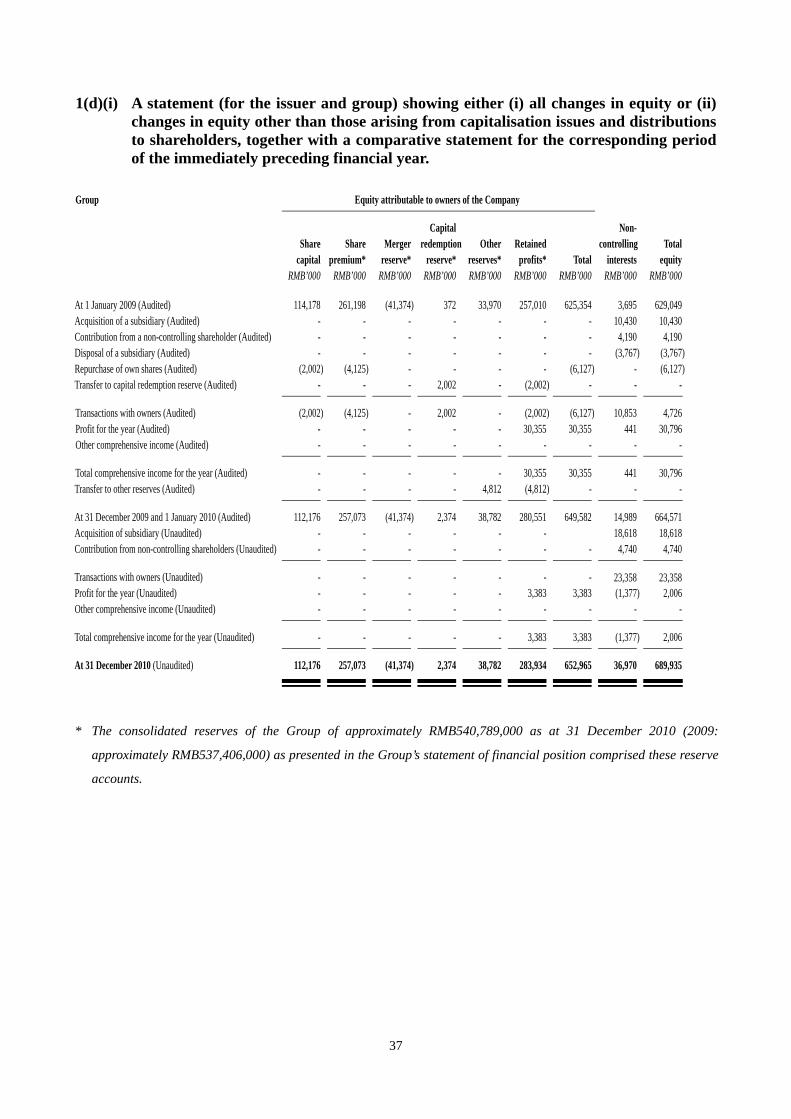
1(d)(i) A statement (for the issuer and group) showing either (i) all changes in equity or (ii) changes in equity other than those arising from capitalisation issues and distributions to shareholders, together with a comparative statement for the corresponding period of the immediately preceding financial year.
Group Equity attributable to owners of the Company
Share
capital Share
premium*Merger
reserve*
Capitalredemption
reserve*Other
reserves*Retained
profits*
Total
Non- controlling
interests Total
equity RMB’000 RMB’000 RMB’000 RMB’000 RMB’000 RMB’000 RMB’000 RMB’000 RMB’000 At 1 January 2009 (Audited) 114,178 261,198 (41,374) 372 33,970 257,010 625,354 3,695 629,049Acquisition of a subsidiary (Audited) - - - - - - - 10,430 10,430Contribution from a non-controlling shareholder (Audited) - - - - - - - 4,190 4,190Disposal of a subsidiary (Audited) - - - - - - - (3,767) (3,767)Repurchase of own shares (Audited) (2,002) (4,125) - - - - (6,127) - (6,127)Transfer to capital redemption reserve (Audited) - - - 2,002 - (2,002) - - -
Transactions with owners (Audited) (2,002) (4,125) - 2,002 - (2,002) (6,127) 10,853 4,726Profit for the year (Audited) - - - - - 30,355 30,355 441 30,796Other comprehensive income (Audited) - - - - - - - - -
Total comprehensive income for the year (Audited) - - - - - 30,355 30,355 441 30,796Transfer to other reserves (Audited) - - - - 4,812 (4,812) - - -
At 31 December 2009 and 1 January 2010 (Audited) 112,176 257,073 (41,374) 2,374 38,782 280,551 649,582 14,989 664,571Acquisition of subsidiary (Unaudited) - - - - - - 18,618 18,618Contribution from non-controlling shareholders (Unaudited) - - - - - - - 4,740 4,740
Transactions with owners (Unaudited) - - - - - - - 23,358 23,358Profit for the year (Unaudited) - - - - - 3,383 3,383 (1,377) 2,006Other comprehensive income (Unaudited) - - - - - - - - -
Total comprehensive income for the year (Unaudited) - - - - - 3,383 3,383 (1,377) 2,006
At 31 December 2010 (Unaudited) 112,176 257,073 (41,374) 2,374 38,782 283,934 652,965 36,970 689,935
* The consolidated reserves of the Group of approximately RMB540,789,000 as at 31 December 2010 (2009:
approximately RMB537,406,000) as presented in the Group’s statement of financial position comprised these reserve
accounts.
38
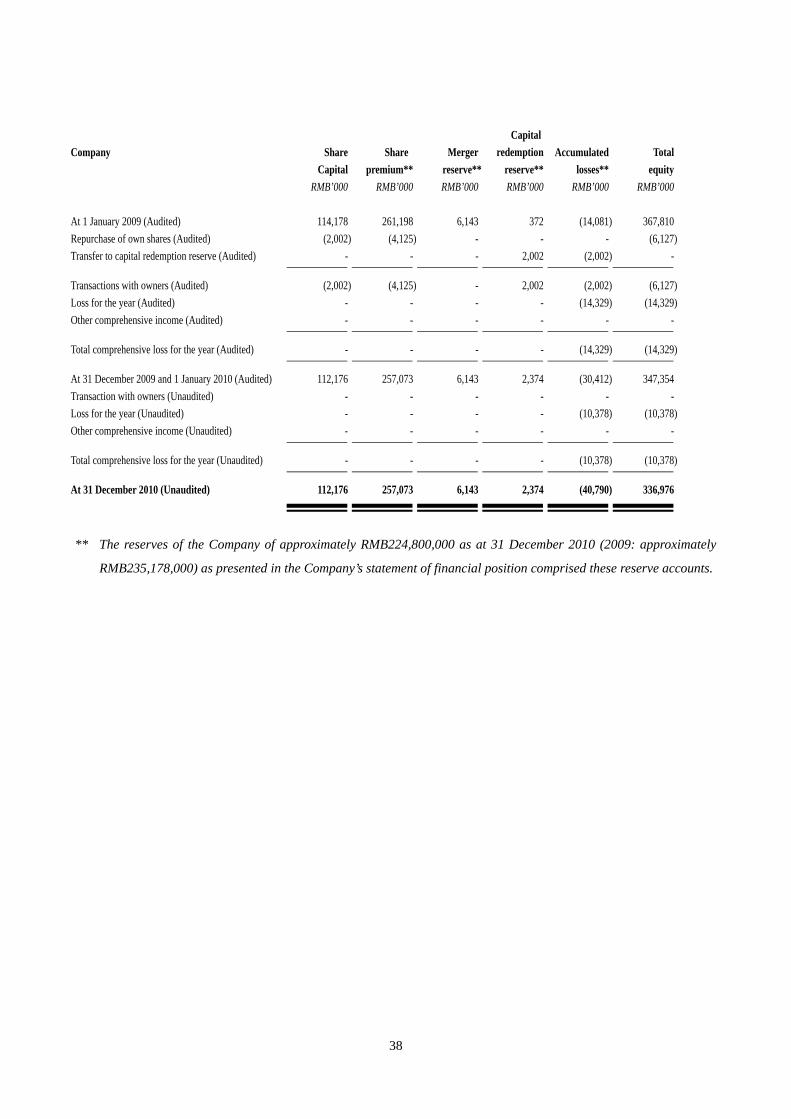
** The reserves of the Company of approximately RMB224,800,000 as at 31 December 2010 (2009: approximately
RMB235,178,000) as presented in the Company’s statement of financial position comprised these reserve accounts.
Company
ShareCapital
Share premium**
Mergerreserve**
Capital redemption
reserve** Accumulated
losses** Total
equity RMB’000 RMB’000 RMB’000 RMB’000 RMB’000 RMB’000 At 1 January 2009 (Audited) 114,178 261,198 6,143 372 (14,081) 367,810Repurchase of own shares (Audited) (2,002) (4,125) - - - (6,127)Transfer to capital redemption reserve (Audited) - - - 2,002 (2,002) -
Transactions with owners (Audited) (2,002) (4,125) - 2,002 (2,002) (6,127)Loss for the year (Audited) - - - - (14,329) (14,329)Other comprehensive income (Audited) - - - - - -
Total comprehensive loss for the year (Audited) - - - - (14,329) (14,329)
At 31 December 2009 and 1 January 2010 (Audited) 112,176 257,073 6,143 2,374 (30,412) 347,354Transaction with owners (Unaudited) - - - - - -Loss for the year (Unaudited) - - - - (10,378) (10,378)Other comprehensive income (Unaudited) - - - - - -
Total comprehensive loss for the year (Unaudited) - - - - (10,378) (10,378)
At 31 December 2010 (Unaudited) 112,176 257,073 6,143 2,374 (40,790) 336,976
39
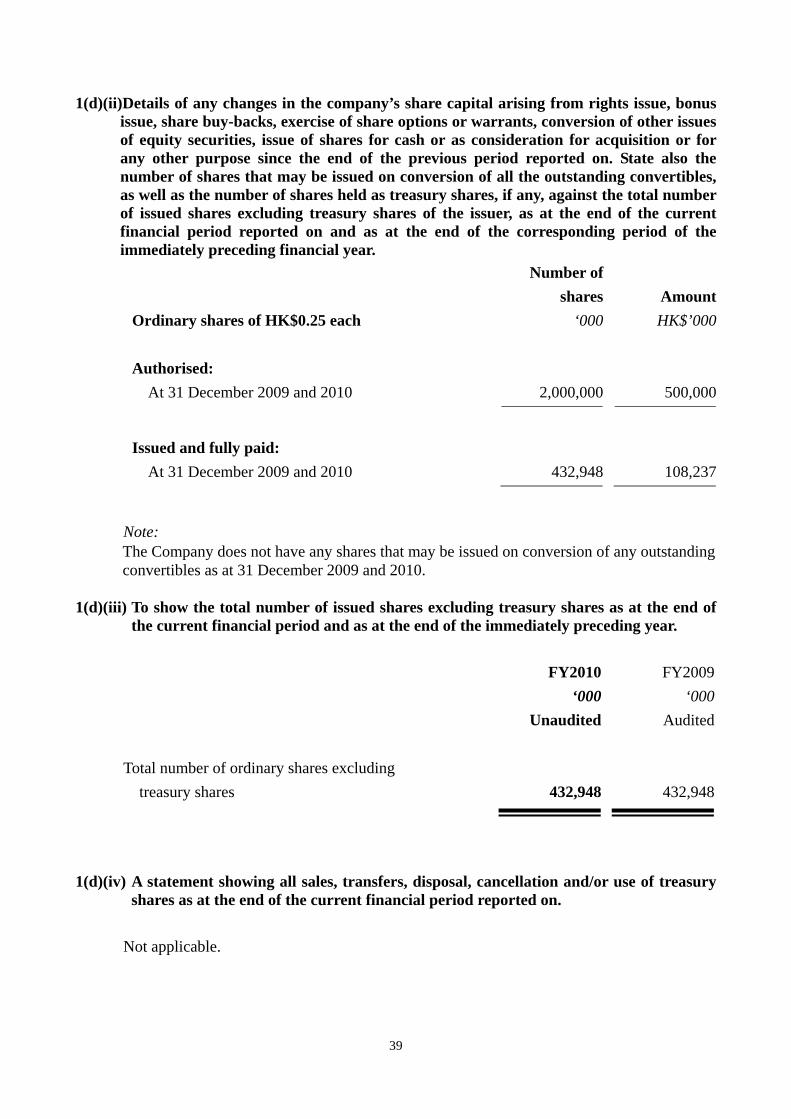
1(d)(ii)Details of any changes in the company’s share capital arising from rights issue, bonus issue, share buy-backs, exercise of share options or warrants, conversion of other issues of equity securities, issue of shares for cash or as consideration for acquisition or for any other purpose since the end of the previous period reported on. State also the number of shares that may be issued on conversion of all the outstanding convertibles, as well as the number of shares held as treasury shares, if any, against the total number of issued shares excluding treasury shares of the issuer, as at the end of the current financial period reported on and as at the end of the corresponding period of the immediately preceding financial year.
Note: The Company does not have any shares that may be issued on conversion of any outstanding convertibles as at 31 December 2009 and 2010.
1(d)(iii) To show the total number of issued shares excluding treasury shares as at the end of the current financial period and as at the end of the immediately preceding year. FY2010 FY2009 ‘000 ‘000 Unaudited Audited
Total number of ordinary shares excluding treasury shares 432,948 432,948
1(d)(iv) A statement showing all sales, transfers, disposal, cancellation and/or use of treasury
shares as at the end of the current financial period reported on.
Not applicable.
Number of
shares AmountOrdinary shares of HK$0.25 each ‘000 HK$’000 Authorised:
At 31 December 2009 and 2010 2,000,000 500,000 Issued and fully paid:
At 31 December 2009 and 2010 432,948 108,237

40
2. Whether the figures have been audited or reviewed and in accordance with which auditing standard or practice.
The figures have neither been audited nor reviewed by the auditor.
3. Where the figures have been audited or reviewed, the auditors’ report (including any
qualifications or emphasis of a matter). Not applicable. However, the Company’s auditor will likely to issue a qualified opinion for the financial statements of the Group for the year ended 31 December 2010 if the Group’s measures to improve its cash flow and financial position are not successful. Please refer to section 10 for details.
4. Whether the same accounting policies and methods of computation as in the issuer’s most recently audited annual financial statements have been applied. The Group has adopted the same accounting policies and methods of computations as stated in its most recently audited financial statements to this full year result announcement, except as mentioned in section 5 below.
5. If there are any changes in the accounting policies and methods of computation, including any required by an accounting standard, what has changed, as well as the reasons for, and the effect of, the change. In the current year, the Group has adopted all of the new and amended standards and interpretations issued by the International Accounting Standards Board (the “IASB”) and the International Financial Reporting Interpretations Committee (the “IFRIC”) of the IASB that are relevant to its operations and effective for accounting years beginning on 1 January 2010, which include the following:
IAS 27 (Revised) Consolidated and Separate Financial Statements
IFRS 3 (Revised) Business Combinations
Various Annual improvements to IFRSs 2009
Also, in a meeting in September 2010, the IFRS Interpretations Committee (“the Committee”) discussed the interpretation of paragraph 69(d) of IAS 1 Presentation of Financial Statements. The Committee considered that a liability must be classified as a current liability if the entity does not have the unconditional right at the reporting date to
41
defer settlement for at least twelve months after the reporting period. The Committee confirmed its view in the agenda decision which was published in the November 2010 edition of IFRIC Update. In view of this clarification of the presentation requirement of IAS 1, the Group has changed its accounting policy on the classification of term loans that contain a repayment on demand clause. Under the new policy, term loans with clauses which give the lender the unconditional right to call the loan at any time are classified as current liabilities in the statement of financial position. Previously such term loans were classified in accordance with the agreed repayment schedule unless the Group had breached any of the loan covenants set out in the agreement as of the reporting date or otherwise had reason to believe that the lender would invoke its rights under the immediate repayment clause within the foreseeable future. The new accounting policy has been applied retrospectively by re-presenting the opening balances at 1 January 2009, with consequential reclassification adjustments to comparatives for the year ended 31 December 2009. The reclassification has had no effect on reported profit or loss, total comprehensive income or equity for any period presented. Effect of this change in accounting policy on the statements of financial position is as follows:
Group/Company
2010 2009
RMB'000 RMB'000
Increase/(Decrease) in
Current liabilities
Interest-bearing borrowings - 42,991
Non-current liabilities
Interest-bearing borrowings - (42,991)
42
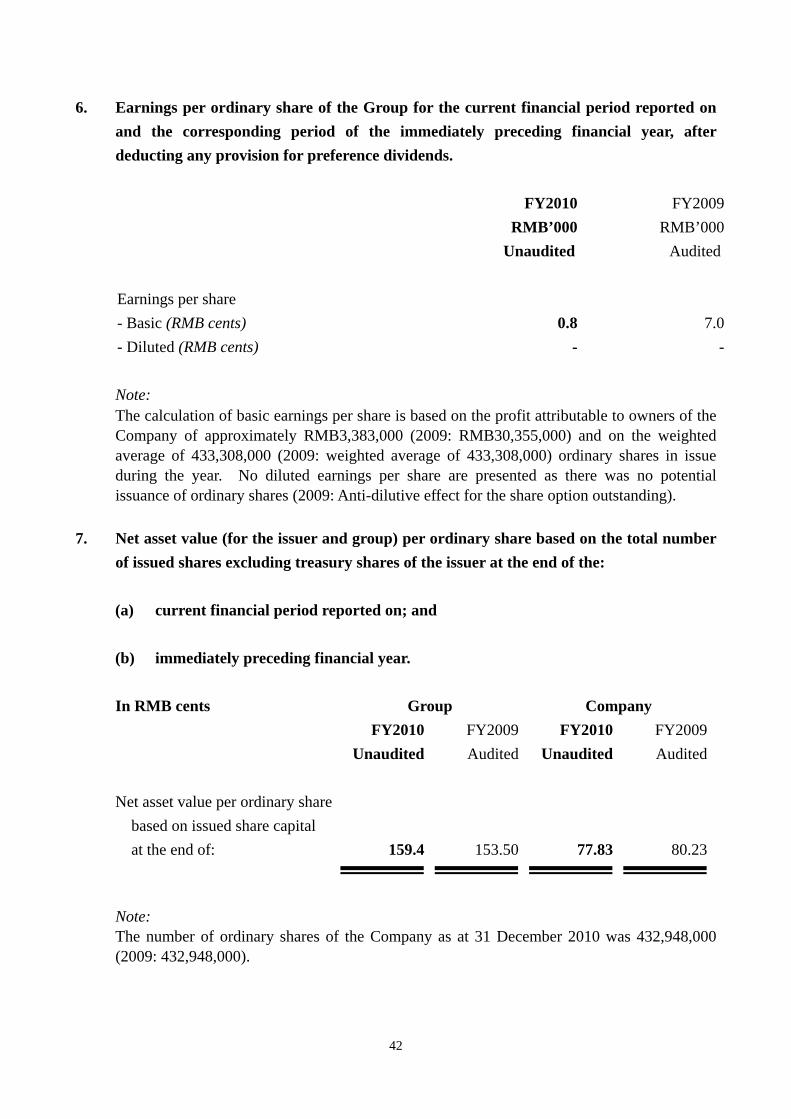
6. Earnings per ordinary share of the Group for the current financial period reported on and the corresponding period of the immediately preceding financial year, after deducting any provision for preference dividends. FY2010 FY2009 RMB’000 RMB’000 Unaudited Audited Earnings per share - Basic (RMB cents) 0.8 7.0 - Diluted (RMB cents) - - Note: The calculation of basic earnings per share is based on the profit attributable to owners of the Company of approximately RMB3,383,000 (2009: RMB30,355,000) and on the weighted average of 433,308,000 (2009: weighted average of 433,308,000) ordinary shares in issue during the year. No diluted earnings per share are presented as there was no potential issuance of ordinary shares (2009: Anti-dilutive effect for the share option outstanding).
7. Net asset value (for the issuer and group) per ordinary share based on the total number of issued shares excluding treasury shares of the issuer at the end of the:
(a) current financial period reported on; and (b) immediately preceding financial year. In RMB cents Group Company FY2010 FY2009 FY2010 FY2009 Unaudited Audited Unaudited Audited Net asset value per ordinary share
based on issued share capital at the end of: 159.4 153.50
77.83 80.23
Note: The number of ordinary shares of the Company as at 31 December 2010 was 432,948,000 (2009: 432,948,000).

43
8. A review of the performance of the group, to the extent necessary for a reasonable understanding of the Group’s business. It must include a discussion of the following:
(a) any significant factors that affected the turnover, costs, and earnings of the group
for the current financial period reported on, including (where applicable) seasonal or cyclical factors; and
REVENUE BY PRODUCTS FY2010 FY2009 % Change RMB’000 RMB’000 +/(-)
(Unaudited) (Audited) (Unaudited)
Processed foods 376,497 269,085 39.9Chilled and frozen rabbit meat 207,673 142,708 45.5Chilled and frozen chicken meat 261,511 228,453 14.5Other products 171,189 110,595 54.8 Total 1,016,870 750,841 35.4
Chilled and Frozen Meat Products The chicken and rabbit meat segments contributed 46.1% and 49.4% to the Group’s total revenue for the years ended 31 December 2010 (“FY2010”) and 2009 (“FY2009”) respectively. The revenue of the chicken and rabbit meat segments registered a 26.4% increase to approximately RMB469.2 million in FY2010. Revenue of the chicken meat segment contributed 25.7% to the Group’s total revenue for FY2010 and increased by 14.5% to approximately RMB261.5 million in FY2010.. The increase was due to the recovering demand in the PRC market and middle-eastern countries, such as United Arab Emirates. Revenue derived from the sale of rabbit meat increased by 45.5% to approximately RMB207.7 million in FY2010. The increase was attributable to the increasing demand for the Group’s rabbit meat products in the European Union (“EU”) markets. There was an uptrend for rabbit meat demand, as rabbit meat is considered a delicacy in EU, such as France and Italy.

44
Processed Food Products Revenue derived from processed food increased by 39.9% to approximately RMB376.5 million in FY2010. The increase was due mainly to the recovering demand of Original Equipment Manufacture (“OEM”) products from Japan market and the continual introduction of various products to the PRC market. The Group has launched various new ranges of processed food products under its own brand names, such as soup, barbeque meat products and meatballs to the PRC market. Other Products Revenue derived from the production and sale of other products increased by 54.8% to approximately RMB171.2 million in FY2010, compared to approximately RMB110.6 million in FY2009, due mainly to strong demand from the PRC and Korean markets. The increase in revenue was largely driven by an increase in demand for the Group’s pet food products. Pet food sales contributed over 50% to this segment with growth generated from Beijing and Shanghai markets in the PRC and overseas markets in Japan and Korea. REVENUE BY GEOGRAPHICAL MARKETS FY2010 FY2009 % Change RMB’000 RMB’000 +/(-) (Unaudited) (Audited) (Unaudited) Export 430,541 313,669 37.3PRC 586,329 437,172 34.1
Total 1,016,870 750,841 35.4
On a geographical basis, revenue from the export sales increased by 37.3% to approximately RMB430.5 million in FY2010. The increase in export sales was attributable mainly to the increase in demand for rabbit meat and processed food products. PRC sales increased by 34.1% to approximately RMB586.3 million in FY2010. The increase was mainly attributable to an increase in the sale of chicken meat products to the PRC market.
45
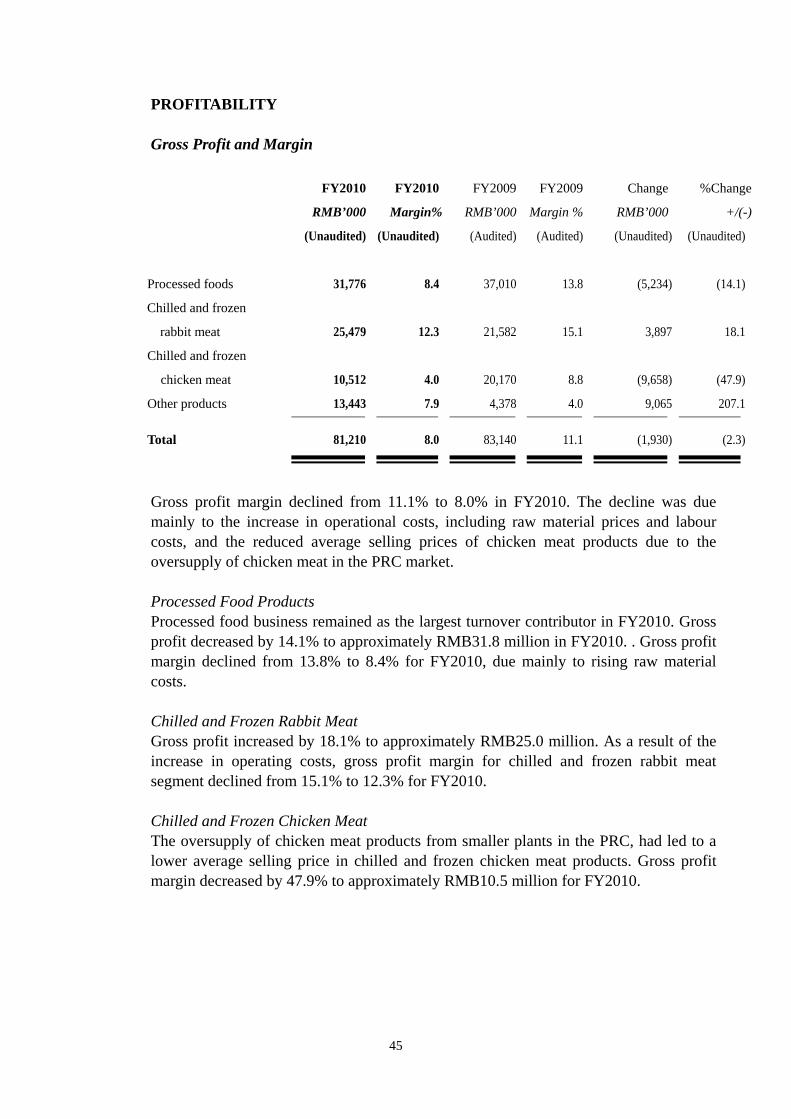
PROFITABILITY Gross Profit and Margin
FY2010 FY2010 FY2009 FY2009 Change %Change
RMB’000 Margin% RMB’000 Margin % RMB’000 +/(-)
(Unaudited) (Unaudited) (Audited) (Audited) (Unaudited) (Unaudited)
Processed foods 31,776 8.4 37,010 13.8 (5,234) (14.1)
Chilled and frozen
rabbit meat 25,479 12.3 21,582
15.1 3,897 18.1
Chilled and frozen
chicken meat 10,512 4.0 20,170
8.8 (9,658) (47.9)
Other products 13,443 7.9 4,378 4.0 9,065 207.1
Total 81,210 8.0 83,140 11.1 (1,930) (2.3)
Gross profit margin declined from 11.1% to 8.0% in FY2010. The decline was due mainly to the increase in operational costs, including raw material prices and labour costs, and the reduced average selling prices of chicken meat products due to the oversupply of chicken meat in the PRC market. Processed Food Products Processed food business remained as the largest turnover contributor in FY2010. Gross profit decreased by 14.1% to approximately RMB31.8 million in FY2010. . Gross profit margin declined from 13.8% to 8.4% for FY2010, due mainly to rising raw material costs. Chilled and Frozen Rabbit Meat Gross profit increased by 18.1% to approximately RMB25.0 million. As a result of the increase in operating costs, gross profit margin for chilled and frozen rabbit meat segment declined from 15.1% to 12.3% for FY2010. Chilled and Frozen Chicken Meat The oversupply of chicken meat products from smaller plants in the PRC, had led to a lower average selling price in chilled and frozen chicken meat products. Gross profit margin decreased by 47.9% to approximately RMB10.5 million for FY2010.

46
Other Products Other products are mainly chicken and rabbit meat by-products and pet food products. These are not the core profit drivers of the Group. The gross profit margin increased to 7.9% in FY2010 and gross profit increased by 207.1% to approximately RMB13.4 million in FY2010. Other Income Other income comprised mainly government grants and interest income from bank deposits amounting to approximately RMB6.3 million and approximately RMB9.3 million respectively. The rest were rental income, recovery of gas, electricity from customers and gain on change in fair value of biological assets. Selling and Distribution Expenses The increase in selling and distribution expenses by 51.0% to approximately RMB25.2 million in FY2010 was primarily due to higher transportation, quality inspection, advertising cost and more salesperson being employed from the increased business activity level. Administrative Expenses Administrative expenses comprised mainly staff costs, professional fees, travelling expenses and etc. The increase of 15.0% amounting to approximately RMB59.5 million for FY2010 was due mainly to the acquisition of subsidiaries in 2010, which resulted in higher administrative expenses and more employees being employed by the Group. Finance costs Finance costs increased by 229.5% to approximately RMB22.6 million for FY2010 resulted from (1) the consolidation of Shandong Kaijia Food Company Limited (“Kaijia Food”) and its subsidiary, Shandong Kaijia International Trade Co., Ltd. (“Kaijia Trade”) (collectively referred as “Kaijia Group”) which incurred the bank loan interests amounting to approximately RMB5.3 million; (2) the increase of bank borrowings due to the business expansion in FY2010; and (3) the amortization of arrangement fee and upfront fee of the syndicated loan amounting to approximately RMB4.7 million. Taxation Tax credit of approximately RMB1.2 million recorded in FY2010 was due mainly to the provision of deferred tax liability in the course of the acquisition of Kaijia Group. Exchange loss, net Since some of the Group’s purchase transactions were originally invoiced in foreign currency, such as Japanese yen and US dollar, the appreciation of RMB against those currencies and the increase of purchase in FY2010 decreased the exchange loss significantly.

47
(b) any material factors that affected the cash flow, working capital, assets or liabilities of the group during the current financial period reported on.
Review of the Group’s Financial Position as at 31 December 2010 The increase in property, plant and equipment represented the Group’s addition of facility and construction in progress, mainly the acquisition of Kaijia Group, amounting to approximately RMB212.9 million and depreciation amounting to approximately RMB12.6 million. The prepaid premium for land leases increased by approximately RMB25.8 million as at 31 December 2010 was mainly as a result of the acquisition of Kaijia Group. Goodwill arising from the acquisitions of Kaijia Group, Qingdao Kangda Modern Agricultural Technology Development Co., Ltd and Qingdao Pu De Food Co., Ltd. amounted to approximately RMB56.3 million, RMB0.4 million and RMB2.7 million respectively. The intangible assets refer to the export licences and hygiene registration certificates awarded by the relevant authorities in Japan and EU, where the registered products produced by the Group are allowed to be exported to these countries. The increase in intangible assets by approximately RMB4.5 million as at 31 December 2010 arose from the acquisition of Kaijia Group. Biological assets refer to progeny rabbits and progeny chickens for sale and breeder rabbits and chickens for breeding purpose. These biological assets were valued by an independent professional valuer as at 31 December 2010 with reference to the market-determined prices. Inventories increased by approximately RMB58.4 million to approximately RMB137.0 million in anticipation of an increase in demand in the first quarter of 2011. The inventory turnover day for FY2010 was 42 days compared to 38 days for FY2009. Trade receivables increased by approximately RMB5.7 million or 6.5% to approximately RMB93.2 million as at 31 December 2010 in line with the increase in business volume. The trade receivables turnover days decreased to 32 days in FY2010 compared with 41 days FY2009 due to the stepping up of collection efforts. Prepayments, other receivables and deposits increased by approximately RMB32.0 million and to approximately RMB51.8 million as at 31 December 2010 due mainly to the increase of deposits placed with the Group’s suppliers for construction in progress, which arose from the enhancement of the Group’s production facilities scheduled for completion in 2011.
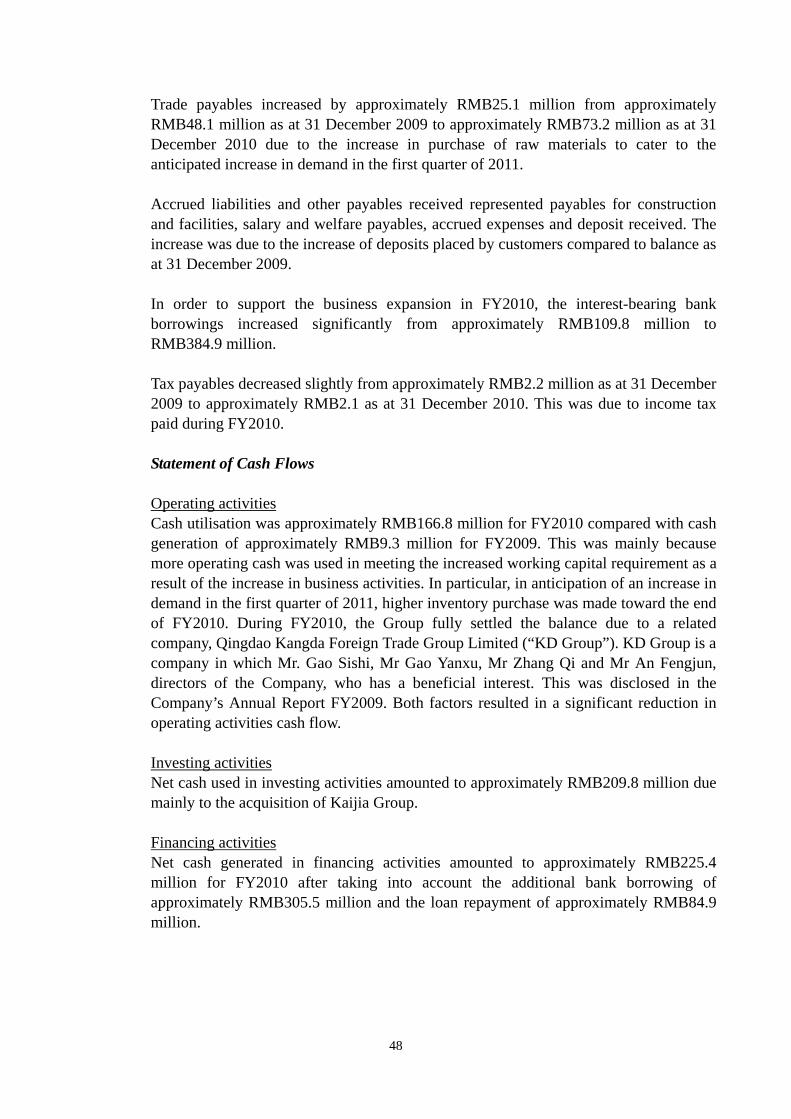
48
Trade payables increased by approximately RMB25.1 million from approximately RMB48.1 million as at 31 December 2009 to approximately RMB73.2 million as at 31 December 2010 due to the increase in purchase of raw materials to cater to the anticipated increase in demand in the first quarter of 2011. Accrued liabilities and other payables received represented payables for construction and facilities, salary and welfare payables, accrued expenses and deposit received. The increase was due to the increase of deposits placed by customers compared to balance as at 31 December 2009. In order to support the business expansion in FY2010, the interest-bearing bank borrowings increased significantly from approximately RMB109.8 million to RMB384.9 million. Tax payables decreased slightly from approximately RMB2.2 million as at 31 December 2009 to approximately RMB2.1 as at 31 December 2010. This was due to income tax paid during FY2010. Statement of Cash Flows Operating activities Cash utilisation was approximately RMB166.8 million for FY2010 compared with cash generation of approximately RMB9.3 million for FY2009. This was mainly because more operating cash was used in meeting the increased working capital requirement as a result of the increase in business activities. In particular, in anticipation of an increase in demand in the first quarter of 2011, higher inventory purchase was made toward the end of FY2010. During FY2010, the Group fully settled the balance due to a related company, Qingdao Kangda Foreign Trade Group Limited (“KD Group”). KD Group is a company in which Mr. Gao Sishi, Mr Gao Yanxu, Mr Zhang Qi and Mr An Fengjun, directors of the Company, who has a beneficial interest. This was disclosed in the Company’s Annual Report FY2009. Both factors resulted in a significant reduction in operating activities cash flow. Investing activities Net cash used in investing activities amounted to approximately RMB209.8 million due mainly to the acquisition of Kaijia Group. Financing activities Net cash generated in financing activities amounted to approximately RMB225.4 million for FY2010 after taking into account the additional bank borrowing of approximately RMB305.5 million and the loan repayment of approximately RMB84.9 million.

49
9. Where a forecast, or a prospect statement, has been previously disclosed to shareholders, any variance between it and the actual results. The announcement is in line with the profit warning announcement released by the Company on 9 February 2011.
10. A commentary at the date of the announcement of the significant trends and competitive conditions of the industry in which the Group operates and any known factors or events that may affect the Group in the next reporting period and the next 12 months. Acquisition of a food processing company, Kaijia Food Kaijia Food is a company incorporated in the PRC. The acquisition of 100% equity interest in Kaijia Food with a total cash consideration of RMB130.0 million was completed on 24 February 2010. The principal activities of Kaijia Food and its subsidiary are that of manufacturing and sale of chilled and frozen meat products and other processed foods. Production and sale of chilled and frozen meat products and other processed foods have commenced during the year. Revenue and profit contributions from these subsidiaries are expected to grow steadily in the coming years. In order to finance the aforesaid acquisition, the Group had made additional bank loans during the year. In addition, the increase in raw materials and labour costs as a result of the increase in competiveness in the business environment, the increase in finance costs and the increase in operating expenses as a result of the enlarged business operations have significantly decreased our profit for the year. Moreover, more operating cash was used in meeting the increased working capital requirement as a result of the increase in business activities. As a result, the Group recorded a net current liabilities position at the year end date. In such respect, the going concern basis adopted in preparing the financial statements of the Group for the year ended 31 December 2010 is further discussed in the paragraphs of “Going Concern” as below.
Breach of loan covenants The syndicated loan of RMB24.9 million is subject to the fulfillment of certain covenants. In the circumstances when the covenants were not met, the drawn-down facilities would become payable on demand. As at 31 December 2010, certain covenants of the syndicated loan were not met. These primarily related to the Group’s current ratio, interest cover ratio and terms and conditions of the negative pledge of certain assets. No waiver has been obtained by the Group from the respective lenders on or before 31 December 2010. Subsequent to the year end date, the Group had received a waiver from the bankers in respect of the syndicated loan in relation to financial ratios and the terms and conditions of negative pledge of certain assets. In addition, part of the syndicated loan of approximately RMB8.0

50
million was repaid by the Group in January 2011. The remaining balance of approximately RMB16.9 million of the syndicated loan will be repaid according to the repayment schedule in 2011. Going concern In preparing the financial statements, the directors considered the operations of the Group as a going concern notwithstanding that:
1. The Group’s profit decreased significantly from approximately RMB30.8 million for the
year ended 31 December 2009 to approximately RMB2 million for the year ended 31 December 2010;
2. There was net cash outflow from operating activities of approximately RMB166.8 million for the year ended 31 December 2010;
3. The Group’s current liabilities exceeded its current assets by approximately RMB100.8 million as at 31 December 2010;
4. There was a significant increase in the bank borrowings of the Group from approximately RMB109.8 million as at 31 December 2009 to approximately RMB384.9 million as at 31 December 2010, all of which are due for repayment within one year from 31 December 2010; and
5. Included in the short-term bank borrowings is an outstanding syndicated loan of approximately RMB24.9 million of which the Group had breached certain loan covenants as at 31 December 2010.
These conditions indicate the existence of a material uncertainty which may cast significant doubts on the Group’s ability to continue as a going concern and hence, its ability to realise its assets and discharge its liabilities in the normal course of business. Nevertheless, the directors prepare the financial statements based on the assumption that the Group can be operated as a going concern and are of the view that the Group will have sufficient working capital to finance its operations in the next twelve months from 31 December 2010, after taking into consideration of the following: 1. The Group continues to implement measures to tighten cost controls over various operating
expenses in order to improve its profitability and to generate positive cash inflow from its operations in the future;
2. The Group is actively negotiating with the banks to seek for renewal of the outstanding
bank borrowings, except for the syndicated bank loan of RMB24.9 million, and new banking facilities;

51
3. In February 2011, the Group has negotiated with and successfully obtained from the banks a waiver in relation to the syndicated loan of approximately RMB24.9 million of which the Group had breached certain loan covenants as at 31 December 2010 as mentioned above. In addition, part of the syndicated loan of RMB8.0 million was repaid by the Group in January 2011. The remaining balance of RMB16.9 million of the syndicated loan will be repaid according to the repayment schedule in 2011;
4. The Group is actively exploring the availability of alternative source of financing; and
5. KD Group, which is substantially beneficially owned by a substantial shareholder of the Company, has agreed to provide continuing financial support to the Group so as to enable the Group to continue its day-to-day operations as a going concern notwithstanding any present or future financial difficulties experienced by the Group.
The directors of the Company believe that the aforementioned financing/business plans and operational measures will be successful, based on the continuous efforts and commitment given by the management. Having regard to the cash flow projection of the Group, which are prepared assuming that these measures are successful, the directors of the Company are of the opinion that, in the light of the measures taken to-date, together with the expected results of the other measures in progress, the Group will have sufficient cash resources to satisfy its future working capital and other financing requirements. Should the Group be unable to continue in business as a going concern, adjustments would have to be made in the financial statements to write down the values of the assets to their recoverable amounts, to provide for any further liabilities which might arise, and to reclassify non-current assets and non-current liabilities as current assets and current liabilities respectively. The effect of these adjustments has not yet been reflected in the financial statements. If the progress or actual outcomes of the aforementioned measures differ unfavourably from the expected results or if there is insufficient evidence to support that the aforementioned measures are successful, the Group’s ability to continue as a going concern will be in doubt, and hence, the use of the going concern basis in the preparation of the financial statements of the Group for the year ended 31 December 2010 may become inappropriate. Accordingly, the Company’s auditor will likely to issue a qualified opinion in this respect for the financial statements of the Group for the year ended 31 December 2010.
Significant trends and competitive conditions of the industry
An increase in raw materials and labour costs had led to the decline in the Group’s gross profit margin from 11.0% to 8.0% compared to last year. However, according to the result in 2011 so far, chilled and frozen rabbit and chicken meats had recorded an apparent increase in gross profit. As such, the Group will continue to increase its production capacity and control its products quality through enhancement of existing production facilities to meet the increase in market demand for its products. The Group will continue to implement measures to tighten

52
cost controls over various operating expenses in order to improve its profitability and to generate positive cash inflow from its operations in the future The Group has also implemented an extensive market strategy with emphasis on good relationship with customers and suppliers and will focus on widening its international client base and continual introduction of new products to the PRC market. At the same time, the Company will take steps aimed at strengthening and expanding the sales network in more provinces in PRC, such as Jilin and Chongqing. Despite the lower profit for the year ended 31 December 2010, the Board considers that the Group’s financial positions is stable and it has sufficient cash resources to meet its present and future cash flow requirements. The Board remains positive on the long term prospect of the Group and the Group will turn around in its operating results. The Board will constantly review the Group’s strategies and operations with a view to improve its business performance and shareholders’ return.
11. Dividend
(a) Current Financial Period Reported On
Any dividend declared for the current financial period reported on?
No dividend declared.
(b) Corresponding Period of the Immediately Preceding Financial Year
Any dividend declared for the corresponding period of the immediately preceding financial year?
No dividend declared.
(c) Date payable
Not applicable.
(d) Books closure date
Not applicable.
12. If no dividend has been declared/recommended, a statement to that effect.
No dividend has been declared/recommended for FY2010.

53
PART II - ADDITIONAL INFORMATION REQUIRD FOR FULL YEAR ANNOUNCEMENT (This part is not applicable for Q1, Q2, Q3 or Half Year Results)
13. Segmented revenue and results for business or geographical segments (of the Group) in
the form presented in the issuer’s most recently audited annual financial statements, with comparative information for the immediately preceding year.
SEGMENT INFORMATION
Information regarding the Group’s reportable segments as provided to the directors is set out below:
2010
Processed foods
Chilled and
frozen rabbit meat
Chilled and frozen
chicken meat
Other products
Total RMB’000 RMB’000 RMB’000 RMB’000 RMB’000
(Unaudited) (Unaudited) (Unaudited) (Unaudited) (Unaudited) Revenue - Revenue from external customers 376,497 207,673 261,511 171,189 1,016,870
Reportable segment revenue 376,497 207,673 261,511 171,189 1,016,870
Reportable segment profit 22,431 20,323 4,022 9,194 55,970
Depreciation 12,738 7,129 10,728 1,959 32,553 Amortisation 6,599 931 770 141 8,441
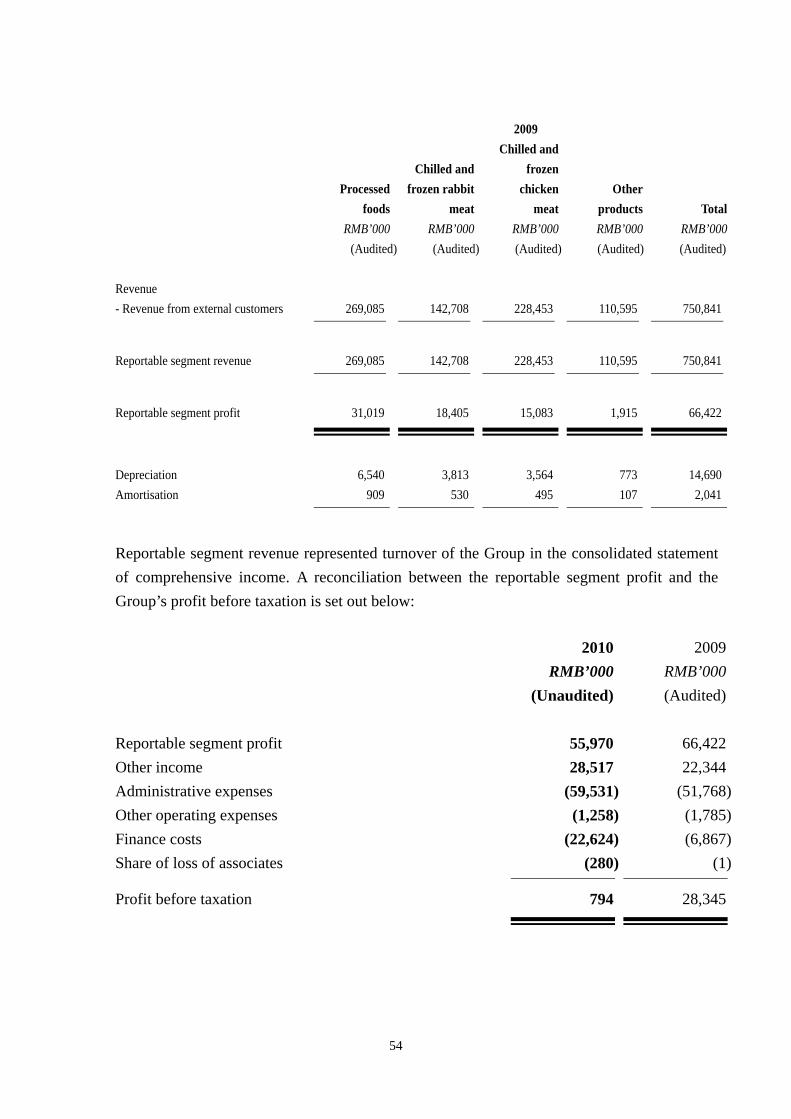
54
2009
Processedfoods
Chilled andfrozen rabbit
meat
Chilled andfrozen
chickenmeat
Other products Total
RMB’000 RMB’000 RMB’000 RMB’000 RMB’000(Audited) (Audited) (Audited) (Audited) (Audited)
Revenue - Revenue from external customers 269,085 142,708 228,453 110,595 750,841
Reportable segment revenue 269,085 142,708 228,453 110,595 750,841
Reportable segment profit 31,019 18,405 15,083 1,915 66,422
Depreciation 6,540 3,813 3,564 773 14,690 Amortisation 909 530 495 107 2,041
Reportable segment revenue represented turnover of the Group in the consolidated statement of comprehensive income. A reconciliation between the reportable segment profit and the Group’s profit before taxation is set out below: 2010 2009 RMB’000 RMB’000 (Unaudited) (Audited)
Reportable segment profit 55,970 66,422Other income 28,517 22,344Administrative expenses (59,531) (51,768)Other operating expenses (1,258) (1,785)Finance costs (22,624) (6,867)Share of loss of associates (280) (1)
Profit before taxation 794 28,345
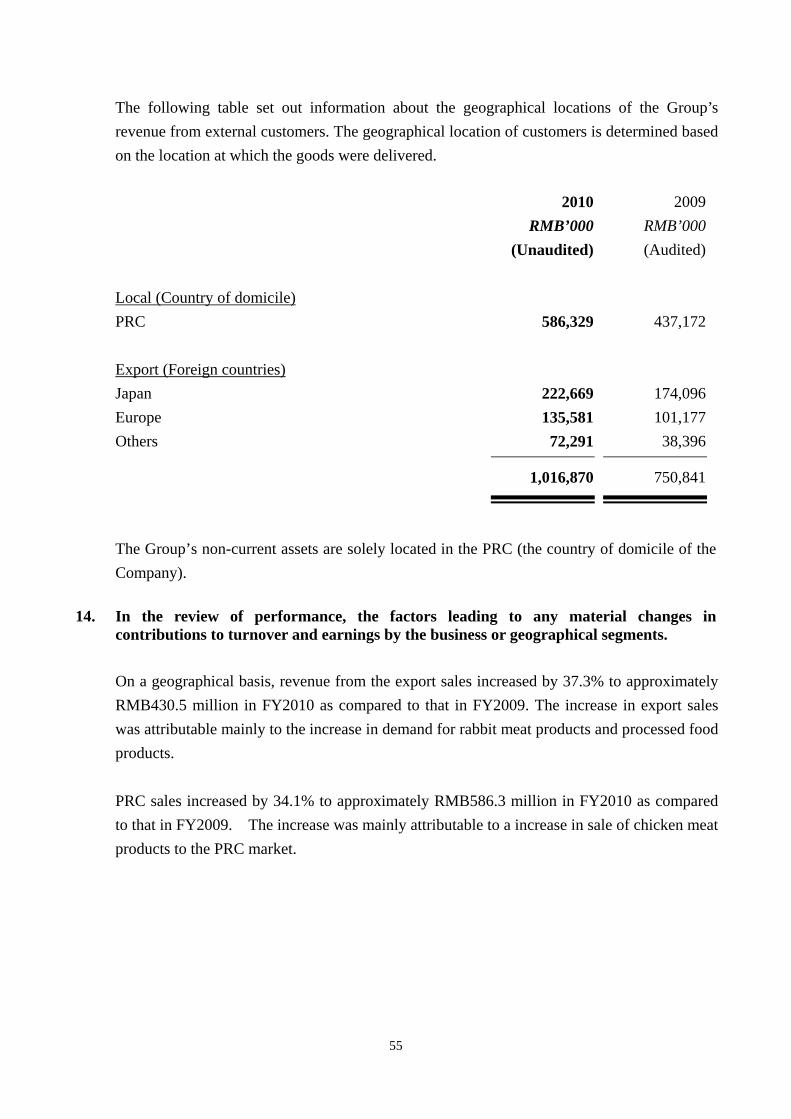
55
The following table set out information about the geographical locations of the Group’s revenue from external customers. The geographical location of customers is determined based on the location at which the goods were delivered. 2010 2009 RMB’000 RMB’000 (Unaudited) (Audited) Local (Country of domicile) PRC 586,329 437,172 Export (Foreign countries) Japan 222,669 174,096Europe 135,581 101,177Others 72,291 38,396
1,016,870 750,841
The Group’s non-current assets are solely located in the PRC (the country of domicile of the Company).
14. In the review of performance, the factors leading to any material changes in
contributions to turnover and earnings by the business or geographical segments. On a geographical basis, revenue from the export sales increased by 37.3% to approximately RMB430.5 million in FY2010 as compared to that in FY2009. The increase in export sales was attributable mainly to the increase in demand for rabbit meat products and processed food products. PRC sales increased by 34.1% to approximately RMB586.3 million in FY2010 as compared to that in FY2009. The increase was mainly attributable to a increase in sale of chicken meat products to the PRC market.
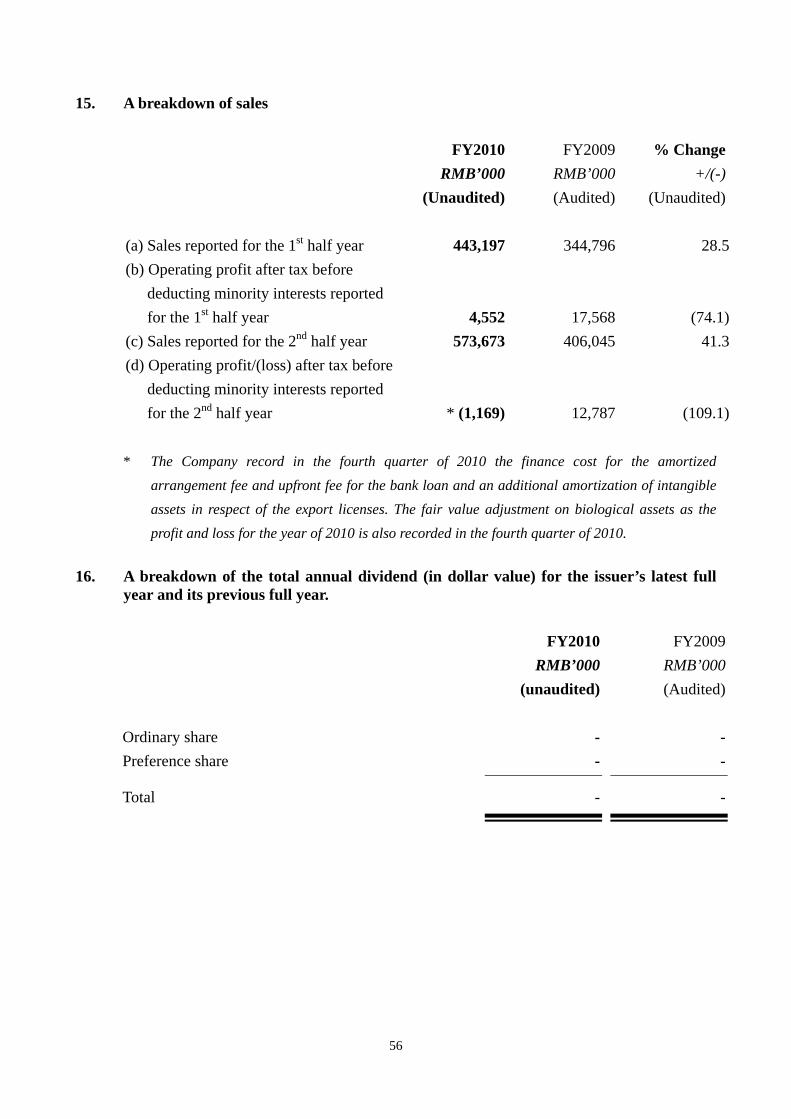
56
15. A breakdown of sales
FY2010 FY2009 % Change RMB’000 RMB’000 +/(-) (Unaudited) (Audited) (Unaudited) (a) Sales reported for the 1st half year 443,197 344,796 28.5(b) Operating profit after tax before
deducting minority interests reported for the 1st half year 4,552
17,568 (74.1)(c) Sales reported for the 2nd half year 573,673 406,045 41.3(d) Operating profit/(loss) after tax before
deducting minority interests reported for the 2nd half year * (1,169)
12,787 (109.1)
* The Company record in the fourth quarter of 2010 the finance cost for the amortized arrangement fee and upfront fee for the bank loan and an additional amortization of intangible assets in respect of the export licenses. The fair value adjustment on biological assets as the profit and loss for the year of 2010 is also recorded in the fourth quarter of 2010.
16. A breakdown of the total annual dividend (in dollar value) for the issuer’s latest full
year and its previous full year.
FY2010 FY2009 RMB’000 RMB’000 (unaudited) (Audited) Ordinary share - -Preference share - -
Total - -

57
17. Interested Person Transactions
In RMB’000 (Unaudited) Full year ended 31 December 2010
Name of Interested Person
Aggregate value of all IPTs during the financial year
under review excluding transactions less than
$100,000 and transactions pursuant to the IPT
Mandate (or a shareholders’ mandate for IPTs under Rule 920 of the
New Listing Manual)
Aggregate value of all IPTs under the IPT
Mandate (or a shareholders’ mandate
for IPTs under Rule 920 of the New Listing
Manual) during the financial
year under review (excluding transactions
less than $100,000)
Sales to KD Group (Note 1) - 206Purchases from KD Group (Note 2) - 31,940Rental expenses paid to related companies 384 -Guarantees given by the KD Group in
connection with bank loans granted to the Group 100,000 -
Notes: 1. These are the sales of the Group’s products to KD Group, including Qingdao Kangda Shidai Property
Development Co., Ltd., for the year ended 31 December 2010. 2. These are the purchases of raw materials such as vegetables, flowers and animal feeds from the KD Group
including Qingdao Jiaonan Kangda Feed Co., Ltd., for the year ended 31 December 2010.
BY ORDER OF THE BOARD Gao Sishi Chairman
Hong Kong, 25 February 2011