DOI: 10.5327/Z2176-947820180437 EVALUATING …
21
128 RBCIAMB | n.50 | dez 2018 | 128-148 Maria Fernanda Kauling Discente na Universidade Posivo – Curiba (PR), Brazil. Valdir Fernandes Docente na Universidade Tecnológica Federal do Paraná – Curiba (PR), Brazil. Marcelo Limont Docente na Universidade Posivo – Curiba (PR), Brazil. Maurício Dziedzic Docente na Universidade Posivo – Curiba (PR), Brazil. Docente na Universidade Ceuma – São Luís (MA), Brazil. Corresponding address: Maurício Dziedzic – Universidade Posivo – Rua Professor Pedro Viriato Parigot de Souza, 5.300 – Campo Comprido – CEP 81280- 330 – Curiba (PR), Brazil – E-mail: [email protected] Received on: 10/20/2018 Accepted on: 12/18/2018 ABSTRACT In order to bolster the concept of sustainable territorial development in conjuncon with the three capitals — natural, social, and built capital —, a conceptual methodology was elaborated. It ulized the infrastructure systems to group indicator dimensions of built capital, highlighng what actually corresponds to the territorial development reality and not just economic growth. This resulted in the selecon of 70 indicators that were tested with data from the Curiba Metropolitan Region (CMR). Thirty-five indicators were selected from the data available to evaluate the development in 29 municipalies that form the CMR. Finally, the Sustainable Territorial Development Index (INFRASTDI) and Inequality Index (II) were proposed to summarize the informaon collected. Keywords: capital theory; urbanizaon; indicator framework; infrastructure; method; inequality index. RESUMO Para reforçar o conceito de desenvolvimento territorial sustentável em conjunto com os três capitais — natural, social e construído —, foi proposta uma metodologia conceitual. Os sistemas de infraestrutura foram empregados para agrupar as dimensões de indicadores do capital construído, destacando o que corresponde à realidade do desenvolvimento territorial e não apenas o crescimento econômico. Isso resultou na seleção de 70 indicadores que foram testados com dados da Região Metropolitana de Curiba (RMC). Um total de 35 indicadores foi selecionado com base nos dados disponíveis para avaliar o desenvolvimento em 29 municípios que formam a RMC. Por fim, o Índice de Desenvolvimento Territorial Sustentável (INFRASTDI) e o Índice de Desigualdade (II) foram propostos para sintezar as informações coletadas. Palavras-chave: teoria dos capitais; urbanização; modelos de indicadores; infraestrutura; método; índice de desigualdade. DOI: 10.5327/Z2176-947820180437 EVALUATING SUSTAINABLE TERRITORIAL DEVELOPMENT WITH BUILT CAPITAL INDICATORS AVALIAÇÃO DO DESENVOLVIMENTO SUSTENTÁVEL DO TERRITÓRIO UTILIZANDO INDICADORES DE CAPITAL CONSTRUÍDO
Transcript of DOI: 10.5327/Z2176-947820180437 EVALUATING …
128
RBCIAMB | n.50 | dez 2018 | 128-148
Maria Fernanda Kauling Discente na Universidade Positivo – Curitiba (PR), Brazil.
Valdir Fernandes Docente na Universidade Tecnológica Federal do Paraná – Curitiba (PR), Brazil.
Marcelo Limont Docente na Universidade Positivo – Curitiba (PR), Brazil.
Maurício Dziedzic Docente na Universidade Positivo – Curitiba (PR), Brazil. Docente na Universidade Ceuma – São Luís (MA), Brazil.
Corresponding address:
Maurício Dziedzic – Universidade Positivo – Rua Professor Pedro Viriato Parigot de Souza, 5.300 – Campo Comprido – CEP 81280-330 – Curitiba (PR), Brazil – E-mail: [email protected]
Received on: 10/20/2018 Accepted on: 12/18/2018
ABSTRACTIn order to bolster the concept of sustainable territorial development in conjunction with the three capitals — natural, social, and built capital —, a conceptual methodology was elaborated. It utilized the infrastructure systems to group indicator dimensions of built capital, highlighting what actually corresponds to the territorial development reality and not just economic growth. This resulted in the selection of 70 indicators that were tested with data from the Curitiba Metropolitan Region (CMR). Thirty-five indicators were selected from the data available to evaluate the development in 29 municipalities that form the CMR. Finally, the Sustainable Territorial Development Index (INFRASTDI) and Inequality Index (II) were proposed to summarize the information collected.
Keywords: capital theory; urbanization; indicator framework; infrastructure; method; inequality index.
RESUMOPara reforçar o conceito de desenvolvimento territorial sustentável em conjunto com os três capitais — natural, social e construído —, foi proposta uma metodologia conceitual. Os sistemas de infraestrutura foram empregados para agrupar as dimensões de indicadores do capital construído, destacando o que corresponde à realidade do desenvolvimento territorial e não apenas o crescimento econômico. Isso resultou na seleção de 70 indicadores que foram testados com dados da Região Metropolitana de Curitiba (RMC). Um total de 35 indicadores foi selecionado com base nos dados disponíveis para avaliar o desenvolvimento em 29 municípios que formam a RMC. Por fim, o Índice de Desenvolvimento Territorial Sustentável (INFRASTDI) e o Índice de Desigualdade (II) foram propostos para sintetizar as informações coletadas.
Palavras-chave: teoria dos capitais; urbanização; modelos de indicadores; infraestrutura; método; índice de desigualdade.
DOI: 10.5327/Z2176-947820180437
EVALUATING SUSTAINABLE TERRITORIAL DEVELOPMENT WITH BUILT CAPITAL INDICATORS
AVALIAÇÃO DO DESENVOLVIMENTO SUSTENTÁVEL DO TERRITÓRIO UTILIZANDO INDICADORES DE CAPITAL CONSTRUÍDO
Built capital and sustainable development
129
RBCIAMB | n.50 | dez 2018 | 128-148
INTRODUCTIONSince the publication of the Brundtland Report in 1987, the theme of sustainable development has been the subject of innumerous debates motivated by the ne-cessity to seek new productive and technological pro-cesses that can, at a minimum, combine the concept of sustainability to that of development. This entails the explicit attempt to draw a new economic paradigm that considers impacts on natural resources and guar-antees social justice.
In this report, sustainable development is understood as the management of resources in such a manner as to guarantee the existence of these resources for current and future generations, considering potential gains and losses in different temporal and spatial scales. This rec-ognizes that the concept is not static, but it is a process of change immersed in the complexity of elements that surround the quality of human life.
The discussions about sustainability indicators also emerged from the Brundtland Report and from Agen-da 21, elaborated at the United Nations Conference on the Environment in Rio de Janeiro, 1992. Sustainabili-ty indicators evolved from “environmental indicators”, developed in the 1980s, and “indicators of sustainable dimensions”, developed in 1990. Based on Malheiros et al. (2012), Cavalcanti et al. (2017a, p. 334) defined sustainability indicators “as a way to materialize the concept of sustainability and at the same time inte-grate its dimensions”.
In order to aid the efficacy of public policies, the cre-ation of space-delimited indicators is important, start-ing with the municipal realities since they are closer to the needs of the population (SCHWARZ, 2010).
However, indicator development has traditionally been focused on environmental, social and economic di-mensions, often not considering the systemic nature of development, leaving out an important aspect, viz., infrastructure systems, which are part of the built cap-ital. This gap was confirmed by a literature search con-ducted on August 03, 2018 through Portal de Periódi-cos da Capes (http://www-periodicos-capes-gov-br.ez129.periodicos.capes.gov.br/), which congregates 491 databases, including Compendex, PubMed, Sco-pus, Springer, Web of Science, to name only a few. The search was performed using the terms “Built Cap-
ital” to select articles from peer-reviewed journals, resulting in 1,097 articles. These results were filtered, selecting the descriptor “Infrastructure” (343), publi-cation period 2010/2018 (186), and topics related to “sustainability” and “urbanization”, leading to 72 arti-cles. Among these, 30 papers presented a built capital approach from the perspective of urban infrastructure, and only 10 studies considered this perspective for the development of indicator systems.
Built capital, according to Meadows (1998), comprises the physical structures built by men. It is the infrastruc-ture, services, industry, highways, technological and scientific equipment, among others. Thus, the present work focuses on indicators of infrastructure as part of the built capital.
Authors such as Furtado (1974), Polanyi (2012), Sachs (2008), and Max-Neef (1993) consider infrastructure as the fundamental element of built capital and the fundamental dimension of development, as well as natural and social capital. Access to appropriate infra-structure can significantly improve the quality of life in communities and their socioeconomic outcomes, also influencing consumption patterns, and contributing to ecological awareness. This evidences the importance of evaluating sustainable territorial development through built capital indicators (HEGARTY & HOLDSWORTH, 2015; KALTENBORN et al., 2017).
The present framework was developed while looking at the Curitiba Metropolitan Region (CMR), seeking to identify sustainable territorial development in met-ropolitan regions. It is important that public policies aimed at metropolitan regions, and not isolated cit-ies, be based on indicators that reflect both local and regional realities. Thus, the present work contributes to the debate about sustainable development consid-ering both local population aspects and public ser-vices policies.
In the following pages, a literature review is present-ed on sustainable territorial development, consider-ing infrastructure as a representation of built capital, and indicators. After the methods section, the results present the 70 indicators selected for the assessment of sustainable territorial development, as well as the 35 indicators employed to assess the CMR. Combina-
Kauling, M.F. et al.
130
RBCIAMB | n.50 | dez 2018 | 128-148
tion of the selected indicators resulted in two indices for the region: one of sustainable infrastructure and another of inequality between the infrastructure of the
municipalities that compose the metropolitan region. The latter allows analysis of the sustainable develop-ment asymmetry at the regional level.
BACKGROUNDSustainable territorial developmentChapter 28 of Agenda 21 highlighted that many of the problems it treated have their origins in local activ-ities. The text recognizes that it is local public power that constructs, operates, and maintains economic and social infrastructure that impacts the environment, establishing the local processes and reflecting the ex-ecution of regional and national development policies (UNITED NATIONS, 1992).
The importance of local power is increasing with the recognition that in the territory are the critical chal-lenges for human and sustainable development in all its dimensions. Initiatives such as the New Urban Agenda (UNITED NATIONS, 2017) and the Agenda for Sustain-able Development 2030 have set the goal of making cities and human settlements inclusive, resilient and sustainable. The movement to seek sustainable actions from the public authorities closest to the population highlighted cities as a central point of sustainable de-velopment because it is the location of most activities and people (KLOPP & PETRETTA, 2017).
Taking the local territory as a starting point of devel-opment that directly affects the population permits a systematic analysis of sustainable development that is only viable if all the parts that compose the whole are identified and addressed (FÜRST et al., 2013). The mat-uration of themes connected to the environment views the local economy and its spatial relations in relation to sustainable territorial development (BOSSEL, 1998).
Sustainable territorial development is argued by Dal-labrida (2011) as a structural process, which constitutes a territoriality, employed by an organized society, sus-tained by the potential local natural resources, tangi-ble and intangible, that reorganizes the socioeconomic relations and aims to improve the population’s quality of life. It also aims at: a synchronic solidarity with the current generation and a diachronic solidarity with fu-ture generations; assured access to basic conditions of universal healthcare and education; and a respect for
customs and traditions, as well as the legitimacy of in-stitutions (SACHS, 2006).
According to Champollion (2006), territoriality is an inter and transdisciplinary concept with contribution from several disciplines, such as Geography, Anthro-pology, and Sociology, involving macro themes such as environmental issues, urban planning, and land use. Territoriality has two origins, legal and ecological, and three dimensions: an existential one (life), a physical one (frame) and an organizational or symbolic one (so-ciety). At the same time, it is also a human and social construction in which identity is produced (HOROCHO-VSKI et al., 2011; SOUZA et al., 2013).
The idea of sustainable territorial development rein-forces the importance given by Agenda 21 to local ac-tions. The objective is to stimulate reflections, discus-sions, conflict resolution, stakeholder integration, and synergy with sustainable development (BAYULKEN & HUISINGH, 2015).
In the urban reality of large cities, it is important to note that the territory is not only in the city, as indi-cated by Local Agenda 21, but includes all of the cities in the surrounding region. Given the inert interdepen-dence among the spaces arising from human activities (SILVA & FORTUNATO, 2007), the surrounding munici-palities cannot be ignored.
Public policy management, during sustainable territo-rial development processes, should be more effective at improving the quality of goods and services offered to local populations. The implementation of these policies is, nevertheless, difficult and complex, facing uncertainties, diverging interests, different levels of government, and other restrictions. For more assertive decision-making, it is important to have management tools, such as indicators, that can recognize the com-plexity and structurally organize it (SCHWARZ, 2010; SANTANA et al., 2011).
Built capital and sustainable development
131
RBCIAMB | n.50 | dez 2018 | 128-148
Indicators created from local information permit a view of the scenario much closer to reality. This leads to in-dicators that hold greater relevancy and are more com-prehensible of diverse interests, guaranteeing greater representation (COUTINHO, 2006; CENTRULO et al., 2013) alongside the possibility for more effective polit-ical action (MARTINET, 2011).
There are many initiatives on sustainable local-level in-dicators (HENDRICKSON, 2010; COX et al., 2010; MAES et al., 2011; ZHANG et al., 2011; KUSAKABE, 2013; MARTIRE et al., 2015; LUPOLI & MORSE, 2015; CARLS-SON et al., 2017; GINÉ-GARRIGA et al., 2016; PATEL et al., 2017; GALLI et al., 2018), but it is observed that few studies effectively address the interaction between local and regional situations, which could be the basis for an analysis of existing inequalities in the region.
To select indicators that are closer to the local reali-ty, Mascarenhas et al. (2010) propose a method that allows local sustainability managers to identify local strengths and weaknesses, evaluate ideas and poten-tial actions. More important than assessing the condi-tions of the municipality is to identify the asymmetries between the neighboring municipalities of the same region with the objective of fomenting new ideas for jointly managing resources shared by all.
Thus, the proposed methodology classifies the indica-tors based on the natural, social and built capital ty-
pology (MEADOWS, 1998), and selects built capital, since infrastructure has great influence on the other two capitals, and it is where a community concentrates its developmental efforts (MEADOWS, 1998; BROCK-LESBY & FISHER, 2003; MULDER et al., 2006; FLORA, 2008). Built capital is fundamental to achieve sustain-able development, either through technocentrism that prescribes the responsibility of replacing natural capi-tal with built capital, or the ecocentric vision, in which the built capital complements natural capital over time. Economic theories of sustainable development consider the creation of infrastructure, investment in technology and other manufactured goods essential for the sustainability and well-being of the population. However, because it is often considered an element of economic growth and not part of an integrated devel-opment of sustainability, built capital is not adequate-ly explored in the literature (SIRGY, 2011). Natural and social capital indicators are abundant in the literature, but there are few studies that explore built capital, notwithstanding its irrefutable importance for the development and for the assessment of sustainabil-ity. Therefore, studies are necessary in this sense, as sought to accomplish here.
This work also proposes a sustainability index and an inequality index to identify differences in infrastructure between metropolitan cities.
Infrastructure systems representative of built capitalThe theme of sustainable development involves hu-man, ecological, political, and economic elements that are integrated, which often impedes distinguishing one element from another.
Thus, conceptually separating the elements as a study strategy aims to satisfy the plentitude that the theme demands. The dimensions brought by Sachs (2008) are one strategic approach in this direction. Meadows pro-poses a systematic structure of the economy, separat-ed into three capitals. Natural, built and social capitals all collaborate for the same sustainable development objective: well-being (MEADOWS, 1998).
The integrated relationship of the capitals is constant, and built capital can increase or decrease the quali-ty of the other capitals (FLORA, 2008). Sustainability on the level of built capital means to invest at least
as fast as the capital is depreciated (COMOLLI, 2006). Cross sustainability means maintaining the flux re-quired by built capital within the sustainable returns and capacities of primary resources — natural capital (MEADOWS, 1998).
Here, Meadows’ (1988) definition of built capital is adopted. It is an intermediate means that associates man’s technology and the created improvements to promote a larger goal, i.e., well-being, without which the development would be disqualified. Built capital, for Meadows (1998), combines the characteristics of being the production capacity of the economy, of growing by investment, and decreasing by deprecia-tion or obsolescence. It is also a transformer of natu-ral capital, thus controlling its use (O’CONNOR, 2000; KARVONEN, 2001; COMOLLI, 2006). Furthermore, built
Kauling, M.F. et al.
132
RBCIAMB | n.50 | dez 2018 | 128-148
capital is auto-reproducing (the larger the investment in production, the larger the production and the larger the investment), which the author identifies as a feed-back circuit.
In the literature, built capital is defined by its represen-tations. For Flora (2008), it is the infrastructure that supports the community, including the services of tele-communications, industrial parks, water and wastewa-ter treatment systems, highways, and technological and scientific equipment. Often this built capital is the focus of a community’s efforts to develop.
Brocklesby and Fisher (2003) include in this catego-ry highways, heavy equipment, factories, houses and apartments, in addition to the basic necessities such as food and clothing. They also include items that are not indispensable, but are a part of daily life, such as washing machines, dishwashers, cars, telephones, and computers.
Income and financial flows can be categorized as fi-nancial capital (BROCKLESBY & FISHER, 2003; FLORA, 2008), but are considered by Meadows (1998) and Mulder et al. (2006) as aspects of built capital.
Built capital is underexplored in the sustainable de-velopment studies; the theme is usually related to the natural and social capitals. According to Parkin et al. (2003), there are only two true sources of wealth that are the basis of any development process: the Earth (natural capital), and human capacities (human and so-cial capital). Everything else derives from these two pri-mary sources. However, the infrastructure, representa-tive of built capital, is made up of the constructions and
public services essential for the quality of human life in their territory, needs to be considered when dealing with sustainable development.
With the aim of improving result measurements, Meadows (1998) subdivided built capital among inter-twined categories that remain aligned with the princi-ple of built capital, as well as physical structures built by men. Among these categories is public infrastruc-ture capital exemplified by highways, ports, bridges, and sanitation. The author highlights the public infra-structure category, since it is the base of the economy, which is reflected in all other categories of built capital.
Public infrastructure was then selected to represent built capital, since it is defined as that infrastructure which supports the life of a community (BROCKLESBY & FISHER, 2003; FLORA, 2008), and also highlighted as the principal category of built capital by authors such as Meadows (1998) and Mulder et al. (2006).
It was then necessary to select among all infrastructure systems those fundamental to the structure of civil life. These consisted of basic public subsidies for local devel-opment, capable of stimulating economic movements, and generating demand for new structures. With the infrastructure systems defined, the corresponding indi-cators were compiled.
Aiming to develop adequate infrastructure indicators for the current reality of the CMR — similar work was conducted by Cavalcanti et al. (2017a; 2017b), focusing on urban mobility projects in Curitiba —, a method was developed to select and analyze indicators that mea-sure sustainable territorial development.
METHODThe method adopted in this work is similar to that de-scribed by Bardin (2007) in his content analysis meth-od, including: pre-analysis, exploration of the material, and treatment of the results.
In the first stage, indicator systems were selected from international organizations — United Nations (UN), World Bank, Organisation for Economic Co-op-eration and Development (OECD) —, universities and government institutions from countries such as Can-ada, the Netherlands, the United States, the United Kingdom and the European Union. The indicators that
make up each selected system were classified in the categories proposed by Meadows (1998) of natural, social and built capital. For the second stage, only the built capital indicators were used. Based on the theo-retical references described, a search was made in the literature of infrastructure systems considered part of the core of public buildings and services relevant to local development.
As a result, the cited systems were compiled as the basis of public infrastructure for economic activation and basic quality of life for the population: transpor-
Built capital and sustainable development
133
RBCIAMB | n.50 | dez 2018 | 128-148
tation, sanitation, health, education, energy, hous-ing, communication.
Urban infrastructure is part of the concept of sustain-able development and directly related to the well-being of the population. Urban policy projects are one of the most challenging problems for public managers, since rapid urbanization has increased the need for better governance of cities (ZHANG & LI, 2018). The limit of the substitution of natural capital by built capital, one of the bases of the theory of weak sustainability, de-fended by neoclassical economics, is also a question of management of public infrastructure and integrates the perspective of sustainable development (RAMOS & CAEIRO, 2010).
The capital indicators selected in the first stage and also present in the indicator systems selected in the second stage make up the final selection. This resulted in the 70 indicators listed in Tables 1 to 7.
The second phase of the content analysis method of Bardin (2007) deals with the exploration of the materi-al, in which the collected textual material is submitted
to an in-depth study, guided by theoretical references, as happened in the analyses following the selections from the first phase.
The third phase involves the treatment of the results, highlighting information for the elaboration of con-clusive interpretations, making a reflexive and critical analysis possible. Corresponding to the last step, the indicators relevant to the CMR were selected.
For this last stage, a survey was carried out in national official databases — Instituto Brasileiro de Geografia e Estatística (IBGE), Instituto Paranaense de Desenvolvi-mento Econômico e Social (IPARDES), Federação das Indústrias do Estado do Paraná, Government of the State of Paraná, Ministries, Government Agencies, City Halls —, in search of data concerning the 70 indicators. Absence of data or inadequacy of existing official data were criteria for discarding indicators (SICHE et al., 2007). Thus, 35 indicators of infrastructure were ob-tained from the perspective of territorial development for the CMR, aligning the concept of sustainable devel-opment with the identity of the territory.
RESULTSThe review of the literature identified 23 indicator models that are described in the Appendix, which en-compass 7 infrastructure systems and 70 indicators. Most of these indicator models, 20 of 23, were pro-posed by international organizations involved in the sustainable development debate. The infrastructure systems comprise: transportation, sanitation, health, education, energy, housing, and communication. Tables 1 to 7, each pertaining to one of the infrastruc-ture systems, present the indicators found, which are related to built capital, in descending order of occur-rence in the models. These indicators cover broad as-pects of infrastructure, and validation in the territory is important to ensure that they adequately represent geographic, social, and cultural realities.
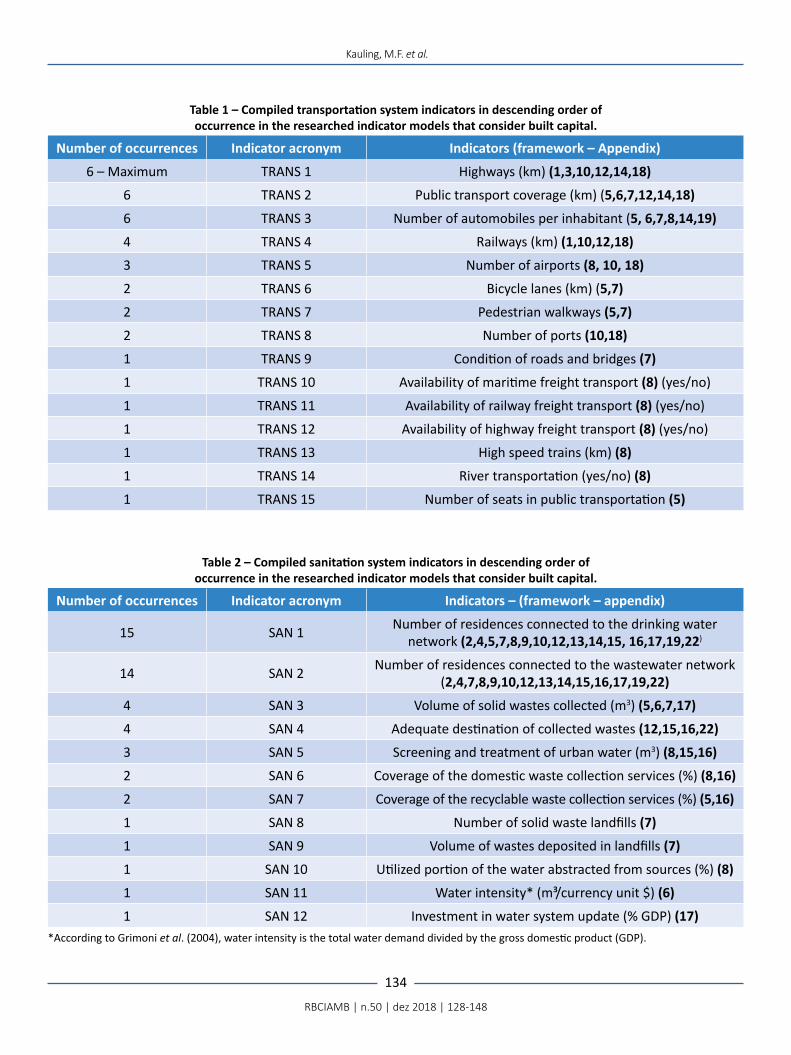
Table 1, showing the transportation system, offers an example of the importance of considering indi-cators under the perspective of the specific territo-ry: indicators evaluating the existence of ports and maritime transportation services are only relevant to coastal territories. Other indicators, such as train
transportation, the ability to travel by train, high speed trains, and river transportation, also were not utilized for CMR due to the absence of these services in the region, even though they are considered good infrastructure indicators according to the criteria pro-posed by Meadows (1998), fulfilling the conditions of content, efficiency, and relevancy. Table 2 shows the indicators for the sanitation system, the only type of infrastructure for which all indicators were included in the evaluation of the CMR. Heeding the precepts of Siche et al. (2007), they can capture the available information, permitting the analysis of territory sce-nario and reflect on the combination of public policies in the area of sanitation.
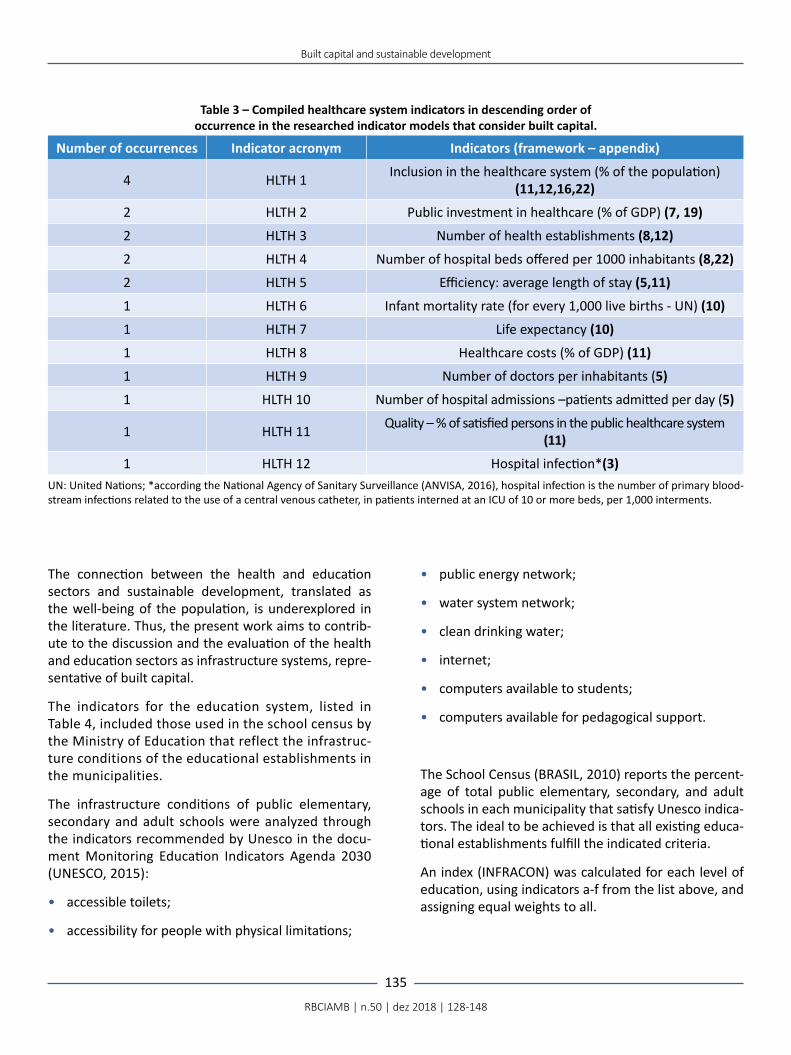
The health and education systems, listed in Tables 3 and 4, respectively, were considered as infrastructure, but could also be classified as social capital (MEADOWS, 1998). Their inclusion seeks to include in the analysis the infrastructure built for the health and education sectors, even if some of the indicators selected provide indirect measurement of the available infrastructure.
Kauling, M.F. et al.
134
RBCIAMB | n.50 | dez 2018 | 128-148
Table 1 – Compiled transportation system indicators in descending order of occurrence in the researched indicator models that consider built capital.
Number of occurrences Indicator acronym Indicators (framework – Appendix)
6 – Maximum TRANS 1 Highways (km) (1,3,10,12,14,18)
6 TRANS 2 Public transport coverage (km) (5,6,7,12,14,18)
6 TRANS 3 Number of automobiles per inhabitant (5, 6,7,8,14,19)
4 TRANS 4 Railways (km) (1,10,12,18)
3 TRANS 5 Number of airports (8, 10, 18)
2 TRANS 6 Bicycle lanes (km) (5,7)
2 TRANS 7 Pedestrian walkways (5,7)
2 TRANS 8 Number of ports (10,18)
1 TRANS 9 Condition of roads and bridges (7)
1 TRANS 10 Availability of maritime freight transport (8) (yes/no)
1 TRANS 11 Availability of railway freight transport (8) (yes/no)
1 TRANS 12 Availability of highway freight transport (8) (yes/no)
1 TRANS 13 High speed trains (km) (8)
1 TRANS 14 River transportation (yes/no) (8)
1 TRANS 15 Number of seats in public transportation (5)
Table 2 – Compiled sanitation system indicators in descending order of occurrence in the researched indicator models that consider built capital.
Number of occurrences Indicator acronym Indicators – (framework – appendix)
15 SAN 1 Number of residences connected to the drinking water network (2,4,5,7,8,9,10,12,13,14,15, 16,17,19,22)
14 SAN 2 Number of residences connected to the wastewater network (2,4,7,8,9,10,12,13,14,15,16,17,19,22)
4 SAN 3 Volume of solid wastes collected (m3) (5,6,7,17)
4 SAN 4 Adequate destination of collected wastes (12,15,16,22)
3 SAN 5 Screening and treatment of urban water (m3) (8,15,16)
2 SAN 6 Coverage of the domestic waste collection services (%) (8,16)
2 SAN 7 Coverage of the recyclable waste collection services (%) (5,16)
1 SAN 8 Number of solid waste landfills (7)
1 SAN 9 Volume of wastes deposited in landfills (7)
1 SAN 10 Utilized portion of the water abstracted from sources (%) (8)
1 SAN 11 Water intensity* (m³/currency unit $) (6)
1 SAN 12 Investment in water system update (% GDP) (17)*According to Grimoni et al. (2004), water intensity is the total water demand divided by the gross domestic product (GDP).
Built capital and sustainable development
135
RBCIAMB | n.50 | dez 2018 | 128-148
Table 3 – Compiled healthcare system indicators in descending order of occurrence in the researched indicator models that consider built capital.
Number of occurrences Indicator acronym Indicators (framework – appendix)
4 HLTH 1 Inclusion in the healthcare system (% of the population) (11,12,16,22)
2 HLTH 2 Public investment in healthcare (% of GDP) (7, 19)
2 HLTH 3 Number of health establishments (8,12)
2 HLTH 4 Number of hospital beds offered per 1000 inhabitants (8,22)
2 HLTH 5 Efficiency: average length of stay (5,11)
1 HLTH 6 Infant mortality rate (for every 1,000 live births - UN) (10)
1 HLTH 7 Life expectancy (10)
1 HLTH 8 Healthcare costs (% of GDP) (11)
1 HLTH 9 Number of doctors per inhabitants (5)
1 HLTH 10 Number of hospital admissions –patients admitted per day (5)
1 HLTH 11 Quality – % of satisfied persons in the public healthcare system (11)
1 HLTH 12 Hospital infection*(3)UN: United Nations; *according the National Agency of Sanitary Surveillance (ANVISA, 2016), hospital infection is the number of primary blood-stream infections related to the use of a central venous catheter, in patients interned at an ICU of 10 or more beds, per 1,000 interments.
The connection between the health and education sectors and sustainable development, translated as the well-being of the population, is underexplored in the literature. Thus, the present work aims to contrib-ute to the discussion and the evaluation of the health and education sectors as infrastructure systems, repre-sentative of built capital.
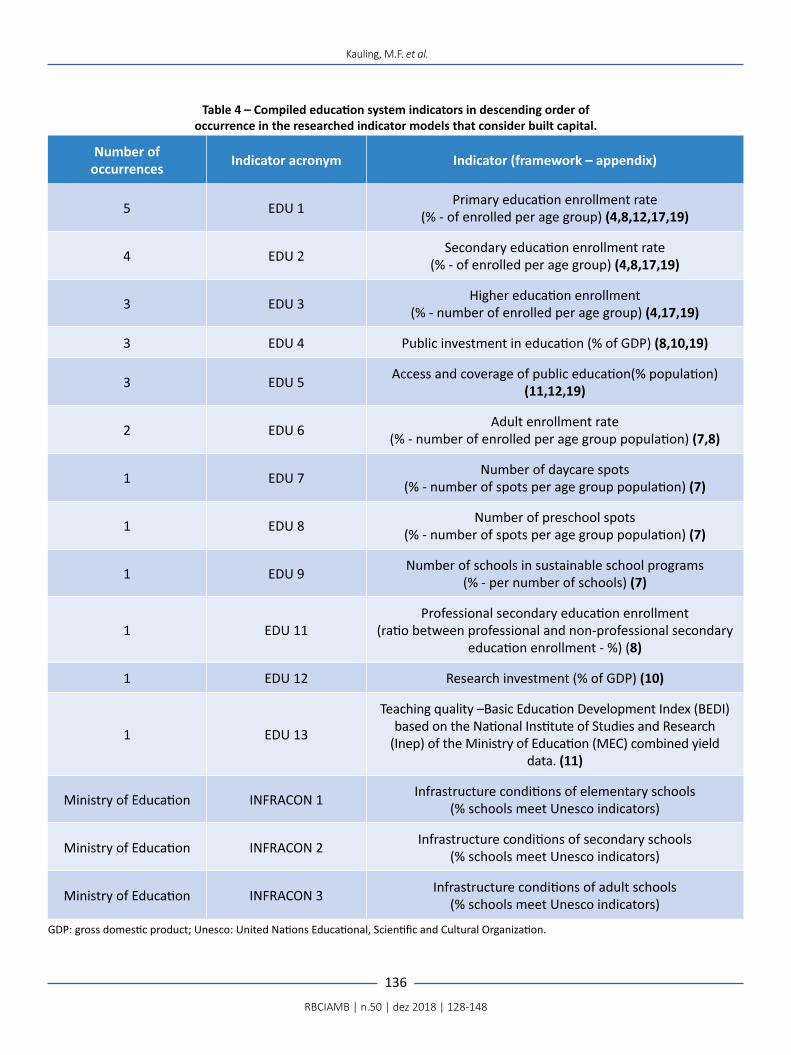
The indicators for the education system, listed in Table 4, included those used in the school census by the Ministry of Education that reflect the infrastruc-ture conditions of the educational establishments in the municipalities.
The infrastructure conditions of public elementary, secondary and adult schools were analyzed through the indicators recommended by Unesco in the docu-ment Monitoring Education Indicators Agenda 2030 (UNESCO, 2015):
• accessible toilets;
• accessibility for people with physical limitations;
• public energy network;
• water system network;
• clean drinking water;
• internet;
• computers available to students;
• computers available for pedagogical support.
The School Census (BRASIL, 2010) reports the percent-age of total public elementary, secondary, and adult schools in each municipality that satisfy Unesco indica-tors. The ideal to be achieved is that all existing educa-tional establishments fulfill the indicated criteria.
An index (INFRACON) was calculated for each level of education, using indicators a-f from the list above, and assigning equal weights to all.
Kauling, M.F. et al.
136
RBCIAMB | n.50 | dez 2018 | 128-148
Table 4 – Compiled education system indicators in descending order of occurrence in the researched indicator models that consider built capital.
Number of occurrences Indicator acronym Indicator (framework – appendix)
5 EDU 1 Primary education enrollment rate (% - of enrolled per age group) (4,8,12,17,19)
4 EDU 2 Secondary education enrollment rate (% - of enrolled per age group) (4,8,17,19)
3 EDU 3 Higher education enrollment (% - number of enrolled per age group) (4,17,19)
3 EDU 4 Public investment in education (% of GDP) (8,10,19)
3 EDU 5 Access and coverage of public education(% population) (11,12,19)
2 EDU 6 Adult enrollment rate (% - number of enrolled per age group population) (7,8)
1 EDU 7 Number of daycare spots (% - number of spots per age group population) (7)
1 EDU 8 Number of preschool spots (% - number of spots per age group population) (7)
1 EDU 9 Number of schools in sustainable school programs (% - per number of schools) (7)
1 EDU 11Professional secondary education enrollment
(ratio between professional and non-professional secondary education enrollment - %) (8)
1 EDU 12 Research investment (% of GDP) (10)
1 EDU 13
Teaching quality –Basic Education Development Index (BEDI) based on the National Institute of Studies and Research
(Inep) of the Ministry of Education (MEC) combined yield data. (11)
Ministry of Education INFRACON 1 Infrastructure conditions of elementary schools (% schools meet Unesco indicators)
Ministry of Education INFRACON 2 Infrastructure conditions of secondary schools (% schools meet Unesco indicators)
Ministry of Education INFRACON 3 Infrastructure conditions of adult schools (% schools meet Unesco indicators)
GDP: gross domestic product; Unesco: United Nations Educational, Scientific and Cultural Organization.
Built capital and sustainable development
137
RBCIAMB | n.50 | dez 2018 | 128-148
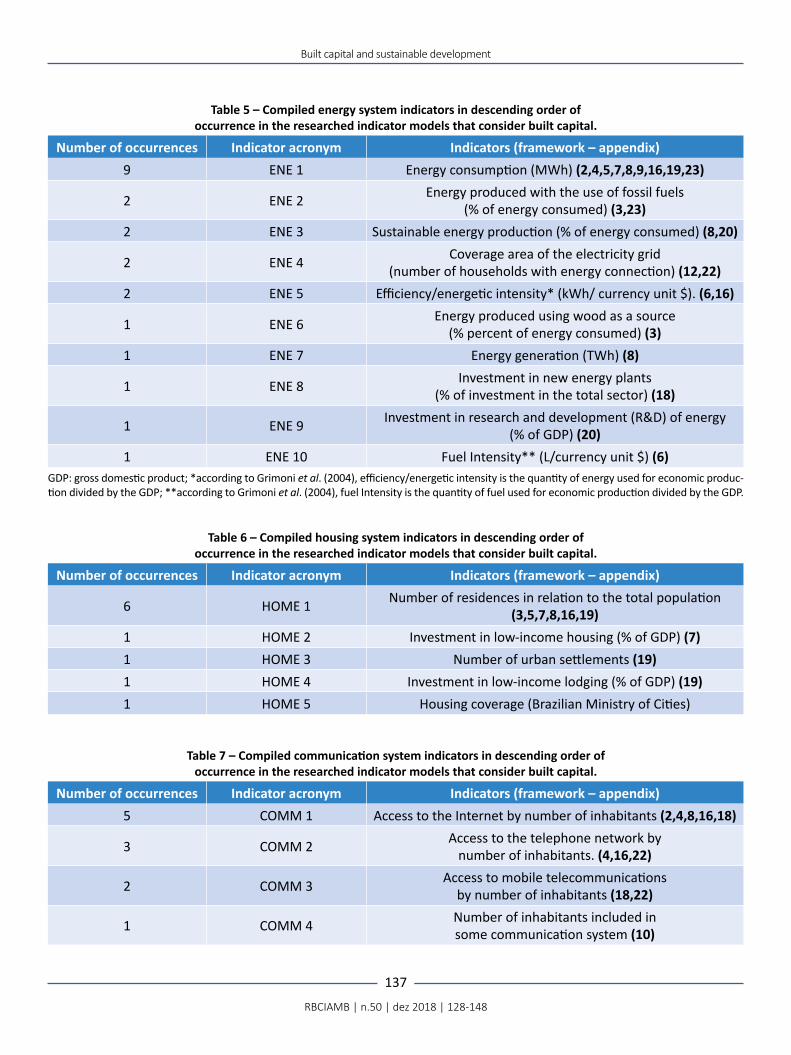
Table 5 – Compiled energy system indicators in descending order of occurrence in the researched indicator models that consider built capital.
Number of occurrences Indicator acronym Indicators (framework – appendix)9 ENE 1 Energy consumption (MWh) (2,4,5,7,8,9,16,19,23)
2 ENE 2 Energy produced with the use of fossil fuels (% of energy consumed) (3,23)
2 ENE 3 Sustainable energy production (% of energy consumed) (8,20)
2 ENE 4 Coverage area of the electricity grid (number of households with energy connection) (12,22)
2 ENE 5 Efficiency/energetic intensity* (kWh/ currency unit $). (6,16)
1 ENE 6 Energy produced using wood as a source (% percent of energy consumed) (3)
1 ENE 7 Energy generation (TWh) (8)
1 ENE 8 Investment in new energy plants (% of investment in the total sector) (18)
1 ENE 9 Investment in research and development (R&D) of energy (% of GDP) (20)
1 ENE 10 Fuel Intensity** (L/currency unit $) (6)GDP: gross domestic product; *according to Grimoni et al. (2004), efficiency/energetic intensity is the quantity of energy used for economic produc-tion divided by the GDP; **according to Grimoni et al. (2004), fuel Intensity is the quantity of fuel used for economic production divided by the GDP.
Table 6 – Compiled housing system indicators in descending order of occurrence in the researched indicator models that consider built capital.
Number of occurrences Indicator acronym Indicators (framework – appendix)
6 HOME 1 Number of residences in relation to the total population (3,5,7,8,16,19)
1 HOME 2 Investment in low-income housing (% of GDP) (7)1 HOME 3 Number of urban settlements (19)1 HOME 4 Investment in low-income lodging (% of GDP) (19)1 HOME 5 Housing coverage (Brazilian Ministry of Cities)
Table 7 – Compiled communication system indicators in descending order of occurrence in the researched indicator models that consider built capital.
Number of occurrences Indicator acronym Indicators (framework – appendix)5 COMM 1 Access to the Internet by number of inhabitants (2,4,8,16,18)
3 COMM 2 Access to the telephone network by number of inhabitants. (4,16,22)
2 COMM 3 Access to mobile telecommunications by number of inhabitants (18,22)
1 COMM 4 Number of inhabitants included in some communication system (10)
Kauling, M.F. et al.
138
RBCIAMB | n.50 | dez 2018 | 128-148
The number of computers available to students and pedagogical support were not used in the calcula-tion of the index because that information does not depict the situation properly, since ratios of comput-ers to the respective populations would be more ad-equate to portray infrastructure conditions, and not simply totals.
For the energy system, detailed in Table 5, only two in-dicators were included (ENE 1 and ENE 4) for the eval-uation of CMR, because of the lack of data for the others. The utility company for the state of Paraná, Copel, presents its data for the state as a whole and not by municipality.
Table 6 lists the indicators compiled for the housing infrastructure system. The indicator “number of resi-dences in relation to the total population” (HOME 1) is highlighted because it is the basis for calculating the housing conditions of the population.
There are studies in Brazil that indicate the occurrence of a housing deficit in the country. The main compo-nent of the calculation of the housing deficit, in quan-titative terms, is based on the subtraction of the total number of families from the total number of house-holds. There will be a housing deficit when the number of families is greater than the number of households (ALVES & CAVENAGHI, 2007).
By this method, there is no housing deficit in the mu-nicipalities of the CMR, because the number of house-holds is greater than the number of families, consid-ering the different categories of domicile and the concept of family defined by research institutes IBGE and IPARDES.
Another method, adopted by the federal govern-ment through the Ministry of Cities (FURTADO et al., 2013), was developed by the João Pinheiro Founda-tion and uses qualitative indicators (precarious, rustic or improvised households, families residing in rooms, households whose rental value exceeds 30% of total household income, and three or more people residing in the same room), showing the existence of a hous-ing deficit in Brazil.
The result obtained by the João Pinheiro Foundation’s method was adopted as the indicator “housing cover-age” (HOME 5).
Among the indicators compiled for housing and com-munication, listed in Tables 6 and 7, respectively, only one indicator for each system was discarded (HOME 4 and COMM 4) due to imprecise definitions. Indicators must have clear content and no uncertainty in the di-rection, using units that make sense (BELLEN, 2005; SICHE et al., 2007; PHILIPPI JR. & MALHEIROS, 2012).
Indicator HOME 4 was discarded due to the lack of spe-cific data for the CMR and also due to uncertainty regard-ing what it exactly attempts to measure (MEADOWS, 1998). Additionally, once the available information was found regarding the expenditures of the municipalities, it was not clear if this responded to the indicator.
COMM 4, which establishes the “number of inhabi-tants in some communication system”, was discarded since it did not stated which indicator system it intend-ed to measure nor how it would be operationalized.
The compiled indicators must be contextualized to the territory being evaluated so that they may effectively measure sustainable territory development.
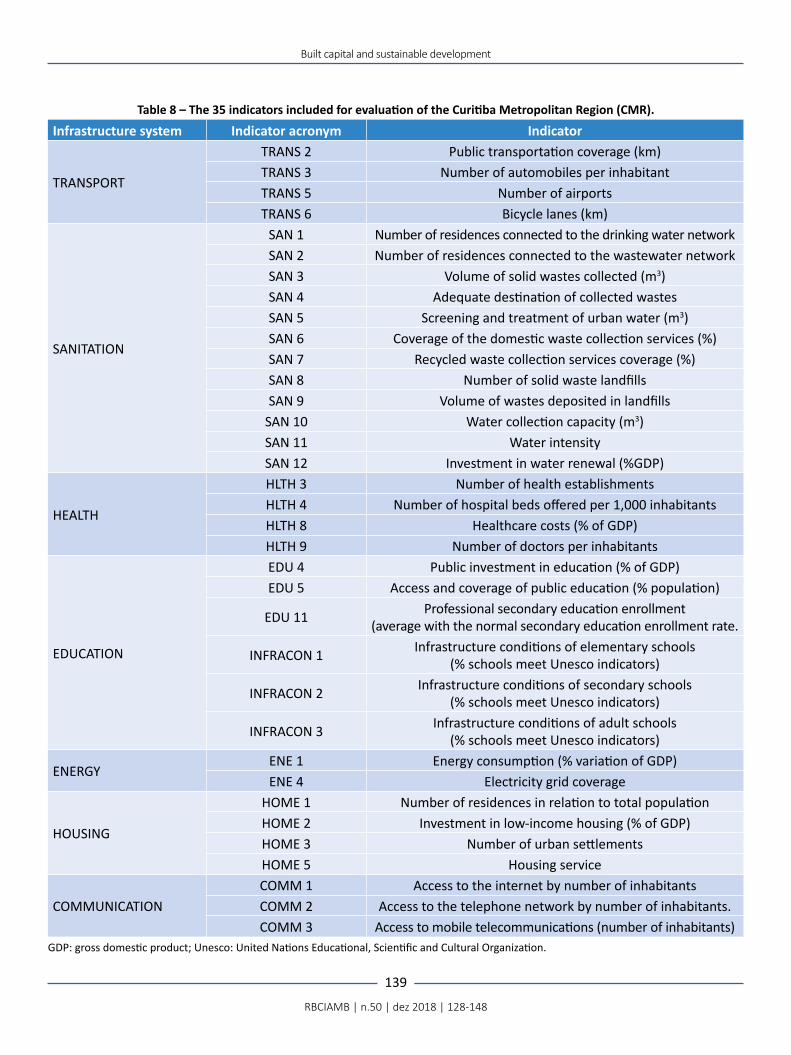
ANALYSIS AND DISCUSSION The compiled indicators were tested with data from the CMR in order to verify their capacity of measuring the quality of development for those municipalities integrated in the metropolis. Among the 70 available, 35 indicators were included in this evaluation, which are listed in Table 8.
In order to facilitate interpretation of the results for each infrastructure system, an index (Sustainable Territory Development Index—STDI), defined as the arithmetic
mean of the included indicators, was created. The sum of the infrastructure indices divided by the number of systems formed the Sustainable Territorial Development Index (INFRASTDI). In agreement with Mayer (2008), aggregating indicators in an index provides a system overview, and when calculated periodically indicates if this system is becoming more or less sustainable, iden-tifying strengths and weaknesses (CAETANO, 2013). Sustainability indices are specifically developed to aid decision-makers. The INFRASTDI synthesizes the current
Built capital and sustainable development
139
RBCIAMB | n.50 | dez 2018 | 128-148
Table 8 – The 35 indicators included for evaluation of the Curitiba Metropolitan Region (CMR).
Infrastructure system Indicator acronym Indicator
TRANSPORT
TRANS 2 Public transportation coverage (km)TRANS 3 Number of automobiles per inhabitantTRANS 5 Number of airportsTRANS 6 Bicycle lanes (km)
SANITATION
SAN 1 Number of residences connected to the drinking water network SAN 2 Number of residences connected to the wastewater networkSAN 3 Volume of solid wastes collected (m3)SAN 4 Adequate destination of collected wastesSAN 5 Screening and treatment of urban water (m3)SAN 6 Coverage of the domestic waste collection services (%)SAN 7 Recycled waste collection services coverage (%)SAN 8 Number of solid waste landfillsSAN 9 Volume of wastes deposited in landfills
SAN 10 Water collection capacity (m3)SAN 11 Water intensity SAN 12 Investment in water renewal (%GDP)
HEALTH
HLTH 3 Number of health establishmentsHLTH 4 Number of hospital beds offered per 1,000 inhabitantsHLTH 8 Healthcare costs (% of GDP)HLTH 9 Number of doctors per inhabitants
EDUCATION
EDU 4 Public investment in education (% of GDP)EDU 5 Access and coverage of public education (% population)
EDU 11 Professional secondary education enrollment (average with the normal secondary education enrollment rate.
INFRACON 1 Infrastructure conditions of elementary schools (% schools meet Unesco indicators)
INFRACON 2 Infrastructure conditions of secondary schools (% schools meet Unesco indicators)
INFRACON 3 Infrastructure conditions of adult schools (% schools meet Unesco indicators)
ENERGYENE 1 Energy consumption (% variation of GDP) ENE 4 Electricity grid coverage
HOUSING
HOME 1 Number of residences in relation to total populationHOME 2 Investment in low-income housing (% of GDP)HOME 3 Number of urban settlementsHOME 5 Housing service
COMMUNICATIONCOMM 1 Access to the internet by number of inhabitantsCOMM 2 Access to the telephone network by number of inhabitants.COMM 3 Access to mobile telecommunications (number of inhabitants)
GDP: gross domestic product; Unesco: United Nations Educational, Scientific and Cultural Organization.
Kauling, M.F. et al.
140
RBCIAMB | n.50 | dez 2018 | 128-148
situation of the system, but it is important to note that indices do not capture all phenomena occurring in a sys-tem, such as technology change or the adaptability of social systems (SICHE et al., 2007).
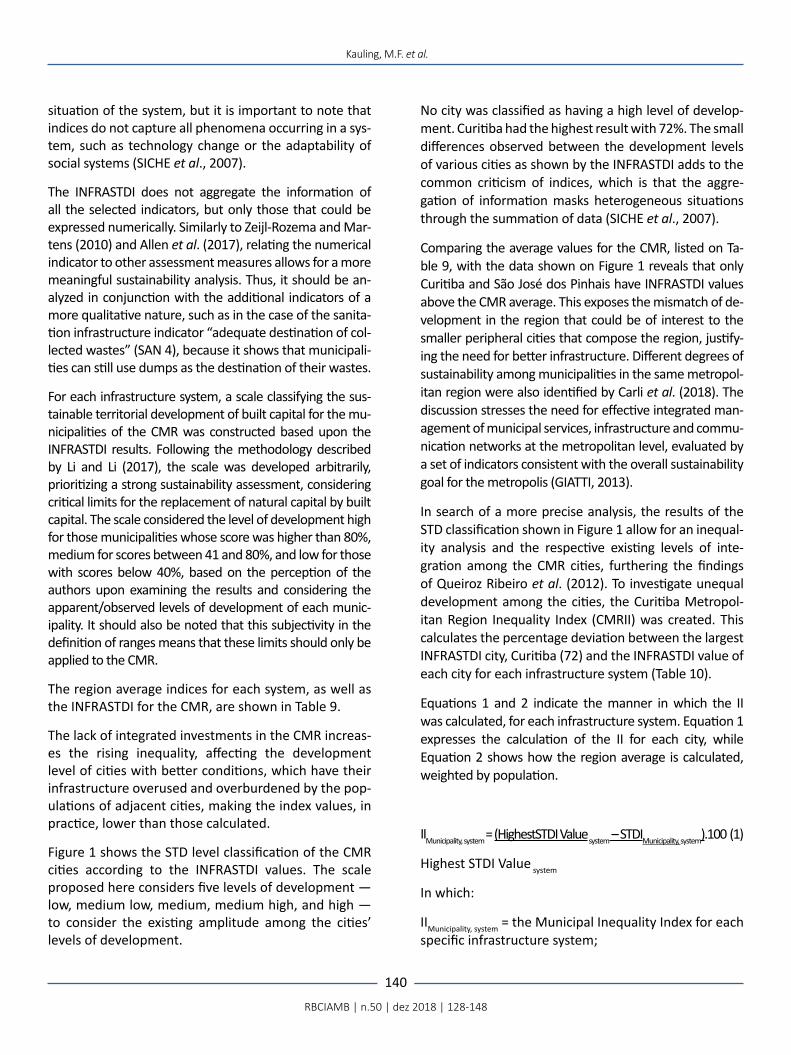
The INFRASTDI does not aggregate the information of all the selected indicators, but only those that could be expressed numerically. Similarly to Zeijl-Rozema and Mar-tens (2010) and Allen et al. (2017), relating the numerical indicator to other assessment measures allows for a more meaningful sustainability analysis. Thus, it should be an-alyzed in conjunction with the additional indicators of a more qualitative nature, such as in the case of the sanita-tion infrastructure indicator “adequate destination of col-lected wastes” (SAN 4), because it shows that municipali-ties can still use dumps as the destination of their wastes.
For each infrastructure system, a scale classifying the sus-tainable territorial development of built capital for the mu-nicipalities of the CMR was constructed based upon the INFRASTDI results. Following the methodology described by Li and Li (2017), the scale was developed arbitrarily, prioritizing a strong sustainability assessment, considering critical limits for the replacement of natural capital by built capital. The scale considered the level of development high for those municipalities whose score was higher than 80%, medium for scores between 41 and 80%, and low for those with scores below 40%, based on the perception of the authors upon examining the results and considering the apparent/observed levels of development of each munic-ipality. It should also be noted that this subjectivity in the definition of ranges means that these limits should only be applied to the CMR.
The region average indices for each system, as well as the INFRASTDI for the CMR, are shown in Table 9.
The lack of integrated investments in the CMR increas-es the rising inequality, affecting the development level of cities with better conditions, which have their infrastructure overused and overburdened by the pop-ulations of adjacent cities, making the index values, in practice, lower than those calculated.
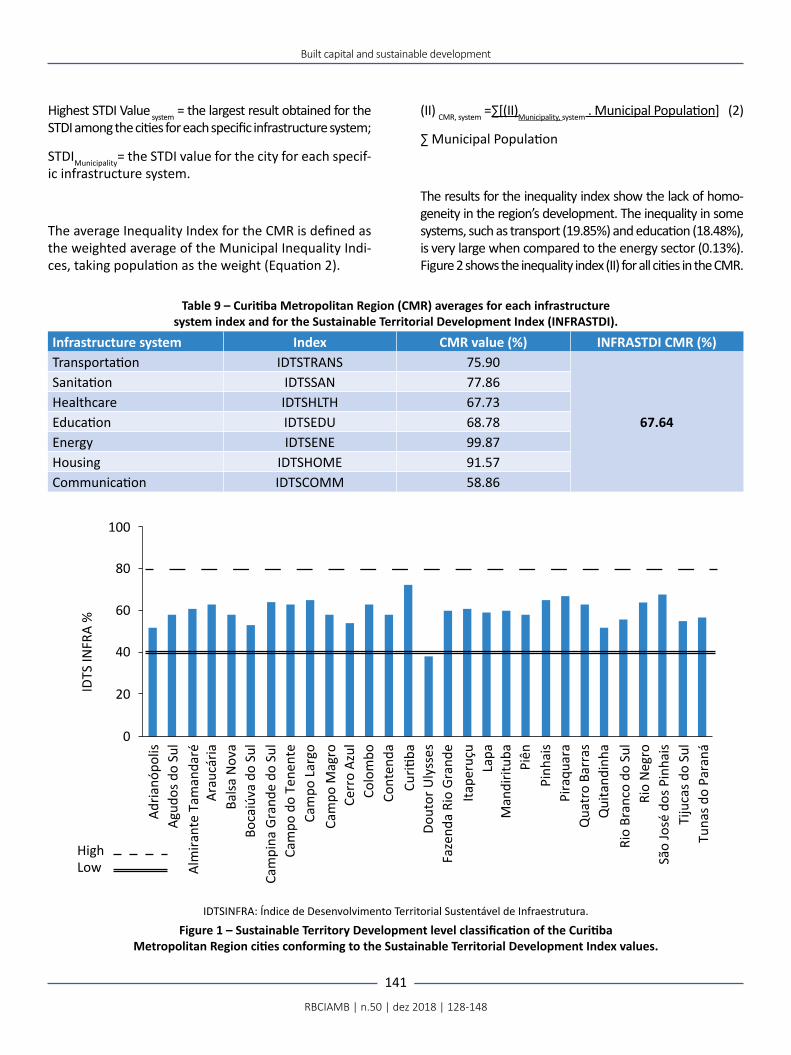
Figure 1 shows the STD level classification of the CMR cities according to the INFRASTDI values. The scale proposed here considers five levels of development — low, medium low, medium, medium high, and high — to consider the existing amplitude among the cities’ levels of development.
No city was classified as having a high level of develop-ment. Curitiba had the highest result with 72%. The small differences observed between the development levels of various cities as shown by the INFRASTDI adds to the common criticism of indices, which is that the aggre-gation of information masks heterogeneous situations through the summation of data (SICHE et al., 2007).
Comparing the average values for the CMR, listed on Ta-ble 9, with the data shown on Figure 1 reveals that only Curitiba and São José dos Pinhais have INFRASTDI values above the CMR average. This exposes the mismatch of de-velopment in the region that could be of interest to the smaller peripheral cities that compose the region, justify-ing the need for better infrastructure. Different degrees of sustainability among municipalities in the same metropol-itan region were also identified by Carli et al. (2018). The discussion stresses the need for effective integrated man-agement of municipal services, infrastructure and commu-nication networks at the metropolitan level, evaluated by a set of indicators consistent with the overall sustainability goal for the metropolis (GIATTI, 2013).
In search of a more precise analysis, the results of the STD classification shown in Figure 1 allow for an inequal-ity analysis and the respective existing levels of inte-gration among the CMR cities, furthering the findings of Queiroz Ribeiro et al. (2012). To investigate unequal development among the cities, the Curitiba Metropol-itan Region Inequality Index (CMRII) was created. This calculates the percentage deviation between the largest INFRASTDI city, Curitiba (72) and the INFRASTDI value of each city for each infrastructure system (Table 10).
Equations 1 and 2 indicate the manner in which the II was calculated, for each infrastructure system. Equation 1 expresses the calculation of the II for each city, while Equation 2 shows how the region average is calculated, weighted by population.
IIMunicipality, system = (HighestSTDI Value system – STDIMunicipality, system).100 (1)
Highest STDI Value system
In which:
IIMunicipality, system = the Municipal Inequality Index for each specific infrastructure system;
Built capital and sustainable development
141
RBCIAMB | n.50 | dez 2018 | 128-148
Table 9 – Curitiba Metropolitan Region (CMR) averages for each infrastructure system index and for the Sustainable Territorial Development Index (INFRASTDI).
Infrastructure system Index CMR value (%) INFRASTDI CMR (%)Transportation IDTSTRANS 75.90
67.64
Sanitation IDTSSAN 77.86Healthcare IDTSHLTH 67.73Education IDTSEDU 68.78Energy IDTSENE 99.87Housing IDTSHOME 91.57Communication IDTSCOMM 58.86
IDTSINFRA: Índice de Desenvolvimento Territorial Sustentável de Infraestrutura.
Figure 1 – Sustainable Territory Development level classification of the Curitiba Metropolitan Region cities conforming to the Sustainable Territorial Development Index values.
High
Adria
nópo
lisAg
udos
do
Sul
Alm
irant
e Ta
man
daré
Arau
cária
Balsa
Nov
a
Cam
pina
Gra
nde
do S
ulBo
caiú
va d
o Su
l
Cam
po d
o Te
nent
eCa
mpo
Lar
goCa
mpo
Mag
roCe
rro
Azul
Colo
mbo
Cont
enda
Curiti
baDo
utor
Uly
sses
Faze
nda
Rio
Gran
deIta
peru
çuLa
paM
andi
ritub
aPi
ênPi
nhai
sPi
raqu
ara
Qua
tro
Barr
asQ
uita
ndin
ha
Rio
Neg
roSã
o Jo
sé d
os P
inha
isTi
juca
s do
Sul
Tuna
s do
Para
ná
Rio
Bran
co d
o Su
l0
20
40
60
80
100
IDTS
INFR
A %
Low
Highest STDI Value system = the largest result obtained for the STDI among the cities for each specific infrastructure system;
STDIMunicipality= the STDI value for the city for each specif-ic infrastructure system.
The average Inequality Index for the CMR is defined as the weighted average of the Municipal Inequality Indi-ces, taking population as the weight (Equation 2).
(II) CMR, system =∑[(II)Municipality, system . Municipal Population] (2)
∑ Municipal Population
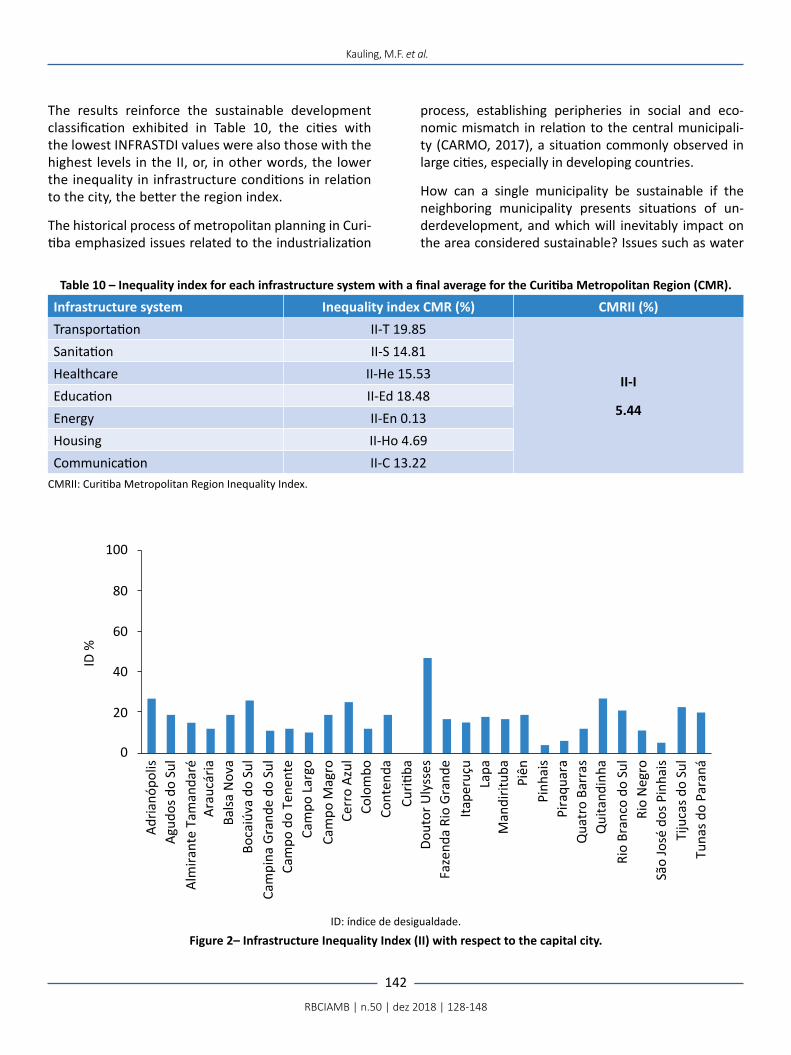
The results for the inequality index show the lack of homo-geneity in the region’s development. The inequality in some systems, such as transport (19.85%) and education (18.48%), is very large when compared to the energy sector (0.13%). Figure 2 shows the inequality index (II) for all cities in the CMR.
Kauling, M.F. et al.
142
RBCIAMB | n.50 | dez 2018 | 128-148
Table 10 – Inequality index for each infrastructure system with a final average for the Curitiba Metropolitan Region (CMR).
Infrastructure system Inequality index CMR (%) CMRII (%)Transportation II-T 19.85
II-I
5.44
Sanitation II-S 14.81Healthcare II-He 15.53Education II-Ed 18.48Energy II-En 0.13Housing II-Ho 4.69Communication II-C 13.22
CMRII: Curitiba Metropolitan Region Inequality Index.
The results reinforce the sustainable development classification exhibited in Table 10, the cities with the lowest INFRASTDI values were also those with the highest levels in the II, or, in other words, the lower the inequality in infrastructure conditions in relation to the city, the better the region index.
The historical process of metropolitan planning in Curi-tiba emphasized issues related to the industrialization
process, establishing peripheries in social and eco-nomic mismatch in relation to the central municipali-ty (CARMO, 2017), a situation commonly observed in large cities, especially in developing countries.
How can a single municipality be sustainable if the neighboring municipality presents situations of un-derdevelopment, and which will inevitably impact on the area considered sustainable? Issues such as water
ID: índice de desigualdade.
Figure 2– Infrastructure Inequality Index (II) with respect to the capital city.
Adria
nópo
lisAg
udos
do
Sul
Alm
irant
e Ta
man
daré
Arau
cária
Balsa
Nov
a
Cam
pina
Gra
nde
do S
ulBo
caiú
va d
o Su
l
Cam
po d
o Te
nent
eCa
mpo
Lar
goCa
mpo
Mag
roCe
rro
Azul
Colo
mbo
Cont
enda
Curiti
baDo
utor
Uly
sses
Faze
nda
Rio
Gran
deIta
peru
çuLa
paM
andi
ritub
aPi
ênPi
nhai
sPi
raqu
ara
Qua
tro
Barr
asQ
uita
ndin
ha
Rio
Neg
roSã
o Jo
sé d
os P
inha
isTi
juca
s do
Sul
Tuna
s do
Para
ná
Rio
Bran
co d
o Su
l0
20
40
60
80
100
ID %
Built capital and sustainable development
143
RBCIAMB | n.50 | dez 2018 | 128-148
supply, sanitation, waste disposal, social and ecological vulnerability do not obey geopolitical boundaries, and generate impacts throughout the region. As observed by Lu et al. (2017), local indicators for sustainability assessment need to consider the reality of the next higher scale in which the assessed territory is inserted, under penalty of inefficiency of this indicator.
The inequality shown by index (II) between periph-eral municipalities and the central municipality presents a great challenge to an integrated man-agement of metropolitan public policies, which inspires research to develop systems based on re-gional sustainability indicators, and not only on a single municipality.
CONCLUSIONInfrastructure indicators for sustainable territorial devel-opment were proposed, creating a method that allows the selection of indicators considering the specificities of the territory.
The evaluation of the CMR contributes to the sustainable development measure from the built capital perspec-tive, considering the relations among natural, social, and built capital for questions of sustainability and economic growth from a territory point of view.
The indicator framework proposed herein allows the as-sessment of sustainable development in a territory, despite focusing on a specific aspect, i.e., urban infrastructure. For an infrastructure system to be sustainable, it must be fully employed, allocated efficiently, and progressively cut back on the use of natural resources. Good infrastructure con-tributes to the reduction of pollution and degradation of natural capital, increasing social well-being.
To contribute to the reflection about infrastructure on the part of public managers, an index was proposed to evaluate the level of sustainable territorial develop-ment in the cities of the CMR, the INFRASTDI, from se-lected and tested indicators using data collected from the region. Seven infrastructure system indices com-posed the INFRASTDI, which led to the conclusion that there is inequality in the level of development among the CMR cities. From this conclusion, the Inequality In-dex (II) for the CMR was calculated.
The result of the II confirmed a higher level of inequality between cities that had lower scores on the INFRASTDI in relation to the central municipality. This agreed with the findings of Queiroz Ribeiro et al. (2012), that pointed to low levels of integration among the peripheral cities and the central part of the region, which could be accounted for the composition of municipalities in the CMR, as many have unique characteristics and population demands. This
strengthens the relevance of indicators focused on the sus-tainable development of the territory, with an emphasis on the local necessities and realities, considering the con-centrated inequalities found in the CMR cities.
It is important to highlight that the results obtained by the INFRASTDI in the CMR are only as relevant as the developed methodology for the overall formation of sustainable territorial development indicators. The uti-lization of selected indicators, such as the INFRASTDI, in public management as instruments for evaluating infrastructure systems strengthens the objective of sus-tainable development in public policy decision-making, which would represent a large improvement in the qual-ity of life in urban centers.
The method adopted for the INFRASTDI can be applied to other metropolitan regions, and, with the selection of new indicators that address other perspectives about in-frastructure systems, it is possible to evaluate other types of infrastructure.
Future work could focus on including “parks and recre-ation” as part of the assessed infrastructure, since they play an important role for the well-being of the popula-tion. Another topic to be considered is the improvement of data gathering, something that depends on the collabo-ration of the region under assessment.
It is recognized, however, that policies, legal, and institu-tional questions permeate the public administration with major influences in the decision management, configuring themselves as obstacles to the implementation of sustain-able public policies.
Nevertheless, the concept of sustainable development is not static, it is a path to be traveled and perhaps not reached in its fullness, but inevitable to maintain the planet. It is necessary to raise awareness and enrich the debate.
Kauling, M.F. et al.
144
RBCIAMB | n.50 | dez 2018 | 128-148
REFERENCESALLEN, C.; NEJDAWI, R.; EL-BABA, J.; HAMATI, K.; METTERNICHT, G.; WIEDMANN, T. Indicator-based assessments of progress towards the sustainable development goals (SDGs): a case study from the Arab region. Sustainability Science, v. 12, n. 6, p. 975-989, 2017. http://dx.doi.org/10.1007/s11625-017-0437-1
ALVES, J. E. D.; CAVENAGHI, S. Família e domicílio no cálculo do déficit habitacional no Brasil. In: ENCONTROS NACIONAIS DA ANPUR, 11., 2007. Anais... 2007.
AGÊNCIA NACIONAL DE VIGILÂNCIA SANITÁRIA (ANVISA). Boletim de Segurança do Paciente e Qualidade em Servi-ços de Saúde nº 14. Avaliação dos indicadores nacionais das Infecções Relacionadas à Assistência à Saúde (IRAS) e Resistência microbiana. Brasil: Anvisa, 2016. Available at: <http://portal.anvisa.gov.br/documents/33852/3074203/Boletim+de+Seguran%C3%A7a+do+Paciente+e+Qualidade+em+Servi%C3%A7os+de+Sa%C3%BAde+n%C2%BA+14+Avalia%C3%A7%C3%A3o+dos+indicadores+nacionais+das+Infec%C3%A7%C3%B5es+Relacionadas+%C3%A0+As-sist%C3%AAncia+%C3%A0+Sa%C3%BAde+%28IRAS%29+e+Resist%C3%AAncia+microbiana/dbd57c96-937f-45d3-93fd-e76684b7f35c>. Acessed on: Dec. 13, 2017.
BARDIN, L. L’analyse de contenu. France: Quadrige Manuels, 2007.
BAYULKEN, B.; HUISINGH, D. Are lessons from eco-towns helping planners make more effective progress in transforming cities into sustainable urban systems: a literature review (part 2 of 2). Journal of Cleaner Production, v. 109, p. 152-165, 2015. http://dx.doi.org/10.1016/j.jclepro.2014.12.099
BELLEN, H. M. V. Indicadores de sustentabilidade: uma análise comparativa. São Paulo: Editora FGV, 2005.
BOSSEL, H. Earth at a crossroads. Paths to a sustainable future. U.K.: Cambridge University Press, 1998.
BRASIL. Ministério da Educação. Censo Escolar. Brasília: Ministério da Educação, 2010. Available at: <www.inep.gov.br>. Accessed on: Sept. 3, 2015.
BROCKLESBY, M. A.; FISHER, E. Community development in sustainable livelihoods approaches–an introduction. Community Development Journal, v. 38, n. 3, p. 185-198, 2003. http://dx.doi.org/10.1093/cdj/38.3.185
CAETANO, P. M. D. Em busca do Graal do indicador ambiental sintético único: Contribuições da Termodinâmica e da Teoria da Informação. Revista Brasileira de Ciências Ambientais, n. 30, p. 11-20, 2013.
CARLI, R.; DOTOLI, M.; PELLEGRINO, R. Multi-criteria decision-making for sustainable metropolitan cities assessment. Journal of Environmental Management, v. 226, p. 46-61, 2018. https://doi.org/10.1016/j.jenvman.2018.07.075
CARLSSON, L.; CALLAGHAN, E.; MORLEY, A.; BROMAN, G. Food System Sustainability across Scales: A Proposed Local-To-Global Approach to Community Planning and Assessment. Sustainability, v. 9, n. 6, p. 1061, 2017. https://doi.org/10.3390/su9061061
CARMO, J. C. B. Curitiba Metropolitan Region planning as a study object: analysis of literature production from 1974 to 2006. Revista Brasileira de Gestão Urbana, v. 9, n. 1, p. 7-18, 2017. http://dx.doi.org/10.1590/2175-3369.009.001.ao01
CAVALCANTI, C. O.; LIMONT, M.; DZIEDZIC, M.; FERNANDES, V. Sustainability assessment methodology of urban mobility projects. Land Use Policy, v. 60, p. 334-342, 2017a. http://dx.doi.org/10.1016/j.landusepol.2016.11.005
CAVALCANTI, C. O.; LIMONT, M.; DZIEDZIC, M.; FERNANDES, V. Sustainability of urban mobility projects in the Curitiba metropolitan region. Land Use Policy, v. 60, p. 395-402, 2017b. http://dx.doi.org/10.1016/j.landusepol.2016.11.015
CENTRULO, T.; MOLINA, N.; MALHEIROS, T. Indicadores de sustentabilidade: proposta de um barômetro de sustentabilidade estadual. Revista Brasileira de Ciências Ambientais, v. 30, p. 33-45, 2013.
Built capital and sustainable development
145
RBCIAMB | n.50 | dez 2018 | 128-148
CHAMPOLLION, P. Territory and territorialization: present state of the caenti thought. In: INTERNATIONAL CONFERENCE OF TERRITORIAL INTELLIGENCE, 2006. Anais… Alba Iulia, 2006.
COMOLLI, P. Sustainability and growth when manufactured capital and natural capital are not substitutable. Ecological Economics, v. 60, n. 1, p. 157-167, 2006. http://doi.org/10.1016/j.ecolecon.2005.11.018
COUTINHO, S. M. V. Análise de um processo de criação de indicadores de desenvolvimento sustentável no município de Ribeirão Pires SP. Tese (Doutorado) – Departamento de Saúde Ambiental, Faculdade de Saúde Pública, Universidade de São Paulo, São Paulo, 2006.
COX, D.; FRERE, M.; WEST, S.; WISEMAN, J. Developing and using local community wellbeing indicators: learning from an experience of Community Indicators Victoria. Australian Journal of Social Issues, v. 45, n. 1, p. 71-88, 2010. https://doi.org/10.1002/j.1839-4655.2010.tb00164.x
DALLABRIDA, V. R. Governança territorial e desenvolvimento: uma introdução ao tema. Governança Territorial e Desenvolvimento: descentralização político-administrativa, estruturas subnacionais de gestão do desenvolvimento e capacidades estatais. Rio de Janeiro: Garamond, 2011.
FLORA, C. B. Social capital and community problem solving: combining local and scientific knowledge to fight invasive species. In: FALK, I.; SURRATA, K.; SUWONDO, K. (orgs.). Community Management of Biosecurity, Special Copublication. Indonesia: Journal of Interdisciplinary Development Studies; Australia: Learning Communities International Journal of Learning in Social Contexts, 2008. p. 30-39.
FÜRST, C.; HELMING, K.; LORZ, C.; MÜLLER, F.; VERBURG, P. H. Integrated land use and regional resource management–A cross-disciplinary dialogue on future perspectives for a sustainable development of regional resources. Journal of Environmental Management, v. 127, suppl., p. S1-S5, 2013. https://doi.org/10.1016/j.jenvman.2012.12.015
FURTADO, B. A.; LIMA NETO, V. C.; KRAUSE, C. Estimativas do déficit habitacional brasileiro (2007-2011) por municípios (2010). Brasília: IPEA, 2013.
FURTADO, C. O Mito do Desenvolvimento Econômico. Rio de Janeiro: Paz e Terra, 1974.
GALLI, A.; ĐUROVIĆ, G.; HANSCOM, L.; KNEŽEVIĆ, J. Think globally, act locally: Implementing the sustainable development goals in Montenegro. Environmental Science & Policy, v. 84, p. 159-169, 2018. https://doi.org/10.1016/j.envsci.2018.03.012
GIATTI, L. L.; FREITAS, C. M. D.; NASCIMENTO, P. R.; LANDIN, R.; GAVIOLLI, J.; CUTOLO, S. A.; MARIA, N. C.; CARBONE, A. S.; TOLEDO, R. F. Estudo de distintos níveis holárquicos para uma região metropolitana por meio da aplicação de Indicadores de sustentabilidade ambiental e de saúde. Revista Brasileira de Ciências Ambientais, v. 30, p. 79-88, 2013.
GINÉ-GARRIGA, R.; FLORES-BAQUERO, Ó.; DE PALENCIA, A. J. F.; PÉREZ-FOGUET, A. Monitoring sanitation and hygiene in the 2030 Agenda for Sustainable Development: a review through the lens of human rights. Science of the Total Environment, v. 580, p. 1108-1119, 2016. https://doi.org/10.1016/j.scitotenv.2016.12.066
GRIMONI, J.; GALVAO, L. C.; UDAETA, M. Iniciação a Conceitos de Sistemas Energéticos para o Desenvolvimento Limpo. São Paulo: EdUSP, 2004. v. 58.
HEGARTY, K.; HOLDSWORTH, S. Weaving complexity and accountability: approaches to higher education learning design (HELD) in the built environment. Environment, Development and Sustainability, v. 17, n. 2, p. 239-258, 2015. https://doi.org/10.1007/s10668-015-9626-1
HENDRICKSON, D. J. Community indicators and sustainable consumption: a blended approach toward implementation. Canadian Journal of Urban Research, v. 19, n. 1, p. 111-133, 2010.
Kauling, M.F. et al.
146
RBCIAMB | n.50 | dez 2018 | 128-148
HOROCHOVSKI, R. R.; JUNCKES, I. J.; MURARO, C. J. L. Participação e planejamento em um programa de desenvolvimento regional sustentável. Revista Brasileira de Ciências Ambientais, v. 20, p. 49-65, 2011.
KALTENBORN, B. P.; LINNELL, J. D.; BAGGETHUN, E. G.; LINDHJEM, H.; THOMASSEN, J.; CHAN, K. M. Ecosystem Services and Cultural Values as Building Blocks for ‘The Good life’. A Case Study in the Community of Røst, Lofoten Islands, Norway. Ecological Economics, v. 140, p. 166-176, 2017. https://doi.org/10.1016/j.ecolecon.2017.05.003
KARVONEN, M. M. Natural versus manufactured capital: win–lose or win–win? A case study of the Finnish pulp and paper industry. Ecological Economics, v. 37, n. 1, p. 71-85, 2001. http://dx.doi.org/10.1016/S0921-8009(00)00265-2
KLOPP, J. M.; PETRETTA, D. L. The urban sustainable development goal: Indicators, complexity and the politics of measuring cities. Cities, v. 63, p. 92-97, 2017. https://doi.org/10.1016/j.cities.2016.12.019
KUSAKABE, E. Advancing sustainable development at the local level: The case of machizukuri in Japanese cities. Progress in Planning, v. 80, p. 1-65, 2013. https://doi.org/10.1016/j.progress.2012.06.001
LI, C.; LI, J. Assessing Urban Sustainability Using a Multi-Scale, Theme-Based Indicator Framework: A Case Study of the Yangtze River Delta Region, China. Sustainability, v. 9, n. 11, p. 2072, 2017. https://doi.org/10.3390/su9112072
LU, Y.; GENG, Y.; LIU, Z.; COTE, R.; YU, X. Measuring sustainability at the community level: An overview of China’s indicator system on National Demonstration Sustainable Communities. Journal of Cleaner Production, v. 143, p. 326-335, 2017. https://doi.org/10.1016/j.jclepro.2016.12.105
LUPOLI, C. A.; MORSE, W. C. Assessing the local impacts of volunteer tourism: Comparing two unique approaches to indicator development. Social Indicators Research, v. 120, n. 2, p. 577-600, 2015.
MAES, W. H.; FONTAINE, M.; RONGÉ, K.; HERMY, M.; MUYS, B. A quantitative indicator framework for stand level evaluation and monitoring of environmentally sustainable forest management. Ecological Indicators, v. 11, n. 2, p. 468-479, 2011. http://dx.doi.org/10.1016/j.ecolind.2010.07.001
MALHEIROS, T. F.; COUTINHO, S. M. V.; PHILIPPI JR., A. Indicadores de Sustentabilidade: uma abordagem conceitual. In: PHILIPPI JR., A.; MALHEIROS, T. F. (Orgs.). Indicadores de sustentabilidade e gestão ambiental. Barueri: Manole, 2012. p. 31-76.
MARTINET, V. A characterization of sustainabilitywithindicators. Journal of Environmental Economics and Management, v. 61, n. 2, p. 183-197, 2011. http://dx.doi.org/10.1016/j.jeem.2010.10.002
MARTIRE, S.; TUOMASJUKKA, D.; LINDNER, M.; FITZGERALD, J.; CASTELLANI, V. Sustainability impact assessment for local energy supplies’ development–The case of the alpine area of Lake Como, Italy. Biomass and Bioenergy, v. 83, p. 60-76, 2015. http://dx.doi.org/10.1016/j.biombioe.2015.08.020
MASCARENHAS, A.; COELHO, P.; SUBTIL, E.; RAMOS, T. B. The role of common local indicators in regional sustainability assessment. Ecological Indicators, v. 10, n. 3, p. 646-656, 2010. http://dx.doi.org/10.1016/j.ecolind.2009.11.003
MAYER, A. L. Strengths and weaknesses of common sustainability indices for multidimensional systems. Environment International, v. 34, n. 2, p. 277-291, 2008. https://doi.org/10.1016/j.envint.2007.09.004
MAX-NEEF, M. Desarollo a escala humana: conceptos, aplicaciones y reflexiones. Montevideo: Nordan Comunidad, REDES, 1993.
MEADOWS, D. H. Indicators and information systems for sustainable development. Hartland, 1998.
MULDER, K.; COSTANZA, R.; ERICKSON, J. The contribution of built, human, social and natural capital to quality of life in intentional and unintentional communities. Ecological Economics, v. 59, p. 13-23, 2006. http://dx.doi.org/10.1016/j.ecolecon.2005.09.021
Built capital and sustainable development
147
RBCIAMB | n.50 | dez 2018 | 128-148
O’CONNOR, M. Natural capital. Environmental valuation in Europe. Policy Research Brief Number 3. Cambridge: Cambridge Research for the Environment, 2000.
PARKIN, S.; SOMMER, F.; UREN, S. Sustainable development: understanding the concept and practical challenge. Proceedings of the Institution of Civil Engineers. Engineering Sustainability, v. 156, n. 1, p. 19-26, 2003. https://doi.org/10.1680/ensu.2003.156.1.19
PATEL, Z.; GREYLING, S.; SIMON, D.; ARFVIDSSON, H.; MOODLEY, N.; PRIMO, N.; WRIGHT, C. Local responses to global sustainability agendas: learning from experimenting with the urban sustainable development goal in Cape Town. Sustainability Science, v. 12, n. 5, p. 785-797, 2017. https://doi.org/10.1007/s11625-017-0500-y
PHILIPPI JR., A.; MALHEIROS, T. F. Indicadores de sustentabilidade e gestão ambiental. Barueri: Manole, 2012.
POLANYI, K. A Subsistência do Homem: ensaios e correlatos. Rio de Janeiro: Contra Ponto, 2012.
QUEIROZ RIBEIRO, L. C.; MOURA, R.; DELGADO, P.; DA SILVA, É. T.; RODRIGUES, J. M.; RIBEIRO, M. G.; ZANINELLI, L. Níveis de integração dos municípios brasileiros em RMs, RIDEs e AUs à dinâmica da metropolização. Relatório de pesquisa. Rio de Janeiro: Observatório das Metrópoles, 2012.
RAMOS, T. B.; CAEIRO, S. Meta-performance evaluation of sustainability indicators. Ecological Indicators, v. 10, n. 2, p. 157-166, 2010. https://doi.org/10.1016/j.ecolind.2009.04.008
SACHS, I. Caminhos para o desenvolvimento sustentável. Rio de Janeiro: Garamond, 2006.
______. Desenvolvimento: includente, sustentável, sustentado. Rio de Janeiro: Garamond, 2008. 151 p.
SANTANA, J. S.; GUEDES, C. A. M.; VILLELA, L. E. Desenvolvimento territorial sustentável e desafios postos por megaempreendimentos: o caso do município de Itaguaí-RJ. Cadernos EBAPE.BR, v. 9, n. 3, p. 846-867, 2011. http://dx.doi.org/10.1590/S1679-39512011000300009
SCHWARZ, N. Urban form revisited—Selecting indicators for characterising European cities. Landscape and Urban Planning, v. 96, n. 1, p. 29-47, 2010. https://doi.org/10.1016/j.landurbplan.2010.01.007
SICHE, R.; AGOSTINHO, F.; ORTEGA, E.; ROMEIRO, A. Índices versus indicadores: precisões conceituais na discussão da sustentabilidade de países. Ambiente & Sociedade, v. 10, n. 2, p. 137-148, 2007. http://dx.doi.org/10.1590/S1414-753X2007000200009
SILVA, G. J. C. da; FORTUNATO, W. L. L. Infraestrutura e Crescimento: Uma Avaliação do Caso Brasileiro no Período 1985-1998. In: ENCONTRO REGIONAL DE ECONOMIA, 12., 2007. Fórum BNB de Desenvolvimento. 2007.
SIRGY, M. J. Theoretical perspectives guiding QOL indicator projects. Social Indicators Research, v. 103, n. 1, p. 1-22, 2011. http://dx.doi.org/10.1007/s11205-010-9692-6
SOUZA, C. M. M.; SAMPAIO, C. A. C.; ZUNIGA, C. H.; PASCO, A. D.; AUMOND, J. J. Diagnóstico e construção de indicadores socioambientais participativos: experiências de um Programa de Extensão. Revista Brasileira de Ciências Ambientais, n. 30, 2013.
UNITED NATIONS. Agenda 21. In: CONFERÊNCIA DAS NAÇÕES UNIDAS SOBRE MEIO AMBIENTE E DESENVOLVIMENTO, 1992, Rio de Janeiro. Rio de Janeiro: United Nations, 1992. Available at: <http://www.un.org/geninfo/bp/enviro.html>. Accessed on: Nov. 22, 2014.
______. Habitat III – United Nations Conference on Housing and Sustainable Urban Development. Quito, Ecuador: United Nations, 2017. Available at: <http://habitat3.org/wp-content/uploads/Habitat-III-the-conference.pdf>. Accessed on: Sept. 15, 2017.
Kauling, M.F. et al.
148
RBCIAMB | n.50 | dez 2018 | 128-148
UNITED NATIONS EDUCATIONAL, SCIENTIFIC AND CULTURAL ORGANIZATION (UNESCO). Thematic Indicators to Monitor the Education 2030 Agenda. Unesco, 2015. Available at: <http://www.uis.unesco.org/Education/Documents/43-indicators-to-monitor-education2030.pdf>. Accessed on: Jan. 19, 2016.
ZEIJL-ROZEMA, A. V.; MARTENS, P. An adaptive indicator framework for monitoring regional sustainable development: a case study of the INSURE project in Limburg, The Netherlands. Sustainability: Science, Practice and Policy, v. 6, n. 1, p. 6-17, 2010. https://doi.org/10.1080/15487733.2010.11908038
ZHANG, X.; LI, H. Urban resilience and urban sustainability: What we know and what do not know? Cities, v. 72, part A, p. 141-148, 2018. https://doi.org/10.1016/j.cities.2017.08.009
ZHANG, X.; WU, Y.; SHEN, L. An evaluation framework for the sustainability of urban land use: A study of capital cities and municipalities in China. Habitat International, v. 35, n. 1, p. 141-149, 2011. https://doi.org/10.1016/j.habitatint.2010.06.006
This is an open access article distributed under the terms of the Creative Commons license.