Divakar Thesis
100
Copyright by Kiran Divakar 2011
-
Upload
shridhar-mathad -
Category
Documents
-
view
219 -
download
0
Transcript of Divakar Thesis

Copyright
by
Kiran Divakar
2011

The Thesis Committee for Kiran Divakar
Certifies that this is the approved version of the following thesis:
Circuit Design and Device Modeling of
Zinc-Tin Oxide TFTs
APPROVED BY
SUPERVISING COMMITTEE:
Ananth Dodabalapur, Supervisor
T R Viswanathan, Co-Supervisor
Supervisors:

Circuit Design and Device Modeling of
Zinc-Tin Oxide TFTs
by
Kiran Divakar, BE
Thesis
Presented to the Faculty of the Graduate School of
The University of Texas at Austin
in Partial Fulfillment
of the Requirements
for the Degree of
Master of Science in Engineering
The University of Texas at Austin
May 2011

Dedication
Dedicated to my parents
and my brother

v
Acknowledgements
I would like to thank Prof. Ananth Dodabalapur, my supervisor, for giving me the
opportunity to work with him on this really interesting topic. I am grateful for his
constant support and guidance throughout the course of my thesis.
I am thankful to Prof. T.R Viswanathan, my co-supervisor, for the words of
wisdom he has passed onto me and for the constant guidance and encouragement he has
offered me. I am amazed by the depth of his knowledge in circuits and inspired by his
passion for teaching and research. I would also like to express my gratitude to Prof.
Lakshmi Viswanathan for taking out time to guide me through my work.
I am extremely grateful to Tanvi Joshi, my thesis partner, for all the effort she has
put in to make our work successful. I would also like to thank Chen-Guan Lee and Brian
Cobb for their numerous technical inputs and ideas. I am also thankful to all the other
members of our research group, especially Christopher Lombardo and Davianne Duarte
for their support, discussion and friendship.
Most importantly, I would like to thank my family and friends who have stood
beside me throughout and helped me get to where I am now.
vi
Abstract
Circuit Design and Device Modeling of
Zinc-Tin Oxide TFTs
Kiran Divakar, MSE
The University of Texas at Austin, 2011
Supervisors: Ananth Dodabalapur, T R Viswanathan
Amorphous Oxide Semiconductors (AOS) are widely being explored in the field
of flexible and transparent electronics. In this thesis, solution processed zinc-tin oxide
(ZTO) n-channel TFT based circuits are studied. Inverters, single stage amplifiers and
ring oscillators are designed, fabricated and tested. 7-stage ring oscillators with output
frequencies up to 106kHz and 5-stage ring oscillators with frequencies up to 75kHz are
reported.
A stable three stage op-amp with a buffered output is designed for a gain of
39.9dB with a unity gain frequency of 27.7kHz. A 7-stage ring oscillator with output
frequency close to 1MHz is simulated and designed. The op-amp and the ring oscillator
are ready to be fabricated and tested. An RPI model for a-Si, adapted to fit the ZTO
device characteristics, is used for simulation.
Development of a new model based on the physics behind charge transport in
ZTO devices is explored. An expression for gate bias dependent mobility in ZTO devices
is derived.
vii
Table of Contents
List of Tables ...........................................................................................................x
List of Figures. ....................................................................................................... xi
CHAPTER 1 : INTRODUCTION ..............................................................................1
1.1 Thin-Film Transistors .....................................................................................2
1.1.1 TFT Device Configurations ...................................................................3
1.1.2 TFT Applications ...................................................................................4
1.2 Amorphous Oxide Semiconductors ................................................................5
1.3 Fabrication Process for ZTO TFTs .................................................................6
1.4 Organization of Thesis ....................................................................................9
CHAPTER 2 : EDA TOOLS SETUP AND LAYOUT DETAILS ................................10
2.1 EDA Setup ………………………………………………………….…….. 10
2.1.1 Schematic design in Cadence...............................................................11
2.1.2 Layout in Tanner EDA – L-Edit ..........................................................12
2.1.3 Layout v/s Schematic (LVS) check in Tanner EDA ............................14
2.2 Masks Designed ............................................................................................15
2.2.1 Mask 1 – Ring Oscillators and Amplifiers ..........................................16
2.2.2 Mask 2 – Op-amp.................................................................................17
2.2.3 Mask 3 – Extended Gate Configuration I ............................................20
2.2.4 Mask 4 – Extended Gate Configuration II ...........................................22
2.3 Conclusion ……………………………………………………….……….. 24

viii
CHAPTER 3 : ZTO BASED CIRCUITS .................................................................25
3.1 Inverter……… ..............................................................................................25
3.2 Amplifier… ...................................................................................................27
3.3 Ring Oscillator ..............................................................................................29
3.4 RPI Model.. ...................................................................................................35
3.5 Conclusion ………………………………………………….…………….. 39
CHAPTER 4 : OPERATIONAL AMPLIFIER ..........................................................40
4.1 Base Op-amp Design ....................................................................................40
4.2 Modifications to Base Op-amp Design .........................................................43
4.3 New Op-amp Design.....................................................................................47
4.4 Conclusion …………………………………………………….………….. 54
CHAPTER 5 : DEVICE MODELING OF ZTO TFTS ............................................55
5.1 Charge transport ............................................................................................55
5.1.1 Crystalline Semiconductors .................................................................56
5.1.2 Amorphous Semiconductors ................................................................56
5.1.3 Charge transport in ZTO ......................................................................58
5.2 Expression for Effective Mobility in ZTO Devices ......................................58
5.2.1 RPI Model Simulations ........................................................................61
5.3 Conclusion …………………………………………………….………….. 64
CHAPTER 6 : CONCLUSION AND FUTURE WORK .............................................65
6.1 Conclusion ………………………………………………………………... 65
6.2 Future Work ..................................................................................................66
6.2.1 Circuit Design ......................................................................................66
6.2.2 Device Modeling ..................................................................................67

ix
APPENDIX A ..........................................................................................................68
APPENDIX B ..........................................................................................................72
APPENDIX C ..........................................................................................................76
APPENDIX D ..........................................................................................................80
REFERENCES ..........................................................................................................83

x
List of Tables
Table 3.1: List of common source amplifiers designed and fabricated in mask 4
……………………………………………………………….….… 38
Table 3.2: List of ring oscillators designed and fabricated in mask 4 ................39
Table 4.1: Simulation results obtained for S-M op-amp with SPICE Level 1 Model
...........................................................................................................43
Table 4.2: Simulation results achieved for the new op-amp with modified RPI a-Si
model.................................................................................................53

xi
List of Figures
Figure 1.1: Four possible TFT device configurations – (a) top-gate staggered,
(b) top-gate coplanar, (c) bottom-gate staggered (top contact), and
(d) bottom-gate coplanar (bottom contact) .........................................3
Figure 1.2: Flexible transparent TFT sheet ...........................................................5
Figure 1.3: ZTO TFT Fabrication process ............................................................8
Figure 2.1: Schematic of an inverter designed in Cadence .................................12
Figure 2.2: Layout of an inter-digitated device (W=1000u, L 4u) ......................12
Figure 2.3: Layout of an inverter in L-Edit .........................................................13
Figure 2.4: Layout of the entire wafer from mask 3 (all layers overlapped).......14
Figure 2.5: Snapshot of entire wafer with all layers separated ............................15
Figure 2.6: (a) Layout of a device in mask 1 with 100u x 100u internal pads,
(b) Enlarged version of the device showing gate overlap of (1u) and
semiconductor overlap of (5u) ..........................................................17
Figure 2.7: A device in mask 2 (W/L = 4u/4u) laid out in three configurations:
(a) overlap of 1u, (b) overlap of 2u, and (c) overlap of 2u with patterned
semiconductor ...................................................................................19
Figure 2.8: Layout of a device in mask 3 with an extended gate configuration
...........................................................................................................20
Figure 2.9: Layout of a 4-point probe device from mask 3 (L = 100u, W = 1000u,
probe distance from channel edge =10u, probe thickness=10u distance
between probes = 60u) ......................................................................21
Figure 2.10: (a) A device with 5u source/drain widths and 50u extended gate
(b) A 3-stage ring oscillator with 50u extended gate devices ...........22

xii
Figure 2.11: Photomask of mask 4 ........................................................................24
Figure 3.1: (a) Schematic of an inverter with active load (b) Snapshot of a layout of
an inverter (I3) in mask 3 (aspect ratio of driver –300u/4u and load –
60u/4u) ..............................................................................................26
Figure 3.2: (a) Voltage transfer characteristic of I3 shown in layout above
(b) Incremental gain plot of I3 ..........................................................27
Figure 3.3: (a) Schematic of a CS amplifier, (b) Small signal input and output
waveforms (c) AC gain plot of the amplifier ....................................29
Figure 3.4: (a) Schematic of a 7-stage ring oscillator, (b) Snapshot of a layout of
7-stage ring oscillator (driver – 600u/4u, load – 30u/4u) .................30
Figure 3.5: Oscillation frequency and propagation delay per stage as a function of
VDD ..................................................................................................31
Figure 3.6: Oscillations observed at the output of a 7-stage ring oscillator (76.5kHz
at 11V VDD) .....................................................................................31
Figure 3.7: Oscillations observed at the output of a 5-stage ring oscillator (driver –
300u/9u, load – 30u/9u) (75kHz at 7V VDD) ..................................32
Figure 3.8: SPICE Level 1 simulation results for (a) 7-stage oscillator (379kHz and
6.4V swing with 11V supply) and (b) 5-stage oscillator (164kHz and
2.9V swing with 7V supply) .............................................................33
Figure 3.9: Comparison of experimental data and SPICE Level 1 model simulations
for Transfer Characteristic Curve (Id – Vgs) of W=80um, L=4um ZTO
Device ...............................................................................................34
Figure 3.10: Comparison of experimental data and SPICE Level 1 model simulations
for Output I-V (Id – Vds) Curves of W=80um, L= 4um ZTO Device
……………………………………………………………………. 35

xiii
Figure 3.11: Comparison of experimental data and RPI a-Si model simulations for
Transfer Characteristic Curve (Id – Vgs) of W=80um, L=4um ZTO
Device ...............................................................................................36
Figure 3.12: Comparison of experimental data and modified RPI a-Si model
simulations for Output I-V (Id – Vds) Curves of W=80um, L= 4um ZTO
Device ...............................................................................................36
Figure 3.13: Output simulation with RPI model for 7-stage ring oscillator
(78kHz frequency and 8V output swing with 11V supply) ..............37
Figure 3.14: Output simulation with RPI model for 5-stage ring oscillator
(62.9kHz frequency and 3V output swing at 7V supply) .................38
Figure 4.1: Schematic and block diagram of Tsividis and Gray op-amp (© 1976
IEEE) [24] .........................................................................................41
Figure 4.2: Schematic of Sarpeshkar and Moini op-amp ....................................42
Figure 4.3: Block diagram of the new op-amp design ........................................47
Figure 4.4: Schematic of (a) Fully differential input stage,
(b) Differential-to-single-ended converter ........................................49
Figure 4.5: Schematic of (a) second stage and (b) third stage of the op-amp .....49
Figure 4.6: Schematic of the output buffer stage ................................................50
Figure 4.7: Schematic of the new op-amp ...........................................................51
Figure 4.8: Layout of the new op-amp showing the various stages ....................52
Figure 4.9: Magnitude-phase plot of the op-amp. (DC gain = 39.9dB,
phase margin = 450, unity gain frequency = 27.7kHz, and
gain margin = 3.89dB) ......................................................................53
Figure 5.1: Charge transport in MTR model .......................................................57

xiv
Figure 5.2: Fitting of contact resistance for Device1 (W/L = 80u/4u) does not fit
Device2 [W/L = 81u/4u] ...................................................................62
Figure 5.3: Id–Vds data fits better at higher Vgs ( 3, 4, 5V) than lower Vgs
(0, 1, 2 V) values ...............................................................................63
Figure 5.4: Gate leakage (Igd) observed in small device (W/L = 14u/4u) at high Vgs
and low Vds, cannot be seen in simulations .....................................63

1
CHAPTER 1: Introduction
In today's technologically expanding world, transparent electronic devices made
on flexible substrates are widely expected to fill key niches that are unsuitable for silicon
based electronics. Improvements in fabrication methodologies and emergence of new
materials have already led to manufacturing of low cost TFT devices that are flexible,
lightweight and shock resistant – properties that have led to applications in high-
resolution displays, wearable computers, sensors [1,2] and hybrid flexible electronic
systems [3]. Amorphous oxide semiconductors (AOSs) are at the heart of this
development due to their high carrier mobility, transparency and relatively high stability,
making them the ideal choice for manufacturing transparent displays and display sensors.
Recently there has been a lot of interest in designing analog circuits with AOS
based TFTs, including inverters, amplifiers and oscillators, in order to use them as
building blocks for low cost sensor applications and data converters [4-7]. This study
deals with the design and fabrication of analog circuits, such as inverters, oscillators and
amplifiers, using solution processed zinc-tin oxide (ZTO) transistors, one of the more
promising AOSs. The ultimate aim is to design an operational amplifier (op-amp) using
ZTO based transistors with acceptable performance (gain, bandwidth and phase). A
device model which accurately replicates the behavior of ZTO based transistors is also
proposed in the process and illustrated.

2
1.1 THIN-FILM TRANSISTORS
A thin-film transistor (TFT) is a special kind of field-effect transistor which is
fabricated by depositing a thin film of semiconductor layer, along with a dielectric layer
and metallic contacts, over a supporting substrate. The very first TFT was demonstrated
at RCA Laboratories (Princeton) in 1962 using cadmium sulphide as semiconductor.
But the first commercially successful TFTs, which used hydrogenated amorphous silicon
(a-Si:H) as the active layer, were produced only in the 1980’s. The key difference
between a TFT and a Metal-Oxide-Semiconductor FET (MOSFET) is that in a TFT the
semiconductor layer is deposited as a thin film layer (30nm to 100nm thickness) on an
insulating substrate, as opposed to the semiconductor itself being the substrate/body
(100um – 1mm deep) in a MOSFET.
TFTs can be made using a wide variety of semiconductor materials. The main
contenders are amorphous silicon, microcrystalline silicon, polysilicon, amorphous metal
oxides such as zinc-tin oxide and organic materials (referred to as Organic TFTs or
OTFTs). The most common substrate used in TFTs is glass, since the primary application
of TFTs is in liquid crystal displays. Since an insulating substrate is used in TFTs they
behave very similar to Silicon on Insulator (SOI) devices. The insulating substrate
ensures that TFTs have much lower parasitic capacitance, lower leakage with good
device isolation, reduced substrate-noise and reduced soft errors when compared to
conventional MOSFETs [8]. Also, unlike MOSFETs, since the active layer is deposited
rather than grown on the substrate, TFTs can have different device configurations by
varying the sequence of film deposition. Hence the optimal device configuration can be
chosen in the case of a TFT depending on the materials, process and application.

3
1.1.1 TFT Device Configurations
TFTs can have four possible device configurations as depicted in Figure 1.1. The
configurations are determined by the relative positioning of the source/drain with respect
to the gate electrode and the sequence in which the layers are deposited on the substrate.
The four configurations are broadly classified into top-gate [Figure 1.1 (a) and (b)] and
bottom-gate [Figure 1.1 (c) and (d)] depending on whether the gate electrode is above or
below the semiconductor layer. They are also classified as staggered [Figure 1.1 (a) and
(c)] or coplanar [Figure 1.1 (b) and (d)] depending on whether the source/drain electrodes
and gate electrode are on the opposite side or same side of the active layer. All the ZTO
TFTs fabricated for the current study use device configuration (c), generally referred to as
top-contact configuration.
Figure 1.1: Four possible TFT device configurations – (a) top-gate staggered,
(b) top-gate coplanar, (c) bottom-gate staggered (top contact), and
(d) bottom-gate coplanar (bottom contact)
Source Drain
Source Drain
Source Drain
Source Drain
Gate
Gate Gate
Substrate
Semiconductor
Dielectric
Substrate
Semiconductor
Dielectric
Substrate
Semiconductor
Dielectric
Substrate
Gate
Dielectric
Semiconductor
(a) (b)
(c) (d)

4
1.1.2 TFT Applications
The most widespread application of TFTs is in display panels, especially in liquid
crystal displays (LCDs). The transistors are fabricated right alongside the display
elements on the panel, thus improving image stability and reducing crosstalk. To use
silicon wafer to bond to the panel and then etch away the unused areas would either yield
low densities or be expensive for high yields with required precision over the entire
panel. Instead, the panels can be coated with a thin film of semiconductor and then etched
to form the transistors [9]. The relatively high switching speeds of the TFTs as compared
to the display elements such as liquid crystals, allows the displays to track fast moving
images, thus enabling gaming and all other forms of multimedia.
TFTs are widely used commercially in many color LCD TVs and monitors. TFT
panels are extensively used in digital radiography applications as well. The new
AMOLED (Active Matrix Organic light-emitting diode) screens also contain a TFT layer.
The major drawback of TFTs is the low mobility of its charge carriers, when compared to
conventional MOSFETs, which reduces its switching speed and current drive capability.
But for key applications of TFTs, like sensors and display arrays, a few microamperes of
current at fairly low frequencies (few megahertz) is sufficient.
By using polymer and organic materials as the semiconductor active layer
(OTFTs), TFTs have found wide range of potential applications in display switches,
RFID tags, optical devices like LEDs and in chemical and biological sensors [1]. The use
of flexible polymers as substrate has further enhanced the applications of TFTs. By using
transparent semiconductors and transparent electrodes, such as indium tin oxide (ITO),
TFT devices can be made completely transparent [2]. These TFTs can be used to make

5
electronic paper, smart tags and see-through displays (Figure 1.2) which can be even put
on car windshields. Also, the use of solution processed TFTs further reduces the
fabrication cost, opening avenues to low cost high yield manufacturing.
Figure 1.2: Flexible transparent TFT sheet
(Reprinted by permission from Macmillan Publishers Ltd:
[Nature] (K. Nomura, et. al, [2]), © (2004))
1.2 AMORPHOUS OXIDE SEMICONDUCTORS
Amorphous oxide semiconductors (AOSs) are of particular interest especially in
the field of flexible displays due to their high carrier mobility, transparency at visible
wavelengths and excellent operational stability. The transparency is owing to their wider
bandgap as compared to Silicon. The main AOS materials currently used to make
transparent devices are zinc oxide (ZnO), tin oxide (SnO), indium oxide (In2O3),
aluminum indium oxide (AIO), zinc-tin oxide (ZTO), indium tin oxide (ITO) and indium
gallium zinc oxide (IGZO) [10].
The competitors to AOS materials as the active layer of TFTs are polycrystalline
silicon, amorphous silicon (a-Si) and organic semiconductors. Even though

6
polycrystalline silicon exhibits higher mobility, it is not preferred over amorphous
materials for making TFTs due to its high processing temperature requirement and
uniformity issues. a-Si TFTs are widely used in active matrix liquid crystal displays
(AMLCD), but are hampered by its low current drive owing to its low mobility
(1.5 cm/V·s) [11]. Organic semiconductors provide a better alternative to a-Si with higher
mobility and lower processing temperature requirement which further reduces the
manufacturing cost. However, organic n-channel semiconductor materials have much
lower mobilities than p-channel ones and are also more environment sensitive, making
them unsuitable for logic applications [1].
AOSs have superior mobility, better air stability and transparency when compared
to a-Si and organic semiconductor materials. The higher mobility in AOSs is due to the
fact that conduction band metal orbitals are insensitive to bond angle distortions [2].
These properties make AOS based TFTs an attractive option for transparent electronics
such as active-matrix liquid crystal display (AMLCD), active-matrix organic light-
emitting diode (AMOLED) [12] and transparent display. They can also be used for
manufacturing electronic paper [13] and display drivers.
1.3 FABRICATION PROCESS FOR ZTO TFTS
A solution-based deposition process was used for the fabrication of ZTO TFTs for
this study. High-vacuum based deposition processes provide high device performance
and better uniformity but are expensive, while solution-based deposition processes have
low fabrication cost, large area deposition and high throughput, with device performance
comparable to high-vacuum based approaches [14]. As a result, solution processed oxide
semiconductors provide an attractive option for low cost electronics, ranging from

7
electronic paper and disposable electronics to RFID tags and sensors. The common
solution-based approaches are spin coating, inkjet printing, dip coating and spray coating.
Spin coating was used for fabricating the ZTO TFT devices used for this work.
The TFT devices were fabricated on a glass substrate and a patterned bottom-gate,
top-contact device architecture was employed. A patterned gate configuration was used to
minimize the overlap capacitance between the gate and the source/drain electrodes, while
a bottom gate approach helped in preventing a possible degradation of the characteristics
of the semiconductor layer due to deposition of oxide and gate layers on top of it. Top
contact architecture also allowed the source/drain metal (Aluminum (Al)) deposition to
be the last step since Al oxidizes at the higher temperatures required for the other
fabrication steps. A recessed gate configuration was used since recessed gate electrodes
exhibited lower off current, higher on/off ratio and improved sub-threshold slope [10].
The glass substrate was first etched (40nm in depth) with a reactive ion etcher
(RIE), followed by photolithography, before depositing the gate (40nm AuPd) using an
e-beam evaporator. Then the dielectric layer was deposited using spin coating. Zirconium
oxide (ZrO2) was used as the dielectric since it can be solution processed, has a high
dielectric constant, and combines well with ZTO to form a stable semiconductor-insulator
interface. The high dielectric constant of ZrO2 allows the dielectric layer to be thicker for
a required induced field, thus mitigating electron tunneling into the gate. It also forms a
smooth film surface when annealed at a relatively low temperature of 5000C, which is
critical to the stability of the transistor.

8
The active layer of ZTO was deposited next through another spin coating step.
The prebake process for the ZTO precursor film was also optimized to get better
uniformity, resulting in improved stability and performance [15].
The ZTO deposition was followed by patterning of the via through
photolithography and reactive ion etch. Silver (Ag), used as the via material, is then
deposited using an e-beam evaporator followed by a liftoff. The next step was to isolate
the devices by pattering the semiconductor through photolithography and reactive ion
etching. The source and drain (S/D) electrodes were then deposited (40nm Aluminum)
using thermal evaporator, after patterning through photolithography, followed by liftoff
to complete the fabrication process. Figure 1.3 below outlines all the above mentioned
steps involved in the fabrication process [10].
Figure 1.3: ZTO TFT Fabrication process
Glass substrate
5. Patterning for via using Photoresist (PR)
6. Via etching using RIE
7. Via (Ag) deposition and liftoff
8. Patterning for semiconductor etching
(a) (b)
(c) (d)
Glass substrate Glass substrateGlass substrate
Glass substrateGlass substrate Glass substrateGlass substrate
Glass substrateGlass substrate Glass substrateGlass substrate
1. Patterning the gate and etching the glass
2. AuPd deposition and liftoff
3. ZrO2 gate dielectric deposition
4. ZTO active layer deposition
(e) (f)
9. ZTO etching and liftoff
10. Patterning for S/D electrodes11. S/D electrode (Al) deposition and liftoff
ZTO
ZTO ZTO
ZTO ZTO
AuPdAuPd AuPd AuPd
AuPdAuPd
AuPdAuPdAuPd AuPd
ZrO2 ZrO2
ZrO2 ZrO2
ZrO2
Ag Ag
Ag
AlAl
PRPR
PR
PR
AuPd AuPd

9
Extended gate configurations, where the overlap of gate electrode with the source
and drain electrodes is much higher, were also tried. This configuration provided a much
more consistent underlying surface and facilitated the growth of a continuous film on top,
thus improving uniformity and performance at the cost of a higher overlap capacitance.
1.4 ORGANIZATION OF THESIS
The objective of this study is to show that high performance analog circuits can be
designed using ZTO based transistors, which can be used for practical applications.
Design of basic analog circuit elements like inverters, oscillators and amplifiers are
discussed and results reported. An accurate simulation model is also proposed for AOS
based transistors and is used to design an OPMAP with significant gain and bandwidth.
This thesis is organized into six separate chapters. Chapter 2 elaborates on the
simulation and layout setup that was used for designing the circuits and briefly talks
about the different layout mask runs tried. Chapter 3 deals with the design of basic analog
circuits that were implemented (inverters, oscillators and amplifiers) and their simulation
and lab results. Chapter 4 presents the design of an Operational Amplifier (op-amp) with
ZTO TFTs, based on simulations results obtained using a modified a-Si model. Chapter 5
discusses in detail about the need for an accurate simulation model for AOS based
processes, and outlines a proposal for a novel model based on the physics behind the
transport mechanisms involved in oxide semiconductors. Chapter 6 summarizes the tasks
accomplished and the lessons learned during the course of the study, and makes
recommendations for the future course of work.

10
CHAPTER 2: EDA Tools Setup and Layout Details
Electronic Design Automation (EDA) is a category of Computer Aided Design
(CAD) tools which help engineers to design and analyze their circuits at every stage of
the multistep design flow which includes circuit design, circuit simulations, synthesis,
timing analysis, and layout. A variety of tools are available to circuit designers, some of
which have integrated CAD suits to handle the entire design flow. A combination of two
such tools - Cadence Design Environment and Tanner EDA – was used for designing
circuits in this study.
This chapter delves into the tools setup that was used for circuit design and
discusses in detail the hybrid approach that was employed – combination of Cadence and
Tanner tools. The layout scheme used is also elaborated and a detailed description about
the various masks designed and fabricated is provided.
2.1 EDA SETUP
Cadence Design Environment is very popular in the industry and is widely used
for silicon based design methodologies. In Cadence, all aspects related to the technology
used for design are defined using an extensive database called 'techlib' which covers all
the required parameters to setup the flow. Defining these parameters for a new process
technology, especially a developing non-silicon process, is ponderous. Before embarking
on circuit designs with a new material system, an in-depth understanding of the
parameters and the Cadence platform is essential. Cadence simulator, Spectre, provides
an extensive circuit analysis platform and is quite easy to use. It also allows direct
integration of new compact models defined in VerilogA.
11
On the other hand, Tanner EDA provides a simpler and comparatively easy to
modify interface to setup the design flow for new processes. Its layout platform, L-Edit,
also has fairly simple tunable interfaces which can be used to define new layers and
modify DRC and extraction rules as per the process technology requirement.
The ZTO based process is defined using a hybrid approach which merges the best
aspects of both the environments. Cadence is used to design and simulate the circuits,
using its schematic editor and Spectre simulation environment, while Tanner EDA is
used to design the layouts for the circuits using L-Edit. The netlist generated using SPICE
simulations in Cadence is used to verify the equivalence of the schematic and layout.
This entire design flow is explained in detail in the following subsections.
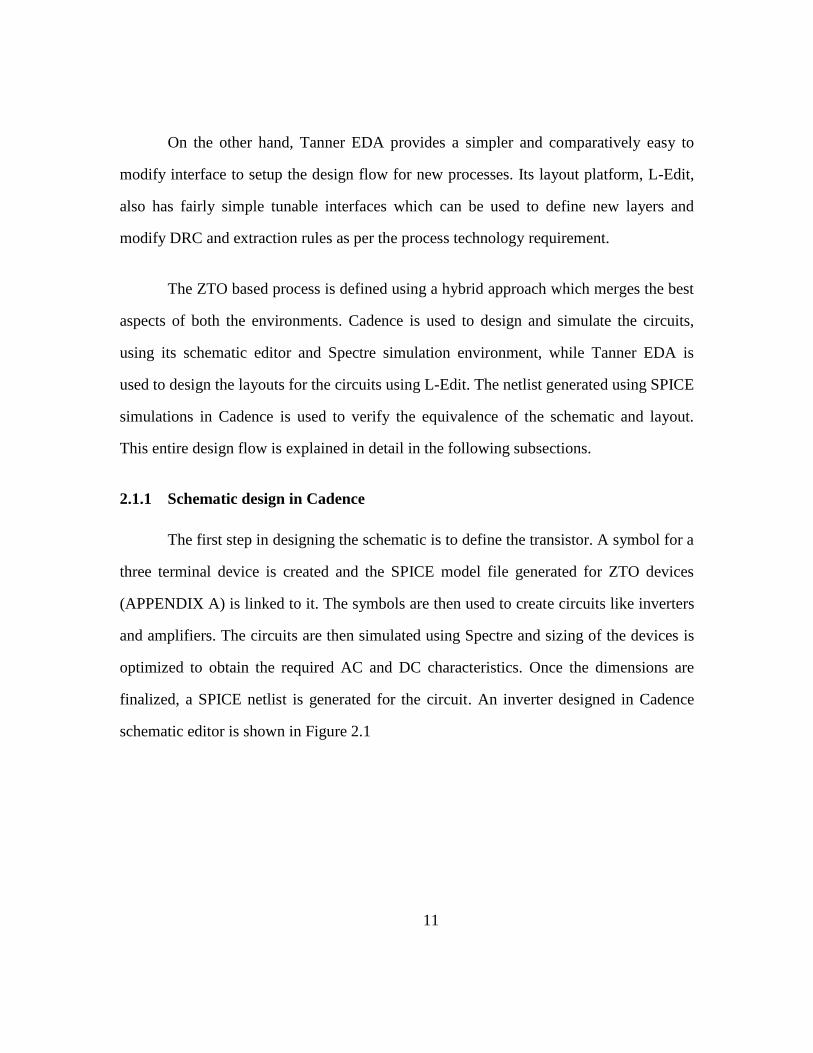
2.1.1 Schematic design in Cadence
The first step in designing the schematic is to define the transistor. A symbol for a
three terminal device is created and the SPICE model file generated for ZTO devices
(APPENDIX A) is linked to it. The symbols are then used to create circuits like inverters
and amplifiers. The circuits are then simulated using Spectre and sizing of the devices is
optimized to obtain the required AC and DC characteristics. Once the dimensions are
finalized, a SPICE netlist is generated for the circuit. An inverter designed in Cadence
schematic editor is shown in Figure 2.1

12
Figure 2.1: Schematic of an inverter designed in Cadence
2.1.2 Layout in Tanner EDA – L-Edit
Once the dimensions of the devices are determined, the circuit is laid out using
L-Edit. The various layers that are used in the layout for ZTO devices and related details
are illustrated in APPENDIX B. Devices with high aspect ratio are inter-digitated by
fingering the source and drain electrodes to reduce their area (Figure 2.2). Figure 2.3
shows the layout of an inverter with such a driver transistor. Pads (100u x 100u) are
provided for on-chip probing in either the via layer or the electrode layer. Thick metal
lines are used for interconnects (25u to 100u) and routing to reduce resistance and the
chances of breakage.
Figure 2.2: Layout of an inter-digitated device (W=1000u, L 4u)

13
Figure 2.3: Layout of an inverter in L-Edit
A few circuits require the provision of connecting external components like
resistors and capacitors. To allow this, bigger pads (2mm x 2mm) are provided around
the periphery of the die and connections are made to these pads from the circuits using
thick metal wires (100u). The boundary pads are separated by a minimum of 1mm to
allow for wire bonding of external components without shorting (Figure 2.4).
Once the layout is completed, design rule check (DRC) is used to analyze if there
are any layout violations. Violations include minimum spacing between layers, minimum
thickness of layers and minimum enclosure of layers, and are characteristics of the
fabrication process. New DRC rules can be set using the L-Edit interface. The set of DRC
rules that were used for the ZTO process is included in APPENDIX C.
On-wafer probing pad in via layer
On-wafer probing pad in electrode (Al) layer

14
Figure 2.4: Layout of the entire wafer from mask 3 (all layers overlapped)
2.1.3 Layout v/s Schematic (LVS) check in Tanner EDA
After conforming to all the DRC rules, the netlist is extracted from the layout.
Details about the extraction definition file are included in APPENDIX C. The netlist that
is extracted from L-Edit is then verified against the SPICE netlist that is generated from
Spectre using the LVS tool in Tanner. LVS ensures that the devices and their
connectivity match between both the netlists.
Once the LVS step is completed on the entire mask, it is ready to be fabricated.
The four layers are split into adjacent squares to form a 2" x 2"configuration (Figure 2.5).
Alignment marks are included in the masks in order to assist the alignment of the layers
Boundary Pad in electrode (Al) layer
Boundary Pad in via layer
Double sized padsfor two parallel external components
1000 mils
10
00
mils
250
mils
250 mils

15
during fabrication (APPENDIX D). This layout is then saved in a DXF format and sent
for creating the masks. The photomask received is made on glass with chromium and is
used for the fabrication process.
Figure 2.5: Snapshot of entire wafer with all layers separated
2.2 MASKS DESIGNED
Four different masks were designed during the course of this study. The different
circuits that were designed, the main features and modifications included, and the results
obtained from each of the mask runs are discussed below. Multiple copies of every circuit
and device designed were placed at different areas in the mask in order to increase the
probability of components working, given the process variations. This also aided in
Gate Layer : AuPd
Via Layer : Via Semiconductor Layer :Active
Electrode Layer : Al
2000
mils
2000 mils

16
learning the effects of non-uniform spinning of the ZTO solution. All the devices and
circuits included were numbered and labeled using AuPd gate layer.
2.2.1 Mask 1 - Ring Oscillators and Amplifiers
Multiple copies of the following circuits were included in mask 1 layout
- 13 different ring oscillators (one 3-stage, ten 5-stage and two 7-stage ring
oscillators)
- 13 inverters which were used to design the ring oscillators
- 4 different common source amplifiers (two with external load and the other
two with n-channel load)
- 1 cascode amplifier
- Buffers as standalone and as part of ring oscillators
- Single devices used for all the above circuits
- Test structures to measure capacitance values at different parts of the mask
(APPENDIX D)
- Alignment marks to help with mask alignment issues during fabrication
(APPENDIX D)
Minimum channel length used was 3u, which is the minimum possible feature
size of the process.
2mm x 2mm outer pads were used in order to allow wire bonding of external
resistors. All internal pads used for on-chip probing were 100u x 100u as shown
in Figure 2.6 (a), which is the layout of one of the devices in mask 1.
Gate overlap with source/drain was 1u. Semiconductor extended at least 5u
beyond the channel boundaries (Figure 2.6(b)).

17
Figure 2.6: (a) Layout of a device in mask 1 with 100u x 100u internal pads,
(b) Enlarged version of the device showing gate overlap of (1u) and
semiconductor overlap of (5u)
This mask exposed a lot of uniformity issues in the experimental results. A
number of components failed due to non-uniform deposition of the layers. The process
was tuned to improve on these shortcomings.
A few inverters were tested successfully with reasonable output characteristics but
low bandwidth. Some enhancement load amplifiers from this mask were also tested in the
lab which gave a low-frequency gain of around 8 to 9 (~18 db) with a unity-gain
bandwidth of around 5kHz. These results are presented in detail in Chapter 3.
2.2.2 Mask 2 – Op-amp
The major change in this mask was the addition of a multistage op-amp
(discussed in Chapter 4) along with the basic circuit blocks designed in mask 1. Various
layout configurations for devices were tried out in this mask to root-cause the non-
uniformity observed in mask 1. Sharp edges were observed at the boundary of the gate
(a) (b)

18
layer in some of the devices fabricated in mask 1. Devices with different gate to
source/drain overlaps were laid out to confirm whether this effect was related to narrow
overlap regions between gate and source/drain. Devices with patterned semiconductor
layer were also included in the mask to check for spreading of charge carriers. The
features of this mask were:
Multiple copies of the following circuits were included in mask 2 layout
- 2 copies of a three stage S-M op-amp (discussed in Chapter 4). Layout of the
op-amp was designed such that each stage could be isolated and tested
separately by scratching thin metal lines provided as part of the connection
between stages.
- 6 different ring oscillators (four 5-stage and two 7-stage ring oscillators) along
with their respective inverters
- 2 common source amplifiers with enhancement loads (no external resistors
were possible for amplifiers since all the pads were used up by the op-amp)
- Test structures and alignment marks
Minimum channel length used was 3u.
Increased the size of the vias and made them continuous wherever possible.
All layer asymmetric pad was added to assist with mask orientation
(APPENDIX D)
All single devices, common source amplifiers and some ring oscillators were tried
in three different configurations – gate and source/drain overlap 1u, gate and
source/drain overlap 2u, and gate and source/drain overlap 2u with patterned
semiconductor – to identify the optimum configuration (Figure 2.7)

19
Figure 2.7: A device in mask 2 (W/L = 4u/4u) laid out in three configurations:
(a) overlap of 1u, (b) overlap of 2u, and
(c) overlap of 2u with patterned semiconductor
Experimental results from mask 2 revealed that having higher overlaps helped
improve the overall uniformity, even though the performance remained quite similar
(average mobility values of around 2cm2/V.s were observed). More inverters and
amplifiers worked due to the better uniformity and DC gains of around 8 were
consistently observed for amplifiers. But the deposition of the semiconductor layer (ZTO)
was not uniform enough for the op-amps and ring oscillators to work even though their
individual inverter stages worked.
Patterned semiconductor devices exhibited much lower gate currents as compared
to their unpatterned counterparts owing to lesser spreading of the accumulation charges in
the film. With larger area, there is a higher probability of tunneling of these charge
carries to the gate through defects.
(a) (b) (c)

20
2.2.3 Mask 3 - Extended Gate Configuration I
To counter the uniformity problems seen in mask 1 and mask 2, all devices in
mask 3 were re-designed with an extended gate configuration. The gate was extended by
a minimum of 2u beyond the source and drain on all sides, thus increasing the overlap
between gate and source/drain electrodes (Figure 2.8). This ensured that a more uniform
surface was provided for deposition of the semiconductor. Also, the minimum channel
length for all devices was increased to 4u to enable easier fabrication.
Figure 2.8: Layout of a device in mask 3 with an extended gate configuration
The features included in mask 3 are listed below.
The op-amp, ring oscillators, amplifiers and inverters from mask 2 were
redesigned with extended gate configuration and multiple copies were laid out.
An all layer outer alignment ring was added along with alignment marks and
asymmetric pads to aid alignment.
Inverters with channel lengths 12u, 15u, and 20u having aspect ratio greater than
10 (W/L > 10) were added to observe the variations in device performance with
respect to channel lengths.
Devices with 4-point probes with channel lengths of 100u and 50u were added to
gauge the contact resistance experienced by the devices (Figure 2.9). A known

21
voltage is applied on the source and drain electrodes and the resultant current and
the effective voltage drop across the channel was measured using the voltage
probe pads. The contact resistance value was then calculated as the difference
between the overall resistance (voltage between source and drain divided by the
drain current) and the channel resistance (voltage between the probes divided by
the drain current).
Figure 2.9: Layout of a 4-point probe device from mask 3
(L = 100u, W = 1000u, probe distance from channel edge =10u,
probe thickness=10u distance between probes = 60u)
The extended gate configuration helped to tackle the uniformity issues
considerably and the overall device performance improved (average mobility of around
5cm2/V.s). Most of single stage amplifiers and inverters worked exhibiting a gain close to
10. The improved uniformity was demonstrated best by the functioning ring oscillators.
Multiple ring oscillators worked, of which a 7-stage oscillator demonstrated the best
performance - 106 kHz frequency and output swing close to 3V with a 14V supply. The
op-amp was tested in different stages and the output stage (common source + buffer
stage) was verified and provided a gain of around 3. But the first and second stage of the
op-amp did not work since the thin aluminum connections (5µ in width) at metal
crossings were burnt due to the high current flow. This was attributed to the thin Al layer
deposition during that particular fabrication cycle (50nm instead of 100nm).

22
2.2.4 Mask 4 - Extended Gate Configuration II
Since the extended gate configuration improved the device performance in
mask 3, the gate electrode was extended even further out for the devices designed in
mask 4 (Figure 2.10). The gates were extended 50u beyond the source/drain boundary,
while the finger widths for inter-digitated devices were reduced to 5u to reduce the
overall increase in overlap capacitance. Also, the functional 7-stage oscillator from mask
3 and its 50u extended and 100u extended gate versions were designed to study the
relative improvement in performance with respect to increase in overlap area. All the
circuits, including the op-amp, ring oscillators and inverters were redesigned for optimum
performance based on the modified a-Si model (discussed in Chapter 3). Buffers were
designed for all the ring oscillators to shield against output loading and to improve the
output swing. Specific devices were also designed and laid out for measuring contact
resistance.
Figure 2.10: (a) A device with 5u source/drain widths and 50u extended gate
(b) A 3-stage ring oscillator with 50u extended gate devices
(a) (b)

23
Multiple copies of the following devices were included in mask 4
- Two copies of the new a-Si model based 3 stage op-amp
- 8 different ring oscillators with "scratchable" buffer stages (buffers can be
disconnected by removing a thin connection) (one 3-stage, three 5-stage, two
7-stage, one 100u extended gate 7-stage and one 7-stage from mask 3)
- 3 enhancement load amplifiers
- Devices of varying channel lengths with aspect ratio of 10 to estimate contact
resistance (devices with L = 4u, 8u, 12u, 20u, 30u, 60u and 80u). The overall
resistance would be measured for each device and a graph plotted for
resistance versus length. The y-intercept of the graph (resistance for channel
length =0) would give an estimate for the contact resistance value.
- Devices with 4-point probes with 100u channel length are also included as an
alternative method to measure contact resistance (probe thickness = 5u,
distance of probe from channel edge = 5u, effective distance between
probes = 80u).
Mask 4 is currently under fabrication and will be tested in the lab soon.

24
Figure 2.11: Photomask of mask 4
2.3 CONCLUSION
The hybrid EDA tools setup used for the ZTO based design flow was illustrated.
The various masks that were laid out, their specific features, the experimental results
obtained and the observations from each of them were discussed in detail.
2000
mils
2000 mils

25
CHAPTER 3: ZTO based Circuits
Any new process technology is calibrated on the performance of circuits designed
using that process, especially the basic building blocks like inverters, amplifiers and
oscillators. There has been extensive research in the field of circuit design and analysis
using amorphous semiconductor based TFTs. Most of this recent work has revolved
around designing high performance inverters [16,17], ring oscillators [4,18,19], high gain
amplifiers [20,21] and circuit applications based on them [7,22].
This chapter illustrates the basic circuits that were designed using the zinc-tin
oxide (ZTO) TFTs. The process limitations, like n-channel only technology and low
transconductance of the devices due to low mobility of its charge carriers, were taken into
consideration during circuit design phase. The design approach, simulation results and
experimental results obtained are discussed in detail in the following sections.
3.1 INVERTER
Inverters are the basic building blocks of any analog or digital circuit. Due to their
simplicity of design and ease of fabrication, inverters were the first circuits that were
designed. A number of inverters, with both active and passive loads, were designed to
gauge the performance and uniformity of the ZTO based process through their transfer
curves. One such inverter with an active load (diode connected n-channel TFT as load), is
shown in Figure 3.1(a). Figure 3.1(b) shows a layout of an inverter in mask 3. Its design
involved optimizing the dimensions of the load and driver transistors to improve the DC
characteristics and gain.

26
Figure 3.1: (a) Schematic of an inverter with active load (b) Snapshot of a layout of an
inverter (I3) in mask 3 (aspect ratio of driver –300u/4u and load – 60u/4u)
The voltage transfer characteristics and the gain obtained from one of inverters
(aspect ratio of driver – 300u/4u and load – 60u/4u) are shown in Figure 3.2. The transfer
curve is shifted towards the left (transition from high to low happens at lower voltage)
due to the skewed sizing of the transistors (pull down path has higher current driving
capability). A DC gain of around -9 and an output swing of 8.5V is obtained with a
supply voltage of 10V. The Noise Margins that were observed are also in the acceptable
range (Noise Margin for low input, NML = VIL –VOL = 0.6V and for high input,
NMH = VOH –VIH = 6.5V)

27
Figure 3.2: (a) Voltage transfer characteristic of I3 shown in layout above
(b) Incremental gain plot of I3
3.2 AMPLIFIER
Amplifiers are key components of electronic circuits and are used widely to
amplify either current or voltage signals. Hence, having a functional high gain amplifier
is paramount to the success of a new process. Both single stage and multi-stage
amplifiers (Chapter 4) were designed and tested during the course of this study. Among
single stage amplifiers, common source and cascode configurations with both active and
passive loads were designed and fabricated.

28
A common source (CS) amplifier with a diode connected load is similar to an
inverter with an active load (Figure 3.1(a)). While the inverter is designed to operate in
the entire voltage range, the amplifier is mainly designed to operate in the transition
region (Figure 3.2(a)), where the gain is maximum. To guarantee this, the driver
transistor should be biased to operate in the saturation regime. The voltage gain that is
obtained from a diode connected CS amplifier is equivalent to the ratio of the
transconductance of the driver to the load. Since the same current flows through both the
devices, this gets simplified to the ratio of their sizes. But higher device widths would
increase the overlap capacitance, which adversely affects the bandwidth of the amplifier.
These design constraints were adhered to while optimizing the device dimensions of the
amplifier to maximize the gain and bandwidth without compromising on their stability
(phase margin of 450).
Figure 3.3(a) shows an amplifier (driver–1000u/18u, load–20u/12u) from the
actual mask used for fabrication. A DC gain of close to 7 (~16dB) was observed when a
small signal of 350mV at 1kHz riding over a DC bias of 1.8V was applied to the input
(Figure 3.3(b)). The AC gain plot of the amplifier against frequency (Figure 3.3(c))
revealed a unity gain bandwidth close to 10kHz.
The voltage gain exhibited by the amplifiers was limited due to the low mobility
of charge carriers (2–5cm2/Vs) as compared to Si. In addition to it, the n-channel only
process necessitated the use of diode connected devices as load which significantly
reduced the load resistance and hence the gain. The low load resistance also caused the
voltage gain obtained from cascode amplifiers to be practically same as that of the normal
common source amplifiers.

29
Figure 3.3: (a) Schematic of a CS amplifier, (b) Small signal input and output waveforms
(c) AC gain plot of the amplifier
3.3 RING OSCILLATOR
Ring oscillators are made of a chain of odd number of inverters connected in a
feedback loop. An oscillator provides an output at a specific frequency without the
application of any input. The noise present in the circuit is amplified and fed back until it
settles into the sustained oscillations seen at the output. The frequency of operation is
determined by the number of stages and the delay per stage. To produce sustained
oscillation, two criteria need to be satisfied – a closed loop gain greater than 1 and a
phase shift of 1800, with each stage contributing 180
0/N (N- number of states). The
minimum gain per inverter stage required for oscillation can be derived as
Ao =

30
3-stage, 5-stage and 7-stage ring oscillators were designed to exceed the minimum
gain requirements for oscillations and fabricated. Figure 3.4(a) shows the schematic of
a 7-stage ring oscillator. A number of oscillators fabricated with the extended gate
structure in mask 3 (Chapter 2) produced sustained oscillations. Figure 3.4(b) shows the
layout of the 7-stage oscillator (driver - 600u/4u, load - 30u/4u) which exhibited
sustained oscillations with frequency 106kHz at VDD of 14V. The output frequency of the
oscillator varied with the supply voltage (Figure 3.5) and a frequency of 76.5kHz was
observed at a VDD of 11V (Figure 3.6). Among the 5-stage oscillators, the highest
frequency measured was 75kHz with 7V supply (Figure 3.7).
Figure 3.4: (a) Schematic of a 7-stage ring oscillator, (b) Snapshot of a layout of 7-stage
ring oscillator (driver – 600u/4u, load – 30u/4u)

31
Figure 3.5: Oscillation frequency and propagation delay per stage as a function of VDD
Figure 3.6: Oscillations observed at the output of a 7-stage ring oscillator
(76.5kHz at 11V VDD)
2 4 6 8 10 12 140
20
40
60
80
100
120
Pro
pag
ation
dela
y (s/s
tage
)
Fre
que
ncy (
kH
z)
VDD
0
2
4
6
8
-40 -20 0 20 40
-2
-1
0
1
2
Outp
ut volta
ge
(V
)
Time (s)
VDD
=11V

32
-40 -20 0 20 40
-0.2
-0.1
0.0
0.1
0.2
Outp
ut volta
ge
(arb
ita
ry u
nit)
Time (s)
VDD
=7V
Figure 3.7: Oscillations observed at the output of a 5-stage ring oscillator
(driver – 300u/9u, load – 30u/9u) (75kHz at 7V VDD)
Since the performance of an oscillator does not depend on any external input and
bias voltages except VDD, it can be employed to calibrate the models used to predict the
device behavior. A modified SPICE MOSFET level 1 model was being used to simulate
all the circuits. Relevant process parameters including mobility, parasitic capacitance and
oxide thickness were plugged into the model to help predict the behavior of ZTO based
devices with required accuracy (APPENDIX A). But the model predicted the frequency
of the above mentioned 7-stage ring oscillator as 379kHz at 11V supply when the
experimental value was just 76.5kHz. Similarly, for the 5-stage ring oscillator at 7V VDD,
the model predicted 164kHz output instead of the experimental value of 75KHz.
Figure 3.8 shows the simulations results obtained for the 7-stage and 5-stage ring
oscillators using the modified SPICE level 1 model.

33
Figure 3.8: SPICE Level 1 simulation results for
(a) 7-stage oscillator (379kHz and 6.4V swing with 11V supply) and
(b) 5-stage oscillator (164kHz and 2.9V swing with 7V supply)

34
Figure 3.9 and 3.10 confirm the inaccuracy of the modified SPICE model
depicting how different its predicted values are from the actual experimental results for
individual devices. This disparity is due to the difference in charge transport mechanism
that exists in AOS as compared to Si (Chapter 5). Since AOS materials have very similar
properties to that of a-Si, a model developed by the RPI group for a-Si was modified and
used for later simulations.
Figure 3.9: Comparison of experimental data and SPICE Level 1 model simulations for
Transfer Characteristic Curve (Id – Vgs) of W=80um, L=4um ZTO Device

35
Figure 3.10: Comparison of experimental data and SPICE Level 1 model simulations for
Output I-V (Id – Vds) Curves of W=80um, L= 4um ZTO Device
3.4 RPI MODEL
The device model developed by the RPI group was catered towards a-Si and
polysilicon TFTs and has already been integrated into circuit simulators like Spectre,
AIM-SPICE, T-SPICE. The RPI model has a number of process specific parameters, few
of which are technology and geometry related (CGDO, CGSO, TOX, EPS, EPSI, IOL). It
also has a number of fitting parameters (around 20 parameters) which can be adapted to
enable the model to predict device characteristics for similar process technologies [23].
Except for a few unpublished VerilogA based implementations of TFTs, the RPI model is
the only commercially available model for TFTs that is used by circuit simulators. The
parameters in the RPI a-Si model available in Spectre simulator [23] were adapted to fit
the I-V curves of the experimental data of ZTO based devices. A close fit was obtained

36
by varying the fitting parameters available in the model (Figure 3.11 and 3.12), which
was then used to simulate the ZTO based TFT circuits (APPENDIX A).
Figure 3.11: Comparison of experimental data and RPI a-Si model simulations for
Transfer Characteristic Curve (Id – Vgs) of W=80um, L=4um ZTO Device
Figure 3.12: Comparison of experimental data and modified RPI a-Si model simulations
for Output I-V (Id – Vds) Curves of W=80um, L= 4um ZTO Device

37
The simulation results obtained for the 5-stage and 7-stage oscillators with the
modified RPI model matched very closely with their experimental results (Figure 3.13
and 3.14). This validated the accuracy of the RPI model to a great extent. Hence
simulations using the RPI model were used to further optimize the design of the
amplifiers and the ring oscillators. After performing careful simulations using the RPI
model, taking into account possible mobility variations, a number of single stage
amplifiers and high frequency oscillators were designed and laid out in mask 4 (Table 3.1
and 3.2). Ring oscillators with frequencies close to 1MHz in simulation were designed
which could rival the performance of the best among solution processed oscillators.
Individual buffer stages were also designed for all the oscillators to prevent loading of the
output while testing. This would ensure that the voltage swing of the amplifier would not
be affected by external loads.
Figure 3.13: Output simulation with RPI model for 7-stage ring oscillator
(78kHz frequency and 8V output swing with 11V supply)

38
Figure 3.14: Output simulation with RPI model for 5-stage ring oscillator
(62.9kHz frequency and 3V output swing at 7V supply)
Table 3.1: List of common source amplifiers designed and fabricated in mask 4

39
Table 3.2: List of ring oscillators designed and fabricated in mask 4
3.5 CONCLUSION
Basic circuits including inverters, single stage amplifiers and ring oscillators have
been designed and fabricated using ZTO based TFTs. Working of these circuits along
with experimental results were illustrated. A model for predicting the behavior of ZTO
based TFTs was developed from an a-Si based RPI model, by modifying the model
parameters to fit the experimental transfer curves. The modified model was then used to
accurately predict circuit behavior and used to design high gain amplifiers and high
frequency ring oscillators. Ring oscillators of close to 1 MHz frequency in simulations
were designed and fabricated. The designs will be verified in the lab soon.

40
CHAPTER 4: Operational Amplifier
Operational Amplifiers (op-amp) can be considered as high-gain differential
amplifiers, with a gain typically in the range of 101 to 10
5. Usually the input is differential
and the output is single ended. Op-amps are basically differential amplifiers with multiple
gain stages to deliver a high overall gain. So the op-amp produces an output which is an
amplified version, almost 105
times, of the voltage difference between its inputs.
Op-amps are the major building blocks for a wide range of electronic circuits and devices
which are used in a number of consumer, industrial, and scientific devices. They are used
in electronic applications ranging from comparators and rectifiers to filters and data
converters. Since op-amps have numerous applications, there has been a lot of interest
recently in designing high gain and low cost op-amps using amorphous semiconductors
[7,22].
This chapter deals with the design and fabrication of an op-amp with ZTO based
n-channel TFTs. The design approach, the topology selected and the simulation results
obtained using the modified RPI model are discussed in detail in the following sections.
An existing n-channel based op-amp topology was selected as the base model and then
optimized to get the best possible performance matrix for the ZTO based process. The
modifications made and the reasons for the changes are also elaborated in subsequent
sections.
4.1 BASE OP-AMP DESIGN
The op-amp design that was selected as the base design was an n-channel only op-
amp design proposed by R. Sarpeshkar and A. Moini, for flexible inorganic TFTs, in their
unpublished work [21]. That op-amp was designed to emulate the performance and

41
specification of the classical 741 op-amp, a BJT based design. The Sarpeshkar-Moini op-
amp (S-M op-amp) was originally based on another integrated n-channel op-amp
designed by Tsividis and Gray in 1976 [24].
The Tsividis and Gray op-amp (T-G op-amp), shown in Figure 4.1, is a three
stage enhancement NMOS only amplifier with a fully differential input stage. The
differential output is then converted to a single ended one through a differential-to-single-
ended converter. The second stage is a cascode stage which amplifies the signal and
drives a common source output stage through a source follower. The source follower acts
as a level shifter and also reduces the effective input capacitance seen by the output stage.
A Miller capacitance driven by a source follower is connected across the output and input
of the cascode stage to apply feedback to provide internal compensation. The source
follower is used to eliminate any feedforward current through the compensation
capacitor, thus avoiding a right-half plane zero which would degrade the phase response
[24]. All the loads used in the op-amp are diode-connected NMOS transistors.
The S-M op-amp is also a three stage design, with a fully differential stage
followed by a differential-to-single-ended converter forming the input stage [21]. The
Figure 4.1: Schematic and block diagram of T-G op-amp (© 1976 IEEE) [24]

42
second stage is a Miller compensated cascode stage followed by a common source third
stage, just like the T-G op-amp. A source follower and resistor buffer circuit is then
added as the output stage to increase the output resistance and help drive the load. The
key difference in the S-M design is that all the diode connected loads in the T-G design
are replaced with resistors. This has a twofold benefit of increasing the gain and
decreasing the parasitic capacitance for each stage, thus improving the overall unity-gain
bandwidth. The source follower in the feedback path is also replaced with an appropriate
resistance which creates a left half plane zero that cancels out an existing pole, thus
improving bandwidth. A parallel RC circuit is also added to the third gain stage to act as
a level-shifter and a short at high frequencies to further increase bandwidth. The
schematic of the S-M op-amp is shown in Figure 4.2.
Figure 4.2: Schematic of Sarpeshkar and Moini op-amp
The simulation results obtained from the original simulations of the S-M op-amp
are tabulated in Table 4.1. A basic Level 1 SPICE MOSFET model was used as the

43
simulation model, to which appropriate parameters like threshold voltage, channel length
modulation, mobility and oxide thickness were fed. A basic capacitance model was also
added to this SPICE model, using experimentally obtained capacitance measurements, to
account for the overlap capacitances in each device. An overall gain of 83dB with a
unity-gain frequency of 1.7MHz was obtained, which is comparable to that of a classical
741 op-amp.
Table 4.1: Simulation results obtained for S-M op-amp with SPICE Level 1 Model
Sl. No Specification Simulation Result
1 Low frequency gain 83 dB
2 Unity-gain frequency 1.7 MHz
3 CMRR 103 dB
4 Input offset voltage 0.9 mV
5 Slew rate 0.12 V/µs
6 Total current 1.04 mA
7 Power supply ±15 V
4.2 MODIFICATIONS TO BASE OP-AMP DESIGN
A number of modifications were made to the S-M op-amp design, both in terms
of topology and sizing, to optimize the performance of the op-amp for the ZTO based
process. Most of these changes were aimed at increasing the overall gain and bandwidth
of the amplifier while meeting the stability criterion (phase margin of 450). A variety of
reasons necessitated these modifications. The major reasons for these modifications and
the design changes made to correct them are detailed below.

44
i. Uniformity – The process used for the fabrication of the ZTO devices was
constantly improved with each cycle and the uniformity and performance of the
devices varied in each fabrication cycle. This meant that the mobility of the
devices would change with improvements made to the mask design, like using
extended gate approach in layout to improve device performance, which in turn
would change the DC operating points of devices in the op-amp. Such changes
might lead to some of the devices going out of the saturation regime, thus
adversely affecting the performance of the amplifier. To counter this scenario,
variable resistances were added to each branch of the op-amp, which gave a
degree of control over the region of operation of the transistors. By optimizing
these resistor values while testing, higher gains could also be achieved
irrespective of the mobility changes that might occur due to the process
variations.
ii. Overlap Capacitance – The capacitance caused by the gate–drain/source overlap
in the devices was modeled conservatively in the S-M model. A more accurate
estimate of the capacitance values, in the modified RPI model (Chapter 3),
coupled with an increase in overlap area, (extended gate configuration) for better
uniformity and performance, showed huge increases in the overlap capacitance
values, which in turn adversely affected the unity-gain frequency and phase. The
capacitance values were reduced by scaling down transistor sizes, by a factor of 8
in the case of the differential input pair, thus pushing the poles to higher
frequencies and hence improving bandwidth. But reducing the transistor sizes also
resulted in the reduction of transconductance values for individual devices and
hence a decline in the overall gain. So a trade-off was made on the overall gain of

45
the op-amp to account for an improved bandwidth and stability. An extra Miller
capacitance was also added around the last gain stage to further improve phase
and bandwidth.
iii. Gate dependent mobility – The phenomenon of gate dependent mobility
experienced by AOS transistors was not taken into consideration in the simplified
MOSFET model used in the initial simulations by Moini. This meant that at the
lower gate voltages that the devices were biased at, the actual mobility values
were lower than expected and therefore the resultant transconductance and gain
were much lower. The new design was optimized to have the transistors biased at
as high a gate voltage as possible with the transistors still in saturation, to improve
the gain from each stage.
iv. Resistance – Even though the resistances used in each of the branches add
controllability against uniformity issues, they hinder the gain available from each
stage. The high resistances used cause a huge drop across them even for low
currents, hence reducing the voltage headroom available for the gain transistor to
be biased in saturation regime. As a result, the resistance limits the amount of
current the transistor can drive, thus limiting the transconductance and the gain.
The value of the resistance and the transconductance of the driver transistor of
each stage were optimized jointly in the new design to generate the optimum gain.
The use of load resistances also made the design of cascode stages very
difficult due to the lack of voltage headroom to bias both the cascode transistors
in saturation. Even though the cascode stage provides a higher output resistance
(gmro1ro2), the load resistance cannot be as large (due to voltage headroom issues)
to make the effective output resistance high. Consequently, a common source

46
stage gives a better gain than a cascode stage in the current process with the use of
load resistances. Therefore, in the new design, the cascode stage in S-M op-amp
design is replaced with a common source stage.
v. Supply voltage – The VDD used in the S-M design was ±15V which is quite high
for sensor and other circuit applications amorphous semiconductor based devices
would be used for. The VDD used in the ZTO based process was ±5V, which is
much lower, and hence limits the mobility and also the voltage available to be
dropped across each branch. As a result, the sizing of the transistors was modified
to extract maximum gain from each stage without compromising on stability.
Also, the cascode stage was replaced with a common source stage due to lack of
voltage headroom to keep the transistors in saturation region.
vi. Fringing current – The fabrication of low transconductance (gm) devices
(devices with very low aspect ratio) was highly constrained by the fringing
current effects in the existing process. As the channel width decreases, the
contribution of fringing currents to the overall current flowing between the drain
and source terminals becomes much higher. Hence low transconductance
n-channel devices could not be used as loads to give a higher output resistance. So
the new op-amp design did not use any n-channel loads, since the output
resistance of such loads (Rout=1/gm) with higher transconductance would be much
lower which would adversely affect the gain from that stage.
4.3 NEW OP-AMP DESIGN
The new op-amp designed for the ZTO based transistors consists of three gain
stages followed by an output buffer stage (Figure 4.3). The input stage is a fully

47
differential stage followed by a single-ended converter. The second and third stages are
common source gain stages which then feed a source follower that acts as the output
stage. Two Miller compensation pairs (capacitance in series with a resistance, connected
across the output and input of a gain stage) are employed, as shown in the figure below,
to improve the overall frequency response. The different stages of the op-amp are
analyzed in detail below.
Figure 4.3: Block diagram of the new op-amp design
The first stage of the op-amp consists of a fully differential stage with differential
inputs and differential outputs, and a differential-to-single-ended converter. The
differential stage (diff-amp), shown in Figure 4.4, is a simple differential input pair with
resistive loads and a tail current source. The tail current source, which feeds the required
current to the entire diff-amp stage, is biased by a current mirror circuit. The sizing of the
input pair is kept below a reasonable limit to ensure that the bandwidth is not severely
affected. The length of the tail transistor is kept much bigger (l = 20u) to increase its
output resistance (ro3), which will improve the overall CMRR of the op-amp. All other
transistors used in the op-amp are minimum sized (l = 4u). The differential gain of this
stage is given by:
Adm1 = gm1(ro1 // R1), where gm1 = gm2 and ro1 = ro2

48
The relatively small size of the input pair causes the transconductance of those
devices to be low, thus reducing the overall gain from the stage to a nominal value of 2.5.
The common-mode gain of this stage is given by:
Acm1
The differential output from the diff-amp is applied to the differential-to-single
ended converter which passes the input signals through two different paths – an inverting
path and a non-inverting path. The inverting path is made up of source follower M4 with
M6 as its load, followed by an inverter M7 with M5 and R4 as its load. The non-inverting
path consists of just M5 which acts as a source follower with M7 as load. The gain of the
single-ended converter is
Av1 =
The gain obtained from the single-ended stage is around 1.2. Hence the overall
gain from the first stage is around 3. The output of the first stage drives back to back
common source stages which form the second and third stages (Figure 4.5). The gain of
the common source stages are:
Av2 = gm9(ro9 // R6) and Av3 = gm10(ro10 // R7)

49
Figure 4.4: Schematic of (a) Fully differential input stage,
(b) Differential-to-single-ended converter
Figure 4.5: Schematic of (a) second stage and (b) third stage of the op-amp
(a) (b)
(a) (b)

50
The second stage gives a gain of around 7 while the third stage gives a gain close
to 6.3. The output of the third stage is connected to the output buffer stage, which is a
source follower (Figure 4.6). The output buffer prevents loading of the op-amp and helps
drive loads up to 15pF without affecting the stability of the amplifier. But the gain from
the buffer stage is 0.79 which pulls down the overall gain of the op-amp from 120, at the
input of the buffer stage, to 100 at its output. The gain of the output buffer stage is:
Av4 =
Figure 4.6: Schematic of the output buffer stage
The complete op-amp schematic is shown in Figure 4.7 and its layout in
Figure 4.8. The schematic is made of all the stages discussed in detail above along with a
current mirror circuitry (M8 and R5) to bias the tail current source of the diff-amp. It also
has two Miller compensation structures, for frequency compensation, across the input
stage and the third stage as the dominant poles fall at their output nodes. The Miller
compensation structures consist of a resistance and capacitance in series, connected
across the output and input of a gain stage. The Miller capacitance helps in pole-splitting

51
and makes the dominant pole even more dominant [25]. It also adds a zero, due to the
feed forward current, the location of which can be tweaked by changing the value of the
resistance. The resistance value is optimized such that the zero cancels out a non-
dominant pole thus improving frequency response and increasing bandwidth. The
frequency compensation is implemented using RC1 = 1MΩ and C1= 300pF across input
stage, and RC2 = 550kΩ and C2 = 500pF across third stage.
Figure 4.7: Schematic of the new op-amp

52
Figure 4.8: Layout of the new op-amp showing the various stages
The simulation results obtained from the new op-amp design are tabulated below
in Table 4.2. The modified a-Si model, elaborated in Chapter 3, is used for all the
simulations. All the parameters are measured with a load capacitance of 5pF. An overall
gain of close to 40dB is achieved at the output with unity gain frequency of 27.7kHz
(Figure 4.9). A phase margin of over 450 is maintained for capacitive loads up to 15pF.
The performance of the op-amp compares favorably to the reported performance of other
op-amps made using amorphous semiconductors [7,22]. But most of the other designs use
higher supply voltages (±15V) to achieve the same performance instead of 0 to 5V used
in this design.

53
Table 4.2: Simulation results achieved for the new op-amp with modified RPI a-Si model
Sl. No Specification Simulation Result
1 Low frequency gain 98.9 = 39.9 dB
2 Unity-gain frequency 27.7 kHz
3 Phase Margin 45.10
4 Gain Margin 3.89 dB
5 CMRR 10.73 dB
6 PSRR 21.4 dB
7 Output Swing (30db gain) 0.4 – 2.5V
Figure 4.9: Magnitude-phase plot of the op-amp. (DC gain = 39.9dB, phase margin = 450
unity gain frequency = 27.7kHz, and gain margin = 3.89dB)

54
4.4 CONCLUSION
The design of a new ZTO based op-amp was discussed in detail and its working
demonstrated through simulation results. All the design constraints and the corresponding
solutions used were elaborated. The op-amp designed provided favorable performance
when compared to other amorphous semiconductor based counterparts. Further
improvements to the design can be adopted by using known gain enhancement techniques
[7,20], once the process is more stable. Use of complimentary circuits could further boost
the gain per stage of the op-amp and also provide enough voltage headroom to implement
higher gain stages such as cascode stages. Also continued improvements and innovations
in layout and fabrication process, like extended gate structures, would further improve
device performance which will in turn enhance the op-amp performance.

55
CHAPTER 5: Device Modeling of ZTO TFTs
CAD tools are an integral part of the circuit design flow, more so now than
before, due to the complexity of the circuits. Simulators and device models they use are
foremost among these tools. Device models that can predict device characteristics
accurately under different process conditions and circuit configurations are key to
designing high performance circuits. Accuracy of the model and time to convergence to a
solution are both important metrics for a good simulation model.
This chapter illustrates the need for a new accurate device model for the ZTO
based process. To substantiate this requirement, charge transport mechanics in crystalline
and amorphous semiconductors, specifically charge transport in ZTO devices, are
discussed in detail. An expression for gate voltage and temperature dependent carrier
mobilities seen in ZTO devices is derived using charge transport physics and is used to
justify the selection of the a-Si RPI model for simulations. The shortcomings of the
modified RPI model are also discussed to further the case for a more comprehensive
model for ZTO devices.
5.1 CHARGE TRANSPORT
Charge transport mechanics exhibited by amorphous materials are quite different
from that of crystalline semiconductors such as silicon. Hence, a crystalline silicon based
model can never be precisely adapted for all conditions for an amorphous material
process, as revealed by the modified SPICE level 1 simulation results for ZTO devices
(Chapter 3). The following sub-sections discuss in detail the charge transport mechanism
in different material systems

56
5.1.1 Crystalline Semiconductors
Charge transport mechanism exhibited by crystalline inorganic semiconductors
like single crystalline silicon or polysilicon is known as band transport. Crystalline
semiconductors have highly ordered lattice structures which enable atoms to interact
closely and allow for easy carrier (electrons or holes) movement. In band transport,
electron transport follows the Drude model [26]. Electrons are assumed to be moving
freely under the influence of an electric field with their movement hampered only by
collisions with the lattice. The mobility of the electrons also has a power law relation
with temperature, with the mobility decreasing with increasing temperature.
5.1.2 Amorphous Semiconductors
Charge transport in an amorphous semiconductor is dominated by the existence
of trap states in the forbidden gap between conduction band and valence band. Such
localized trap-states are formed due to the structural defects and unwanted impurities in
the semiconductor film. These trap states form a continuous distribution of energy levels
in the bandgap, which is described by the density of states (DOS). Charge carriers that
get captured in a trap state are released after a period of time into the conduction band
when they get thermally excited. This mechanism, called multiple trap and release
transport, is observed in amorphous semiconductors like a-Si and zinc-tin oxide, which
limits the mobility of charge carriers [27].
Multiple Trap and Release (MTR) and Variable Range Hopping (VRH) are the
two most widely used models that explain this trap limited transport. The MTR model
assumes that the localized states lie near the transport band edge above which band like
transport (delocalized bands) occurs and below which all states are trap states. In the

57
MTR model, as charge carriers move in the transport band, they get trapped and released
(thermal release) multiple number of times from the localized trap states.
Figure 5.1: Charge transport in MTR model
The effective mobility of charge carriers is thus given by:
eff = o . . o
. (5.1)
where ‘o’ is the mobility in the transport band, ‘’ is a constant depending on the
ratio of number of carriers in the band to the total number of charge carriers, (Ec – Et) is
the difference in energy levels of the transport band and the trap state level. An
approximate expression in terms of ‘Nc’(effective DOS near the band edge) and ‘Nt’
(DOS of the traps) is obtained by assuming a single trap state of energy level Et (Eq.
(5.1)). Hence the effective mobility observed is usually much smaller than the band
mobility.
The Monroe model is an extension to the MTR model [28] and is suited for
charge transport at low temperatures or when there is no transport band. Monroe model
assumes the band tail to contain the delocalised transport states also and assumes an
exponential distribution of trap / localised states in the band tail.
Both Monroe model and MTR model point to a gate voltage dependent mobility.
When the external gate bias is applied, the energy levels shift so that the difference in

58
energy between the filled trap states and the edge of the transport band decreases. This
enables the easier release of charge carriers to the transport band which in turn increases
the effective mobility.
5.1.3 Charge transport in ZTO
The charge transport exhibited by ZTO based devices under study have been
shown to be a combination of MTR and band transport [29]. At low values of gate
voltage, effective mobility is observed to increase with increase in temperature, which
follows from the MTR model of trap and thermally activated release of charge carriers.
At higher gate voltages, effective mobility decreases with increasing temperature which
can be considered to be band transport limited by lattice vibrations.
A fairly accurate fit was observed between the MTR model (Eq. 5.1) and the
experimental data obtained at different temperatures for ZTO devices [29], provided the
gate voltage is below the crossover point to band transport. Thus, the effective mobility
(eff) has the following relation with band mobility (0):
eff = 0 .
(5.2)
where ‘Ea’ is the activation energy or (Ec–Et), ‘k’ is the Boltzman’s constant and ‘T’ is
the temperature.
5.2 EXPRESSION FOR EFFECTIVE MOBILITY IN ZTO DEVICES
As discussed in section 5.1.3, charge transport mechanism of ZTO devices can be
modeled as a multiple trap and thermal release mechanism. Thus, Eq. (5.1) can be used as
a starting point to derive the expression for effective mobility:
eff = o . . (from Eq.(5.1))

59
In this model, band mobility scaled by the ratio of free carrier density (volume) to
the total carrier density (volume) is termed as the effective mobility.
eff = o .
(5.3)
where the free carrier density ‘nc’,based on Boltzman’s approximation is:
nc = Nc . (5.4)
and the density of trapped carriers in single trap energy level ‘Et’ with DOS of ‘Nt’ is:
nt = Nt . (5.5)
From Eq. (5.3, 5.4 and 5.5),
eff = o .
o
(5.6)
The expression in Eq. (5.6) assumes a single (dominating) trap level. But since
ZTO devices exhibit a continuous range of trap states [10], the above expression does not
accurately model the effective mobility.
The exponential band tail trap distribution is given as:
Nt (E) =
(5.7)
where “Nt’ is expressed as an exponential function of the energy level ‘E’, ‘Nt0’ is the
total density (per unit area) of the trap states and ‘T0’ is the characteristic width of the
density distribution.
The density of trapped charges can be given as (assuming that a large number of
carriers are trapped i.e. n nt ) :
n =
(5.8)
where ‘f (E)’ is the Fermi Dirac distribution that decides the probability of charge carriers
at an energy level ‘E’.
The expression for Fermi Dirac distribution is
f (E) =
(5.9)

60
For simplification, absolute zero operation (T = 0) is assumed which makes the
Fermi Dirac distribution 1 for energy level ‘E’ below ‘Ef’, and 0 for ‘E’ above it. Thus,
in absolute zero operation, carriers will fill up the states only till the Fermi level ‘Ef’.
With the above assumption, bounds of the integral in Eq. (5.8) becomes
n =
n = Nt0 . (5.10)
=> ( Ec – Ef ) = kT0 . ln
(5.11)
Substituting Eq. (5.11) in (5.4),
nc = Nc .
(5.12)
Now, Eq. (5.3) can be expressed as,
eff = o .
(5.13)
where ‘n’ is the total induced carrier density.
Thus, using Eq. (5.10, 5.12 and 5.13),
eff = o .
(5.14)
The total induced carrier (volume) density can be expressed as,
n =
(5.15)
where ‘Cg’ is the gate capacitance, ‘q’ is the charge of an electron and ‘t’ is the estimated
thickness of the channel formed.
From Eq. (5.14 and 5.15), the expression for effective mobility is obtained as
eff = o .
(5.16)
where the following terminology is used.
eff : Effective Mobility

61
o : Mobility of carriers in the transport band
Nc : Total density of states (per unit volume) in the extended states/ near the
transport band edge
Nt0: Total density of states (per unit volume) in the band tail
Cg: Gate capacitance (Cox) per unit area
Vgs: Externally applied gate voltage w.r.t. source
Von: Onset voltage
q : Unit charge
t : Depth of penetration of channel into semiconductor film (arond 150 nm)
T0 : Characteristic temperature that decides the width of the distribution of trap
states (Kelvin)
T : Operating temperature in Kelvin
A similar expression has been derived for OTFTs by Horowitz et al. [30]
considering MTR mechanism of charge transport. It further corroborates the assumptions
made and the approach that was used in this derivation.
5.2.1 RPI Model Simulations
The RPI model, described in Chapter 3, was fitted to the ZTO device
characteristics by adapting its parameters and used for circuit simulations. RPI model
uses a power law expression to portray the gate voltage dependent effective mobility. The
equation used is:
eff = o
(5.17)
where, ‘o’ is the conduction band mobility and ‘Vaa’ and ‘ ’ are fitting parameters.
Comparing equations (5.16) and (5.17), it is evident that the RPI model uses an
expression for mobility identical in form to the expression derived for ZTO devices.

62
Hence using the RPI model for modeling the characteristics of ZTO devices is justified
for the scope of this study.
Even though the RPI model provides a good fit in most cases for the ZTO device
and circuit characteristics, there are a few observerd limitations as listed below:
(i) The contact resistance values that fit for I-V data of one device do not fit the I-V
data of other devices (Figure 5.2).
(ii) The simulations for Id – Vds curves deviates from the experimental data at low
values of Vgs (Figure 5.3).
(iii) The high gate leakage observed in small ZTO devices at low Vds values, was not
accounted for by the fit (Figure 5.4).
Figure 5.2: Fitting of contact resistance for Device1 (W/L = 80u/4u)
does not fit Device2 [W/L = 81u/4u]
Effect of Contact Resistance
(a) W = 81u L= 4u (b) W = 80u L= 4u

63
Figure 5.3: Id–Vds data fits better at higher Vgs (3, 4, 5V)
than lower Vgs (0, 1, 2 V) values
Figure 5.4: Gate leakage (Igd) observed in small device (W/L = 14u/4u)
at high Vgs and low Vds, cannot be seen in simulations
Id Deviates at Lower Vgs
(b) W = 80u L= 4u : Vgs (3, 4, 5 V) (a) W = 80u L= 4u : Vgs (0, 1, 2 V)
Gate Leakage (Igd) at High Vgs, Low Vds

64
The deviations listed above of the predicted characteristics from the experimental
values could be attributed to the assumptions that are made while deriving the effective
mobility expression for ZTO devices (discussed in Chapter 6).
5.3 CONCLUSION
Various charge transport mechanisms governing amorphous semiconductors,
specifically ZTO based devices, were discussed. An expression for gate bias dependent
mobility was derived, which was then employed to justify the use of RPI a-Si based
model for circuit simulations in this study. The limitations of the RPI model in predicting
the ZTO device characteristics at certain corner scenarios were exposed to illustrate the
need for a comprehensive model.

65
CHAPTER 6: Conclusion and Future Work
6.1 CONCLUSION
In this thesis, functional analog circuits based on solution processed n-channel
ZTO TFTs were demonstrated. Circuits including inverters, single stage amplifiers
(cascode and common source amplifiers) and ring oscillators have been designed,
fabricated and tested. Amplifiers with open loop gain consistently around 10 have been
tested. A 7-stage ring oscillator with output frequency of 106kHz (14V supply) and a
5-stage ring oscillator with frequency of 75kHz (7V supply) have been reported.
A hybrid simulation setup was used for simulations by combining the best
features of Cadence and Tanner EDA tools. The simulation model was continuously
adapted to improve the accuracy of the entire simulation environment. A modified SPICE
level 1 model was used for the initial simulations which was then replaced by a more
accurate version of the RPI a-Si model. The RPI a-Si model takes into account the
multiple trap and release charge transport, typically seen in amorphous semiconductors,
which made it a more relevant and precise model for the ZTO based devices. An
expression was derived for the gate dependent mobility in ZTO devices based on their
MTR charge transport mechanism which validated the use of a modified a-Si model for
the purpose of this study. However, due to the assumptions made while deriving the gate
dependent mobility expression, the modified a-Si model is not accurate for complex
analysis of ZTO based circuits. A more comprehensive model needs to be developed for
ZTO devices.
A stable 3-stage op-amp with buffered output was also designed and simulated
using the modified a-Si model. The performance of the op-amp (39.9dB gain, unity gain

66
frequency = 27.7kHz and phase margin = 45.10) is comparable to other existing op-amps
based on amorphous devices [7,22]. A 7-stage ring oscillator with close to 1MHz
frequency in simulation was also designed which is better than any other solution
processed oscillator to-date. Both the op-amp and the oscillator have been fabricated and
are ready to be tested.
6.2 FUTURE WORK
6.2.1 Circuit Design
There is a lot of scope for improvement and innovation in the design of ZTO
based circuits. The lack of p-channel devices has considerably limited the performance of
ZTO based circuits. A hybrid organic-inorganic complementary circuit configuration
with organic p-channel devices can lend a huge boost to the overall circuit performance.
High gain stages such as cascode stages will perform better with a complementary
configuration. The leakage from circuits can also be reduced using complementary
circuits which will open further avenues for ZTO TFT applications.
Advancements in semiconductor deposition processes can also lead to better
uniformity and higher performance. With a stable process, gain boosting techniques like
adding circuitry to provide positive feedback to improve output resistance can be
implemented to further enhance the amplifier performance [7,20]. Also, designing Vt
insensitive circuits will add to the stability and overall performance of the circuit.
Designing and characterizing basic digital gates like inverters, OR gates and AND
gates using ZTO devices is another important step. Once the basic gates are built, they
can be used to design more complex circuits like DACs and ADCs. Digital logic is

67
innately more immune to process variations and threshold shifts which have been the
biggest drawbacks of solution processed circuits. Hence solution processed devices might
be a better fit in digital circuits rather than analog circuits.
6.2.2 Device Modeling
As discussed in Chapter 5, it is essential to have an accurate model to enable
design of complex circuits. So a key area of future research on amorphous
semiconductors should be the development of such models. While deriving future models
for such devices, few key assumptions should be handled carefully –
The step function behavior assumed for the Fermi–Dirac distribution function
should be replaced with an accurate expression to calculate the density of trapped
charges.
ZTO device operation at high gate voltages, where the charge transport crosses over
from MTR to band transport, should be modeled.
Instead of treating the band mobility (o) as a constant, its dependence on
temperature and DOS should be considered.
An accurate DC model can be derived for amorphous materials if the above
assumptions are handled appropriately. But to complete the model, a charge based model
should also be generated to predict the small signal behavior. The charge based approach
adopted in [31] can be replicated for this purpose by making the required modifications to
the base model to reflect the MTR mechanism instead of the VHR mechanism followed
in [31].

68
APPENDIX A
Following is the list of different model files used during circuit simulations.
I. Modified SPICE Level 1 MOSFET model
(i) Simulator : Spectre
simulator lang = spice
.MODEL NMOS_VTL nmos LEVEL=1
+ TOX=42E-9 TPG=1 VTO=1 UO=5 GAMMA=0 LAMBDA=1E-3
+ NSUB=1e11
+cgso = 2.5e-9 cgdo = 2.5e-9
(ii) Simulator: SPICE [Excluded the “simulator lang” directive from the
Spectre model]
.MODEL NMOS_VTL nmos LEVEL=1
+ TOX=42E-9 TPG=1 VTO=1 UO=5 GAMMA=0 LAMBDA=1E-3
+ NSUB=1e11
+cgso = 2.5e-9 cgdo = 2.5e-9
II. RPI a-Si TFT model fit to experimental data of ZTO devices
(i) Simulator : Spectre
simulator lang = spice
.MODEL NMOS_aSi atft type=n
**GEOMETRIC AND TECHNOLOGY PARAMETERS**
+TOX=100e-9
+cgso = 2.5e-8 cgdo = 2.5e-8

69
+EPS=1.5
+EPSI=18
+IOL=20e-9
**TRAP DISTRIBUTION RELATED PARAMETERS**
**default values**
+DEF0 = 0.6
+GMIN = 1.0e23
+V0 = 0.12
**OTHER PARAMETERS**
*onset voltage *
+VTO= 0
*series contact resistance*
+rd=500 rs= 500
*saturation knee parameters - default values*
+ALPHASAT = 0.6
+m = 2.5
**--removing temperature dependence--**
+tnom=27
+kvt = 0
+kasat = 0
**--physics--**
*gate dependence of mobility*
+GAMMA= 0.29
*activation energy*
+EMU= 0.05
*flat band voltage*
+VFB= 1.4

70
**---leakage---****
+sigma0= 50e-9
+delta= 2
+VGSL= 2
**--Band Mobility--**
+MUBAND= 0.003
(ii) Simulator : Spectre
This model is a modification of the RPI a-Si model listed above
[II(i)]. In model II(i), the activation energy given by Eq. (5.1) is not
observed to affect the effective mobility exponentially at all temperatures
as seen in (Eq. 5.1).
eff o . (From Eq. (5.1))
where (Ec - Et = Ea ) is the activation energy in eV.
Temperature dependence was eliminated by setting tnom
parameter to ambient temperature and kvsat, kvt to zero. Then the
MUBAND parameter was directly set to the value of effective mobility
value extracted from experimental data. This model showed fits as close to
the experimental values as model II(i). Through this modification,
flexibility to set the effective mobility observed in experimental data
directly in simulation models was added to the model.
simulator lang = spice
.MODEL NMOS_aSi atft type=n
+GAMMA=0.026
+VTO=0

71
+TOX=100e-9
+cgso = 2.5e-8 cgdo = 2.5e-8
+rd=500 rs=500
** Removing Temperature Dependence**
+tnom=27
+kvt = 0
+kasat = 0
************************************
+VFB=1.4
+EPS=1.5
+EPSI=18
+sigma0=50e-9
+delta=3
+IOL=20e-9
+VGSL=2
** Effective Mobility **
+MUBAND=4e-4
************************************

72
APPENDIX B
The different layers used for the layout of the ZTO based circuits in the L-Edit
tool are listed below:
Table B1: Layers used in the layout of ZTO based circuits
Layer Function Type
AuPd Gate Fabrication
Al Source/ Drain Fabrication
Active ZTO (Semiconductor) Fabrication
Via Via and Silver plug Fabrication
NMOS Define device Verification
Source Define Al layer as source Verification
Drain Define Al layer as drain Verification
Ntran Define conductive channel Verification
The layers classified as „Fabrication‟ are actually deposited during the fabrication
of ZTO devices. While the layers classified as „Verification‟ are defined only for the
purpose of extraction and verification of the layout.

73
I. Steps involved in laying out a ZTO TFT device
(i) Define the Source and Drain electrodes of the device
(ii) Define Gate and channel (for extraction) of the device
(iii)Adding semiconductor layer (active) to define the device and adding the
identifying layer (NMOS) for extraction of the device

74
(iv) ZTO TFT layout
(v) Connecting Al and AuPd layer by Via
(vi) Crossing of Al and AuPd layer

75
II. Alignment marks
III. Test structures used for capacitance measurements

76
APPENDIX C
Following are the command files defined for the Design Rule Check (DRC) and
Layout Extraction in Tanner EDA:
(i) DRC commend file
TITLE "Organic_ZTO"
// Setup Info
PRECISION 1000
RESOLUTION 5
UNIT LENGTH u
FLAG ACUTE YES
FLAG NONSIMPLE YES
FLAG SKEW YES
FLAG ZEROWIDTHWIRES YES
FLAG POLYGONVERTEXLIMIT 199
FLAG WIREVERTEXLIMIT 200
VIRTUAL CONNECT COLON NO
VIRTUAL CONNECT SEMICOLON AS COLON NO
VIRTUAL CONNECT DEPTH PRIMARY
DRC TOLERANCE FACTOR 0.005
LAYOUT PRIMARY "OPAMP_Mask4_final"
// Input Layers
LAYER Active 4
LAYER Al 2
LAYER drain 1009
LAYER n_mos 5
LAYER ntran 1011
LAYER Pd_Au 1
LAYER source 1010
LAYER Via1 13
// Rules
PdAu_Min_Width @ < 4.9 Microns
INTERNAL Pd_Au < 4.9 ABUT >= 0 < 90 SINGULAR

77
al_without_via = NOT INTERACT Al Via1
gold_al_overlap = AND al_without_via Pd_Au
Gold_Al_Active_surround @ < 2 Microns
ENCLOSURE gold_al_overlap Active < 2 ABUT >= 0 < 90
INSIDE ALSO OUTSIDE ALSO SINGULAR REGION REVERSAL
PdAu_Al_Overlap @ < 1 Microns
INTERNAL Pd_Au Al > 0 < 1 ABUT >= 0 < 90 SINGULAR
Intermediate_0001 = AND drain n_mos
ndiff_d = AND Intermediate_0001 Al
Intermediate_0002 = AND source Al
ndiff_s = AND Intermediate_0002 n_mos
Min_Channel_Length @ < 3 Microns
EXTERNAL ndiff_d ndiff_s < 3 ABUT == 0 INSIDE ALSO
SINGULAR REGION REVERSAL
PdAu_PdAu_Spacing @ < 9.9 Microns
EXTERNAL Pd_Au < 9.9 SINGULAR
PdAu_Al_Spacing @ < 2.45 Microns
EXTERNAL Pd_Au Al < 2.45 ABUT >= 0 < 90 SINGULAR
Al_Min_Width @ < 4.9 Microns
INTERNAL Al < 4.9 SINGULAR
Al_Al_Spacing @ < 3.9 Microns
EXTERNAL Al < 3.9 SINGULAR
Via_Al_Surround @ < 3 Microns
ENCLOSURE Via1 Al < 3 ABUT == 0 SINGULAR
Result1 = CUT Via1 Al
Via_PdAu_Surround @ < 3 Microns
ENCLOSURE Via1 Pd_Au < 3 ABUT == 0 SINGULAR
Result1 = CUT Via1 Pd_Au
Via_Via_Spacing @ < 10 Microns
EXTERNAL Via1 < 10 SINGULAR
Active_ntran_Surround @ < 2 Microns
ENCLOSURE ntran Active < 2 ABUT == 0 SINGULAR

78
Via_Min_Width @ < 20 Microns
INTERNAL Via1 < 20 ABUT >= 0 < 90 SINGULAR
(ii) Layout extraction command file
# File: Organic_ZTO.ext
# For: Extract definition file
# Technology: Solution based ZTO Process
# Technology Setup File and Test/Demo Suite: Organic_ZTO_TechSetup.tdb
# Copyright © 2002-2003 Tanner EDA
# All Rights Reserved
#
# This file will work only with L-EDIT Version 7 and greater.
#
******************************************************************
**********
connect(Pd_Au,Al, Via1)
#Commands to recognize ports
attach(Al,ndiff_s)
connect(Al,ndiff_s,ndiff_s)
attach(Al,ndiff_d)
connect(Al,ndiff_d,ndiff_d)
attach(Al,Via1)
attach(Al,Pd_Au)
attach(Label,Al)
attach(Label,Active)
attach(Label,Pd_Au)
connect(gate_org,Pd_Au,Pd_Au)
# NMOS transistor with pDAU gate
device = SUBCKT(
RLAYER=ntran, LW, WIDTH;

79
Dr=ndiff_d, AREA, PERIMETER;
Ga=gate_org, LW, WIDTH;
So=ndiff_s, AREA, PERIMETER;
MODEL=NMOS_VTL;
)

80
APPENDIX D
Mask Alignment and Orientation
The photomask that was used to fabricate the devices consists of four adjacent
squares (1" x 1") one for each layer (Figure 2.5). While fabricating, the squares, which
can be considered as individual masks for each layer, were used one at a time to pattern
and deposit that particular layer. For the fabrication to be successful, the squares should
be aligned perfectly over the wafer at each fabrication step. To aid this alignment,
alignment marks are laid out at different places in the mask. Two different features were
laid out in the masks to aid alignment
(i) An all layer 5u thick ring around the periphery of the entire mask (Figure D.2)
was laid out for a coarse alignment estimate. Since the ring is made of all the
layers, each individual mask for the four different layers will have it. So a rough
alignment of the masks can be done by ensuring that the outer rings are aligned.
(ii) Alignment marks were designed (Figure D.1(a)) and placed at different locations
in the mask to aid finer alignment. In total, 9 alignment marks were placed in each
mask - one at the centre, one each at the four corners and one each at the centre of
each side. The alignment mark consists of a rectangular area of gate layer (red),
which has 3 “+” shaped grooves each for Ag (dark grey) and Al (blue) layers, and
a smaller rectangular area for the semiconductor layer (green), which has 3
grooves for AuPd. The layers that fill the grooves (Ag, Al, and AuPd) were
designed such that they have 1u spacing on all sides as shown in Figure D.1(b).
During the fabrication process, the gate layer was deposited first. Then while
depositing the other layers, their individual masks were placed such that their part

81
of the alignment mark fit perfectly into their respective grooves formed by the
gate, thus ensuring perfect alignment.
Figure D.1 (a) Alignment marks used in the layouts.
(b) Enlarged view of a single groove showing 1u space on all sides.
An "asymmetric pad" was also placed in the mask to assist in interpreting the
orientation of mask easily (Figure D.2). The pad is made in all levels in the shape of a
rectangle, and is placed in an asymmetric corner in the mask to help identify the
orientation of the mask.
Figure D.2: Snapshot of Mask 4 showing the outer “all layer ring” and asymmetric pad

82
Test Structures
Test structures were laid out at different parts of the mask to estimate the overlap
capacitance and its variation with respect to its position in the layout. The test structures
consisted of two sets of three different sizes of overlapping layers (25u x 25u, 50u x 50u,
and 100u x 100u), with 100u x 100u internal pads provided to probe the capacitance
values. In one set, only AuPd and Al layers were overlapping while in the other set AuPd,
Al and ZTO layers were overlapping. The 6 different test structures used in the layouts
are shown below in Figure D.3.
Figure D.3: Test structures used to make capacitance measurements

83
References
[1] A. Dodabalapur, "Organic and polymer transistors for electronics," Materials
Today, vol. 9, pp. 24-30, Apr 2006.
[2] K. Nomura, H. Ohta, A. Takagi, T. Kamiya, M. Hirano, and H. Hosono, "Room-
temperature fabrication of transparent flexible thin-film transistors using
amorphous oxide semiconductors," Nature, vol. 432, pp. 488-492, Nov 2004.
[3] A. Dodabalapur, et al., "European research and development in hybrid flexible
electronics," WTEC Panel report, July 2010.
[4] K. H. Kim, Y. H. Kim, H. J. Kim, J. I. Han, and S. K. Park "Fast and stable
solution-processed transparent oxide thin-film transistor circuits," IEEE Electron
Device Letters, vol. 32, no. 4, Apr 2011.
[5] H. Kumomi, et al., "Materials, devices, and circuits of transparent amorphous-
oxide semiconductor," Journal of Display Technology, vol. 5, no. 12, Dec 2009.
[6] M. Ofuji, et al., "Fast thin-film transistor circuits based on amorphous oxide
semiconductor," IEEE Electron Device Letters, vol. 28, no. 4, Apr 2007.
[7] Y. C Tarn, P. C. Ku, H. H. Hsieh, and L. H. Lu, "An amorphous-silicon
operational amplifier and its application to a 4-bit digital-to-analog converter,"
IEEE Journal of Solid-State Circuits, vol. 45, no. 5, May 2010.
[8] T. Sakurai, A. Matsuzawa, and T. Douseki "Fully-depleted SOI CMOS circuits
and technology for ultra-low power applications," Springer, 2006.
[9] D. A. Good, "Novel Processes for Poly-Si Thin-Film Transistors on Plastic
Substrates," dissertation, University of California, Berkeley, Spring 2007.
[10] C. G. Lee, "Solution-processed zinc-tin oxide thin-film transistors and circuit
applications," dissertation, University of Texas at Austin, Spring 2011.

84
[11] M. Stewart, R. S. Howell, L. Pires, and M. K. Hatalis, "Polysilicon TFT
technology for active matrix OLED displays," IEEE Transactions on Electron
Devices, vol. 48, pp. 845-851, May 2001
[12] J. K. Jeong, et al., "12.1-in. WXGA AMOLED display driven by InGaZnO thin-
film transistors," Journal of the Society for Information Display, vol. 17, pp. 95-
100, Feb 2009.
[13] M. Ito, et al., "Application of amorphous oxide TFT to electrophoretic display,"
Journal of Non-Crystalline Solid, vol. 354, pp. 2777-2782, May 2008.
[14] C. G. Lee, B. Cobb, and A. Dodabalapur, "Band transport and mobility edge in
amorphous solution-processed zinc tin oxide thin-film transistors," Appl. Phys.
Lett., vol. 97, p. 203505, Nov 2010.
[15] C. G. Lee and A. Dodabalapur, "Solution-processed zinc-tin oxide thin-film
transistors with low interfacial trap density and improved performance," Appl.
Phys. Lett., vol. 96, p. 243501, Jun 2010.
[16] D. P. Heineck, B. R. McFarlane, and J. F. Wager, "Zinc Tin Oxide Thin-Film-
Transistor Enhancement/Depletion Inverter," IEEE Electron Device Lett., vol. 30,
pp. 514-516, May 2009.
[17] M. S. Oh, J. I. Han, K. Lee, B. H. Lee, M. M. Sung, and S. Im, "Coupling Top-
and Bottom-Gate ZnO Thin Film Transistors for Low Voltage, High Gain
Inverter," Electrochemical and Solid State Letters, vol. 13, pp. II194-II196, 2010.
[18] D. A. Mourey, D. L. A. Zhao, and T. N. Jackson, "Self-Aligned-Gate ZnO TFT
Circuits," IEEE Electron Device Lett., vol. 31, pp. 326-328, Apr 2010.
[19] D Zhao, D. A Mourey, “Fast Flexible Plastic Substrate ZnO Circuits,” IEEE
Electron Device Letters, vol. 31, no. 4, Apr 2011.

85
[20] S. Sambandan, "High-gain amplifiers with amorphous-silicon thin-film
transistors," IEEE Electron Device Letters, vol. 29, no. 8, Aug 2008.
[21] A. Moini, "Op-amps on flexible substrates with printable materials", unpublished
work, Sept 2009.
[22] H Marien, M. S. J Steyaert, E Veenendaal, and P Heremans, "A fully integrated
ΔΣ ADC in organic thin-film transistor technology on flexible plastic foil," IEEE
Journal of Solid-State Circuits, vol. 46, no. 1, Jan 2011.
[23] Virtuoso® Simulator Circuit Components and Device Models Manual: Cadence
Design Systems, 2007.
[24] Y. P. Tsividis and P. R. Gray, "An Integrated NMOS Operational Amplifier with
internal compensation," IEEE Journal of Solid-State Circuits, vol. 11, pp. 748-
753, Dec 1976.
[25] B. Razavi, "Design of analog CMOS integrated circuits," Tata McGraw Hill,
2002.
[26] Z. Bao and J. J. Locklin, “Organic field-effect transistors”, CRC Press, 2007.
[27] W. Brutting, "Physics of organic semiconductors," ed, 2005.
[28] D. Monroe, "HOPPING IN EXPONENTIAL BAND TAILS," Physical Review
Letters, vol. 54, pp. 146-149, 1985.
[29] C. G. Lee, et al., "Band transport and mobility edge in amorphous solution-
processed zinc tin oxide thin-film transistors," Applied Physics Letters, vol. 97,
Nov 2010.
[30] G. Horowitz, et al., "Temperature and gate voltage dependence of hole mobility
in polycrystalline oligothiophene thin film transistors," Journal of Applied
Physics, vol. 87, pp. 4456-4463, May 2000.

86
[31] F. Torricelli, et al., "A Charge-Based OTFT Model for Circuit Simulation," IEEE
Transactions on Electron Devices, vol. 56, pp. 20-30, Jan 2009.