DisplacementMeasurementsandNumericalAnalysisof Long ...
15
Research Article Displacement Measurements and Numerical Analysis of Long-Term Rock Slope Deformation at Higashi-Shikagoe Limestone Quarry, Japan Clement A. Amagu , 1 Cheng Zhang, 1 Jun-ichi Kodama, 1 Kazuyuki Shioya, 2 Tomoyuki Yamaguchi, 2 Atsushi Sainoki, 3 Daisuke Fukuda, 1 Yoshiaki Fujii, 1 and Mostafa Sharifzadeh 4 1 Rock Mechanics Laboratory, Graduate School of Engineering, Hokkaido University, N13 W8, Kita-Ku, Sapporo 060-8628, Japan 2 Nittetsu Mining Co. Ltd., Yusen Building, 3-2, Marunouchi 2-Chome, Chiyoda-Ku, Tokyo 100-8377, Japan 3 International Research Organization for Advanced Science and Technology, Kumamoto University, Kumamoto 860-8555, Japan 4 Western Australia School of Mine (WASM), Curtin University, Kalgoorlie, Australia Correspondence should be addressed to Clement A. Amagu; [email protected] Received 2 September 2021; Accepted 28 September 2021; Published 11 October 2021 Academic Editor: Xiaohu Zhang Copyright © 2021 Clement A. Amagu et al. is is an open access article distributed under the Creative Commons Attribution License, which permits unrestricted use, distribution, and reproduction in any medium, provided the original work is properly cited. e Higashi-Shikagoe limestone quarry is an open-pit mine situated in Hokkaido Prefecture, Japan, that has experienced four slope failure incidents since 1996. e rock slope behaviour has been monitored since the first failure event by measuring the rock slope surface displacement using an automated polar system. Recent measurements have revealed a gradual decrease of the distance between the beam generator and mirrors over time; however, the displacements and decrease rate differs between the centre and left- and right-hand sides of the quarry. is implies that the deformation characteristics of the rock slope and factors influencing the slope deformation differ at the centre and left- and right-hand sides of the quarry. In this study, the two- dimensional finite element method was used to identify the causes of slope deformation by investigating the effects of limestone excavation at the foot of the rock slope, the deterioration of a ∼70 m-thick clay layer at the rock slope foot wall, and shear failure owing to rainfall infiltration. e numerical results show that slope deformation on the left-hand side and centre of the quarry are induced by clay deterioration, whereas the right-hand side of the quarry is deformed owing to floor excavation and/or shear sliding. e rock slope is presently stable because the magnitude of the rate of displacement decrease is small and no acceleration is observed. 1. Introduction Rock slope stability poses a major challenge to rock engi- neering projects worldwide, including open-pit mines. Rock slopes instability can seriously affect mining operations and lead to high economic losses [1, 2]. e degree of the rock slope stability must therefore be ensured, not only for economics purposes but also to minimise risks related to operation safety [3]. ere are a variety of practical methods to assess slope stability, including laboratory tests on rock core samples, rock mass classification [4–6], field mea- surements [1], and limit equilibrium analysis [7–10]. Recently, Tao et al. [11] proposed a physical model exper- iment to study the control mechanisms of toppling defor- mation of anti-inclined slopes during slope excavation using model-scale NPR anchor cable. From the above studies, it can be said that continuous rock slope deformation mea- surement is vital in mining operation stage to assess slope stability [12], predict future failure, and design potential countermeasures. An automated polar system (APS) has been used to monitor slope movement at the Higashi-Shikagoe limestone quarry, Japan, since July 2002 following the first of four slope failure incidents by measuring rock slope surface Hindawi Advances in Civil Engineering Volume 2021, Article ID 1316402, 15 pages https://doi.org/10.1155/2021/1316402
Transcript of DisplacementMeasurementsandNumericalAnalysisof Long ...

Research ArticleDisplacement Measurements and Numerical Analysis ofLong-Term Rock Slope Deformation at Higashi-ShikagoeLimestone Quarry Japan
Clement A Amagu 1 Cheng Zhang1 Jun-ichi Kodama1 Kazuyuki Shioya2
Tomoyuki Yamaguchi2 Atsushi Sainoki3 Daisuke Fukuda1 Yoshiaki Fujii1
and Mostafa Sharifzadeh4
1RockMechanics Laboratory Graduate School of Engineering Hokkaido University N13W8 Kita-Ku Sapporo 060-8628 Japan2Nittetsu Mining Co Ltd Yusen Building 3-2 Marunouchi 2-Chome Chiyoda-Ku Tokyo 100-8377 Japan3International Research Organization for Advanced Science and Technology Kumamoto University Kumamoto 860-8555 Japan4Western Australia School of Mine (WASM) Curtin University Kalgoorlie Australia
Correspondence should be addressed to Clement A Amagu amaguclementglkgmailcom
Received 2 September 2021 Accepted 28 September 2021 Published 11 October 2021
Academic Editor Xiaohu Zhang
Copyright copy 2021 Clement A Amagu et al is is an open access article distributed under the Creative Commons Attribution Licensewhich permits unrestricted use distribution and reproduction in any medium provided the original work is properly cited
e Higashi-Shikagoe limestone quarry is an open-pit mine situated in Hokkaido Prefecture Japan that has experienced fourslope failure incidents since 1996e rock slope behaviour has been monitored since the first failure event by measuring the rockslope surface displacement using an automated polar system Recent measurements have revealed a gradual decrease of thedistance between the beam generator and mirrors over time however the displacements and decrease rate differs between thecentre and left- and right-hand sides of the quarry is implies that the deformation characteristics of the rock slope and factorsinfluencing the slope deformation differ at the centre and left- and right-hand sides of the quarry In this study the two-dimensional finite element method was used to identify the causes of slope deformation by investigating the effects of limestoneexcavation at the foot of the rock slope the deterioration of a sim70m-thick clay layer at the rock slope foot wall and shear failureowing to rainfall infiltratione numerical results show that slope deformation on the left-hand side and centre of the quarry areinduced by clay deterioration whereas the right-hand side of the quarry is deformed owing to floor excavation andor shearsliding e rock slope is presently stable because the magnitude of the rate of displacement decrease is small and no accelerationis observed
1 Introduction
Rock slope stability poses a major challenge to rock engi-neering projects worldwide including open-pit mines Rockslopes instability can seriously affect mining operations andlead to high economic losses [1 2] e degree of the rockslope stability must therefore be ensured not only foreconomics purposes but also to minimise risks related tooperation safety [3] ere are a variety of practical methodsto assess slope stability including laboratory tests on rockcore samples rock mass classification [4ndash6] field mea-surements [1] and limit equilibrium analysis [7ndash10]
Recently Tao et al [11] proposed a physical model exper-iment to study the control mechanisms of toppling defor-mation of anti-inclined slopes during slope excavation usingmodel-scale NPR anchor cable From the above studies itcan be said that continuous rock slope deformation mea-surement is vital in mining operation stage to assess slopestability [12] predict future failure and design potentialcountermeasures
An automated polar system (APS) has been used tomonitor slope movement at the Higashi-Shikagoe limestonequarry Japan since July 2002 following the first of four slopefailure incidents by measuring rock slope surface
HindawiAdvances in Civil EngineeringVolume 2021 Article ID 1316402 15 pageshttpsdoiorg10115520211316402
displacement Cutting measures were adopted on the upperpart of the rock slope after the second slope failure eventoccurred in July 2004 to increase slope stability by reducingthe slope angle However the rock slope has been observedto continuously deform An accident involving the suddencollapse of 300000ndash400000m3 of rock slope was reported inthe Kagemori limestone quarry Japan following the con-tinuous development of cracks on the slope surface [8] Anunderstanding of the continuous rock slope deformationmechanism at the Higashi-Shikagoe limestone quarry istherefore a crucial issue to assess the rock slope stability
Rainfall-induced landslides and slope failure pose seri-ous threats worldwide In Japan for example nearly 2700landslides and slope failure disasters have been inducedowing to rainfall effects [13] Okata et al [14] Sugiyama et al[15] and Shuin et al [16] performed statistical analyses onthe connection between landslides and slope failure withrainfall intensity duration and antecedent rainfall Cai andUgai [17] pointed out that rainfall infiltration increases thegroundwater level and pore-water pressure consequentlyreducing the shear strength of rocks and possibly leading tolandslides or slope failure In cold regions lowered rockstrength can likely been attributed to the effects of snowmeltwater infiltration [18 19] which causes a large amount ofsurface water flowing through tension cracks to rechargepotential surface weaknesses thus triggering landslides andslope failure
Several cases of slope failure induced by ground motionhave been also reported [20ndash22] Orense [23] reported casesof slope failure induced by large-magnitude ground shakingand soil liquefaction of weathered tuffaceous sandstonesmostly at the boundaries between fill and cut slope sectionsduring the 2011 Tohoku earthquake in Japan To account forthe difficulties in obtaining realistic slope stability evalua-tions during an earthquake Lu et al [22] proposed a nu-merical model involving dynamic slope stress anddeformation to consider the effect of groundwater levelmaterial stiffness deformation and geosynthetics Lu et al[21] defined slope failure during an earthquake to occurwhen a cumulative plastic displacement induced by a dy-namic response exceeds a critical displacement value esti-mated by a static parameter
e above studies indicate that the rock slope defor-mation at the Higashi-Shikagoe limestone quarry may beinduced by rainfall andor earthquake activity However theeffect of earthquakes is not considered particularly seriousbecause rock slope surface displacement changes were notobserved before or after the large 2018 Hokkaido EasternIburi earthquake In contrast rainfall and snowmelt areconsidered to be more strongly affect rock slope stability atthe Higashi-Shikagoe limestone quarry because the maxi-mum rainfall per day is at least 150mm and the cumulativesnowfall is gt1000mm
Another factor that likely affects slope deformation at theHigashi-Shikagoe limestone quarry is an approximately70m-thick clay layer distributed at the foot wall of the rockslope Previous studies on engineering structures have in-dicated that clay plays a vital role in the stability of slopes intunnels and mines [24ndash27] In particular Erguler and
Shakoor [28] showed that the exposure of clay-bearing rocksto natural climatic conditions (eg freeze-thaw cycles) ef-fectively causes rock slaking and disintegration Erguler andUlusay [29] consequently established that clay-bearing rockscan reduce rock slope strength and cause deformation owingto its weak strength and high sensitivity to water contentvariations is is particularly relevant for the water sensi-tivity of clay minerals that tend to swell (eg montmoril-lonite) Van Eeckhout [30] listed five processes of strengthloss in shale fracture energy reduction capillary tensiondecrease pore pressure increase frictional reduction andchemical and corrosive deterioration e results of thesestudies indicate that the rock slope at the Higashi-Shikagoelimestone quarry likely deforms owing to deterioration ofthe clay seam at the foot wall of the rock slope
It should be noted that natural slope displacement isoften induced by inelastic deformation (eg sliding) but thedisplacement of a cut rock slope in an open-pit mine mayalso result from elastic deformation owing to excavation[1 31] Kaneko et al [31] demonstrated that rock slopedeformation behaviour in open-pit mines depends on themagnitude and direction of rock stress mostly the ratio ofhorizontal stress (σH) to vertical stress (σV) because exca-vation typically relieves stress from a rock mass eyconcluded that a rock slope contracts when σHσV is smalland extends when σHσV is large Kodama et al [1] con-ducted case studies to investigate long-term rock slopedeformation observed at the Ikura limestone quarry underexcavation processes ey concluded that the rock slopedeformation can be interpreted as elastic deformation owingto excavation ese studies indicate that excavation is ex-pected to be a significant cause of the slope deformation atthe Higashi-Shikagoe limestone quarry However thesestudies estimated the rock slope deformation by assumingrock mass was homogeneous and elastic material
From the above discussion it can be said that a numberof studies have been undertaken to understand character-istics of slope deformation and several principal factorstriggering slope instability in an open-pit mine Howeverthe study on the impact of clay layer on mining-induceddeformation is limited us understanding the elasto-plastic behaviour of clay rock is deemed necessary inassessing slope stability at Higashi-Shikagoe limestonequarry is is mainly because mechanical properties of clayrocks are certainly different from those of limestone Fur-thermore clay rocks are likely to show elastoplastic be-haviours due to release of confining stress by excavation
e present study aims at clarifying the causes of long-term slope deformation at Higashi-Shikagoe limestonequarry using numerical simulation and to assess the rockslope stability considering the impact of the clay layer Atfirst the characteristics of the rock slope deformation wereclarified by analysing surface displacement measured usingan automated polar system (APS) e relationship betweenthe slope deformation characteristics and elevation of thequarry was established Secondly deformation resultingfrom the deterioration of a sim70m-thick clay layer at the rockslope foot wall was predicted irdly the impact of exca-vation at the foot of the rock slope on the slope deformation
2 Advances in Civil Engineering
was estimated by considering elastoplastic behaviours of theclay layer Fourthly the influence of rainfall was examinedassuming that groundwater reduces the shear strength ofrockmass Finally the stability of the rock slope at the quarrywas assessed by ascertaining the possible factors affecting therock slope deformation based on comparisons between themeasured and simulated results
2 Description of the Higashi-ShikagoeLimestone Quarry
e Higashi-Shikagoe limestone quarry is a small-scale minesituated in Minami Furano Central Hokkaido PrefectureJapan e site is approximately 400m from artificial LakeKanayama e quarry has been in operation for more than100 years and operated by Nittestsu Mining Co Ltd with anannual production of 200000 tons e rock mass at thequarry is predominantly composed of high-grade limestoneand schalstein (Figure 1) of the pre-Cretaceous HidakaGroup Although there are other types of rock such as low-grade limestone and slate this altered with the main rocktypes e limestone deposit lies irregularly and is lenticularwith a N30degE strike 680m length and 100ndash200m thicknesse quarried limestone is mainly used in sugar productionbecause of its grade e major geological structure in thequarry is characterized as a right lateral faults which strikeand dip at N70degE-80degS and N70degE-75degN respectively etopographical layout of the rock slope as of July 2019 inFigure 2 is viewed from the direction indicated by the yellowarrow in Figure 1 e quarry has been developed by thebench cut method with a bench height of 10m and overallslope angle of 42deg e working face is presently located at the340m level and the old working face at the northern side belowthe 340m level has been used for backfilling A massive rockslope of 130m in height has been formed with the increasingexcavation level as sketched in Figure 2 A clay seam of ap-proximately 70m in thickness (elevation 440ndash370m) occurs atthe foot wall of the rock slope as illustrated in Figure 2
Figure 3 illustrates the series of events that occurred atthe quarry from 1996 to 2020 including four slope failureincidents e first massive slope failure occurred at the480 m level in December 1996 e slope failure then ex-tended to the 515 m level in July 2004 (Figure 4(a)) Failurelater occurred in April 2009 at the north end of the face of the2004 failure (Figure 4(b)) and then reoccurred in May 2017However mechanism of the slope failures was not discussedin this study as the evidence is not yet clear More signifi-cantly rock slope displacement was begun to be measuredusing an APS in July 2002 to monitor the rock stabilitybehaviour by installing twomirrors at the 480 (ET480-1) and500m levels (ET500-1) To ensure rock slope stability slopeangle reduction and cutting measures were taken at theupper part of the slope from April 2007 until July 2009 asshown in Figure 5 In February 2012 16 surface displace-ment monitoring points (mirrors) were set along the rockslope to monitor the deformation of the entire quarry asshown in Figure 6 Countermeasures such as planting andsupport systems installation (shotcrete and rock bolts shownin Figure 2) have been undertaken since 2018
3 Data and Methods
31AnAutomatedPolar System (APS) Setup forDisplacementMeasurement at theQuarry eAPS consists of a laser beamgenerator located 470m from the top of the slope at an altitudeof 380mon thewestern side of the quarry (Figure 6) Data werecollected from three nearby stations of the nationwide GPSarray of Japan to determine the stability of the base point Inthis study the change in distance from 11 monitoring points(ie APS mirror points) installed on the left- and right-handsides and the centre of the quarry was used to investigate theoverall rock slope deformation behaviour
32 Laboratory Test of Effect of Water Content on YoungrsquosModulus of Clay Specimen As discussed in Section 2 theclay layer at the foot wall may influence the strength re-duction and deformability of the rock slope Erguler andUlusay [29] proposed that a slight increase of water contentmay strongly reduce the strength and deformability of clay-bearing rocks In this section the effect of increasing watercontent on clay deformability was investigated experimen-tally in terms of the effect on Youngrsquos modulus AlsoYoungrsquos modulus of the clay as input parameters for nu-merical simulation was also selected
Cylindrical clay specimens were difficult to prepare bydrilling owing to the inherently weak nature of clay-bearingrocks Cubic specimens with approximate dimensions of50times 50times 50mm were thus cut from a clay block especimens were dried at 80degC in an oven for more than 24 huntil reaching a constant mass and then cooled to roomtemperature for a minimum of one week prior to testingUniaxial compressive stress tests were then applied on thespecimens at a constant loading rate of 04Ns using a loadframe manufactured by Instron company
e experiments were carried out on the specimensunder three water content conditions In the first stage thespecimen was subjected to three loading cycles e watercontent of the specimens cooled at room temperature wasapproximated to 1 e specimens were then covered witha wet towel for 24 h to increase their water content reeloading cycles were then applied to the specimens under
Figure 1 Geological map of the quarry Yellow arrow shows thedirectional view of the rock slopersquos layout in Figure 2
Advances in Civil Engineering 3
42deg
55deg
Average angle
Slope fa
ce
Toe
4 m
Berm Bench height 10 m
Crest
Figure 2e layout of rock slope at the quarry (photo taken in the direction of yellow arrow shown in Figure 1)e support system zone isthe area where rock bolts and shotcrete is installed to control the deformation
1995
Countermeasures
Displacement measurement
In December 1996 failure at 480 mL
In July 2004 the failure was extented to 515 mL
In April 2009 failure at the north end of face
In July 2002 monitoring of rock slope by APS begun
In Feb 2012 a total of 16 APS mirrors were set
Cutting upper part of slope from April 2007 to July 2009
Planting shotcrete and rock bolting started from April 2018
In may 2017 Re-failure at the northend of face
Slope failure
1997 1999 2001 2003 2005 2007 2009 2010 2012 2014 2016 2018 2020
Figure 3 An illustration of events that have occurred at the quarry
(a) (b)
Figure 4 Slope failure that occurred at the quarry in (a) July 2004 and (b) April 2009
4 Advances in Civil Engineering
water contents of approximately 11 e specimens werethen covered with a wet towel for another 24 h and threeloading cycles were applied again under water contents ofapproximately 19 e peak loading stress was set to0145MPa e stress-strain curves were linear in the stressrange of 008ndash0145MPa As mentioned cyclic loading wasapplied to the specimens in each stage to eliminate the effectsof stress release and consolidation on the specimendeformability For example the specimens might haveloosened upon release of the overburden
e relationship between Youngrsquos modulus and watercontent of the clay specimens is shown in Figure 7 Youngrsquosmodulus is found to rapidly decrease with increasing watercontent from 21 55 and 50MPa in the first second andthird load cycles respectively for water contents of ap-proximately 1 to 3 17 and 21MPa for water contents ofapproximately 19 ese results demonstrate that Youngrsquosmodulus of clay in the quarry considerably decreases withincreasing water content under both loose and consolidatedconditions
(a) (b)
Figure 5 Layout of the rock slope (a) before and (b) after cutting upper part of the slope in July 2004 and November 2009
Figure 6 Map showing the APS at the quarry e ETrepresents the mirror point locations of the automated polar system (APS) set on therock slope Each mirror point is represented with a number that indicates its level of elevation
Advances in Civil Engineering 5
33 Numerical Model Description of the Rock Slope Defor-mation Characteristics e potential causes of rock slopedeformation at the Higashi-Shikagoe limestone quarry areinvestigated by numerical analysis e two-dimensional finiteelement method (2D FEM) was used to simulate deformationinduced by clay deterioration excavation and shear failure Anumerical analysis model of layered rock slope establishedusing a commercial finite element program (MIDAS GTSNX2014 (V21)) [32] was used in this study e geological profileof the rock slope along the cross-sectional area of the quarrydesignated as V33 (Figure 1) was used to build the numericalmodel shown in Figure 8(a) e finite element meshes shownin Figure 8(b) were generated using six-node triangular ele-ments based on the elevation readings from the cross-sectionalarea of the quarry e entire analytical model has dimensionsof 830m from north to south and 1489m from east to west
In this model the ground types are classified into twogroups hard rock mass (limestone schalstein and slate) andclay based on their notably different Youngrsquos modulus [33]Youngrsquos modulus of the rock specimens can be relativelyevaluated by various laboratory tests [33] However anestimation of rock mass mechanical properties from testresults of rock specimens can be difficult except for in situtests because the rock specimens are strongly affected byinhomogeneity [3] e quality of the hard rock and clayseam are therefore assumed to average and poor respec-tively Youngrsquos modulus of the hard rock was set to 1GPawhereas that of the clay was assumed to be 120 and 150 ofthat of the hard rock with the aim of examining the key roleplayed by the presence of clay in causing rock slope insta-bility e unit weight and Poissonrsquos ratio of the hard rockwere assumed to be 262 kNm3 and 02 respectively whichfall within the reasonable range of values for a good qualityrock mass [34 35]ese properties are presented in Table 1e unit weight and Poissonrsquos ratio of the clay were set to180 kNm3 and 03 respectively which fall within theproperties of soft clay estimated by Chai and Miura [36] Itshould be noted however that elastoplastic analyses toinvestigate behaviour of rock mass intersected with a weakclay zone are critical in assessing the slope stability [37] Inthis regard assuming the elastoplastic behaviour of the clayrock for the numerical simulation is vital to assess the slope
stability in the study quarry In this study for simplicity clayrock was assumed to be perfect elastoplastic materialwhereas the hard rock mass was assumed to be isotropicelastic material All analyses were carried out under planestrain conditions Normal displacements to the surface at theright and left sides and bottom face of the model(Figure 8(b)) were fixed to zero For comparison with themeasurement results the change in distance was analysedbetween several points on the slope surface at different el-evations and beam generator points e displacementvector on the slope surface and beam generator point wasalso analysed to understand the causes of the distancechange In this study a qualitative comparison between theanalytical and measurement results is given because Youngrsquosmodulus of the hard rock was set to a unit valuee changesin distance were normalised to the maximum value and arelative magnitude was assigned to the displacement vectorsas discussed detail in the later section
4 Results and Analysis
41 Analysis of Measured Results In this study the change indistances from 11 APS monitoring points installed at the left-and right-hand sides and centre of the quarry was analysed toinvestigate the overall characteristics of the rock slope defor-mation Figure 9 shows that the change in distance between thebeam generator and each mirror gradually decreased betweenJanuary 2014 and April 2019 e total distance change rangesbetween approximately 20 and 100mm e trends are gen-erally similar for all mirror positions but the decreasing ratesdifferis implies that the rock slope deformation depends onthe position of the quarry
e relationship between the change in distance and ele-vation was analysed to better understand the rock slope de-formation characteristics of the entire quarry by classifying themirrors into three groups north (ie left-hand side of thequarry ET460-1 ET480-1 ET500-1 ET520-1 and ET560-1)central (central side of the quarry ET480-2 and ET520-2) andsouth (right-hand side of the quarry ET480-3 ET520-3 andET560-2) ET590-1 is installed at the top of the slope and iscommon in all of the three groups e mirrors are respec-tively indicated as red green blue and purple in Figure 6ecorrelation of each group (Figure 10) clearly shows that thegreatest reductions of distance occurred in the middle (ele-vation 520m) of the rock slope (Figures 10(a) and 10(b)) Incontrast the decrease in distance reaches a maximum at theslope foot as shown in Figure 10(c) ese results indicate thatthe factors that influence the slope deformation on the left-hand side and central part of the quarry are likely similar butdiffer from those that influence the slope deformation on theright-hand side of the slope
42 Analysis of Numerical Results In this section the nu-merical calculations were qualitatively analysed to identifythe causes of the slope deformation at the Higashi-Shikagoelimestone quarry using the two-dimensional finite elementmethod (2D FEM)e deformation characteristics based onthe numerical simulations were then compared with the
00
10
20
Youn
grsquos m
odul
us o
f cla
y (M
Pa)
30
40
50
60
5 10Water content ()
15 20
1st loading2nd loading3rd loading
Figure 7 Youngrsquos modulus of the clay specimens at different watercontents
6 Advances in Civil Engineering
measured displacement results to ascertain the possiblefactors affecting the rock slope deformation as observed atthe quarry as discussed detail in the later section
421 Displacement Induced by Clay Deterioration Toclarify the effect of the reduced Youngrsquos modulus of the clayon the rock slope deformation two basic cases (Case _a and
600
550
500
450
400
350
300
250
200000 25000 48943
200
250
300
350
400
450
500
550
600
(a)
830
m
1489 m
580
m
(b)
Figure 8 (a) Geological cross section along the line V33 in Figure 1 and (b) entire analytical model of the quarry Simulated results ofinduced displacement in the blue rectangle are shown
Table 1 Mechanical properties of the rock materials
Properties Hard rock mass ClayUnit weight c (kNm3)a 262a 180c
Youngrsquos modulus E (GPa)b 1 005 and 002Poissonrsquos ratio v 02a 03c
Cohesion c (MPa) 30d 002e
Friction angle ϕ (deg) 40 and 50d 35eae unit weight adopted from Bell bAssumed cAdopted from Chai and Miura dCalculated from laboratory test results by Bandazi eAdopted from Chaiet al
112014-120
-100
-80Chan
ge in
dist
ance
(mm
)
-60
-40
-20
0
20
112015 112016 112017 112018 112019
ET460ET480_1ET480_2ET480_3
ET500ET520_1ET520_2ET520_3
ET560_1ET560_2ET590
Figure 9 Change in distance with time for periods of five years from 2014sim2019
Advances in Civil Engineering 7
Case _b Table 2) were modelled following the simulationconditions described in Section 33 Based on the experi-mental results described in Section 32 Youngrsquos modulus ofclay was set to 50 and 20MPa in the initial stages and thenassumed to deteriorate to 20 and 3MPa respectively owingto increased water contact whereas Youngrsquos modulus of thehard rock was set to 1GPa (Table 2) e mechanicalproperties presented in Tables 1 and 2 were usede relativedisplacements induced by the reduced Youngrsquos modulus ofthe clay were then calculated for each model by subtractingthe displacement in the initial model from that in the de-teriorated model Figure 11 shows the displacement vectorsat the surface of the rock slope in Case_a(50MPa⟶ 20MPa) and Case_b (20MPa⟶ 3MPa)Figure 12 depicts the change in distance at an elevation of460ndash590m calculated from the displacement vectors echange in distances were normalised by the maximum valuein case_a and plotted relatively to the quarry elevations asshown in Figure 12 As seen in Figure 11 the displacementvectors show an overall trend of downslope displacement ofthe rock mass from the top to the toe of the rock slopesurface in both cases e maximum displacement wasobserved mostly within the clay zone near the foot of the
slope In Figure 12 it can be seen that the distance decreasedat all elevations between 460 and 590m in both cases echange in distance is considered to decrease because of alarge displacement within the clay zone due to deteriorationwhich induces downslope displacement above the clay zoneIt should be noted that the maximum decreasing rate of thedistance was observed in the middle (sim520m) of the rockslope in both cases although the maximum value in case_a isgreater than that in case_b
422 Excavation-Induced Displacement Displacementowing to excavation is a considerable factor for assessing thedeformation mechanism e deformation of rock slopeoften occurs because the rock mass within an excavationzone is subjected to considerable redistributions of the initialstress state [38] Zhu et al [39] conducted case studies toinvestigate the deformation characteristics and failuremechanism of the anti-dip rock slope induced by miningexcavation at the Changshanhao open-pit mine in Nei-menggu province Chinaey concluded that the rock massin the deformed area bended and moved downwards as aresult of the stress redistribution in the slope caused by the
-120460 470 480 490 500 510 520 530
Elevation (m)540 550 560 570 580 590
-100
Chan
ge in
dist
ance
(mm
)
-80
-60
-40
-20
0
MR_2014MR_2015MR_2016
MR_2017MR_2018MR_2019
(a)
MR_2014MR_2015MR_2016
-90480 490 500 510 520 530
Elevation (m)540 550 560 570 580 590
-70-60
-80Chan
ge in
dist
ance
(mm
)
-50-40-30-20-10
0
(b)
-100480 490 500 510 520 530
Elevation (m)540 550 560 570 580 590
Chan
ge in
dist
ance
(mm
)
-80
-60
-40
-20
0
MR_2015MR_2016MR_2017
MR_2018MR_2019
(c)
Figure 10 Relationship between change in distance from 2014 to 2019 and elevations at (a) the left-hand side (b) centre and (c) right-handside of the quarry
8 Advances in Civil Engineering
continuous excavation of the slope at the mine As men-tioned in Section 2 the limestone had been excavated by thebench cut method on the floor of the quarry Excavation isthus expected to have deformed the rock slope because bothgravity and horizontal stress applied to the floor were re-leased during excavation To address these effects the slopedeformation resulting from excavation was simulated byelastoplastic analysis
In this section numerical models for two stress condi-tions are established and five cases are modelled in each setfor the progressive excavation levels from 2015 to 2019Excavation at the 400m level was completed at the end of2015 and resumed at the 360m level in 2019 e basicconfiguration of the analytical models is the same as thatdiscussed in Section 33 using the mechanical propertiespresented in Table 1 However the geometry of the bluedotted rectangle in Figure 8(b) changed as the excavationprogressed Figure 13 shows the analytical models of thequarry in 2015ndash2019 Some of the boundary conditions are
different in the first model which shows the analysis ofdisplacement induced by horizontal stress release A unithorizontal rock stress (σxx) of 1MPa was applied to theright-hand side of the model In the second model thesimulation conditions including the boundary conditionsfor the analysis of displacement induced by gravity releaseare the same as with the conditions described in Section 33In both models the displacement increment due to exca-vation from 2014 was simulated using the excavationanalysis function equipped in MIDAS GTSNX 2014 (V21)[32]
Examples of the displacement vector at the surface of therock slope and beam generator point induced by excavationare shown in Figure 14 e changes in distance calculatedfrom the distribution of the surface displacement vectorsalong the slope and beam generator point are plotted relativeto the quarry elevation between 460 and 590m as shown inFigure 15 e changes in distance were normalised by themaximum value in 2019 In Figure 14(a) the displacementvectors show the forward displacement of the rock massfrom the top to the toe of the slope It is clearly seen inFigure 15(a) that the distance decreased with similar ten-dencies along both the slope and at the beam generator pointowing to the horizontal stress release as the rock floor wasexcavated likely because of the forward displacement of therock mass As expected the displacement magnitude in-creased upon approaching the slope foot with the greatestdisplacement concentrated near the clay zone e highestdecreasing distance rate is also notably observed near thefoot of the rock slope e displacement vectors along therock slope shown in Figure 14(b) indicate upward andleftward movement of the rock mass whereas the vectors atthe beam generator point show upward and rightwarddisplacement owing to the gravity release when the rockfloor of the pit was excavated Figure 15(b) shows that thedistance at elevation 590ndash460m increased with progressive
590 m
460 m
XY
(a)
XY
590 m
460 m
(b)
Figure 11 Total displacement vector at the surface of rock slope induced by reduction in Youngrsquos modulus of clay case_a (a) and case_b(b) in the blue dotted rectangle in Figure 8(b) e arrows indicate the direction of the displacement whereas the length of the arrow isproportional to the magnitude of the displacement
-11460 480470 490 500 510 520 530
Elevation (m)540 550 560 570 580 590N
orm
aliz
ed ch
ange
in d
istan
ce
-1
-08-07
-09
-06-05-04
Case_aCase_b
Figure 12 Normalized change in distance calculated from sim-ulated results
Table 2 Youngrsquos modulus of hard rock mass and clay rock
CasesClay (GPa)
Hard rock mass (GPa)Initial After deterioration
Case_a 005 002 1Case_b 002 0003 1
Advances in Civil Engineering 9
Excavation zone in 2015Excavation zone in 2017
Excavation zone in 2017
Excavation zone in 2018
Figure 13 FEM meshes in terms of excavation yearly in blue dotted rectangle in Figure 8(b)
590 m
460 m
YX
(a)
YX
590 m
460 m
(b)
Figure 14 Examples of total displacement vector at the surface of rock slope induced by excavation due to (a) release of horizontal stress and(b) gravity in 2019 at the blue dotted rectangle in Figure 8(b) e arrows indicate the directions of the displacement whereas the length ofthe arrow is proportional to the magnitude of the displacement
-1460 480470 490 500 510 520 530
Excavation (m)540 550 560 570 580 590
Nor
mal
ized
chan
ge in
dist
ance
-05
0
EXca_2015EXca_2016EXca_2017
EXca_2018EXca_2019
(a)
EXca_2015EXca_2016EXca_2017
EXca_2018EXca_2019
0
02
04
08
1
Elevation (m)460 480470 490 500 510 520 530 540 550 560 570 580 590
Nor
mal
ized
chan
ge in
dist
ance
06
12
(b)
Figure 15 Normalized change in distance of the simulated results of displacement induced by (a) release of horizontal stress and (b) gravity
10 Advances in Civil Engineering
yearly excavation owing to the leftward and rightwarddisplacement of the rock mass along the slope and at thebeam generator point e maximum distance increase isobserved near the foot of the rock slope where the largestdisplacement magnitude is concentrated
423 Displacement Caused by Reduced Shear Strengthe shear strength reduction method (SSRM) where boththe hard rock mass and clay are assumed to behave as perfectelastoplastic materials was adopted to understand rockslope displacement caused by reduced shear strength afterrainfall infiltration e SSRM is one of the most populartechniques for performing FEM slope analysis [40 41]mainly because it simulates progressive shear failure of theslope under complex geometric conditions [42 43] eSSRM also determines a stress reduction factor or factor ofsafety value that brings a slope to the verge of its failure limit[44 45] according to
CF C
F
F tanminus1 tanF
1113874 1113875
(1)
where C and ϕ are the actual cohesion and friction anglerespectively CF and ϕF are the reduced strength char-acteristics (cohesion and friction angle) and F is a re-duction factor that controls the reduction rate of C and ϕAs noted by Dawson et al [40] and Griffiths and Lane[41] C and ϕ gradually decrease until the final slopefailure is detected
e basic model configuration including the shapesize and boundary conditions was the same as in Section33 is analytical simulation is aimed at clarifying theeffect of shear failure due to reduction in shear strength ofrock mass on the slope deformation As discussed byGriffiths and Lane [41] that deformation and progressivefailure can be simulated by varying the friction angle andor cohesion of the material gradually us in addition tothe elastic modulus and unit weight the cohesion andfriction angle were also included in the simulation e Cand ϕ values of the hard rock mass were estimated fromstandard triaxial compression tests [46] In these laboratorytests the friction angles of limestone and schalstein wereapproximated as 40deg and 50deg respectivelye friction angleof hard rock was set to 40deg and 50deg for two analytical casesIn this model shear strength parameters of the clay wereadopted from Chai et al [47] as presented in Table 1 Usinginput parameter presented in Table 1 the simulation wasperformed In this simulation the reduction factor in-crement ΔF and maximum iteration number were set to001 and 50 cycles respectively e displacement incre-ment induced by plastic deformation owing to sequentialfailure of elements was analysed
e surface displacement vector of the rock slope atϕ 40deg is shown in Figure 16 with the shear strain distri-bution e change in distance calculated from the surfacedisplacement vectors is plotted against the quarry elevation
for comparison as shown in Figure 17 e change indistance is normalised by the maximum value at ϕ 50degFigure 16 shows that the downslope movement of the rockmass occurred at the top of the rock slope e slope clearlyslid relatively downward from the top to the intense shearstrain zone in the middle of the slope resulting in massiveforward displacement of the middle of the rock slopesurface e change in distance decreased as a result of thedownslope movement along the slope and at the beamgenerator point e maximum decreasing rate of thedistance is shown at 460m for both friction angles(Figure 17)
5 Discussion
As described in Section 41 the distance between the beamgenerator and each mirror gradually decreases with time(Figure 9) e reduced distance is greatest at the middle ofthe rock slope (elevation 520m) in the left-hand side andcentre of the quarry but at the foot of the slope in the right-hand side of the quarry (Figure 10) e following de-formation characteristics were estimated based on thenumerical simulations as discussed in Section 42 elowered Youngrsquos modulus of the clay seam reduced thedistance and the maximum decrease is seen at the middleof the slope (Figure 12) e change in distance owing toexcavation of the pit floor depends on the rock stressconditions (Figure 15) e distance increases undergravity force conditions and decreases under horizontalstress conditions e magnitude of the distance reductionunder horizontal stress conditions is greatest at the foot ofthe slope As the shear sliding progressed in the rock slopeowing to reduced rock mass strength the distance de-creased with the greatest magnitude at the foot of the slope(Figure 17) According to the above results the possiblecauses of the continuous deformation of the rock slope atthe Higashi-Shikagoe limestone quarry are deduced asfollows (a) e rock slope displacement at the left-handside and centre of the quarry is caused by deterioration ofthe existing clay layer (b) e rock slope displacement atthe right-hand side is caused by floor excavation andorshear sliding of the slope
As seen in Figure 1 clay is mainly distributed on theleft-hand side and centre of the quarry which consequentlyexhibits significant strength reductions and deformabilityas a result of the clayrsquos contact with water [29] For sim-plicity clay deterioration owing to water was modelled byreducing its Youngrsquos modulus However clay also showsother deterioration types including plastic deformationcracking and breaking [48] It is therefore noted that waterinduces slope displacement resulting from clay deterio-ration For confirmation rainfall time series were analysedand compared with the measured result as shown inFigure 18 e comparison confirms that the distance tendsto decrease with increasing rainfall accumulation rate isrelationship indirectly verifies that the clay deterioration isinduced by water It should be noted that clay deteriorationcan also be caused by other factors Nicholson and Hencher[49] explained that clay deterioration includes the
Advances in Civil Engineering 11
progressive physical and chemical alteration of rock whichis facilitated by stress release freeze-thaw and wet-drycycles [19 28] when exposed to natural climate conditionsIn particular slaking which is caused by repeated exposureto dry and wet conditions is also an important mechanismof clay deterioration [28 50] e clay in the quarry istherefore also possibly susceptible to deterioration viaslaking
Excavation is expected to be one of the dominant causes ofthe slope displacement on the right-hand side of the quarrybecause the limestone on the pit floor of this area has beenexcavated since 2014 (Figure 6) Reduced distances willtherefore occur if the regional horizontal stress at the Higashi-Shikagoe limestone quarry is sufficiently high In this case theeffect of horizontal stress is expected to be greater than that ofthe gravity release For example Obara et al [51] suggestedthat rock slope exhibits elastic extension by excavationresulting in forward displacement of the rock slope at ahorizontal stress to vertical stress ratio of 10 However thisratio tends to increase with inverse depth and is thereforelikely to be greater than 10 in open pit mines [52]
Figure 19 shows the change in distance at the 480ndash500mlevel from the beginning of measurement (July 2002) untilthe second slope failure (July 2004) For comparison thechanges in distance at the same points between April 2014and March 2019 are also shown e decrease ratio of thedistances from 2014 to 2019 is significantly smaller than thatfrom 2002 to 2004 e total change of distance during theslope failure in July 2004 is closer to 1500mm whereas thatfrom 2014 to 2019 is less than 50mm As seen in Figure 19an apparent accelerating decrease is observed in the curvesfrom 2002 to 2004 In contrast the distance from 2014 to2019 decreases at a nearly linear rate with no apparentacceleration (Figure 19) this was probably due to the effectof the undertaken countermeasures such cutting upper partof the slope planting and support systems installation(shotcrete and rock bolt) ese results indicate that the riskof rock slope shear failure is presently low even though thedistance decrease on the south side of the quarry is caused byshear movement of the slope It can therefore be concludedthat the slope is not unstable even though continuousdeformation is observed
Pit floor excavation is one of the dominant causes ofslope deformation ree-dimensional (3D) analysis istherefore necessary because excavation-induced deforma-tion is expected to depend on 3D geometry As discussedearlier other factors such mining-induced plastic behaviourof the clay rock at foot wall of the rock slope encompassingthe orientation of the clay rock geological conditions in-cluding discontinuities (eg fault shown in Figure 1) andrainfall and snowmelt-water infiltration are likely to havesignificant effects on the deformational behaviour of the rockslope Based on the characterized deformation future studywill analyse the deformation with a 3D numerical modelbased on the aforementioned factors e effect of coun-termeasures (eg rock bolts and shotcrete) should also beinvestigated because they are expected to effectively preventfurther clay deterioration
590 m
460 m
x
y
Figure 16 Displacement vector along the rock slope at φ 40(deg) in the blue dotted rectangle in Figure 8(b)e arrow indicates the directionof the displacement whereas the length of the arrow is proportional to the magnitude of the displacement
-12460 480470 490 500 510 520 530
Elevation (m)540 550 560 570 580 590
Nor
mal
ized
chan
ge in
dist
ance
-1
-08
-06
-04
-02
0
ϕ = 40degϕ = 50deg
Figure 17 Normalized change in distance calculated from SSRsimulation results
12 Advances in Civil Engineering
6 Conclusions
is paper investigates the characteristics and causes oflong-term rock slope deformation at the Higashi-Shikagoelimestone quarry in Japan e analysed rock slope dis-placement characteristics in the quarry were measured by anAPS e likely causes of the continuous rock slope de-formation were then investigated numerically using 2D FEMtechniques and discussed based on the characteristics of themeasured displacements e conclusions of this study aresummarised as follows
(1) e measured results reveal that the distance be-tween the beam generator and mirrors is graduallydecreasing with time throughout the slope but themagnitude of decrease depends on the slope positionin the quarry e rate of decreasing distance isgreatest at the middle of the slope on the left-hand
side and centre of the quarry but at the foot of theslope on the right-hand side of the quarry
(2) e simulated results of the change in distance be-tween the beam generator point and slope surfacereveal that the distance decreases owing to a re-duction of Youngrsquos modulus of clay e distancereduction owing to pit floor excavation increasesunder gravity force conditions but decreases underhorizontal stress conditions e distance decreasesowing to shear movement in the rock slope caused bystrength reduction of the rock mass e magnitudeof the decrease in distance owing to the loweredYoungrsquos modulus of clay is the greatest in the middleof the rock slope whereas the highest magnitude ofdecreased distance owing to excavation and shearstrength reduction occurs at the slope foot
(3) e possible causes of the continuous deformation ofthe rock slope at the Higashi-Shikagoe limestonequarry are as follows (a) Clay deterioration owing toincreased water content is one of the dominantcauses of slope displacement on the left-hand sideand centre of the quarry (b)e excavation of the pitfloor can cause slope displacement on the right-handside of the quarry if the horizontal stress is suffi-ciently large e shear sliding of rock mass owing toreduced shear strength is also a considerable cause ofthe slope deformation However the risk of shearfailure of the slope is presently quite low because themagnitude of the decreasing distance is small and noacceleration is observed
Data Availability
e data used in supporting the results of our study areincluded within the article
2016110
-5
-10
Chan
ge in
dist
ance
(mm
)
-15
-20
-25
-30
201631 201651 201671 201691 20161110
500
1000
1500
Cum
ulat
ive r
ainf
all (
mm
day
)2000
2500
ET460ET500ET560-1
ET480-1ET520-1ET560-2
ET480-2ET520-2ET590
ET480-3ET520-3Cumulative rainfall
Figure 18 e comparison between cumulative rainfall and measured change in distance
-15000 800400 1200 1600 2000
Time (days)2400 2800
Chan
ge in
dist
ance
(mm
)
-1000
-500
0
ET480_20141-20194ET480_20027-20047
ET500_20141-20194ET500_20027-20047
slope failure in 2004711
Figure 19e change in distance from 20024 to 20047 and 20141to 20194
Advances in Civil Engineering 13
Conflicts of Interest
e authors declare no conflicts of interest
Acknowledgments
is research was fully supported by the Ministry of Edu-cation Culture Sports Science and Technology Japanthrough the Japanese Government (MEXT) ScholarshipPrograme authors also wish to thank the NittetsuMiningCo Ltd for the opportunity to carry out the research andtheir staff for their immeasurable contribution to dis-placement measurements over the years
References
[1] J Kodama E Nishiyama and K Kaneko ldquoMeasurement andinterpretation of long-term deformation of a rock slope at theIkura limestone quarry Japanrdquo International Journal of RockMechanics and Mining Sciences vol 46 no 1 pp 148ndash1582009
[2] A R Bye and F G Bell ldquoStability assessment and slope designat Sandsloot open pit South Africardquo International Journal ofRock Mechanics and Mining Sciences vol 38 no 3pp 449ndash466 2001
[3] D C Willie and C W Mah Rock SlopeEngineering pp320ndash327 Spon Press 4th edition 2004
[4] B Hassan and M Hani ldquoApplication of rock mass classifi-cation systems to rock slope stability assessment a casestudyrdquo International Journal of Rock Mechanics and Geo-technical Engineering vol 9 pp 993ndash1009 2017
[5] L Pantelidis ldquoRock slope stability assessment through rockmass classification systemsrdquo International Journal of RockMechanics and Mining Sciences vol 46 no 2 pp 315ndash3252009
[6] Y-C Liu and C-S Chen ldquoA new approach for application ofrock mass classification on rock slope stability assessmentrdquoEngineering Geology vol 89 no 1-2 pp 129ndash143 2007
[7] AW Bishop ldquoe use of the slip circle in the stability analysisof slopesrdquo Geotechnique vol 5 no 1 pp 7ndash17 1955
[8] U Yamaguchi and T Shimotani ldquo10 A case study of slopefailure in a limestone quarryrdquo International Journal of RockMechanics and Mining Science amp Geomechanics Abstractsvol 23 no 1 pp 95ndash104 1986
[9] M Ataei and S Bodaghabadi ldquoComprehensive analysis ofslope stability and determination of stable slopes in theChador-Malu iron ore mine using numerical and limitequilibrium methodsrdquo Journal of China University of Miningand Technology vol 18 no 4 pp 488ndash493 2008
[10] D Stead E Eberhardt and J S Coggan ldquoDevelopments in thecharacterization of complex rock slope deformation andfailure using numerical modelling techniquesrdquo EngineeringGeology vol 83 no 1-3 pp 217ndash235 2006
[11] Z G Tao C Zhu M C He and M Karakus ldquoA physicalmodeling-based study on the control mechanisms of NegativePoissonrsquos ratio anchor cable on the stratified toppling de-formation of anti-inclined slopesrdquo International Journal ofRock Mechanics and Mining Sciences vol 138 Article ID104632 2021
[12] N D Rose and O Hungr ldquoForecasting potential rock slopefailure in open pit mines using the inverse-velocity methodrdquoInternational Journal of Rock Mechanics and Mining Sciencesvol 44 no 2 pp 308ndash320 2007
[13] H Fujiita ldquoState of the art of the landslide control in Japanand the issues in the futurerdquo Journal of Japanese GeotechnicalSocial vol 45 no 6 pp 1ndash4 1997 in Japanese
[14] K Okata T Sugiyama H Muraishi et al ldquoStatistical riskestimating method for rainfall on surface collapse of a cutsloperdquo Soils and Foundations vol 34 no 93 pp 49ndash58 1994
[15] T Sugiyama K Okada H Muraishi T Noguchi andM Samizo ldquoStatistical rainfall risk estimating method for adeep collapse of a cut sloperdquo Soils and Foundations vol 35no 4 pp 37ndash48 1995
[16] Y Shuin N Hotta M Suzuki and K-i Ogawa ldquoEsti-mating the effects of heavy rainfall conditions on shallowlandslides using a distributed landslide conceptual modelrdquoPhysics and Chemistry of the Earth Parts ABC vol 49pp 44ndash51 2012
[17] F Cai and K Ugai ldquoNumerical analysis of rainfall effects onslope stabilityrdquo International Journal of Geomechanics vol 4no 2 pp 69ndash78 2004
[18] T Ishikawa T Tokoro andM Seiichi ldquoGeohazard at volcanicsoil slope in cold regions and its influencing factorsrdquo JapaneseGeotechnical Society Special Publication vol 1 no 1 pp 1ndash202015
[19] N Matsuoka ldquoFrost weathering and rockwall erosion in thesoutheastern Swiss Alps long-term (1994-2006) observa-tionsrdquo Geomorphology vol 99 no 1-4 pp 353ndash368 2008
[20] S Ohtsuka and M Matsuo ldquoldquoRigid plastic dynamic defor-mation analysis of structuresrdquordquo in Proceedings of the 1st In-ternational Conference on Earthquake GeotechnicalEngineering pp 1147ndash1152 Tokyo Japan November 1995
[21] L Lu Z J Wang X Y Huang Z Bin and K Arai ldquoDynamicand static combination analysis method of slope stabilityanalysis during earthquakerdquo Mathematical Problems in En-gineering vol 2014 Article ID 573962 13 pages 2014
[22] L Lu Z J WangM L Song and K Arai ldquoStability analysis ofslopes with ground water during earthquakesrdquo EngineeringGeology vol 193 pp 288ndash296 2015
[23] R P Orense ldquoSoil liquefaction and slope failures during the2011 Tohoku Japan Earthquakerdquo in Proceedings of the 2012NZSEE Annual Technical Conference and AGM pp 1ndash8Wellington New Zealand April 2012
[24] T Ivasuc and E Olinic ldquoe effect of clay desensitization withgranular materials on slope stability analysisrdquo Agriculture andAgricultural Science Procedia vol 6 pp 459ndash466 2015
[25] D S Park and B L Kutter ldquoStatic and seismic stability ofsensitive clay slopesrdquo Soil Dynamics and Earthquake Engi-neering vol 79 pp 118ndash129 2015
[26] X Bian Z-S Hong and J-W Ding ldquoEvaluating the effect ofsoil structure on the ground response during shield tunnellingin Shanghai soft clayrdquo Tunnelling and Underground SpaceTechnology vol 58 pp 120ndash132 2016
[27] K V Jessu T R Kostecki A J S Spearing and J ZhangldquoInfluence of varying bedding thickness of underclay on floorstabilityrdquo International Journal of Mining Science and Tech-nology vol 27 no 3 pp 517ndash523 2017
[28] Z A Erguler and A Shakoor ldquoQuantification of fragment sizedistribution of clay-bearing rocks after slake durability test-ingrdquo Environmental and Engineering Geoscience vol 15 no 2pp 81ndash89 2009
[29] Z A Erguler and R Ulusay ldquoWater-induced variations inmechanical properties of clay-bearing rocksrdquo InternationalJournal of Rock Mechanics and Mining Sciences vol 46 no 2pp 355ndash370 2009
14 Advances in Civil Engineering
[30] E M V Eeckhout ldquoe mechanisms of strength reductiondue to moisture in coal mine shalesrdquo International Journal ofRock Mechanics and Mining Sciences vol 13 pp 61ndash67 1976
[31] K Kaneko M Kato Y Noguchi and N Nakamura ldquoIn-fluence of initial stress on rock slope stabilityrdquo in Proceedingsof the international symposium on rock stress BalkemaRoterdam pp 429ndash434 Kumamoto Japan October 1997
[32] N X Gts ldquoMIDAS information Technology Co Ltdrdquo 2014httpwwwmidasGTSNXcom
[33] S Sakurai ldquoIn-situ test of rock masses and interpretation ofthe resultsrdquo Journal of the Society of Materials Science Japanvol 31 no 347 pp 759ndash769 1982 in Japanese
[34] E Hoek and E T Brown ldquoPractical estimates of rock massstrengthrdquo International Journal of Rock Mechanics andMining Sciences vol 34 no 8 pp 1165ndash1186 1997
[35] F G Bell Engineering Properties of Soils and Rocks BlackwellScientific Oxford United Kingdom 4th edition 2000
[36] J-C Chai and N Miura ldquoInvestigation of factors affectingvertical drain behaviorrdquo Journal of Geotechnical and Geo-environmental Engineering vol 125 no 3 pp 216ndash226 1999
[37] D Mao and B Nilson ldquoNumerical analysis of effects ofweakness zones on tunnel stability 2D versus 3D Advances inunderground space developmentrdquo Research publishing ser-vice pp 388ndash398 2013
[38] M C He J L Feng and X M Sun ldquoStability evaluation andoptimal excavated design of rock slope at Antaibao open pitcoal mine Chinardquo International Journal of Rock Mechanicsand Mining Sciences vol 45 no 3 pp 289ndash302 2008
[39] C Zhu M He M Karakus X Cui and Z Tao ldquoInvestigatingtoppling failure mechanism of anti-dip layered slope due toexcavation by physical modellingrdquo Rock Mechanics and RockEngineering vol 53 no 11 pp 5029ndash5050 2020
[40] E M Dawson W H Roth and A Drescher ldquoSlope stabilityanalysis by strength reductionrdquo Geotechnique vol 49 no 6pp 835ndash840 1999
[41] D V Griffiths and P A Lane ldquoSlope stability analysis by finiteelementsrdquo Geotechnique vol 49 no 3 pp 387ndash403 1999
[42] T Matsui and K C San ldquoFinite element slope stabilityanalysis by shear strength reduction techniquerdquo Soils andFoundations vol 32 no 1 pp 59ndash70 1992
[43] J Shen S D Priest and M Karakus ldquoDetermination ofmohr-coulomb shear strength parameters from generalizedhoek-Brown criterion for slope stability analysisrdquo Rock Me-chanics and Rock Engineering vol 45 no 1 pp 123ndash129 2012
[44] O C Zienkiewicz C Humpheson and R W Lewis ldquoAs-sociated and non-associated visco-plasticity and plasticity insoil mechanicsrdquo Geotechnique vol 25 no 4 pp 671ndash6891975
[45] N Farshidfar and A Nayeri ldquoSlope stability analysis by shearstrength reduction methodrdquo Journal of Civil Engineering andUrbanism vol 5 no 1 pp 35ndash37 2015
[46] C N Bandazi Measurement and Analysis of Rock SlopeDisplacement at Higashi Shikagoe limestone Quarry JapanMaster thesis Master thesis in Hokkaido University SapporoJapan 2017
[47] J Chai Y Igaya T Hino and J Carter ldquoFinite elementsimulation of an embankment on soft clay - case studyrdquoComputers and Geotechnics vol 48 pp 117ndash126 2013
[48] W Zhang Q Sun and Y Zhang ldquoCorrelation analyses ofeffects of temperature on physical and mechanical propertiesof clayrdquo Environmental Earth Sciences vol 77 no 17 p 6142018
[49] D T Nicholson and S R Hencher ldquoAssessing the potentialfor deterioration of engineered rock slopesrdquo in Eng Geol the
Env P G Marinos G C Koukis G C Tsiambaos andG C Stournaras Eds pp 911ndash917 Balkema RotterdamNetherlands 1997
[50] T P Gautam and A Shakoor ldquoSlaking behavior of clay-bearing rocks during a one-year exposure to natural climaticconditionsrdquo Engineering Geology vol 166 pp 17ndash25 2013
[51] Y Obara N Nakamura S S Kang and K Kaneko ldquoMea-surement of local stress and estimation of regional stressassociated with stability assessment of an open-pit rocksloperdquo International Journal of Rock Mechanics and MiningSciences vol 37 no 8 pp 1211ndash1221 2000
[52] E T Brown and E Hoek ldquoTrends in relationships betweenmeasured in-situ stresses and depthrdquo International Journal ofRock Mechanics and Mining Science amp Geomechanics Ab-stracts vol 15 no 4 pp 211ndash215 1978
Advances in Civil Engineering 15
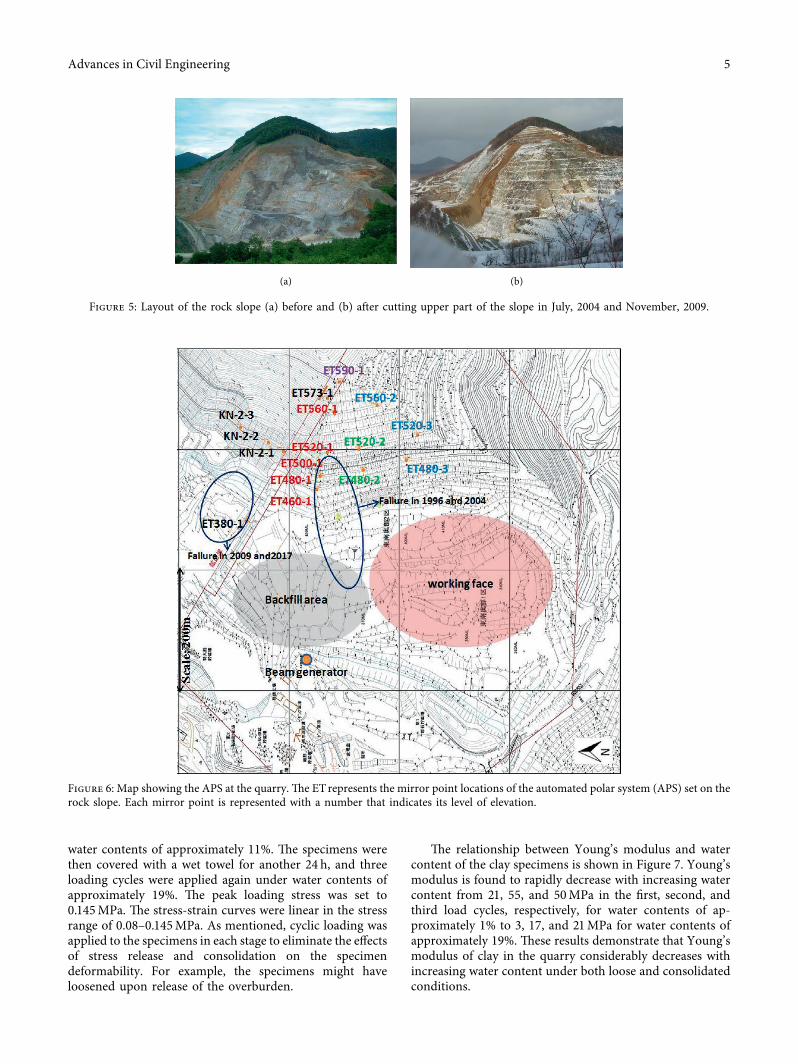
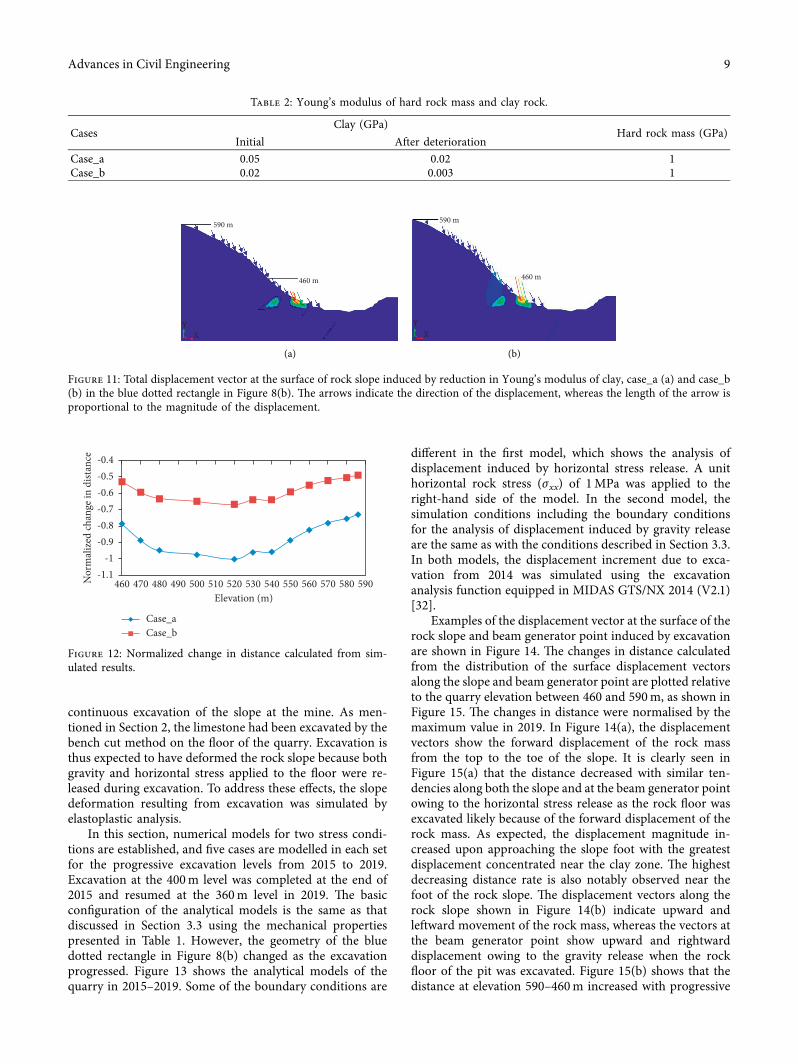
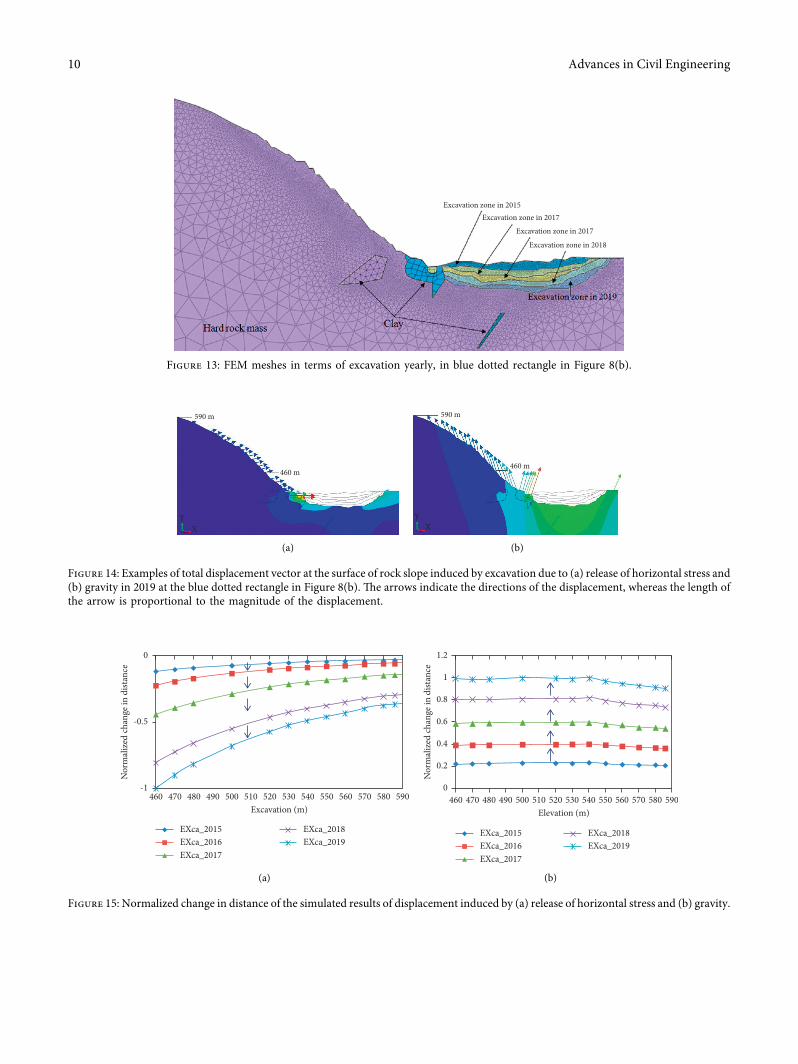
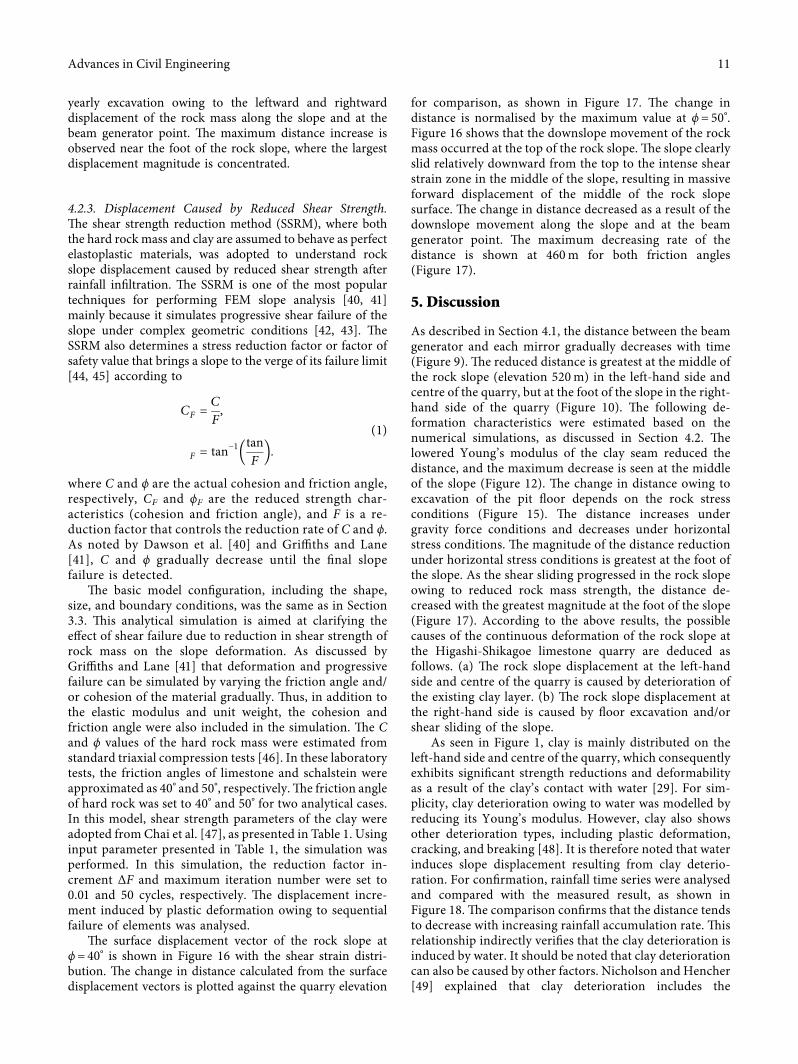
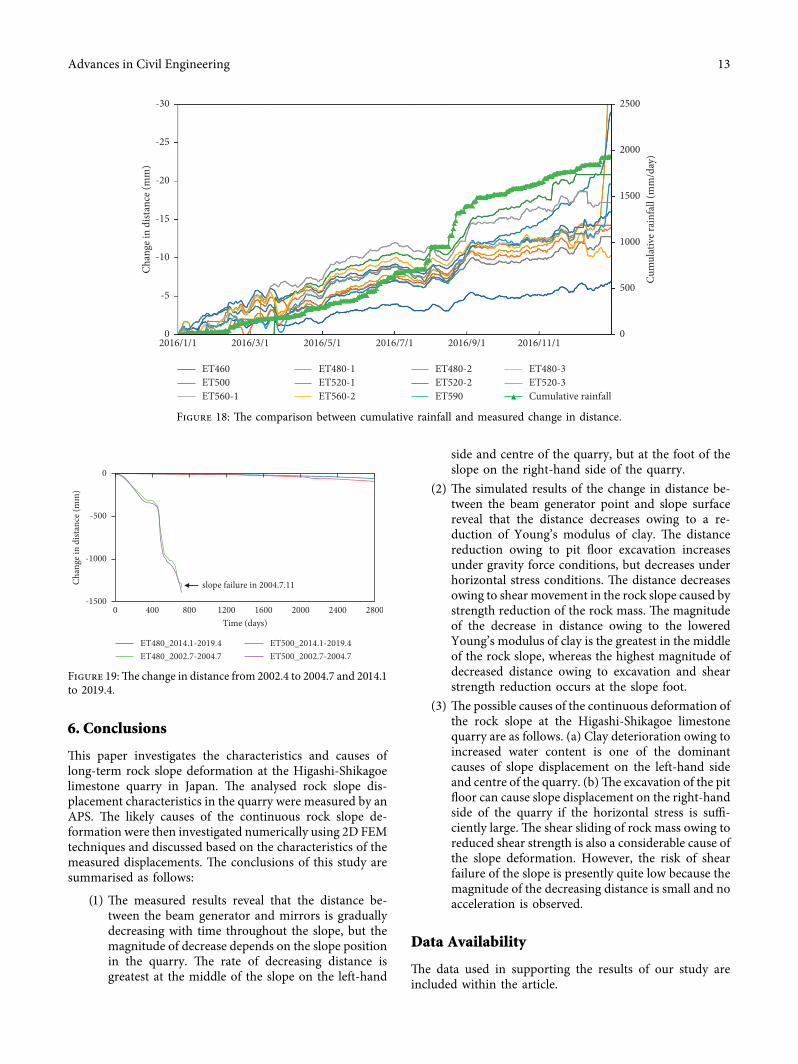
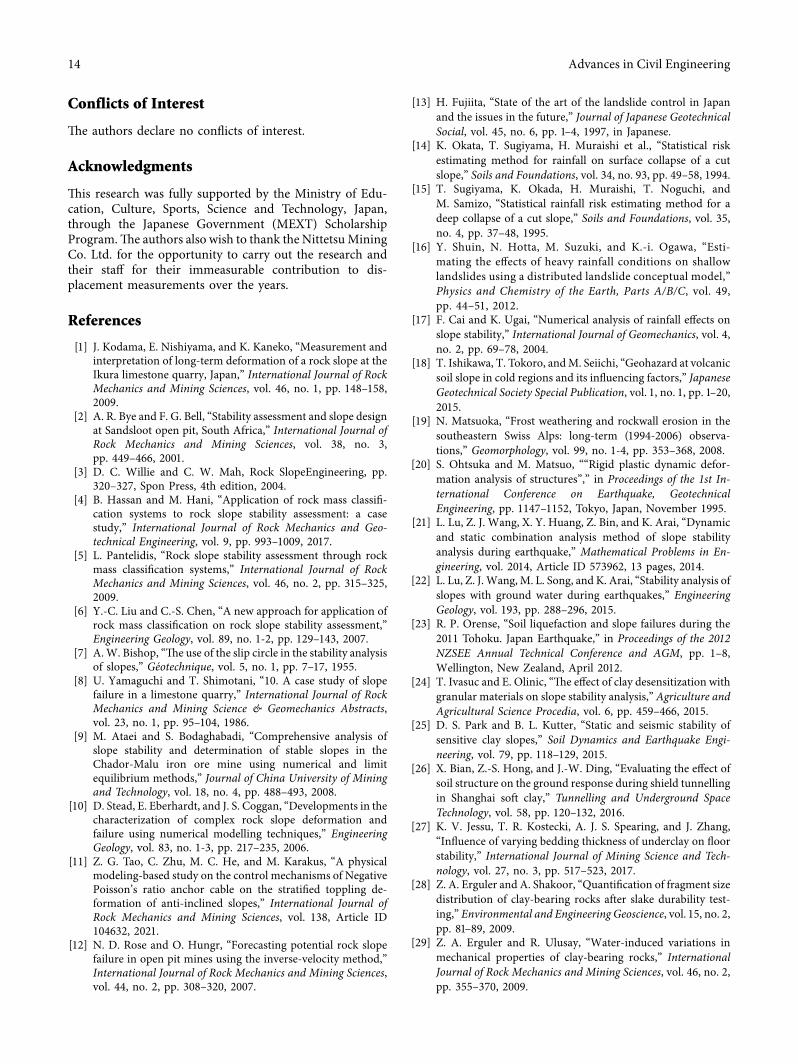