
Digital Marketing Innovation in the Health Care Industry: Service, Measurement and Investment Trends...
19
RESEARCH ABSTRACT: Strategic Benchmarking Research & Analysis Best Practices, LLC Pharma Digital Marketing Innovation:: Service, Measurement, & Investment Trends to Maximize Customer Impact
-
Upload
best-practices-llc -
Category
Marketing
-
view
185 -
download
2
Transcript of Digital Marketing Innovation in the Health Care Industry: Service, Measurement and Investment Trends...
RESEARCH ABSTRACT:
Strategic Benchmarking Research & Analysis
Best Practices, LLC
Pharma Digital Marketing Innovation:: Service, Measurement, & Investment Trends to Maximize Customer Impact
BEST PRACTICES,
®
LLC
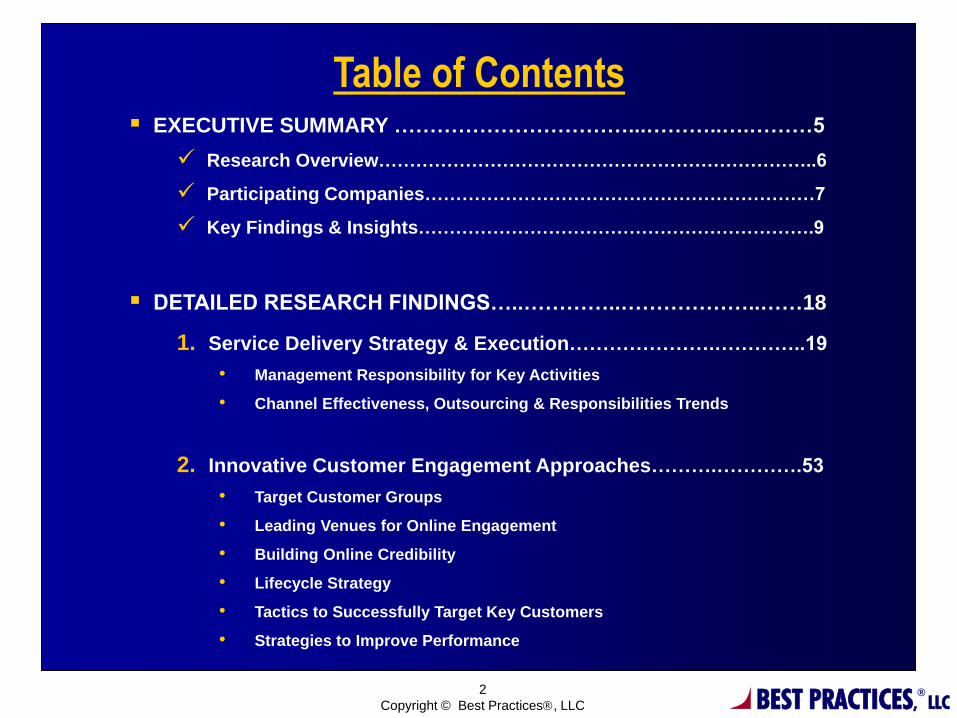
Table of Contents
EXECUTIVE SUMMARY ……………………………...………..….………5
Research Overview……………………………………………………………..6
Participating Companies………………………………………………………7
Key Findings & Insights……………………………………………………….9
DETAILED RESEARCH FINDINGS…..…………..………………..……18
1. Service Delivery Strategy & Execution………………….…………..19
• Management Responsibility for Key Activities
• Channel Effectiveness, Outsourcing & Responsibilities Trends
2. Innovative Customer Engagement Approaches……….………….53
• Target Customer Groups
• Leading Venues for Online Engagement
• Building Online Credibility
• Lifecycle Strategy
• Tactics to Successfully Target Key Customers
• Strategies to Improve Performance
2
Copyright © Best Practices, LLC
BEST PRACTICES,
®
LLC
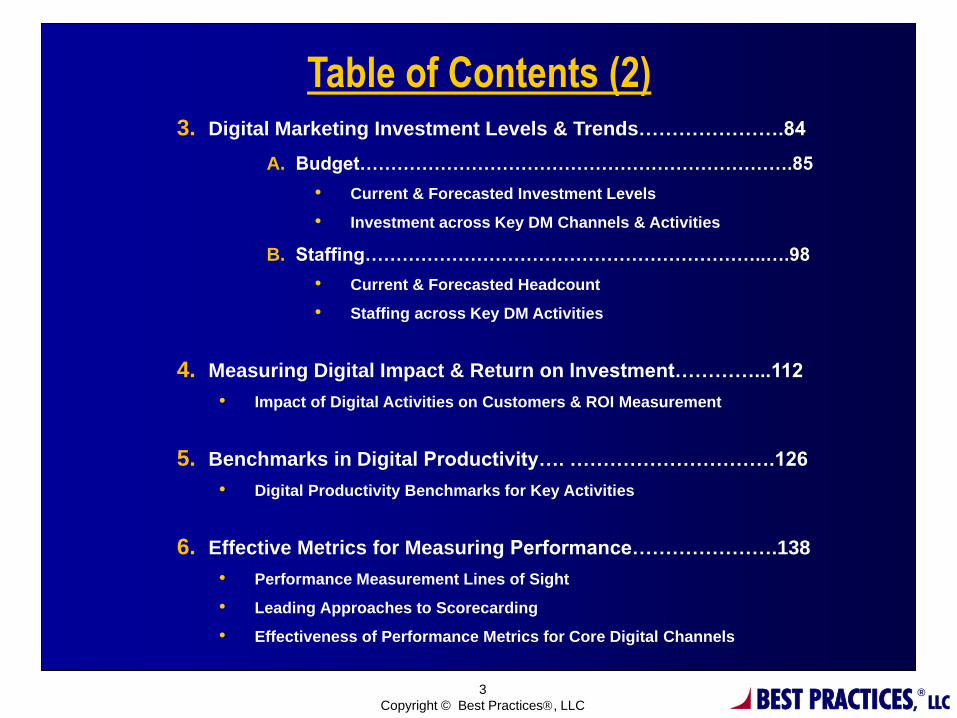
Table of Contents (2)
3. Digital Marketing Investment Levels & Trends………………….84
A. Budget…………………………………………………………….85
• Current & Forecasted Investment Levels
• Investment across Key DM Channels & Activities
B. Staffing………………………………………………………..….98
• Current & Forecasted Headcount
• Staffing across Key DM Activities
4. Measuring Digital Impact & Return on Investment…………...112
• Impact of Digital Activities on Customers & ROI Measurement
5. Benchmarks in Digital Productivity…. ………………………….126
• Digital Productivity Benchmarks for Key Activities
6. Effective Metrics for Measuring Performance………………….138
• Performance Measurement Lines of Sight
• Leading Approaches to Scorecarding
• Effectiveness of Performance Metrics for Core Digital Channels
3
Copyright © Best Practices, LLC
BEST PRACTICES,
®
LLC
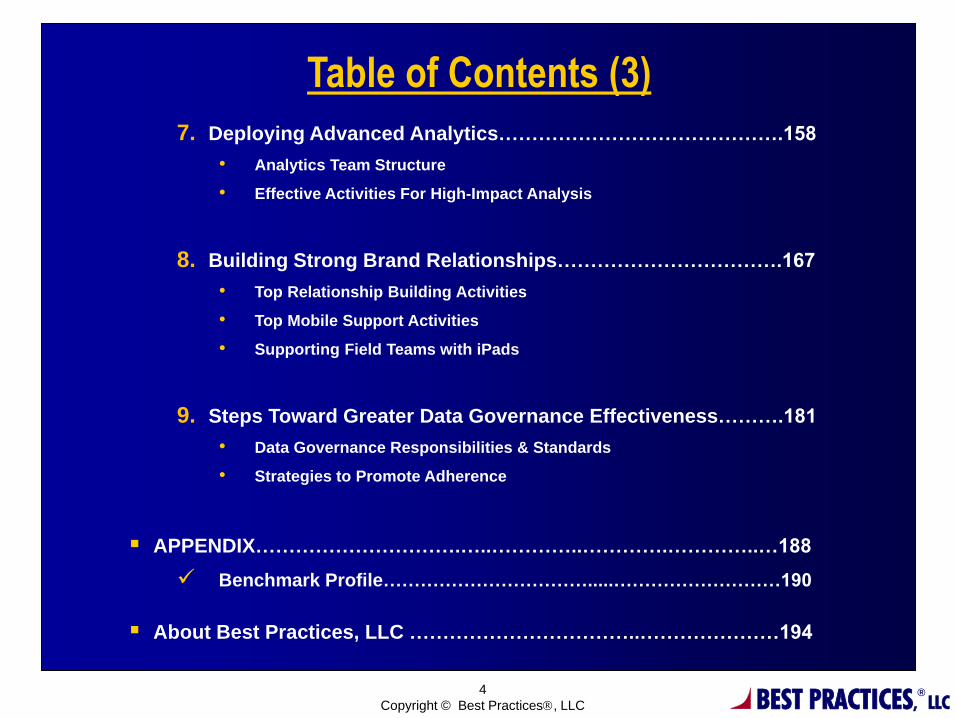
Table of Contents (3)
7. Deploying Advanced Analytics…………………………………….158
• Analytics Team Structure
• Effective Activities For High-Impact Analysis
8. Building Strong Brand Relationships…………………………….167
• Top Relationship Building Activities
• Top Mobile Support Activities
• Supporting Field Teams with iPads
9. Steps Toward Greater Data Governance Effectiveness……….181
• Data Governance Responsibilities & Standards
• Strategies to Promote Adherence
APPENDIX………………………….…..…………..………….…………..…188
Benchmark Profile…………………………….....………………………190
About Best Practices, LLC ……………………………..…………………194
4
Copyright © Best Practices, LLC
BEST PRACTICES,
®
LLC
Topics Included: Study Overview:
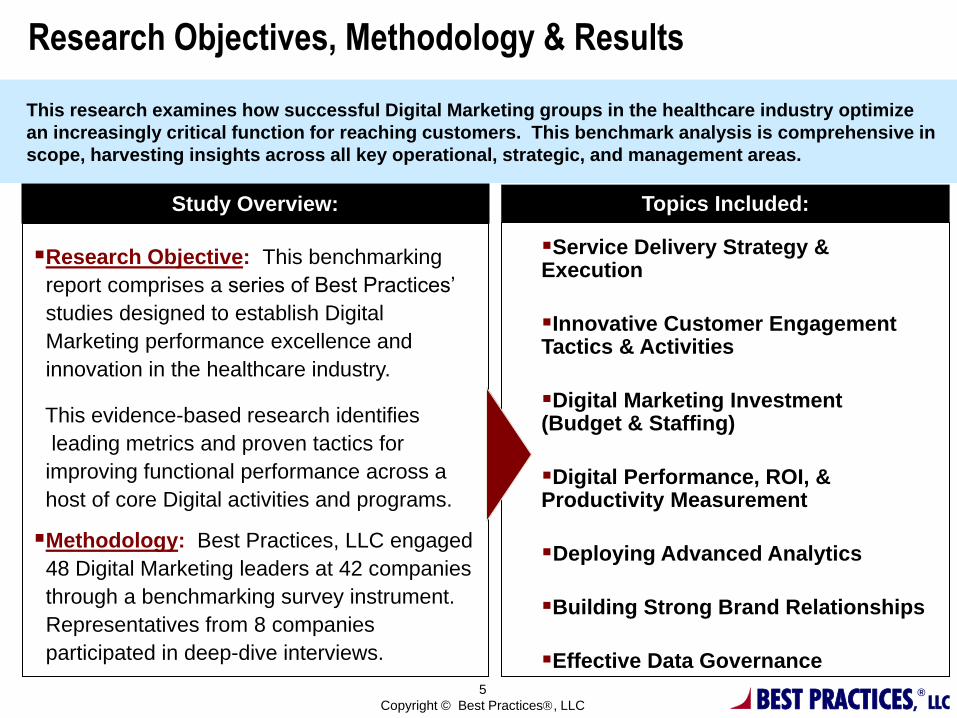
Research Objective: This benchmarking
report comprises a series of Best Practices’
studies designed to establish Digital
Marketing performance excellence and
innovation in the healthcare industry.
This evidence-based research identifies
leading metrics and proven tactics for
improving functional performance across a
host of core Digital activities and programs.
Methodology: Best Practices, LLC engaged
48 Digital Marketing leaders at 42 companies
through a benchmarking survey instrument.
Representatives from 8 companies
participated in deep-dive interviews.
Research Objectives, Methodology & Results
This research examines how successful Digital Marketing groups in the healthcare industry optimize
an increasingly critical function for reaching customers. This benchmark analysis is comprehensive in
scope, harvesting insights across all key operational, strategic, and management areas.
5
Copyright © Best Practices, LLC
Service Delivery Strategy & Execution
Innovative Customer Engagement Tactics & Activities
Digital Marketing Investment (Budget & Staffing)
Digital Performance, ROI, & Productivity Measurement
Deploying Advanced Analytics
Building Strong Brand Relationships
Effective Data Governance
BEST PRACTICES,
®
LLC
Benchmark Class:
6
Copyright © Best Practices, LLC
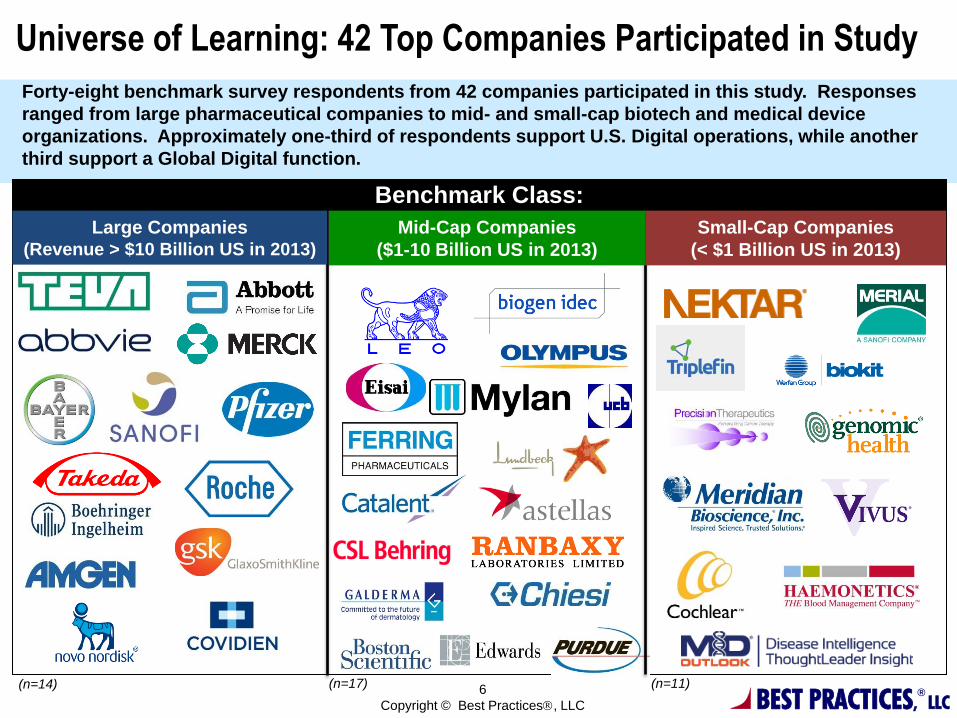
Universe of Learning: 42 Top Companies Participated in Study
Large Companies (Revenue > $10 Billion US in 2013)
Mid-Cap Companies
($1-10 Billion US in 2013)
Small-Cap Companies
(< $1 Billion US in 2013)
(n=14) (n=17) (n=11)
Forty-eight benchmark survey respondents from 42 companies participated in this study. Responses
ranged from large pharmaceutical companies to mid- and small-cap biotech and medical device
organizations. Approximately one-third of respondents support U.S. Digital operations, while another
third support a Global Digital function.
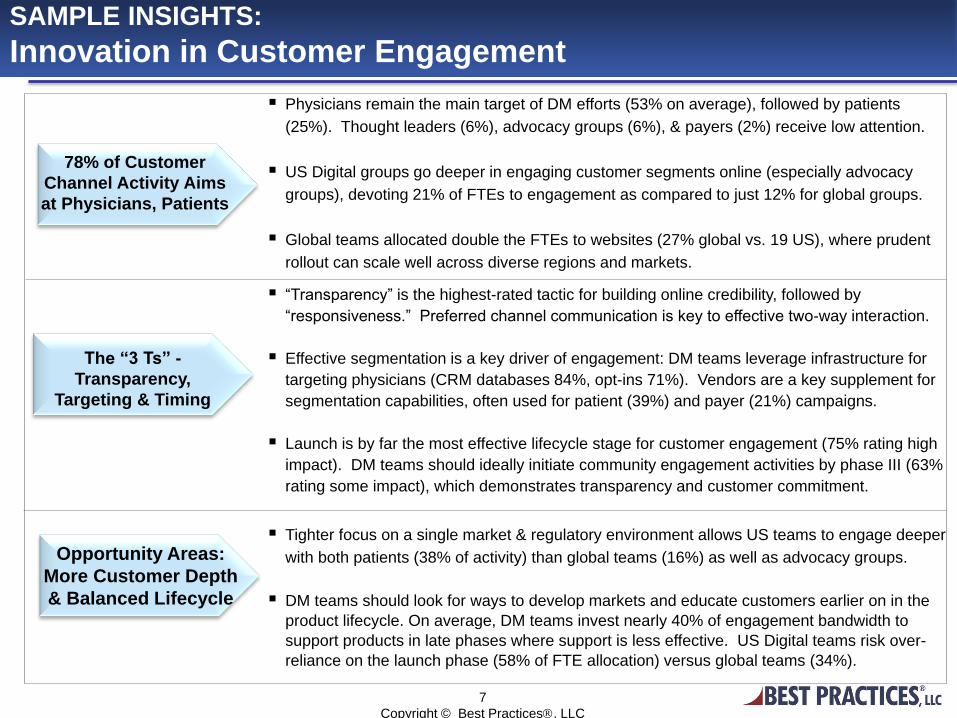
SAMPLE INSIGHTS:
Innovation in Customer Engagement
78% of Customer
Channel Activity Aims
at Physicians, Patients
7
Copyright © Best Practices, LLC
The “3 Ts” -
Transparency,
Targeting & Timing
Opportunity Areas:
More Customer Depth
& Balanced Lifecycle
Physicians remain the main target of DM efforts (53% on average), followed by patients
(25%). Thought leaders (6%), advocacy groups (6%), & payers (2%) receive low attention.
US Digital groups go deeper in engaging customer segments online (especially advocacy
groups), devoting 21% of FTEs to engagement as compared to just 12% for global groups.
Global teams allocated double the FTEs to websites (27% global vs. 19 US), where prudent
rollout can scale well across diverse regions and markets.
“Transparency” is the highest-rated tactic for building online credibility, followed by
“responsiveness.” Preferred channel communication is key to effective two-way interaction.
Effective segmentation is a key driver of engagement: DM teams leverage infrastructure for
targeting physicians (CRM databases 84%, opt-ins 71%). Vendors are a key supplement for
segmentation capabilities, often used for patient (39%) and payer (21%) campaigns.
Launch is by far the most effective lifecycle stage for customer engagement (75% rating high
impact). DM teams should ideally initiate community engagement activities by phase III (63%
rating some impact), which demonstrates transparency and customer commitment.
Tighter focus on a single market & regulatory environment allows US teams to engage deeper
with both patients (38% of activity) than global teams (16%) as well as advocacy groups.
DM teams should look for ways to develop markets and educate customers earlier on in the
product lifecycle. On average, DM teams invest nearly 40% of engagement bandwidth to
support products in late phases where support is less effective. US Digital teams risk over-
reliance on the launch phase (58% of FTE allocation) versus global teams (34%).
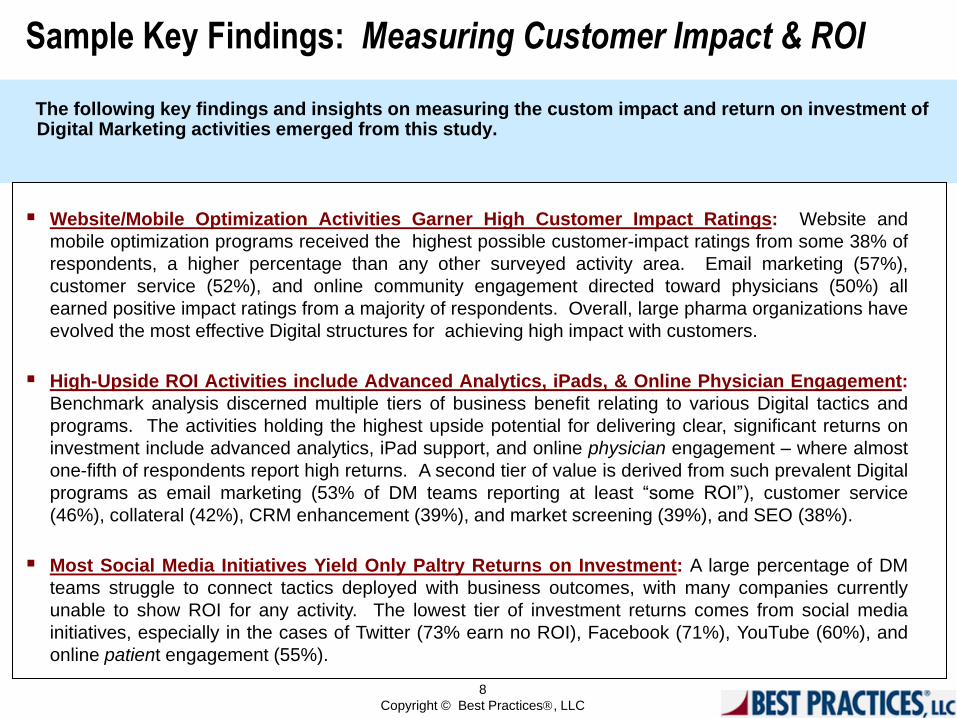
Sample Key Findings: Measuring Customer Impact & ROI
The following key findings and insights on measuring the custom impact and return on investment of Digital Marketing activities emerged from this study.
Website/Mobile Optimization Activities Garner High Customer Impact Ratings: Website and
mobile optimization programs received the highest possible customer-impact ratings from some 38% of
respondents, a higher percentage than any other surveyed activity area. Email marketing (57%),
customer service (52%), and online community engagement directed toward physicians (50%) all
earned positive impact ratings from a majority of respondents. Overall, large pharma organizations have
evolved the most effective Digital structures for achieving high impact with customers.
High-Upside ROI Activities include Advanced Analytics, iPads, & Online Physician Engagement:
Benchmark analysis discerned multiple tiers of business benefit relating to various Digital tactics and
programs. The activities holding the highest upside potential for delivering clear, significant returns on
investment include advanced analytics, iPad support, and online physician engagement – where almost
one-fifth of respondents report high returns. A second tier of value is derived from such prevalent Digital
programs as email marketing (53% of DM teams reporting at least “some ROI”), customer service
(46%), collateral (42%), CRM enhancement (39%), and market screening (39%), and SEO (38%).
Most Social Media Initiatives Yield Only Paltry Returns on Investment: A large percentage of DM
teams struggle to connect tactics deployed with business outcomes, with many companies currently
unable to show ROI for any activity. The lowest tier of investment returns comes from social media
initiatives, especially in the cases of Twitter (73% earn no ROI), Facebook (71%), YouTube (60%), and
online patient engagement (55%).
8
Copyright © Best Practices, LLC
Average Cost to Deliver Common Digital Tasks:
(Total Benchmark Class)
9
Copyright © Best Practices, LLC
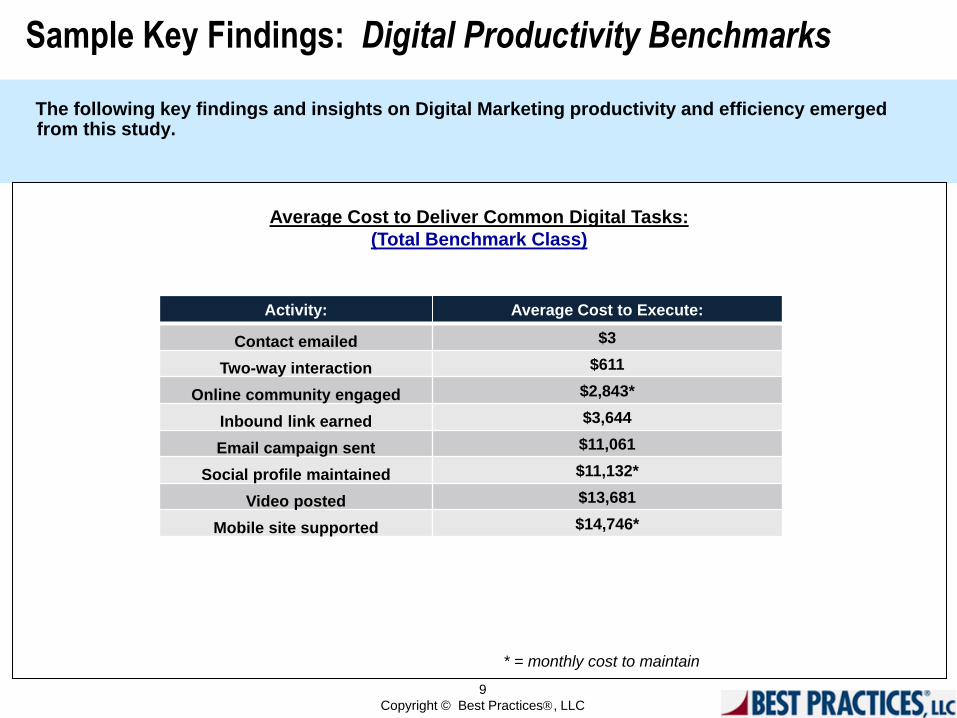
The following key findings and insights on Digital Marketing productivity and efficiency emerged from this study.
Activity: Average Cost to Execute:
Contact emailed $3
Two-way interaction $611
Online community engaged $2,843*
Inbound link earned $3,644
Email campaign sent $11,061
Social profile maintained $11,132*
Video posted $13,681
Mobile site supported $14,746*
* = monthly cost to maintain
Sample Key Findings: Digital Productivity Benchmarks
BEST PRACTICES,
®
LLC
10
Copyright © Best Practices, LLC
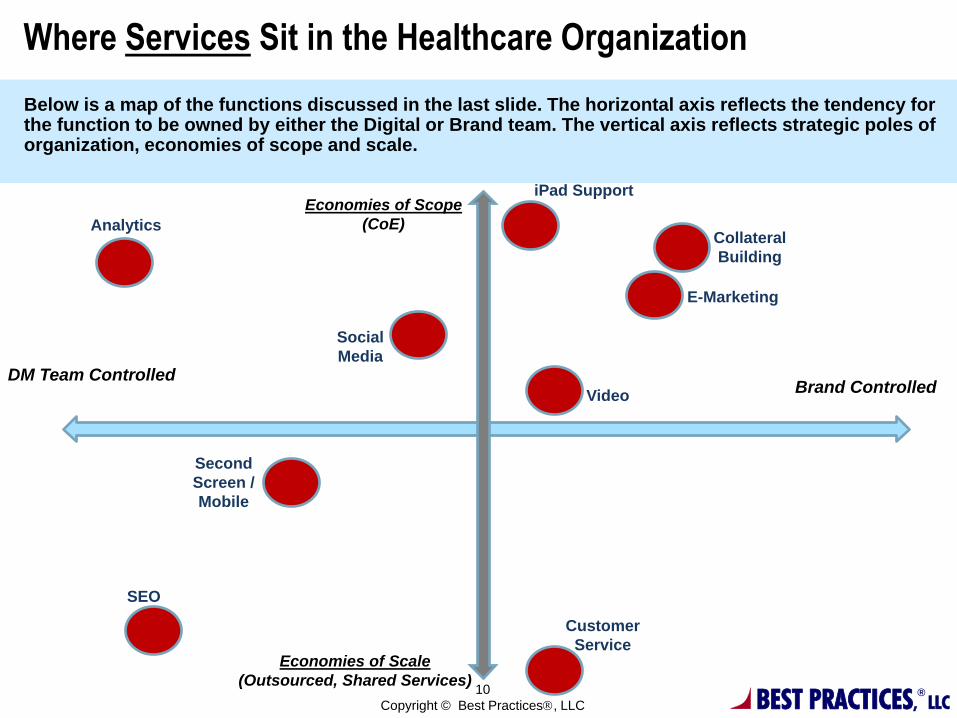
Where Services Sit in the Healthcare Organization
Economies of Scope
(CoE)
Economies of Scale
(Outsourced, Shared Services)
Brand Controlled DM Team Controlled
Analytics
SEO
E-Marketing
Second
Screen /
Mobile
Customer
Service
Collateral
Building
iPad Support
Social
Media
Below is a map of the functions discussed in the last slide. The horizontal axis reflects the tendency for the function to be owned by either the Digital or Brand team. The vertical axis reflects strategic poles of organization, economies of scope and scale.
Video
BEST PRACTICES,
®
LLC
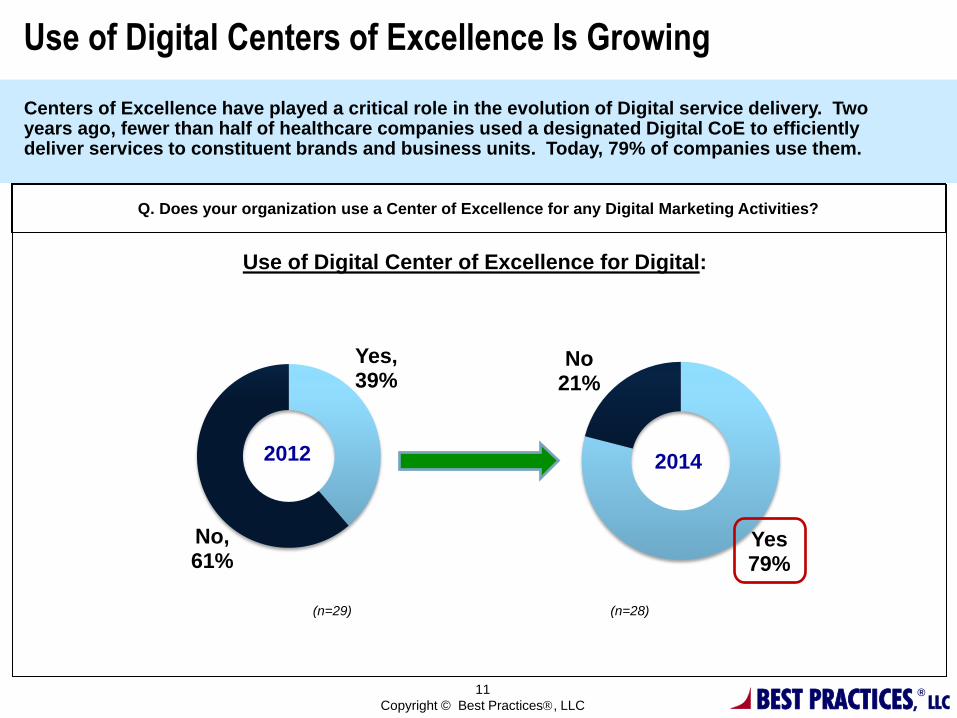
Q. Does your organization use a Center of Excellence for any Digital Marketing Activities?
11
Copyright © Best Practices, LLC
Use of Digital Center of Excellence for Digital:
Use of Digital Centers of Excellence Is Growing
Centers of Excellence have played a critical role in the evolution of Digital service delivery. Two years ago, fewer than half of healthcare companies used a designated Digital CoE to efficiently deliver services to constituent brands and business units. Today, 79% of companies use them.
(n=29)
Yes, 39%
No, 61%
2014 2012
(n=28)
Yes 79%
No 21%
BEST PRACTICES,
®
LLC
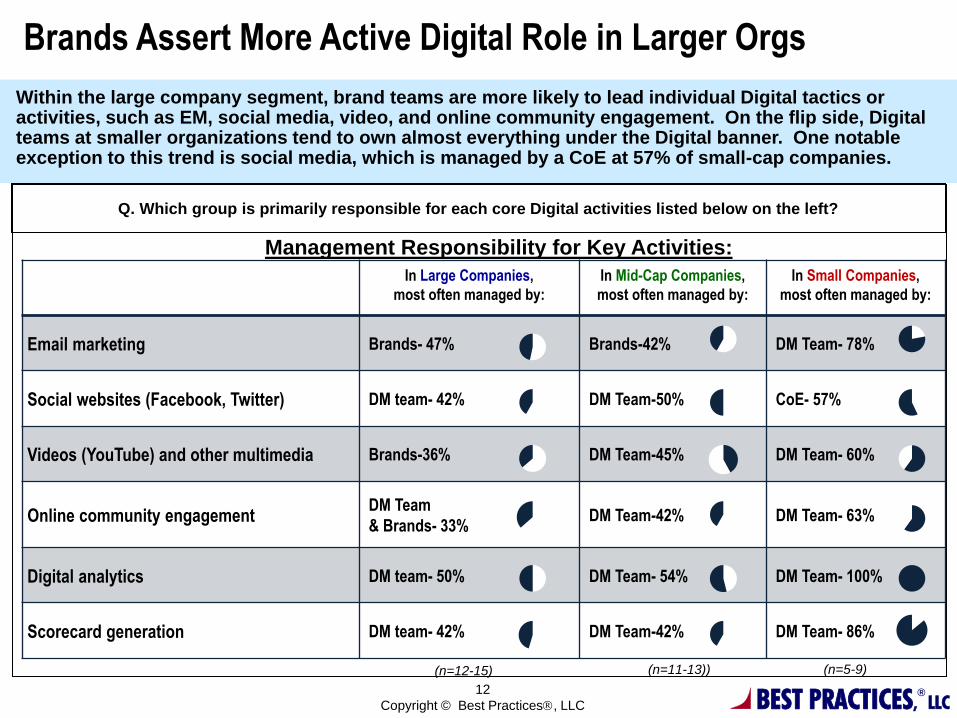
Q. Which group is primarily responsible for each core Digital activities listed below on the left?
12
Copyright © Best Practices, LLC
Management Responsibility for Key Activities:
Brands Assert More Active Digital Role in Larger Orgs
(n=12-15)
In Large Companies,
most often managed by:
In Mid-Cap Companies,
most often managed by:
In Small Companies,
most often managed by:
Email marketing Brands- 47% Brands-42% DM Team- 78%
Social websites (Facebook, Twitter) DM team- 42% DM Team-50% CoE- 57%
Videos (YouTube) and other multimedia Brands-36% DM Team-45% DM Team- 60%
Online community engagement DM Team
& Brands- 33% DM Team-42% DM Team- 63%
Digital analytics DM team- 50% DM Team- 54% DM Team- 100%
Scorecard generation DM team- 42% DM Team-42% DM Team- 86%
Within the large company segment, brand teams are more likely to lead individual Digital tactics or activities, such as EM, social media, video, and online community engagement. On the flip side, Digital teams at smaller organizations tend to own almost everything under the Digital banner. One notable exception to this trend is social media, which is managed by a CoE at 57% of small-cap companies.
(n=11-13)) (n=5-9)
BEST PRACTICES,
®
LLC
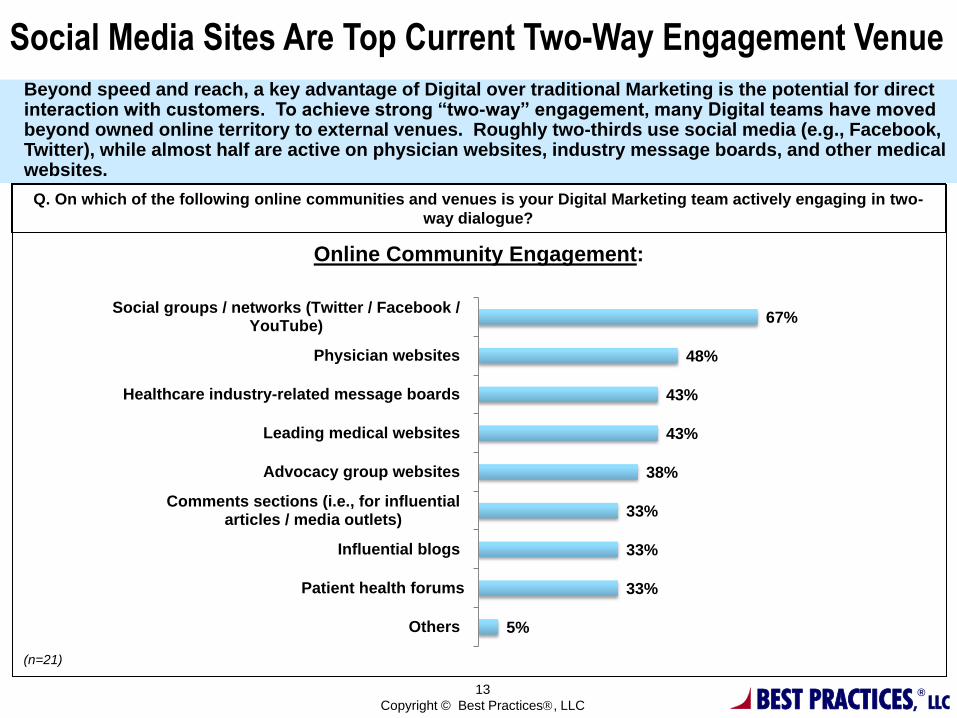
Q. On which of the following online communities and venues is your Digital Marketing team actively engaging in two-
way dialogue?
13
Copyright © Best Practices, LLC
Online Community Engagement:
Social Media Sites Are Top Current Two-Way Engagement Venue
Beyond speed and reach, a key advantage of Digital over traditional Marketing is the potential for direct interaction with customers. To achieve strong “two-way” engagement, many Digital teams have moved beyond owned online territory to external venues. Roughly two-thirds use social media (e.g., Facebook, Twitter), while almost half are active on physician websites, industry message boards, and other medical websites.
5%
33%
33%
33%
38%
43%
43%
48%
67%
Others
Patient health forums
Influential blogs
Comments sections (i.e., for influentialarticles / media outlets)
Advocacy group websites
Leading medical websites
Healthcare industry-related message boards
Physician websites
Social groups / networks (Twitter / Facebook /YouTube)
(n=21)
BEST PRACTICES,
®
LLC
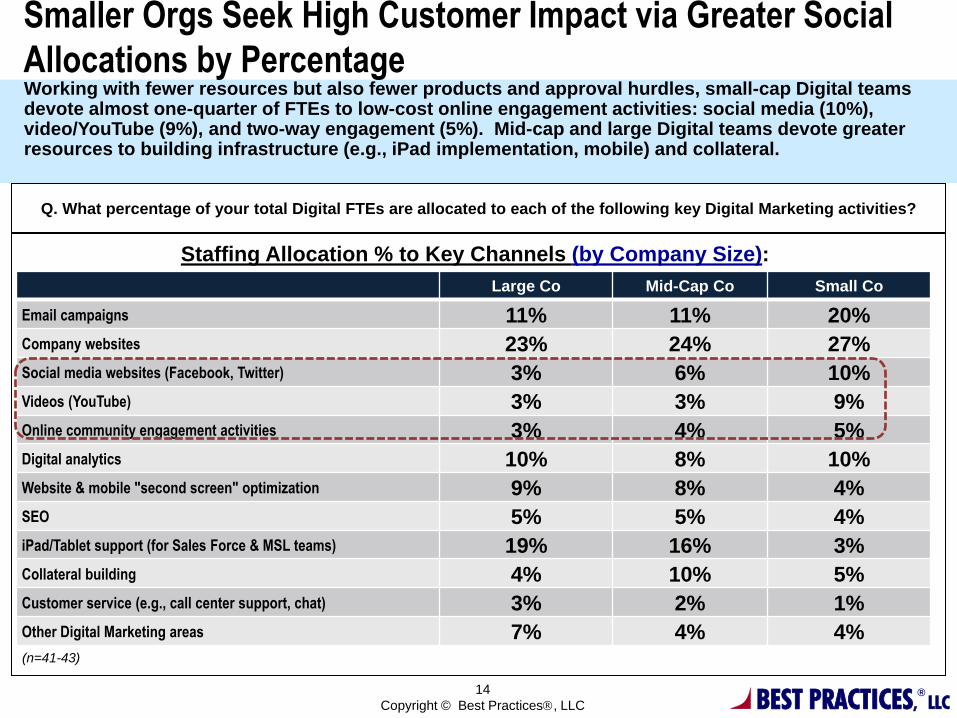
Q. What percentage of your total Digital FTEs are allocated to each of the following key Digital Marketing activities?
14
Copyright © Best Practices, LLC
Staffing Allocation % to Key Channels (by Company Size):
(n=41-43)
Large Co Mid-Cap Co Small Co
Email campaigns 11% 11% 20%
Company websites 23% 24% 27%
Social media websites (Facebook, Twitter) 3% 6% 10%
Videos (YouTube) 3% 3% 9%
Online community engagement activities 3% 4% 5%
Digital analytics 10% 8% 10%
Website & mobile "second screen" optimization 9% 8% 4%
SEO 5% 5% 4%
iPad/Tablet support (for Sales Force & MSL teams) 19% 16% 3%
Collateral building 4% 10% 5%
Customer service (e.g., call center support, chat) 3% 2% 1%
Other Digital Marketing areas 7% 4% 4%
Smaller Orgs Seek High Customer Impact via Greater Social
Allocations by Percentage Working with fewer resources but also fewer products and approval hurdles, small-cap Digital teams devote almost one-quarter of FTEs to low-cost online engagement activities: social media (10%), video/YouTube (9%), and two-way engagement (5%). Mid-cap and large Digital teams devote greater resources to building infrastructure (e.g., iPad implementation, mobile) and collateral.

BEST PRACTICES,
®
LLC
Interviewed Digital Marketing leaders described an often gradual process toward successful
performance measurement. For multiple companies, arriving at a valid cost per conversion metric
served as a critical first step toward effectively tracking multichannel marketing activities.
Cost Per Conversion Analysis Enables Evaluation of
E-Promotion and Field Follow-up:
“We had basically zero tracking and analytics two years ago
when I joined the company. Now we heavily track cost per
lead and cost per conversion, trying to drive rep
conversions up. We use salesforce.com for tracking.”
-Interviewed Director, Digital Strategy
Cost Per Conversion Is a Favored Metric for Initial Measurement
15
Copyright © Best Practices, LLC
“We’ve re-designed our microsites and new patient websites
to leverage emergent analytics. Though we’re in our
“analytics infancy” we’ve designed our dot.com properties to
support new launch. With more detailed sites that can be
linked to and clicked through from an EM blast, we have a
clearer understanding of how traffic comes in and clicks
around and what the cost per conversion might then turn
out to be.”
-Interviewed VP, Global Marketing
INTRODUCE
CONNECT
ENGAGE
*CONVERSION*
16
Copyright © Best Practices, LLC
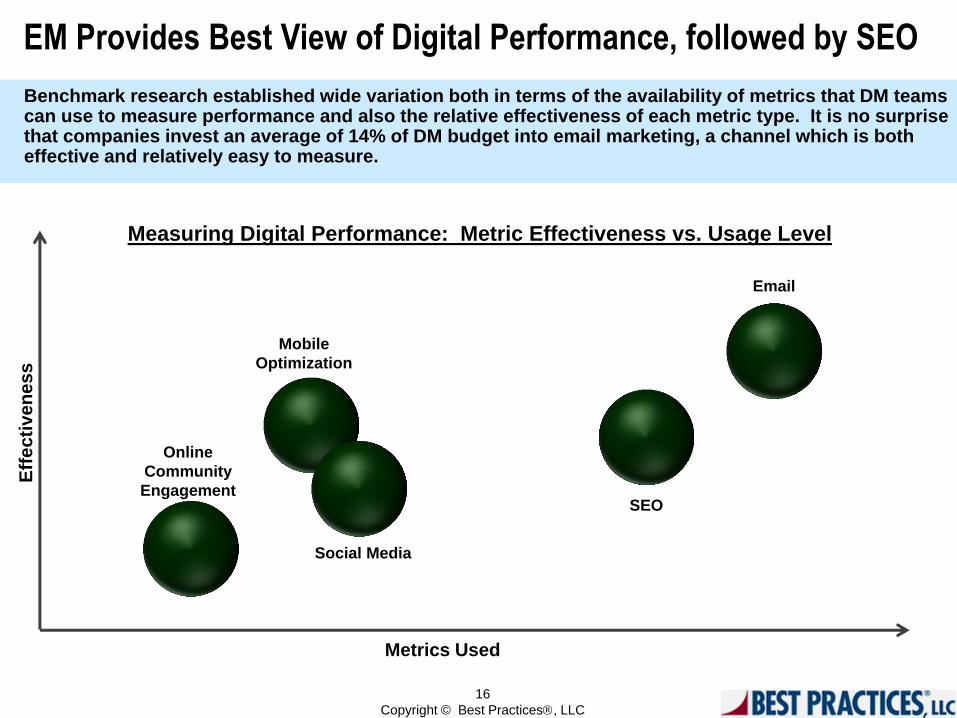
EM Provides Best View of Digital Performance, followed by SEO
Benchmark research established wide variation both in terms of the availability of metrics that DM teams can use to measure performance and also the relative effectiveness of each metric type. It is no surprise that companies invest an average of 14% of DM budget into email marketing, a channel which is both effective and relatively easy to measure.
Eff
ecti
ven
ess
Metrics Used
Online
Community
Engagement
Social Media
Mobile
Optimization
SEO
Measuring Digital Performance: Metric Effectiveness vs. Usage Level
BEST PRACTICES,
®
LLC
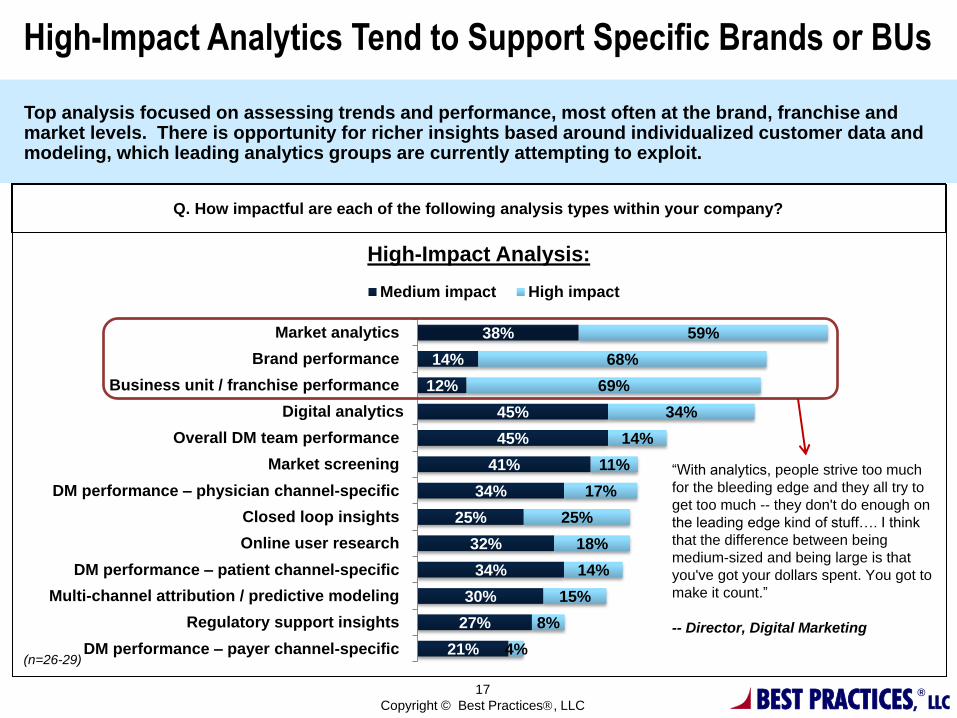
Q. How impactful are each of the following analysis types within your company?
17
Copyright © Best Practices, LLC
High-Impact Analysis:
High-Impact Analytics Tend to Support Specific Brands or BUs
21%
27%
30%
34%
32%
25%
34%
41%
45%
45%
12%
14%
38%
4%
8%
15%
14%
18%
25%
17%
11%
14%
34%
69%
68%
59%
DM performance – payer channel-specific
Regulatory support insights
Multi-channel attribution / predictive modeling
DM performance – patient channel-specific
Online user research
Closed loop insights
DM performance – physician channel-specific
Market screening
Overall DM team performance
Digital analytics
Business unit / franchise performance
Brand performance
Market analytics
Medium impact High impact
(n=26-29)
Top analysis focused on assessing trends and performance, most often at the brand, franchise and market levels. There is opportunity for richer insights based around individualized customer data and modeling, which leading analytics groups are currently attempting to exploit.
“With analytics, people strive too much
for the bleeding edge and they all try to
get too much -- they don't do enough on
the leading edge kind of stuff…. I think
that the difference between being
medium-sized and being large is that
you've got your dollars spent. You got to
make it count.”
-- Director, Digital Marketing
In many cases, too many variables across the multichannel marketing mix makes it impossible to
determine the return on investment for any one tactic. As one study participant explained, gauging
Digital ROI is possible, but only in scenarios where you can link specific campaigns or activities to
specific, measurable customer actions.
Some Companies Get Trapped by a
Simplistic Approach to Gauging ROI:
“That's kind of the big question: ‘How does Digital drive ROI?’ The challenge you have when you're trying to measure
that is can you effectively strip it down so that you're properly linking a specific email campaign to a specific end result?
When you look at promotional mix across the board, you have to take everything into consideration. There's a ton of
different things that you have to take into consideration when you try to measure it. Where you get stuck sometimes is
going on the firm ROI measure of: ‘We spent A, we received B (e.ge., new prescription), then therefore this program
worked.’
For one of our apps, we just used downloads to measure the ROI. (Because unless your app is engineered to give usage
data back to you – with all the personal identifiable information and privacy rigmarole that goes along with that – then the
best you can do to measure is just by download.) The app topped out at around 15,000 downloads from the Apple store,
which is great. But there are roughly 18,000 [relevant disease state physicians] out there in the United States. Can we
say that it was downloaded almost all of the doctors out there? No. In fact, there's 44 of us on the marketing team alone
and we all have it on our own devices (maybe multiple times), so possibly 100 of those downloads are just from our
internal teams….But all these factors have to weigh into the final ROI calculation.”
-Interviewed Associate Director, Marketing
Isolate Key Program Variables to Effectively Gauge Digital Benefits
18
Copyright © Best Practices, LLC
BEST PRACTICES,
®
LLC
About Best Practices, LLC
Best Practices, LLC is a research and consulting firm that conducts work based on the simple yet profound principle that organizations can chart a course to superior economic performance by studying the best business practices, operating tactics, and winning strategies of world-class companies.
19
Copyright © Best Practices, LLC
6350 Quadrangle Drive, Suite 200
Chapel Hill, NC 27517
(Phone): 919-403-0251
www.best-in-class.com/digital-marketing-consortium
www.best-in-class.com