
Digital color codes of stars
13
Received 2 December 2020; Revised 11 January 2021; Accepted 14 January 2021 DOI: 10.1002/asna.202113868 ORIGINAL ARTICLE Digital color codes of stars Jan-Vincent Harre 1,2 | René Heller 2,1 1 Institut für Astrophysik, Georg-August-Universität Göttingen, Friedrich-Hund-Platz 1, 37077 Göttingen, Germany 2 Max-Planck-Institut für Sonnensystemforschung, Justus-von-Liebig-Weg 3, 37077 Göttingen, Germany Correspondence Jan-Vincent Harre, Email: [email protected], René Heller, Email: [email protected] Funding Information German Aerospace Agency (Deutsches Zentrum für Luft- und Raumfahrt), 50OO1501. Publications in astrophysics are nowadays mainly published and read in digitized formats. Astrophysical publications in both research and in popular outreach often use colorful representations of stars to indicate various stellar types, that is, different spectral types or effective temperatures. Computer generated and computer displayed imagery has become an integral part of stellar astrophysics communication. There is, however, no astrophysically motivated standard color palette for illustrative rep- resentations of stars and some stars are actually represented in misleading colors. We use pre-computed PHOENIX and TLUSTY stellar model spectra and convolve them with the three standard color matching functions for human color perception between 360 nm and 830 nm. The color matching functions represent the three sets of receptors in the eye that respond to red, green, and blue light. For a grid of main sequence stars with effective temperatures between 2300 K and 55,000 K of different metallicities we present the red-blue-green and hexadecimal color codes that can be used for digitized color representations of stars as if seen from space. We find signif- icant deviations between the color codes of stars computed from stellar spectra and from a black body radiator of the same effective temperature. We illustrate the main sequence in the color wheel and demonstrate that there are no yellow, green, cyan, or purple stars. Red dwarf stars (spectral types M0V - M9V) actually look orange to the human eye. Old white dwarfs such as WD 1856+534, host to a newly discovered transiting giant planet candidate, occur pale orange to the human eye, not white. Our freely available software can be used to generate color codes for any input spectrum such as those from planets, galaxies, quasars etc. KEYWORDS: standards, stars: atmospheres, stars: general, stars: imaging, techniques: spectroscopic 1 INTRODUCTION Digitized representations of stars have become an integral part of publications in astronomy and astrophysics. Though real- istic colors of stars are sometimes irrelevant for depictions of an astrophysical process, they can be helpful to support the message of a figure in a paper (Becker, Vanderburg, Adams, Khain, & Bryan, 2017; Heller & Pudritz, 2016; Hippke & Angerhausen, 2015; Kaltenegger et al., 2010; Kasting & Har- man, 2013; Sidis & Sari, 2010) or a slide in an electronic science talk 1 . And in some cases, though the effect may be subtle, color is key, for example for the Rossiter-McLaughlin effect (Bourrier et al., 2018; Sanchis-Ojeda et al., 2012) or for the color-induced displacement of binary stars (Pourbaix, Ivezi, Knapp, Gunn, & Lupton, 2004). In fact, the history of modern astronomy is deeply rooted in by-eye analyses of the apparent colors of stars and their relation to the temperature (Hertzsprung, 1911; Payne, 1925; Russell, 1914). 1 http://exoplanet-talks.org arXiv:2101.06254v2 [astro-ph.SR] 24 Feb 2021
Transcript of Digital color codes of stars
Received 2 December 2020; Revised 11 January 2021; Accepted 14 January 2021
DOI: 10.1002/asna.202113868
ORIGINAL ARTICLE
Digital color codes of stars
Jan-Vincent Harre1,2 | René Heller2,1
1Institut für Astrophysik,Georg-August-Universität Göttingen,Friedrich-Hund-Platz 1, 37077 Göttingen,Germany
2Max-Planck-Institut fürSonnensystemforschung,Justus-von-Liebig-Weg 3, 37077 Göttingen,Germany
CorrespondenceJan-Vincent Harre, Email:[email protected], René Heller, Email:[email protected]
Funding InformationGerman Aerospace Agency(Deutsches Zentrum für Luft- undRaumfahrt), 50OO1501.
Publications in astrophysics are nowadays mainly published and read in digitizedformats. Astrophysical publications in both research and in popular outreach oftenuse colorful representations of stars to indicate various stellar types, that is, differentspectral types or effective temperatures. Computer generated and computer displayedimagery has become an integral part of stellar astrophysics communication. Thereis, however, no astrophysically motivated standard color palette for illustrative rep-resentations of stars and some stars are actually represented in misleading colors.We use pre-computed PHOENIX and TLUSTY stellar model spectra and convolvethem with the three standard color matching functions for human color perceptionbetween 360 nm and 830 nm. The color matching functions represent the three setsof receptors in the eye that respond to red, green, and blue light. For a grid of mainsequence stars with effective temperatures between 2300K and 55,000K of differentmetallicities we present the red-blue-green and hexadecimal color codes that can beused for digitized color representations of stars as if seen from space. We find signif-icant deviations between the color codes of stars computed from stellar spectra andfrom a black body radiator of the same effective temperature. We illustrate the mainsequence in the color wheel and demonstrate that there are no yellow, green, cyan,or purple stars. Red dwarf stars (spectral types M0V - M9V) actually look orange tothe human eye. Old white dwarfs such as WD1856+534, host to a newly discoveredtransiting giant planet candidate, occur pale orange to the human eye, not white. Ourfreely available software can be used to generate color codes for any input spectrumsuch as those from planets, galaxies, quasars etc.
KEYWORDS:standards, stars: atmospheres, stars: general, stars: imaging, techniques: spectroscopic
1 INTRODUCTION
Digitized representations of stars have become an integral partof publications in astronomy and astrophysics. Though real-istic colors of stars are sometimes irrelevant for depictions ofan astrophysical process, they can be helpful to support themessage of a figure in a paper (Becker, Vanderburg, Adams,Khain, & Bryan, 2017; Heller & Pudritz, 2016; Hippke &Angerhausen, 2015; Kaltenegger et al., 2010; Kasting & Har-man, 2013; Sidis & Sari, 2010) or a slide in an electronic
science talk1. And in some cases, though the effect may besubtle, color is key, for example for the Rossiter-McLaughlineffect (Bourrier et al., 2018; Sanchis-Ojeda et al., 2012) orfor the color-induced displacement of binary stars (Pourbaix,Ivezić, Knapp, Gunn, & Lupton, 2004). In fact, the history ofmodern astronomy is deeply rooted in by-eye analyses of theapparent colors of stars and their relation to the temperature(Hertzsprung, 1911; Payne, 1925; Russell, 1914).
1http://exoplanet-talks.org
arX
iv:2
101.
0625
4v2
[as
tro-
ph.S
R]
24
Feb
2021
2 Harre & Heller
Beyond the scientific value of colorful stellar representa-tions, the colors of stars play an important role in digitizedscience dissemination activities to the public, such as pressreleases2, educational websites3, electronic books4 (Fraknoi,Morrison, &Wolff, 2019), electronic slides in public talks etc.That said, no uniform scale for the digitized color codes of
stars exists. The digital illustration of stellar colors is oftendone in a pragmatic fashion rather than in a scientificallyfounded way and color representations of essentially the sametypes of stars differ greatly among publications in the vari-ous outlets listed above. Moreover, some myths about the redcolor of so-called red dwarf stars, of a brownish look of browndwarfs, and of the white appeal of white dwarfs prevail. Herewe develop a reproducible method to compute the colors ofstars as they appear to the human eye (from space) and wereport the digital color codes of main sequence stars.
2 METHODS
2.1 Stellar model spectraAs input spectra to our color calculations, we used pre-computed model stellar spectra of the flux densities as afunction of wavelength. For effective temperatures 2300K ≤Teff ≤ 12, 000K we used spectra from the publicly available5PHOENIX spectral library of Husser et al. (2013). AdditionalPHOENIX spectra with Teff up to 15,000K were providedby courtesy of T. O. Husser in private communication. ThePHOENIX model grid embraced surface gravity values 0 ≤log(g) ≤ 6 (g expressed in units of cm s−2) and stellar metallic-ities [Fe∕H] ∈ {0,−1,−2}. All spectra were provided on thesamewavelength grid (500Å≤ � ≤ 5.5�m) and with a typicalresolution of R = �∕Δ� = 500, 000 in the optical regime.These spectra were computed using version 16 of the
PHOENIX software (Hauschildt & Baron, 1999). Sphericalsymmetry of the stars was assumed and each atmospherewas represented by 64 layers. The assumption of local ther-mal equilibrium (LTE) was justified by the maximum effec-tive temperatures of 12,000K, and dust settling was ignoredbecause it is insignificant for Teff ≥ 2300K. For details werefer the reader to Husser et al. (2013).For OB stars with 16, 000K ≤ Teff ≤ 55, 000K we
used TLUSTY models6 of the BSTAR2006 grid of Lanz &Hubeny (2007) and the OSTAR2002 grid of Lanz & Hubeny(2003). These models take into account the effects of non-LTEin plane-parallel, hydrostatic atmospheric layers. Due to the
2www.eso.org/public/usa/news/eso16293www.exocast.org4https://openstax.org/details/books/astronomy5http://phoenix.astro.physik.uni-goettingen.de6http://tlusty.oca.eu/Tlusty2002/tlusty-frames-OS02.html
very weak absorption lines of these hot stars, the differencesin the color codes are very small across different stellar metal-licities. As a consequence, we restricted our analysis to solarmetallicity.
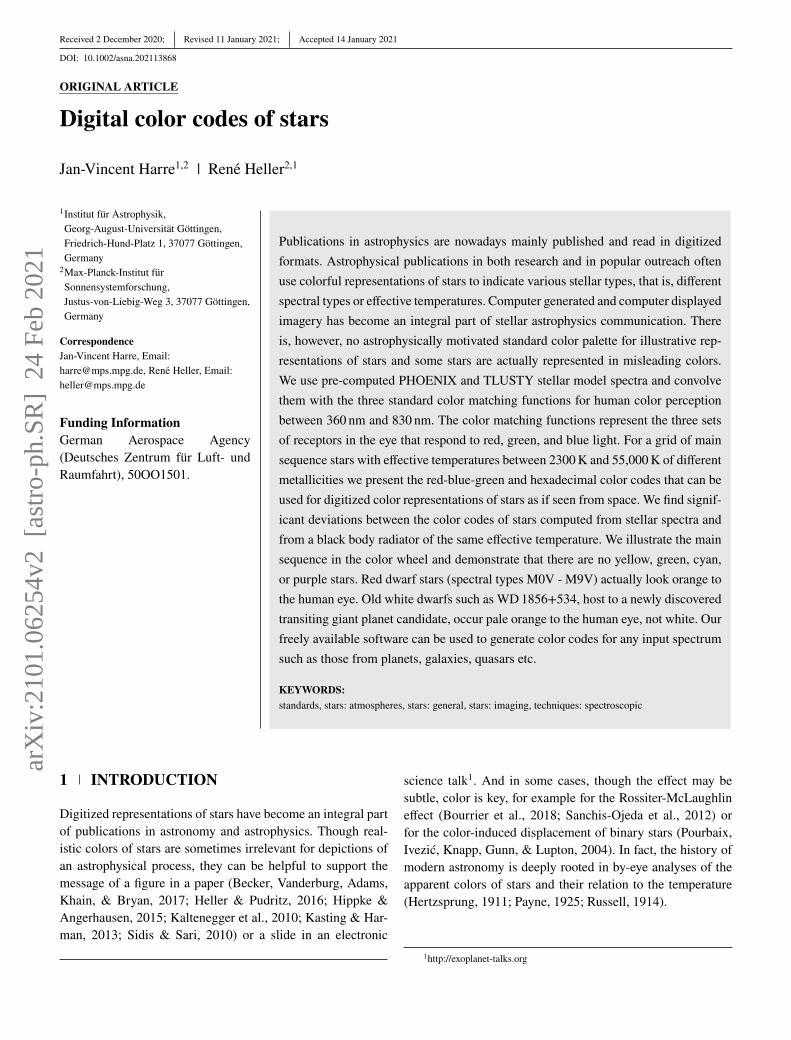
2.2 Color codes and Matching functionsTo infer the digital color codes for the model spectraas if they were perceived by the human eye, we usedcolor_system.py7. This pythonmodule uses data from colormatching functions (CMFs), which describe the perceptionof light by the cone cells in the human eye under standard-ized illumination, to convert a spectrum to a color code. Sincethe model stellar spectra have a high wavelength resolutionwe used the latest values of the 2-degree XYZ CMFs8, trans-formed from the 2006 CIE (International Commission onIllumination) 2-degree LMS (long-medium-short color space)cone fundamentals (Stockman & Sharpe, 2008), which comewith one data point per Å. We then degraded the resolution ofthe synthetic stellar spectra to the same wavelength resolution.In Fig. 1 we show the CMFs (blue, green, red lines)
together with two example spectra, one being a black body of2500K (black line) and one being a PHOENIX spectrum forTeff = 2500K, log(g) = 5, and [Fe∕H] = 0. Both spectra arenormalized to a value of one (see inset). The presence of strongmolecular absorption bands in the PHOENIX spectrum sug-gests that the resulting color perception, and therefore also thedigital color codes, differ substantially between a black bodyand a stellar spectrum of the same effective temperature.
2.3 Spectral typingThe PHOENIX spectra are not formally linked to a given stel-lar spectral type (SpT), although empirical relationships canbe used to relate PHOENIX spectra with SpT. To simplify thechoice of an appropriate color representation for a given SpT,one of our aims was to create a look-up table that is astrophys-ically motivated but particularly suitable from an astronomer’sperspective.To this end, we matched spectral types of main-sequence
stars with the corresponding Teff and log(g) values from ourgrid of PHOENIX models – and for consistency also for theTLUSTYmodels. First, we used Table 5 of Pecaut &Mamajek(2013) to match Teff from the synthetic models with observedspectral types of stars. These authors used a weighting schemeof a large sample of standard main-sequence stars from theliterature to infer a Teff -SpT relation for Teff ≤ 34, 000K. Stel-lar surface gravities were not provided. As an alternative, wedefine three intervals of log(g) based on the Teff -log(g) relation
7https://scipython.com/blog/converting-a-spectrum-to-a-colour8http://cvrl.ucl.ac.uk
Harre & Heller 3
3000 4000 5000 6000 7000 8000 9000Wavelength [Å]
0.0
0.2
0.4
0.6
0.8
1.0
Flux
2500 K BB2500 K PHXXYZ
0.0
0.4
0.8
1.2
1.6
2.0
XYZ
valu
es
0 20000 40000 60000Wavelength [Å]
0.0
0.2
0.4
0.6
0.8
1.0
Flux
FIGURE 1 Comparison of a black body spectrum (labeled BB, black solid line) and a PHOENIX spectrum of a main-sequencestar (labeled PHX, orange line), both with an effective temperature of 2500K. The color matching functions are shown as X, Yand Z in red, green and blue, respectively. The inset shows an extended coverage of the spectra from 0 to 60, 000Å.
derived from a sample of detached eclipsing stellar binaries(Eker et al., 2018):
Teff ≤ 3648K ⇒ log(g) = 5.03648K < Teff ≤ 6152K ⇒ log(g) = 4.56152K < Teff ⇒ log(g) = 4.0 (1)
For Teff > 34, 000K we used Table 7 of Eker et al. (2018)for the SpT-to-Teff matching.
2.4 Limb darkeningFor illustration purpose only, we generate a library of plotsof the apparent stellar surface that include limb darkening asparameterized by the quadratic limb darkening law,
I(�)I(1)
= 1 − a(1 − �) − b(1 − �)2 , (2)
where � = cos( ), is the angle between the line of sight andthe normal to the stellar surface, I is the specific intensity, and(a, b) are the limb darkening coefficients. This model does nottake into account the possible wavelength dependence of limbdarkening, that is, chromatic effects. We used limb darkeningcoefficients that reproduce the limb darkening as observed inthe G filter of the Gaia mission (Table 2 in Claret, 2019). Wechose the Gaia G filter because its response curve matchesreasonably well with the response function of the human eye(Weiler, 2018). Given that the PHOENIX and TLUSTYmodel
grids and the limb darkening tables have different step sizes inthe model parameters, we used linear interpolation of the limbdarkening coefficients whenever necessary to represent starson the model grid.In technical terms, limb darkening was implemented into
our computer code by first creating a two-dimensional arraywith 1001 × 1001 entries, each containing a sub-array with therespective linear RGB color triple values of the star. Each lin-ear RGB triple entry corresponded to a radial distance from thestellar center. Using the relation � =
√
1 − r2 (Heller, 2019),with 0 ≤ r ≤ 1 being the radial distance from the star disk inunits of stellar radii, each entry in the color array was multi-plied with the corresponding intensity of the limb darkening inEq. (2) law to obtain the radial limb darkening profile.
3 RESULTS
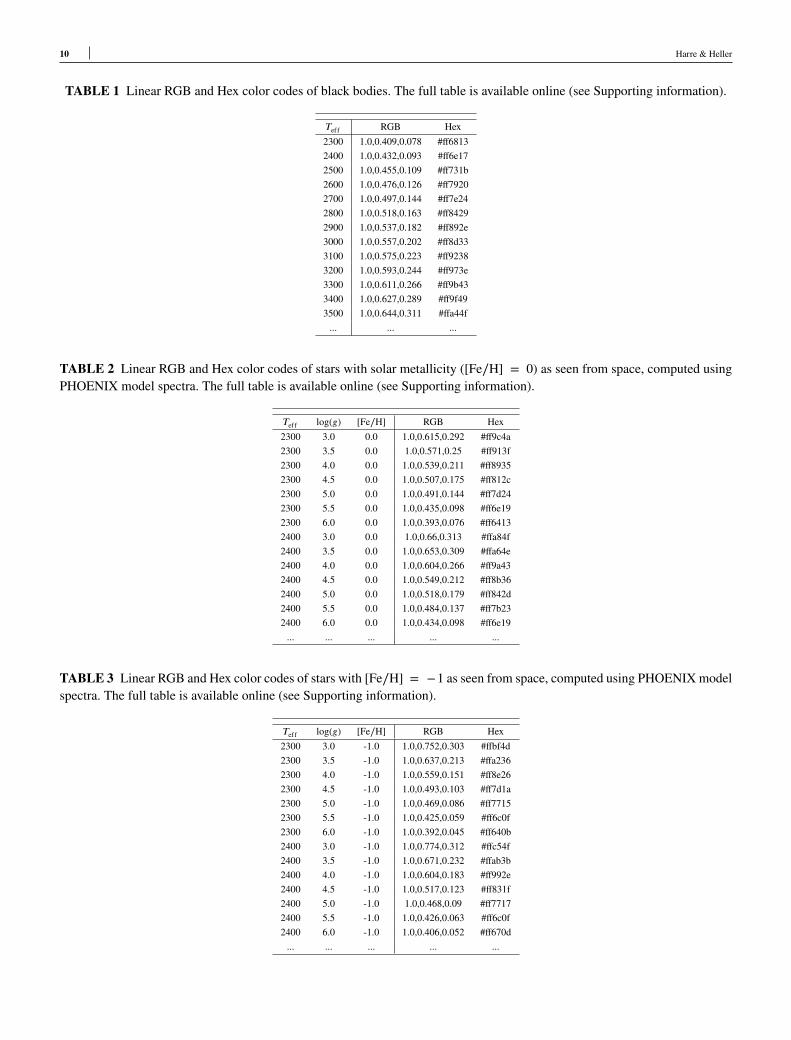
3.1 Digital color codesIn Table 1 we list the linear RGB and Hexadecimal (Hex)color codes of black bodies with 2300 ≤ T ≤ 12, 000K, thetemperature range of which corresponds to the publicly avail-able PHOENIX models. Columns 2 and 3 refer to the colorsof a black body in vacuum without any extinction or transmis-sion through an additional medium between the radiator andthe observer.
4 Harre & Heller
B0.5O5.5O1
M9.5M4.5
M0K5K0
G4F9.5
F5F0
A4A0
B5
PHOENIX
(a)
TLUSTY
×××
×Model Spectra: Blackbody
M9.5
M4.5M0
K5K0
G4F9.5
F5F0
A4A0
Model Spectra
(b)
B5B0.5O5.5O1
×
×××
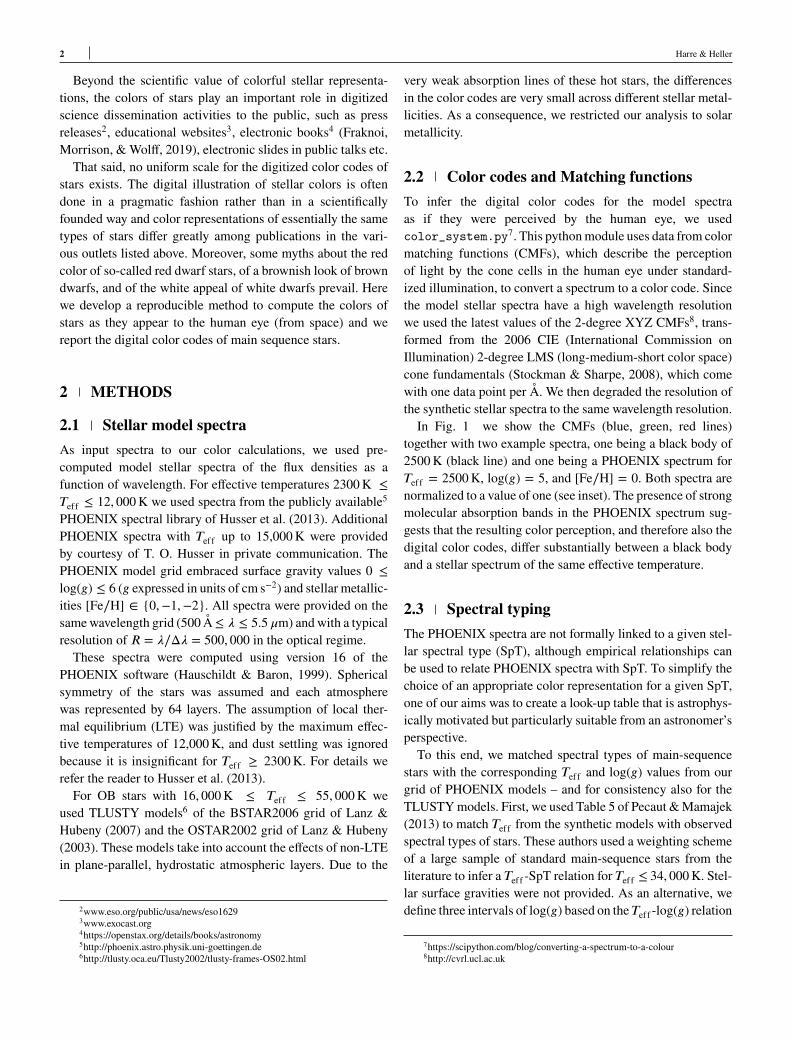
FIGURE 2 (a) Main sequence stars in the color wheel. Colors are derived from synthetic stellar spectra. (b) Comparison ofcolors derived from synthetic spectra (filled circles) with colors calculated from black bodies of the corresponding effectivetemperatures (open circles). Spectral types are indicated along the curves.
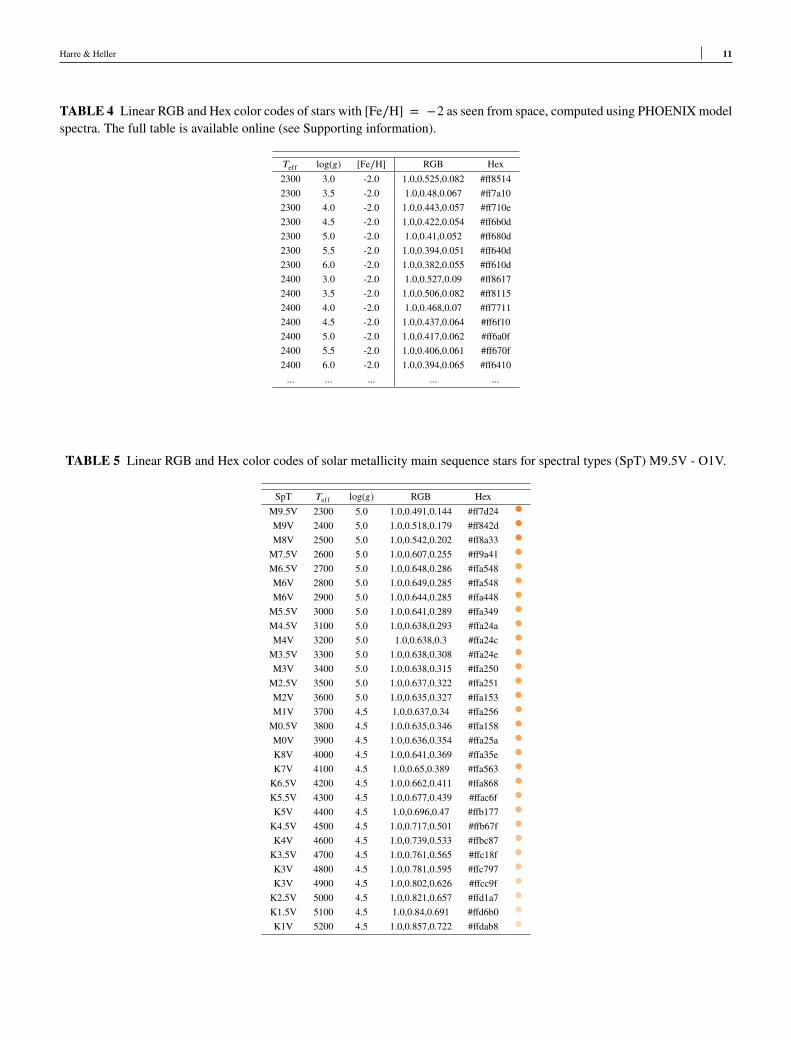
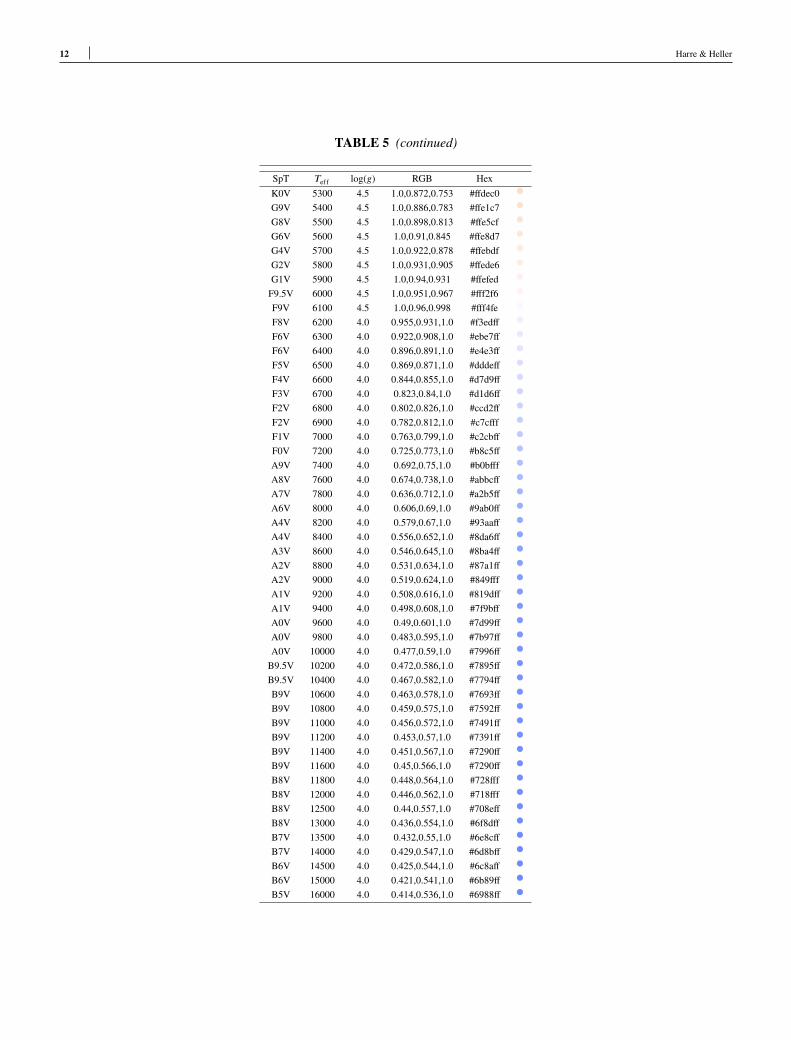
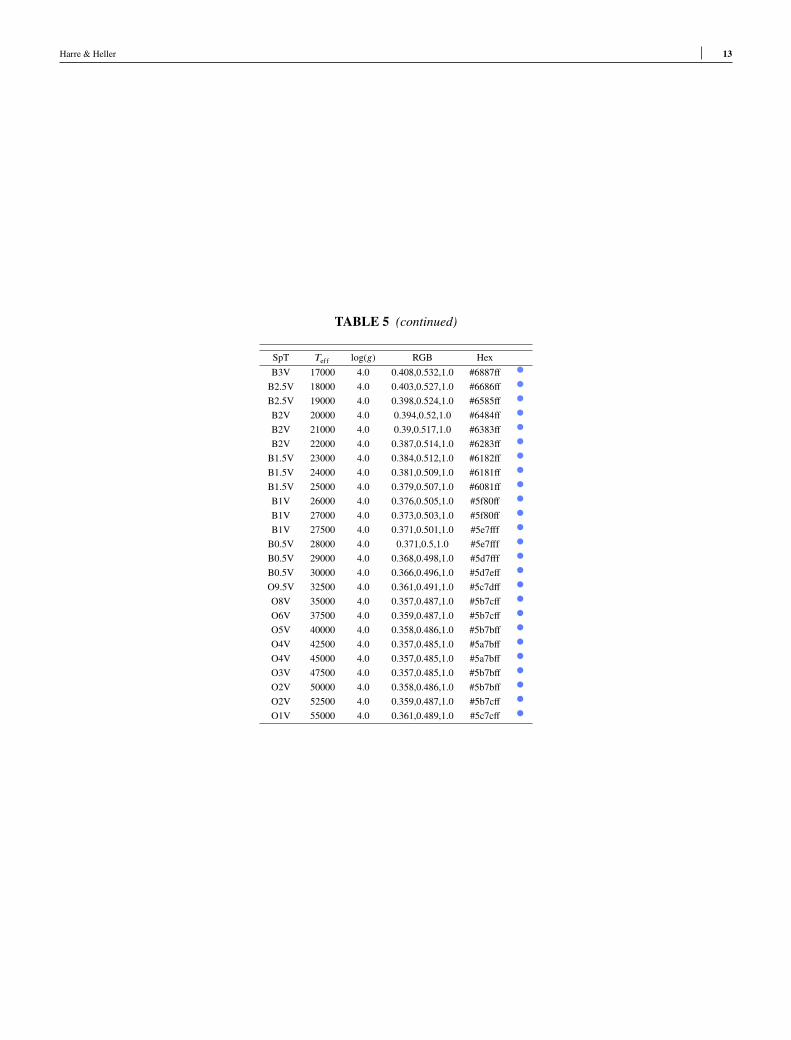
In Tables 2 - 4 we show the linear RGB and Hexcolor codes as computed from the PHOENIX spectra for2300 ≤ Teff ≤ 12, 000K. The color variation of stars withTeff > 12, 000K is hardly notable to the human eye, which iswhy we restricted Tables 2 - 4 to Teff ≤ 12, 000K. Table 2 ,for [Fe∕H] = 0, contains color codes for 841 PHOENIXspectra; Table 3 and its 846 entries refer to [Fe∕H] = −1;and Table 4 is a list of 848 PHOENIX spectra assuming[Fe∕H] = −2. Table 5 is a look-up table for the color codesof main-sequence stars of a given spectral type and embracesboth the PHOENIX and the TLUSTY models with effectivetemperatures up to 55,000K.Figure 2 is a visual representation of these color codes.
Panel (a) shows the stellar main sequence in the color wheel.Color codes were first computed using the PHOENIX andTLUSTY spectra and then a selection of spectral types weremarked in the color wheel in steps of about half a spectral classbetween M9.5 to O1 (all of luminosity class V). To our knowl-edge, this is the first digital color code representation of thelong known astronomical observation that there are no yellow,green, cyan, or purple stars. At the lowest temperatures, themain sequence beginswith orange stars of SpTM9.5, then con-tinues to produce brighter and brighter stars across the K classuntil it reaches the white point with stars of SpT F9.5. Sun-likestars with SpT G2 are slightly yellowish. Early-type stars ofspectral classes A, B, and O tend to have ever more blue col-ors. Interestingly, for spectral types earlier than about B5 thecolors of increasingly hotter stars converge towards a blueishtone of linear RGB = (90,123,255).
5800 K PHX no LD 5800 K PHX LD
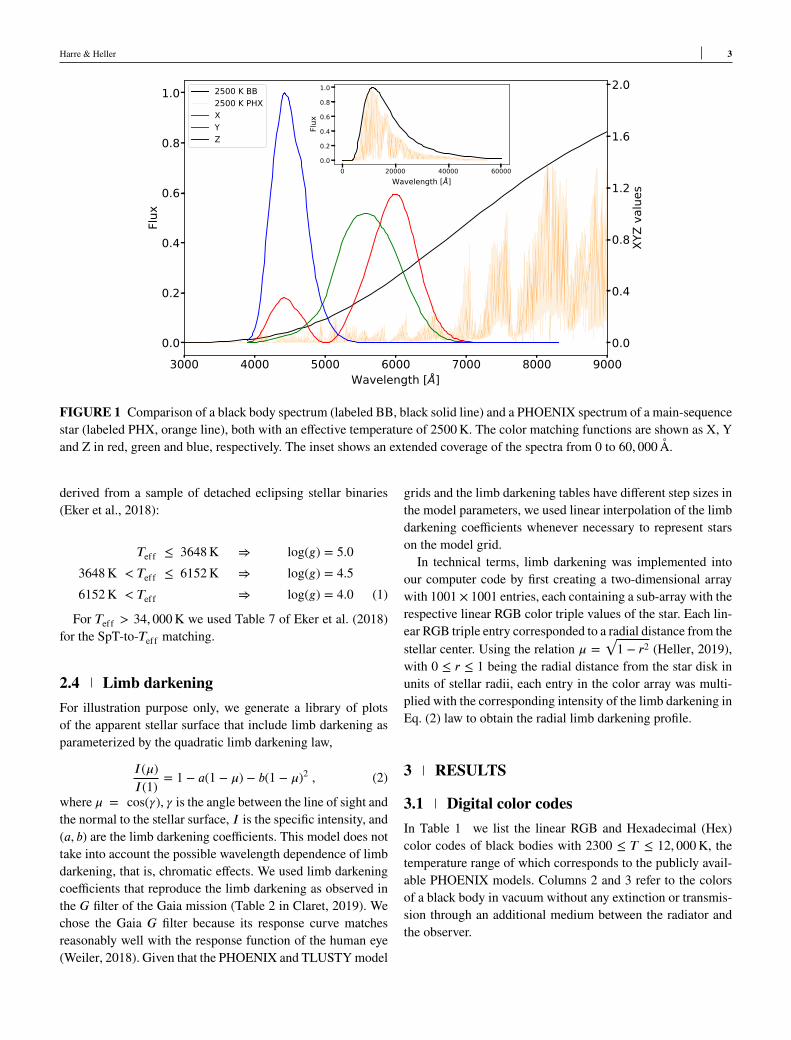
FIGURE 3 Comparison of the same star with and withoutlimb darkening. For the computation of the color we chose thePHOENIX spectrum of a sun-like star with Teff = 5800 K,log(g) = 4.5, and [Fe∕H] = 0.
In Figure 2 (b) we illustrate the differences between the col-ors of main-sequence stars as depicted in panel (a) and blackbodies of the same effective temperatures for the same selec-tion of spectral types. Pairs of model spectra (filled circles andcrosses) and black bodies (open circles) of the same Teff areconnected with a black line. Interestingly, while there are sig-nificant deviations between the two models for both the mostlate-type stars and the most early-type stars, colors virtuallyagree for SpT K0. We also note two inflection points in thecolor differences, one between M4.5 and M0 and a second onebetween K5 and K0.
Harre & Heller 5
3.2 Limb darkeningThe effect of limb darkening is illustrated in Fig. 3 for a sun-like star. The left panel has no limb darkening, the right panelincludes the quadratic limb darkening law. Our implementa-tion of limb darkening comes after the calculation of the linearRGB codes from the model spectra, which means that the lin-ear RGB colors codes given in Tables 2 - 4 refer to the centerof the stellar disk.For each of the 107 stars listed in the look-up Table 5 , we
generated an illustration in portable document format (PDF,version 1.4) using the python plotting package matplotlibthat is similar to the one in the right panel of Fig. 3 . Theseelectronic images are available in the online version of thisreport.
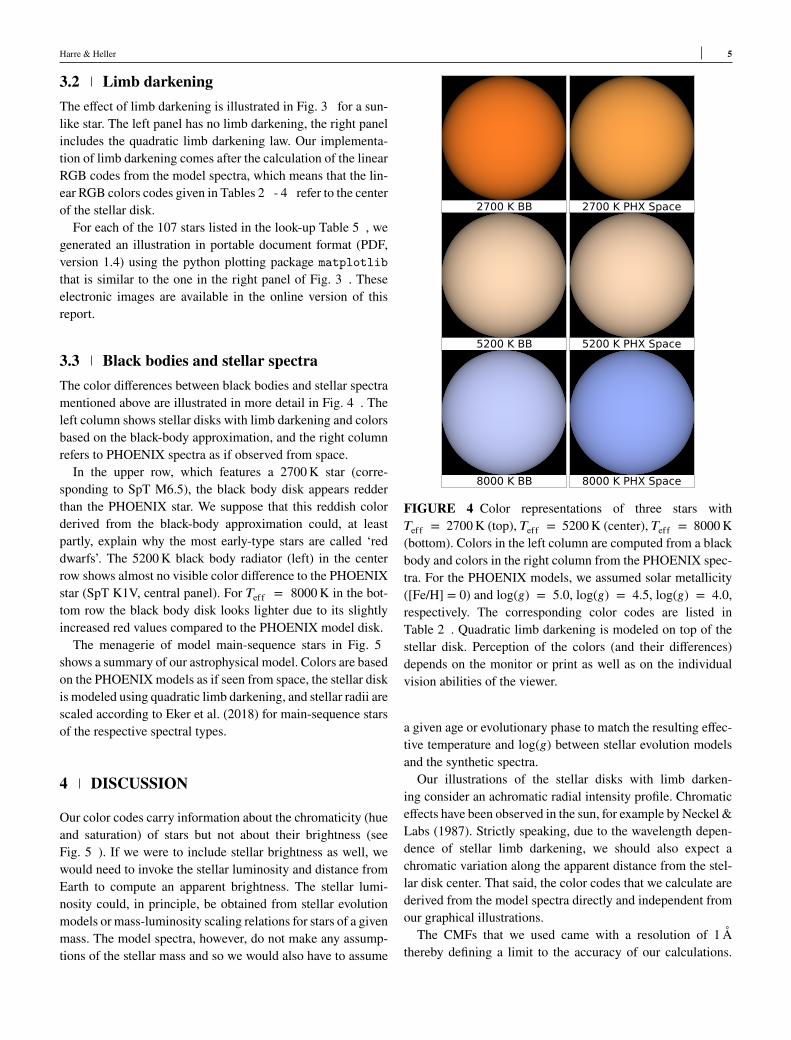
3.3 Black bodies and stellar spectraThe color differences between black bodies and stellar spectramentioned above are illustrated in more detail in Fig. 4 . Theleft column shows stellar disks with limb darkening and colorsbased on the black-body approximation, and the right columnrefers to PHOENIX spectra as if observed from space.In the upper row, which features a 2700K star (corre-
sponding to SpT M6.5), the black body disk appears redderthan the PHOENIX star. We suppose that this reddish colorderived from the black-body approximation could, at leastpartly, explain why the most early-type stars are called ‘reddwarfs’. The 5200K black body radiator (left) in the centerrow shows almost no visible color difference to the PHOENIXstar (SpT K1V, central panel). For Teff = 8000K in the bot-tom row the black body disk looks lighter due to its slightlyincreased red values compared to the PHOENIX model disk.The menagerie of model main-sequence stars in Fig. 5
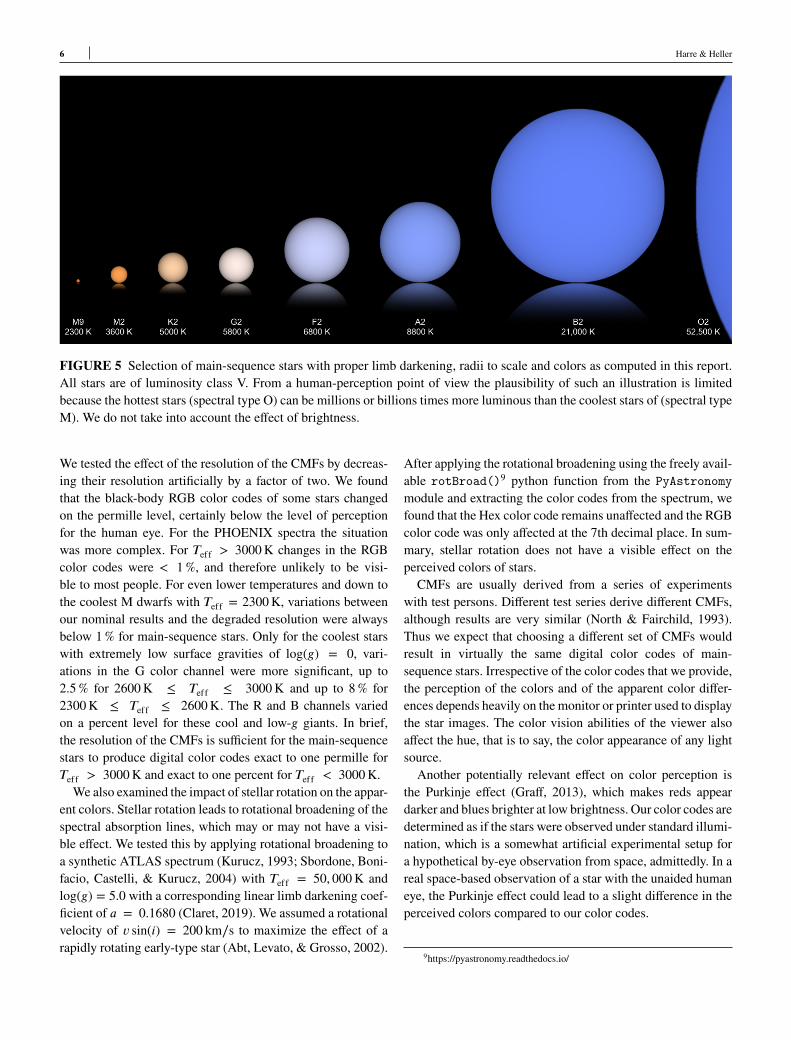
shows a summary of our astrophysical model. Colors are basedon the PHOENIXmodels as if seen from space, the stellar diskis modeled using quadratic limb darkening, and stellar radii arescaled according to Eker et al. (2018) for main-sequence starsof the respective spectral types.
4 DISCUSSION
Our color codes carry information about the chromaticity (hueand saturation) of stars but not about their brightness (seeFig. 5 ). If we were to include stellar brightness as well, wewould need to invoke the stellar luminosity and distance fromEarth to compute an apparent brightness. The stellar lumi-nosity could, in principle, be obtained from stellar evolutionmodels or mass-luminosity scaling relations for stars of a givenmass. The model spectra, however, do not make any assump-tions of the stellar mass and so we would also have to assume
2700 K BB 2700 K PHX Space
5200 K BB 5200 K PHX Space
8000 K BB 8000 K PHX Space
FIGURE 4 Color representations of three stars withTeff = 2700K (top), Teff = 5200K (center), Teff = 8000K(bottom). Colors in the left column are computed from a blackbody and colors in the right column from the PHOENIX spec-tra. For the PHOENIX models, we assumed solar metallicity([Fe/H] = 0) and log(g) = 5.0, log(g) = 4.5, log(g) = 4.0,respectively. The corresponding color codes are listed inTable 2 . Quadratic limb darkening is modeled on top of thestellar disk. Perception of the colors (and their differences)depends on the monitor or print as well as on the individualvision abilities of the viewer.
a given age or evolutionary phase to match the resulting effec-tive temperature and log(g) between stellar evolution modelsand the synthetic spectra.Our illustrations of the stellar disks with limb darken-
ing consider an achromatic radial intensity profile. Chromaticeffects have been observed in the sun, for example by Neckel &Labs (1987). Strictly speaking, due to the wavelength depen-dence of stellar limb darkening, we should also expect achromatic variation along the apparent distance from the stel-lar disk center. That said, the color codes that we calculate arederived from the model spectra directly and independent fromour graphical illustrations.The CMFs that we used came with a resolution of 1Å
thereby defining a limit to the accuracy of our calculations.
6 Harre & Heller
FIGURE 5 Selection of main-sequence stars with proper limb darkening, radii to scale and colors as computed in this report.All stars are of luminosity class V. From a human-perception point of view the plausibility of such an illustration is limitedbecause the hottest stars (spectral type O) can be millions or billions times more luminous than the coolest stars of (spectral typeM). We do not take into account the effect of brightness.
We tested the effect of the resolution of the CMFs by decreas-ing their resolution artificially by a factor of two. We foundthat the black-body RGB color codes of some stars changedon the permille level, certainly below the level of perceptionfor the human eye. For the PHOENIX spectra the situationwas more complex. For Teff > 3000K changes in the RGBcolor codes were < 1%, and therefore unlikely to be visi-ble to most people. For even lower temperatures and down tothe coolest M dwarfs with Teff = 2300K, variations betweenour nominal results and the degraded resolution were alwaysbelow 1% for main-sequence stars. Only for the coolest starswith extremely low surface gravities of log(g) = 0, vari-ations in the G color channel were more significant, up to2.5% for 2600K ≤ Teff ≤ 3000K and up to 8% for2300K ≤ Teff ≤ 2600K. The R and B channels variedon a percent level for these cool and low-g giants. In brief,the resolution of the CMFs is sufficient for the main-sequencestars to produce digital color codes exact to one permille forTeff > 3000K and exact to one percent for Teff < 3000K.We also examined the impact of stellar rotation on the appar-
ent colors. Stellar rotation leads to rotational broadening of thespectral absorption lines, which may or may not have a visi-ble effect. We tested this by applying rotational broadening toa synthetic ATLAS spectrum (Kurucz, 1993; Sbordone, Boni-facio, Castelli, & Kurucz, 2004) with Teff = 50, 000K andlog(g) = 5.0 with a corresponding linear limb darkening coef-ficient of a = 0.1680 (Claret, 2019). We assumed a rotationalvelocity of v sin(i) = 200 km∕s to maximize the effect of arapidly rotating early-type star (Abt, Levato, & Grosso, 2002).
After applying the rotational broadening using the freely avail-able rotBroad()9 python function from the PyAstronomymodule and extracting the color codes from the spectrum, wefound that the Hex color code remains unaffected and the RGBcolor code was only affected at the 7th decimal place. In sum-mary, stellar rotation does not have a visible effect on theperceived colors of stars.CMFs are usually derived from a series of experiments
with test persons. Different test series derive different CMFs,although results are very similar (North & Fairchild, 1993).Thus we expect that choosing a different set of CMFs wouldresult in virtually the same digital color codes of main-sequence stars. Irrespective of the color codes that we provide,the perception of the colors and of the apparent color differ-ences depends heavily on the monitor or printer used to displaythe star images. The color vision abilities of the viewer alsoaffect the hue, that is to say, the color appearance of any lightsource.Another potentially relevant effect on color perception is
the Purkinje effect (Graff, 2013), which makes reds appeardarker and blues brighter at low brightness. Our color codes aredetermined as if the stars were observed under standard illumi-nation, which is a somewhat artificial experimental setup fora hypothetical by-eye observation from space, admittedly. In areal space-based observation of a star with the unaided humaneye, the Purkinje effect could lead to a slight difference in theperceived colors compared to our color codes.
9https://pyastronomy.readthedocs.io/
Harre & Heller 7
In this paper, we restrict ourselves to the apparent colorsof stars as if seen from space. For an observer on Earth, thecolors would look slightly different due to several effects inthe Earth’s atmosphere such as scattering of the light in theatmosphere, scintillation, Rayleigh scattering, and the pres-ence of carbon black dust and other small particles (Schlosser,Schmidt-Kaler, & Milone, 1991, Chapter 19). That said, wedid a small experiment of simulating the transmission of stel-lar light through the Earth’s atmosphere using data from theHITRAN10 database (Gordon et al., 2017). Every moleculeand isotopologue listed in the database, except for the CO2 iso-topologues 18C13C17O and 13C17O2, was used in the generationof the absorption spectrum. The resulting transmission spec-trumwas binned to the samewavelength grid as the CMFswitha fixed wavelength step size of 1Å. The transmission spec-trum was normalized to a maximum value of one and thenmultiplied with the respective PHOENIX spectrum. The trans-mission spectrum for the Earth’s atmosphere was normalizedto the maximum value in the wavelength range of the modelspectra. A different normalization would result in similar col-ors, since the absorption of light in the Earth’s atmosphereonly has a small impact (∼ 0.1%) on the RGB color code. Asa result, we found that the effects from transmission on thestellar RGB color codes are less than about 1%. The otheratmospheric effects are probably more significant.The digital color codes that we computed for black bodies
can safely be used as representative for white dwarfs of spectraltype DC. Spectra of DC white dwarfs are very close to blackbody radiators with essentially no significant absorption lines(Greenstein, 1958;Wegner&Yackovich, 1983). This has someremarkable implications for DC white dwarfs with coolingages of billions of years, at which point their effective temper-atures drop below 5000K. The look of these white dwarfs isa light orange. Their color is similar to the star of SpT K2 inFig. 5 . The stellar remnant of the recently discovered transit-ing exoplanet candidate WD1856+534 b is a topical example(Vanderburg et al., 2020). With Teff = 4710 ± 60K this DCwhite dwarf would really have a pale orange look to the humaneye.
5 CONCLUSIONS
We use standard color matching functions representing thecolor perception of the human eye to determine the colors ofstars from synthetic spectra. We find that colors derived fromrealistic stellar spectra differ substantially from colors basedon a black body approximation.
10https://hitran.org
In particular, the coolest (Teff = 2300K) and thus most late-type (SpT M9.5V) main-sequence stars look orange to thehuman eye. The digital linear RGB color code of a solar metal-licity M9.5V dwarf reads (1.0, 0.491, 0.144) (Table 5 ). Wesuppose that part of the explanation for why these stars areoften called red dwarfs is in the fact that a black body spec-trum yields a much redder color, namely RGB = (1.0, 0.409,0.078) (Table 1 ). The colors of stars of SpT K1V - K0V(with Teff = 5200K or 5300K, respectively) are very similarto those of a black body with the same effective temperature.Early-type stars of SpT F, A, B, and O look bluer than theirblack-body counterparts because synthetic spectra yield lowerred values in the resulting linear RGB color codes.We find that the transmission of star light through the
Earth’s atmosphere has a negligible effect on color perception,with color differences on the level of a few permille in thecorresponding RGB color codes.Our ad-hoc parameterization of stellar limb darkening with
the quadratic limb darkening law yields realistic, plastic illus-trations of main-sequence stars with correct colors, achromaticlimb darkening, and physical stellar radii to scale. To ourknowledge, this is the first digital representation of main-sequence stars with consistent and correct colors based onastrophysical modeling. Our computer code, Spec2Col.py,is freely available and can be used to compute digital colorscodes for any type of input spectrum. Images of 107 stars withspectral types ranging from M9.5V to O1V as per Table 5including limb darkening are available as PDF with the onlineversion of this paper.
ACKNOWLEDGMENTS
The authors appreciate the comments on the manuscript froman anonymous referee. The authors also thank Christian Hillfor providing them with the color_system.py code, Tim-Oliver Husser for help in accessing the PHOENIX files, andFelix Mackebrandt for comments on a manuscript draft. Thiswork made use of NASA’s ADS Bibliographic Services. RHis supported by the German Aerospace Agency (DeutschesZentrum für Luft- und Raumfahrt) under PLATO DataCenter grant 50OO1501.
Conflict of interestThe authors declare no potential conflict of interests.
SUPPORTING INFORMATION
The data underlying this article are available on Zenodo athttps://doi.org/10.5281/zenodo.4090873.

8 Harre & Heller
How to cite this article: J.-V. Harre and R. Heller (2020),Digital color codes of stars, Astron. Nachr., 2021:XXX-XXX.
Harre & Heller 9
REFERENCES
Abt, H. A., Levato, H., & Grosso, M. 2002, July, ApJ, 573(1), 359-365. doi:
Becker, J. C., Vanderburg, A., Adams, F. C., Khain, T., & Bryan, M.2017, December, AJ, 154(6), 230. doi:
Bourrier, V., Lovis, C., Beust, H. et al. 2018, January, Nature,553(7689), 477-480. doi:
Claret, A. 2019, January, Research Notes of the American Astronom-ical Society, 3(1), 17. doi:
Eker, Z., Bakıs, , V., Bilir, S. et al. 2018, October, MNRAS, 479(4),5491-5511. doi:
Fraknoi, A., Morrison, D., & Wolff, S. 2019, June, Updateon the Non-profit Project to Produce and Disseminate a Free,Open-source Astro 101 Textbook and Resource Hub. Amer-ican Astronomical Society Meeting Abstracts #234 Vol. 234,p. 224.02.
Gordon, I. E., Rothman, L. S., Hill, C. et al. 2017, December,J. Quant. Spec. Radiat. Transf., 203, 3-69. doi:
Graff, K. 2013, Grundriss der Astrophysik. Vieweg+Teubner Ver-lag. Retrieved from https://books.google.de/books?id=r660BgAAQBAJ
Greenstein, J. L. 1958, The Spectra of the White Dwarfs. S. Flügge(Ed.), Astrophysik I: Sternoberflächen-Doppelsterne / Astro-physics I: Stellar-Surfaces-Binaries pp. 161–186. Berlin, Hei-delberg: Springer Berlin Heidelberg. Retrieved from https://doi.org/10.1007/978-3-642-45906-1_5 doi:
Hauschildt, P. H., & Baron, E. 1999, September, Journal ofComputational and Applied Mathematics, 109(1), 41-63.
Heller, R. 2019, March, A&A, 623, A137. doi:Heller, R., & Pudritz, R. E. 2016, April, Astrobiology, 16(4), 259-270.
doi:Hertzsprung, E. 1911, January, Publikationen des Astrophysikalis-
chen Observatoriums zu Potsdam, 63.Hippke, M., & Angerhausen, D. 2015, September, ApJ, 810(1), 29.
doi:Husser, T.-O., Wende-von Berg, S., Dreizler, S., Homeier, D., Rein-
ers, A., Barman, T., & Hauschildt, P. H. 2013, May, A&A, 553,A6. doi:
Kaltenegger, L., Selsis, F., Fridlund, M. et al. 2010, January, Astro-biology, 10(1), 89-102. doi:
Kasting, J. F., & Harman, C. E. 2013, December, Nature, 504(7479),221-223. doi:
Kurucz, R. L. 1993, January, ANewOpacity-SamplingModel Atmo-sphere Program for Arbitrary Abundances. M. M. Dworetsky,F. Castelli, & R. Faraggiana (Eds.), IAU Colloq. 138: Peculiarversus Normal Phenomena in A-type and Related Stars Vol. 44,p. 87.
Lanz, T., & Hubeny, I. 2003, June, ApJS, 146(2), 417-441. doi:Lanz, T., & Hubeny, I. 2007, March, ApJS, 169(1), 83-104. doi:Neckel, H., & Labs, D. 1987, March, Sol. Phys., 110(1), 139-170.
doi:North, A. D., & Fairchild, M. D. 1993, Color Research & Applica-
tion, 18(3), 163-170. Retrieved from https://onlinelibrary.wiley.com/doi/abs/10.1002/col.5080180306 doi:
Payne, C. H. 1925. Stellar Atmospheres; a Contribution to theObservational Study of High Temperature in the Reversing Lay-ers of Stars. (Unpublished doctoral dissertation). RADCLIFFECOLLEGE.
Pecaut, M. J., & Mamajek, E. E. 2013, September, ApJS, 208(1), 9.doi:
Pourbaix, D., Ivezić, Ž., Knapp, G. R., Gunn, J. E., & Lupton, R. H.2004, August, A&A, 423, 755-760. doi:
Russell, H. N. 1914, May, Popular Astronomy, 22, 275-294.Sanchis-Ojeda, R., Fabrycky, D. C., Winn, J. N. et al. 2012, July,
Nature, 487(7408), 449-453. doi:Sbordone, L., Bonifacio, P., Castelli, F., & Kurucz, R. L. 2004, Jan-
uary, Memorie della Societa Astronomica Italiana Supplementi,5, 93.
Schlosser,W., Schmidt-Kaler, T., &Milone, E. F. 1991, Challenges ofAstronomy. Hands-on Experiments for the Sky and Laboratory.
Sidis, O., & Sari, R. 2010, September, ApJ, 720(1), 904-911. doi:Stockman, A., & Sharpe, L. 2008, ISS/CIE Expert Symposium ’06
"75 Years of the CIE Standard Colorimetric Observer", 13-20.Retrieved from http://www.cvrl.org/people/Stockman/pubs/2006%20Physiological%20CMFs%20SS.pdf
Vanderburg, A., Rappaport, S. A., Xu, S. et al. 2020, Nature,585(7825), 363–367. Retrieved from https://doi.org/10.1038/s41586-020-2713-y doi:
Wegner, G., & Yackovich, F. H. 1983, December, ApJ, 275, 240-246.doi:
Weiler, M. 2018, October, A&A, 617, A138. doi:
How to cite this article: J.-V. Harre and R. Heller (2020), Digitalcolor codes of stars, Astron. Nachr., 2021:XXX-XXX.
10 Harre & Heller
TABLE 1 Linear RGB and Hex color codes of black bodies. The full table is available online (see Supporting information).
Teff RGB Hex2300 1.0,0.409,0.078 #ff68132400 1.0,0.432,0.093 #ff6e172500 1.0,0.455,0.109 #ff731b2600 1.0,0.476,0.126 #ff79202700 1.0,0.497,0.144 #ff7e242800 1.0,0.518,0.163 #ff84292900 1.0,0.537,0.182 #ff892e3000 1.0,0.557,0.202 #ff8d333100 1.0,0.575,0.223 #ff92383200 1.0,0.593,0.244 #ff973e3300 1.0,0.611,0.266 #ff9b433400 1.0,0.627,0.289 #ff9f493500 1.0,0.644,0.311 #ffa44f... ... ...
TABLE 2 Linear RGB and Hex color codes of stars with solar metallicity ([Fe∕H] = 0) as seen from space, computed usingPHOENIX model spectra. The full table is available online (see Supporting information).
Teff log(g) [Fe∕H] RGB Hex2300 3.0 0.0 1.0,0.615,0.292 #ff9c4a2300 3.5 0.0 1.0,0.571,0.25 #ff913f2300 4.0 0.0 1.0,0.539,0.211 #ff89352300 4.5 0.0 1.0,0.507,0.175 #ff812c2300 5.0 0.0 1.0,0.491,0.144 #ff7d242300 5.5 0.0 1.0,0.435,0.098 #ff6e192300 6.0 0.0 1.0,0.393,0.076 #ff64132400 3.0 0.0 1.0,0.66,0.313 #ffa84f2400 3.5 0.0 1.0,0.653,0.309 #ffa64e2400 4.0 0.0 1.0,0.604,0.266 #ff9a432400 4.5 0.0 1.0,0.549,0.212 #ff8b362400 5.0 0.0 1.0,0.518,0.179 #ff842d2400 5.5 0.0 1.0,0.484,0.137 #ff7b232400 6.0 0.0 1.0,0.434,0.098 #ff6e19... ... ... ... ...
TABLE 3 Linear RGB and Hex color codes of stars with [Fe∕H] = −1 as seen from space, computed using PHOENIXmodelspectra. The full table is available online (see Supporting information).
Teff log(g) [Fe∕H] RGB Hex2300 3.0 -1.0 1.0,0.752,0.303 #ffbf4d2300 3.5 -1.0 1.0,0.637,0.213 #ffa2362300 4.0 -1.0 1.0,0.559,0.151 #ff8e262300 4.5 -1.0 1.0,0.493,0.103 #ff7d1a2300 5.0 -1.0 1.0,0.469,0.086 #ff77152300 5.5 -1.0 1.0,0.425,0.059 #ff6c0f2300 6.0 -1.0 1.0,0.392,0.045 #ff640b2400 3.0 -1.0 1.0,0.774,0.312 #ffc54f2400 3.5 -1.0 1.0,0.671,0.232 #ffab3b2400 4.0 -1.0 1.0,0.604,0.183 #ff992e2400 4.5 -1.0 1.0,0.517,0.123 #ff831f2400 5.0 -1.0 1.0,0.468,0.09 #ff77172400 5.5 -1.0 1.0,0.426,0.063 #ff6c0f2400 6.0 -1.0 1.0,0.406,0.052 #ff670d... ... ... ... ...
Harre & Heller 11
TABLE 4 Linear RGB and Hex color codes of stars with [Fe∕H] = −2 as seen from space, computed using PHOENIXmodelspectra. The full table is available online (see Supporting information).
Teff log(g) [Fe∕H] RGB Hex2300 3.0 -2.0 1.0,0.525,0.082 #ff85142300 3.5 -2.0 1.0,0.48,0.067 #ff7a102300 4.0 -2.0 1.0,0.443,0.057 #ff710e2300 4.5 -2.0 1.0,0.422,0.054 #ff6b0d2300 5.0 -2.0 1.0,0.41,0.052 #ff680d2300 5.5 -2.0 1.0,0.394,0.051 #ff640d2300 6.0 -2.0 1.0,0.382,0.055 #ff610d2400 3.0 -2.0 1.0,0.527,0.09 #ff86172400 3.5 -2.0 1.0,0.506,0.082 #ff81152400 4.0 -2.0 1.0,0.468,0.07 #ff77112400 4.5 -2.0 1.0,0.437,0.064 #ff6f102400 5.0 -2.0 1.0,0.417,0.062 #ff6a0f2400 5.5 -2.0 1.0,0.406,0.061 #ff670f2400 6.0 -2.0 1.0,0.394,0.065 #ff6410... ... ... ... ...
TABLE 5 Linear RGB and Hex color codes of solar metallicity main sequence stars for spectral types (SpT) M9.5V - O1V.
SpT Teff log(g) RGB HexM9.5V 2300 5.0 1.0,0.491,0.144 #ff7d24 ∙M9V 2400 5.0 1.0,0.518,0.179 #ff842d ∙M8V 2500 5.0 1.0,0.542,0.202 #ff8a33 ∙M7.5V 2600 5.0 1.0,0.607,0.255 #ff9a41 ∙M6.5V 2700 5.0 1.0,0.648,0.286 #ffa548 ∙M6V 2800 5.0 1.0,0.649,0.285 #ffa548 ∙M6V 2900 5.0 1.0,0.644,0.285 #ffa448 ∙M5.5V 3000 5.0 1.0,0.641,0.289 #ffa349 ∙M4.5V 3100 5.0 1.0,0.638,0.293 #ffa24a ∙M4V 3200 5.0 1.0,0.638,0.3 #ffa24c ∙M3.5V 3300 5.0 1.0,0.638,0.308 #ffa24e ∙M3V 3400 5.0 1.0,0.638,0.315 #ffa250 ∙M2.5V 3500 5.0 1.0,0.637,0.322 #ffa251 ∙M2V 3600 5.0 1.0,0.635,0.327 #ffa153 ∙M1V 3700 4.5 1.0,0.637,0.34 #ffa256 ∙M0.5V 3800 4.5 1.0,0.635,0.346 #ffa158 ∙M0V 3900 4.5 1.0,0.636,0.354 #ffa25a ∙K8V 4000 4.5 1.0,0.641,0.369 #ffa35e ∙K7V 4100 4.5 1.0,0.65,0.389 #ffa563 ∙K6.5V 4200 4.5 1.0,0.662,0.411 #ffa868 ∙K5.5V 4300 4.5 1.0,0.677,0.439 #ffac6f ∙K5V 4400 4.5 1.0,0.696,0.47 #ffb177 ∙K4.5V 4500 4.5 1.0,0.717,0.501 #ffb67f ∙K4V 4600 4.5 1.0,0.739,0.533 #ffbc87 ∙K3.5V 4700 4.5 1.0,0.761,0.565 #ffc18f ∙K3V 4800 4.5 1.0,0.781,0.595 #ffc797 ∙K3V 4900 4.5 1.0,0.802,0.626 #ffcc9f ∙K2.5V 5000 4.5 1.0,0.821,0.657 #ffd1a7 ∙K1.5V 5100 4.5 1.0,0.84,0.691 #ffd6b0 ∙K1V 5200 4.5 1.0,0.857,0.722 #ffdab8 ∙
12 Harre & Heller
TABLE 5 (continued)
SpT Teff log(g) RGB HexK0V 5300 4.5 1.0,0.872,0.753 #ffdec0 ∙G9V 5400 4.5 1.0,0.886,0.783 #ffe1c7 ∙G8V 5500 4.5 1.0,0.898,0.813 #ffe5cf ∙G6V 5600 4.5 1.0,0.91,0.845 #ffe8d7 ∙G4V 5700 4.5 1.0,0.922,0.878 #ffebdf ∙G2V 5800 4.5 1.0,0.931,0.905 #ffede6 ∙G1V 5900 4.5 1.0,0.94,0.931 #ffefed ∙F9.5V 6000 4.5 1.0,0.951,0.967 #fff2f6 ∙F9V 6100 4.5 1.0,0.96,0.998 #fff4fe ∙F8V 6200 4.0 0.955,0.931,1.0 #f3edff ∙F6V 6300 4.0 0.922,0.908,1.0 #ebe7ff ∙F6V 6400 4.0 0.896,0.891,1.0 #e4e3ff ∙F5V 6500 4.0 0.869,0.871,1.0 #dddeff ∙F4V 6600 4.0 0.844,0.855,1.0 #d7d9ff ∙F3V 6700 4.0 0.823,0.84,1.0 #d1d6ff ∙F2V 6800 4.0 0.802,0.826,1.0 #ccd2ff ∙F2V 6900 4.0 0.782,0.812,1.0 #c7cfff ∙F1V 7000 4.0 0.763,0.799,1.0 #c2cbff ∙F0V 7200 4.0 0.725,0.773,1.0 #b8c5ff ∙A9V 7400 4.0 0.692,0.75,1.0 #b0bfff ∙A8V 7600 4.0 0.674,0.738,1.0 #abbcff ∙A7V 7800 4.0 0.636,0.712,1.0 #a2b5ff ∙A6V 8000 4.0 0.606,0.69,1.0 #9ab0ff ∙A4V 8200 4.0 0.579,0.67,1.0 #93aaff ∙A4V 8400 4.0 0.556,0.652,1.0 #8da6ff ∙A3V 8600 4.0 0.546,0.645,1.0 #8ba4ff ∙A2V 8800 4.0 0.531,0.634,1.0 #87a1ff ∙A2V 9000 4.0 0.519,0.624,1.0 #849fff ∙A1V 9200 4.0 0.508,0.616,1.0 #819dff ∙A1V 9400 4.0 0.498,0.608,1.0 #7f9bff ∙A0V 9600 4.0 0.49,0.601,1.0 #7d99ff ∙A0V 9800 4.0 0.483,0.595,1.0 #7b97ff ∙A0V 10000 4.0 0.477,0.59,1.0 #7996ff ∙B9.5V 10200 4.0 0.472,0.586,1.0 #7895ff ∙B9.5V 10400 4.0 0.467,0.582,1.0 #7794ff ∙B9V 10600 4.0 0.463,0.578,1.0 #7693ff ∙B9V 10800 4.0 0.459,0.575,1.0 #7592ff ∙B9V 11000 4.0 0.456,0.572,1.0 #7491ff ∙B9V 11200 4.0 0.453,0.57,1.0 #7391ff ∙B9V 11400 4.0 0.451,0.567,1.0 #7290ff ∙B9V 11600 4.0 0.45,0.566,1.0 #7290ff ∙B8V 11800 4.0 0.448,0.564,1.0 #728fff ∙B8V 12000 4.0 0.446,0.562,1.0 #718fff ∙B8V 12500 4.0 0.44,0.557,1.0 #708eff ∙B8V 13000 4.0 0.436,0.554,1.0 #6f8dff ∙B7V 13500 4.0 0.432,0.55,1.0 #6e8cff ∙B7V 14000 4.0 0.429,0.547,1.0 #6d8bff ∙B6V 14500 4.0 0.425,0.544,1.0 #6c8aff ∙B6V 15000 4.0 0.421,0.541,1.0 #6b89ff ∙B5V 16000 4.0 0.414,0.536,1.0 #6988ff ∙
Harre & Heller 13
TABLE 5 (continued)
SpT Teff log(g) RGB HexB3V 17000 4.0 0.408,0.532,1.0 #6887ff ∙B2.5V 18000 4.0 0.403,0.527,1.0 #6686ff ∙B2.5V 19000 4.0 0.398,0.524,1.0 #6585ff ∙B2V 20000 4.0 0.394,0.52,1.0 #6484ff ∙B2V 21000 4.0 0.39,0.517,1.0 #6383ff ∙B2V 22000 4.0 0.387,0.514,1.0 #6283ff ∙B1.5V 23000 4.0 0.384,0.512,1.0 #6182ff ∙B1.5V 24000 4.0 0.381,0.509,1.0 #6181ff ∙B1.5V 25000 4.0 0.379,0.507,1.0 #6081ff ∙B1V 26000 4.0 0.376,0.505,1.0 #5f80ff ∙B1V 27000 4.0 0.373,0.503,1.0 #5f80ff ∙B1V 27500 4.0 0.371,0.501,1.0 #5e7fff ∙B0.5V 28000 4.0 0.371,0.5,1.0 #5e7fff ∙B0.5V 29000 4.0 0.368,0.498,1.0 #5d7fff ∙B0.5V 30000 4.0 0.366,0.496,1.0 #5d7eff ∙O9.5V 32500 4.0 0.361,0.491,1.0 #5c7dff ∙O8V 35000 4.0 0.357,0.487,1.0 #5b7cff ∙O6V 37500 4.0 0.359,0.487,1.0 #5b7cff ∙O5V 40000 4.0 0.358,0.486,1.0 #5b7bff ∙O4V 42500 4.0 0.357,0.485,1.0 #5a7bff ∙O4V 45000 4.0 0.357,0.485,1.0 #5a7bff ∙O3V 47500 4.0 0.357,0.485,1.0 #5b7bff ∙O2V 50000 4.0 0.358,0.486,1.0 #5b7bff ∙O2V 52500 4.0 0.359,0.487,1.0 #5b7cff ∙O1V 55000 4.0 0.361,0.489,1.0 #5c7cff ∙