Diagnostic agroenvironnemental de la fertilisation phosphatée des ...
147
JULIE GUERIN DIAGNOSTIC AGROENVIRONNEMENTAL DE LA FERTILISATION PHOSPHATÉE DES CULTURES MARAÎCHÈRES EN SOLS ORGANIQUES Thèse présentée à la Faculté des études supérieures de l'Université Laval dans le cadre du programme de doctorat en sols et environnement pour l'obtention du grade de Philosophiae Doctor (Ph.D.) DEPARTEMENT DES SOLS ET DE GENIE AGROALIMENTAIRE FACULTÉ DES ÉTUDES SUPÉRIEURES UNIVERSITÉ LAVAL QUÉBEC 2009 Julie Guérin, 2009
-
Upload
nguyencong -
Category
Documents
-
view
222 -
download
2
Transcript of Diagnostic agroenvironnemental de la fertilisation phosphatée des ...
JULIE GUERIN
DIAGNOSTIC AGROENVIRONNEMENTAL DE LA FERTILISATION PHOSPHATÉE DES CULTURES
MARAÎCHÈRES EN SOLS ORGANIQUES
Thèse présentée à la Faculté des études supérieures de l'Université Laval
dans le cadre du programme de doctorat en sols et environnement pour l'obtention du grade de Philosophiae Doctor (Ph.D.)
DEPARTEMENT DES SOLS ET DE GENIE AGROALIMENTAIRE FACULTÉ DES ÉTUDES SUPÉRIEURES
UNIVERSITÉ LAVAL QUÉBEC
2009
Julie Guérin, 2009
RESUME COURT
Cette étude avait comme objectifs de développer un indicateur agronomique et
environnemental, d'évaluer les pertes en phosphore (P) en dehors de la couche arable et de
déterminer des doses de P requises par classe de fertilité pour les cultures de la carotte, du
céleri, du chou-chinois, de la laitue, de l'oignon et de la pomme de terre cultivés en sols
organiques. Nos travaux ont permis i) de sélectionner l'indice de saturation en P selon la
méthode de Mehlich III (ISPMIII) comme test de P en sols organiques ; ii) de déterminer un
seuil critique environnemental d'ISPM-m fixé à 0,05 au-delà duquel la fertilisation ne doit
dépasser les exportations de P par la culture; iii) d'établir des seuils critiques agronomiques
d'ISPM-m entre 0,10 et 0,15 à partir de la réponse de la culture à la fertilisation; iv) de
démontrer une variabilité spatiale faible et une variabilité saisonnière élevée de I'ISPM-III en
sols organiques avec des pertes enregistrées de plus de 40 kg P ha"1 entre l'automne et le
printemps suivant; v) de déterminer des classes de fertilité du sol par saut de 0,05 unité
d'ISPM-m; vi) de démontrer aucune ou faible réponse de la culture à la fertilisation sauf
dans la classe de fertilité moyenne 0,05-0,10. Les recommandations en P sont basées selon
une approche agroenvironnementale limitant l'accumulation du P dans les sols et la
fertilisation doit être inférieure aux exportations de P lorsque I'ISPM-III dépasse le seuil
environnemental de 0,05.
u
RESUME LONG
La majorité des productions maraîchères sont cultivées en sols organiques dans le Sud-
ouest du Québec, Canada. Plusieurs cours d'eau drainant ces sols montrent des
concentrations dépassant le critère de 30 pg P total (PT) par litre (L1) généralement retenu
par la réglementation environnementale pour prévenir l'eutrophisation. Les objectifs de
cette recherche étaient de: i) développer des indices environnementaux et agronomiques de
saturation en phosphore (P) des sols organiques selon la méthode Mehlich III (ISPMIII); ii)
identifier les patrons de variation spatiale et saisonnière du P extrait selon la méthode M-III
(PM-III) et de I'ISPM-III des sols organiques cultivés; iii) élaborer des recommandations
agroenvironnementales en P pour la carotte, le céleri, le chou-chinois, la laitue, la pomme
de terre et l'oignon en sols organiques. Entre 2002 et 2005, 66 sites d'essais de fertilisation
ont été implantés pour déterminer la réponse des différentes cultures à l'ajout de P et les
exportations de P par la culture. La variabilité spatiale et saisonnière du PM-III et de ISPMIII a
été étudiée lors de l'automne 2006 et du printemps 2007 selon une grille d'échantillonnage
de 25 m par 25 m sur des échantillons de trois types de sols organiques dans des champs
cultivés d'une superficie moyenne de 7 ha. L'approche agroenvironnementale a été testée
sur 82 sols organiques prélevés à travers le Québec et sur les 66 sites d'essais de
fertilisation. La méthode a été étalonnée par rapport au degré de saturation en P extrait à
l'oxalate acide d'ammonium (DSPox) avec un facteur am=0,4 et à la méthode d'extraction à
l'eau du P. Le rapport molaire [P/(Al-^Fe)]M-m (7=5) était le mieux corrélé au DSPox
(1^=0.88). Un seuil critique de 0,05 de [P/(Al+5Fe)]M-m a été calculé pour DSPOx=0.25 et
Pw=9.7 mg P L"1. Cette valeur fut validée avec une étude indépendante menée en Caroline
du Nord. Des seuils agronomiques ISPM-III se situaient entre 0,10 et 0,15. Les analyses
spatiales en sols organiques ont démontré que les valeurs de PM-III et d'ISPM-m étaient
spatialement autocorrélées. Il y avait également une grande variation parmi les valeurs de
PM-III et d'ISPM-m entre l'automne et le printemps. Malgré la variation spatiale et
saisonnière, les valeurs ISPM-HI étaient plus élevées que le seuil environnemental à chacun
des sites pour les deux périodes d'échantillonnage. Les seuils agroenvironnementaux
(ISPMIII environnemental de 0,05 et ISPMIII agronomiques de 0,10 et 0,15) étaient les
critères de référence pour initier la classification de la fertilité du sol et élaborer des
m

recommandations en P pour les cultures maraîchères. Cinq classes de fertilité définies par le
rapport molaire [P/(Al+yFe)]M-m ont été déterminées (faible: 0,00-0,05; moyenne: 0,05-
0,10; élevée: 0,10-0,15; très élevée: 0,15-0,25; excessivement élevée: > 0,25). La
probabilité de réponse à l'intérieur des classes de fertilité de sol a été évaluée à l'aide d'un
test de puissance. Les tests de puissance et les courbes de réponses de la culture à la
fertilisation phosphatée n'ont démontré aucune réponse significative des cultures à l'ajout
de P sauf dans la classe de fertilité moyenne (0,05-0,10). La fertilisation en P a été proposée
dans la classe de fertilité faible (0,00-0,05) et moyenne (0,05-0,10). Pour les classes de
fertilité au dessus de 0,10 l'application de P pourrait être substantiellement réduite sans
affecter le rendement et la qualité des cultures. Donc, le seuil critique environnemental
d'ISPM-m au-delà duquel la fertilisation ne doit dépasser les exportations de P par la culture
est fixé à 0,05. Une importante perte de P (41 kg P ha"1) a été mesurée entre l'automne
2006 et le printemps suivant. La culture ne répond plus à la fertilisation phosphatée à partir
d'une valeur d'ISPM-m de 0,10.
iv
ABSTRACT
Vegetable crops are currently grown in organic soils of southwestern Quebec, Canada.
Watercourses draining these soils show phosphorus (P) concentration exceeding the current
regulatory criterion of 30 pg P total (PT) by liter (L1) to prevent eutrophication. The aims
of this research were: i) to develop environmental and agronomic thresholds of soil
phosphorus saturation using Mehlich III method (IPSM-III) for cultivated organic soils; ii) to
identify the spatial and temporal variation patterns of P using the Mehlich III method (PM-
III) and IPSM-III for cultivated organic soils; and iii) to elaborate P agri-environmental
recommendations for carrots, celery, Chinese cabbage, lettuce, onions, and potatoes grown
in organic soils. Between 2002 and 2005, we conducted 66 field trials to determine crop
response to added P and P removal by the harvested portion of the crop. Spatial and
seasonal variability of PM-III and IPSM-III was studied on composite soil samples taken in a
25 m by 25 m grid size on plots averaging 7 ha in three types of cultivated organic soils in
fall of 2006 and spring of 2007. We collected 82 samples across Histosols in Quebec and
66 samples from fertilizer trials to calibrate the soil test methods against the degree of P
saturation using the acid-oxalate method (DPSox) and setting am = 0.4, and the water-
extractable P method (Pw)- The [P/(AH7Fe)]M-m ratio as IPSM-III was the most closely
related to DPSox (r2 = 0.88) setting y = 5. The critical [P/(Al+5Fe)]M-m ratio was found to
be 0.05 at DPSox = 0.25 and Pw = 9.7 mg P L". The spatial analysis of organic soils
showed that PM-III and IPSM-III were spatially autocorrelated. There was also large seasonal
variability. The IPSM-III values were always higher than environmental threshold of 0.05
across sites and sampling periods. Environmental (IPSM-III 0.05) and agronomic thresholds
(IPSM-III 0.10 and 0.15) were the benchmarks to initiate soil fertility classification and
assess P requirements. Five soil fertility classes defined by the [P/(Al47Fe)]M-m ratio were
established (low: 0.00-0.05; medium: 0.05-0.10; high: 0.10-0.15; very-high: 0.15-0.25;
excessively-high: > 0.25). Response probability within each soil fertility class was
computed using power tests. Power tests and crop response curves showed little or no crop
response to added P across soil fertility classes except 0.05-0.10. The P fertilisation has
been proposed for low (0.00-0.05) and medium (0.05-0.10) soil fertility classes. For soil
fertility classes above 0.10, P application could be reduce substantially without affecting

crop yield and quality. The critical IPSM-III value above which the P fertilisation should not
exceed crop P removal was fixed at 0.05. An important P loss (41 kg P ha"1) was measured
between fall 2006 and the following spring. The vegetable crops did not respond to added P
above the IPSM-III value of 0.10.
vi
AVANT-PROPOS
Cette thèse comprend huit chapitres. Les chapitres 4, 5 et 6 ont été préparés sous forme de
publications scientifiques. Le contenu original des articles rédigé en langue anglaise a été
conservé. Cependant, un résumé en langue française accompagne ces chapitres afin de
respecter les règlements de la Faculté des études supérieures de l'Université Laval. Il va de
soit que la répétition de certains paragraphes dans ces écrits était inéluctable.
Les premier et deuxième chapitres présentent l'introduction et la revue de littérature
relatant les éléments de la littérature nécessaires à la compréhension du sujet de thèse et à la
formulation des hypothèses et des objectifs.
Les hypothèses et objectifs de recherche forment le troisième chapitre.
Le quatrième chapitre traite du développement des indices environnementaux et
agronomiques de saturation en phosphore des sols organiques selon la méthode Mehlich III
(ISPM-III). Ce chapitre a fait l'objet de publication dans la revue Journal of Environmental
Quality : Guérin J., L.E. Parent, and R. Abdelhafid. 2007. Agri-environmental thresholds
using Mehlich III soil phosphorus saturation index for vegetables in Histosols. Journal of
Environmental Quality. 36: 975-982.
Le cinquième chapitre relate les résultats de la variabilité spatiale et saisonnière du
phosphore (PM-III) et de l'indice de saturation en phosphore (ISPM-III) extrait selon la
méthode Mehlich III dans sols organiques cultivés : Guérin, J.É., L.É. Parent, and B.C. Si.
2009. Spatial and seasonal variability of IPSM-III in cultivated organic soils.
Le sixième chapitre porte sur la fertilisation phosphatée des cultures maraîchères cultivées
en sols organiques du Québec : Guérin J.É., L.É. Parent, and A. Pellerin. Phosphorus
fertilization of vegetable crops in Québec cutivated Organic soils.
vn

Le septième et le huitième chapitre présentent la conclusion générale de la thèse ainsi que
la bibliographie utilisée pour la rédaction des chapitres 1, 2, 3 et 7. Ces chapitres sont suivis
d'une section sur les perspectives de la recherche.
vin
REMERCIEMENTS
Le projet de développer des outils d'aide à la fertilisation phosphatée pour les cultures
maraîchères en sols organiques est un travail de grande envergure qui nécessite la
participation de plusieurs acteurs. Je voudrais donc exprimé ma gratitude envers les
personnes qui m'ont aidé d'une manière ou d'une autre dans cette aventure qui n'aurait eu
lieu sans leur contribution.
La première personne que je tiens à remercier est M. Léon-Etienne Parent, mon directeur
de recherche, qui m'a donné la confiance nécessaire pour mettre à terme un projet qui a
débuté à la maîtrise et s'est poursuivi au doctorat. Il a toujours porté grand intérêt pour mes
travaux et encadré dans leur réalisation. Il a toujours répondu à mes nombreuses
sollicitations et encouragé à développer mon esprit critique. Il m'a donné la liberté d'ouvrir
mes horizons et d'apprendre un nouveau langage en acceptant mon départ pour la
Saskatchewan. Je le remercie pour la confiance et le soutien dont il a fait preuve à mon
égard. J'éprouve un profond respect pour son travail ainsi que pour ses qualités humaines.
Merci aux Docteurs Annie Pellerin, Noura Ziadi et Lotfi Khiari d'avoir accepté de faire
partie de mon jury. Leurs remarques et commentaires permettront d'améliorer et clarifier
certains points de ce manuscrit. Je voudrais également remercier les coauteurs des articles
scientifiques, Rahima Abdelhafid et Bing C. Si.
Remerciements à mon équipe terrain, / 'Escouade Organique ; Samuel Comtois,
Geneviève Roux et Jimmy Planche. Je les remercie de leur assiduité au travail et de leur
soutien durant ces journées de travail sur le terrain. Je me rends compte à quel point ils
étaient importants dans le travail et dans la vie. Ce fut un réel plaisir de travailler avec eux.
Remerciements particuliers à Samuel Comtois pour son amitié, sa joie de vivre, son
énergie et ses encouragements. Sincères remerciements à Nicolas Samson pour avoir
toujours répondu à mes demandes et rendu service de si nombreuses fois. Je le remercie
pour sa disponibilité, son aide sur le terrain, ses connaissances et ses conseils. Merci à
César Cchléla, Annie Pellerin et Eric Thibeault pour leur aide, leurs conseils et leur
IX

amitié. Merci aussi aux producteurs maraîchers participants, au Consortium PRISME
et à tous les dépisteurs qui se sont joints à nous lors des travaux sur le terrain. Merci au
Ministère de l'Agriculture, des Pêcheries et de l'Alimentation du Québec (St-Rémi,
Qc), à Phytodata Inc. (Sherrington, Qc) et à Technique Gazon (LaSalle, Qc).
Je tiens également à remercier Marie-Hélène Lamontagne pour son soutien au laboratoire
et plus particulièrement pour son amitié. Merci à Rahima Abdelhafid pour son soutien au
laboratoire. Merci à mon ami Jonathan Lafond, pour ses nombreux services offerts et son
amitié. Merci à Angela Bedard-Haughn pour l'aide et l'attention qu'elle m'a porté à
Saskatoon.
Je voudrais également remercier les organismes qui ont offert un soutien financier : le
Conseil de Recherche en Pêche et Agroalimentaire du Québec (CORPAQ), le Conseil
de Recherche en Sciences Naturelles et Génie du Canada (CRSNG), le Conseil pour le
Développement de l'Agriculture du Québec (CDAQ), la Ferme Daniel Bolduc et
Patates Dolbec Inc.
Je remercie évidemment mes parents Martine et Ghislain et mon frère Frédéric, pour ce
qu'ils sont et ce qu'ils donnent. Pour leur irremplaçable soutien et inconditionnel amour. Ils
sont toujours présents pour m'écouter, m'encourager et partager les joies et les peines.
Remerciements également à ma famille et mes amis (es) d'être présents dans ma vie. Et
finalement, un profond merci à mon amour, Maxime, pour me tenir la main tous les jours.

A ma Mère, à Maxime et à Samuel

TABLE DES MATIERES
RÉSUMÉ COURT II
RÉSUMÉ LONG III
ABSTRACT V
AVANT-PROPOS VII
REMERCIEMENTS IX
TABLE DES MATIÈRES XII
LISTE DES TABLEAUX XV
LISTE DES FIGURES XVI
LISTE DES ABRÉVATIONS XVII
CHAPITRE 1 : INTRODUCTION 1
1. INTRODUCTION 2
CHAPITRE 2: REVUE DE LITTÉRATURE 4 2. REVUE DE LITTÉRATURE 5
2.1 Les sols organiques 5 2.1.1 Formation des sols organiques 5
2.2 Disponibilité du phosphore dans le sol : 6 2.2.1 Formes de fer et d'aluminium dans le sol 7 2.2.2 Mécanismes de sorption du phosphore 8 2.2.3 Mécanismes d'adsorption du phosphore 8
2.3 Pollution de l'eau par le phosphore 9 2.3.1 Potentiel de dissolution du phosphore 10
2.4 Méthodes d'extraction 11 2.4.1 Oxalate acide d'ammonium 11 2.4.2 Mehlich-III ; 11 2.4.3 Pyrophosphate de sodium 13 2.4.4 Méthode d'analyses du phosphore 13 2.4.5 Préparation de l'échantillon 14
2.5 Saturation des sols en phosphore r 14 2.5.1 Degré de saturation en phosphore 14 2.5.2 Indice de saturation en phosphore 17
2.6 Variabilité spatiale et temporelle 18 2.7 Aspect agronomique 19
2.7.1 Étalonnage des sols 19
xu
2.7.2 Doses économiques optimales 20 2.7.3 Modèles de recommandation 21
CHAPITRE 3: HYPOTHÈSES ET OBJECTIFS 22
3. HYPOTHÈSES ET OBJECTIFS 23 3.1 Hypothèses 23 3.2 Objectif général 23
3.2.1 Objectifs spécifiques 23 CHAPITRE 4 PUBLICATION SCIENTIFIQUE NO 1 DE LA THÈSE : AGRI-ENVIRONMENTAL THRESHOLDS USING MEHLICH III SOIL PHOSPHORUS SATURATION INDEX FOR VEGETABLES IN HISTOSOLS 25
4. INDICE DE SATURATION DES SOLS EN PHOSPHORE UTILISANT LA MÉTHODE MEHLICH III POUR DÉTERMINER LES SEUILS AGROENVIRONNEMENTAUX DES CULTURES MARAÎCHÈRES CULTIVÉES EN SOLS ORGANIQUES 26
4.1 Avant-propos 26 4.2 Résumé 27 4.3 Abstract 27 4.4 Introduction 28 4.5 Theory : 29 4.6 Materials and method 31
4.6.1 Experimental setup for fertilizer trials 31 4.6.2 Soil analysis 32 4.6.3 Statistical analysis 34
4.7 Results and discussion 34 4.7.1 Soil characteristics 34 4.7.2 Soil Phosphorus Test 35 4.7.3 Model Development 36 4.7.4 Soil Test Calibration 37
4.8 Conclusion 38 4.9 Acknowledgements 38 4.10 References 39
CHAPITRE 5 PUBLICATION SCIENTIFIQUE NO 2 DE LA THÈSE: SPATIAL AND SEASONAL VARIABILITY OF MEHLICH III SOIL PHOSPHORUS SATURATION INDEX IN CULTIVATED ORGANIC SOILS 53
5. VARIABILITE SPATIALE ET SAISONNIERE DE L'INDICE DE SATURATION EN PHOSPHORE UTILISANT LA METHODE DE MEHLICH III DANS LES SOLS ORGANIQUES CULTIVES 54
5.1 Avant-propos 54 5.2 Résumé 55 5.3 Abstract 55 5.4 Introduction 56 5.5 Materials and methods 58
5.5.1 Study sites 58 5.5.2 Soil Analysis 59 5.5.3 Statistical Methods 60
5.6 Results and Discussion 60
Xlll
5.6.1 Spatial variability 60 5.6.2 Semivariance of dataset 61 5.6.3 Seasonal variability 63
5.7 Conclusion 65 5.8 Acknowledgements 65 5.9 References 66
CHAPITRE 6 PUBLICATION SCIENTIFIQUE NO 3 DE LA THÈSE: PHOSPHORUS FERTILIZATION OF VEGETABLE CROPS GROWN IN QUEBEC ORGANIC SOILS 82
6 . F E R T I L I S A T I O N P H O S P H A T É E D E S C U L T U R E S M A R A Î C H È R E S C U L T I V É E S E N S O L S
ORGANIQUES DU QUÉBEC 83 6.1 Avant-propos 83 6.2 Résumé 84 6.3 Abstract ; 84 6.4 Introduction 85 6.5 Materials and method 87
6.5.1 Fertilizer trials 87 6.5.2 Soil analysis 88 6.5.3 Plant biomass analysis 89 6.5.4 Statistical methods 89
6.6 Results and discussion 90 6.6.1 Soil properties 90 6.6.2 Phosphorus requirements 90
6.7 Conclusion 93 6.8 Acknowledgements 93 6.9 References 94
CHAPITRE 7: CONCLUSION GÉNÉRALE 112
7. CONCLUSION GÉNÉRALE 113
CHAPITRE 8: BIBLIOGRAPHIE 116
8.1 BIBLIOGRAPHIE 117 8.2 MÉDIAGRAPHIE 126
PERSPECTIVES DE RECHERCHE 127
xiv
LISTE DES TABLEAUX
Tableau 1: Phosphorus application rates at experimental sites 51 Tableau 2: Range of soil properties in the survey and the field trial datasets 52 Tableau 3: Summary statistics of phosphorus (PM-III) and index of phosphorus saturation using Mehlich III method (IPSM-III) parameters for three organic soils and two sampling periods 71 Tableau 4: Range of aluminum and iron values using Mehlich III method and phosphorus, aluminum, iron and degree of phosphate saturation using acid ammonium oxalate method for three organic soils and two sampling periods 72 Tableau 5: Semivariogram parameters for phosphorus (PM-III), and index of phosphorus saturation using Mehlich III method (IPSM-III) for three organic soils and two sampling periods 73 Tableau 6: Cross-validation results of kridged values for for phosphorus (PM-III), and index of phosphorus saturation using Mehlich III method (IPSM-III) for three organic soils and two sampling periods 74 Tableau 7: Description of experimental fertilizer sites between 2002 and 2006 growing seasons 97 Tableau 8: Crop market requirements 98 Tableau 9: Soil characteristics of experimental trials in each block at the site establishment and in the control plot at the site harvest for each vegetable crop 99 Tableau 10: Analysis of variance results on marketable yields by crop and year 100 Tableau 11: Marketable yields (Mg kg"1) and P exported by the harvested portion of the crop (kg P ha"1) for carrot 101 Tableau 12: Marketable yields (Mg kg"1) and P exported by the harvested portion of the crop (kg Pha"1) for Chinese cabbage 102 Tableau 13: Marketable yields (Mg kg"1) and P exported by the harvested portion of the crop (kg P ha"1) for onion 103 Tableau 14: Marketable yields (Mg kg"1) and P exported by the harvested portion of the crop (kg P ha"1) for potato 104 Tableau 15: Marketable yields (Mg kg"1) and P exported by the harvested portion of the crop (kg P ha"1) for celery 105 Tableau 16: Marketable yields (Mg kg"1) and P exported by the harvested portion of the crop (kg P ha"1) for lettuce 106 Tableau 17: Soil fertility classification, P exported by the harvested portion of the crop and power of fertilization for vegetable crops grown in organic soil for the 2002-2005 period.
107 Tableau 18: Soil fertility classification, P exported by the harvested portion of the crop and power of fertilization for vegetable crops grown in organic soil in 2006 108 Tableau 19: Recommended P applications for vegetable crops grown in cultivated organic soils 109
xv
LISTE DES FIGURES
Figure 1: The r2 values for relationships between the [P/(Al+yFe)]M-in ratio as an index of P saturation (IPSM-III) and the degree of P saturation (DPSox) (dm - 0.4) or water-extractable P (Pw) by varying the y coefficient in IPSM-III 45 Figure 2: Relationship between the [P/(Al+7Fe)]M-m ratio as an index of P saturation (IPSM-III) (Y = 5) and the degree of P saturation (DPSox) (am= 0.4). The model and all the parameters are significant at P < 0.001) 46 Figure 3: Relationship between the [P/(Al-HyFe)]M-m ratio as an index of P saturation (IPSM-III) (Y = 5) and water-extractable P (Pw)- The model and all the parameters are significant at P< 0.001) 47 Figure 4: Relationship between relative yield and the [P/(Al+yFe)]M-m ratio as an index of P saturation (IPSM-III) (Y = 5) across Group A crops 48 Figure 5: Relationship between relative yield and the [P/(AH7Fe)]M-in ratio as an index of P saturation (IPSM-III) (Y = 5) across Group B crops 49 Figure 6: Significance (a level for rejecting H0) of the partition between two soil groups below or above the [P/(Al-HyFe)]M-m ratio as an index of P saturation (IPSM-III) (Y = 5) separator on the x axis 50 Figure 7: Spatial distribution of a) phosphorus (PM-III) (mg kg"1) for soil samples collected in fall 2006 and b) phosphorus (PM-III) (mg kg"1) for soil samples collected in spring 2007 at the site 1 75 Figure 8: Spatial distribution at the site 1 of a) index of phosphorus saturation (IPSM-III) for soil samples collected in fall 2006, b) index of phosphorus saturation (IPSM-III) for soil samples collected in spring 2007 and c) PM-III lost (kg ha"1) between fall 2006 and spring 2007 76 Figure 9: Spatial distribution of a) phosphorus (PM-III) (mg kg"1) for soil samples collected in fall 2006 and b) phosphorus (PM-III) (mg kg"1) for soil samples collected in spring 2007 at the site 2 77 Figure 10: Spatial distribution at the site 2 of a) index of phosphorus saturation (IPSM-III) for soil samples collected in fall 2006, b) index of phosphorus saturation (IPSM-III) for soil samples collected in spring 2007 and c) PM-III lost (kg ha"1) between fall 2006 and spring 2007 78 Figure 11: Spatial distribution of a) phosphorus (PM-III) (mg kg"1) for soil samples collected in fall 2006 and b) phosphorus (PM-III) (mg kg"1) for soil samples collected in spring 2007 at the site 3 79 Figure 12: Spatial distribution at the site 3 of a) index of phosphorus saturation (IPSM-III) for soil samples collected in fall 2006, b) index of phosphorus saturation (IPSM-III) for soil samples collected in spring 2007 and c) PM-III lost (kg ha"1) between fall 2006 and spring 2007 80 Figure 13: Spatial distribution of phosphorus sorption maximum (am(Al+Fe)ox am=0.4) a) site 1, b) site 2 and c) site 3 81 Figure 14: Comparison between P exportations (kg P Mg"1 fresh matter) for vegetables crop in organic soils 110 Figure 15: Averaged yield (Mg ha"1) by fertility class vs. P addition (kg P ha"1) across vegetable crops in organic soils a) years 2002 to 2005 and b) year 2006 I l l
xvi

LISTE DES ABREVATIONS Al : aluminium
AIM-III : aluminium extrait selon la méthode Mehlich-IH
am : facteur de saturation maximale pour une sorption totale
ANOVA : analyse de la variance
ANCOVA : analyse de la covariance
Alox : aluminium extrait à l'oxalate acide d'ammonium
A0 : portée
Pm : facteur de saturation maximale pour une adsorption totale
B : bore
c : concentration en phosphate dans la solution
C : carbone
Ca : calcium
C+C0 : plateau
C0 : effet de pépite
Cu : cuivre
DSP : degré de saturation en phosphore
DTPA : diéthylène triamine penta acide
EOM : engrais organo-minéral
EDTA : acide ethylènediaminetétraacetique
Fe : fer
FeM-m •' fer extrait selon la méthode Mehlich-III
Fm : maximum de sorption totale
Feox '■ fer extrait à l'oxalate acide d'ammonium
g : gramme
y : coefficient de pondération pour le fer extrait selon la méthode Mehlich-III
y (h) : semivariance
GPS : global position system
h: distance (m)
ha : hectare
ISP : indice de saturation en phosphore
xvn
k : constante d'adsorption
K : potassium
kg : kilogramme
L : litre
LQE : loi sur la qualité de l'environnement
MDDEPQ : Ministère du Développement durable, de l'Environnement et des Parcs du
Québec
Mg : magnésium
M-III : méthode d'extraction des éléments du sol selon la méthode Mehlich III
Millimole : mmol
Mn : manganèse
M.O. : matière organique
MVAchamp : masse volumique apparente déterminée au champ
MVAiabo : masse volumique apparente déterminée en laboratoire
N : azote
NAC : nitrate d'ammonium calcique
OX : méthode d'extraction des éléments du sol à l'oxalate acide d'ammonium
P : phosphore
PD : phosphore dissous
PM-III : phosphore extrait selon la méthode de Mehlich-III
PMA : phosphate mono ammoniacal
Pox : phosphore extrait à l'oxalate acide d'ammonium
PP : phosphore particulaire
PRD : phosphore réactif dissous
PSC : capacité maximale de fixation du P
PT : phosphore total
Pw : phosphore soluble à l'eau
Q : degré de dépendance spatiale
Qm : adsorption maximum
REA : règlement sur les exploitations agricoles
S : soufre
xvni
SEP : spectrométrie d'émission au plasma
Sm : sorption maximale qui est due aux réactions lentes
SPS : saturation en phosphore du sol
Zn : zinc
xix
Chapitre 1: Introduction
1. Introduction
Les pressions exercées par le phosphore (P) sur les écosystèmes aquatiques constituent une
préoccupation environnementale majeure particulièrement dans les bassins versants qui
drainent les sols organiques sous productions maraîchères. En effet, les sols organiques
cultivés contribuent largement à l'eutrophisation des cours d'eau (Miller, 1979; Porter et
Sanchez, 1992) due à une fertilisation inadéquate (Simoneau, 1996). Comme ces sols ont
reçu de généreuses applications de fertilisants durant les années de culture, les réserves en P
ont augmenté malgré l'exportation par la culture et les pertes par les eaux de drainage
(Minotti et Stone, 1988). Les producteurs disposent de peu de moyens pour rationaliser
leurs intrants. Les principaux guides de fertilisation proposent des recommandations en P
qui dépassent largement les exportations par la culture et menant ainsi à des accumulations
de P dans les sols et des pertes de P vers les eaux de surface. Plusieurs essais de fertilisation
ont démontré aucune ou de faibles réponses des cultures maraîchères à l'ajout de P dans les
sols organiques (Hamilton et Bernier, 1975; Minotti et Stone, 1988). Il faut donc quantifier
les charges en P dans les sols organiques cultivés tout en prenant en considération les
impacts de la fertilisation phosphatée.
Le potentiel de pollution des cours d'eau est associé à la capacité du sol à retenir ou
relâcher le P. La teneur du sol en oxydes et hydroxydes de fer (Fe) et d'aluminium (Al)
ainsi qu'en substances humiques confèrent à ces sols des propriétés particulières de fixation
du P. En Hollande, la stratégie nationale pour réduire l'entrée du P dans les eaux de surface
et souterraine utilise un modèle de degré de saturation en P (DSP). Ce concept est basé sur
la capacité du sol à retenir le P relié aux formes de Fe et Al extraites à l'oxalate acide
d'ammonium (Feox et Alox)- Les méthodes d'analyses du P les plus usuelles dans les sols
organiques sont toutefois l'extraction à l'eau (Sanchez et Hanlon, 1990) et la méthode Bray
1 (Lucas, 1982). Ces méthodes d'extraction ne sont cependant pas courantes au Québec,
qui fait plutôt usage de la méthode Mehlich III (M-III) (Mehlich, 1984). Toutefois, le M-III
n'est pas très efficace pour extraire le Fe (Khiari et al., 2000; Sims et a l , 2002). Comme il
y a prédominance de Fe dans les sols organiques, le Fe extrait selon la méthode M-III (FeM-
m) requiert un facteur de pondération visant à corriger cette déficience inhérente à la
méthode M-III avant d'établir les seuils agroenvironnementaux pour les sols organiques.
Puisque le problème environnemental est l'eutrophisation, il est primordial de développer
des tests de P du sol permettant d'identifier et de contrôler le potentiel de pollution du P des
sols. Les analyses en P peuvent affecter considérablement les recommandations en P
puisque les processus chimiques, physiques et biologiques opérant dans les sols peuvent
varier à l'échelle spatiale et temporelle (Goovaerts, 1998). Cependant, il y a peu
d'information disponible sur la variabilité spatiale et temporelle des propriétés des sols
organiques. Il est donc impératif de comprendre les patrons de variation de saturation des
sols organiques en P pour proposer des coefficients de sécurité réalistes et élaborer des
recommandations de P tenant compte de la variation spatio-temporelle des analyses de sol.
Comme mesure d'atténuation de l'eutrophisation des eaux de surface environnant les
cultures maraîchères cultivées en sols organiques, nous proposons d'élaborer un modèle
agroenvironnemental de fertilisation phosphatée pour la carotte, le céleri, le chou-chinois,
la laitue, l'oignon et la pomme de terre cultivées en sols organiques selon une approche
agroenvironnementale.
Chapitre 2: Revue de littérature
2. Revue de littérature
2.1 Les sols organiques
Le territoire du Québec méridional est pourvu de 4 % en sol organique dont 40 000 hectares
cultivables en majorité dans le sud-ouest de la Montérégie (Lamontagne, 2004). C'est dans
les années 1920 que l'exploitation de ces terres, antérieurement délaissées par les
agriculteurs, a pris son essor au Québec. Par conséquent, ces terres sont cultivées de façon
intensive depuis près de 80 ans.
2.1.1 Formation des sols organiques
Le processus de paludification ou géogenèse est l'accumulation de matériel organique
formant les tourbières (Parent et al., 1991; Okruszko et Ilnicki, 2003). La géogenèse s'est
produite dans des écosystèmes où l'humidité et la température étaient propices à
l'accumulation de débris végétaux. En général, l'accumulation de matériel organique se fait
sous conditions anoxiques en milieu gorgé d'eau (Brady et Well, 2002). Les sols de l'Ordre
organique se définissent comme des sols constitués de plus de 30 % de matière organique
ou plus de 17 % de carbone organique sur une épaisseur minimale de matériel organique
(Système canadien de classification des sols, 1987). Le stade de décomposition est mesuré
selon l'échelle ordinale de von Post (Farnham et Finney, 1965; Parent, 2001).
Le processus post-paludique se présente durant la pédogenèse qui suit le drainage pour la
mise en culture d'une tourbière. Des altérations chimiques, physiques et biologiques
transforment la surface de la tourbière en terre noire ; c'est le processus de formation de la
terre noire (Okruszko et Ilnicki, 2003). La profondeur de la nappe souterraine est
précurseur des changements dans les propriétés de sols organiques (Zeitz et Velty, 2002).
L'augmentation de l'aération conséquente au drainage apporte des changements dans la
morphologie du sol principalement dans la couche de tourbe située au dessus de la nappe
phréatique (Parent et a l , 1991). Ceci produit une augmentation de la communauté
microbienne aérobie (Hortenstine et Forbes, 1972) responsable de l'oxydation, de la
minéralisation et de la décomposition du matériel organique. Le taux de minéralisation de
la tourbe dépend du degré de décomposition de la matière organique, de la température, des
rapports entre les éléments, du contenu en cendre, en eau et en air (Zeitz et Velty, 2002;
Ilnicki et Zeitz, 2003). Le processus de formation de la terre noire désagrège graduellement
la structure de la tourbe, la rendant ainsi granulaire (Okruszko, 1993 cité dans Okruszko et
Ilnicki, 2003). Selon la constitution botanique et le degré de décomposition, 50 à 70 % du
volume du substrat originel est perdu par affaissement de la tourbe (Zeitz et Velty, 2002;
Ilnicki et Zeitz, 2003). Pendant le processus de formation de la terre noire, la densité des
particules augmente par compaction et il y a augmentation du contenu en cendre (Ilnicki et
Zeitz, 2003).
2.2 Disponibilité du phosphore dans le sol
Le phosphore (P) interagit avec plusieurs constituants dans le sol comme la matière
organique, les argiles minéralogiques et les matériaux amorphes. Les oxydes et hydroxydes
de fer (Fe) et d'aluminium (Al) sont les composés les plus impliqués dans la disponibilité
des phosphates en sol acide (Bolan et al., 1985; van der Zee et Riemsdijk, 1986 ; 1988;
Breeuwsma et Silva, 1992). Quelques mécanismes ont été proposés pour expliquer la
rétention du P par ces composés. Ceux-ci incluent les réactions de sorption-désorption et les
réactions de précipitation-dissolution (Tisdale et al., 1985). Barrow (1980) a déterminé que
le P, qui interagit avec les composantes du sol, est présent dans le sol sous trois phases
distinctes : i) le P présent dans la solution du sol; ii) le P adsorbé par la phase solide du sol
et en quasi-équilibre avec la solution du sol (adsorption-désorption); iii) le P retenu plus
fortement par les particules de sol et non directement en équilibre avec la solution du sol
(précipitation-dissolution).
Plusieurs facteurs influent sur la disponibilité du P pour la plante. Selon Williams (1967),
cité dans Fox et Kamprath (1970), l'intensité est la concentration de P dans la solution du
sol; la quantité est la mesure de la quantité de P labile dans les sols soit la quantité de P
adsorbée qui est susceptible de retourner dans la solution du sol; la capacité est le pouvoir
du sol à maintenir l'intensité durant l'épuisement en P; la mobilité est la dissolution des
phosphates associés à la phase solide du sol, transport du P vers les racines et prélèvement
du P par la plante.

En sol organique, l'adsorption du P est reliée à la forme cationique des éléments associés à
la matière organique (Fox et Kamprath, 1971). Selon Miller (1979), la capacité des sols
organiques à adsorber le P dépend fortement de leur contenu en Fe et en Al. En effet, les
phosphates sont adsorbés à la surface des hydroxydes de Fe et d'Al ou sur les hydroxydes
de Fe et d'Al liés aux substances humiques (Gerke, 1992). De plus, un complexe
phosphate-métal-acide fulvique facilement utilisable par la plante peut se former avec les
phosphates apportés lors de la fertilisation (Chamayou et Legros, 1989). Lévesque (1970) a
utilisé la terminologie de fulvo-phosphate ferrique pour caractériser le complexe formé par
l'association d'un acide fulvique et d'un phosphate, l'ion ferrique assurant la liaison
(Lévesque et Schnitzer, 1967).
2.2.1 Formes de fer et d'aluminium dans le sol
Le Fe est un constituant majeur de la lithosphère et l'Ai est considéré comme l'un des
éléments les plus abondants dans les sols (Lindsay, 1979). Durant le processus d'altération
des minéraux primaires, le Fe et l'Ai générés par ces minéraux précipitent en minéraux
secondaires formant ainsi les oxydes, les hydroxydes et les oxyhydroxydes de Fe et d'Al
(Lindsay, 1979 ; Brady et Well, 2002). Les formes de Fe et d'Al présentent dans les sols
sont déterminées largement par le pH (Brady et Well, 2002). Le P forme des composés
difficilement solubles avec le Fe et l'Ai à faibles valeurs de pH; des composés plus solubles
avec le calcium (Ca) et le magnésium (Mg) à des valeurs de pH près de la neutralité; et des
composés difficilement solubles avec le Ca à de hautes valeurs de pH (Tisdale et a l , 1985).
L'adsorption du P par les oxydes de Fe et d'Al diminue donc avec l'augmentation du pH
(Tisdale et al., 1985).
La variscite (AIPO42H2O) et la strengite (FeP04-2H20), des phosphates d'Al et de Fe
formés à partir des Al-P et Fe-P sous formes amorphes (Juo et Ellis, 1968), sont les produits
ultimes du P inorganique formés lors de la genèse du sol et par le P apporté lors de la
fertilisation (Kittrick et Jackson, 1956; Chang et Jackson, 1958; Lindsay et al., 1959; Yuan
et al., 1960; Chang et Chu, 1961; Chakravarti et Talibudeen, 1962; Taylor et a l , 1963;
Hawkins et Kunze, 1965 cités dans Juo et Ellis, 1968). Ces phosphates de Fe et d'Al sont
sous forme cristalline et, conséquemment, le P est peu disponible pour la plante (Juo et
Ellis, 1968). Les colloïdes Al-P et Fe-P sont des formes facilement disponibles pour la
plante (Juo et Ellis, 1968) et possèdent une grande capacité de fixation en raison de leur
forme amorphe, de leur petite taille et de leur grande surface spécifique (Tisdale et a i ,
1985). Cependant, les formes cristallines peuvent également retenir une grande quantité de
P (Tisdale et a l , 1985).
La cristallisation est un processus très important pour la disponibilité des phosphates de Fe
et d'Al dans les sols acides (Juo et Ellis, 1968). Le passage des formes amorphes vers des
formes plus cristallisées est contrôlé par la quantité de matière organique (M.O.) dans le sol
qui retarde la cristallisation. En effet, les substances humiques peuvent influencer
l'adsorption des phosphates dans le sol en empêchant l'accès des phosphates aux sites de
fixation sur les oxydes de Fe et d'Al, ralentissant ainsi l'adsorption du P (Moshi et al., 1974
cités dans Gerke, 1993; Yuan, 1980; Lévesque, 1970). Enfin, les acides humiques peuvent
inhiber la cristallisation des oxydes de Fe et d'Al en les complexant (Gerke, 1993).
2.2.2 Mécanismes de sorption du phosphore
Selon Brady et Well (2002) et Gregorich et al. (2001), la sorption du P serait définie par la
perte d'ions ou de molécules de la solution du sol par adsorption ou absorption. Le P est
considéré comme étant adsorbé lorsqu'il est retenu à la surface d'un solide. De plus, si le P
retenu pénètre plus ou moins uniformément à l'intérieur de la phase solide, il est considéré
comme absorbé. Le terme sorption, qui est moins spécifique, est parfois préféré à cause de
la difficulté à différencier les deux termes précédents (adsorption ou absorption) (Tisdale et
al., 1985).
2.2.3 Mécanismes d'adsorption du phosphore
L'adsorption est définie comme étant l'attraction des ions ou des composés à la surface
d'un solide (Brady et Well, 2002). Selon Gregorich et al. (2001) l'adsorption est le
processus par lequel les atomes, les molécules ou les ions sont prélevés et retenus à la
surface des solides par des liens physiques ou chimiques (i.e. l'adsorption des cations par
les charges négatives des minéraux du sol) (Sample et al., 1980). Ce processus, qui réfère à
la fixation du P sous forme ionique par la phase solide du sol, peut être décrit par l'équation
de Langmuir (Breeuwsma et Silva, 1992; Breeuwsma et Reijerink, 1992).
2.3 Pollution de Peau par le phosphore
Les activités agricoles, industrielles et municipales déchargent de grandes quantités de P
total (PT) et de P dissous (PD) dans les cours d'eau. Le P est l'élément régulant la
croissance des plantes aquatiques responsables du dépérissement des plans d'eau par le
processus d'eutrophisation (Schindler, 1977). Ce phénomène est caractérisé par
l'augmentation de la fertilité de l'eau stimulant ainsi la prolifération des algues et des
plantes aquatiques (Hutchinson, 1973). Le guide québécois sur la qualité de l'eau (2002)
classe les lacs selon la concentration en P total (PT) par litre (L1) d'eau comme suit: ultra-
oligotrophe (< 4 pg PT L"1), oligotrophe (4-10 pg PT L"1), mésotrophe (10-20 pg PT L"1),
méso-eutrophe (20-35 pg PT L"1), eutrophe (35-100 pg PT L"1) et hyper-eutrophe (> 100 pg
PT L"1). Les autorités québécoises visent un seuil maximum de 30 pg PT L"1 comme
mesure de prévention de l'eutrophisation (Simoneau, 1996). Dans un rapport du ministère
du Développement durable, de l'Environnement et des Parcs du Québec, (MDDEPQ, 2005)
sur la capacité de support des activités agricoles par les rivières drainant les terres noires de
la Montérégie Ouest, la concentration en PT du bassin versant de la rivière l'Acadie (132
pg PT L"1) était 4 fois supérieure au critère actuel (30 pg PT L"1). À l'embouchure de la
rivière Châteauguay, la concentration médiane en P était de 82 pg PT L"1, et celle du
ruisseau Norton était 14 fois plus élevée que le seuil retenu avec une concentration
moyenne de 440 pg PT L"1 (Simoneau, 1996). Parce que la concentration en PD était de
neuf fois celle du P particulaire (PP), le ruissellement et le lessivage des fertilisants
phosphatés appliqués en grande quantité aux cultures de légumes étaient considérés comme
étant des facteurs majeurs contribuant à la pollution des eaux (Simoneau, 1996).
L'eau de drainage provenant des sols organiques contribue à l'accélération de
l'eutrophisation des lacs (Duxbury et Peverly, 1978; Breeuwsma et Reijerink, 1992). Les
pertes de P par lessivage provenant des sols organiques seraient en grande partie sous le
contrôle de la minéralisation, de la fertilisation et de la capacité du sol à retenir le P
(Cogger et Duxbury, 1984). Reddy (1983) estime pour sa part que la perte en P provenant
des sols organiques est attribuable à la solubilisation du P inorganique et à la minéralisation
du P organique.
Des pertes annuelles de 2 à 37 kg P ha"1 an"1 et de 0,6 à 31 kg P ha"1 an"1 ont été mesurées
dans les eaux de drainage des sols organiques de l'Ontario (Miller, 1979) et de New-York
(Duxbury et Peverly, 1978), respectivement. De plus, Reddy (1983) a évalué des pertes de
16 à 168 kg P ha"1 an"1 en raison de la décomposition des Histosols de la Floride. Pourtant,
l'eau de ruissellement des tourbières ombrotrophes cultivées est généralement faible en P
quand de faibles quantités de fertilisants sont appliquées (Eck, 1990).
2.3.1 Potentiel de dissolution du phosphore
Le transport du P biodisponible sous formes de PD et PP par ruissellement et lessivage à
partir des terres agricoles (Sharpley et ah, 1994) peut résulter en une eutrophication
accélérée des cours d'eau (Schindler, 1977). Le P biologiquement disponible est défini
comme la quantité de P inorganique qu'une population d'algue déficiente en P peut utiliser
durant une période de 24 h ou plus (Sonzongni et a l , 1982). Le P réactif dissous (PRD) est
défini comme le P qui passe à travers un filtre de 0,45 pm alors que le PP fixé sur la phase
solide ne passe pas à travers le filtre de 0,45 pm (Sharpley et al., 1993; Sonzogni et a l ,
1982). Le PRD représente également la portion du P dissous dans l'eau de ruissellement
directement disponible aux plantes aquatiques (Sharpley et al, 1993; 1996). La
concentration de PRD dans les eaux de ruissellement est hautement corrélée au P soluble à
l'eau (Pw) (Pote et a l , 1996, 1999) et à la saturation en P des sol (SPS) (Sharpley, 1995;
Pote et al., 1996). Donc, une estimation de la perte de P ainsi que la biodisponibilité du P
doivent être considérées simultanément dans l'élaboration d'un test environnemental pour
le P dans le sol.
Le Pw est un indicateur de P potentiellement dissous dans la solution du sol (Pote et al.,
1999). La méthode d'extraction à l'eau est parmi les plus appropriées pour évaluer le risque
environnemental. Des études québécoises ont montré que le rapport (P/A1)MIII extrait selon
la méthode de Mehlich III était hautement corrélé avec le Pw dans les sols minéraux (Khiari
et a l , 2000; Pellerin et al., 2006a).
10

2.4 Méthodes d'extraction
La distribution des différentes formes de Fe et d'Al présentent dans le profil de sol peut être
déterminée à partir de différents extractifs comme l'oxalate acide d'ammonium (OX) et le
M-III. La méthode d'extraction au pyrophosphate de sodium permet également de
déterminer les formes de Fe et d'Al liées à la matière organique (McKeague, 1967).
2.4.1 Oxalate acide d'ammonium
La solution à l'OX extrait les substances inorganiques non cristallines et pauvrement
cristallines de Fe et Al (Ross et Wang, 1993) et les formes de Fe et d'Al complexées à la
M.O. (McKeague, 1967). La solution à l'OX extrait donc aussi les formes de Fe et d'Al
extraites au pyrophosphate de sodium avec les autres oxyhydroxydes de Fe et d'Al (Parent
et Marchand, 2006).
2.4.2 Mehlich-III
La méthode M-III est une procédure rapide d'extraction de plusieurs éléments disponibles
comme le P, le Fe, l'Ai, le Ca, le Mg, le manganèse (Mn), le potassium (K), le zinc (Zn) et
le cuivre (Cu) (Mehlich, 1984). Elle permet de déterminer en une seule extraction la
concentration de plusieurs éléments. Cette méthode est utilisée comme test du sol de
routine dans plusieurs états américains et plusieurs provinces canadiennes dont le Québec.
De plus, la méthode M-III est utilisée pour l'évaluation de la saturation en P pour les sols
minéraux et organiques. Cependant, comparativement à la méthode à l'OX, l'extractif M-
III n'était pas très efficace pour extraire le Fe (Fernandez Marcos et a l , 1998).
Le fer et l'aluminium extrait selon la méthode de Mehlich-III
La méthode d'extraction au M-III permet d'estimer l'Ai sous forme non cristalline (Tran et
a l , 1990). Habituellement, les formes d'Al non cristallines sont déterminées à partir d'une
extraction à l'oOX (Ross et Wang, 1993). Toutefois, l'Ai extrait par la méthode de M-III
(A1M-IH) est bien corrélé à l'Ai extrait selon la méthode à l'oxalate (Alox) (Tran et a l , 1990;
Sims et a l , 2002). En sol minéral, l'extractif M-III extrait approximativement 84% de
l'Alox et seulement 19% du Fe extrait à l'OX (Fe0x) (Sims et a l , 2002). En sol minéral
québécois, le Fe extrait selon la méthode de M-III (FeM-m) représente seulement 12% de
11

(Al+Fe)M-m sur une base molaire (Khiari et a l , 2000). Pour les sols de la région du Mid-
Atlantique des États-Unis, le FeM-m représentait 7% de (Al+Fe)M-m sur une base molaire
(Sims et a l , 2002). Bien que le Fe joue un rôle important dans la fixation du P en sol non
calcaire, il n'est pas pris en compte dans le calcul des indices de saturation en P puisque sur
une base molaire, le rapport (P/Al+Fe)M-m étant hautement corrélé au rapport (P/A1)MHI
(Khiari et a l , 2000; Maguire et Sims, 2002).
Les différences entre les quantités de Fe et d'Al extraites par les méthodes sont influencées
par l'extractif et le type de sol (Kraske et a l , 1989). Fernandez Marcos et al. (1998) n'ont
pas trouvé de littérature scientifique utilisant le M-III pour l'estimation du Fe sous forme
non cristalline. Ils évaluaient également que le FeM-m était faiblement relié au Feox-
D'autres auteurs semblent plutôt parler de l'extraction du FeM-m sous forme disponible
(Kraske et a l , 1989). Dans les études de Kraske et al. (1989) comparant différents
extractifs pour la disponibilité des éléments incluant le M-III, les quantités de Fe extraites
par les différentes méthodes suivaient une tendance similaire aux quantités d'Al extraites
puisque le traitement acide offert par la solution M-III dissout le Fe et Al précipités. Ziadi
et Sen Tran (2007) s'entendent pour dire que le FeM-m est extrait par le NH» et l'acide
ethylènediaminetétraacetique (EDTA) présents dans la composition du M-III.
Le FeM-m est corrélé significativement aux formes de Fe les plus labiles mesurées par la
méthode d'extraction au diéthylène triamine penta acide (DTPA) (Fernandez Marcos et a l ,
1998). Les auteurs expliquaient cette corrélation par la capacité chélatante de EDTA
(présent dans la composition du M-III) et du DTPA constitutionnels de ces deux extractifs.
Ces agents chélatants se combinent avec les ions métalliques libres en solution pour former
des complexes solubles réduisant l'activité des ions métalliques libres en solution (Lindsay
et Norvell, 1978). Lindsay et Norvell (1978) ont suggéré l'utilisation du DTPA comme
extractif pour mesurer le Fe disponible. De plus, Borggaard (1979) ont démontré que
l'EDTA était capable d'extraire sélectivement certaines fractions de Fe (III) comme les
formes solubles à l'eau, échangeables et présumées complexées et le Fe (III) dans les
oxydes de Fe amorphes. Borggaard (1983) a proposé de différencier la fraction amorphe et
12

mal cristallisée avec une extraction à l'EDTA (Borggaard, 1979; 1981) et la fraction
cristallisée avec une extraction au dithionite-EDTA (Borggaard, 1982).
En sol organique, le FeM-m doit être comptabilisé dans le calcul des indices de saturation en
P (ISP) car ces sols contiennent généralement plus de Fe que d'Al (Efimov et a l , 1996).
Cependant, la solution extractive M-III ne semble pas aussi efficace que la méthode à l'OX
pour extraire le Fe (Fernandez Marcos et a l , 1998). Le FeM-m requiert donc un facteur de
pondération (Y) pour compenser l'inefficacité de l'extractif M-III en sol organique. Le Fe
peut s'accumuler en quantité substantielle sous forme de limonite ou de goethite (formes
cristallines de Fe) dans les sols organiques, particulièrement là où le sous-sol est sableux et
facilite le mouvement de l'eau (Naucke et a l , 1993). La goethite possède une forte capacité
à adsorber les phosphates (Efimov et a l , 1996). L'habileté des oxyhydroxydes de Fe à
adsorber des phosphates dépend de leur degré de cristallinité (Borggaard, 1983).
2.4.3 Pyrophosphate de sodium
La méthode d'extraction au pyrophosphate de sodium extrait la fraction du Fe et de l'Ai
liée à la matière organique (Loveland et Digby, 1984). Cette méthode dissout légèrement
les formes inorganiques non cristallines et n'extrait pas de façon significative les oxydes et
hydroxydes de Fe et d'Al cristallins (McKeague et a l , 1971).
2.4.4 Méthode d'analyses du phosphore
Les tests de P du sol servent à déterminer si le P disponible à la plante est présent en
quantité suffisante pour atteindre des rendements économiques acceptables (Corey, 1987).
En effet, pour qu'un test de sol soit efficace, il doit être relié à la réponse de la culture. Un
test environnemental pour le P du sol doit clairement identifier les niveaux excessifs de P et
les endroits où aucune application de P ne devrait être effectuée (Sims, 1993). Le test
agroenvironnemental doit relier les tests agronomiques et environnementaux en évaluant les
risques de pertes de P par ruissellement et lessivage (Sims et a l , 2002). Les études de
Khiari et al. (1999) et Pellerin et al. (2006) ont permis de montrer l'efficacité de la M-III et
de l'ISP à évaluer les risques environnementaux et agronomiques de la fertilisation en P des
cultures de la pomme de terre et du maïs-grain.
13
Les méthodes d'analyse de sol les plus communes en sols organiques sont la méthode
d'extraction à l'eau (Sanchez et Hanlon, 1990) et la méthode d'extraction Bray 1 (Lucas,
1982). Par contre, les laboratoires d'analyses au Québec utilisent plutôt la méthode M-III
(Mehlich, 1984). Rezaian et al. (1992) suggèrent d'utiliser M-III dans les Histosols de la
Floride. En sol minéral, il y a une relation linéaire entre le P extrait au M-III (PM-III) et: 1) le
Pw (^=0,68) et 2) le degré de saturation en P utilisant la méthode d'extraction à l'OX
(DSPox) (^=0,72) (Sims et a l , 2002). Le DSPox a été suggéré comme indicateur de perte
de P provenant des sols agricoles (Breeuwsma et a l , 1995 cité dans Maguire et Sims, 2002;
Hooda et a l , 2000).
2.4.5 Préparation de l'échantillon
Les analyses de laboratoire de routine pour les tests de sol utilisent un échantillon de sol sec
et tamisé à < 2 mm, puis prélevé à la cuillère d'un volume standard de 3 ml. En sols
minéraux, la masse volumique apparente en laboratoire (MVAiab0) ressemble à celle au
champ (MVAchamp) (Khiari et a l , 1999). Toutefois, pour les sols organiques, le séchage et
le tamisage des échantillons causent de grands changements dans la masse volumique
apparente du sol (Erviô, 1970). Ainsi, déterminer un rapport élémentaire permet de réduire
l'effet de la densité sur l'interprétation des tests en sols organiques (van Lierop, 1981).
2.5 Saturation des sols en phosphore
2.5.1 Degré de saturation en phosphore
Breeuwsma et Silva (1992) ont défini le DSP sur une base molaire (millimole par
kilogramme (mmol kg"1)) selon l'équation suivante :
DSP = - ^ - [1] PSC
14
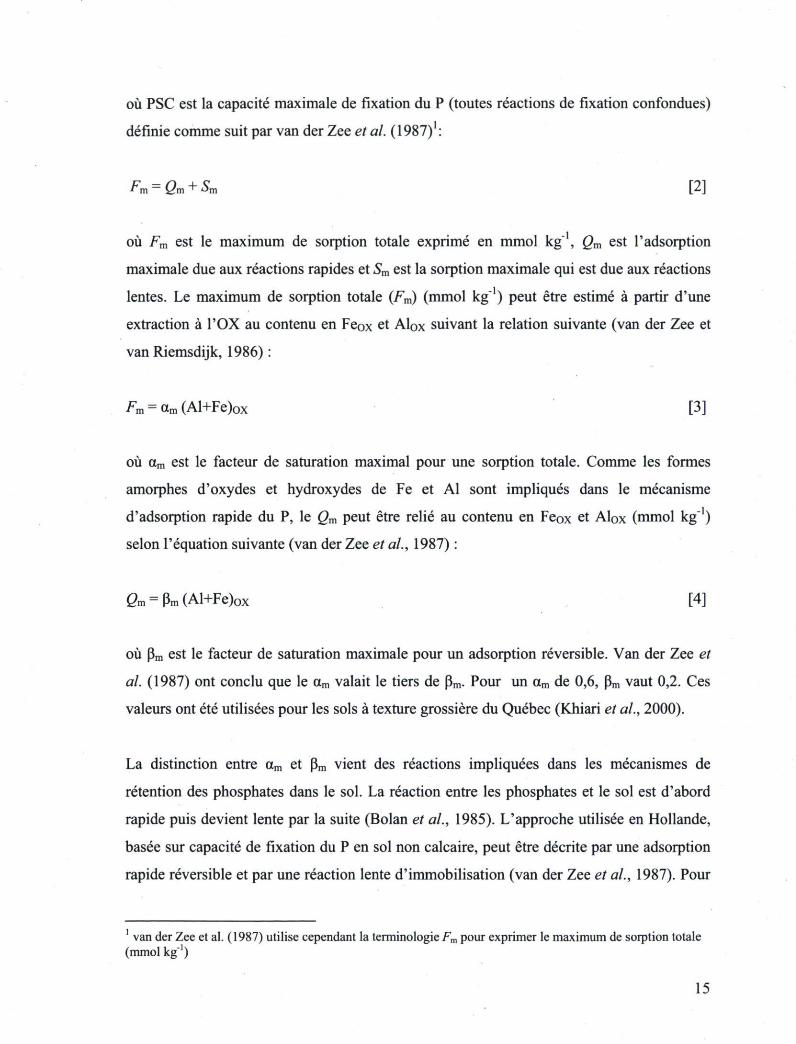
où PSC est la capacité maximale de fixation du P (toutes réactions de fixation confondues)
définie comme suit par van der Zee et al. (1987) :
Fm = Qm + Sm [2]
où Fm est le maximum de sorption totale exprimé en mmol kg"1, Qm est l'adsorption
maximale due aux réactions rapides et 5m est la sorption maximale qui est due aux réactions
lentes. Le maximum de sorption totale (Fm) (mmol kg"1) peut être estimé à partir d'une
extraction à l'OX au contenu en Feox et Alox suivant la relation suivante (van der Zee et
van Riemsdijk, 1986) :
Fm = am (Al+Fe)0x [3]
où am est le facteur de saturation maximal pour une sorption totale. Comme les formes
amorphes d'oxydes et hydroxydes de Fe et Al sont impliqués dans le mécanisme
d'adsorption rapide du P, le Qm peut être relié au contenu en Feox et Alox (mmol kg"1)
selon l'équation suivante (van der Zee et a l , 1987) :
Qm = pm (Al+Fe)ox [4]
où pm est le facteur de saturation maximale pour un adsorption réversible. Van der Zee et
a l (1987) ont conclu que le am valait le tiers de pm. Pour un am de 0,6, pm vaut 0,2. Ces
valeurs ont été utilisées pour les sols à texture grossière du Québec (Khiari et a l , 2000).
La distinction entre am et pm vient des réactions impliquées dans les mécanismes de
rétention des phosphates dans le sol. La réaction entre les phosphates et le sol est d'abord
rapide puis devient lente par la suite (Bolan et a l , 1985). L'approche utilisée en Hollande,
basée sur capacité de fixation du P en sol non calcaire, peut être décrite par une adsorption
rapide réversible et par une réaction lente d'immobilisation (van der Zee et a l , 1987). Pour
1 van der Zee et al. (1987) utilise cependant la terminologie Fm pour exprimer le maximum de sorption totale (mmol kg"')
15

maintenir une concentration d'équilibre de 0,10 mg d'ortho-P L"1, Breeuwsma et Silva
(1992) ont déterminé un DSPox de 0,25. Breuuwsma et al. (1986) ont trouvé un am de 0,4
pour des épipédons histiques. Pour les sols minéraux, des études québécoises ont démontré
qu'un DSPox de 0,25 correspondait à une valeur de Pw extrait selon la méthode de Sissingh
(1971) de 9,7 mg P L"1 (Khiari et a l , 2000). Cette valeur de Pw a été utilisée comme seuil
critique environnemental et corrélée avec l'indice de saturation en P utilisant la méthode
M-III (ISPM-III) pour quatre classes texturales de sol minéral selon leur contenu en argile
(Pellerin et a l , 2006a).
Phénomène d'adsorption réversible et phénomène de sorption à long terme
La rétention du P par les différents constituants du sol suit d'abord une réaction initiale
rapide puis une réaction plus lente. Les réactions impliquant les échanges d'anions et les
ligands entre les atomes métalliques et la surface des oxydes de Fe et d'Al sont
extrêmement rapides (Tisdale et a l , 1985). Les réactions plus lentes suivant la sorption sont
la pénétration du P à l'intérieur des constituants du sol formant ainsi des composés où le P
est moins disponible pour la plante (Tisdale et a l , 1985).
Phénomène d'adsorption réversible
Le phénomène d'adsorption réversible est l'adsorption rapide du P (van der Zee et van
Riemsdijk, 1986; Breeuwsma et Reijerink, 1993) qui peut être décrite par l'équation de
Langmuir (Breeuwsma et Silva, 1992; Breeuwsma et Reijerink, 1993) comme suit :
2=Mt [5] l + kc
où Q est la quantité de phosphates adsorbée réversible en mmol kg"1, Qm est l'adsorption
maximale en mmol kg"1, k est la constante d'adsorption en litre par millimole (1 mmol"1) et
c est la concentration des phosphates dans la solution du sol en mmol 1". Donc cette
équation tient compte à la fois de l'adsorption et de la désorption.
En sol acide, la concentration en phosphate dans la solution du sol est contrôlée par des
phénomènes d'adsorption et de désorption à la surface des minéraux de Fe et d'Al (Welp et
16
a l , 1983 cité dans Gerke, 1993). Le phénomène d'adsorption-désorption représente la
deuxième phase du P dans le sol selon Barrow (1980). L'adsorption est la fixation du P
sous forme ionique de la solution du sol vers la phase solide du sol. La sorption du P par les
oxyhydroxydes de Fe et d'Al est rapide (Ryden et a l , 1973) et le P peut se désorber en
libérant du P de la phase solide du sol vers la solution du sol. Ceci se produit lorsqu'il y a
perte de P de la solution du sol et que l'équilibre est perturbé. Les réactions par lesquelles le
P est adsorbé ou désorbé par la phase solide du sol sont considérées comme rapides
(Tisdale et a l , 1985).
Phénomène de sorption à long terme
Les phénomènes de sorption sont caractérisés par des réactions lentes et presque
irréversibles (Breeuwsma et Silva, 1992). C'est un processus de précipitation des
phosphates par des particules d'oxydes de Fe et d'Al (Breeuwsma et Reijerink, 1992). La
précipitation ou cristallisation est un processus qui à long terme mène à la formation de
minéraux secondaires insolubles comme les phosphates de Fe et d'Al (Juo et Ellis, 1968).
Van der Zee et Riemsdijk (1988) rapportaient que l'adsorption du P peut être associée à la
diffusion du P dans la phase solide. L'adsorption initiale induit un gradient de diffusion
vers l'intérieur de la particule par laquelle commence un processus de diffusion à travers la
phase solide (Barrow, 1983). Les minéraux ainsi formés représentent un stockage à long
terme dans les sols. Une fois que les sites sont saturés, la désorption potentielle augmente.
2.5.2 Indice de saturation en phosphore
Pour comptabiliser le rôle du Fe et de l'Ai dans la rétention et la perte de P, Sims et al.
(2002) recommandaient un rapport molaire de (P/[Al+Fe])M-m comme indice agro
environnemental pour la région du Mid-Atlantique aux États-Unis. Comme le FeM-m ne
représente que 7 à 12 % de (Al+Fe)M-m sur une base molaire en sol minéral (Khiari et a l ,
2000; Sims et a l , 2002), requiert un facteur de pondération (Y) pour compenser
l'inefficacité d'extraction en sols organiques car le Fe y est présent en grande quantité
(Efimov et a l , 1996). L'ISPM-III est défini comme suit :
17
ISPM m = ^ ^ [6] M-'" Al +vFe
A l M - m T r 1 e M - i n
où PM-III, AIM-III et FeM-m sont les formes de P, d'Al et de Fe extraites par la méthode de M-
III en mmol kg"1 et Y est un coefficient de pondération développé pour corriger la difficulté
de la méthode M-III à extraire le Fe. Sims et al. (2002) a utilisé Y = 1 pour prendre en
considération le Fe dans la fixation du P dans le sol.
2.6 Variabilité spatiale et temporelle
Les propriétés du sol varient à l'échelle spatiale et temporelle et sont influencées par des
facteurs intrinsèques (les facteurs de formation des sols et les matériaux parentaux) et
extrinsèques (les pratiques culturales, la fertilisation et la rotation des cultures) (Trangmar
et a l , 1985; Cambardella et a l , 1994). La compréhension de l'hétérogénéité et de la
variation dans les propriétés du sol est essentielle pour élaborer de bonnes pratiques
agricoles et pour estimer les effets de l'agriculture sur l'environnement (Cambardella et a l ,
1994).
L'analyse géostatistique fournit des moyens pour décrire le comportement conjoint des
variables aléatoires échantillonnées qui ont une plus grande continuité dans le temps et dans
l'espace à faible distance que les valeurs échantillonnées à distance élevée (Goovaerts,
1998). La géostatistique est utilisée pour estimer la variabilité spatiale et temporelle d'une
base de données grâce aux paramètres du semivariogramme (Si et a l , 2007). La
semivariance est utile pour évaluer le degré d'autocorrélation spatial parmi les propriétés du
sol, pour déterminer la portée de l'autocorrélation et pour cartographier les propriétés du sol
(Boerner et a l , 1998). Ainsi, le degré de dissimilarité peut être calculé entre les paires de
données comme une fonction de leur distance de séparation (Goovaerts, 1998). La
semivariance augmente avec la distance entre deux positionnements jusqu'à une valeur plus
ou moins constante à une distance de séparation donnée (Trangmar et a l , 1985).
Les modèles théoriques sont ajustés aux semivariogrammes empiriques pour trouver les
valeurs des paramètres à partir des modèles théoriques. Les modèles théoriques peuvent
18
être linéaires, linéaires plateaux, sphériques, exponentiels et de gaussiens (Webster, 1985).
La méthode non linéaire des moindres carrés pondérés est utilisée pour le choix du modèle
théorique correspondant au semivariogramme empirique (Cressie, 1991; Si et al. 2007).
Cette approche ajuste simultanément l'effet de pépite (C0), le plateau (C0+C) et la portée
(A0) pour minimiser la somme des carrés de l'erreur entre les données du semivariogramme
et le modèle choisi (Cressie, 1985). Les paramètres du semivariogramme sont (i) C0
correspond à la valeur maximale que prend le semivariogramme (Y(h)) entre la distance (h)
0 et la valeur h la plus petite, (ii) A0 est la distance à laquelle le semivariogramme atteint un
plateau et (iii) et C0+C est la valeur que prend le semivariogramme lorsque h devient grand
(Si et a l , 2007).
La valeur Q [C (C0+C)''] représente le degré de dépendance spatiale. Une valeur Q de 0
indique qu'il n'y a pas de structure spatiale (Lyons et a l , 1998) et une valeur de 1 montre
un système spatialement structuré (Boerner et a l , 1998). Alternativement, un rapport de
l'effet de pépite sur le plateau [C0 (Co+C)'1] < 25% indique une forte dépendance spatiale;
pour [C0 (Co+C)'1] entre 25% et 75%, il y a une dépendance spatiale moyenne ; un [C0
(Co+C)'1] > 75% indique une faible dépendance spatiale. La méthode d'interpolation
géostatistique par krigeage permet d'appréhender la structure spatiale des propriétés du sol
étudiées (Boerner et a l , 1998). À partir des observations voisines, le krigeage permet
d'estimer le patron spatial des propriétés du sol à un endroit non échantillonné et de
représenter ces valeurs sur une carte (Goovaerts, 1998).
2.7 Aspect agronomique
2.7.1 Étalonnage des sols
L'étalonnage des analyses de sols sert à distinguer le degré de déficience ou de suffisance
d'un élément nutritif et d'estimer la quantité d'engrais à appliquer en situation de
déficience (Evans, 1987). Pour ce faire, des essais de fertilisation doivent être conduits sur
des sols variant selon leur niveau de fertilité en y incluant des traitements couvrant une
large étendue de la carence à la suffisance, des traitements de référence et des traitements
situés au-dessus du point de rendement maximum. Les traitements de référence
19

comprennent un traitement témoin sans fertilisant et des traitements où tous les éléments
sont apportés à des niveaux adéquats mais non excessifs.
L'établissement du seuil critique de réponse se fait à l'aide de la relation entre le rendement
relatif et l'analyse de sol obtenue au laboratoire pour les différents sites expérimentaux
(Nelson et Anderson, 1984). On définit le rendement relatif comme le rapport entre le
rendement témoin qui n'a reçu aucune application d'engrais sur le rendement maximal
obtenu avec apport d'engrais. L'utilité de cette expression est de regrouper les essais de
fertilisation réalisés sur différents sites expérimentaux présentant des rendements différents
dans le but de standardiser les effets des sites et des saisons (Whitney et a l , 1985). La
méthode de Cate-Nelson (Nelson et Anderson, 1984) calcule le maximum des écarts de la
somme des carrés entre deux groupes et permet de définir 2 ou 3 classes de fertilité pour
initier le classement des sols. Dans une approche agroenvironnementale, les classes de
fertilité sont définies suivant les seuils critiques agronomiques comme point de référence
agronomique et les seuils critiques environnementaux pour inclure le risque
environnemental (Khiari et a l , 2000).
2.7.2 Doses économiques optimales
La dose économique optimale est obtenue à partir des modèles de réponse décrivant la
relation entre les rendements (Mg ha"1) et les doses de P (kg ha"1). Ceci permet de
déterminer la quantité d'engrais requise à chaque site afin d'atteindre un rendement
économique optimum. Les modèles théoriques peuvent être dérivés pour obtenir la dose
économique optimale. La dose d'engrais au rendement maximum est obtenue lorsque la
dérivée première de l'équation de la courbe est égale à 0. La dose optimum est obtenue
lorsque la dérivée première est égale au rapport de prix unitaire entre la récolte et l'engrais
(Nelson et a l , 1985). Le modèle est choisi selon le coefficient de détermination ( r ) mais
les différents modèles de réponse ne décrivent pas toujours de façon objective la réponse de
la culture aux ajouts d'engrais (Dahnke et Oison, 1990). Si aucun modèle ne convient, il
faut choisir la dose produisant un rendement économique à partir des observations.
20
2.7.3 Modèles de recommandation
Traditionnellement, les modèles de recommandation suivent différentes philosophies de
fertilisation incluant l'évaluation des réserves du profil de sol, le redressement rapide et
entretien, la suffisance nutritive, le redressement et la suffisance et les approches par
gestion spécifique (Dahnke et Oison, 1990; Black, 1993). Les concepts de fertilisation sont
aussi basés sur des principes environnementaux et agronomiques pour prévenir
l'accumulation de P dans les sols (Khiari et a l , 2000; Sims et a l , 2002). La fertilisation
phosphatée doit être inférieure aux exportations de P par la partie récoltée lorsque l'analyse
de sol dépasse le seuil environnemental (Khiari et a l , 2000; Pellerin et a l , 2006b).
La probabilité de réponse de la culture aux ajouts de P dans différentes classes de fertilité
est à la base du concept de suffisance nutritive (Fitts, 1955). Les recommandations de
fertilisants phosphatés sont établies à partir des classes de fertilité établies par des seuils
agroenvironnementaux. Les sols sont regroupés en trois classes de fertilité, soit sous le
niveau optimum (faible teneur en P), au niveau optimum (teneur en P moyenne) et au-delà
du niveau optimum (forte teneur en P). Sous le niveau optimum, la concentration en P dans
le sol est jugée déficiente et la probabilité de la réponse de la culture à l'ajout de P varie
d'élevée à modérée (Sims et a l , 2002). Au niveau optimum de P dans le sol, la
concentration en P est jugée adéquate et l'application de P est rarement recommandée
puisque la probabilité de réponse de la culture à l'addition de P est faible (Sims et a l ,
2002). Au-delà du niveau optimum, la concentration en P est jugée plus qu'adéquate et
aucune application de P ne devrait être faite puisqu'il y a une très faible probabilité de
réponse de la culture suite à l'application de P (Sims et a l , 2002). L'ajout de P n'est pas
motivé tant et aussi longtemps que la quantité de P disponible dans le sol convient aux
besoins de la cultures sans atteinte au rendement ou à la qualité (Whitney et a l , 1985).
21

Chapitre 3: Hypothèses et Objectifs
3. Hypothèses et objectifs
3.1 Hypothèses
Les cinq hypothèses suivantes ont été émises:
1. Le seuil environnemental pour les sols organiques est obtenu en faisant varier le
facteur y de I'ISPM-III en fonction de DSPox et de Pw-
2. La variabilité spatiale et saisonnière de I'ISPM-III en sols organiques cultivés est
faible à l'échelle du champ entre l'automne et le printemps suivant.
3. L'analyse du phosphore dans le sol et la biomasse est proportionnelle à la dose de
phosphore appliquée.
4. La réponse de la carotte, du céleri, du chou-chinois, de la laitue, de l'onion et de la
pomme de terre aux ajouts de phosphore dépend de la saturation en phosphore des
sols organiques évaluée selon la méthode Mehlich-III.
3.2 Objectif général
Collaborer à l'élaboration d'un modèle agroenvironnemental de fertilisation phosphatée
pour la carotte, le céleri, le chou-chinois, la laitue, l'oignon et la pomme de terre en sols
organiques au Québec.
3.2.1 Objectifs spécifiques
Quatre objectifs ont été établis:
1. Calibrer le rapport molaire [P/(Al+YFe)]M-m pour établir la valeur critique
environnementale après optimisation du facteur de pondération (Y) à l'aide du
DSPox et de Pw en sols organiques cultivés.
2. Établir les valeurs critiques agronomiques selon I'ISPM-III pour la carotte, le céleri,
le chou-chinois, la laitue, l'oignon et la pomme de terre cultivées en sols
organiques.
3. Quantifier le patron de variation spatial et saisonnier de l'indice de saturation en
phosphore utilisant la méthode Mehlich III (ISPMIII) des sols organiques cultivés.
23

4. Évaluer le besoin en P de la carotte, du céleri, du chou-chinois, de la laitue, de
l'oignon et de la pomme de terre selon I'ISPM-III.
24

Chapitre 4 PUBLICATION SCIENTIFIQUE NO 1 DE
LA THÈSE : Agri-environmental thresholds using
Mehlich III soil phosphorus saturation index for
vegetables in Histosols
4. Indice de saturation des sols en phosphore utilisant la méthode Mehlich III pour déterminer les seuils agroenvironnementaux des cultures maraîchères cultivées en sols organiques
4.1 Avant-propos
Le chapitre 4 comporte la partie sur le développement des indices environnementaux et
agronomiques de saturation des sols organiques selon la méthode Mehlich III (ISPM-III). fl
représente la première publication scientifique de la thèse et il a fait l'objet de parution dans
la revue Journal of Environmental Quality :
Guérin J., L. E. Parent, and R. Abdelhafid. 2007. Agri-environmental thresholds using
Mehlich III soil phosphorus saturation index for vegetables in Histosols. Journal of
Environmental Quality 36: 975-982.
Il a été soumis le 3 octobre 2006 et accepté pour publication le 21 février 2007. Il a paru en
ligne le 25 mai 2007.
26

4.2 Résumé
La concentration en phosphore dans les cours d'eau drainant les sols organiques dépasse
jusqu'à 14 fois le critère de 0,03 mg PT L"1 retenu par les autorités québécoises pour
prévenir l'eutrophisation. Le but de cette étude était de développer des indices
environnementaux et agronomiques de saturation des sols organiques selon la méthode de
Mehlich-III (ISPM-III)- L'approche a été testée sur 82 sols organiques prélevés à travers le
Québec et sur 66 sites d'essais de fertilisation. La méthode a été étalonnée par rapport au
degré de saturation en P extrait à l'oxalate acide d'ammonium (DSPox avec facteur am=0,4)
et à la méthode d'extraction à l'eau du P (Pw)- Les essais au champ sur la réponse de la
culture à l'ajout de P ont été réalisés sur 8 sites de carottes, 11 sites de pommes de terre, 10
sites d'oignons, 7 sites de chou-chinois, 10 sites de céleris et 20 sites de laitues.
L'extraction du phosphore au Mehlich-III était mieux reliée au DSPox (r2=0,73) que la
méthode Bray 1 (^=0,62) et la méthode de la Floride (1^=0,53). Le rapport molaire
[P/(Al-HyFe)]M-m (Y=5) était le mieux corrélé au DSPox (^=0,88). Un seuil critique de 0,05
de [P/(Al+5Fe)]M-m a été calculée pour DSPOX=0,25 et Pw=9,7 mg P L"1. Cette valeur fut
validée avec une étude indépendante menée en Caroline du Nord. La teneur en P des sols
organiques influençait significativement le rendement des cultures maraîchères. Les valeurs
agronomiques ISPM-III se situaient entre 0,10 et 0,15. Le critère environnemental (0.,05) et
les critères agronomiques (0,10 et 0,15) sont de nouveaux outils pour la gestion du P dans
les cultures maraîchères en sols organiques.
4.3 Abstract
The P concentration in the Norton Creek which drains cultivated Histosols in Quebec
showed median concentration exceeding up to 14 times the environmental guideline of 0.03
mg total P L". The aim of this study was to develop environmental and agronomic
thresholds using soil tests to provide a tool for P management in Histosols. Soil samples
were collected from Histosol across Quebec (82) and in fertilizer trials (66) to calibrate soil
test methods against the degree of P saturation (DPSox) using the acid-oxalate method and
setting am = 0.4, and the water-extractable P (Pw) (Sissingh, 1971). The field trials on crop
response to added P were conducted with carrots (8), potatoes (11), onions (10) Chinese
27
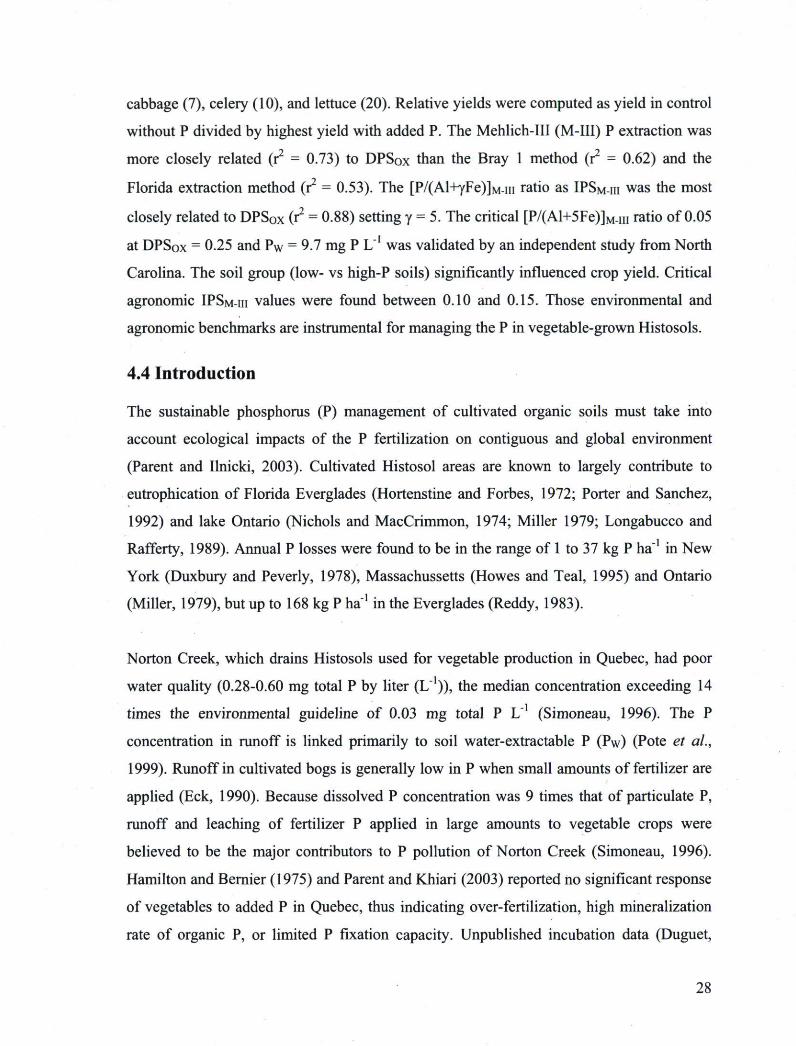
cabbage (7), celery (10), and lettuce (20). Relative yields were computed as yield in control
without P divided by highest yield with added P. The Mehlich-III (M-III) P extraction was
more closely related (r2 = 0.73) to DPSox than the Bray 1 method (r2 = 0.62) and the
Florida extraction method (r2 = 0.53). The [P/(AH7Fe)]M-m ratio as IPSM-III was the most
closely related to DPSox (r2 = 0.88) setting y = 5. The critical [P/(Al+5Fe)]M-m ratio of 0.05
at DPSox = 0.25 and Pw = 9.7 mg P L"1 was validated by an independent study from North
Carolina. The soil group (low- vs high-P soils) significantly influenced crop yield. Critical
agronomic IPSM-III values were found between 0.10 and 0.15. Those environmental and
agronomic benchmarks are instrumental for managing the P in vegetable-grown Histosols.
4.4 Introduction
The sustainable phosphorus (P) management of cultivated organic soils must take into
account ecological impacts of the P fertilization on contiguous and global environment
(Parent and Ilnicki, 2003). Cultivated Histosol areas are known to largely contribute to
eutrophication of Florida Everglades (Hortenstine and Forbes, 1972; Porter and Sanchez,
1992) and lake Ontario (Nichols and MacCrimmon, 1974; Miller 1979; Longabucco and
Rafferty, 1989). Annual P losses were found to be in the range of 1 to 37 kg P ha"1 in New
York (Duxbury and Peverly, 1978), Massachusetts (Howes and Teal, 1995) and Ontario
(Miller, 1979), but up to 168 kg P ha"1 in the Everglades (Reddy, 1983).
Norton Creek, which drains Histosols used for vegetable production in Quebec, had poor
water quality (0.28-0.60 mg total P by liter (L1)), the median concentration exceeding 14
times the environmental guideline of 0.03 mg total P L"1 (Simoneau, 1996). The P
concentration in runoff is linked primarily to soil water-extractable P (Pw) (Pote et a l ,
1999). Runoff in cultivated bogs is generally low in P when small amounts of fertilizer are
applied (Eck, 1990). Because dissolved P concentration was 9 times that of particulate P,
runoff and leaching of fertilizer P applied in large amounts to vegetable crops were
believed to be the major contributors to P pollution of Norton Creek (Simoneau, 1996).
Hamilton and Bernier (1975) and Parent and Khiari (2003) reported no significant response
of vegetables to added P in Quebec, thus indicating over-fertilization, high mineralization
rate of organic P, or limited P fixation capacity. Unpublished incubation data (Duguet,
28
2004) showed that net mineralization rate averaged only 0.063 mg kg"1 d"1 during 150 d of
incubation in Quebec Histosols.
Early work attributed P fixation in organic soils to aluminum (Al) and iron (Fe) compounds
(Droughty, 1930; Kaila, 1959; Larsen et a l , 1959; Wondrausch, 1969). The P losses from
cultivated organic soils were thus related to amounts of Al, and Fe compounds reacting
with P (Miller, 1979; Porter and Sanchez, 1992; Efimov et a l , 1996; Litaor et a l , 2003).
Oxy-hydroxides of Al and Fe contributing to P sorption in acid soils generally increase with
C content (Williams et a l , 1957). The Al-P forms were found to be more available to plants
than Fe-P forms (Anthony and Ellis, 1968). Lévesque and Schnitzer (1967) and Bloom
(1981) confirmed the formation of metal-P complexes with organic matter. In general,
fulvo-Fe phosphates represent a poor source of P for plant growth (Lévesque, 1970) unless
the organo-metallic complex is highly saturated with P (Lévesque, 1969; Efimov et a l ,
1996). The Fe may accumulate in substantial amounts as limonite and goethite in organic
soils, especially where the subsoil is sandy and facilitates water movement (Naucke et a l ,
1993). Okruszko et al. (1962) were the first to propose a soil test based on a molar ratio
between P and (Al+Fe).
4.5 Theory
Dutch researchers (van Der Zee et a l , 1987, Breeuwsma and Silva, 1992) defined the
degree of phosphate saturation as follows:
DPS o x = ^ [1] <*m(Alox+Feox)
where am is the maximum saturation factor for total sorption (unitless) and Pox, Alox, and
Feox are acid ammonium oxalate-extractable forms (mmol kg"1). Selected values for
ormwere 0.5 in Litaor et al. (2003) for Israel Histosols and 0.4 in Breeuwsma et al. (1986)
across Dutch soils comprising two histic epipedons. A critical level for DPSox (&m= 0.5)
was set at 0.25 corresponding to 0.10 mg ortho-P L"1 in the connecting groundwater of
mineral soils (Breeuwsma and Silva, 1992).
29
Dissolved reactive P (< 0.45 pm filtration) in wells averaged 0.190 mg P L"1 in Israel
Histosols showing DPS0x ( a„= 0.5) values of 0.065±0.05 (Litaor et a l , 2003). Litaor et al.
(2003) attributed those high levels to recent P fertilization history combined with solute
transport by preferential flow, although flushes of organo-metal-P complexes and
mineralized organic P may also be involved. Prismatic or lump structure favorable to
preferential flow has also been reported in temperate Histosols (Kuiper and Slager, 1963;
Zeitz and Velty, 2002). Because a period of 1 to 2 wk is necessary to achieve P sorption
equilibrium state in high-Fe Histosols (> 49 g Feox kg"1) (Efimov et a l , 1996), P fertilizer
should thus be applied in early spring and well before crack formation, and soil P should be
maintained below a critical environmental P saturation level throughout the year as
measures to prevent P loss.
The commonly used soil P tests for organic soils are the Bray 1 method in Michigan
(Lucas, 1982) and water extraction in Florida (Sanchez, 1990). However, the routine soil
test in Quebec and Mid-Atlantic USA is the multi-element Mehlich III (M-III) extraction
method (Mehlich, 1984) followed by multi-elemental determination using plasma emission
spectroscopy (PES). Quebec researchers (Khiari et a l , 2000; Pellerin et a l , 2006a) found
that a DPSox of 0.25 in mineral soils corresponded to a Sissingh (1971) Pw value of 9.7 mg
P L"1 of soil. Because the Mehlich III method (Mehlich, 1984) was found to be sensitive to
soil texture (Giroux and Tran, 1985; Simard et a l , 1991; Zheng et a l , 2001) but not
Sissingh (1971) Pw (Houba, 1986), Pellerin et a l (2006a) used that critical Pw value of 9.7
mg PL"1 to define critical index of P saturation using the M-III method (IPSM-III) for four
textural groups varying in clay content.
In order to account for the important role of amorphous Al and Fe in the retention and
release of soil P, Sims et al. (2002) recommended the (P/[Al+Fe])M-m molar ratio (Mehlich,
1984) as an agri-environmental index for Mid-Atlantic USA. However, the M-III
extractable Fe (FeM-m) was found to represent only 7 to 12% of (Al+Fe) on a molar basis in
mineral soils (Khiari et a l , 2000; Sims et a l , 2002). In mineral soils containing 4 to 5%
organic matter, the M-III method extracted 15-22% of Alox compared to 2% of Feox
(Khiari and Parent, 2005). Hence, the FeM-m may require a weighing factor (y) to account
30
for extraction efficiency, especially in Histosols where Fe may be present in large quantities
(Efimov et a l , 1996).
The IPSM-III is defined as follows:
IPS M m = ^ ^ [2] Al +yFe ^ ' M - I I I X I 1 cM-III
where PM-III, A1M-III, and FeM-m are M-III-extractable forms (mmol kg"1) and y is a
weighing coefficient for Fe. Khiari et al. (2000) and Pellerin et al. (2006a) used y = 0 or 1
since the PM-III/A1M-HI mass ratio and the (PM-III)/(A1M-IH+ FeM-m) molar ratio were closely
related to each other. Sims et al. (2002) suggested to use y = 1 to account for the role of Fe
in P fixation in soils. However, y has not been determined in high-Fe and high-C soils like
organic soils.
A ratio expression reducing the effect of scooped soil density on soil test (Khiari et a l ,
1999) could be of significance in organic soils where bulk density is highly sensitive to soil
preparation methods (Erviô, 1969; Van Lierop, 1981). Also, the tenfold increase in P
extraction with the M-III compared to water extraction requires less sensitive analytical
determination (Sanchez and Hanlon, 1990). As emphasized by Sanchez and Burdine
(1988), there is a need to develop a soil test P related to Pw and reactive forms of Al and Fe
to account for the high variability in soil P buffering capacities and make P fertilizer
recommendations in Histosols.
The aims of the present study were (1) to calibrate an environmental (P/[Al+YFe])M-m molar
ratio threshold after optimizing y against Pw and DPSox in Histosols, and (2) to determine
agronomic (P/[Al-HyFe])M-m thresholds for common vegetable crops grown on Histosols.
4.6 Materials and method
4.6.1 Experimental setup for fertilizer trials
During the 2002 to 2005 period, we conducted fertilizer P trials on eight carrot (Daucus
carota L.), ten celery (Apium graveolens L.), eleven potato (Solanum tuberosum L.), ten
31

onion (Allium cepa L.), twenty lettuce (Latuca sativa L.), and seven Chinese cabbage
(Brassica rapa var. pekinensis) commercial sites in organic soils of southwestern Quebec,
Canada. Average length of the growing period was 100 d for carrots, 88 d for celery, 66 d
for Chinese cabbage (Pak choi), 45 d for Romaine and leaf lettuce, 60 d for crisphead
lettuce, 110 d for onions, and 120 d for potato.
There were three replications and four to five P rates per site arranged in a randomized
complete block design (Table 1). Sources of P were monoammonium phosphate (MAP)
(11-52-0) or a mixture of dehydrated swine solids and monoammonium phosphate (3.2-
15.5-0.8). It was assumed that manure nitrogen (N) was 60% equivalent and manure
potassium (K) 100% equivalent compared to MAP similarly to solid manure (CRAAQ,
2003), but that manure P was equivalent to MAP. N, K, and micro-nutrients were applied
as recommended locally (CRAAQ, 2003). Fertilizers were broadcast before sowing or
planting. Plots were four to six rows in width and 5 to 8 m long. Row spacing was 47 cm
for carrots, lettuce and onions, 55 for Chinese cabbage, 65 cm for celery, and 91 cm for
potato. Other practices were those commonly used in the region. Yields were measured in
two central rows or in center of the bed over a length of 3 to 6 m (3-7 m2 depending on the
crop). Harvest date depended on the number of days to meet market requirement, the
number of harvests during summer, and crop size category. The harvested portions of the
plant in each plot were classified according to commercial standards and reported as
commercial yield.
4.6.2 Soil analysis
Soil surface materials covering a large spectrum of properties (22 peat samples collected by
Vaillancourt et al. [1999] between the 45th and the 49th parallel in Quebec and 60 cultivated
sapric materials collected by Duguet et al. [2006] between the 45th and the 46th parallel
close to the fertilizer trials) were analyzed in duplicate. A second dataset comprised the
soils collected at the fertilizer trial sites where five cores were composited in the root zone
(0-30 cm) of each of three blocks before fertilization. Soils were air-dried to constant
weight, and sieved to < 2 mm. Soil pH was determined in 0.01 M CaCb using a
32
soil/solution volumetric ratio of 1:4. Organic C and N were quantified using the CNS-
Leco2000 instrument. Loss on ignition (LOI) was quantified by burning the organic
material for 16 h at 550°C. Total P was determined by colorimetry (Laverty, 1963) after
dissolving the ashes from LOI with 0.1 N HC1. The Perayi was determined according to
Bray and Kurtz (1945) and quantified by PES. A volume of 3 mL of organic soil material
was scooped and extracted for soil P using 37.5 mL of distilled water to obtain the same
soil/solution ratio as in the official Florida soil test P (Sanchez, 1990) (Pnonda)- Soil P, Fe
and Al were extracted using the M-III method (Mehlich, 1984). Pox, Feox, and Alox were
extracted according to Ross and Wang (1993). Pyrophosphate Fe (Fepyr) and Al (Alpyr) were
extracted according to McKeague (1967). The OX method extracts non-crystalline and
poorly crystalline Al and Fe (Fe[II] and Fe[IH]) forms (Ross and Wang, 1993) that include
organically bound (pyrophosphate-extractable) and oxy-hydroxide (oxalate-minus-
pyrophosphate extractable) forms of Al and Fe. The Florida, M-III, pyrophosphate, and
oxalate extracts were quantified by PES.
The Pw was extracted in a 60:1 HzO/soil ratio according to Sissingh (1971) using NaCl
across samples to clarify the suspension that was passed through a < 0.45-pm filter. In
contrast with mineral soils, where field bulk density (FBD) is generally similar to the
reconstituted bulk density (RBD) as scooped weight (Khiari et a l , 1999), the FBD may be
only 0.45 times the RBD after drying and sieving the peat (Erviô, 1969). The Pw value in
air-dried and sieved materials must be corrected accordingly in order to be representative of
field conditions. We found that for cultivated organic soils FBD was 0.753 times RBD after
drying and sieving. For pristine peat materials of known von Post degree of humification
(VPDH) (Vaillancourt et a l , 1999), peat FBD depends on VPDH as follows (Silc and
Stanek, 1977):
FBD(g mL l) = 0.0182VPDH + 0.0529, r2 = 0.88 [3]
The Pw values obtained from scooped soils was thus corrected for RBD as follows:
P = P ™ [4] r W - F B D l W-RBD n n r \ L J
we used PW-FBD in this study.
33
4.6.3 Statistical analysis
The relationships between soil tests were determined by regression. The y value in Eq. [2]
was iterated until the r2 value was maximized for the relationships between IPSM-III and
either Pw or DPSox- The relative yield was computed by dividing absolute yield in the
control treatment by the highest yield among treatments with added P. The soil calibration
study was conducted using the P response patterns of six crops. Type IV error may occur
when interactions are examined (crop response by soil test combinations) although
hypotheses require means to be analyzed or, conversely, cell means are examined when the
hypotheses require that interactions be analyzed (Umesh et al., 1996). Soil fertility
classification requires a minimum of two classes of crop response patterns defined
graphically or by ANOVA (Nelson and Anderson, 1984). As a protection against type IV
error, the six crops were compared in two groups of soil tests as delineated by a critical
value of IPSM-III above which most crops no longer responded to added P as shown by
relative yield close to 100%. The separation between the two soil test groups was varied by
0.1 IPSM-III units below and above the initial value, and F values were computed iteratively
from ANOVA (SPSS vs. 13.1) for each IPSM-III separator to test the effects of the six crops
and the two Soil groups and their interaction (factorial design with unequal replications). If
the interaction was not significant, type IV error was considered negligible and relative
yields were averaged across crops as one random variable. A constraint on the initial IPSM-
III separator was that all crops should be represented at least one time (one replication) in
each soil group. Below 0.08 and above 0.17, there was no specimen of the onion crop,
hence limiting the validity of IPSM-III separator to five crops outside that range.
4.7 Results and discussion
4.7.1 Soil characteristics
In general, both soil datasets covered similar spectrum of properties (Table 2). In the soil
survey dataset, loss on ignition ranged between 292 and 991 g kg"1, total carbon represented
0.57 of the loss on ignition, DPSox (0.438±0.243) ranged between 0.033 and 1.035, and
IPSM-III (0.115±0.085) ranged between 0.003 and 0.419. The IPSM-m varied between 0.030
and 0.2°8 in the fertilizer trial dataset, so within the range of the soil survey dataset 0.003
34
to 0.419 (Table 2). Hence, the fertilizer trial dataset was representative of the soil survey
dataset.
The Fe content averaged 3.6 to 4.1 g Feox kg"1 and Al content averaged 1.4 to 1.7 g Alox
kg"1 across datasets (Table 2). In comparison with highest values of 9.8 g Feox kg"' and 8.6
g Alox kg"1 in Table 2, German bog (oligotrophic) peats contained 2.4 g total Fe kg"1 (0.3-
4.7) and 1.5 g total Al kg"1 (0.2-3.6) and German fen (eutrophic) peats contained 17 g total
Fe kg"1 (1-26) and 10 g total Al kg"1 (3-17) (Naucke et a l , 1993). Efimov et al. (1996)
reported values of 21 to 189 g Feox kg"1 in ferruginous bogs of Karelia (Russia) where the
organic compounds were saturated with Fe, allowing the formation of mineral Fe
compounds with high P sorption capacity. In Polish Histosols containing 1 to 81 g Feox kg"
, almost half of the Fe forms contributing to P fixation were organically bound
(Wondrausch, 1969). In our study, Alpyr was close to Alox, showing that Al was almost
entirely associated (96%) with organic matter (Table 2). The Fepyr accounted for 53% of
Feox (Table 2), indicating the presence of other amorphous Fe forms than the ones related
to organic matter.
4.7.2 Soil Phosphorus Test
The relationship between PM-III and Perayi was found to be as follows in Quebec organic
soils:
PM_w(mg L-l) = l.56PBrayi(mg L ' ) , r 2 = 0.88 [5]
In other studies, soils high in amorphous Fe and Al and organic C had slopes between 1.5
and 2.2 (Ping and Michaelson, 1986; Michaelson et a l , 1987; Davenport et a l , 1997). The
slope of 1.56 in Eq. [5] differed markedly from slopes close to one reported for mineral
soils of southern and Mid-Atlantic USA (Mehlich, 1984), Ultisols, Alfisols and Mollisols
(Hanlon and Johnson, 1984; Wolf and Baker, 1985), Cryochrepts (Michaelson et a l , 1987),
Spodosols and Inceptisols (Tran et a l , 1990; Parent and Marchand, 2006). Indeed, strongly
acidic extradants such as M-III were found to extract larger quantities of P compared to the
Bray 1 extractant and to be more closely related to agronomic yield in acid volcanic ash
soils containing 7.8 to 10.9 g FeQx kg"1, 9.2 to 14.3 g Alox kg"1, and 60 to 80 g C kg"1 (Ping
35
and Michaelson, 1986; Michaelson et a l , 1987). The P appeared to be more easily
extracted by the M-III compared to the Bray 1 extractant in Histosol materials high in C,
Feox, and Alox (Table 2) where Alpyr and Fepyr forms may react with P.
4.7.3 Model Development
The y coefficient was varied between 0 and 10 in order to maximize the relationship
between IPSM-III, on the one hand, and DPSox or Pw, on the other (Fig. 1). The r2 values
tended to stabilize when y increased above 3. We selected y = 5 where r2 reached its
maximum value. The r2 value was lower for the IPSM-III-PW relationship compared to IPSM-
m-DPSox because the variation in bulk density was more difficult to control in the Pw
expression compared to the DPSox ratio.
Setting DPSox - 0.25 (Fig. 2), a critical environmental IPSM-III value of 0.05 was found for
DPSox using am values of 0.4 (Breeuwsma et al., 1986). This critical IPSM-III value was
validated as follows:
(1) The relationship between IPSM-III (y = 5) and Pw shows that for Pw = 9.7 mg P L"1,
IPSM-III = 0.05 (Fig. 3).
(2) A North Carolina Wasda muck containing 1705 mg A1M-III kg"1 and 197 FeM-m kg"1
showed a change point at 115 PM-III kg"1 (Bond et a l , 2006). The environmental critical
IPSM-III ratio was found to be 0.05 as follows:
(3) IPSM m = ^ ^ = 0.05 [6] M m 2705/27 + 5(197/56)
We thus selected 0.05 as critical environmental IPSM-III value for Quebec Histosols. The
IPSM-III was more closely related to DPSox (r2 = 0.88) compared to PM-III (r2 = 0.74), Perayi
(r2 = 0.63), and PFionda (r2 = 0.53). Hence, compared to the Bray 1 and Florida extraction
methods, the M-III method appeared to be more appropriate for the environmental
assessment of inorganic P status. Among the 66 experimental sites, only 5 sites had IPSM-III
values below the environmental threshold of 0.05.
36
4.7.4 Soil Test Calibration
Carrots, potato, onion, and Chinese cabbage showed similar response patterns to added P
(Group A: Fig. 4), while celery and lettuce seemingly formed another group (Group B: Fig.
5). The initial IPSM-III agronomic threshold above which relative yield stabilized near 100%
was approximately 0.16 in Group A (Fig. 4). There was no clear pattern in Group B (Fig.
5). Hence, the initial IPSM-III value was fixed at 0.16 to partition soil test values and was
varied thereafter within the IPSM-III range of 0.08 to 0.19. There was no significant
correlation at P < 0.05 between soil test and relative yield for each crop and soil group
combinations (data not shown) indicating random effect of soil test within IPSM-III group.
The ANOVA results showed no significant effect of the crop species (P > 0.9) or the crop
by soil group interaction (P > 0.3). Hence, crop responses could be combined without
making any significant type IV error. Only the soil group across crops-had a significant
effect that varied with the IPSM-III separator (Fig. 6). The contrast between low-P and high-
P soils was highest (P < 0.05) with IPSM-III separators of 0.10, 0.13, and 0.15 (Fig. 6).
Weighed relative yields accounting for the number of replications per crop averaged 98, 98
and 99% in the high-P soil group using the 0.10, 0.13 and 0.15 IPSM-III separators,
respectively. In high-P soils, it is generally required that relative yield average be above
98% (Bray, 1945) or even 99% (Melsted and Peck, 1977). The weighed yield average was
92 to 94% at low-P sites across separators, hence below the critical value of 95% for
relative yields separating highly responsive from less responsive crops using non linear
models (Black, 1993). Hence, the 0.10, 0.13 and 0.15 IPSM-III values appeared valuable
separators between low- and high-P organic soils.
Obviously, the environmental threshold was lower than the agronomic threshold in
Histosoils. In contrast, the environmental threshold was higher than the agronomic
threshold for potato (Solanum tuberosum L.) (Khiari et a l , 2000), cranberry (Vaccinium
macrocarpon Ait.) (Parent and Marchand, 2006) and corn (Zea Mays L.) in mineral soils
(Pellerin et a l , 2006b). As a result, the vegetable production on Histosols poses a greater
environmental risk than crop productions on mineral soils. The poor water quality of
Norton Creek confirms this (Simoneau, 1996). Above IPSM-III of 0.05, the P balance (added
37
P minus P removal by the harvested portion of the crop) should thus be negative to
minimize the risk of P contamination of surface and groundwater. Using 0.05 and either
0.10, 0.13 or 0.15 as IPSM-III separators for establishing agri-environmental soil fertility
classes, phosphorus fertilization concepts must be developed to minimize externalities of
the P fertilization of vegetable crops grown on Histosols.
4.8 Conclusion
The Mehlich-III method, recognized to be more appropriate than the Bray 1 method for
soils high in C and oxy-hydroxides of Al and Fe, was evaluated in Histosoils. A general
expression of the DPS for organic soils using the M-III method (IPSM-III) was proposed as
[P/(Al-i7Fe)]M-m, where y was set at 5 to account for the role of Fe forms in P retention
organic soils. The IPSM-III (y = 5) was closely related to the Pw and DPSox (am = 0.4). The
critical thresholds of 0.25 as DPSox and 9.7 mg Pw L"1 suggested in the literature
corresponded to the IPSM-III value of 0.05. Above the IPSM-III of 0.05, the P balance (added
P minus P removal by the harvested portion of the crop) should be negative to minimize the
risk of P contamination of surface and groundwater. The environmental threshold was
found to be lower than agronomic thresholds (0.10, 0.13 and 0.15) across vegetables, hence
confirming the higher environmental risk of adding P to Histosols compared to mineral
soils. The 0.05 as well as 0.10, 0.13 or 0.15 IPSM-III separators will be useful benchmarks
for implementing beneficial P management practices minimizing the externalities of P
fertilization of vegetable crops grown on Histosols.
4.9 Acknowledgements
We thank the Conseil de Recherche en Pêche et Agroalimentaire du Québec and the
Natural Sciences and Engineering Research Council of Canada for financial support.
Thanks are extended to the Ministère de l'Agriculture, des Pêcheries et de l'Alimentation
du Québec (St-Rémi, QC), Phytodata Inc. (Sherrington, QC), Technique Gazon Inc.
(LaSalle, QC), and the participating vegetable growers.
38
4.10 References
Anthony, S.R.J., and B.G. Ellis. 1968. Chemical and physical properties of iron and
aluminum phosphates and their relation to phosphate availability. Soil Sci. Soc. Am.
Proc. 32:216-221.
Black, C. A. 1993. Soil fertility evaluation and control. Lewis Publication, Boca Raton, FL.
746 pp.
Bloom, P.R. 1981. Phosphorus adsorption by an aluminium-peat complex. Soil Sci. Soc.
Am. J. 45:267-272.
Bond, C.R., R.O. Maguire, and J.L. Havlin. 2006. Change in soluble phosphorus in soils
following fertilization is dependent on initial Mehlich-3 phosphorus. J. Environ.
Qual. 35:1818-1824.
Bray, R.H., and L.T. Kurtz. 1945. Determination of total, organic, and available forms of
phosphorus in soils. Soil Sci. 59:39-45.
Bray, R.H. 1945. Soil-plant relations: II. Balanced fertilizer use through soil tests for
potassium and phosphorus. Soil Sci. 60:463-473.
Breeuwsma, A., and S. Silva. 1992. Phosphorus fertilization and environmental effects in
the Netherlands and the Po region (Italy). Winand Staring Centre for Integrated
Land, Soil, and Water Research, Agric. Res. Dep. Rep. 57, Wageningen, The
Netherlands. 39 pp.
Breeuwsma, A., J.H. Wôsten, J.J. Vleeshouwer, A.M. van Slobbe, and J. Bouma. 1986.
Derivation of land qualities to assess environmental problems from soil surveys.
Soil Sci. Soc. Am. J. 50: 186-190.
CRRAQ. 2003. Reference guide for crop fertilization. 1st Ed., Centre de Référence en
Agriculture et Agroalimentaire du Québec, Québec, Canada, 297 pp.
Davenport, J., M.T. Pitts, W. Provance, and C. DeMoranville. 1997. Influence of soil iron
and aerobic status on phosphorus availability in cranberry soils. Acta Hortic. 446:
369-379.
Droughty, J.L. 1930. The fixation of phosphate by a peat soil. Soil Sci. 2:23-35.
Duguet, F., L.E. Parent, and A. Ndayegamiye. 2006. Compositional indices of net
nitrification in organic soils. Soil Sci. 171:886-901.
39
Duguet, F. 2004. Mineralization of N and P in cultivated organic soils of southwestern
Quebec. M.Sc. Memo., Université Laval, Québec (Canada), 92 pp. [In French]
Duxbury, J.M., and J.H. Peverly.,1978. Nitrogen and phosphorus losses from organic soils.
J. Environ. Qual. 7:566-570.
Eck, P. 1990. The American Cranberry. Rutgers University Press, New Brunswick, NJ, 420
pp.
Efimov, V.N., L.I. Kornilova, and M.E. Ryabtseva. 1996. Absorption capacity and kinetics
of sorption of phosphate ions in ferruginous peat soils of lowmoor bogs. Eurasian
Soil Sci. 29:928-933.
Erviô, R. 1969. The importance of soil bulk density in soil testing. Ann. Agric. Fenniae
9:278-286.
Giroux, M., and T.S. Tran. 1985. Evaluation of different P extracting methods in relation to
oat yield and soil properties. Can. J. Soil Sci. 65: 47-60.
Hamilton, H.A., and R. Bernier. 1975. N-P-K fertilizer effects on yield, composition and
residues of lettuce, celery, carrot and onion grown on an organic soil in Quebec.
Can. J. Plant Sci. 55:453-461.
Hanlon, E.A., and G.V. Johnson. 1984. Bray/Kurtz, Mehlich III, AB/D and ammonium
acetate extractions of P. K, and Mg in four Oklahoma soils. Commun. Soil Sci.
Plant Anal. 15:277-294.
Hortenstine, C C , and R.B. Forbes. 1972. Concentrations of nitrogen, phosphorus,
potassium, and total soluble salts in soil solution samples from fertilized and
unfertilized organic soils. J. Environ. Qual. 1:446-449.
Houba, V.J.G. 1986. Comparison of soil extractions by 0.01 M CaCb, by EUF and by some
conventional extraction procedures. Plant Soil 96: 433-437.
Howes, B.L., and J.M. Teal. 1995. Nutrient balance of a Massachusetts cranberry bog and
relationships to coastal eutrophication. Environ. Sci. Technol. 29: 960-974.
Kaila, A. 1959. Retention of phosphate by peat samples. J. Sci. Agric. Soc. Finland 31:215-
225.
Khiari, L., and L.E. Parent. 2005. Phosphorus transformations in acid light-textured soils
treated with dry swine manure. Can. J. Soil Sci. 85:75-87.
40
Khiari, L., L.E. Parent, A. Pellerin, A.R.A. Alimi, C. Tremblay, R.R. Simard, and J. Fortin.
2000. An agri-environmental phosphorus saturation index for acid coarse-textured
soils. J. Environ. Qual. 29:1561-1567 [errata: 29: 2052].
Khiari, L., A. Pellerin, J. Fortin, and L.E. Parent. 1999. A soil phosphorus satutration index
decreasing scooped weight effect in Mehlich-3 procedure. Commun. Soil Sci. Plant
Anal. 30:2157-2168.
Kuiper, F., and S. Slager. 1963. The occurrence of distinct prismatic and platy structures
inorganic soil profiles. Neth. J. Agric. Sci. 11:418-421.
Larsen, J.E., GF. Warren, and R. Langston. 1959. Effect of iron, aluminium and humic
acid on phosphorus fixation by organic soils. Soil Sci. Soc. Am. Proc. 23:438-440.
Laverty, J. C. 1963. A modified procedure for the determination of phosphorus in soil
extracts. Soil Sci. Soc. Am. Proc. 27: 360-361.
Lévesque, M. 1970. Contribution of fulvic acid and fulvo-metallic complexes to to mineral
nutrition of plants. Can. J. Soil Sci. 50:385-395.
Lévesque, M. 1969. Characterization of model and soil organic matter metal-phosphate
complexes. Can. J. Soil Sci. 49:365-373.
Lévesque, M., and M. Schnitzer. 1967. Organo-metallic interactions in soils: 6. Preparation
and properties of fulvic acid-metal phosphates. Soil Sci. 103:183-190.
Litaor, M.I., O. Reichmann, M. Belzer, K. Auerswald, A. Nishri, and M. Schenker. 2003.
Spatial analysis of phosphorus sorption capacity in a semiarid altered wetland. J.
Environ. Qual. 32:335-343.
Longabucco, P., and M.R. Rafferty. 1989. Delivery of non point source phosphorus from
cultivated mucklands to lake Ontario. J. Environ. Qual. 18:157-163.
Lucas, R. 1982. Organic soils (Histosols). Formation, distribution, physical and chemical
properties and management for crop production. Res. Rep. 435, Agric. Exp. Sta. and
Coop. Ext. Serv., Michigan State Univ., East Lansing, and Agric. Exp. Sta., Inst.
Food Agric. Sci., Univ. Florida, Gainesville, FL, 79 pp.
McKeague, A. 1967. An evaluation of 0.1 M pyrophosphate and pyrophosphate-dithionite
in comparison with oxalate as extractants of the accumulation products in podzols
and some other soils. Can. J. Soil Sci. 47:95-99.
41
Mehlich, A. 1984. Mehlich-3 soil test extractant: a modification of Mehlich-2 extractant.
Commun. Soil Sci. Plant Anal. 15:1409-1416.
Melsted, S.W., and T.R. Peck. 1977. The Mitsherlich-Bray growth function, p. 1-18, ln M.
Stelly (ed.) Soil testing: correlating and interpreting the analytical results. Reprinted
1984. Am. Soc. Agron. Spec. Publ. 29, Soil Sci. Soc. Am. Madison, Wl.
Michaelson, G.I., CL. Ping, and G.A. Mitchell. 1987. Correlation of Mehlich 3, Bray 1,
and ammonium acetate extractable P, K, Ca, and Mg for Alaska agricultural soils.
Commun. Soil Sci. Plant Anal. 18:1003-1015.
Miller, M.H. 1979. Contribution of nitrogen and phosphorus to subsurface drainage water
from intensively cropped mineral and organic soils in Ontario. J. Environ. Qual.
8:42-48.
Naucke, W., A.L. Heathwaite, R. Eggelsmann, and M. Shuch. 1993. Mire chemistry, p.
263-309. In A.L. Heathwaite (ed.) Mires. Process, exploitation and conservation.
3rd ed., John Wiley & Sons, NY, 506 pp.
Nelson, L. A., and R.L. Anderson. 1984. Partitioning of soil test-crop response probability.
p. 19-38. In M. Stelly (ed.) Soil testing: Correlating and interpreting the analytical
results. ASA Special Publication 29. ASA, Madison, Wl.
Nicholls, K.H., and H.R. MacCrimmon. 1974. Nutrients in subsurface and runoff waters of
the Holland Marsh, Ontario. J. Environ. Qual. 3:31-35.
Okruszko, H., G.E. Wilcox, and GF. Warren. 1962. Evaluation of laboratory tests on
organic soils for prediction of phosphorus availability. Soil Sci. Soc. Am. Proc.
26:71-74.
Parent, L.E., and L. Khiari. 2003. Nitrogen and phosphorus balance indicators in organic
soils. P. 105-136. In Parent, L.E. and P. Ilnicki (eds.) Organic soils and peat
materials for sustainable agriculture. CRC Press, Boca Raton, FL, 205 pp.
Parent, L.E., and Ilnicki, P. 2003. Foreword in Parent, L.E. and P. Ilnicki (ed.) Organic
soils and peat materials for sustainable agriculture. CRC Press, Boca Raton, FL, 205
pp.
Parent, L.E., and S. Marchand. 2006. Response to P of cranberry on high P testing acid
sandy soils. Soil Sci. Soc. Am. J. 70:1914:1921.
42
Pellerin, A., L.E. Parent, J. Fortin, C. Tremblay, L. Khiari, and M. Giroux. 2006a.
Environmental soil phosphorus saturation index for Quebec acid to near neutral
mineral soils varying in texture and genesis. Can. J. Soil Sci. 86:711-723.
Pellerin, A., L.E. Parent, C. Tremblay, J. Fortin, G. Tremblay, C.P. Landry, and L. Khiari,
L. 2006b. Agri-environmental Mehlich-III soil phosphorus saturation index for com
in Quebec.. Can. J. Soil Sci. 86:897-910.
Ping, C.L., and G.I. Michaelson. 1986. Phosphorus sorption by major agricultural soils of
Alaska. Commun. Soil Sci. Plant Anal. 17:299-320.
Porter, P.S., and CA. Sanchez. 1992. The effect of soil properties on phosphorus sorption
by Everglades histosols. Soil Sci. 154:387-398.
Pote, D.H., T.C. Daniel, D.J. Nichols, A.N. Sharpley, P.A. Moore, Jr., D.M. Miller, and
D.R Edwards. 1999. Relationship between phosphorus levels in three Ultisols and
phosphorus concentrations in runoff. J. Environ. Qual. 28:170-175.
Reddy, K.R. 1983. Soluble phosphorus release from organic soils. Agric. Ecosyst. Environ.
9:373-382.
Ross, G.L., and C. Wang. 1993. Extractable Al, Fe, Mn, and Si. p. 239-246. In M.R. Carter
(ed.) Soil sampling and methods of analysis. Lewis Publ., Boca Raton, FL.
Sanchez, CA. 1990. Soil-testing and fertilization recommendations for crop production on
organic soils in Florida. Techn. Bull. 876, Agric. Exp. Sta., Inst. Food Agric. Sci.,
Univ. Florida, Gainesville, FL, 44 pp.
Sanchez, C.A., and E.A. Hanlon. 1990. Evaluation of selected phosphorus soil tests for
lettuce on Histosols. Commun. Soil Sci. Plant Anal. 21:1199-1215.
Sanchez C.A., and H.W. Burdine. 1988. Relationship between soil-test P and K levels and
lettuce yield on Everglades Histosols. Soil Crop Sci. Soc. Fla. Proc. 47:52-56.
Silc, T., and W. Stanek. 1977. Bulk density estimation of several peats in northern Ontario
using the von Post humification scale. Can. J. Soil Sci. 57:75.
Simard, R.R., T.S. Tran, and J. Zizka. 1991. Strontium chloride-citric acid extraction
evaluated as a soil-testing procedure for phosphorus. Soil Sci. Soc. Am. J. 55: 414-
421.
Simoneau, M. 1996. Water quality of the Châteauguay river basin. Dir. Aquat. Ecosyst.,
Québec Min. Environ. Fauna, Québec, Canada. [In French]
43

Sims, J.T., R.O. Maguire, A.B. Leytem, K.L. Gartley, and M.C. Pautler. 2002. Evaluation
of Mehlich-3 as an agri-environmental soil phosphorus test for the Mid-Atlantic
United States of America. Sci. Soc. Am. J. 66:2016-2032.
Sissingh, H.A. 1971. Analytical technique of the Pw method used for the assessment of the
phosphate status of arable soils in the Netherlands. Plant Soil 34: 483-486.
Tran, T.S., M. Giroux, J. Guilbeault, and P. Audesse. 1990. Evaluation of Mehlich-III
extractant to estimate the available P in Quebec soils. Commun. Soil Sci. Plant
Anal. 21:1-28.
Umesh, U.N., R.A. Peterson, M. McCann-Nelson, and R. Vaidyanathan. 1996. Type IV
error in marketing research: the investigation of ANOVA interactions. J. Acad.
Marketing Sci. 24:17-26.
Vaillancourt, N., L.E. Parent, P. Buteau, V. Parent, and A. Karam. 1999. Sorption of
ammonia and release of humic substances as related to selected peat properties.
Can. J. Soil Sci. 79:311-315.
Van Der Zee, S.E.A.T.M., L. G. J. Fokkink, and W.H. van Riemsdijk. 1987. A new
technique for assessment of reversibly adsorbed phosphate. Soil Sci. Soc. Am. J.
51:599-604.
Van Lierop, W. 1981. Laboratory determination of field bulk density for improving
fertilizer recommendations of organic soils. Can. J. Soil Sci. 61:475-482.
Williams, E.G., N.M. Scott, and M.J. McDonald. 1957. Soil properties and phosphate
sorption. J. Sci. Food Agric. 9:551-559.
Wolf, A., and D.E. Baker. 1985. Comparisons of soil test phosphorus by Olsen, Bray Pl,
Mehlich I and Mehlich III methods. Commun. Soil Sci. Plant Anal. 16:467-484.
Wondrausch, J. 1969. Phosphorus sorption in mucky-peat soils. Polish J. Soil Sci. II(2):97-
106.
Zeitz, J., and S. Velty. 2002. Soil properties of drained and rewetted fen soils. J. Plant Nutr.
Soil Sci. 165:618-626.
Zheng, Z., R.R. Simard, J. Lafond, and L.E. Parent. 2001. Changes in phosphorus fractions
of a Humic Gleysol as influenced by cropping systems and nutrient sources. Can. J.
Soil Sci. 81:175-183.
44
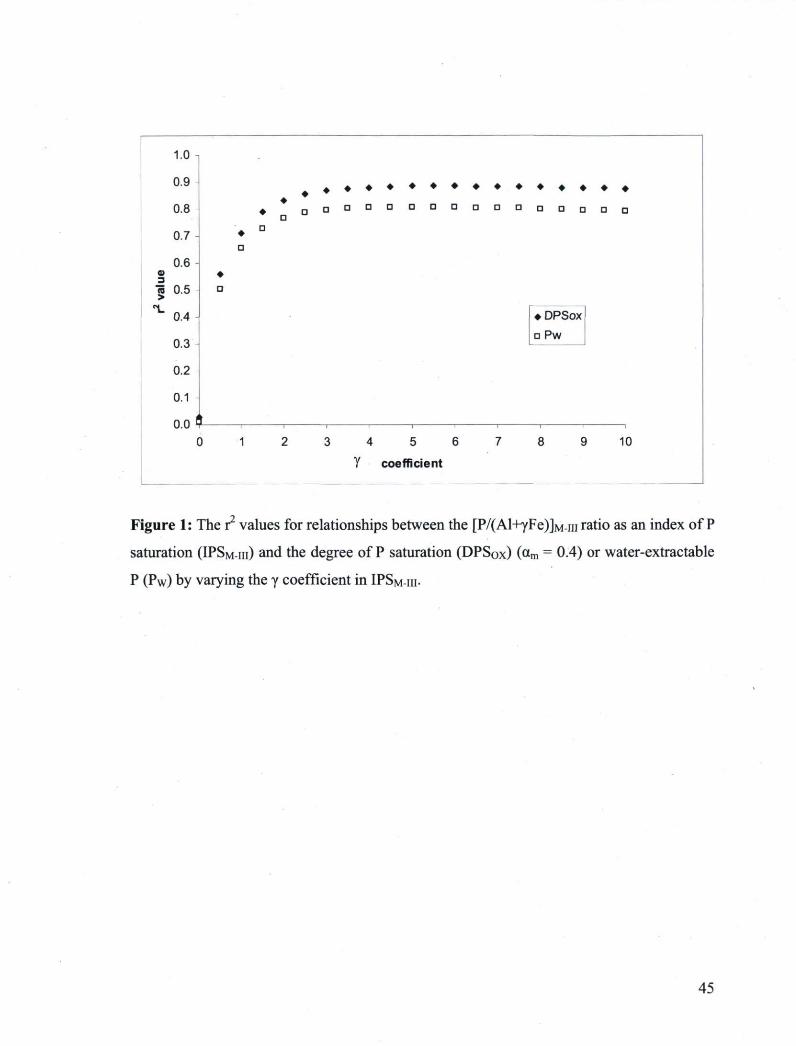
1-0 i
0.9
0.8
0.7
0.6
« 0.5
0.4
0.3
0.2
0.1
0.0 4
♦ D
♦ o ° D
♦ ♦ ♦ ♦ ♦ ♦ ♦ ♦ ♦ ♦ ♦ ♦ ♦ ♦ ♦ a a o a a u a a a a n n a a
□
4 5 6
Y coefficient
♦ DPSox □ Pw
10
Figure 1 : The r2 values for relationships between the [P/(Al+yFe)]M-m ratio as an index of P
saturation (IPSM-III) and the degree of P saturation (DPSox) (am = 0.4) or water-extractable
P (Pw) by varying the y coefficient in IPSM-III-
45
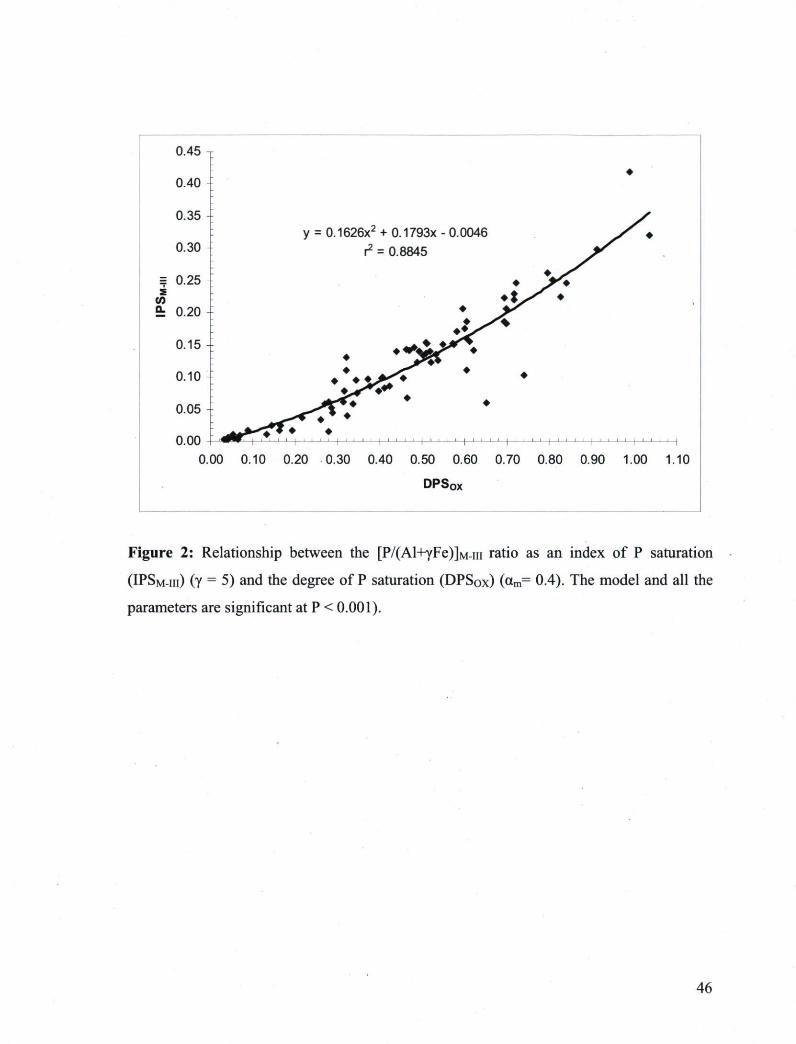
0.45
0.40 ♦
0.35
y = 0.1626X2 + 0.1793X 0.0046 S ♦
0.30 r2 = 0.8845
= 0.25 ♦ + * j T
s tn {\z 0.20 ♦
^ ♦ ■
0.15
0.10
0.05 ♦ * ♦
♦
0.00 * * • < ♦ * * ♦ ♦ 0.00 I I I I I I I I i i i i i i i i i i i i i i i i i i i i i i | i i 1 | 1 1 1 [ | I 1 1 1 1 1 1 1 1 |
0.00 0.10 0.20 0.30 0.40 0.50 0.60
DPSox
0.70 0.80 0.90 1.00 1.10
Figure 2: Relationship between the [P/(Al+7Fe)]M-m ratio as an index of P saturation
(IPSM-III) (Y = 5) and the degree of P saturation (DPSox) (am= 0.4). The model and all the
parameters are significant at P < 0.001).
46
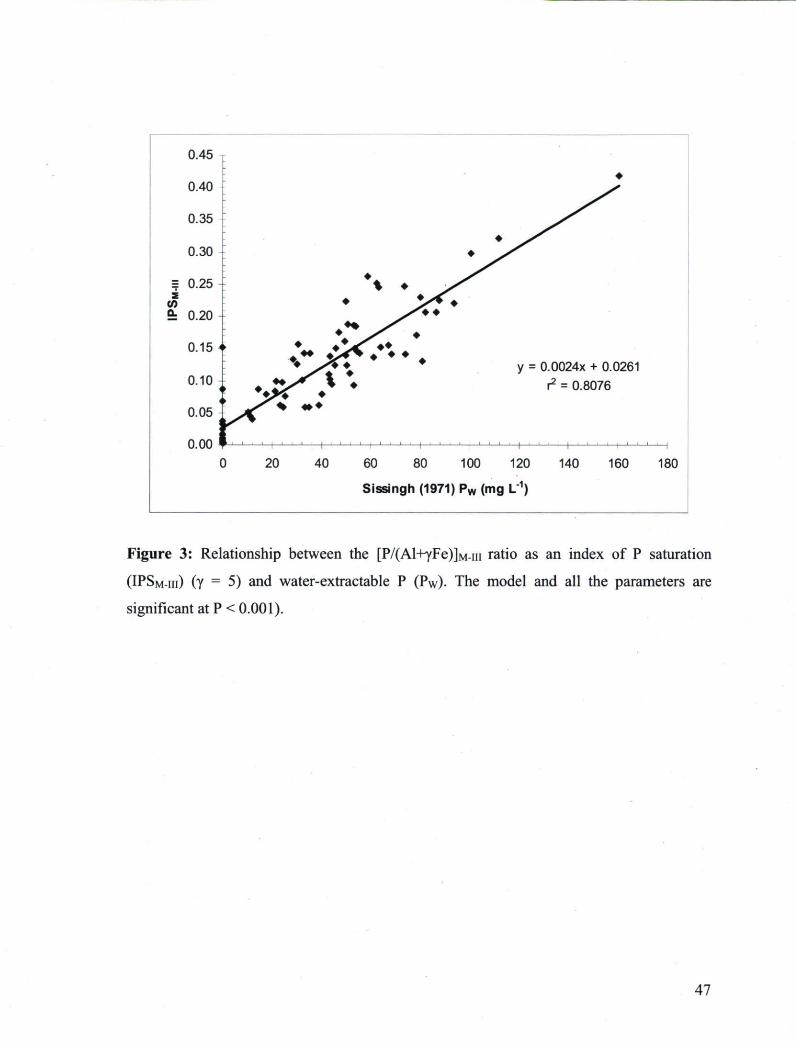
0.45
0.40 ♦
0.35 ♦ j * r
0.30 ♦ /
= 0.25 \ ♦ ^ ^ s
tn Wz 0.20
o.i5 o ♦ * % r ♦♦ * r r " ? ♦ y
= 00024x + 0.0261 °
10o ♦ J V ^ * ♦ ^ = 0.8076
0.06 \ S C% * *
n nn I
0 20 40 60 80 100 120 140 160 180
Sissingh (1971) Pw (mg L'1)
Figure 3: Relationship between the [P/(Al+YFe)]M-m ratio as an index of P saturation
(IPSM-III) (y - 5) and water-extractable P (Pw)- The model and all the parameters are
significant at P < 0.001).
47
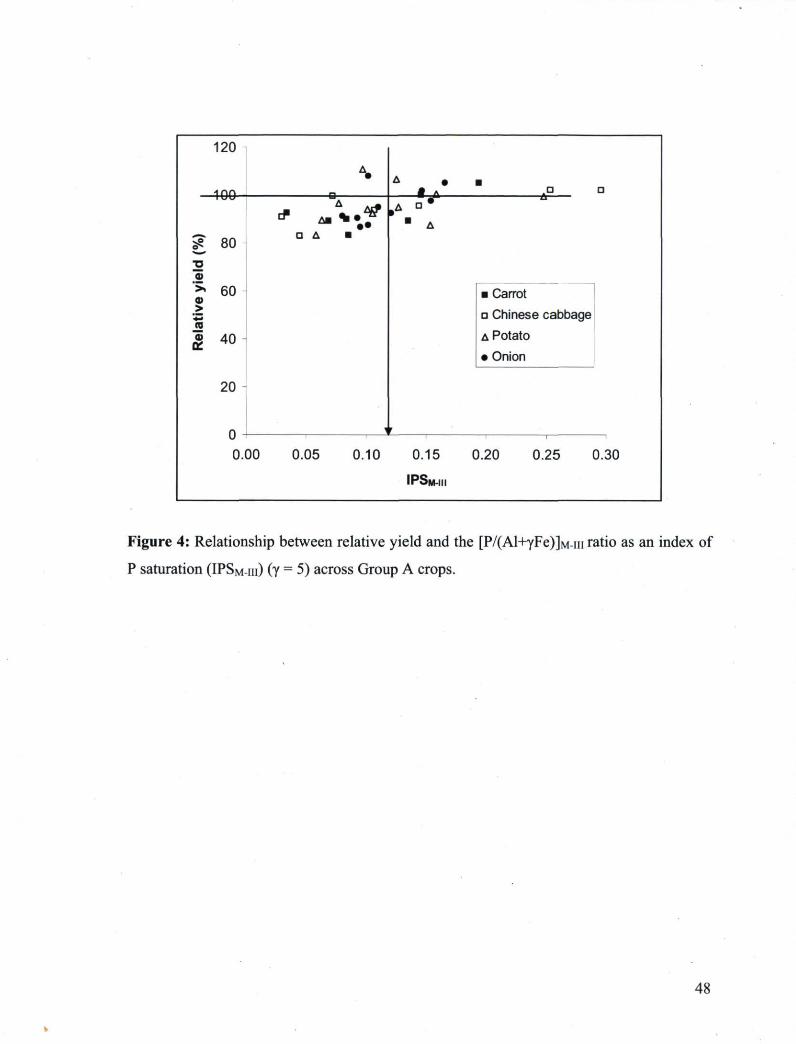
120
• inn ^
■ a
Rela
tive y
ield
(%)
ro
*»■
a.
co
c
3
O
O
O
O
C
D A ■
1
Rela
tive y
ield
(%)
ro
*»■
a.
co
c
3
O
O
O
O
C
D A ■
1
■ Carrot a Chinese cabbage A Potato • Onion
Rela
tive y
ield
(%)
ro
*»■
a.
co
c
3
O
O
O
O
C
D A ■
1
0. DO 0.05 0.10 0.15 0.20 0.25 0.30
IPSMIH
Figure 4: Relationship between relative yield and the [P/(Al+yFe)]M-m ratio as an index of
P saturation (IPSM-III) (Y - 5) across Group A crops.
48
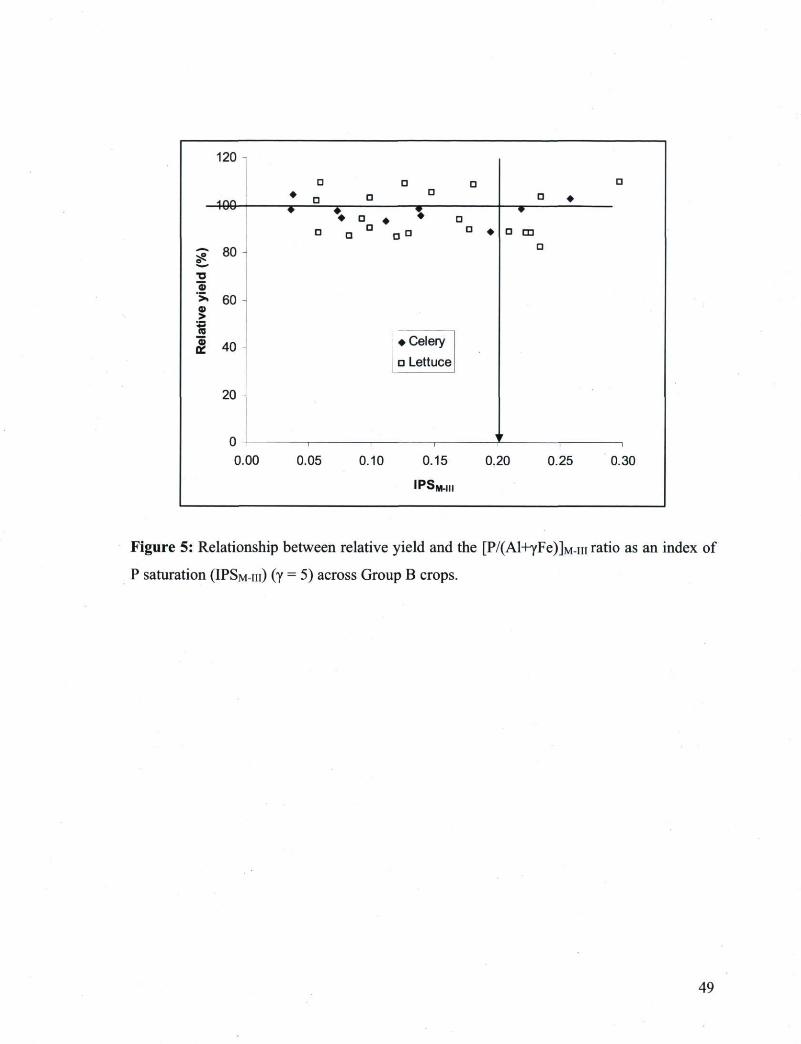
120
□ D Q n i n n ♦ D a ♦
♦ D ♦ ♦ Q n m
g 80 □
TJ S
9 > ra ë
60
40
TJ S
9 > ra ë
60
40 ♦ Celery
20
D Lettuce
20
n V
0.00 0.05 0.10 0.15 0.20 0.25
IPSMIII
0.30
Figure 5: Relationship between relative yield and the [P/(Al+yFe)]M-m ratio as an index of
P saturation (IPSM-III) (Y - 5) across Group B crops.
49
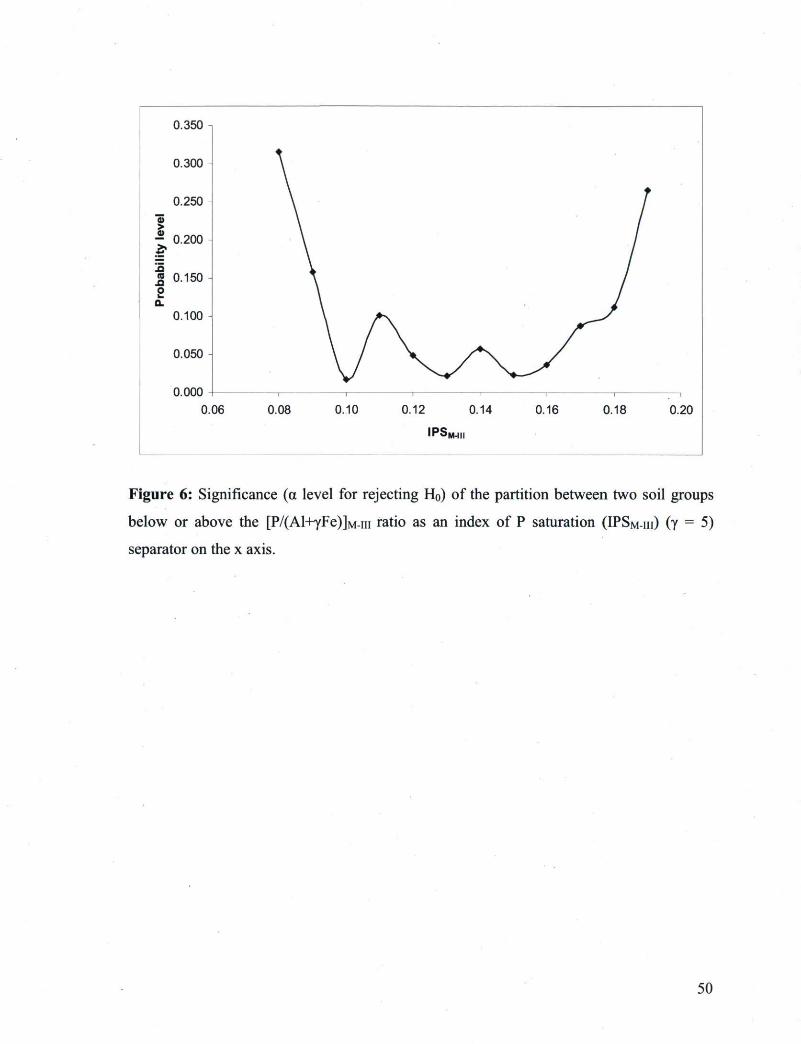
Figure 6: Significance (a level for rejecting Ho) of the partition between two soil groups
below or above the [P/(Al-HyFe)]M-m ratio as an index of P saturation (IPSM-III) (y = 5)
separator on the x axis.
50

Tableau 1: Phosphorus application rates at experimental sites.
Crop 2002-2003 2004-2005 kg F ha'1 kg F
Carrot - 0,13, 26, 52 Chinese cabbage - 0, 15,31,61 Onion 0,13,26,39 0, 13, 26, 52 Potato 0,9,17,35 0, 13, 26, 52 Celery 0,9,17,35,52 0,11,22,44 Lettuce 0,9,17,35 0,13,26,52
51
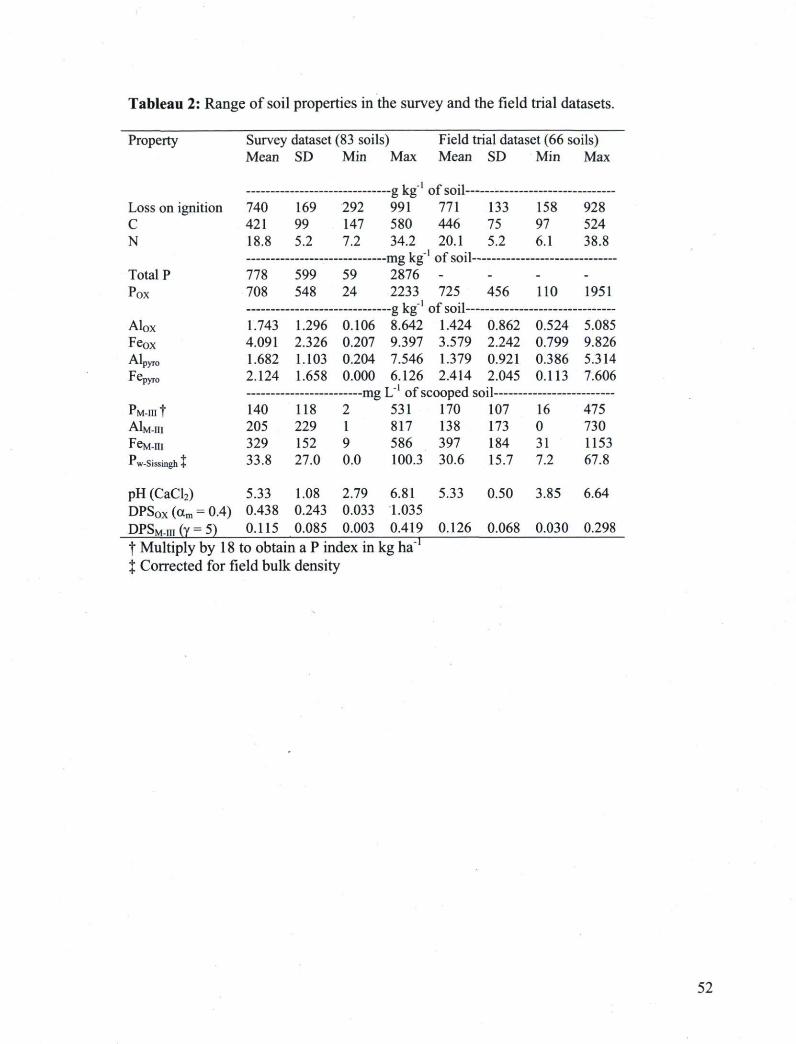
Tableau 2: Range of soil properties in the survey and the field trial datasets.
Property Survey dataset (83 soils) Field trial dataset (66 soils) Mean SD Min Max
e ke"'
Mean SD Min Max
Loss on ignition 740 169 292 6 K 6 991 771 133 158 928
C 421 99 147 580 446 75 97 524 N 18.8 5.2 7.2 34.2
m o lc~o 20.1 5.2 6.1 38.8
Total P 778 599 59 1 U 6 *-& 2876 _ _ _
Pox 708 548 24 2233 725 456 110 1951 --gkg"'
8.642 Alox 1.743 1.296 0.106 --gkg"'
8.642 1.424 0.862 0.524 5.085 Fe o x 4.091 2.326 0.207 9.397 3.579 2.242 0.799 9.826 -^Ipyro 1.682 1.103 0.204 7.546 1.379 0.921 0.386 5.314 'jSpyfO 2.124 1.658 0.000 6.126 2.414 2.045 0.113 7.606
m o L"' of scooped s nil n i g L"' of scooped s
PM-III t 140 118 2 531 170 107 16 475 AIMIII 205 229 1 817 138 173 0 730 FeM-m 329 152 9 586 397 184 31 1153 -Iw-Sissingh + 33.8 27.0 0.0 100.3 30.6 15.7 7.2 67.8
pH (CaCl2) 5.33 1.08 2.79 6.81 5.33 0.50 3.85 6.64 DPSox (a» = = 0.4) 0.438 0.243 0.033 1.035 DPSM-,,, (Y = = 5) 0.115 0.085 0.003 0.419 0.126 0.068 0.030 0.298 t Multiply by 18 to obtain a P index in kg ha" J Corrected for field bulk density
52
Chapitre 5 PUBLICATION SCIENTIFIQUE NO 2 DE
LA THESE: Spatial and seasonal variability of Mehlich
III soil phosphorus saturation index in cultivated organic
soils
5. Variabilité spatiale et saisonnière de l'indice de saturation en phosphore utilisant la méthode de Mehlich III dans les sols organiques cultivés
5.1 Avant-propos
Le chapitre 5 porte sur la variabilité spatiale et saisonnière du phosphore (PM-III) et de
l'indice de saturation en phosphore (ISPM-III) extrait selon la méthode Mehlich III en sols
organiques. Ce chapitre sera soumis sous peu au Journal of Water Science:
Guérin, J.É., L.É. Parent, and B.C. Si. 2009. Spatial and seasonal variability of IPSM-III in
cultivated organic soils.
54
5.2 Résumé
Plusieurs études ont attribué le lessivage du phosphore (P) des sols organiques cultivés et
l'eutrophisation des cours d'eau adjacents à la fertilisation en P excessive et à
l'accumulation de P dans les sols. L'indice de saturation en P utilisant la méthode Mehlich
III (ISPM-III) a été proposé comme un indice agroenvironnemental de saturation en P pour
les sols organiques cultivés. La variabilité spatiale et saisonnière de I'ISPM-III dans les
champs cultivés doit être documentée et reliée aux risques environnementaux de pollution
diffuse pour recommander des pratiques de fertilisation plus efficaces. L'objectif de cette
recherche était d'identifier les patrons de variation spatiale et temporelle du PM-III et de
I'ISPM-III pour les sols organiques cultivés et d'évaluer les pertes de P entre l'automne et le
printemps suivant. Les échantillons de sols ont été prélevés en composite selon une grille
d'échantillonnage de 25 m par 25 m sur une superficie moyenne de 7 ha dans trois types de
sols organiques cultivés dans sud-ouest du Québec en automne 2006 et au printemps 2007.
Le P, le fer (Fe) et l'aluminium (Al) du sol ont été extraits en duplicata en utilisant la
méthode M-III et l'oxalate acide d'ammonium (OX). Les analyses spatiales en sols
organiques ont démontré que les valeurs de PM-III et d'ISPM-m étaient spatialement
autocorrélées et que les semivariogrammes expérimentaux pouvaient être décrits par des
modèles théoriques linéaires plateaux ou sphériques avec une portée allant de 68,0 à 167,8
m. Il y avait également une grande variation parmi les valeurs de PM-III et d'ISPM-m entre
l'automne et le printemps. Malgré la variation spatiale et saisonnière, les valeurs ISPM-III
demeuraient généralement plus élevées que le seuil environnemental à chaque site et
chaque période d'échantillonnage. La perte de P hors de la couche arable ont atteint 41 kg
PM-III ha"1 et 84 kg Pox ha"1 entre l'automne et le printemps suivant, indiquant une forte
contribution des sols organiques à la pollution des rivières.
5.3 Abstract
Many reports attributed the phosphorus (P) leaching from cultivated organic soils and the
eutrophication of adjacent surface waters to excessive P fertilization and accumulation in
soils. The index of phosphorus saturation using the Mehlich III (IPSM-m) method has been
proposed to define an agri-environmental threshold of P saturation in cultivated organic
55
soils. The spatial and temporal variability of IPSM-III in cultivated fields must be
documented and related to the risk of P pollution to recommend more efficient fertilization
practices. The objective of this research was to identify spatial and temporal variation
patterns of PM-III and IPSM-III in cultivated organic soils and to evaluate the P losses between
autumn and the following spring. Composite soil samples were taken following a 25 m by
25 m grid within 7-ha plots in three types of cultivated organic soils of south western
Quebec in fall 2006 and spring 2007. Soil P, iron (Fe), and aluminum (Al) were extracted
in duplicates using the Mehlich III and the acid ammonium oxalate methods (OX). The
spatial analysis of organic soils showed that PM-III and IPSM-III were spatially autocorrelated
and that the experimental semivariogram can be described by linear to sill or spherical
models with a range of 68.0 to 167.8 m. There was also a high seasonal variability among
PM-III and IPSM-III values. In spite of spatial and seasonal variability, IPSM-III values were
generally higher than the environmental threshold of 0.05 across sites and sampling
periods. The P loss reached 41 kg PM-III ha"1 and 84 kg Pox ha"1 between fall and the
following spring, indicating substantial contribution of cultivated organic soils to the
pollution of downstream surface waters.
5.4 Introduction
Cultivated Histosols may largely contribute to the eutrophication of waters such as the
Florida Everglades (Hortenstine and Forbes, 1972; Porter and Sanchez, 1992) and Lake
Ontario (Nicholls and MacCrimmon, 1974; Miller, 1979; Longabucco and Rafferty, 1989).
The phosphorus (P) pressure on downstream surface water quality is also a major concern
in organic soils used for vegetable productions in south western Quebec, Canada. The
median P concentration in the Norton River draining a large area of cultivated organic soils
in Quebec showed poor water quality (0.28-0.60 mg total P by liter (L-1)), the median
concentration exceeding 14 times the environmental guideline of 0.03 mg total P L_1
(Simoneau, 1996). This criterion has been fixed by the local government authority for
limiting algae growth (Menviq, 2003). The P losses in organic soils are controlled by many
factors acting simultaneously such as current fertilization, soil and water management
practices, composition and depth of the soil, the nature of the underlying mineral material
(Duxbury and Peverly, 1978), mineralization, previous fertilization, soil ability to sorb P
56
(Cogger and Duxbury, 1984), and solubilisation of inorganic P (Reddy, 1983). Since
dissolved P concentration was nine times that of particulate P in the Norton River, runoff
and leaching of fertilizer P applied in excessive amounts to vegetable crops are thought to
be the major contributors to P pollution of Norton River (Simoneau, 1996).
Acidic organic soils may retain large amounts of P (Kaila, 1959) as related to their
aluminum (Al) and iron (Fe) contents (Droughty, 1930; Kaila, 1959; Larsen et a l , 1959;
Wondrausch, 1969). The P mobility in soils is controlled by fast and slow reactions of
phosphate with oxalate-extractable Fe and Al (Feox and Alox) (Lookman et a l , 1995).
During their genesis, organic and gleyed soils may accumulate substantial amounts of Alox
as well as Feox (Naucke et a l , 1993; Efimov et a l , 1996). Metal-P complexes with organic
matter can also be formed (Lévesque and Schnitzer, 1967; Bloom, 1981) and are part of the
oxalate extraction (Ross and Wang, 1993). Peat materials with low ash content show small
ability to sorb P (McCool, 1921) since Fe and Al oxide and hydroxide contents tend to
increase with ash content (Staker and Jornlin, 1944).
In spring, during snowmelt, a significant amount of P may be carried by snowmelt runoff
(Hansen et a l , 2002). Organic soils are subject to flooding in the spring due to their low
landscape position, followed by a drier state after the drainage of excess water and seedbed
preparation. Wetting/drying cycles may decrease the solubility of native and added P as a
result of biological reduction of Fe during the flooding phase and reoxidation during the
drying phase that enhances the reactivity of sesquioxides (Sah et a l , 1989; Iyamuremye
and Dick, 1996). There is an increase in water-soluble and plant-available P during the
flooding phase occurs due to hydrolysis of Fe(III) and Al(III) phosphates, release of
exchangeable P on hydrous oxides of Fe(III) and Al(III), and reduction Fe(III) to Fe(II)
(Ponnamperuma, 1972). Any change in reactive P, Al, and Fe due to wetting/drying cycles
in organic soils may show up in the oxalate extraction.
The degree of phosphorus saturation (DPS) describing this retention is empirically defined
( P ) as DPS = , where P, Al, and Fe are OX extracted forms and am is the am(Al + Fe)Jox
57
maximum saturation factor for total sorption (van Der Zee et a l , 1987). The P sorption
maximum parameter is estimated by am(Al+Fe)ox, where am=0.5 for mineral soils and
am=0.4 for organic soils (Breeuwsma and Silva, 1992). Guérin et al. (2007) proposed an
index of P saturation (IPSM-III) for cultivated organic soils based on P (PM-III), Al (A1M-III),
and weighted Fe (FeM-m) as extracted by the Mehlich-III (M-III) method (Mehlich, 1984)
widely used in North American soil testing laboratories. The environmental IPSM-III
threshold was found to be 0.05 and the agronomic IPSM-III thresholds to be 0.10 and 0.15.
The IPSM-III values above environmental threshold were considered at environmental risk
(Gartley and Sims, 1994).
On the other hand, fertilizer recommendations for commercial farming are generally based
on soil samples collected in the fall preceding the growing season using random sampling
across a field or a management zone (CRAAQ, 2003). Phosphorus leaching as well as
spatial variability may affect the prediction of P requirements the following spring. Soil
spatial variability can be associated to physical, chemical, and biological processes
occurring at different spatial scales (Goovaerts, 1998). Litaor et al. (2003) determined P
sorption in organic soils at regional scale in Israel. However, little is known about the
spatial and temporal variability of IPSM-III at field scale in organic soils.
The aims of this present study were (i) to quantify patterns of spatial variability of PM-III and
IPSM-III in cultivated organic soils and (ii) to determine the variation in P stocks in the
arable layer between fall and the following spring. This study will document spatial
variability of PM-III and IPSM-III in three fields and calculate P losses from the arable layer
between fall and the following spring.
5.5 Materials and methods
5.5.1 Study sites
The three representative organic soil sites selected for this study were located in
southwestern Québec, Canada, where vegetable crops are grown. Soils at the site 1, 2, and 3
were classified as Typic Fibrisol, Terric Mesisol and Mesic Fibrisol, respectively (Canadian
58
System of Soil Classification, 1998). We selected those three fields because of their
difference in degree of decomposition and time elapsed since reclamation. Sites 1 and 3
were reclaimed in 2002 and 1998, respectively. Site 2 has been reclaimed more than 30 yr
ago. In fall 2006 after vegetable harvest and in early spring 2007 before soil preparation,
soil samples were collected on a regular 25 m by 25 m grid pattern in the 0-30 cm layer, the
normal depth of the arable layer in Quebec organic soils (Parent et a l , 1991). Plot size was
8 ha at site 1, 7 ha at site 2, and 5 ha at site 3. Six soil samples were composited at each grid
point and all sampling points were georeferenced using a Geographical Positioning System
(GPS) SX-Blue model RS-232 and the FARM works software (version 7.0, Farm Work
division of CTN Data Service, Inc., Hamilton, IN). The coordinates were transformed
according to the UTM-83 zone 18 and to Y and X axes before analysis. The maximum lag
distance was set at half the longest distance (site 1, maximum lag distance = 187.5 m; site 2
and 3, maximum lag distance = 260 m).
5.5.2 Soil Analysis
Soils were air-dried to constant weight, and sieved to < 2 mm. Soil P, Fe, and Al were
extracted in duplicates using the M-III method (Mehlich, 1984). The oxalate extraction is
more quantitative than PM-III soil P test for assessing P loss from the arable layer. Oxalate P
(Pox), Feox, and Alox were extracted according to Ross and Wang (1993). Soil P, Fe and
Al were determined by ICP (Thermo Jarrell-Ash model 61-E, Thermo Instrument, Franklin,
MA). The IPSM-III values were computed as follows (Guérin et a l , 2007):
■Al M - M + y r e ' M-III I P S M - „ I = „■ M~"l [1]
Where PM-III, A1M-HI and FeM-m are M-IH-extractable forms in mmol kg"1 and y = 5 is a
weighting coefficient for Fe (Guérin et a l , 2007). The degree of phosphate saturation was
determined as follows (van der Zee et a l , 1987; Breeuwsma and Silva, 1992):
DPS o x = ^ [2] aMlox+ F e ox)
where am is the maximum saturation factor for total sorption and P0x, Alox, and Feox are
oxalate forms (mmol kg"1). We selected am = 0.4 for histic epipedons (Breeuwsma et al ,
1986).
59
5.5.3 Statistical Methods
Variography, kriging and cross validation of kriged values were computed using GS+
Version 5.1, 2000 (Gamma Software Design, St. Plainwell, MI). Semivariograms illustrate
changes in semivariance between two sampling points as the distance between them
increases (Goovaerts, 1998). The semivariance increases with distance between two
locations to a more or less constant value at a given separation distance (Trangmar et a l ,
1985). The degree of normality is estimated by inspecting a plot of frequency distribution
(Si et a l , 2007). Semivariance was used to evaluate the degree of spatial autocorrelation
among soil properties, determine the range of autocorrelation, and map soil properties
(Boerner et a l , 1998). Tested models were linear, linear to sill, spherical, exponential and
gaussian (Webster, 1985). Weighted nonlinear least squares methods (Cressie, 1991; Si et
a l , 2007) were used to fit the models to the empirical semivariogram. The Q value [C
(Co+Q"1] represents the degree of spatial dependence. A Q value of 0 indicates no spatial
structure (Lyons et a l , 1998) and the Q value may reach 1 in a spatially structured system
(Boerner et a l , 1998). Alternatively, a nugget sill ratio [C0 (C0+C)'1] < 25% indicates
strong (S) spatial dependency (Cambardella et a l , 1994). For [C0 (C0+C)'1] between 25%
and 75%, the variable has moderate (M) spatial dependency. For [Ca (Co+C)'1] > 75%, the
variable has weak (W) spatial dependency.
Kridged values were cross-validated to evaluate the effective parameters in kriging
interpolation. A good kriging practice is expressed by goodness of fit of the linear
regression between estimated and actual values for each sample location in the domain,
(Robertson, 2008). For a perfect fit, regression coefficient is 1.00 on the 1:1 bisector line
(45-degrees). Measured and kriged values were mapped using Sufer Version 8.0 (Golden
Software, 2002, Golden, CO). The range determined the maximum radius for interpolation
by kriging (Trangmar et a l , 1985).
5.6 Results and Discussion
5.6.1 Spatial variability
General statistics
60
All datasets showed normal distribution (Table 3) and there were no obvious spatial trends
in the data. Hence, the PM-III and IPSM-III values were stationary and met the intrinsic
stationarity assumption required for geostatistical analysis. In average between fall 2006
and spring 2007, PM-III concentrations decreased from 209 mg kg"1 to 146 mg kg"1 at the site
1, from 263 mg kg"1 to 257 mg kg"1 at site 2, and from 159 mg kg"1 to 95 mg kg*' at site 3
(Table 3). The (Al+yFe)M-m value remained fairly constant between seasons. As a result of
less PM-III, IPSM-III decreased from 0.27 to 0.16 at site 1, from 0.13 to 0.11 at site 2, and
from 0.17 to 0.09 at site 3. Between fall 2006 and spring 2007 at sites 1, 2, and 3,
respectively, the Pox content showed average decreases from 336 mg kg"1 to 223 mg kg"1,
754 mg kg"1 to 688 mg kg"1, and 326 mg kg"1 to 252 mg kg"1 at sites 1, 2, and 3,
respectively (Table 4). The DPSox dropped from 0.39 to 0.26, 0.23 to 0.21, and 0.31 to
0.22 at sites 1, 2, and 3, respectively. The P sorption capacity as am(Al+Fe)ox (am=0.4)
value remained fairly constant between fall and spring. Hence, any decrease in DPSox was
thus attributable to Pox loss.
5.6.2 Semivariance of dataset
There was no anisotropy in the directional semivariograms among sites and years.
Therefore, isotropic semivariograms were used for modeling spatial variability of PM-III and
IPSM-III- Semivariance analysis of PM-III and IPSM-III across sites and sampling periods
showed a moderate spatial structure (Table 5). The Q ranged from 0.295 to 0.758. As Q
increases more variance is explained by the semivariogram and the degree of spatial
dependency becomes stronger (Lyons et a l , 1998).
As shown by nugget values for PM-III varying from 589 to 3267 (Table 5), samples showed
greater fine-scale heterogeneity in PM-m in fall than spring ones. In contrast with PM-III,
IPSM-III exhibited greater homogeneity in fall than spring. Sill values ranged from 1300 to
10 259 for PM-III and 0.0011 to 0.0051 for IPSM-m (Table 5). Distances for autocorrelation
ranged from 110.3 m to 161.6 m for PM-III and from 68.0 m to 167.8 m for IPSM-III (Table 5).
Hence, PM-III and IPSM-III values were spatially autocorrelated, similar to previous studies on
P sorption (Bruland and Richarson, 2004).
61
Spatial dependency was generally moderate, although PM-III showed strong spatial
dependence at site 2 in spring 2007 (Table 5). Cambardella et al. (1994) hypothesized that
intrinsic variation in soil characteristics may control the strong spatial dependence, and that
weak spatial dependence may be influenced by extrinsic variation. The relative nugget
effect [Co/Co+C] ranged from 45 % to 59% and from 24% to 69% for PM-m in fall 2006 and
spring 2007, respectively (Table 5), indicating strong to moderate spatial dependence. The
spatial distribution class for IPSM-m ranged from 39% to 52% and 33% to 72% for fall 2006
and spring 2007 respectively, indicating moderate spatial dependence.
Ranges of semivariogram did not change between fall and the following spring (Table 5).
The ranges of PM-III and IPSM-III varied from 110.3 m to 161.6 m for PM-m and from 68.0 m
to 167.8 m for IPSM-m- For the spherical model, semivariance increased with the distance
between samples up to a constant value (i.e. the sill or total semivariance) at a given
separation distance (i.e. the range of influence). For the linear to sill model generally used
hereinafter, semivariance increased as the distance between two samples increased until a
constant value (sill) was reached. Litaor et al. (2003) found that the linear model best
described the spatial pattern of the P saturation index (using the oxalate method) in organic
soils over a long range of spatial dependency (> 2000 m). Since DPSox was found to be
closely related to IPSM-III (1^=0.88) (Guérin et a l , 2007), theoretical models should be
similar. Contour maps were made using ordinary point kriging and linear to sill
semivariogram models except for PM-III at site 3 in fall 2006 and spring 2007, where the best
models determined by the r2 statistics were spherical (Table 5). The difference in theoretical
models between both studies could be explained by the sampling scale. Litaor et al. (2003)
quantified P sorption at a regional scale. Their DPS variogram used 70 georeferenced
locations for an area of 1860 ha of organic soils showing a unit separation range from 800
to 1200 m, and a lag tolerance of 600 to 400 m. In our study at field scale, the average
maximum lag distance was 235 m.
The distribution and the pattern of both measured and kriged values for PM-III and IPSM-III
are represented as surface maps (Fig. 7 to 13). Cross-validation results showed that PM-III
and IPSM-III satisfied the interpolation criteria (Robertson, 2008) (Table 6). The contour
62
maps of IPSM-III values were separated into five IPSM-III classes as follows: low: 0.00-0.05;
medium: 0.05-0.10; high: 0.10-0.15; very-high: 0.15-0.25; and excessively-high: > 0.25
(Guérin et a l , 2007). At site 1, the spatial distribution of PM-III values was patchy in fall
2006 (Fig. 7a). The lowest PM-III values were at the top of the map. The PM-III distribution
was more uniform in spring 2007 (Fig. 7b) and still showed the lowest values at the top of
the map. The contour map of IPSM-III values at site 1 in fall 2006 (Fig. 8a) was more
uniform compared to spring 2007 (Fig. 8b). However, both the lowest and highest IPSM-III
values appeared in the same areas, the lowest values being at the top of the map and the
highest at the bottom. Nevertheless, for both fall 2006 and spring 2007 IPSM-III values
exceeded the environmental threshold of 0.05 across site 1.
The contour map of PM-III at site 2 in fall 2006 and spring 2007 showed that similar PM-III
concentrations appeared in the same areas (Fig. 9a and 9b). The IPSM-III followed the same
pattern as PM-III (Fig. 10a and 10b). The highest IPSM-III values covered a large portion of
the map and exceeded the environmental threshold of 0.05 in fall 2006. The following
spring, 92% of the IPSM-III values exceeded the environmental threshold of 0.05.
The PM-III kriged map at site 3 in fall 2006 (Fig. 1 la) showed a large patch in the center of
the plot where low PM-III values were surrounded by large patches of slightly higher PM-III
values. In the following spring, the same patches appeared approximately at the same
locations, but PM-III values were lower (Fig. lib). The IPSM-III values showed the same
pattern as PM-III (Fig. 12a) and all IPSM-III values exceeded the environmental threshold of
0.05 (Guérin et a l , 2007) in fall 2006. The following spring, 86% of IPSM-m values (Fig.
12b) exceeded the environmental threshold. Hence, some P was leached between fall and
the following spring, but the arable layer of organic soils still remained at a high P risk in
the spring.
5.6.3 Seasonal variability
There was large seasonal variability in PM-IH , IPSM-III, POX and DPSox values across sites.
The PM-III values were closely related to Pox for both fall samples (r2 = 0.88, 0.73, 0.79 at
sites 1, 2, and 3, respectively) and spring ones (r2 = 0.88, 0.86, 0.75 at sites 1, 2, and 3,
63

respectively). The IPSM-m values were also closely related to DPSox for both fall (r2 = 0.84,
0.79, 0.81 at sites 1, 2, and 3, respectively) and spring samples (r2 = 0.83, 0.88, 0.81 at sites
1, 2, and 3, respectively). Our results are in line with those obtained by Guérin et al. (2007).
The P loss between fall 2006 and spring 2007 averaged 41 kg PM-III ha"1 and 84 mg Pox kg"
, indicating substantial P losses from the arable layer of cultivated organic soils that are
potentially at high risk for the pollution of the Norton River. In comparison, P losses in
outflows were in the range of 1-37 kg P ha"1 yr"1 in New York (Duxbury and Peverly,
1978), Massachusetts (Howes and Teal, 1995) and Ontario (Miller, 1979), and up to 168
kg P ha"1 yr"1 in the Everglades (Reddy, 1983). In average, IPSM-III values decreased from
0.19 to 0.12 and DPSox from 0.31 to 0.23. The P loss peaked where P saturation values
were high to excessively-high (0.10-0.15; 0.15-0.25; > 0.25) at sites 1 and 3 (Figs. 8a, and
12a). Even at medium saturation level (0.05-0.10), some P loss was detected. Large patches
of P accumulation were found at site 2 (Fig. 10c). The highest P losses (Figs. 8c, 10c, 12c)
were found in areas showest the lowest am(Al+Fe)ox (am=0.4) values (Fig. 13a, b, c).
The phosphate retention was reported to be closely related to soil Fe and Al oxide and
hydroxide content, the apparent degree of decomposition (Larsen et al., 1958) and the
length of time the soil had been cultivated (Larsen et a l , 1959). The am(Al+Fe)ox (am=0.4)
values at site 2 (Fig. 13b) were higher than those at sites 1 and 3 (Fig. 13a, c). The Alox and
Feox contents at site 2 were 1240 and 4710 mg kg"1, respectively, compared to 718 and 966
mg kg"1 at site 1 and 961 and 1177 mg kg"1 at site 3. Site 2 was reclaimed for cultivation
more than 30 yr ago. Repeated P fertilization, combined with high Al and Fe oxide and
hydroxide contents led to soil P retention. Sites 1 and 3 are cultivated since 2002 and 1998,
respectively, and show lower degree of decomposition and Al and Fe oxide and hydroxide
content. Although Al and Fe contents may have differed in the original peat materials at
three sites before reclamation, Al and Fe may have also accumulated as a result of the
decomposition of organic matter in the arable layer during pedogenesis (Ilnicki and Zeitz,
2003).
64
Our results showed that fall IPSM-III values may not be representative of the soil fertility
class the following spring (Fig. 8a, 8b, 10a, 10b, 12a and 12b). Most IPSM-III fall values
were in a lower soil fertility class the following spring. Consequently, fertilizer P
recommendations appeared more reliable when based on soil samples collected in the
spring due to important P loss between fall and spring when the environmental threshold
was exceeded. However, P requirements must be determined for each soil fertility classes
to ascertain any significant change in fertilizer recommendations between adjacent soil
fertility classes above the environmental threshold.
5.7 Conclusion
The spatial ranges of PM-III and IPSM-III values varied between 68.0 and 167.8 m in Quebec
organic soils. The semivariogram models were linear to sill or spherical. As shown by
contour maps, cultivated fields generally exceeded the environmental IPSM-III threshold of
0.05. The kriged map indicated that the fields were at high P pollution risk for the Norton
River. Between fall 2006 and spring 2007, there was a loss of 41 kg PM-III ha"1 or 84 kg Pox
ha"1. Since IPSM-III values were generally higher than the environmental threshold of 0.05
across sites and sampling periods, added P should not exceed exported P where
environmental threshold of 0.05 is exceeded. Soil samples collected in spring before the
growing season appeared to be more reliable than fall sampling since the important P loss
between fall and spring may alter soil fertility classification and, possibly, P fertilizer
recommendations. More field monitoring is needed to verify whether IPSM-III values close
to the environmental threshold of 0.05 could persist between fall and the following spring
and sustain the production systems in organic soils. Also, P losses could be further related
to P concentration in drain outflow to support the claim that P loss from the arable layer of
organic soils is an important phenomenon.
5.8 Acknowledgements
We thank the Conseil de Recherches en Pêche et Agroalimentaire du Québec, the Natural
Sciences and Engineering Research Council of Canada (DG 2254-04 and RDCPJ 305166-
03), Patates Dolbec Inc., and Ferme Daniel Bolduc (1980) Inc. for financial support.
Thanks are extended to Samuel Comtois, Maxime Paré and Rahima Abdelhafid for field
65
and laboratory support, the Ministère de l'Agriculture, des Pêcheries et de l'Alimentation
du Québec (St-Rémi, QC), Phytodata Inc. (Sherrington, QC), Technique Gazon Inc.
(LaSalle, QC), and the participating vegetable growers.
5.9 References
Bloom, P.R. 1981. Phosphorus adsorption by an aluminium-peat complex. Soil Sci. Soc.
Am. J. 45: 267-272.
Boemer, R.P.J., A.J. Scherzer et J.A. Brinkman. 1998. Spatial patterns of inorganic N, P
availability, and organic C in relation to soil disturbance: a chronosequence
analysis. Applied Soil Ecology. 7: 159-177.
Breeuwsma, A., J.H. Wôsten, J.J. Vleeshouwer, A.M. van Slobbe et J. Bouma. 1986.
Derivation of land qualities to assess environmental problems from soil surveys.
Soil Sci. Soc. Am. J. 50: 186-190.
Breeuwsma, A. et S. Silva. 1992. Phosphorus fertilization and environmental effects in the
Netherlands and the Po region (Italy). Winand Staring Centre for Integrated Land,
Soil, and Water Research, Agric. Res. Dep. Rep. 57, Wageningen, The Netherlands.
39 pp.
Bruland, G.L. et CJ. Richardson. 2005. Spatial variability of soil properties in created,
restored, and paired natural wetlands. Soil Sci. Soc. Am. J. 69: 273-284.
Cambardella, CA. et D.L. Karlen. 1999. Spatial analysis of soil fertility parameters.
Precision Agriculture. 1: 5-14.
Cambardella, C.A., T.B. Moorman, J.M. Novak, T.B. Parkin, D.L. Karlen, R.F. Turco et
A.E. Konopka. 1994). Field-scale variability of soil properties in central Iowa soils.
Soil Sci. Soc. Am. J. 58: 1501-1511.
Canada S C W G .1998. The Canadian system of soil classification.
CRAAQ. 2003. Reference guide for crop fertilization [In French]. 1st ed. Centre de
Référence en Agriculture et Agroalimentaire du Québec, Québec, Canada. 297 p.
Cressie, N. 1991. Statistics for Spatial Data, Is' ed. John Wiley & Sons, New York.
Cogger, C. et J.M. Duxbury. 1984. Factors affecting phosphorus losses from cultivated
organic soils. J. Environ. Qual. 13: 111-114.
Delcourt, H., P.L. Darius et J.D. Baerdemaeker. 1996. The spatial variability of some
66
aspects of topsoil fertility in two Belgian fields. Computers and Electronics in
Agriculture. 14: 179-196.
Droughty, J.L. 1930. The fixation of phosphate by a peat soil. Soil Science, 2, 23-35.
Duxbury J.M et J.H. Peverly. 1978. Nitrogen and phosphorus losses from organic soils. J.
Environ. Qual. 7: 566-570.
Efimov, V.N., L.I. Kornilova et M.E. Ryabtseva. 1996. Absorption capacity and kinetics of
sorption of phosphate ions in ferruginous peat soils of lowmoor bogs. Eurasian Soil
Science. 29: 928-933.
Goovaerts, P. 1998. Geostatistical tools for characterizing the spatial variability of
microbiological and physico-chemical soil properties. Biol. Fert. Soils. 27: 315-334.
Gamma Design Software. 2000. GS+ Version 5.1. Gamma Design Software, Plainwell, MI.
Gartley, K.L. and J.T. Sims. 1994. Phosphorus soil testing: environmental uses and
implications. Comm. Soil Sci. Plant Anal. 25: 1565-1582.
Guérin, J., L.E. Parent et R. Abdelhafid. 2007. Agri-environmental thresholds using
mehlich III soil phosphorus saturation index for vegetables in histosols. J. Environ.
Qual. 36: 975-982.
Gupta, R.K., S. Mostaghimi, P.W. McClellan, M.M. Alley et D.E. Brann. 1997). Spatial
variability and sampling strategies for NO3-N, P, and K determinations for site-
specific farming. Transactions of the American Society of Agricultural Engineers.
40: 337-343.
Hansen, N.C., S.C. Gupta et J.F. Moncrief. 2002. Snowmelt runoff, sediment, and
phosphorus losses under three different tillage systems. Soil and Tillage Research.
57: 93-100.
Hortenstine, CC. et R.B. Forbes. 1972. Concentrations of nitrogen, phosphorus, potassium,
and total soluble salts in soil solution samples from fertilized and unfertilized
organic soils. J. Environ. Qual. 1: 446-449.
Howes, B.L et J.M. Teal. 1995. Nutrient balance of a Massachusetts cranberry bog and
relationships to coastal eutrophication. Environmental Science and Technology. 29:
960-974.
Illnicki, P. and J. Zeitz. 2003. Irreversible loss of organic soil functions after reclamation.
Pages 15-32 in L.E. Parent and P. Ilnicki (Eds.). Organic soil and peat material for
67
sustainable agriculture. CRC Press, Boca Raton, FL, 205 pp.
Iyamuremye E. et R.P. Dick. 1996. Organic amendments and phosphorus sorption by soils.
Adv. Agron. 56: 139-185.
Kaila, A. 1959. Retention of phosphate by peat samples. J. Sci.c Agric. Soc. Finland. 31:
215-225.
Larsen, J.E., R. Langston et G.F. Warren. 1958. Studies on the leaching of applied labelled
phosphorus in organic soils. Soil and Crop Sci. Soc. Florida. 22: 558-560.
Larsen, J.E, G.F. Warren et R. Langston. 1959. Effect of iron, aluminum and humic acid on
phosphorus fixation by organic soils. Soil Sci. Soc. Am. Proc. 23: 438-440.
Lévesque, M. et M. Schnitzer. 1967. Organo-metallic interactions in soils: VI. Preparation
and properties of fulvic acid-metal phosphates. Soil Sci. 103: 183-190.
Litaor, M.I., O. Reichmann, M. Belzer, K. Auerswald, A. Nishri et M. Schenker. 2003.
Spatial analysis of phosphorus sorption capacity in a semiarid altered wetland. J.
Environ. Qual. 32: 335-343.
Longabucco, P. et M.R. Rafferty. 1989. Delivery of non point source phosphorus from
cultivated mucklands to Lake Ontario. J. Environ. Qual. 18: 157-163.
Lookman, R., D. Freese, R. Merckx, K. Vlassak et W.H. Van Riemsdijk. 1995. Long-term
kinetics of phosphate release from soil. Environ. Sci. Techn. 29: 1569-1575.
Lyons, J.B., J.H. Gorres et J.A. Amador. 1998. Spatial and temporal variability of
phosphorus retention in a riparian forest soil. J. Environ. Qual. 27: 895-903.
McCool, M.M. 1921. Peat and muck soils. Fixation of fertilizers.Michigan Quart Bulletin.
3: 127.
Mehlich, A. 1984. Mehlich-3 soil test extractant: A modification of Mehlich-2 extractant.
Commun. Soil Sci. Plant Anal. 15: 1409-1416.
Menviq. 2003. Critère de qualité des eaux de surface au Québec, Ministère de
l'environnement du Québec. CAS:7723-14-0.
Miller, M.H. 1979. Contribution of nitrogen and phosphorus to subsurface drainage water
from intensively cropped mineral and organic soils in Ontario. J. Environ. Qual. 8:
42-48.
Miller, M.P., M.J. Singer et D.R. Nielsen. 1988. Spatial variability of wheat yield and soil
properties on complex hills. Soil Sci. Soc. Am. J. 52: 1133-1141.
68

Naucke, W, A.L. Heathwaite, R. Eggelsmann et M. Shuch. 1993. Mire chemistry, p. 263-
309. In A.L. Heathwaite (ed.) Mires: Process, exploitation, and conservation. 3rd ed.
John Wiley & Sons, NY. 506 pp.
Nicholls, K.H. et H.R. MacCrimmon. 1974. Nutrients in subsurface and runoff waters of
the Holland Marsh, Ontario. J. Environ. Qual. 3 : 31-35.
Parent, L.E, L. Grenon et P. Bluteau. 1991. Effet de plusieurs décennies d'exploitation
agricole intensive sur les propriétés des sols organiques dans le sud-ouest du
Québec. CR. Symp. "Tourbes et tourbières", Québec (1989), Vol. 11:92-98. [In
French].
Ponnamperuma, F.N. 1972. The chemistry of submerged soils. Adv. Agron. 24: 29-96.
Porter, P.S. et CA. Sanchez. 1992. The effect of soil properties on phosphorus sorption by
Everglades histosols. Soil Sci. 154: 387-398.
Reddy, K.R. 1983. Soluble phosphorus release from organic soils. Agric. Ecosys. Environ.
9: 373-382.
Rezaian, S, E.A. Hanlon, CA. Sanchez, J.A. Cornell. 1992. Optimization of solution-soil
ratio and shaking times of the Mehlich-III soil test on Histosols. Commun. Soil Sci.
Plant Anal. 23: 2247-2259.
Robertson, G.P. 2008. GS+: Geostatistics for the environemental sciences. Gamma Design
Software, Plainwell, Michigan USA.
Ross, G.L. et C Wang. 1993. Extractable Al, Fe, Mn, and Si. In: Soil sampling and
methods of analysis (Carter M R ed), pp 239-246. Lewis Publ, Boca Raton, Florida.
Sah, R.N., D.S. Mikkelsen et A.A. Hafez. 1989. Phosphorus behavior in flooded-drained
soils. II. Iron transformation and phosphorus sorption. Soil Sci. Soc. Am. J. 53:
1723-1729.
Si, B.C., R.G. Kachanoski et W.D. Reynolds. 2007. Analysis of soil variability. In: Soil
sampling and methods of analysis, second edition (Carter M R; Gregorich E G ed),
pp 1163-1191. CRC Press, Boca Raton, Florida.
Simoneau, M. 1996. Water quality of the Châteauguay river basin [In French]. Dir. Aquat.
Ecosyst., Québec Min. Environ. Fauna, Québec, Canada.
69
Staker, E.V. et F.M. Jornlin. 1944. The effect of cropping on the organic matter, nitrogen,
phosphorus, and potassium in the profiles of peat soils. Soil Sci. Soc. .Am. Proc. 9:
117-125.
Trangmar, B.B., R.S. Yost et G. Uehara. 1985. Spatial dependence and interpolation of soil
properties in West Sumatra, Indonesia I. Anisotropic variation. Soil Sci. Soc. Am J.
50: 1391-1395.
van Der Zee, S.E.A.T.M., L.G.J. Fokkink et W.H. van Riemskijk. 1987. A new technique
for assessment of reversibly adsorbed phosphate. Soil Sci. Soc. Am J. 51: 599-604.
Webster, R. 1985. Quantitative spatial analysis of soil in the field. Adv. Soil Sci. 3: 1-70.
Webster, R. et M. Oliver. 2000. Geostatistics for environmental scientists. John Wiley &
Sons Ltd, Chichester, UK 271 pp.
Wondrausch, J. 1969. Phosphorus sorption in mucky-peat soils. Polish J. Soil Sci. 2: 97-
106.
70

2 y . & ■ — i
1 € u E
— < — H
— fl o a o
s CO
.a OO 3 C O ~
« « co
5 o
x i tx 00 O
G O
S»H O X (U
T3 _c m .
a o o c 'C « (U
^ r j O u "Z M i .C
0^ "S. oo E 5 00
o C Q. ' j .
o
1 O T3
C C O fe
t u 00 o oo O O 00
*—1 00 o
" C J 'E C. C3
m J
oo t r
| E E
O <u (U E
| E E 3 î
C/3 '2 m 00
t r s (LJ
r r es <u o E
 rt 03
H Jr C. O
r r
T O s r o ro oc r o O o t * * C/3
O O o — r o I T ,
2z o H d d d O r o d o
■
CN
Û 0 ^ u C 7
' C R U oo r~u
0 0 r o vo i n ON
vO
vC oc f N
oo r~u 0 0
r o
r o d "Î Z
1
r l o C/3 =
t m vC f i n o f N
u sn VO O r d
O
d O
d d o< r N
r f d
i mW Z
1 o H
o CN
Fa
M 1
11
;kg
ON </" j vc CM
I— vO ru
i n
CN
oc ro
KO
Pr r?
JE ^ f N CN d o Pr r?
JE H T ^ r f f l t~ t~> Ov OV
007
IPS
v
d O d
O
d d i n r o d
i
^ Z 1
CM
6 0 r ^ . O T
"C = 60
(N 3
r u i n f N
vo 0 0
o CN r o r o
m d
■
CN
o ** 1
♦ i m r
w = r O r o vo 0 0 f N r^ CN
ru M VO CL
d O
d O d d vd
f N
>JO
d ^ Z 1
O H o CN
ca a eo Ur ± Z 4
eu a3
E VO CN
0 0 VD
Ov O N
ro
O VD f N
r f d
i 5 z
1
r r
"T VO vO m __ ro r f 0 0
r» c/3 rt o O ro VD f N
"° z 1 o K o d d d r o d "° z 1
(N 60 ^ G
1 S
pri
P
M-I
II
VO r f 0 0
u j Ov m
oo CM r o
vo d r o
r f d
ro "1 Z
Ov u CN
C/3 5 S
C/3
C r f N O O) un OV C/3 5 S
C/3 CN o — m
i n ro 2 2 SO CL, d d d d ( N d o 1 o K
o CN
•—' "7 ca = eo OV
o l/\, C l f N
Ov vo
i n r f
o 9 Z
OH *P f N — r o ( N d o OH *P
3
e E , U *
a . C
on O a
r . JJ Q C/3
3
E S
3 E C3 >
on O c r t O
'S 'S
g | 3 fi r t m t C/3 a
c o
'A 3 ■ £ . 2
r
rt
rr C S
•S "C
s s O .£
UJ
Z <
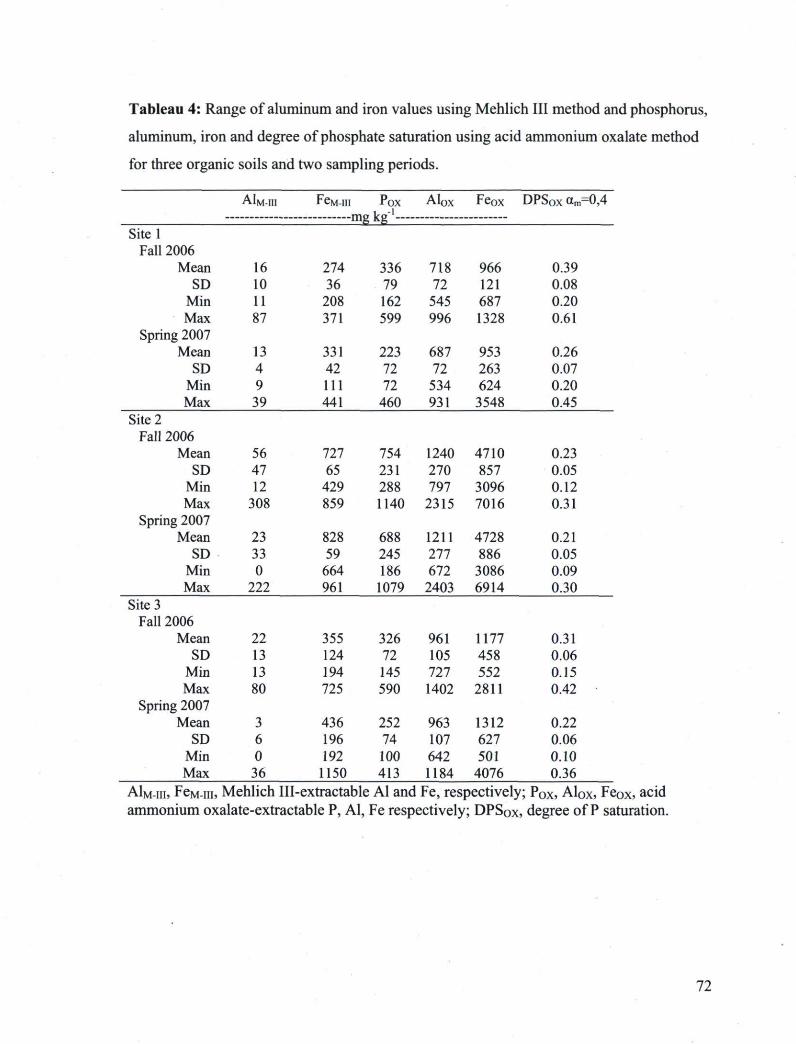
Tableau 4: Range of aluminum and iron values using Mehlich III method and phosphorus,
aluminum, iron and degree of phosphate saturation using acid ammonium oxalate method
for three organic soils and two sampling periods.
AIM-III FeM-m Pox ke'1
Alox Fe o x DPSox <xm=0,4 jUj, Ks Sitel
Fall 2006 Mean 16 274 336 718 966 0.39 SD 10 36 79 72 121 0.08 Min 11 208 162 545 687 0.20 Max 87 371 599 996 1328 0.61
Spring 2007 Mean 13 331 223 687 953 0.26 SD 4 42 72 72 263 0.07 Min 9 111 72 534 624 0.20 Max 39 441 460 931 3548 0.45
Site 2 Fall 2006
Mean 56 727 754 1240 4710 0.23 SD 47 65 231 270 857 0.05 Min 12 429 288 797 3096 0.12 Max 308 859 1140 2315 7016 0.31
Spring 2007 Mean 23 828 688 1211 4728 0.21 SD 33 59 245 277 886 0.05 Min 0 664 186 672 3086 0.09 Max 222 961 1079 2403 6914 0.30
Site 3 Fall 2006
Mean 22 355 326 961 1177 0.31 SD 13 124 72 105 458 0.06 Min 13 194 145 727 552 0.15 Max 80 725 590 1402 2811 0.42
Spring 2007 Mean 3 436 252 963 1312 0.22 SD 6 196 74 107 627 0.06 Min 0 192 100 642 501 0.10 Max 36 1150 413 1184 4076 0.36
A1M-IH, FeM-iii, Mehlich Ill-extractable Al and Fe, respectively; P0x, Alox, Feox, acid ammonium oxalate-extractable P, Al, Fe respectively; DPSox, degree of P saturation.
72
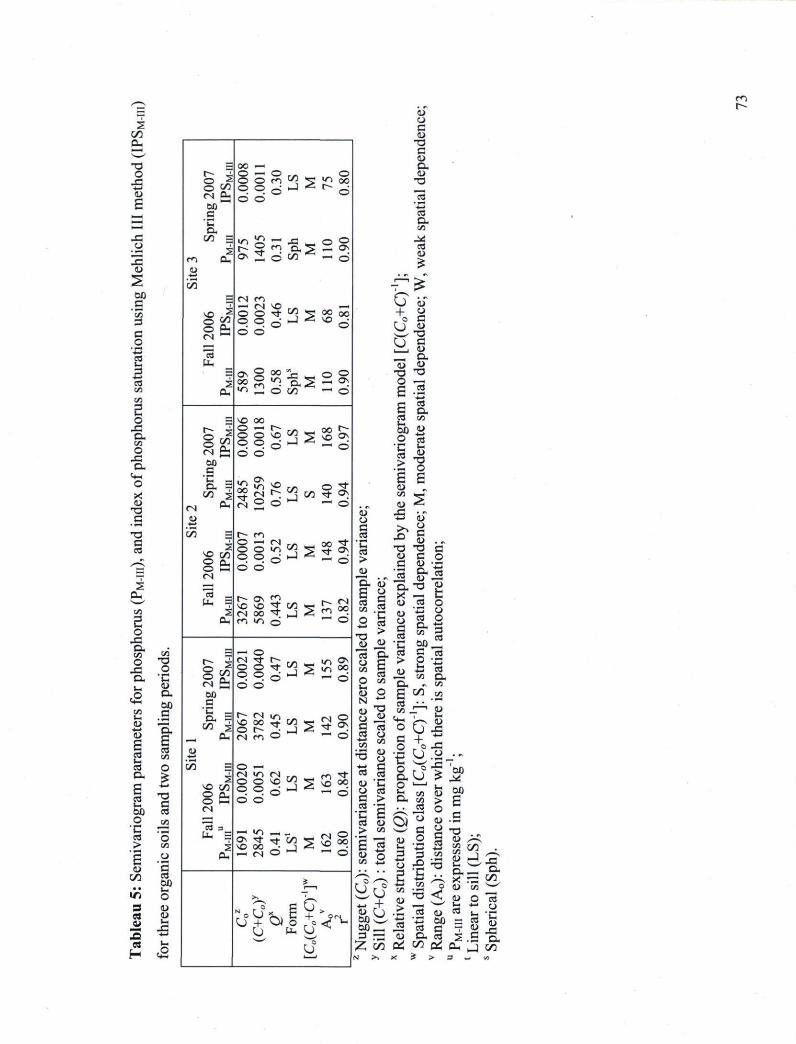
(U r—
i n
•S rC
oc r~ 3 o H O o O rZ o O r o C/3 l> rC 60 O C/3 CN Pr
o d
P d O
J l> ^ d
6 01
S I n tx
O . g i n m
1 3 C o o
S r^ m
1 3 Q. s ZZ Ov
f O OH o
m
1 3 C/3 — o ë 'V
E CN r o 1
— t N vo — vo ? O OH CN ~
O o d
O r t R d o
C/3 s 3°°
o _̂ ca
u.
S Ov 00
O 00 o i n CO
Sa a s H O v
OH i n G o C/3 — (J
g vO 0 0
C: i M CN H
O O o
p r
O vo
R d co r J >
oo t~J
—' d C: i M CN H d o 60 S
2 S
pri
P
M-I
II
i n 00 r f (N
C N t * ; O o
&o co r f <> —i o
3 C/3 = r r o
VO or, ° OH
o o o
— f N o >n P d
C/3 r J r i
oo 2 ! r f » . —i o
VO or, ° OH
d o CN
,_̂
Fa
M-I
II
r vO (N
ov <2 vo 3 0 0 • " *
G0 r j m i
r CN ro oq
OH r o >n o — o
p ■ — i o
r 4 CN fc
f N O O
5 ru O r f © d
C/3 ^ "> 2 ; «n ° °
— o r 4 CN fc
d o 60
Spri
n
M-I
II
Spri
n
M-I
II
ru VO O
CN m
£ 2 C/3 r J S
— OL, CN r o O H 0
S C/3 = O * H
VO C/3 O OH
f N O o
m CN O vo
9 d CO
S \ o 00 —' o
O r—I d o CN
,__|
Fa
PM
-III
Ov VD
> 0 —1
r f Hj
CN o
"c/3 S VO ° °
—' d i _ ^
r 0 p b cj Vb O <
0 r^
v j u u <
0 r^
g
u CJ C rt lu
rt > eu Q . u E rt
o C rt
O 4—»
n
E rt >
i ) eu
rt tx CJ i
rt f ) 00 IH <1> O N «J O £J m rt o
ru
I U
f — rt
tr u r i
+ s r » H
i i i w — o-S -H O a Ë 2 Ë & rt Sn oo J2 •i 1 1*8 M «rH (L) r2(
C ••>
° S fi fl fl <U .
3 s- -2 * s S eu rt o <U ' -5 y ?< rt O C Ç 3 §
M g ' C & Û H ca fl ffl
2 £ g, fl r 00 g CO o.
m r
c o
oo 00
(U o
<u ' C eu rt S £ •c Ë rt u > * Ë 3 <U o co JS
« r+ <u O M O OJOrH S f l Z co
°G S + •2 t? € i i S r ? G. U
. . Cm
« .2
il 2 B G oo (U ^ > "3
(U fl
S3 5? > Ë ° C m ta rt <u
- 2 <u
o i CO
a oo 00 <«
•S u
S go eu
< eu *—' i-, 50 H fl -r û i OH
co J C
^ U . ro
on O rt r J o Cm m )
G
•c eu fl CL J CO
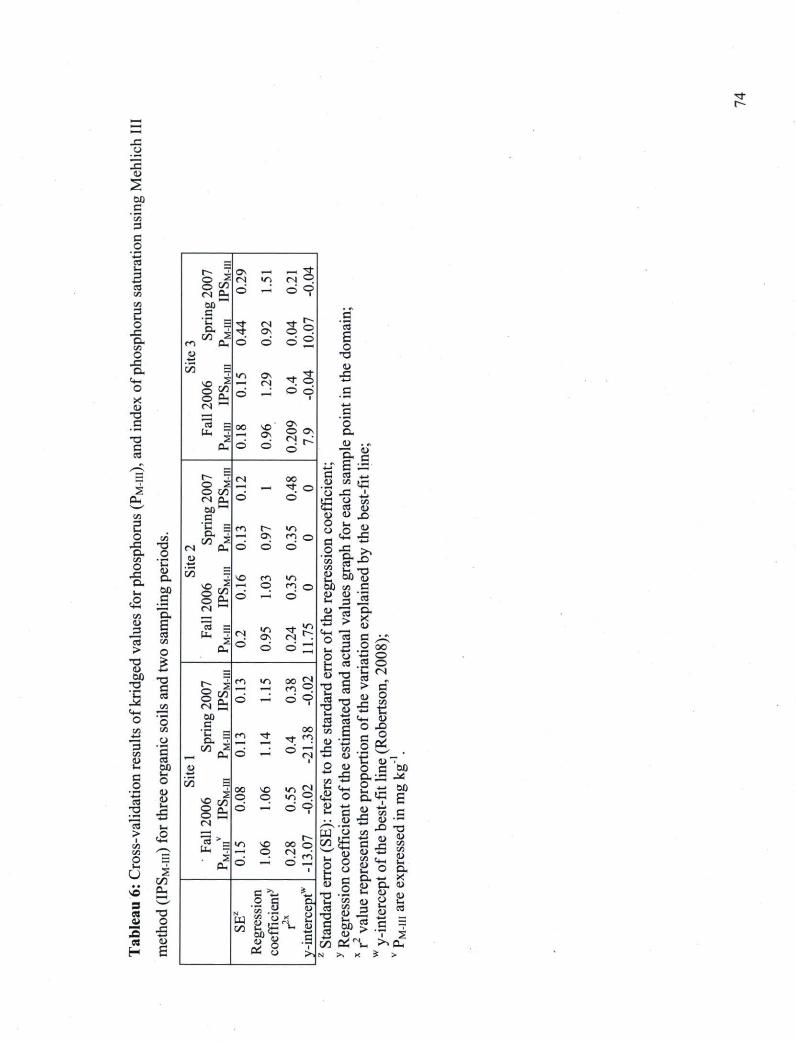
r f r
E ± Or
W
o 00
e a CL o 00 O
r O CL
■E <u CL
k u 60 o a
c+3 C3 00 CL
_ 3 1 ed 00
> O
<u B 6 0
5 rt 00
c+_ —̂ O 'o 00 00
4 r CJ
3 00 '£ cu rt iS 6 0
o •— O
m J Cm
a
u <u I
5 "rt V. > ,o
I Cjr00 00
o ™
(J 2 CO
vO m m .
3 '—' rt a CU o 2 2 « CU
H E
mm
07
Ov __ s s 07
CN i n s s o
r
CN OH d — d o rmt
6 0
5 ' m . —
CL S co s
r o OH
r f r f
d r j
d d 2 w
H »
co 5 m ( N t 3
o ço O OH
d — o d i
f N '""'
rt n S
OH
oo
d VO
d
Ov O Os
o
£; 1 rN oo o s O CO
— " t © CN P H d o 60
l —'
S ■a = ro » >n CL ^
C/3 S — Ov ro o CN OH d d d CD
C/3 =
VO ^
O OH
vO ro I/J C/3 =
VO ^
O OH •— © ro o
C/3 =
VO ^
O OH d —< d CN ~ ,_̂ rt p
Ur ~ 2
OH
f N i n Ov a£ rt p
Ur ~ 2
OH d d d ^
IS CN B
ro
d i n oo H
ro O d o
60 c
pri
i-
i 11
ro r f 0 0
r f " . CO 2:
^ ^ — OH d '"* ^ ^ U
49
s 006
IPS
M-I
II
oo VD m ^ s 006
IPS
M-I
II
o d
O V, o d o
CN
_^ "3 " B H H =
m vC oo o "3 " B H H = —̂ O CN ZrT
S _ : f *3 OH o O H
1
S ~ * ■iJ
1 s fl. CJ N
UJ co
OH 8
OH g . f l
c • «—«
Cm
E o <u
C
o C L
CJ . r.
CL CU
fl £» S c rt Hr—»
.5 on IB 'S C . i . Cfl o 00 cC rt CJ (U cu X ) o CU
i
c2 CJ
3
e 4—1
^o 3 >, 'cfl §" r D 00
2 6 0 a cu
6 0 oo ç ID CU
_S E 3 _S cu rt
> a
fl rt > X
r r
rt >
cu O I H
"3 2
0 0 0
O CJ "*—« o Ë CU
a a •— rt
rt a §
o cu
4—i C .
C*3
'6 > CJ
fl 4 ^
C+,
o CN ri* o 00
Ç cu
00 1 o C o
O o cu
r C fl 00
o C o è
O CU <U o CJ '
fl ' 60 0 0 2 C L
o r r C L
M lH
,<u ' r r
O
C L o r r C L
r J 60
£ u E w CO
o Ë
4 ^ c
.43 ' 5 C*r
CU o ô
cu C 4—»
4—»
C cu 00 cu s —
4r 00 CJ
D CJ
3 r J ( H
o
.G a eu 00 00 CU C C L
u E w CO
o Ë c CL *—» X cu c
CU a. CU
o c
1 Or) CU g U. CJ CJ fl rt
a CO
OO ^ <u , 3 fen ca s° >
S 4—»
.g Cî
0
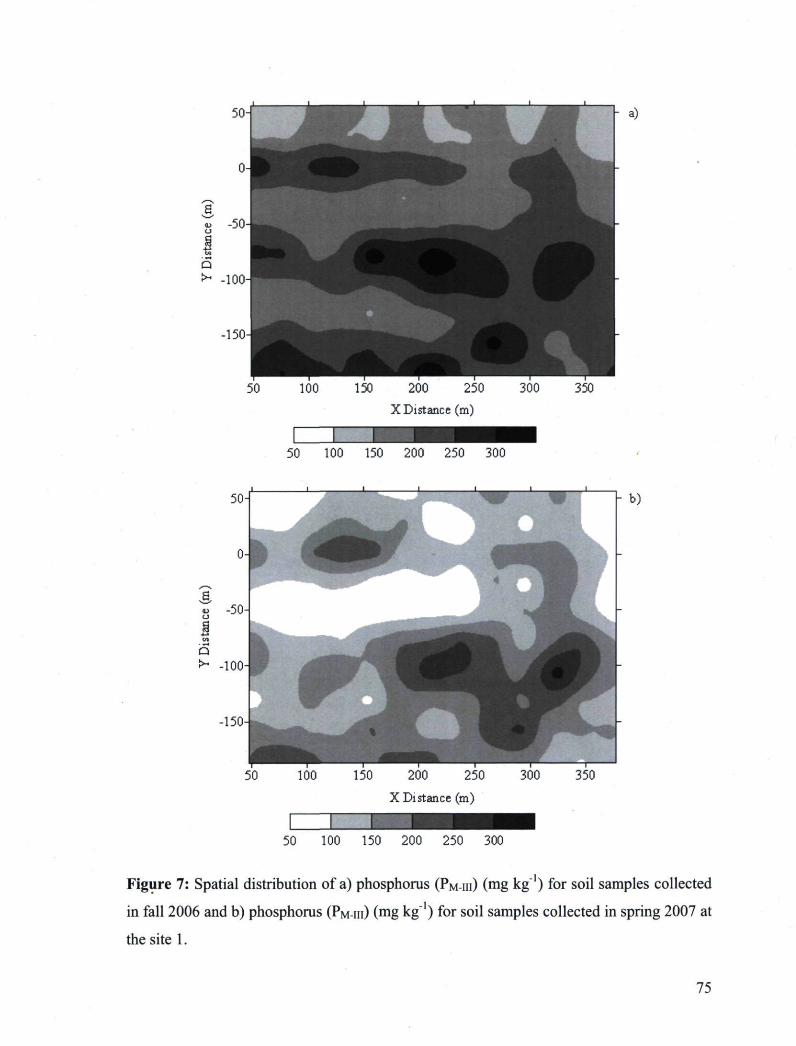
a)
50 100 150 200 250 300 350 X Distance (m)
50 100 150 200 250 300
" b)
150 200 250 X Distance (m)
50 100 150 200 250 300
Figure 7: Spatial distribution of a) phosphorus (PM-III) (mg kg"1) for soil samples collected
in fall 2006 and b) phosphorus (PM-III) (mg kg"1) for soil samples collected in spring 2007 at
the site 1.
75
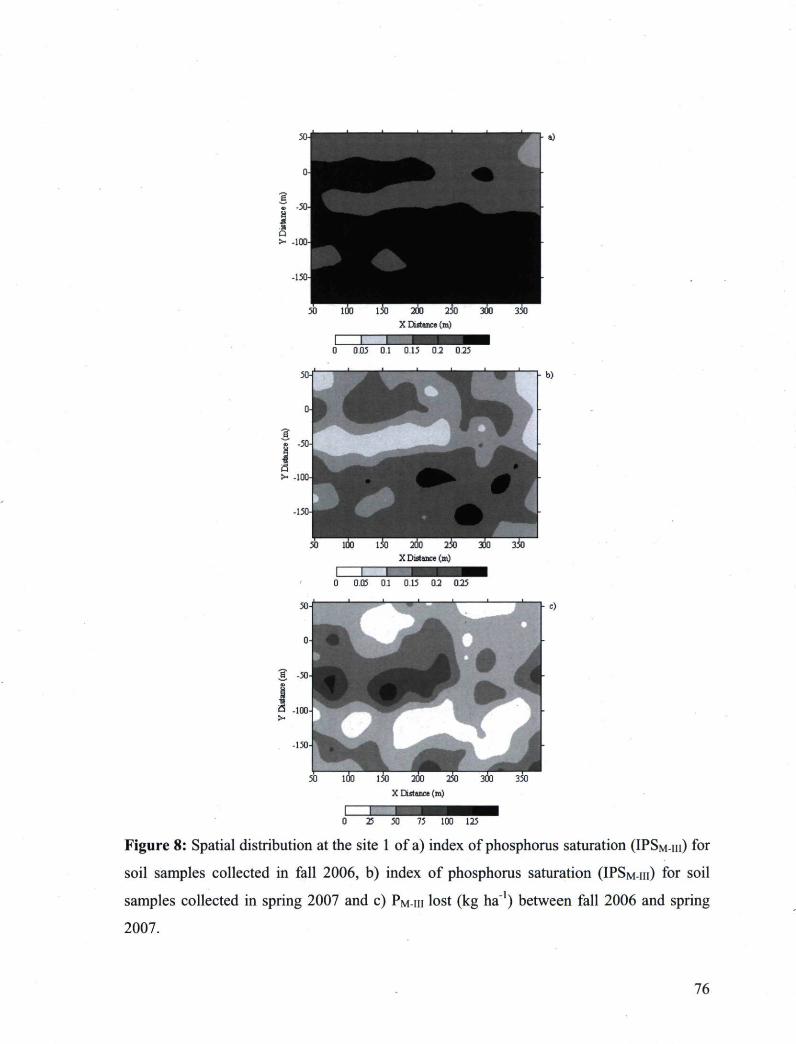
50 100 150 200 250 300 350 X Distance (m)
a r~ -100-
3 -50
i ■a S -100
-150-
50 100 150 200 250 300 350 X Distance (m)
I I B ^ ^ ^ ^ ^ 0 25 50 75 100 125
Figure 8: Spatial distribution at the site 1 of a) index of phosphorus saturation (IPSM-III) for
soil samples collected in fall 2006, b) index of phosphorus saturation (IPSM-III) for soil
samples collected in spring 2007 and c) PM-III lost (kg ha"1) between fall 2006 and spring
2007.
76
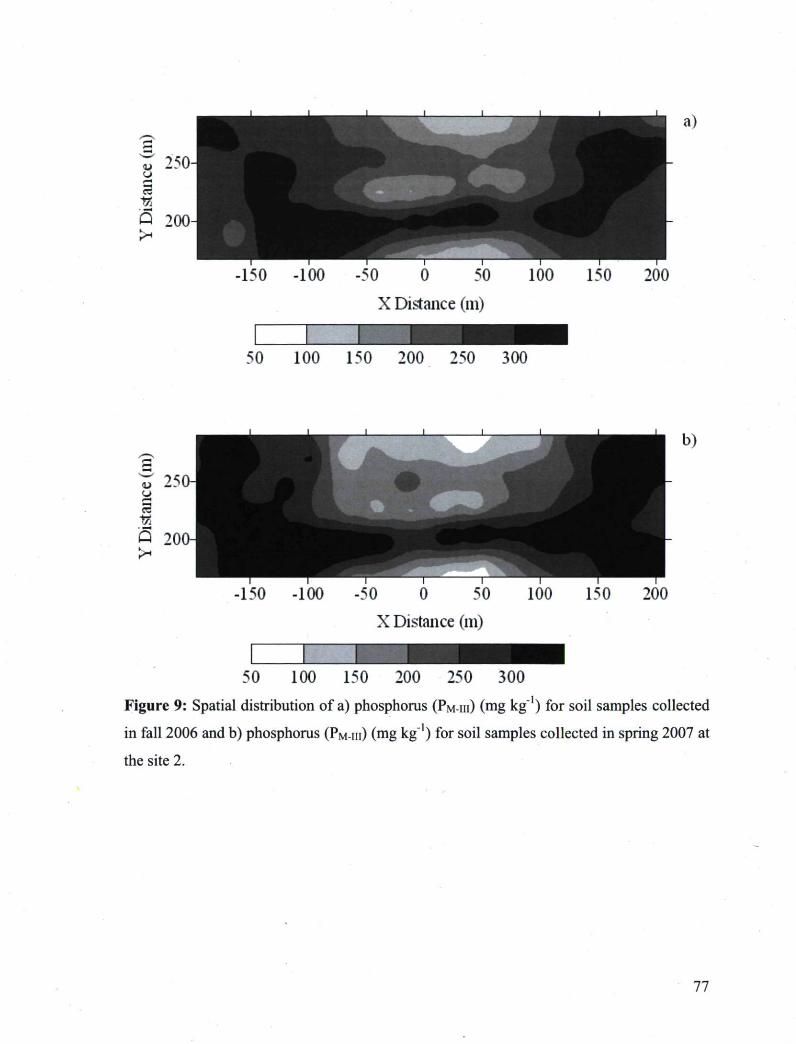
-50 0 50 X Distance (m)
50 100 150 200 250 300
■150 -100
a)
150 200
b)
-50 0 50 100 150 200 X Distance (m)
50 100 150 200 250 300 Figure 9: Spatial distribution of a) phosphorus (PM-III) (mg kg"1) for soil samples collected
in fall 2006 and b) phosphorus (PM-III) (mg kg"1) for soil samples collected in spring 2007 at
the site 2.
77
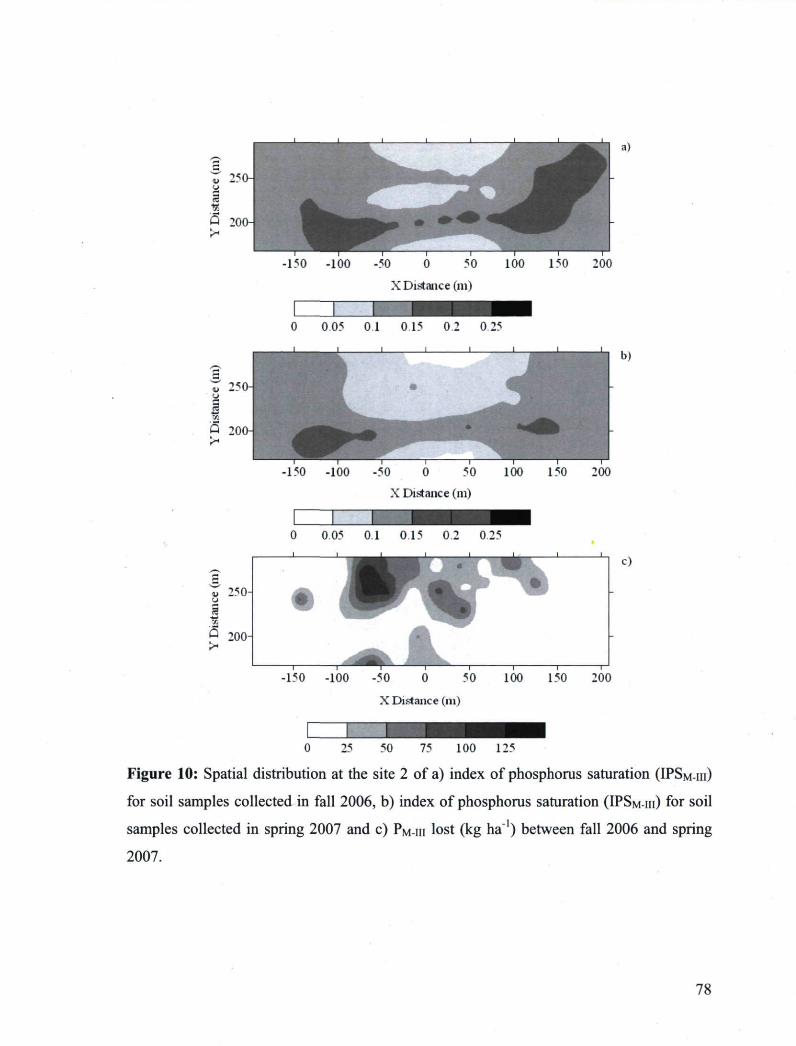
-150 -100 -50 0 50 X Distance (m)
n)
100 150 200
0 0.05 0.1 015 02 0.25
-150 -100 -50 0 50 100 150 200 X Distance (m)
0 0.05 0.1 0.15 0.2 0.25
r
c)
-150 -100 -50 0 50 100 150 200 X Distance (m)
0 25 50 75 100 125
Figure 10: Spatial distribution at the site 2 of a) index of phosphorus saturation (IPSM-III)
for soil samples collected in fall 2006, b) index of phosphorus saturation (IPSM-III) for soil
samples collected in spring 2007 and c) PM-III lost (kg ha"1) between fall 2006 and spring
2007.
78
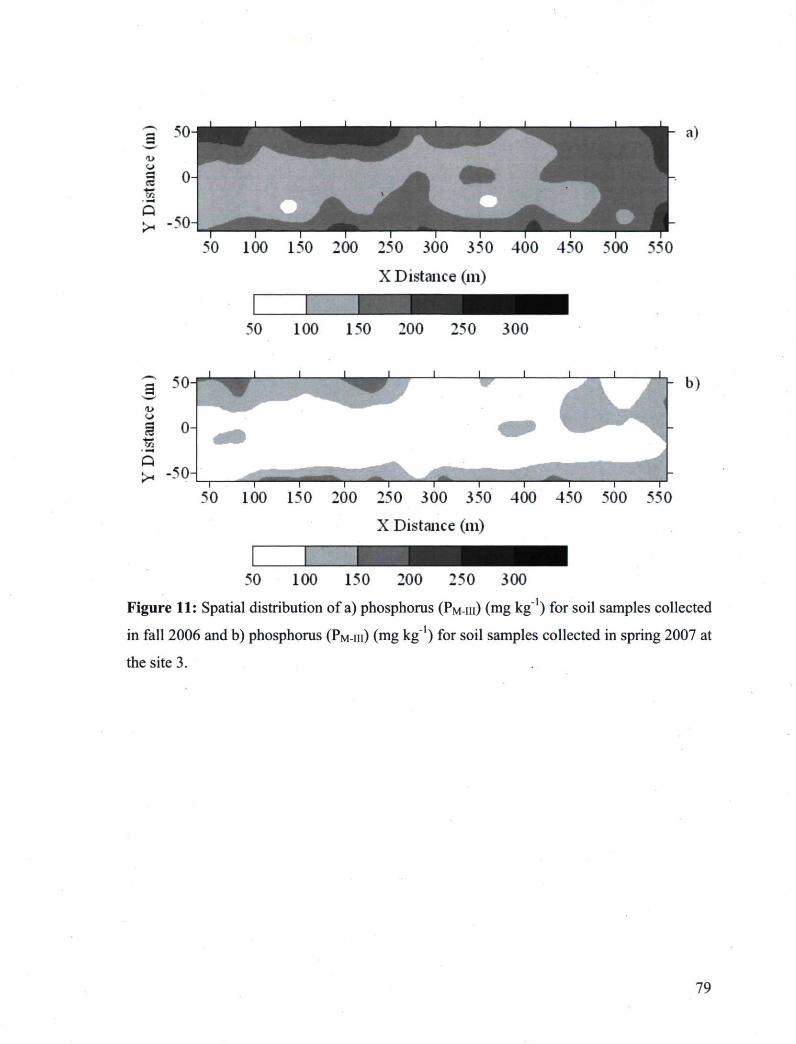
a 50 ■m>
CZ
"S3
50
a)
100 150 200 250 300 350 400 450 500 550 X Distance (m)
50 100 150 200 250 300
b)
100 150 200 250 300 350 400 450 500 550
X Distance (m)
50 100 150 200 250 300
Figure 11: Spatial distribution of a) phosphorus (PM-III) (mg kg"1) for soil samples collected
in fall 2006 and b) phosphorus (PM-III) (mg kg"1) for soil samples collected in spring 2007 at
the site 3.
79
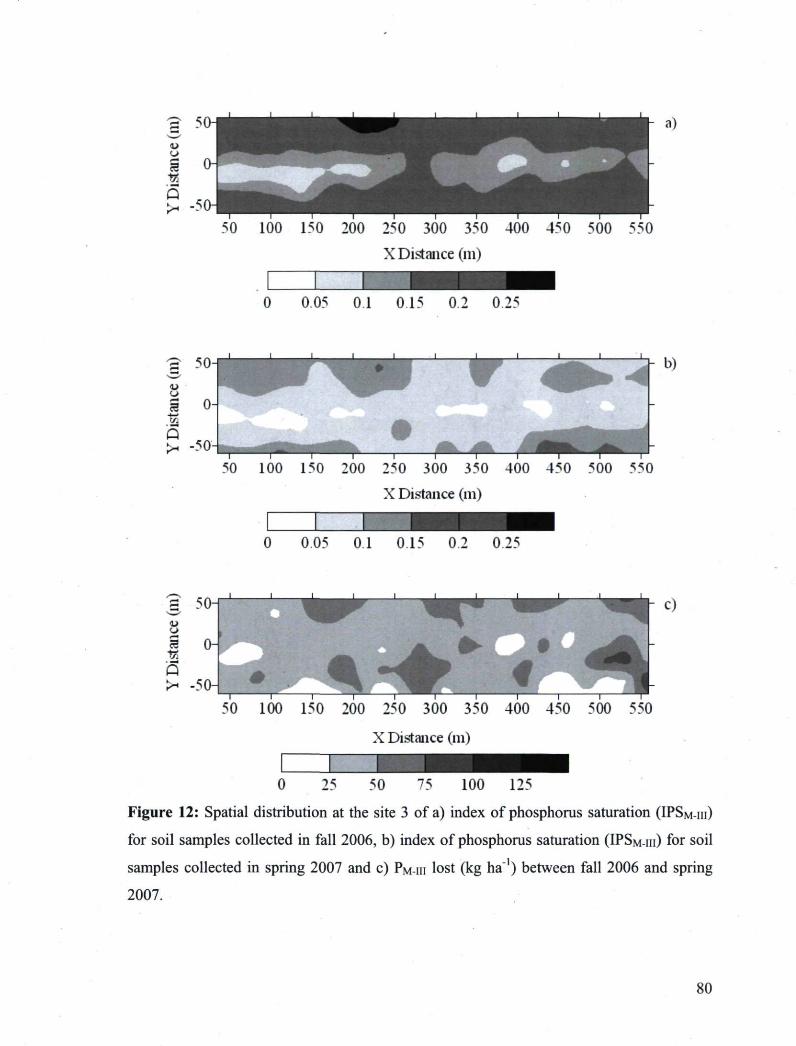
I ij^HM CU
. .
a)
50 100 150 200 250 300 350 400 450 500 550 X Distance (m)
0 0.05 0.1 0.15 0.2 0.25
b)
100 150 200 250 300 350 400 450 500 550 X Distance (m)
0 0.05 0.1 0.15 0.2 0.25
^ ^ am —,
S 50-u •mf
3 >H -50
J L
{ ; ■ . % 50 100 150 200 250 300 350 400 450 500 550
X Distance (in)
0 25 50 75 100 125
Figure 12: Spatial distribution at the site 3 of a) index of phosphorus saturation (IPSM-III)
for soil samples collected in fall 2006, b) index of phosphorus saturation (IPSM-III) for soil
samples collected in spring 2007 and c) PM-III lost (kg ha"1) between fall 2006 and spring
2007.
80
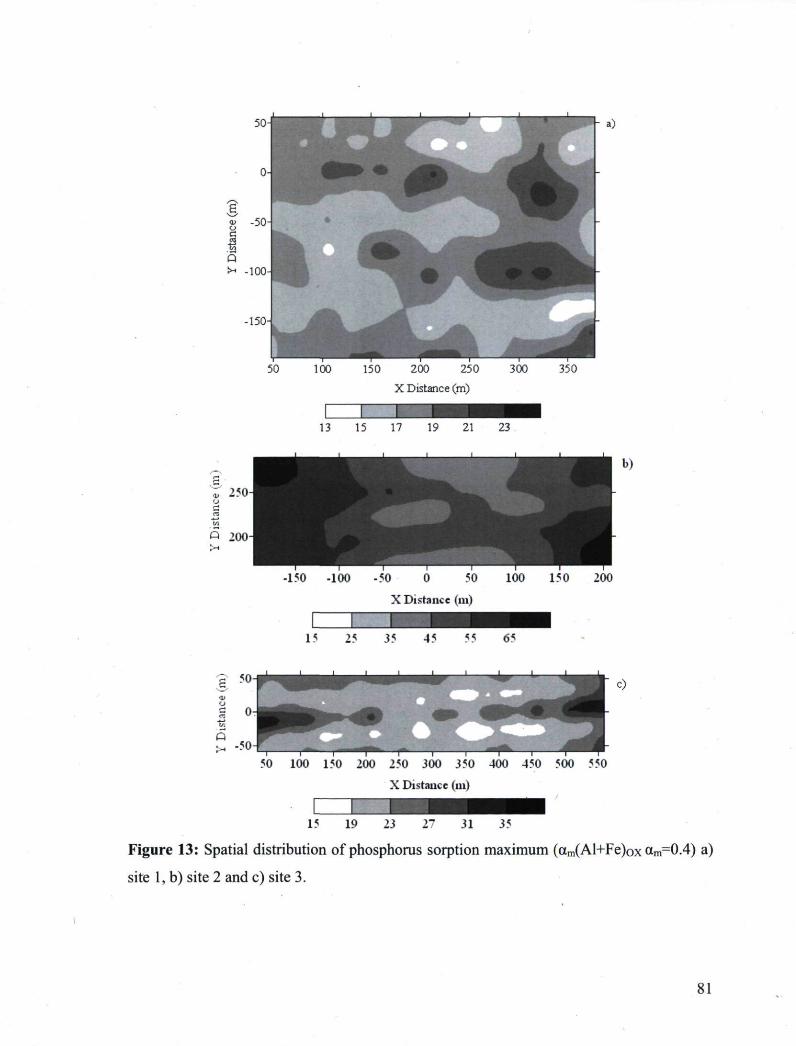
50
rv - 5 0
J i-
P "
a)
150 200 250 X Distance (m)
300 350
1 B 13 15 17 19 21 23
-150 -100 -50 0 50 100 150 200 X Distance (in)
15 25 35 45 55 65
3
50 100 150 200 250 300 350 400 450 500 550 X Distance (ni)
15 19 15 11 31 55
Figure 13: Spatial distribution of phosphorus sorption maximum (am(Al+Fe)ox am=0.4) a) site 1, b) site 2 and c) site 3.
81
Chapitre 6 PUBLICATION SCIENTIFIQUE NO 3 DE
LA THESE : Phosphorus fertilization of vegetable crops
grown in Québec organic soils.
6. Fertilisation phosphatée des cultures maraîchères cultivées en sols organiques du Québec
6.1 Avant-propos
Le sixième chapitre porte sur la fertilisation phosphatée des cultures maraîchères cultivées
en sols organiques du Québec. Ce chapite sera soumis à la revue Agriculture, Ecosystems
and Environment :
Guérin J.É., L.É. Parent, and A. Pellerin. Phosphorus fertilization of vegetable crops
grown in Québec organic soils.
83

6.2 Résumé
Plusieurs productions maraîchères sont cultivées en sols organiques dans le sud-ouest du
Québec, Canada. En Amérique du Nord, plusieurs cours d'eau environnant les sols
organiques cultivés montrent un niveau élevé en P attribué à un bilan de P déséquilibré
dans les sols organiques cultivés. Un niveau critique de saturation en P (ISPM-III) a été
déterminé pour réduire l'impact environnemental du P en sols organiques. Un concept
agroenvironnemental doit être développé pour concilier les patrons de réponse de la culture
et les préoccupations environnementales. L'objectif de cette étude était d'évaluer le dosage
agroenvironnemental du P pour la carotte, le céleri, le chou-chinois, la laitue, l'onion et la
pomme de terre cultivés en sols organiques pour accompagner les producteurs dans la
réduction de la pollution diffuse. Entre 2002 et 2005, 66 sites d'essais de fertilisation ont
été implantés pour déterminer la réponse des différentes cultures à l'ajout de P et les
exportations de P par la culture. Cinq classes de fertilité ont été définie par le rapport
molaire [P/(Al+7Fe)]M-ni (faible: 0,00-0,05; medium: 0,05-0,10; élevée: 0,10-0,15; très
élevée: 0,15-0,25; et excessivement élevée: > 0,25). La probabilité de réponse à l'intérieur
des classes de fertilité de sol a été évaluée à l'aide d'un test de puissance. Les tests de
puissance et les courbes de réponses de la culture à la fertilisation phosphatée n'ont
démontré aucune réponse significative des cultures à l'ajout de P sauf dans la classe de
fertilité 0,05-0,10. La fertilisation en P a été proposée dans la classe de fertilité faible (0,00-
0,05) et moyenne (0,05-0,10). Pour les classes de fertilité au-dessus de 0,10 l'application de
P pourrait être substantiellement réduite sans affecter le rendement et la qualité des
cultures.
6.3 Abstract
Vegetable crops are the main crops grown in organic soils of southwestern Quebec,
Canada. In organic soil areas of North America, many watercourses show high P levels due
to considerably imbalanced farm P budgets. A critical Mehlich-III P saturation level (IPSM-
m) has been determined in a previous study for environmental impact and response to P of
vegetable crops in organic soils. An agri-environmental concept must be developed to
address simultaneously the P response patterns of vegetable crops and environmental
84

concerns. Our aim was to evaluate the P agri-environmental dosage for carrots, celery,
Chinese cabbage, lettuces, onions, potatoes grown in organic soils to assist decisions on
reducing substantially off-farm P pollution. Between 2002 and 2005, we conducted 66 field
trials to determine crop response to added P and P removal by the crops. Environmental
(IPSM-III value of 0.05) and agronomic thresholds were the benchmarks to initiate soil
fertility classification and assess vegetable crop P requirements. Five soil fertility classes
were defined from the [P/(Al-H/Fe)]M-in ratio (low: 0.00-0.05; medium: 0.05-0.10; high:
0.10-0.15; very high: 0.15-0.25; and excessively high: > 0.25). The response probability
within each soil fertility class was computed using a power test. The power tests and crop
response curves showed no significant crop response to added P except in the 0.05-0.10
fertility class. The P fertilisation has been proposed for low (0.00-0.05) and medium (0.05-
0.10) soil fertility classes. For soil fertility classes above 0.10, P application could be
reduced substantially without affecting crop yield and quality.
6.4 Introduction
Histosols are productive soils for vegetable growing. However, they largely contributed to
the eutrophication of watercourses (Hortenstine and Forbes, 1972; Miller, 1979; Porter and
Sanchez, 1992) due to excessive P fertilization over the years (Simoneau, 1996). Soil P
reserves can increase steadily despite the P removal by vegetable crops or P loss by
leaching (Minotti and Stone, 1988). Current fertilization guidelines generated imbalanced P
budgets (added P as fertilizer largely exceeding the P exported by the harvested portion of
the crop), leading to P accumulation in soils and P loss to surface waters. Guérin et al.
(Chapter 5) indicated the contribution of Quebec cultivated organic soils to the
eutrophication of water with P loss averaged 41 kg PM-III ha"1 between fall and following
spring. The sustainable P management in cultivated organic soils must take into account the
environmental impacts of the P fertilization (Parent and Ilnicki, 2003).
The soil test P (STP) solutions commonly used in organic soils to determine crop P
requirements are Bray 1 (Lucas, 1982), water (Sanchez, 1990) and Mehlich III (M-III)
(Mehlich, 1984) in Michigan, Florida and Québec, respectively. The M-III method
appeared to be more efficient compared to the Bray 1 method for extracting the P in soils
85
high in C and Fe (Michaelson et al., 1987). Guérin et al. (2007) derived agri-environmental
thresholds using a M-III soil P saturation index (IPSM-III = [P/(AH7Fe]M-in, Y = 5) for
vegetables grown in Québec Histosols. Environmental (IPSM-III = 0.05) and agronomic
thresholds were combined to develop an agri-environmental classification model for
vegetable crops. However, no P management was proposed for such classification to abate
eutrophication.
Earlier fertilization trials showed little or no response of vegetable crops to added P in
organic soils (Hamilton and Bernier, 1975; Minotti and Stone, 1988). Duxburry and
Peverly (1978) suggested a substantial reduction in P addition or to skip temporarily the P
fertilization without affecting crop yield to reduce off-farm pollution by excess P. Repeated
applications of fertilizer can also affect the marketable yield and quality of vegetable crop
(Jasmin et a l , 1964) and lead to P accumulation in soils (Minotti and Stone, 1988). Some
studies had reported that P accumulation in the soil could suppress yield of potatos (Hill
and Browne, 1955 cited in Jasmin et a l , 1964).
Soil calibration studies are useful to separate nutrient deficiency from sufficiency and to
assess fertilizer requirements in deficiency situation (Evans, 1987). We need a control plot
and one or more fertilizer treatments up to more than enough to obtain maximum yield
(Dahnke and Olson, 1990). A critical response threshold can be established from the
relationship between relative yield (RY) and soil test value (Nelson and Anderson, 1984).
The RY is thought to standardize the variable yield levels among sites and years (Withney
et a l , 1985). Economic optimum rates of P-fertilizer are obtained from response curves
after plotting marketable yield against P rate (kg P ha"1). Response curves generally follow
plateau, linear, linear or quadratic-plateau or polynomial trends. The response model must
describe objectively the crop response to avoid over-fertilization, often encountered with
the quadratic model (Dahnke and Olson, 1990). The economic rates can be computed as
the first derivative (dy/dx) after accounting for the fertilizer cost to product price ratio,
where v is yield in kg ha"1 and x is fertilizer rate in kg P ha"1 (Nelson et a l , 1985).
86
Traditionally, fertilizer requirement models are interpreted following buildup and
maintenance, nutrient sufficiency, and nutrient budget concepts (Black, 1993). The nutrient
sufficiency concept is based on crop response probability to added nutrients (Fitts, 1955).
Soils are classified according to STP into fertility groups of low, medium, and high P
concentrations. In groups with low P concentrations, the probability of an economic yield
response to applied P is moderate to high (Sims et a l , 2002). In soils with medium P
concentrations, there is a low probability of an economic yield response to applied P and P
applications are rarely recommended (Sims et a l , 2002). In soils with high P
concentrations, a response is rarely expected and no P should be applied (Sims et a l , 2002).
The P application is not motivated as long as soil P concentration enables to satisfy crop
needs without affecting yield or crop quality (Whitney et a l , 1985). Fertilizer requirement
models can be also constrained by environmental limits (Khiari et a l , 2000; Sims et a l ,
2002).
The aim of this study was to develop a P management model to mitigate the eutrophication
of surface waters in vegetable growing organic soil areas by examining the P budget near
the environnement threshold. We conducted P fertilizer trials across soil fertility classes
defined by agri-environmental thresholds. We computed the power of fertilization in each
soil class and the amount of exportated P by the harvested portion of the crop. Added P
should not exceed exported P above IPSM-III environmental threshold of 0.05.
6.5 Materials and method
6.5.1 Fertilizer trials
Fertilizer P trials were conducted on 66 commercial sites between 2002 and 2005 in organic
soils of southwestern Quebec, Canada, to build a P requirement model. The vegetable crops
were carrot (Daucus carota L.), celery (Apium graveolens L.), potato (Solanum tuberosum
L.), onion (Allium cepa L.), lettuce (leaf, romaine and crisphead) (Latuca sativa L.), and
Chinese cabbage (Brassica rapa var. pekinensis). To validate the P requirement model, 15
additional fertilizer trials were carried out in 2006. Fertilizer trials are described in Table 7.
The vegetable crop varieties were those used commonly by the producers.
87
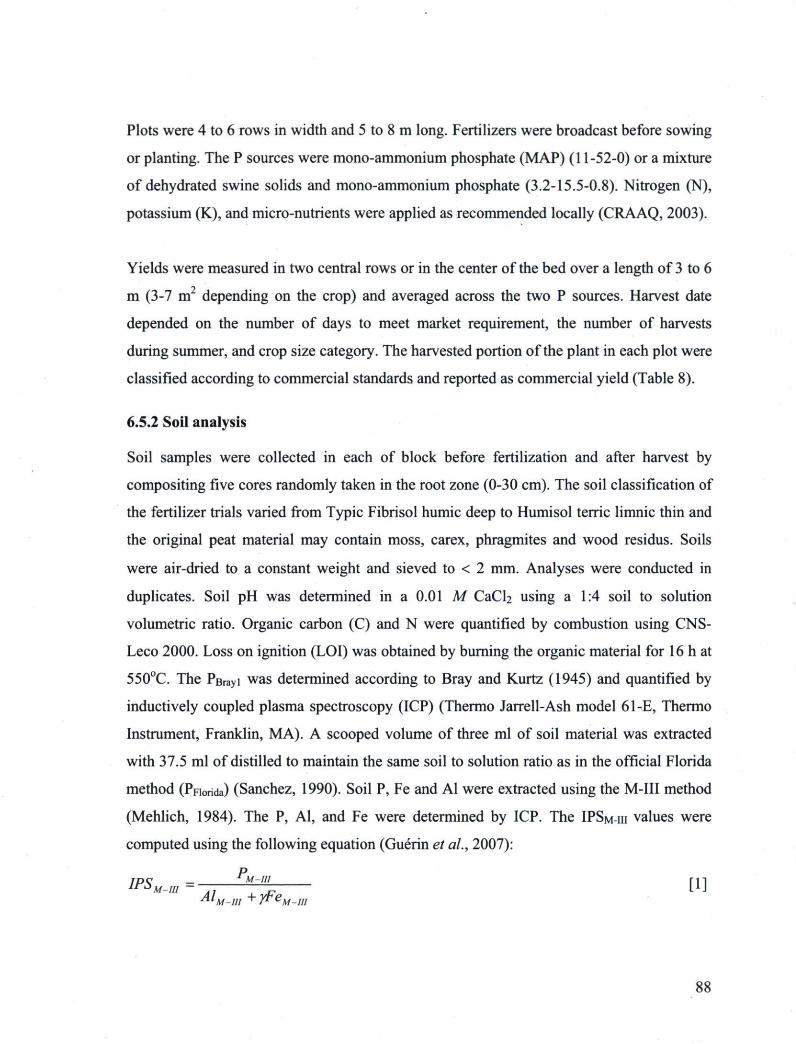
Plots were 4 to 6 rows in width and 5 to 8 m long. Fertilizers were broadcast before sowing
or planting. The P sources were mono-ammonium phosphate (MAP) (11-52-0) or a mixture
of dehydrated swine solids and mono-ammonium phosphate (3.2-15.5-0.8). Nitrogen (N),
potassium (K), and micro-nutrients were applied as recommended locally (CRAAQ, 2003).
Yields were measured in two central rows or in the center of the bed over a length of 3 to 6
m (3-7 m2 depending on the crop) and averaged across the two P sources. Harvest date
depended on the number of days to meet market requirement, the number of harvests
during summer, and crop size category. The harvested portion of the plant in each plot were
classified according to commercial standards and reported as commercial yield (Table 8).
6.5.2 Soil analysis
Soil samples were collected in each of block before fertilization and after harvest by
compositing five cores randomly taken in the root zone (0-30 cm). The soil classification of
the fertilizer trials varied from Typic Fibrisol humic deep to Humisol ferric limnic thin and
the original peat material may contain moss, carex, phragmites and wood résidus. Soils
were air-dried to a constant weight and sieved to < 2 mm. Analyses were conducted in
duplicates. Soil pH was determined in a 0.01 M CaCk using a 1:4 soil to solution
volumetric ratio. Organic carbon (C) and N were quantified by combustion using CNS-
Leco 2000. Loss on ignition (LOI) was obtained by burning the organic material for 16 h at
550°C. The PBrayi was determined according to Bray and Kurtz (1945) and quantified by
inductively coupled plasma spectroscopy (ICP) (Thermo Jarrell-Ash model 61-E, Thermo
Instrument, Franklin, MA). A scooped volume of three ml of soil material was extracted
with 37.5 ml of distilled to maintain the same soil to solution ratio as in the official Florida
method (PFiorida) (Sanchez, 1990). Soil P, Fe and Al were extracted using the M-III method
(Mehlich, 1984). The P, Al, and Fe were determined by ICP. The IPSM-III values were
computed using the following equation (Guérin et a l , 2007):
IPSM m = 5tS [1] Al + vFe ' n l M - I I I T I 1 K M - I I I
88
Where PM-III, AIM-III and FeM-m are in mmol kg"1 and y is a weighting factor for Fe (y = 5)
correcting for the low extraction capacity of M-III for Fe (Guérin et a l , 2007).
6.5.3 Plant biomass analysis
Five plants representative of each crop were randomly collected in each plot. About 500 g
of sub-samples of the harvested portion of the crop were oven-dried at 70°C for 24 to 36 h
and ground to < 2 mm. Total P was determined after micro-wave digestion in a perchloric-
nitric acid solution (Barnhisel and Bertsch, 1982). Total P exported by the harvested
portion of the crop (kg P ha"1) was calculated as P concentration in biomass (kg Mg"1) X
total biomass (Mg ha"1). Exported P by megagram of marketable yield (kg Mg"1) was
computed as exported P (kg ha"1) divided by marketable yield (Mg ha"1).
6.5.4 Statistical methods
The experimental design for analyses of variance (ANOVA) was a split-plot design with
whole plots arranged in a randomized complete-block design with three repetitions (Laird
and Cady, 1969). Phosphorus trials were randomly assigned to whole plot (main plot) and
the P treatments were randomly assigned to split-plot (subplot) within each whole plot.
Each main plot comprised 4 to 9 subplots depending of the vegetable crop and year.
ANOVA were conducted on crop marketable yields using the mixed and GLM procedures
SAS software version 8.0 for Windows (SAS Institute Inc., Cary NC). We used a combined
ANOVA for data from same both vegetable crop and year in order to test treatment X site
interaction and the treatment main effects averaged over all sites and years (Nelson et a l ,
1985). The variance homogeneity had been verified with graphical residual analysis. A
covariance analysis (ANCOVA) using plant density at harvest was performed to decrease
experimental error and improve determination coefficient. The RY were calculated as yield
in the control (minus P) treatment divided by maximum yield among P treatments (Nelson
and Anderson, 1984). A power test (Baillargeon and Rainville, 1977; Hair et a l , 1995) was
computed the probability of making a good decision to apply P. The mean of RY values in
a given fertility class was compared to the expected mean of 100% to compute type II (P)
error and power test (1- P). The power test must be high (> 0.80) to significantly reject the
null hypothesis (Hair et a l , 1995).
89

6.6 Results and discussion
6.6.1 Soil properties
In spring before fertilization, soil pH varied from 4.7 to 6.0, loss on ignition from 152 to
522 g kg"1, PM-III from 146 to 494 mg kg"1, AlM-ni from 0 to 819 mg kg"1, FeM-in from 534 to
920 mg kg"1, and IPSM-m from 0.09 to 0.21 (Table 9). In the fall, PM-m ranged from 126 to
473 mg kg"1, AIM-III from 8 to 623 mg kg"1, FeM-m from 507 to 906 mg kg"1, and IPSM-III
from 0.09 to 0.17. Thus, the P requirement models covered a large spectrum of soil
characteristics. Between spring and the fall, average PM-III dropped from 305 mg kg"1 to 287
mg kg"1, IPSM-III decreased from 0.13 to 0.12, and (Al+5Fe)M-m mmol kg"1 remained fairly
constant. The drop of 16 kg PM-III ha"1 between spring and fall in the control treatment is
attributable primarily to P uptake by the crop.
6.6.2 Phosphorus requirements
Crop response to added phosphorus
Site effect was generally significant (P < 0.05) on crop yield while P treatment effect was
occasionally significant (Table 10). The combined ANOVA for data from same both
vegetable crops and year showed the site by treatment interaction was not significant except
for the potato crop in 2004 (P < 0.05) and there was no significant effect of crop species
and crop by fertility class interaction. Hence, crop response patterns were combined.
Between 2002 and 2005, marketable yields averaged 46.8, 51.9, 52.5, 39.1, 63.0, and 41.7
Mg ha"1 for carrot (Table 11), Chinese cabbage (Table 12), onion (Table 13), potato (Table
14), celery (Table 15), and lettuce (Table 16), respectively. In 2006, marketable yields
averaged 44.7, 39.2, 53.8, 52.4, 44.0, and 33.7 Mg ha"1 carrot, Chinese cabbage, onion,
potato, celery, and lettuce, respectively. The P removal by the harvested portion of the crop
averaged 25.3, 22.8, 26.2, 30.1, and 14.8 kg P ha"1 for carrot, Chinese cabbage, onion,
potato, celery, and lettuce, respectively. There was no significant effect of P treatment on
biomass P concentration (P > 0.91 for carrot; P > 0.97 for Chinese cabbage; P > 0.28 for
onion; P > 0.10 for potato; P > 0.73 for celery; P > 0.95 for lettuce). The P treatment by
crop interaction effect was not significant (P > 0.07). In other experiments, P applications
90

did not increase the P concentration in lettuce tissues (Parups and Goodwin-Wilson, 1952)
and potato leaves (Jasmin et a l , 1964) while the fertilizer applications increased P plant
uptake in onion bulbs (Minotti and Stone, 1988). Phosphorus exportation values (kg P per
ton of fresh matter) of the current Quebec guidelines are presented at Fig. 14 for
comparision (CRAAQ, 2003).
Previous soil test calibration studies for crop P response to added P against IPSM-III
indicated an environmental threshold of 0.05 and agronomic thresholds of 0.10 and 0.15 as
benchmarks for establishing soil fertility classes (Guérin et a l , 2007). The IPSM-III values
above environmental threshold are considered at environmental risk (Gartley and Sims,
1994). Using an approach similar to Cope and Rouse (1983), we subdivided the dataset into
five IPSM-III classes as follow: low: 0.00-0.05; medium: 0.05-0.10; high: 0.10-0.15; very-
high: 0.15-0.25; excessively-high > 0.25. For sites in each soil class, we averaged the IPSM-
III, marketable yields, yield gain with added P, and the P exported by the harvested
proportion of the crop (Table 17). There was a slight but not significant increase of 0.5 to
3.9 % in marketable yields in response to added P (Table 17). The P exported by the
harvested crop ranged from 19 to 29.3 kg P ha"1 through soil class fertilities. The power of
crop response to added P (i.e. good decision to apply P) exceeded 0.80 only in the 0.05-
0.10 soil fertility class (Table 17). Despite small increase of marketable yields in response
to added P, there were non significant responses to added P across sites (Fig. 15a).
Validation data in 2006 showed power less than 0.80 (Table 18), indicating little or no crop
response to added P (Fig. 15b). The absence of effect from P fertilization on crop yields is
attributable to the high STP at most sites. Even at low P saturation (< 0.05), the crops did
not respond significantly to the P fertilization (Table 17). However, only 5 on 81
experimental sites were in the low P saturation group below environmental threshold.
In absence of crop response, a nutrient sufficiency concept can be applied considering that
added P should not exceed P removal from field above the environmental threshold (Khiari
et a l , 2000; Pellerin et a l , 2006b) and that applied P depends on how far STP is below the
critical agronomic level (Sanchez and Burdine, 1988). Fertilizer trials showed no response
91

to P in organic soils even after 4 yr of cropping without P fertilization in potato (Jasmin et
a l , 1964), onion (Hamilton and Bernier, 1975; Minotti and Stone, 1988), celery, lettuce and
carrot production (Hamilton and Bernier, 1975). Duxbury and Peverly (1978) also
suggested to reduce substantially or even omit P additions to vegetables in organic soils
without productivity loss.
Guidelines for phosphorus recommendations by soil fertility class
An agri-environmental concept was built to assist decisions on reducing off-farm P
pollution. For the low soil fertility class (0.00-0.05), the P requirement could be P removal
(30 kg P ha"1) with an additional P supply to reach 0.05.
Crops were responsive to phosphorus fertilization in the medium soil fertility class (0.05-
0.10) as shown by power test. As a result, the vegetable crops could be fertilized using a
starter fertilizer at rates not exceeding P removal (25 kg P ha"1) to drive STP toward the
environmental threshold.
The vegetable crop did not respond to added P above the IPSM-III value of 0.10 as shown by
power test < 0.80 (Table 17). For the high (0.10-0.15), very-high (0.15-0.25) and
extremely-high (> 0.25) soil P fertility classes, there was no crop response to added P. Soil
P reserve alone appeared to be sufficient to sustain vegetable growth without agronomic
loss. As a measure against P. accumulation and off farm P pollution, no P fetilizer or a pop
up P application at seeding or planting could be recommended until the IPSM-III value
decreases below 0.10.
For low STP, where the P-fertilizer recommendations averaged 85, 170, and 53 kg P ha"1
across vegetable crops for Michigan, Florida, and Quebec, respectively (Table 19). The
conversion equation among soil tests used in Florida (Sanchez, 1990) and Québec
(CRAAQ, 2003) was obtained for scooped soil (mg L"1) as follows:
PM_m = 2.5PFlorida , r2 = 0.52 [2]
The relationship between PM-III and Psrayi for scooped soil (mg L"1) found by Guérin et al.
(2007) was as follows:
92
PM.1I1=Y56PBray,,r2 = 0 M [3]
In our trials, P-fertilizer requirements for vegetable crops did not exceed 30 kg P ha *
according to the nutrient sufficiency concept. Therefore, P-fertilizer recommendations
should be revisited since current fertilization guidelines recommend P fertilization rates
largely exceeding the P exported by the harvested portion of the plant, possibly leading to P
accumulation in soils and P loss to surface waters.
6.7 Conclusion
Environmental and agronomic thresholds and P removal by the harvested portion of the
plant were combined to assess P requirements for vegetable crops in Quebec organic soils.
The models were implemented using the critical environmental IPSM-in, of 0.05 and the
critical agronomic IPSM-III, of 0.10 and 0.15 to establish the following five soil fertility
classes: low: 0.00-0.05; medium: 0.05-0.10; high: 0.10-0.15; very-high: 0.15-0.25;
excessively-high: > 0.25. Power tests and crop response curves showed that STP in organic
soils were at such a high level that the application of P fertilizer can be omitted in the soil
fertility classes above IPSM-III 0.10. The P fertilization has been proposed only for low
(0.00-0.05) and medium (0.05-0.10) soil fertility classes. The crops remained productive
without P fertilization and exported up to 30 kg P ha"1. These results showed that vegetable
growers can decrease substantially their P inputs with no yield loss. Hence, the P
recommendation guidelines for the fertilization of vegetable crops in organic soils must be
revisited to avoid soil P accumulation leading to the eutrophication of surface waters.
However, a long term study fertilization must be conducted to measure the impacts of
reduced P additions on water quality of the watercourses and groundwater draining
cultivated organic soils.
6.8 Acknowledgements
We thank the Conseil de Recherches en Pêche et Agroalimentaire du Québec (CORPAQ
603025), the Conseil pour le Développement de l'Agriculture du Québec (CDAQ 2124),
and the Natural Sciences and Engineering Research Council of Canada (NSERC CRDPJ
305166-03 and (NSERC DG 2254) for financial support. The senior author received a
93
fellowship from Technique Gazon Inc. (LaSalle, QC). Thanks are extended to the
participating vegetable growers and to Samuel Comtois, Maxime Paré, César Chléla, Eric
Thibault, Annie Pellerin, Nicolas Samson, Geneviève Roux, Jimmy Planche, Marie-Hélène
Lamontagne, and Rahima Abdelhafid for field and laboratory support.
6.9 References
Baillargeon, G, Rainville, J., 1977. Applied statistics. Statistical tests, regression and
correlation. Tome 2. Les Editions SGM, Trois-Rivières (Qc), Canada. [In French]
Barnhisel, R., Bertsch, P.M., 1982. Digestion with perchloric-nitric acids. In: Page, A.L.
(Ed.), Methods of soil analysis. Agronomy No 9, Part 2. Am. Soc. Agron., Madison,
Wl. pp. 279-280.
Black, C.A., 1993. Soil fertility evaluation and control. Lewis Publication, Boca Raton, FL.
746 pp.
Bray, R.H., Kurtz, L.T., 1945. Determination of total, organic, and available forms of
phosphorus in soils. Soil Sci. 59, 39-45.
Cope, J.T., Rouse, R.D., 1983. Interpretation of soil test result. In: Walsh, L.M., Beaton,
J.D. (Eds.), Soil testing and plant analysis, ed. rev. SSSA, Madison, Wl. pp. 35-54.
Dahnke, W.C., Olson, R.A., 1990. Soil test correlation, calibration and recommendation.
Duguet, F., Parent, L.E., Ndayegamiye, A., 2006. Compositional indices of net nitrification
in cultivated organic soils. Soil Sci. 171, 886-901.
Duxbury, J.M., Peverly, J.H., 1978. Nitrogen and phosphorus losses from organic soils. J.
Environ. Qual. 7, 566-570.
CRAAQ., 2003. Reference guide for crop fertilization. [In French] 1st Ed., Centre de
Référence en Agriculture et Agroalimentaire du Québec, Québec, Canada, 297 pp.
Evans, CE., 1987. Soil test calibration. SSSA Special Publication, Soil Sci. Soc. Ame. 21,
23-29.
Fitts, J.W., 1955. Using soil tests to predict a probable response from fertilizer application.
Better Crops, 39, 17-20,40-41.
Gartley, K.L., Sims, J.T., 1994. Phosphorus soil testing: environmental uses and
implications. Comm. Soil Sci. Plant Anal. 25, 1565-1582.
Guérin, J., L.E., Parent, Abdelhafid, R., 2007. Agri-environmental thresholds using mehlich
94

Ill soil phosphorus saturation index for vegetables in histosols. J. Environ.l Qual.
36,975-982.
Hamilton, H.A., Bernier, R., 1975. N-P-K fertilizer effects on yield, composition and
residues of lettuce, celery, carrot and onion grown on an organic soil in Quebec.
Can. J. Plant Sci., 55, 453-461.
Hair, J.F.Jr., Anderson, R.E., Tatham, R.L., Black, W.C., 1995. Multivariate data analysis
with readings. 4th ed. Prentice Hall, Upper Saddle River, NJ. 745 pp.
Hortenstine, C C , Forbes, R.B., 1972. Concentration of nitrogen, phosphorus, potassium,
and total soluble salts in soil solution samples from fertilized and unfertilized
Histosols. J. Environ. Qual. 1, 446-449.
Jasmin, J.J., Heeney, H.B., Tourchot, R., 1964. Potassium and phosphorus accumulation in
organic soil and their influence on potato crops. Can. J. Soil Sci. 44, 280-285.
Khiari, L., Parent, L.E., Pellerin, A., Alimi, A.R.A., Tremblay, C, Simard, R.R., Fortin, J.,
2000. An agri-environmental phosphorus saturation index for acid coarse-textured
soils. J. Environ. Qual. 29, 1561-1567.
Laird, R.J., Cady, F.B., 1969. Combined analysis of yield data from fertilizer experiments.
Agron. J. 61,829-834.
Lucas, R., 1982. Organic soils (Histosols). Formation, distribution, physical and chemical
properties and management for crop production. Res. Rep. 435, Agric. Exp. Sta. and
Coop. Ext. Serv., Michigan State Univ., East Lansing, and Agric. Exp. Sta., Inst.
Food Agric. Sci., Univ. Florida, Gainesville, FL, 79 pp.
Mehlich, A., 1984. Mehlich-3 soil test extractant: a modification of Mehlich-2 extractant.
Commun. Soil Sci. Plant Anal. 15, 1409-1416.
Michaelson, G.J., Ping, C.L., Mitchell, G.A., 1987. Correlation of Mehlich 3, Bray 1, and
ammonium acetate extractable P, K, Ca, and Mg for Alaska agricultural soils.
Commun. Soil Sci. Plant Anal. 18, 1003-1015.
Miller, M.H., 1979. Contribution of nitrogen and phosphorus to subsurface drainage water
from intensively cropped mineral and organic soils in Ontario. J. Environ. Qual. 8,
42-48.
Minotti, P.L., Stone, K.W., 1988. Consequences of not fertilizing onions on organic soils
with high soil test values. Commun. Soil Sci. Plant Anal. 19, 1887-1906.
95
Nelson, LA., Anderson, R.L., 1984. Partitioning of soil test-crop response probability. In:
Stelly, M. (Ed.), Soil testing: Correlating and interpreting the analytical results.
ASA Special Publication 29. ASA, Madison, Wl. pp. 19-38
Nelson, L.A., Voss, R.D., Pesek, J., 1985. Agronomic and statistical evaluation of fertilizer
response.
Parent, L.E., Ilnicki, P., 2003. Foreword in Parent, L.E., Ilnicki, P. (Eds.), Organic soils and
peat materials for sustainable agriculture. CRC Press, Boca Raton, FL, 205 pp.
Parups, E.V., Goodwin-Wilson, R., 1952. Nutrition of lettuce with nitrogen, phosphorus
and potassium on Organic soils in Ontario. Ame. Soc. Horticul. Sci. 71, 399-406.
Pellerin, A., Parent, L.E., Tremblay, C , Fortin, J., Tremblay, G, Landry, C.R., Khiari, L.,
2006. Agri-environmental models using Mehlich-III soil phosphorus saturation
index for corn in Quebec. Can. J. Soil Sci. 86, 897-910.
Porter, P.S., Sanchez, C.A., 1992. The effect of soil properties on phosphorus sorption by
Everglades Histosols. Soil Sci. 154, 387-398.
Sanchez, C.A., Burdine, H.W., 1988. Relationship between lettuce yield and soil-test
phosphorus and K levels. Soil and Crop Sci. Soc. Florida. 47, 52-56.
Sanchez, C.A., 1990. Soil-testing and fertilization recommendations for crop production on
organic soils in Florida. Techn. Bull. 876, Agric. Exp. Sta., Inst. Food Agric. Sci.,
Univ. Florida, Gainesville, FL, 44 pp.
Simoneau, M., 1996. Water quality of the Châteauguay river basin [In French]. Dir. Aquat.
Ecosyst., Québec Min. Environ. Fauna, Québec, Canada.
Sims, J.T., Maguire, R.O., Leytem, A.B., Gartley, K.L., Pautler, M.C, 2002. Evaluation of
Mehlich 3 as an agri-environmental soil phosphorus test for the Mid-Atlantic United
States of America. Soil Sci. Soc. Ame. J. 66, 2016-2032.
Vaillancourt, N., Parent, L.E., Buteau, P., Parent, V., Karam, A., 1999. Sorption of
ammonia and release of humic substances as related to selected peat properties.
Can. J. Soil Sci. 79,311-315.
Whitney, D.A., Cope, J.T., Welch, L.F., 1985. Prescribing soil and crop nutrient needs.
96
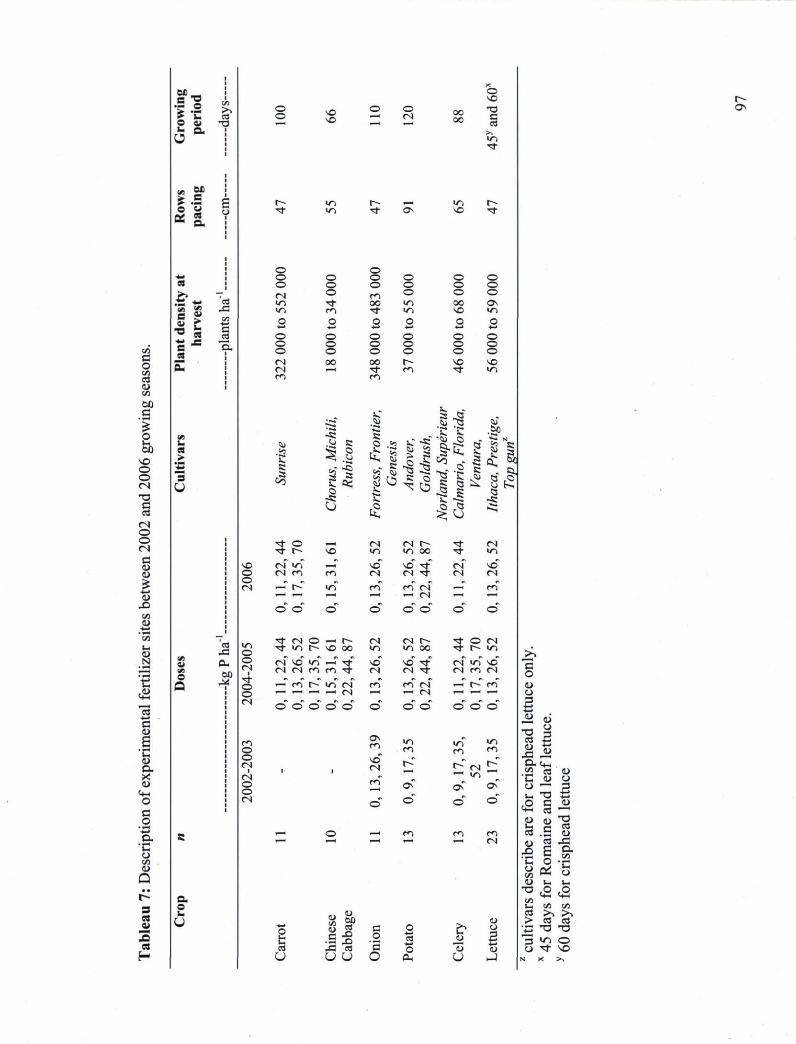
C O in c. OJ C/3
txO ■ S i 2 co o o CS
CM O
o c OJ
<u X > tu
Lu tu N
Cm ■ * »
c tu
i tu c X tu o G o Ou
•c CJ CA tu Q
. m
3 es
H
I l | ? C et» e o» a '— — O
«JJ gf> £ . S a y as g.
es
£ •mJ m .
S t u
es C
C
es
c
V) u es » •c U
Cm
SJ} r ^
a o u U
o o NC o o oc
oc
r» i n
o
1—
0 0 O O 0 0 0 0 O O 0 0 0 0 CM O t n 0 0 0 "JJ <* oc l / J 0 0 0 l j ^ r<J "3F i n vO i n
O O 0 0 O 0 r r r r r r r r
—• 0 O 0 O 0 0 0 O 0 O 0 0 0 O 0 O 0 0
rN ce 0 0 t u NO ^ 0 ( N r—I ^t c n ■ * i / j r<J r j
C l u . _s
eu ■S C K
c3
Tu
5
09 a C CJ
e CJ
S s
0=
e» •ur u . C 0
1 I
en
0 Andover
, G
old
rush
, .5 ■CD
S,
~C3
S S
?3
1 ,0"
C 5
2" ■SP •*— 83
1 s' C3 sR C lu. «fe s:
O £ 0 Q
l u as
5 O , , ( N <N r cr C J 5 r~ ^ C i / J i n oc "uf i r i
' . Z ( N m — SO vC
5 CN uO O ( N m m ( N r j 5 CM r N O m .
r r ,. „ r r s ~— » UTi r o r j r i — m
r — •—' ,—1 — 0 1 — —
O o o o
O o CM
1
o o CM
r<J O O ( N
i
o o rN
■ * ■ *
CM i n
O S r00
CM Ul
C J 0 0
cT O c j i / j
( N r N C J
l / J m
3 <* CM CM
3 *
( N l / J r j r N
~ f l f r m ( N CM
m m C M CM S t m
0 0 0 0 0
NO rN
o o O O O
l/J rri
i n
^ <N s
<G d d
r<J r N
g CCS
u
8 il guS
■3 ° . 3 es O U
C O
'3 O
o s o U
CJ
rJ
f »
tu
■a P
11 C D o — 1, T 3
, 0 C £ «> "2 |U r ra C3 . S tu
-O S 8" ^ Ss O k l I H
T3 .O .O CrH t+u
t/3 U l m . J .
Ç3 >% > . > ce) ea
•43 T3 T3
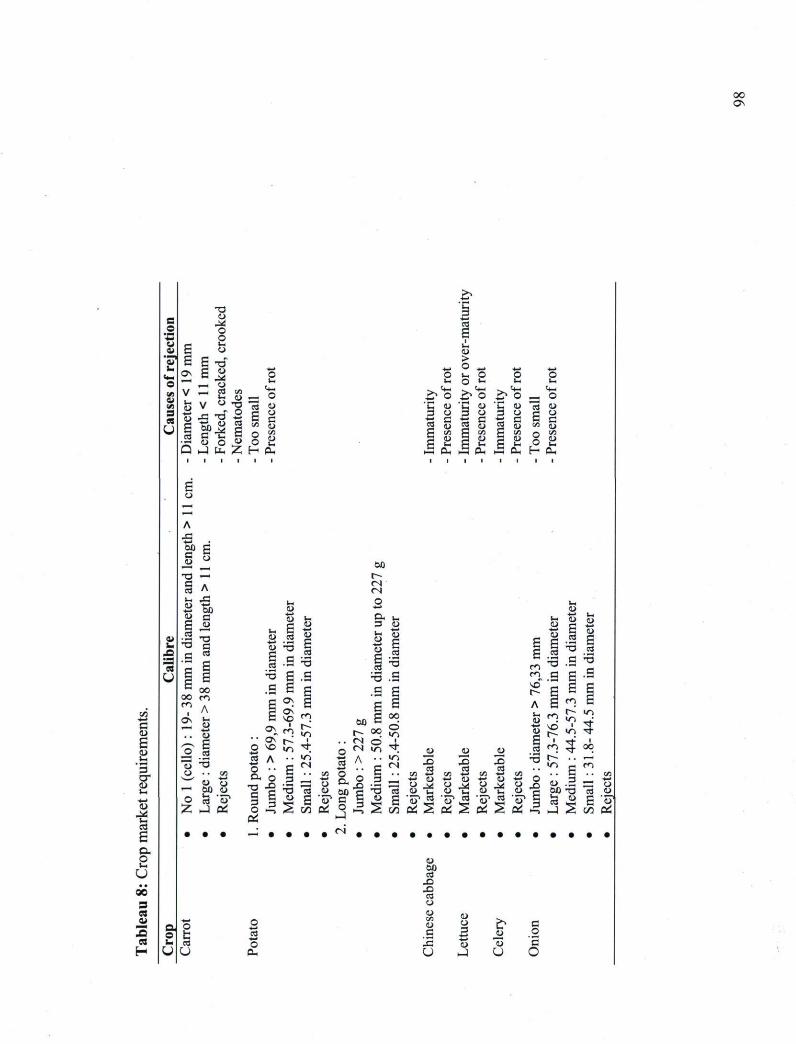
00 ON
G tu E CU u, '3 tu
tu
■g ca
o. 2 u ôo s es * 3 es H
Ul Nj .rr* r r* O U, O O O b O h U In
u CM . trr .. t+_, urr i J O j i ' O Î Î ' O r - O
§ S g 1 S ë •2 § ë s § .>
ZZ C — C H Cu H PH
o fc CS
u
rCN r N O
u B< «H u 3 u m J
U t . tu E
amet
e d
iam
K
amet
e d
iam
x amet
e d
iam
c 3 S
CJ
i 2 r? " . ^ g rn 4 oo
i n es etf es -• "^ C <^ B j M V B l V M ^ . . H . C f l
U ' C J U T C U * J C O ' U » 0 . ^ 3 "*"* o J2 O J2 U 3 U n U .S 3 O u ' B c g ' S u t o g M ' O B l o '5?u2 '5? u2 'â? u2 '«7 S e3 â g "5J ft!r,6!r?r<^^j2^ S PH S Oi S r*
CM
O —J r r o
Ou
CJ M es
X i O CS CJ CJ
CJ CJ
b c s ê o o s CJ CJ 'c u J u o
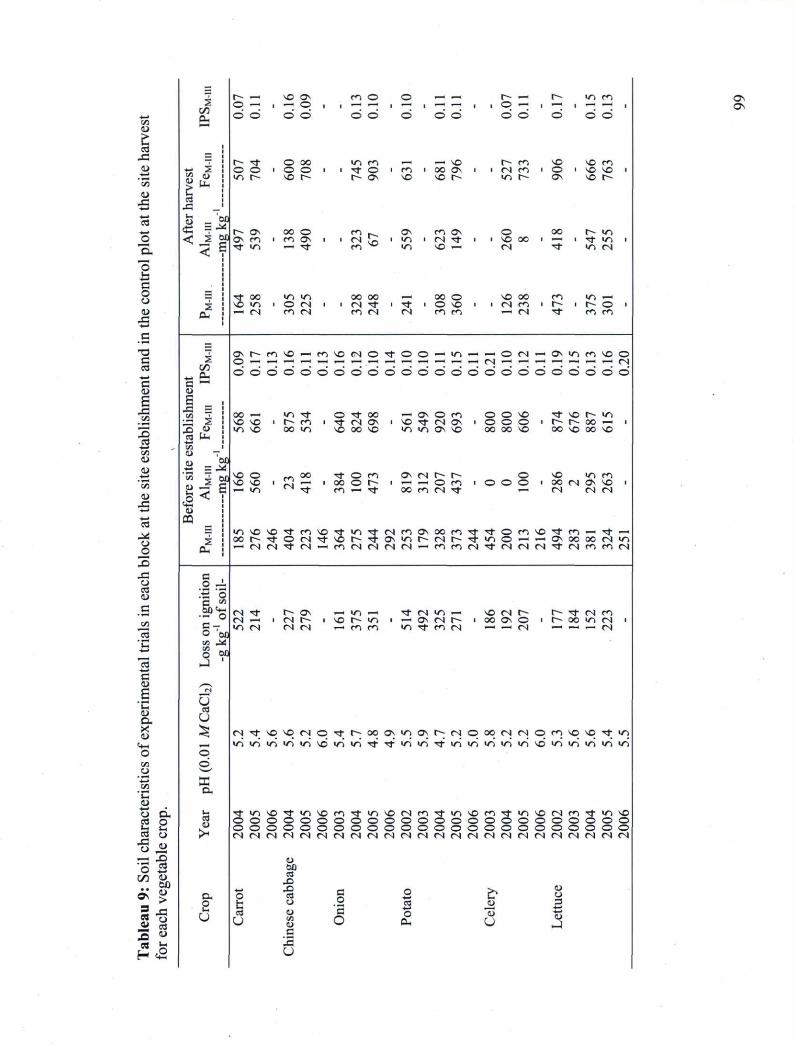
C/3
tu ca
rC
tu
ca ur
o. "ô iz c o o tu
C
2
—
r — i NO ON m O O l H r n r~ — r m m 2
— O m . | »—i O , , — — , —' ■ l H .—1 ,
i O i H , — , — ^ ^ i 2
— o d © d d d d d d d d d d ©
= r s o os i n m m NO f » m NO N O m s ié o o ■ o o ■ i t O i m i 0 O ON 1 , CM m i O i N O NO ■
m r N O r^ p O N N O NO r i n r ON N C r
es C S _ '« Jj
« ?■* i« O N 0 0 o rn N O
O N m O N O OO » i n
< * ? ON m i m ON ■ , CM
N O i i n i «N a ' , N C 0 0 i — l x t « n i
< * : t « n —■ x t m N O i n N O H CM " t i n CM
P x t oo «n i n 0 0 OC oo o NO oo m m
Pu, NO ■ n i o r N i , CM a , ^ ■ O NO ■ i CM m ■ r i f © ■
Pu, ( N m CM m CM CM m m CM x t m m
s 4. P H
ON r m NO <—i m NO CM o a O o —« i n o CM — ON i n m NO © s 4. P H
O . H H n H r—I — H — — r—I
— m—t r n H ^ H H CM — r n r n mm r n — H CM s
4. P H d o d d d d d d d d d d o d d d d d o d d d © ©
5 ~ o s J3 H M 3 0 0 m « n x t o x t OC m ON O m o o NO a NO r i n
r 3 S NO NO I t— m i t CM O , NO a CM ON l o o © ■ r r» OC — , 2 <u i n NO 0 0 i n N C OO N C i n i n ON NO oc CC NO 0 0 NO SO NO 2 <u
1> T t u
c _\ « = A u
m . . m . t PS i n
C N
oo ^r o rn O N CM r r O NO i n m w j — c t u S f
PS i n
C N i — , i 0 0 o r , m r n o m ' o o © l OO CM ON NO ■ w j — c
t u S f U | i n C N
^r C J ~ a oo m rs xt H CM CM CM
(S u CQ
5 «n NO NO "uf m N O xt m 5 <N m ON oo m t x t o m N O • x t m _ x t — i
tu 0 0 h " t O CM Tfr N O f » 5 ON i n r CM r— xt m o H H t M » 0 0 C M i n
tu ~
r M M • v t CM H m CM CM CM CM — i rn m rs a CM CM CM CT CM m m CM
G 2 S 'c ! c « i ■ S? S; 5
N r f r ON r — i n , — i xt CM > n H N O CM r t x t CM m ■ S? S; 5 C N | n l CM r i ND t i n , m ON r N r ■ OC ON O , M » m CM i
3 ■? •n CM CM CM >— m rr, i n a m r N —̂ >— CM m n H r r CM o c f t n . i 5 M r o «
J)
uJ
<N|
U es U *l CM ■a N O N O CM O xt »> 0 0 ON i n O N h N O OC CM CM o rn NO NO x t i n r i n v i m i n i n v o i n i n X * x t i n i n T f i n i n i n i n i n N O i n i n i n i c i i n O o
K o. u cS U
S i n N O x t i n N O m a i n N O CM m ^ T i n N O m ■ * i n N O < N m a >n NO u
cS U o o o o o o o o o O o o o o o o o © © © O O © © u cS U
o o o o o o o o o O o o o o o o o © © © o o © ©
u cS U
CN CM CM CM CM CM CM CM CM CM CM CM CM CM CM CM CM CM CM CM CM CM CM CM
O ao ta
O
D . O r O es C
O
"I O
o b > CJ
O u
U fc ta
O
O DO O
C O
"I O
o c
CJ tu 2
r J O
r J c r 3
U
ON GN
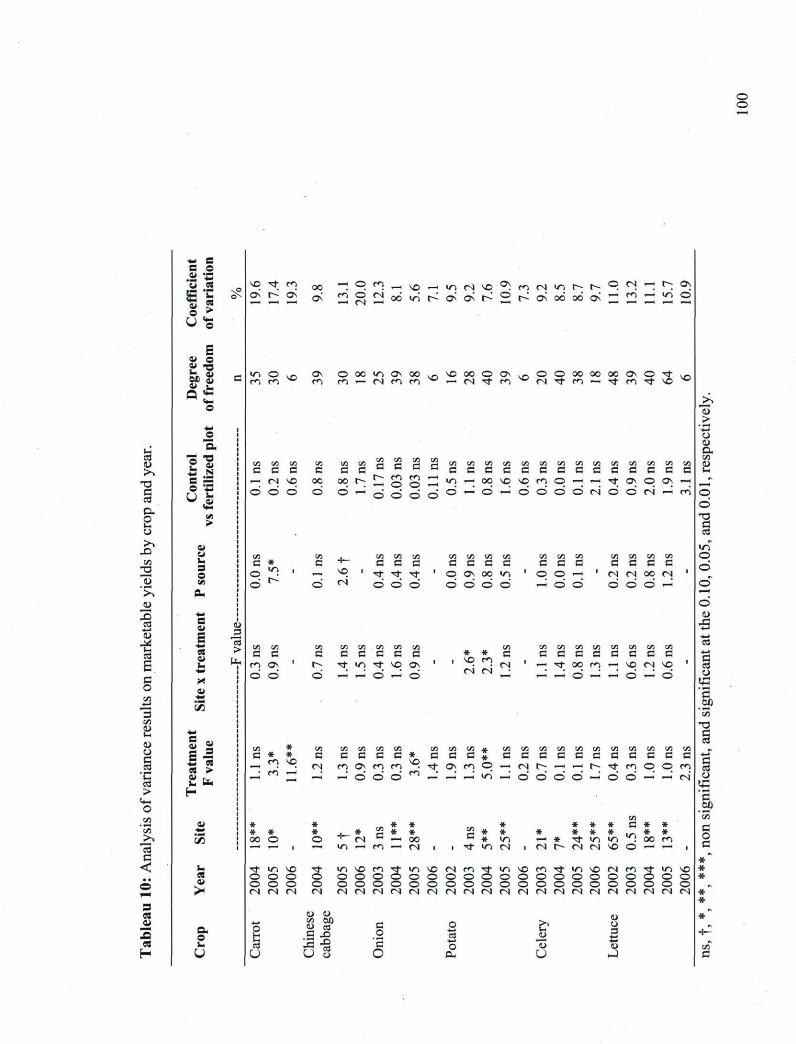
o o
ca
s es eu o es H
■a c
s o f i l .mm
.— -u-
u es
6 |
H OJ
eu i v U
lïVN
ca t u
tro
l zed
>. tro
l zed
13 C ca
e S o S 13 C ca w eu Or '*O l n O
>> eu U r O eu U
un I H
2 S o
*â3 w
>> PH t u
1 4 n
•ur
a eu t u
r * 2 • m *
S es
i 3
c IX
o t u en
u» * u
3 .en CU C eu S g
^1 x—. CQ Cxt > 'a 2to
> H o en
eu ' e n <M
> u S
U es eu
a . o U
NO x t r n , ON r ON Q^ m
<— o m ^
© CN
NO H i n CM N O O r n CM i n r r^
? 2 a ' v i r ; o \ a i i > 2 r ~ O N 0 0 0 0 * © CNJ <H —J m' rî
r; ON i n d
in © NO ON rn
© 0 0 i n O N 0 0 . o N 0 0 0 © m H C M r n m ^ H C M x t
O NO © © 0 0 0 0 0 0 O N © x t
C M x t m u a r n x t N O NO
en t n en 3 3 3
—, CM N O © © ©
m .
3 *
en en en m un m u. 3 S
00 00 © © H
t n j _ _
m NO
<= <N
S S S S
r.
en en en en en S S 3 S S
g g ^ m H O O N O N O d — < © — © © © ©
en B
m
en
© © © ©
3 3 3 p —; n
CM"
en S
en 3
en B
en 3
x t ON O ON
© O CM —
en en 3 S
x t t r j
© © ©
en en S C S
© <3N (X! i n © © © d
en en en S S S
© © H —; d ©
un t j . mn rjn 3 B S S
CM CM OO CM © © © —J
en S
en B
m ON
O O
en en en en en en S B 3 S S 3
r» x t i n x t N O ON © —< ^ © — d
* * NO r n CM CM
en B
CM
c n e n c n c n c n c n c n e n B S S S S S S S
^ x t o o m H N O C M N O m r n m O H H O n H ©
en * en en en en en en en en Jj(. en en
a * * S B E E E * E E E * O
E E _ r n vq CM m ON m m NO
x t ON m * O
u n CM _ ; r n H —' d d © r n —i m ' i n «H d
en en en S S S
r n n H r X t
© © —« ©
en en en
* * * 00 ©
* * * * O
A— * ^ CM
en B * *
m 0 0 •— i n H m _ I f S |
* s * * H * <n
x t «n CM
* * * * * * * H * x t i n i n CM r ^ CM CM N O
S S S m © © en O ^H" m! CM
en S * *
m * * " J oo m O u m
x t i n NO t i n N o m x t i n N o r N r n x t i n N o m x t i n N O C M m x t i n N O © © © © © © © © © © © © © © © © © © o © © © © © © © © © © © © © © © © © © © © © © © © © © © © © C M C M C M CM C M C M C M C M C M C M C M C M C M C M C M C M C M C M C M C M C M C N C M C M
O
S U
<u o en W)
erg m j CJ
E O
■ — l
E O
O
S o
eu U
o c j
o
tu
I SL en tu u
O
d
i n
o d
J. es
I o
.1 ca
T3
CJ
en B O C
*
*
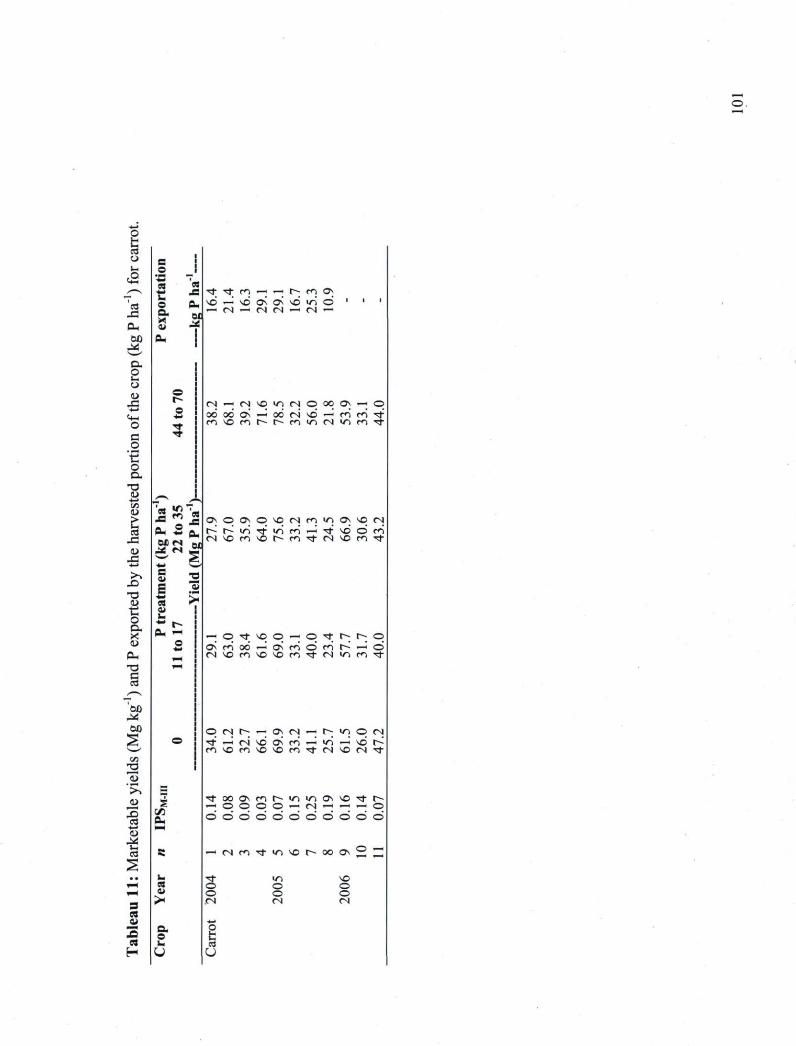
o fc ca o B I n O
a ■B es
zT̂ t 'ea o _C a.
x O H eu 6 0 P H
M , t x O I n O u
C O f»
U J O e+H ■ m *
O x t d x t
o 1 a T J
_£•*. CU
45 M CU
A O C m PH S
C 6£ rs u .M CM
r C "̂̂ ■ * > M
>. c E
O c E
U es € t u
i r o D. X
c rPL, ~
tu O *D_ » H
T J 1—1
S3 r—N
' 6 0 M 6 0
§ O
C/3
2 *2 " > i 3
s r H
3 cX
ca P. U» NN <U ^ I n ea S
s . „ U « M es _ M t u
s > es CJ
Z a o
es u H U
es J3
tu
!
es -= 0
xt xt m —; —| r; rn ON N O H N O O N O N N O i n © H ( N H t N N f N | 1
C M H C M N O i n C M © 0 0 O N ^ © o d o d o N H o d c M N d ^ m r n x t m N o m r r ~ m i n c M i n m x t
O N © O N © N o r N r n i n O N N q r N i > ^ r ^ i n x t i n r n H x t N d © r n r N N o m N o r ~ m x t c M N o m a
x t N O © H O x t r r © —| © ON m oo H ON rn CM NO m NO NO m
rn r H <N i n rn
© C M t ; H H O N C M — i l > ; > n © C M x t — " ' c N i N O O N r n ' r ^ i n ' ^ N d r u m N o m N O N o m t r N N o r N ' x t
x t o o o N m r i n i n O N N O x t r — © © © © H C M H _ n H O
© d © © © © © ' © © © ©
rt(NM^I|J«tCOC>2n
t o o
g ca
u
i n o o CJ
NC O O O )
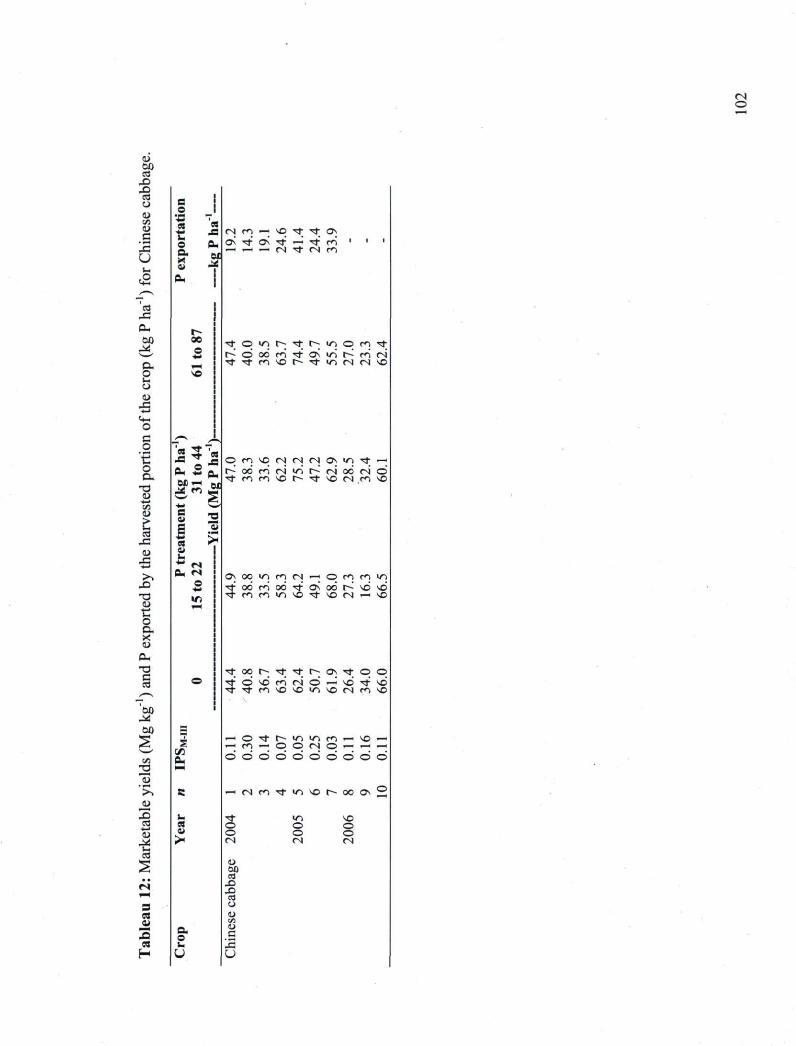
CN O
ru 6 0 ca
X>
■c. CJ CU en eu C
r C
u U
ca c Or
â & H O tu •5 «H, O c o
o O.
-O tu +n en tu ca
r C tu
;>■ O a tu C o a. x tu
T 3
6 0
.3 60 g
en
2 cU
'>, eu
"S 4—»
| ca
C M 1H
3 es eu S CS
E -
s o •a es
un L O a x CU
a.
!
oe
PH S
es C su WD
§ T3
S 3
CM CM
i n
s [fl tu
u es tu >
tx o U
rsi r n —; NO r t x t ON 0 \ \ t t > T f n i j ( f ) H H nH CM T t CM m
x t © i n r^ r » © x t a
r i n © m x t . x t o d m x t O N i n r ~ r n c M m N o r u x t i n c M C M N O
© m N o c N c M r N O N . i n ' x t — r~ oo m rN in r^ xt m m NO O- rt
CM oo CM © NO CM m NO
ON oo in m CM -H
5 © rni rn >n
o o r n o o x t O N o d r ^ N O N O m r n i n N O x t N o r N H v o
x t C X 5 r ; x t T t r ; O N X t © © x t © NO m CM © H NO x t v d x t x t m N O N O i n N o c M m N O
^ © x t r u i n i n m H N O — ' H f f j H q q t N o u n © © ' © © © © © © © ©
H C M m x t i n N O r o o O N 2
x t o o
o 60 ca
X XJ ca CJ o en o C
'rC.
U
i n O O CM
NC O O (N
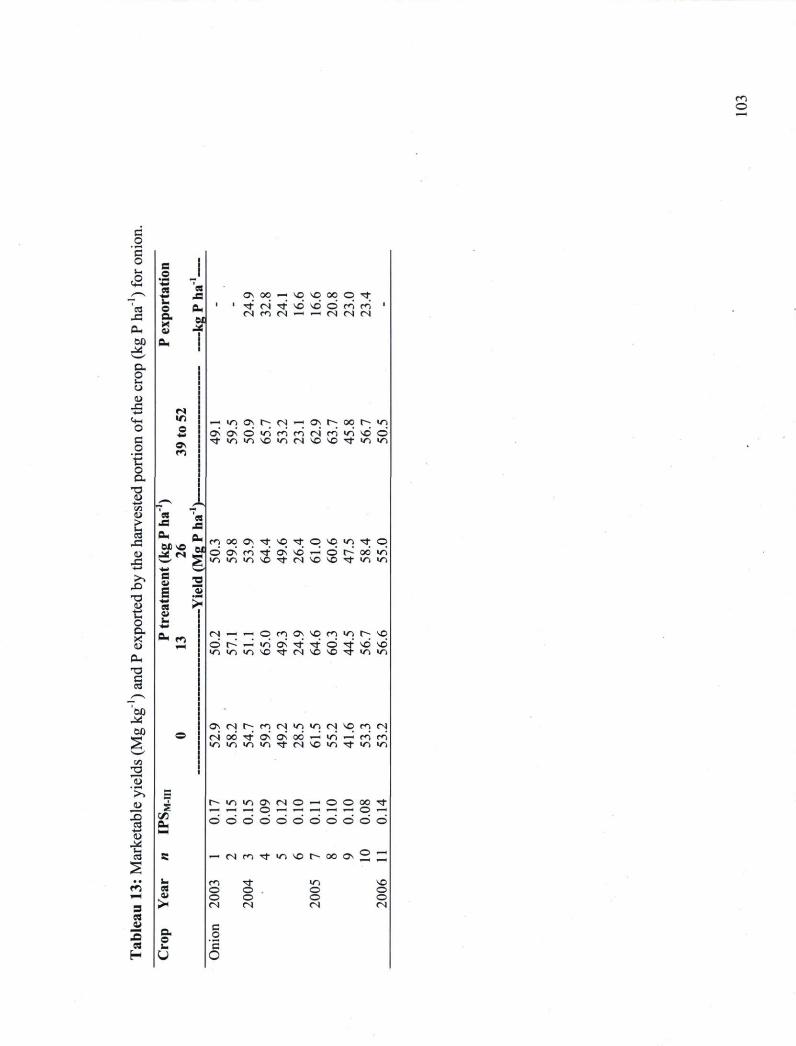
m O
c o
'S o
ca x 50
r ^ ,
Ou O u o eu
s t+H O c o
'■S o Ou
CU u i en CU
ca x tu x ■ur
> N X TJ
CU C o OX CU
TJ
3P 60
v. TJ U
>% tu s
X ( / j
ca eu <U
M I n ea c r t • • u
r*. es 1H t u
S > es eu
.O tx O es i
H U
o o. X eu
es JS
cm
CM
ON
m
6 C N O r9 CM
a. 61
f 2 13 S
m
O N O O m N O N O O O O ' X t x t CM x t NO NO © en r n ( N m t N i n M t N t N
n i n O N f C M — ' O N r o o r ^ O N O N © i n m m c M m i n N O © x t i n i n N O i n c M N O N O x t i n i n
r n o q O N x t N O x t © N q i n T t © © O N m ' x t O N N d H © r ^ o d i n i n i n i n N O x t c M N O N O x t i n i n
( N i m r n o m a N N o m i n r u N O © r ^ H i n O N a x t © 5 NO NO
O N C M r ^ r n r N i n i n c M N O r n r N c M o d x t O N O N o d H ' i n ^ m ' r n i n i n i n i n ' x t c M N O i n x t i n i n
r i n i n O N C N © H © © e î o x t n m _ 0 H H r n n H n H O — © d © © © © © © © © ©
H C M m x t i n N O r o o o S r ^
m O O CN
E O
'Ë O
x t O O CM
m © ©
NO © ©
rs
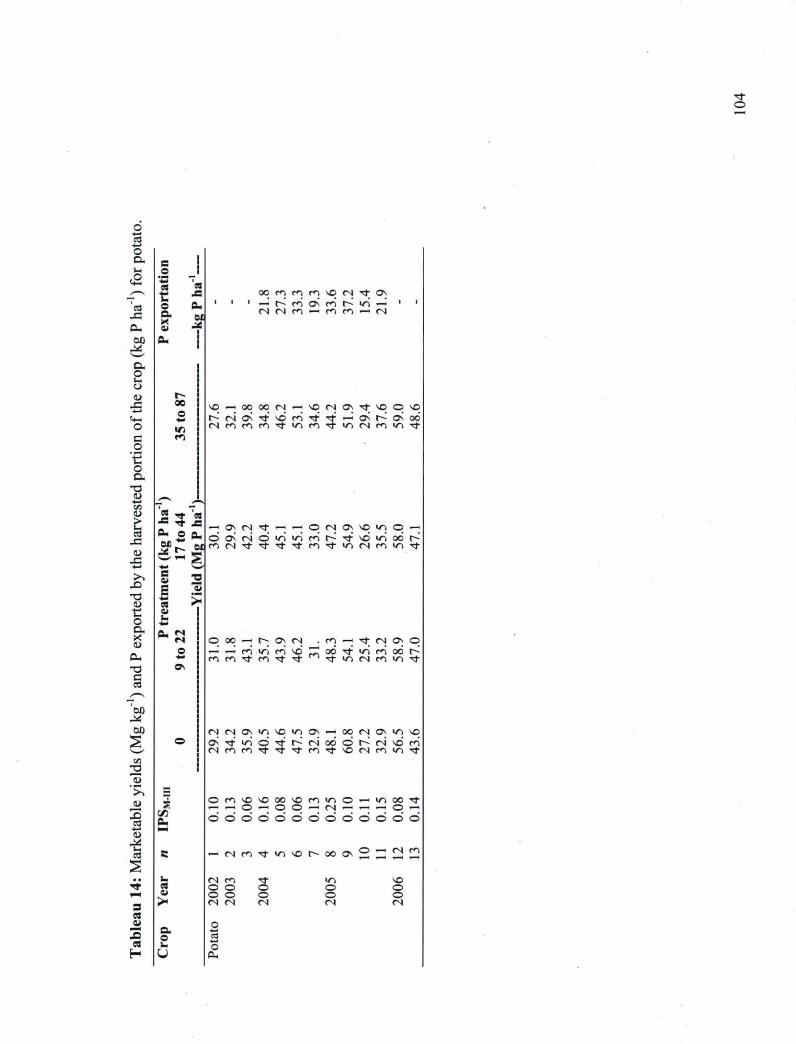
xt O
O — i
ca U» O C r s 1
I n o 1
a es 'es _^~N
t o
J S 00 m r n m N O CM x t O N
'cet r C
t o
tu , 1 ■ r n r^ r n ON" e n r^ i n r i ■ , 'cet r C a
eu C l
CM CM m — m m ' CM
O H
a eu zt
1 60 P u
M 1
tx O r J
O u ru
X —
ée e
UH
NO — 0 0 0 0 CM — N O CM O) t N O © se <+H
ée e
UH r^ rs ON x t N O r n t x t r i o< K ON' 0 0
O m CM m m m x t i n m x t i n CM m i n x t
fl m 1
O ' ■ f c
o O.
T j
■ u * x—S
un 1
tU
S x
t u
X
es
fi
■xt x t O H r
'es X _
O N CM x t ^ r _ © CM ON NO i n © _ tU
S x
t u
X
es
fi
■xt x t O H r Q. d ON CM © i n i n rn K a' N O i n oc i >
tU
S x
t u
X
sc rr—
61 m CM x t x t x t t m t i n CM m i n x t
u n ■ u
>> s t u
E un es
2 X
s t u
E un es
"3 TJ eu
s t u
E un es
> fc o
t u u
■UT O . X CU
Pu
eu CM CM © 0 0 __ r; O N CM m __
x t CM ON © O . X CU
Pu O .Z r n ' r n i n rn N O m od x t i n rn 0 0 l >
O . X CU
Pu ■uu m m t m x t x t m x t i n CM m i n x t
TJ ON
C ea
zr^ 'eo M 60 g CM CM
°! m N O m ON — oc CM ON m N O 60 g © C> x t i n © x t K CM oo d »> r j ND r n
CN m m x t x t x t m x t NO N m i n x t en
2 "o >. = U 7.
un tu
© m N O N O 0 0 NO m m © — i n oc x t U 7. un tu
■ — ' '—i © — © © i—i CM i H i—i ©
1 U»
7. un tu d d d © d d © © d d d d d 1
U» M
tU
*! U ca e — CM m x t i n NO t oc ON © ^ CN m
r t • • • CN m x t m N C
^ es O © © © © ■ > — t u
> O © © © ©
S es
t u
> CM CM CM CM CM S es eu o
!■■* n. es o
m . ta r r o H U CU
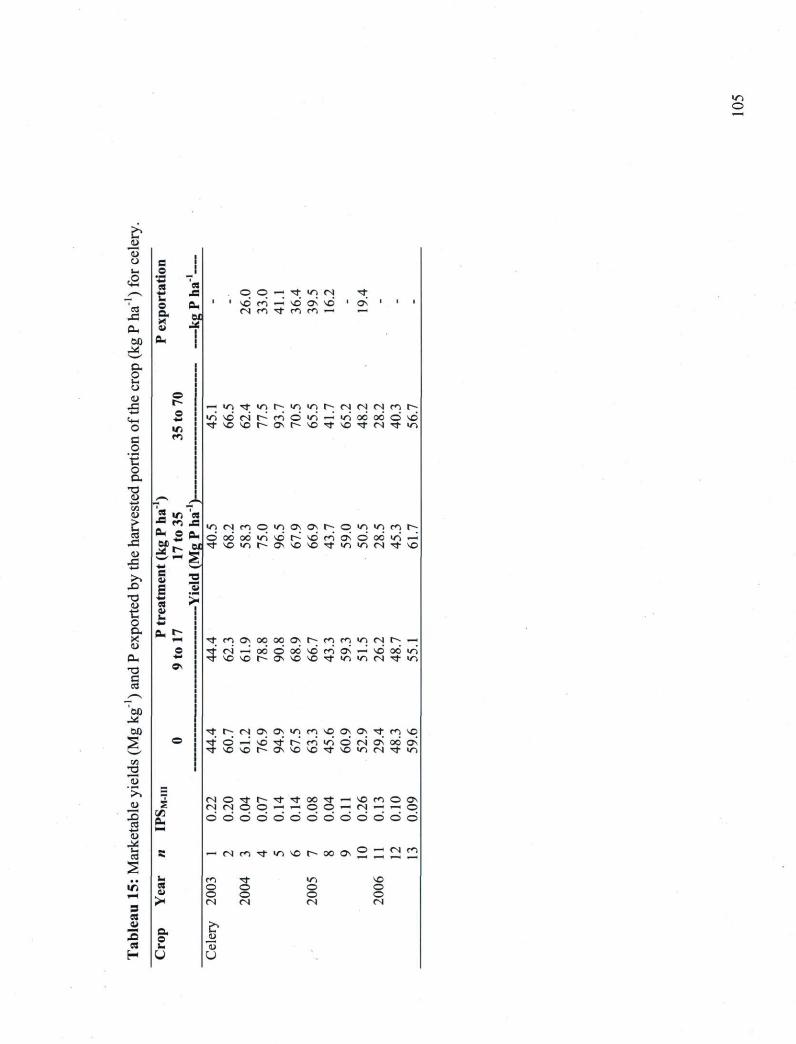
1/-I
o
î? eu U O e r o ■
a •G es 'es
rr , o
X © © H T t i n ( N t 7 o eu 1 i NO r r . H NO ON N C i ON' > ■ ■
es X CL,
a x eu
61 Z£ !
CM m x t m m
60 OH i
r * N—J
tx o u. U tu
X O
i r m x t i n r <n m r CM CM CM m rC+H
O O mm
i n NO CM t ^ r n © i n r i i n od od © NO C+H
O I f . x t NO NO f ON r^ N O x t NO x t <N x t i n
C m o
'tu o a
TJ CU un
J * ^ .
un eu S ifi
P H O r r * H
'es
£ S ifi P H O r r * H
X i n CM r n © <n ON ON l > O i n i n rn r;
c3
X CU
miZ\
S ifi P H O r r * H eu d OC o d i n NO i S NO r n ON © od i n ' r. c3
X CU
miZ\ W 1H
C i x t NO i n r » ON NO VO x t i n i n CM x t NO
u n «H N r
>X
S eu
es
2 TS
TJ eu
S eu
es ? fc eu
m .
o U n
c P H «^ X eu
™ rH x t m ON oq oo ON r~ m r n i n CM r H X eu
O 3 CM i 0O © 00 NO r n ON' m ' NO o d i n P H ** 3 NO NO r O N NO N O x t m i n CM x t i n T J o\
zr̂ '60 M 60 x t r CM ON ON i n r n N O ON ON x j m NO
N V o xT' d m ' NO x t r~ m ' i n © CM ON o d O N
N V xT' N O N O r~ ON NO NO x t NC m CM x t i n CA
2 13 . rH
> u ~ 5e
eu
CM O x t f x t a oo t — NO m © ON eu 5e
eu O J ( N © © m m O o — CM —i H O 5e
eu d d © © © d © d d © d © ©
(U
•g ca
(U
•g ca
s — (N m x t «n N O r~ 0C ON © — CM r n
> ##
u m x t m N O IT)
— es eu
i» O ©
© © g ©
©
S es
es eu
i» rN CM r i CM S es — tx p 2 es
o u
"0 H U U .
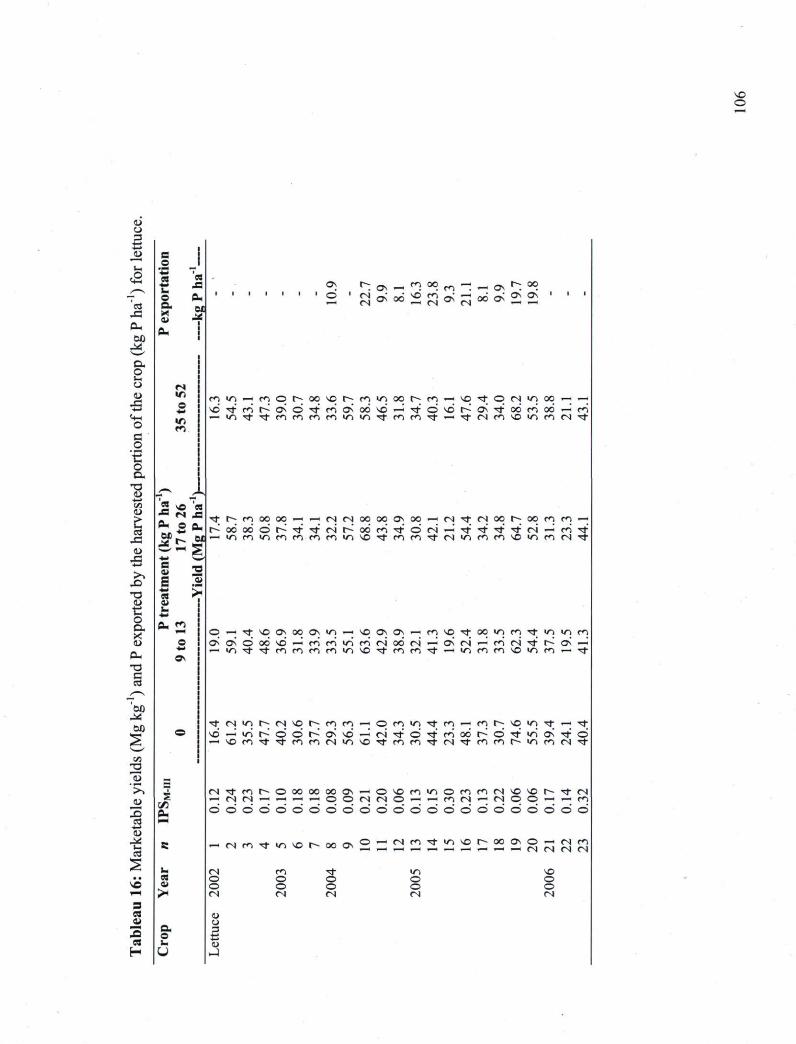
N C O
tu o
r .
ca x Cu 60
I CJ t a
x u n
t+n O c o c o tx
TJ tu u n un tu ca x tu x *—I >,
X TJ
CU
O n. x tu
CU TJ
60 M 60
CO
2 "S — '>. £ eu y .
r O fiea <■*
U J
(U ^ K ea
s I H
• • es zz <u H H > 3 es
_ÇU tx
3 e es U
H U
In O C X t u
es x
64
rN
m
es «a rs PH O
W 1H u—
s t u
E * H es eu i . r
CH «** " 1H
O Un
«TN
NO es
Cu ex
° . t ^ ^ ^ r n o q ^ n ^ . 2 ' ^ ON' od 2 8 ON'
r~ oo ON r; cd o< 2 2
m i n — m © r ~ o o N o r ~ m i n o o r ^ m n H N o x t © c M i n o q — ' r n * ' è f n h i j \ d N i
:n » c < ) ^ H N t d * r
;o \ ' ê r c > o t < i o d H ' M
n H V i x t x t m m m m i n m x t m m x t H T t c M m N O i n m c M x t
• x t r m o o o o — ' n c M C M o o o o O N O o — c M t C M o o r ^ o o m m n n r ^ o o o o © r ~ x t x t r N r u o o m x t © H i n m i n m m m m i n N O x t m m
c N n H x t x t a x t r N — i x t c M i n m m N O i n m
© n H x t N O O N O O O N i n n H N O O N O N H r n N O x t o q i n r n x t i n i n m O N O N © c » N d H r n r n ' i n r n r N o d c M — e j N C M i — " r n c M x t ' r ^ O N — n i n x t x t m m m m i n N O x t m m x t H i n m m N O i n r n i — , T t
x t ( N i n r r N N O r ~ m m n H © m i n x t m n H m r N O i n x t n H x t N O H i n t © © r ^ O N N O H H N o m x t x t m m r N i n N o
CN x t © xt m oo v t n n N T t N x f
r © t in ON a © m m r in m CM xt
c M x t m r © o o o o o o o N H O N o m i n © m m r N N O N O r ~ a ' C M — r N C M H n n n n n H p o c M r N © — — r n r N — C M © O — < r n r n © d © © © © © © © © © © © © © © © © © © © © ©
H r N m ' x t i n N o r o o O N © n H C M m ^ i n N o r u o o O N © H C M m r n r n n H n n n H m r n m m H C M C M C M C M
CM m © © © © CM CM
t o © CM
m
8 r i
NO © © r j
CJ

f j
tx • u 0J x t r^ CM © x t
I n * o
oc N O p » ©
* * o © d d d d
O C H
X B 1
ru c 1 1
60 _o U " ■ f l 'es > es S rn oc —; © © U ; u Cu O ' x t ,—'. ON' ON'
■2 O Cu
( N CM CM »H r n ■2 O. C t C X C
o u ■ÙJ 1
J S
1 es t u E
!
c _ç 1
1
ON ON O rn i n
G 'cS 6 0
1
1
CM m ' d r n © en
è 2 'S
T D
! cS O
i , 3
O . 3 g 1H 8
S NO
<2 r i m , m x t ©
eu " • S
o
NO
<2 r n i n r n x t CM "7 n * ■s «T> N C m t x t x t ca o
J 3 tu ' r r rn ÛO' ÎT
O C
1 'es X ex
o O TJ oo '5.o
O. „ § ■a A |
"S *— r r . 2 oo t x t __ r
i* un t u
OzT^ o Un
2 d x t CM NO ON 8 S SB
un t u
12 1 H
eu NO i n x t x t m 8 S SB
J3 es Ou 7 3 " u
eu X eu
u en tu ex • 3 O
B 0 3 . 2 N?
« i l P. W
es u t u r»
• 3 O B 0 3 .
2 N?
m <* 2 8 TTJ H 0 0 ON ON OC 0 0 .H '
t u © ON r n r n x t o< > , en
o o. TJ
O
W e>
i n i n t t m "3 T3
11 X O > • t u
eu c
U, (U O.
« T J
o x t x t ON NO 0 0
CJ u 1 >
'es TJ o © © t > m' CM x t — X <
' un ca CJ
CM i
CM ©
i n i n x t x t x t
2 T3 tu eu
' a l Ë 3
'en en
2 CJ
© CN CU
X
C i n ON © CN
ri n
2 T3 tu eu
' a l Ë 3
£> a t
mt. Cu
t oo CM © »> 3 x S 1 • \—■
• i—i
■ f c
a t
mt. Cu
© ©
© d ©
CM
d CM
d "S 22 9 S
1 1 ,n
II r S
Il —
C+n
• r
O 00
'S co O C ca
u. en es
"S 22 9 S
1 1 ,n
II r S
Il — ». 60 CJ i n © i n i n o " 3
f » —
r û O ■ f r
© © © d
CM
d i n CM
S? 3 w tu
3 G •fl i © i n
■ © © .S B
es o C .Cui
© © A C 3 m—
X r î UK
d © © © 2 " § es H
O Ul 60
'S c/3
ÇJ 3 N >.
o
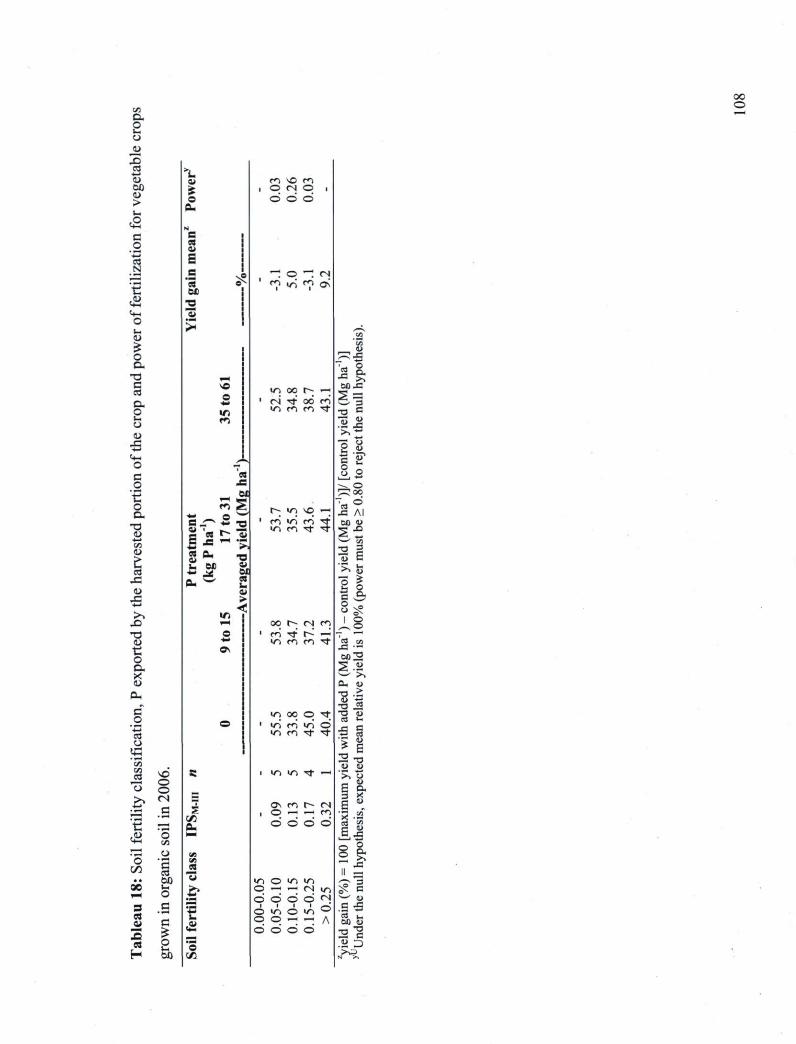
en Ou
CJ
o 8 ' i . CJ eu m NC m 6 0 ■ © CN © ,
u © d d
«2 N
C
.2 e 2
■1 • iH
1
E
t >i 1 m' © i n r n
1
CM
O N ■1 • iH
1 ■a V eu 0 >
en
è 'un eu
a " ■ 5
il T J „ " ■ 5
il N O
O Un
i n 1 CM
oc x t
l > 00 r n
mi l Z Z
2=3 m i n m m x t T3 C
o m J ï ï r ë tu >>
0
■s il ■r~
C ■— 3 JT O _
G 'es ■IL 2 O JS u O
1 a . « H
n m o
un
6J
i c i n NO _ " 00
le AI
i en
S r û ^
n m o
un " 3 1 m ' i n r n x t 00 tu
i en
Z. 'm
E S r H
"êû ' >
i n m x t x t I* •a
3 CU es c
eu b 61
■3 eu e j
X PL, w es
u
1 m
eu >
^ 8 X H t » f CM m ^ 8 ""O O 1 m' x t K n T *""* u un i n m m ^r 3 « *• ON J3 " «
i Si x N© > , eu — eu
Cu ■■■
1 © i n
1 i n i n
oc r n m
© in" x t
t
d x t
"S 8
CJ t f l 1
E
2 T3 c / j . u « C/3
c3 VO S i i n m x t — '? . o © ru e j
3 x
i B
. 1 » © CM
Cu
os m t" (N
ru e j
3 x
i B
. c
© CM
Cu i © .
© —r © ©
m d 'S •«
2 £ ~ ' JS Il n
t+n
'S 0 0
' o co
U
'I en
'S •«
2 £ ~ ' JS Il n • • 6 0 eu i n © i n i n ' S 3
60 u. O
© — © © ©
(N ©
m CM
à? S w (U
3 es eu
_g •fl ■ ■ © i n O
■ m © .S cS
es u 00 eu
3 es eu r j u
eu o © A .S cS es u 00 eu
X £ (fl © © d d s'a es H
O u, 6 0
"S e/3
oc o
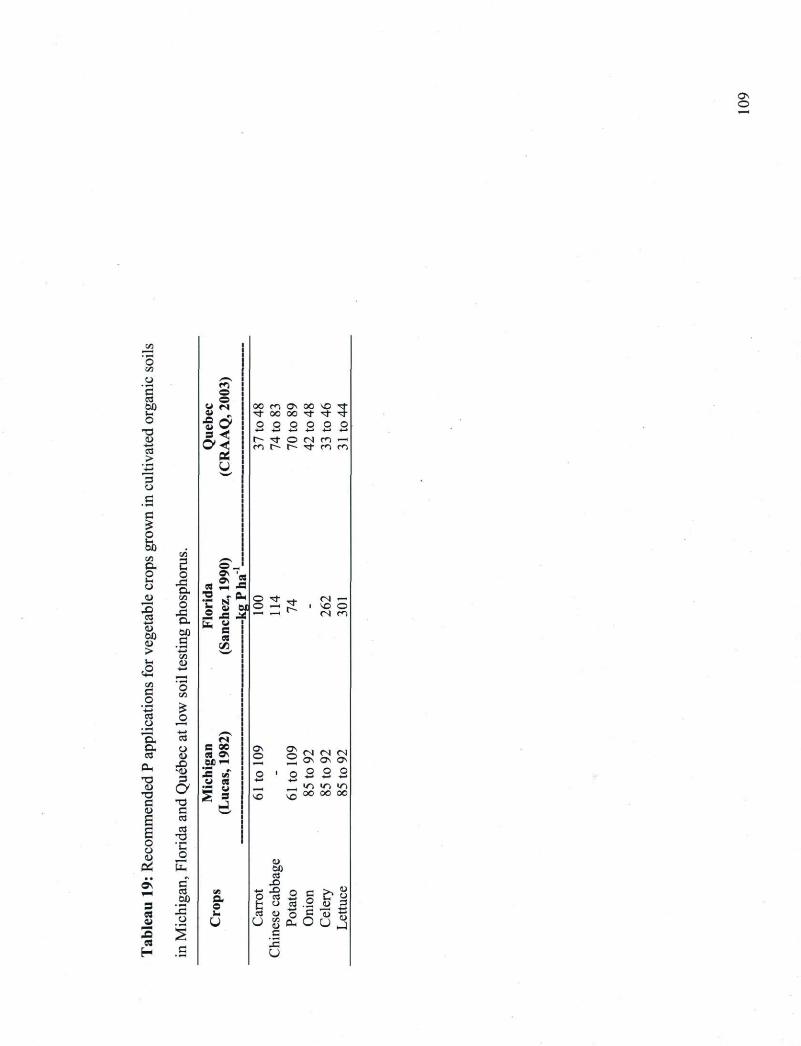
© o
o X O. en O
X tx 60 fl
'un CO tu
O en
■s *
B es eu 3 es
H
ca CJ tu
3
a TJ C ca ca
TJ 'C o E c ca 60
X o ri ■ S
m ©
«u v
.5 •<
U
S 'es es2 S
2 U T P H
S x J U . W W B
es C/3
rs e x es o\
eu es a eu
Q. O U
u
oo m ON oo NO êt t 00 00 x t et T O O O O O O
r x t © CM m H r n r» r— j r n m
2 5? CN NO © CM m
ON © 1 — <
ON © CM
ON CM ON
CM ON
O 1 O O n
O w
O — r r r r
mCl ^r> m 0 0
i n oo
i n oo
o 60 ea
X J X O ca fc CJ ca tu U en
eu 3
X U
es .2 eu 3 o c u 5

I O-7
S 0.6 lï * 0.5 'oo
_S 0.4 'es X
eu 0.3 60
g 0.2
o CJ
0.1
0.0
O Our trials A CRAAQ (2003)
Carrot Chinese Celery Lettuce Onion Potato cabbage
Figure 14: Comparison between P exportations (kg P Mg"1 fresh matter) for vegetables
crop in organic soils.
110

8 U a)
,u 7 0 'ca r3 M 60 A A A A
S <j>
• 3 ♦ ♦ ♦ Is 50 >N
T3 cu ea
0 4 0 Î O
5 o ■ o
8 u A 0.00 0.05
« 3 0 ♦ 0.050.10
« 3 0 ■ 0.100.15 O 0.150.25
Oft • — 1 1
O > 0.25
■10
60 r
50 ca
JS M 40
T3
!S 30 >>
■g CU
2 u > <
20
10
-10
o o
10 20 30 40 50 60
P rate (kg P ha )
b)
o
© o
♦ 0.05-0.10 ■ 0.10-0.15 O 0.15-0.25 © > 0.25
10 20 30 40 50 60
P rate (kg P ha )
Figure 15: Averaged yield (Mg ha"1) by fertility class vs. P addition (kg P ha"1) across
vegetable crops in organic soils a) years 2002 to 2005 and b) year 2006.
I l l

Chapitre 7: Conclusion générale
7. Conclusion générale
Dans une optique de développement durable, l'objectif premier de ce projet de doctorat
était de développer un modèle agroenvironnemental de fertilisation phosphatée pour la
carotte, le chou-chinois, le céleri, la laiture, l'onion et la pomme de terre. Afin de répondre
à cet objectif, nos travaux ont permis : i) de sélectionner un test de P du sol basé sur la
saturation en P des sols organiques; ii) de déterminer un seuil environnemental critique au-
delà duquel toute fertilisation phoshatée ne doit pas dépasser les exportations de P par
récoltes; iii) d'établir des seuils critiques agronomiques de réponse des cultures à la
fertilisation; iv) de déterminer des classes de fertilité du sol pour l'établissement de dose de
P appropriée à l'analyse du sol en P.
Nos travaux sur le développement des indices agroenvironnementaux de saturation en P des
sols organiques utilisant la méthode M-III ont permis de proposer une expression générale
du degré de saturation en P pour les sols organiques utilisant la méthode de M-III (ISPM-III)
comme le rapport molaire [P/(Al-HyFe)]M-in, où y=5 comptabilise le rôle du Fe dans la
fixation du P en sols organiques. Les seuils critiques de DSPox=0,25 et Pw=9,7 mg L"1
correspondaient à une valeur de ISPMIII de 0,05. Les seuils agronomiques ont été fixés à des
valeurs d'ISPM-m entre 0,10 et 0,15. Le seuil environnemental était plus bas que les seuils
agronomiques. Ceci confirme le haut risque environnemental d'appliquer du P dans les sols
organiques cultivés.
Le seuil environnemental critique de 0,05 constitue la première norme jamais publiée et
validée pour les productions en sols organiques cultivés. Au-dessus de cette valeur
environnementale de ISPMIII, le bilan du P devrait être négatif pour minimiser le risque de
contamination des cours d'eau par le P. Les séparateurs agroenvironnementaux de ISPM-III
de 0,05 et 0.10-0,15 sont des références fiables pour l'application de bonnes pratiques de
gestion du P minimisant les externalités de la fertilisation phosphatée des cultures
maraîchères cultivées en sols organiques sur les écosystèmes aquatiques.
113
Le développement des indices de saturation en P des sols organiques cultivés a été étalonné
avec les résultats des analyses des échantillons de sol prélevés au printemps lors de
l'implantation des sites expérimentaux. Traditionnellement, les recommandations en P sont
basées sur les analyses de sols échantillonnés à l'automne précédant le semis. Il fallait donc
s'assurer que les résultats étaient transférables entre le printemps et l'automne précédent.
La variabilité spatiale et saisonnière de I'ISPM-III a été utilisée pour corriger nos résultats de
recherche et évaluer le risque agronomique et environnemental d'une fertilisation moyenne.
Les résultats sur l'analyse spatiale et saisonnière ont permis d'émettre les conclusions
suivantes : (1) les valeurs de PM-in et de ISPMIII sont spatialement autocorrélées et les
semivariogrammes expérimentaux peuvent être décrits par des modèles théoriques linéaires
plateaux ou sphériques avec une portée allant de 68.0 à 167.8 m; (2) la cartographie
démontrait que les sols organiques cultivés avaient une probabilité élevée (> 90% pour les
trois champs) de dépasser le seuil environnemental ISPM-III de 0,05 après la variation
saisonnière. Il y avait une grande variation parmi les valeurs PM-III et ISPM-III entre
l'automne et le printemps. La plupart des zones de forte saturation en P affichaient les plus
grandes pertes en P. Les valeurs IPSM-III de l'automne se retrouvaient généralement dans
une classe de fertilité inférieure au printemps. Des pertes de PM-III de plus de 41 kg PM-III ha" 1 ou 84 kg Pox kg"1 viennent confirmer que l'horizon de surface des sols organiques
cultivés contribue à la pollution des eaux de surface et souterraines. La caractérisation de la
variabilité spatiale et saisonnière du PM-III et de 1'ISPM-III constitue un premier pas dans
l'étude des propriétés des sols organiques. Cependant, des éludes plus spécifiques sur la
variabilité temporelle sont nécessaires pour vérifier si les valeurs de I'ISPM-III près du seuil
environnemental à l'automne persistent au printemps suivant.
La valeur critique environnementale de ISPM-III de 0,05 et les valeurs critiques
agronomiques de ISPM-III de 0.10 et 0,15 ont permis de définir cinq classes de fertilité selon
le rapport molaire [P/(Al+7Fe)]M-in soit : faible : 0,00-0,05; moyenne : 0,05-0,10; élevée :
0,10-0,15; très élevée : 0,15-0,25; excessivement élevée : > 0.25. Les recommandations en
P pour les cultures maraîchères cultivées en sols organiques doivent être élaborées selon
une approche agroenvironnementale prévenant l'accumulation du P dans les sols. En
l'absence de réponse claire des cultures aux ajouts de P, on s'est basé sur le principe que la
114
fertilisation phosphatée n'est pas motivée et doit être inférieure aux exportations de P par la
récolte lorsque l'analyse du sol en P dépasse le seuil environnemental. En effet, les tests de
puissance et les courbes de réponses de la culture à la fertilisation phosphatée n'ont
démontré aucune réponse significative des cultures à l'ajout de P sauf dans la classe de
fertilité 0,05-0,10. La fertilisation en P a été proposée dans la classe de fertilité faible (0,00-
0,05) et moyenne (0,05-0,10). Pour les classes de fertilité au-dessus de 0,10 l'application de
P pourrait être substantiellement réduite sans affecter le rendement et la qualité des
cultures. En plus de réduire la pollution des cours d'eau par le P, les producteurs pourront
profiter d'une économie d'argent. Nos résultats appuient la suggestion de Duxbury et
Peverly (1978) de réduire substantiellement ou d'omettre les ajouts de P sans affecter la
productivité. L'utilisation des seuils environnementaux et agronomiques permettront aux
maraîchers de déterminer des limites d'application de fertilisants par champ afin de
contribuer à l'assainissement de leur milieu tout en maintenant une agriculture compétitive.
La mise à jour des grilles de référence en fertilisation des cultures maraîchères cultivées en
sols organiques élaborée selon une approche environnementale et agronomique favorisera
la prévention de l'eutrophisation des bassins versant drainant les sols organiques cultivés en
plus de placer la gestion environnementale ces productions au premier plan au niveau
international.
115
Chapitre 8: Bibliographie
8.1 Bibliographie
Barrow, N.J. 1980. Evaluation and utilization of residual phosphorus in soils, p. 333-360
Dans F.E. Khasawneh et a l , ed. The role of phosphorus in agriculture. Am. Soc.
Agron., Madison, Wl.
Barrow, N.J. 1983. A mechanistic model for describing the sorption and désorption of
phosphate by the soil. J. Soil Sci. 34: 733-750.
Black, CA. 1993. Soil fertility evaluation and control. Lewis Publication, Boca Raton, FL.
746 p.
Boerner, R.P.J., A.J. Scherzer et J.A. Brinkman. 1998. Spatial patterns of inorganic N, P
availability, and organic C in relation to soil disturbance: a chronosequence
analysis. Applied Soil Ecology 7:159-177.
Bolan, N.S., N.J. Barrow et A.M. Posner. 1985. Describing the effect of time on sorption of
phosphate by iron and aluminum hydroxides. J. Soil Sci. 36: 187-197.
Borggaard, O.K. 1979. Selective extraction of amorphous iron oxides by EDTA from a
Danish sandy loam. J. Soil Sci. 30: 727-734.
Borggaard, O.K. 1981. Selective extraction of amorphous iron oxides by EDTA from soils
from Denmark and Tanzania. J. Soil Sci. 32: 427-432.
Borggaard, O.K. 1982. The influence of iron oxides on the surface area of soils. J. Soil Sci.
33: 443-449.
Borggaard, O.K. 1983. The influence of iron oxides on phosphate adsorption by soil. J. Soil
Sci. 34:333-341.
Brady, N.C. et R.R. Well. 2002. The nature and properties of soils. 13th Ed., Pearson
Education, Inc., Upper Saddle River, NJ 07458. 960 p.
Breeuwsma, A., J.H. Wôsten, J.J. Vleeshouwer, A.M. van Slobbe, et J. Bouma. 1986.
Derivation of land qualities to assess environmental problems from soil surveys.
Soil Sci. Soc. Am. J. 50: 186-190.
Breeuwsma, A. et S. Silva. 1992. Phosphorus fertilisation and environnemental effects in
the Netherlands and the Po region (Italy). Rep. 57. Agric. Res. Dep., Einand Staring
Center for Integrated Land. Soil land Water Res., Wageningen, the Netherland. 37
P-
117
Breeuwsma, A. et J.G.A Reijerink. 1992. Phosphate satured soils: A new environnemental
issue, p. 1-10 Dans Proceedings of the European State-of-the-Art. Conference on
Delayed Effects of Chemicals on Soil and Sediments, wageningen, The
Netherlands.
Cambardella, C.A., T.B. Moorman, J.M. Novak, T.B. Parkin, D.L. Karlen, R.F. Turco et
A.E. Konopka. 1994. Field-scale variability of soil properties in central Iowa soils.
Soil Soil Sci. Soc. Am. J. 58:1501-1511.
Chamayou, H. et J.P. Legros. 1989. p. 197-202 Dans Chapitre 3. Humus. Les bases
physiques, chimiques et minéralogiques de la science du sol. Presse universitaire de
France. Agence de coopération culturelle et technique, Paris?.
Cogger, C. et J.M. Duxbury. 1984. Factors affecting phosphorus losses from cultivated
organic soils. J. Environ. Qual. 13: 111-114.
Corey, R.B. 1987. Soil test procedures: correlation, p. 15-22 Dans J.R. Brown, ed. Soil
testing : sampling, correlation, calibration, and interpretation. Soil Sci. Soc. Am.
Spec. Publ. 21, Madisson, Wl.
CRAAQ, 2003. Guide de référence en fertilisation. 1er Ed., Centre de Référence en
Agriculture et Agroalimentaire du Québec, Québec.
Cressie, N. 1985. Fitting variogram models by weighted least squares. J. Int. Assoc. Math.
Geol. 17: 563-586.
Cressie, N. 1991. Statistics for Spatial Data, 1st Ed. John Wiley & Sons, New York.
Dahnke, W.C. et R.A. Olson. 1990. Soil test correlation, calibration and recommendation.
Pages 45-71. Dans R.L. Westerman, ed. Soil testing and plant analysis. 3rd Ed.,
book series no. 3, Soil Science Society of America, Madison, Wl.
Duguet, F., L.E. Parent et A. Ndayegamiye. 2006. Compositional indices of net nitrification
in cultivated organic soils. Soil Sci. 171: 886-901.
Duxbury, J.M. et J.H. Peverly. 1978. Nitrogen and phosphorus losses from organic soils. J.
Environ. Qual. 7: 566-570.
Eck, P. 1990. The American Cranberry. Rutgers University Press, New Brunswick, NJ, 420
P-
118

Efimov, V.N., L.I. Kornilova et M.E. Ryabtseva. 1996. Absorption capacity and kinetics of
sorption of phosphate ions in ferruginous peat soils of lowmoor bogs. Eurasian Soil
Sci. 29: 928-933.
Erviô, R. 1970. The importance of soil bulk density in soil testing. Ann. Agric. Fenniae. 9:
278-286.
Evans, CE. 1987. Soil test calibration. Pages 23-29 Dans J.R. Brown ed. Soil testing :
sampling, correlation, calibration, and interpretation. Soil Sci. Soc. Am. Spec. Publ.
21, Madisson, Wl.
Farnham, R.S. et H.R. Finney. 1965. Classification and properties of organic soils. Adv.
Agron. 17. Academic Press. NY. 386 p.
Fernandez Marcos, M.L., E. Alvarez et C. Monterroso. 1998. Aluminum and iron estimated
by Mehlich-3 extractant in mine soils in Galicia, Northwest Spain. Commun. Soil
Sci. Plant Anal. 29:599-612.
Fitts, J.W. 1955. Using soil tests to predict a probable response from fertilizer application.
Better Crops 39: 17-20, 40-41.
Fox, R.L. et E.J. Kamprath. 1970. Phosphate sorption isotherms for evaluating the
phosphate requirement of soils. Soil Sci. Soc. Amer. Proc. 34 : 902-907.
Fox, R.L. et E.J. Kamprath. 1971. Adsorption and leaching of P in acid organic soils and
high organic matter sand. Soil Sci. Soc. Amer. Proc. 35: 154-156.
Gangbazo, G., J. Roy et A. : Le Page. Capacité de support des activités agricoles par les
rivières : le cas du phosphore total. Mars 2005. Ministère du Développement
durable, de l'Environnement et des Parcs du Québec, Québec, QC. 28 p.
Gerke, J. 1992. Solubilization of Fe (III) from humic-Fe complexes, humic/Fe-oxide
mixtures and from poorly ordered Fe-oxide by organic acids-consequences for P
adsorption. Z. Pflanzenernahr. Bodenk.. 156, 253-257.
Gerke, J. et R. Hermann. 1992. Adsorption of orthophosphate to humic-fe-complexes and
to amorphous fe-oxide. Z Pflanzenernahr. Bodenk., 155, 233-236.
Gerke, J. 1993. Phosphate adsorption by humic/Fe oxyde mixtures aged at pH 4 and 7 by
poorly ordered Fe-oxide. Geoderma 59: 279-288.
Goldberg, S. et G. Sposito. 1984. A chemical model of phosphate adsorption by soils: II.
Noncalcareous soils. Soil Sci. Soc. Am. J. 48: 779-783.
119
Goovaerts, P. 1998. Geostatistical tools for characterizing the spatial variability of
microbiological and physico-chemical soil properties. Biol. Fert. Soils 27:315-334.
Gregorich, E.G., L.W. Turchenek, M.R. Carter et D.A. Angers. 2001. Soil and
Environmental Science Dictionary. Canadian Society of Soil Science, CRC Press:
577 p.
Guérin, J., L.E. Parent et R. Abdelhafid. 2007. Agri-environmental thresholds using
Mehlich-III soil phosphorus saturation index for vegetables in Histosols. J. Environ.
Qual. 36: 975-982.
Gurevitch, J. et L.V. Hedges. 1999. Statistical issues in ecological meta-analysis. Ecology.
80: 1142-1149.
Hamilton, H.A. et R. Bernier. 1975. N-P-K fertilizer effects on yield, composition and
residues of lettuce, celery, carrot and onion grown on an organic soil in Quebec.
Can. J. Plant Sci. 55:453-461.
Hedges, L.V. et I. Olkin. 1985. Statistical method for meta-analysis. Academic Press, Inc.,
Orlando, FL. 369 p.
Hooda, P.S., A.R. Rendell, A.C. Edwards, P.J.A. Withers, M.N. Aitden et V.W. Truesdale.
2000. Relating soil phosphorus indices to potential phosphorus release to water. J.
Environ. Qual. 29: 1166-1171.
Hortenstine, CC. et R.B. Forbes. 1972. Concentrations of nitrogen, phosphorus, potassium,
and total soluble salts in soil solution samples from fertilized and unfertilized
organic soils. J. Environ. Qual. 1: 446-449.
Hutchinson, G. E. 1973. Eutrophication. The scientific background of a contemporary
practical problem. American Scientist 61: 269-279.
Ilnicki, P et J. Zeitz. 2003. Irreversible loss of organic soil functions after reclamation.
p. 15-32. Chapitre 2. Dans L.E. Parent et P. Ilnicki, ed. Organic soils and peat
materials for sustainable agriculture. CRC Press LLC. USA Florida, 205 p.
Juo. A.S.R. et B.G. Ellis. 1968. Chemical and physical properties of iron and aluminum
phosphates and their relation to phosphorus availability. Soil Sci. Soc. Amer. Proc.
32:216-221.
Kaila, A. 1959. Retention of phosphate by peat samples. J. Sci. Agric. Soc. Finland 31:
215-225.
120
Khiari, L., A. Pellerin, J. Fortin et L.E. Parent. 1999. A soil phosphorus saturation index
decreasing scooped weight effect in Mehlich-3 procedure. Commun. Soil Sci. Plant
Anal. 30:2157-2168.
Khiari, L., L.E. Parent, A. Pellerin, A.R.A. Alimi, C Tremblay, R.R. Simard et J. Fortin.
2000. An agri-environmental phosphorus saturation index for acid coarse-textured
soils. J. Environ. Qual. 29: 1561-1567.
Kraske, C.R., I.J. Fernandez et CJ. Spencer. 1989. A comparison of methods for measuring
extractable Ca, Mg, K, Na, Mn, Al, Fe, and P from New England forest soils.
Comm. Soil Sci. Plant Anal. 20: 439-464.
Lamontagne, L. 2004. Les sols agricoles du Québec méridional. Module 1. Dans contexte
agricole et agro-alimentaire québécois. Mémento de l'agronome du Québec. Ordre
des agronomes du Québec. Québec.
Lévesque, M. et M. Schnitzer. 1967. Organo-metallic interactions in soils. 6. Preparation
and properties of fulvic acid-metal phosphates. Soil Sci. 103: 183-190.
Lévesque, M. 1970. Contribution de l'acide fulvique et des complexes fulvo-métalliques à
la nutrition minérale des plantes. Can. J. Soil Sci. 50: 385-395.
Lindsay, W.L. et W.A. Norvell. 1978. Development of a DTPA soil test for zinc, iron,
manganèse, and copper. Soil Sci. Soc. Am. J. 42 : 421-428.
Lindsay, W. L. 1979. Chemical équilibra in soils. Jonh Wiley & Sons, NY, 449 p.
Loveland, PJ. et P. Digby. 1984. The extraction of Fe and Al by 0.1 M pyrophosphate
solution: a comparison of some techniques. J. Soil Sci. 35: 243-250.
Lucas, R. 1982. Organic soils (Histosols). Formation, distribution, physical and chemical
properties and management for crop production. Res. Rep. 435, Agric. Exp. Sta. and
Coop. Ext. Serv., Michigan State Univ., East Lansing, and Agric. Exp. Sta., Inst.
Food Agric. Sci., Univ. Florida, Gainesville, FL, 79 p.
Lyons, J.B., J.H. Gorres et J.A. Amador. 1998. Spatial and temporal variability of
phosphorus retention in a riparian forest soil. Journal of Environmental Quality
27:895-903.
Maguire, R.O. et J.T. Sims. 2002. Measuring agronomic and environmental soil
phosphorus saturation and predicting phosphorus leaching with Mehlich 3. Soil Sci.
Soc. Am. J. 66: 2033-2039.
121
Mattingly, G.E.G. 1975. Labile phosphate in soils. Soil Sci. 119: 369-375.
McKeague, A. 1967. An evaluation of 0.1 M pyrophosphate and pyrophosphate-dithionite
in comparison with oxalate as extradants of the accumulation products in podzols
and some other soils. Can. J. Soil Sci. 47: 95-99.
McKeague, J.A., J.E. Brydon et N.M. Miles. 1971. Differentiation of forms of extractable
iron and aluminum in soils. Soil Sci. Soc. Am. Proc. 35: 33-38.
McLaughlin, J.R., J.C. Ryden et J. K. Syers. 1981. Sorption of inorganic phosphate by iron
and aluminum-containing components. J. Soil Sci. 32: 365-377.
Mehlich, A. 1984. Mehlich-3 soil test extractant: a modification of Mehlich-2 extractant.
Commun. Soil Sci. Plant Anal. 15:1409-1416.
Miller, M.H. 1979. Contribution of nitrogen and phosphorus to subsurface drainage water
from intensively cropped mineral and organic soil in Ontario. J. Environ. Qual. 8:
42-48.
Minotti, P.L., et K.W. Stone. 1988. Consequences of not fertilizing onions on organic soils
with high soil test values. Comm. Soil Sci. Plant Anal. 19: 1887-1906.
Naucke, W., A.L. Heathwaite, R. Eggelsmann, and M. Shuch. 1993. Mire chemistry, p.
263-309. Dans A.L. Heathwaite (ed.) Mires. Process, exploitation and conservation.
3rd ed., John Wiley & Sons, NY, 506 p.
Nelson, L.A. et R.L. Anderson. 1984. Partitioning of soil test-crop response probability, p.
19-38 Dans M. Stelly, ed. Soil testing: Correlating and interpreting the analytical
results. ASA Special Publication 29. ASA, Madison, Wl.
Nelson, L.A., R.D. Voss et J. Pesek. 1985. Agronomic and statistical evaluation of fertilizer
response, p. 53-90 Dans O.P. Engelstad ed. Fertilizer technology and use. Soil Sci.
Soc. Amer. Madison, Wl.
Okruszko, H. et P. Ilnicki. 2003. The moorsh horizons as quality indicators of reclaimed
organic soils, p. 1-14. Chapitre 1. Dans L.E. Parent et P. Ilnicki, ed. Organic soils
and peat materials for sustainable agriculture. CRC Press LLC, Boca Raton FL, 205
P-Osenberg, C.W., O. Sarnelle, S.D. Cooper et R.D. Holt. 1999. Resolving ecological
questions through meta-analysis : Goals, metrics, and models. Ecology 80: 1105-1117.
122
Parent, L.E., L. Grenon, et P. Buteau. 1991. Effet de plusieurs décennies d'exploitation
agricole intensive sur les propriétés des sols organiques dans le sud-ouest du
Québec. Symposium 89. Tourbe et tourbières, diversification et innovation. Vol. II:
92-98. The Canadian Society for Peat and Peatlands.
Parent, L.E. 2001. Classification, pédogenèse et dégradation des sols organiques, p. 241-
255. Chapitre 10. Dans Écologie des tourbières du Québec-Labrador. Presse de
l'Université Laval.
Parent, L.E. et S. Marchand. 2006. Response to phosphorus of cranberry on high
phosphorus testing acid sandy soils. Soil Sci. Soc. Am. J. 70: 1914-1921.
Pellerin, A., L.E. Parent, J. Fortin, C Tremblay, L. Khiari et M. Giroux. 2006a.
Environmental soil phosphorus saturation index for Québec acid to near neutral
mineral soils varying in texture and genesis. Can. J. Soil Sci. 86: 711-723.
Pellerin, A., L.E. Parent, J. Fortin, C Tremblay, G. Tremblay, C.P. Landry et L. Khiari.
2006b. Agri-environmental Mehlich-III soil phosphorus saturation index for corn in
Québec. Can. J. Soil Sci. 86: 897-910.
Pote, D.H., T.C. Daniel, A.N. Sharpley, P.A. Moore, D.R. Edwards et D.J. Nichols. 1996.
Relating extractable soil phosphorus to phosphorus losses in runoff. Soil Sci. Soc.
Am. J. 60: 855-859.
Pote, D.H., T.C. Daniel, D.J. Nichols, A.N. Sharpley, P.A. Moore, D.M. Miller et D.R
Edwards. 1999. Relationship between phosphorus levels in three Ultisols and
phosphorus concentrations in runoff. J. Environ. Qual. 28:170-175.
Porter, P.S. et CA. Sanchez. 1992. The effect of soil properties on phosphorus sorption by
Everglade Histosols. Soil Sci. 154 : 387-398.
Reddy, K.R. 1983. Soluble phosphorus release from organic soils. Agric. Ecosystems
Environ. 9: 373-382.
Rezaian, S.E.A. Hanlon, CA. Sanchez et J.A. Cornell. 1992. Optimization of solution : soil
ratio and shaking times of the Mehlich-III soil test on histosol. Commun. Soil Sci.
Plant Anal. 23: 2247-2259.
Ross, G.L. et C Wang. 1993. Extractable Al, Fe, Mn and Si. p. 239-246 Dans M. R. Carter,
ed. Soil sampling and methods of analysis. Lewis Publication, Boca Raton, FL.
123
Ryden, J.C, J.K. Syers et R.F. Harris. 1973. Phosphorus in runoff and streams. Adv. Agron.
25: 1-45.
Sample, E.C, R.J. Soper et GJ. Racz. 1980. Reaction of phosphate fertilizers in soils, p
263-310. Dans F.E. Khasawneh et al., ed. The role of phosphorus in agriculture.
American Society of Agronomy, Crop Science Society of America, Soil Science
Society of America; Madison, Wl.
Sanchez, CA. et E.A. Hanlon. 1990. Evaluation of selected phosphorus soil test for lettuce
on histosols. Commun. Soil Sci. Plant Anal. 21:1199-1215.
Schindler, D.W. 1977. Evolution of phosphorus limitation in lakes. Science. 195: 260-262.
Sharpley, A.N., T.C. Daniel et D.R. Edwards. 1993. Phosphorus movement in the
landscape. J. Prod. Agric. 6: 492-500.
Sharpley, A.N., S.C. Chapra, R. Wedepohl, J.T. Sims, T.C. Daniel et K.R. Reddy. 1994.
Managing agricultural phosphorus for protection of surface waters: Issues and
options. J. Environ. Qual. 23 :437-451.
Sharpley, A.N. 1995. Dependence of runoff phosphorus on extractable soil phosphorus. J.
Environ. Qual. 24: 920-926.
Sharpley, A., T.C. Daniel, J.T. Sims et D.H. Pote. 1996. Determining environmentally
sound soil phosphorus levels. J. Soil Water Cons. 51: 160-166.
Si, B.C., R.G. Kachanoski et W.D. Reynolds. 2007. Analysis of soil variability, p. 1163-
1191. Chapitre 85. Dans M.R. Carter and E.G. Gregorich ed. Soil sampling and
methods of analysis, 2nd Ed., CRC Press, Boca Raton, FL, 1264 p.
Simoneau, M. 1996. La qualité de l'eau dans le bassin versant de la rivière Châteauguay.
Dir. Aquat. Ecosyst., Québec Min. Environ. Faune, Québec, Canada.
Sims, J.T. 1993. Environmental soil testing for phosphorus. J. Prod. Agric. 6: 501-507.
Sims, J.T., R.O. Maguire, A.B. Leytem, K.L. Gartley et M.C. Pautler. 2002. Evaluation of
Mehlich-3 as an agri-environmental soil phosphorus test for the Mid-Atlantic
United States of America. Sci. Soc. Am. J. 66: 2016-2032.
Sissingh, H.A. 1971. Analytical technique of the Pw method used for the assessment of the
phosphate status of arable soils in the Netherlands. Plant Soil. 34: 483-486.
Sonzogni, W.C, S.C. Chapra, D.E. Amstrong et TJ. Logan. 1982. Bioavailability of
phosphorus inputs to lakes. J. Environ. Qual. 11: 555-563.
124
Système canadien de classification des sols. 1987. 2e Ed., Agric. Can., publ. 1646, Ottawa,
170 p.
Tisdale, S.L., W.L. Nelson et J.D. Beaton. 1985. Soil and fertilizer phosphorus. 4th Ed.,
Macmillan publishing company, NY, 754 p.
Tonitto, C , M.B. David et L.E. Drinkwater. 2006. Replacing bare fallows with cover crops
in fertilizer-intensive cropping systems: a meta-analysis of crop yield and N
dynamics. Agric. Ecosystems Environ. 112:58-72.
Tran, T.S., M. Giroux, J. Guilbeault et P. Audesse. 1990. Evaluation of Mehlich-III
extractant to estimate the available P in Québec soils. Commun. Soil Sci. Plant
Anal. 21: 1-28.
Trangmar, B.B., R.S. Yost et G. Uehara. 1985. Application of geostatistics to spatial
studies of soil properties. Adv. Agron. 38:45-94.
van der Zee, S.E.A.T.M. et W.H. van Riemsdijk. 1986. Sorption kinetics and transport of
phosphate in sandy soil. Geoderma 38: 293-309.
van der Zee, S.E.A.T.M., G J. Fokking et W. H. van Riemsdijk. 1987. A new technique for
assessment of reversibility adsorbed phosphate. Soil Sci. Soc. Am. J. 51: 599-604.
van der Zee, S.E.A.T.M. et W.H. van Riemsdijk. 1988. Model for long-term phosphate
reaction kinetics in soil. J. Environ. Qual. 17: 35-41.
van Lierop, W. 1981. Laboratory determination of field bulk density for improving
fertilizer recommendations of organic soils. Can. J. Soil Sci. 61: 475-482.
Webster, R. 1985. Quantitative spatial analysis of soil in the field. Adv. Soil Sci. 3:1-70.
Whitney, D.A., J.T. Cope et L.F. Welch. 1985. Prescribing soil and crop nutrient needs, p.
25-52 Dans O. P. Engelstad, ed. Fertilizer technology and use. 3rd Ed. SSSA,
Madison, Wl.
Yuan, T.L. 1980. Adsorption of phosphate and water-extractable soil organic material by
synthetic aluminum silicates and acid soils. Soil Sci. Soc. Am. J. 44: 951-955.
Ziadi, N. et T. Sen Tran. 2007. Mehlich 3-Extractable elements, p. 81-88. Chapitre 7. Dans
M.R. Carter and E.G. Gregorich ed. Soil sampling and methods of analysis, 2nd Ed.,
CRC Press, Boca Raton, FL, 1264 p.
Zeitz, J. et S. Velty. 2002. Soil proprerties of drained and rewetted fen soils. J. Plant Nutr.
Soil Sci. 165:618-626.
125
8.2 Médiagraphie
Classes des niveaux trophiques des lacs :
http://www.mddep.gouv.qc.ca/eau/rsv-lacs/methodes.htm
126
Perspectives de recherche Les résultats de recherche serviront aux procédures méta-analytiques. La méta-analyse a la
capacité de considérer simultanément plusieurs facteurs affectant le rendement des cultures
sous contraintes agronomiques et environnementales spécifiques et de comptabiliser la
variance de l'erreur lors de l'interprétation des patrons de réponse de la culture à la
fertilisation à travers un grand nombre d'essais. Ce genre d'analyse va au-delà des modèles
de recommandations classiques qui ne prennent en considération que les interactions entre
les sites et les années de même que les effets locaux de la variance de l'erreur sur les
estimations des besoins en P à l'échelle régionale. Ceci servira d'outils pour élaborer des
doses de recommandation en P plus fiables pour les cultures maraîchères.
La mise en valeur des résultats se fera ensuite dans la mise à jour des grilles de référence en
fertilisation des cultures maraîchères cultivées en sols organiques. L'approche
agroenvironnementale développée ici est très innovatrice et permettra de répondre aux
objectifs d'une agriculture durable tout en restant compétitive. L'indice critique
environnemental sera utile pour développer un indice de risque du P prenant en
considération tous les mécanismes hydrologiques du transport du P dans le sol.
Pour mesurer les éventuels impacts qu'auront l'utilisation des nouveaux outils à la
fertilisation sur la qualité de l'eau des bassins versants drainant les sols organiques ainsi
que sur la qualité des cultures maraîchères et des sols organiques, un suivi à long terme de
la fertilisation réduite devrait être réalisé.
Pour supporter les estimations de perte en P et pour les quantifier davantage, une
surveillance du niveau de P dans les cours d'eau drainant les sols organiques et dans les
nappes souterraines devraient être réalisée à intervalle régulier. De cette façon,
l'augmentation dans les concentrations en P en fonction de la période de l'année, du niveau
de fertilisant appliqué et des variations climatiques pourrait être vérifiée.
127

Après consultation auprès des agronomes et des agriculteurs et avec l'aide des différents
comités d'experts en fertilisation et des agences de bassins versants, les normes
environnementales proposées sur le P à partir du critère de saturation en P des sols
organiques et de l'étude sur la variabilité spatiale et temporelle pourront être soumises au
Conseil des ministres du Québec pour son adoption dans le Règlement sur les exploitations
agricole (REA). C'est par décret du gouvernement du Québec permettant de modifier la
Loi sur la qualité de l'environnement (LQE) que les normes sur le P seront introduites dans
le REA. L'adoption de ces nouvelles normes permettra de fixer des limites à l'application
de fertilisants phosphatés en vue de la prévention de l'eutrophisation dans les bassins
versants qui drainent les sols organiques et du maintien d'une agriculture compétitive.
128