

DHA attenuates postprandial hyperlipidemia via … · DHA attenuates postprandial hyperlipidemia...
37
1 DHA attenuates postprandial hyperlipidemia via activating PPARα in intestinal epithelial cells Rino Kimura a , Nobuyuki Takahashi a, b *, Shan Lin a , Tsuyoshi Goto a, b , Kaeko Murota c , Rieko Nakata d , Hiroyasu Inoue d , and Teruo Kawada a, b a Laboratory of Molecular Function of Food, Division of Food Science and Biotechnology, Graduate School of Agriculture, Kyoto University, Uji, Kyoto, Japan b Research Unit for Physiological Chemistry, the Center for the Promotion of Interdisciplinary Education and Research, Kyoto University, Japan c Department of Life Science, School of Science and Engineering, Kinki University, Osaka, Japan d Department of Food Science and Nutrition, Nara Women’s University, Nara, Japan * Corresponding Author: Nobuyuki Takahashi, PhD Laboratory of Molecular Function of Food, Division of Food Science and Biotechnology, Graduate School of Agriculture, Kyoto University, Uji, Kyoto, 611-0011, Japan, TEL: +81-774-38-3957, FAX: +81-774-38-3852, E-mail: [email protected] Running title: DHA attenuates hyperlipidemia via intestinal PPARα Abbreviations: PPAR, peroxisome proliferator activated receptor; PPRE, PPAR-response element; FA, fatty acid; DHA, docosahexaenoic acid; EPA, eicosapentaenoic; Acs, acyl-CoA synthetase; Cpt1a, carnitine-palmitoyl transferase-1a; Aox, acyl-CoA oxidase; Fabp, fatty acid binding protein; Ucp2, uncoupling protein-2; apoB, apolipoprotein B; OCR, oxygen consumption rate; ASM, acid soluble metabolites; TG, triacylglyceride; HFD, high-fat diet; WT, wild-type by guest, on August 28, 2018 www.jlr.org Downloaded from
Transcript of DHA attenuates postprandial hyperlipidemia via … · DHA attenuates postprandial hyperlipidemia...
1
DHA attenuates postprandial hyperlipidemia via activating PPARα in intestinal
epithelial cells
Rino Kimura a, Nobuyuki Takahashi a, b *, Shan Lin a, Tsuyoshi Goto a, b, Kaeko Murota c,
Rieko Nakata d, Hiroyasu Inoue d, and Teruo Kawada a, b
a Laboratory of Molecular Function of Food, Division of Food Science and Biotechnology,
Graduate School of Agriculture, Kyoto University, Uji, Kyoto, Japan
b Research Unit for Physiological Chemistry, the Center for the Promotion of
Interdisciplinary Education and Research, Kyoto University, Japan
c Department of Life Science, School of Science and Engineering, Kinki University, Osaka,
Japan
d Department of Food Science and Nutrition, Nara Women’s University, Nara, Japan
* Corresponding Author: Nobuyuki Takahashi, PhD
Laboratory of Molecular Function of Food, Division of Food
Science and Biotechnology, Graduate School of Agriculture, Kyoto
University, Uji, Kyoto, 611-0011, Japan, TEL: +81-774-38-3957,
FAX: +81-774-38-3852, E-mail: [email protected]
Running title: DHA attenuates hyperlipidemia via intestinal PPARα
Abbreviations: PPAR, peroxisome proliferator activated receptor; PPRE, PPAR-response
element; FA, fatty acid; DHA, docosahexaenoic acid; EPA, eicosapentaenoic; Acs, acyl-CoA
synthetase; Cpt1a, carnitine-palmitoyl transferase-1a; Aox, acyl-CoA oxidase; Fabp, fatty acid
binding protein; Ucp2, uncoupling protein-2; apoB, apolipoprotein B; OCR, oxygen
consumption rate; ASM, acid soluble metabolites; TG, triacylglyceride; HFD, high-fat diet;
WT, wild-type
by guest, on August 28, 2018
ww
w.jlr.org
Dow
nloaded from
2
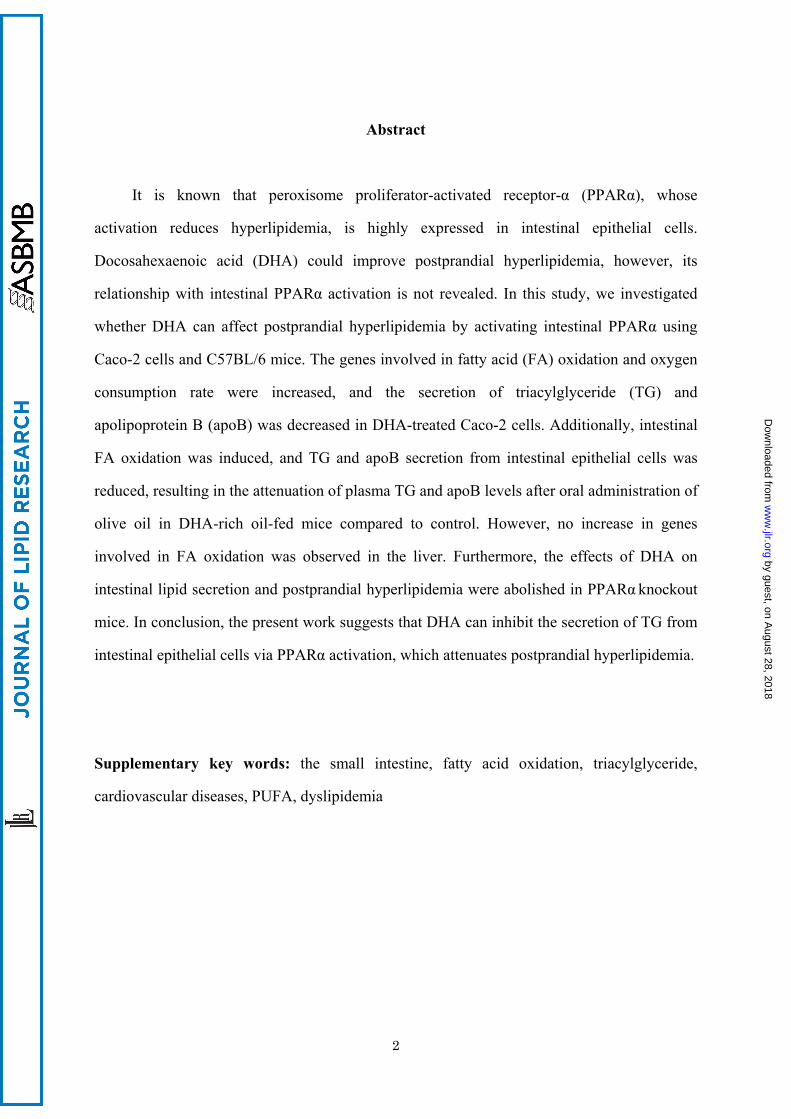
Abstract
It is known that peroxisome proliferator-activated receptor-α (PPARα), whose
activation reduces hyperlipidemia, is highly expressed in intestinal epithelial cells.
Docosahexaenoic acid (DHA) could improve postprandial hyperlipidemia, however, its
relationship with intestinal PPARα activation is not revealed. In this study, we investigated
whether DHA can affect postprandial hyperlipidemia by activating intestinal PPARα using
Caco-2 cells and C57BL/6 mice. The genes involved in fatty acid (FA) oxidation and oxygen
consumption rate were increased, and the secretion of triacylglyceride (TG) and
apolipoprotein B (apoB) was decreased in DHA-treated Caco-2 cells. Additionally, intestinal
FA oxidation was induced, and TG and apoB secretion from intestinal epithelial cells was
reduced, resulting in the attenuation of plasma TG and apoB levels after oral administration of
olive oil in DHA-rich oil-fed mice compared to control. However, no increase in genes
involved in FA oxidation was observed in the liver. Furthermore, the effects of DHA on
intestinal lipid secretion and postprandial hyperlipidemia were abolished in PPARα knockout
mice. In conclusion, the present work suggests that DHA can inhibit the secretion of TG from
intestinal epithelial cells via PPARα activation, which attenuates postprandial hyperlipidemia.
Supplementary key words: the small intestine, fatty acid oxidation, triacylglyceride,
cardiovascular diseases, PUFA, dyslipidemia
by guest, on August 28, 2018
ww
w.jlr.org
Dow
nloaded from
3
Introduction
Over the past few decades, the prevalence of metabolic syndrome has markedly
increased worldwide, particularly in wealthy, industrialized countries (1). Metabolic
syndrome includes multiple factors such as insulin resistance, dyslipidemia, and central
obesity and increases the risk of developing serious metabolic disorders such as
cardiovascular diseases and type 2 diabetes. Many epidemiological studies, including
prospective cohort studies (2-4), cross-sectional studies (5, 6), and case-control studies (7),
demonstrate that postprandial hyperlipidemia is an independent risk factor for cardiovascular
disease. Therefore, attenuating postprandial hyperlipidemia could be a key factor for
preventing cardiovascular diseases.
High intake of dietary fat significantly increases postprandial plasma triacylglyceride
(TG) levels. The epithelial cells in the small intestine are constantly exposed to this dietary fat.
Therefore, the regulation of lipid metabolism in intestinal epithelial cells could affect
postprandial hyperlipidemia. Previous studies have demonstrated that peroxisome
proliferator-activated receptor-α (PPARα) is highly expressed in intestinal epithelial cells
along the length of the small intestine as well as in the liver, skeletal muscle, and brown fat
(8,9). PPARα, which is a nuclear transcriptional factor, regulates the mRNA expression of
fatty acid (FA) oxidation-related enzymes (10-11). Synthetic PPARα agonists, such as fibrates,
decrease circulating lipid levels and are commonly used as drugs for the treatment of
hyperlipidemia (12). PPARα knockout (PPARα-/-) mice showed dyslipidemia (13, 14).
Recently, we and others have reported that activation of PPARα in intestinal epithelial cells
improves postprandial hyperlipidemia through enhancing FA oxidation (15, 16). PUFAs, such
as docosahexaenoic acid (DHA) and eicosapentanoic acid (EPA), are known to lower plasma
TG; the mechanism responsible for their hypolipidemic action is thought to be involved in the
regulation of TG clearance from circulation and TG synthesis in the liver (17-19). Recent
studies have found that PUFAs increase the mRNA expression levels of genes involved in FA
by guest, on August 28, 2018
ww
w.jlr.org
Dow
nloaded from
4
oxidation in intestinal epithelial cells (20). However, it is unknown whether dietary lipids,
such as DHA could affect the intestinal lipid metabolism, resulting in improvement of
postprandial hyperlipidemia.
In this study, we investigated whether DHA improves postprandial hyperlipidemia by
altering the lipid metabolism in intestinal epithelial cells. DHA induced FA oxidation in
intestinal epithelial cells by activating PPARα, which attenuated postprandial hyperlipidemia
by directly reducing TG secretion from intestinal epithelial cells. Furthermore, we confirmed
that hepatic lipid metabolism is unlikely to contribute to these effects of DHA. These findings
suggest that activating intestinal PPARα by dietary lipids such as DHA may shed light on
postprandial hyperlipidemia-induced cardiovascular diseases.
by guest, on August 28, 2018
ww
w.jlr.org
Dow
nloaded from
5
Materials and methods
Chemicals and cell culture
Docosahexaenoic acid (DHA) and eicosapentaenoic acid (EPA) were purchased from
Nacalai Tesque (Kyoto, Japan) and dissolved in ethanol. Bezafibrate was purchased from
Sigma (St. Louis, MO, USA) and dissolved in dimethylsulfoxide (DMSO) as a stock solution.
Decanoic acid and palmitic acid were purchased from Nacalai Tesque and Wako Pure
Chemicals (Osaka, Japan), respectively. All other chemicals used were from Sigma or Nacalai
Tesque and were guaranteed to be reagent or tissue-culture grade.
Human Caco-2 cells were purchased from American Type Culture Collection (ATCC,
Manassas, VA, USA) and were cultured in DMEM (100 mg/dL glucose) containing 10% fetal
bovine serum, 1% non-essential amino acid solution, and 10 mg/mL penicillin/streptomycin at
37°C in 5% CO2/95% air under humidified conditions. Caco-2 cells were seeded at a density
of 1.2 × 10⁶ cells/mL on 12-well Transwell plates (Corning Inc.; Corning, NY, USA) for 2
weeks for differentiation into intestinal epithelial-like cells. To evaluate differentiation of
Caco-2 cells, we measured transepithelial electrical resistance (TER). No significance in TER
was detected in any experiment (data not shown). The apical medium was changed to DMEM
containing either 1 µM or 25 µM DHA or 50 μM bezafibrate and 600 μM taurocholic acid Na
salt hydrate and 500 μM oleic acid. Additionally, the basolateral medium was changed to
serum-free DMEM. After 48 h, the basolateral medium was collected to measure TG and
apolipoprotein B (apoB) secretion. Cell viability was measured in Caco-2 cells treated with
DHA and bezafibrate based on cell titers (Promega; Fitchburg, WI, USA).
Luciferase assays
Luciferase assays were performed using the modified dual luciferase system as previously
described (21). Briefly, for luciferase assays using the GAL4/PPAR chimera system, CV-1
cells or Caco-2 cells were transfected with p4xUASg-tk-luc (reporter plasmid), pM-h PPARα
by guest, on August 28, 2018
ww
w.jlr.org
Dow
nloaded from

6
(chimeric plasmid expressing GAL4 DNA-binding domain and human PPARα-ligand binding
domain), pM-h PPARγ or pM-h PPARδ, and pRL-CMV (internal control plasmid for
normalizing transfection efficiencies). Transfected cells were treated with DHA and EPA at
the indicated concentrations for 24 h. Bezafibrate (50 µM), pioglitazone (1 µM) or
GW501516 (1 µM) were used as positive controls. For luciferase assays using a PPAR
full-length system, a reporter plasmid (p4xPPRE-tk-luc) and pRL-CMV were transfected into
Caco-2 cells. Transfection was performed using Lipofectamine 2000 (Invitrogen; Carlsbad,
CA, USA) according to the manufacturer’s protocol. Four hours after transfection, transfected
cells were cultured in medium containing DHA for an additional 24 h. Luciferase assays were
performed using the dual luciferase system according to the manufacturer’s protocol.
Real-time quantitative RT-PCR
Total RNA samples were prepared from Caco-2 cells, mouse intestinal epithelial cells, and
hepatocytes using Sepasol Super-I (Nacalai Tesque) and Qiazol Lysis reagent (Qiagen; Hilden,
Germany) according to the manufacturer’s instructions, respectively. Using M-MLV reverse
transcriptase (Invitrogen), total RNA was reverse-transcribed following the manufacturer’s
protocol using a thermal cycler (Takara; Shiga, Japan). To quantify mRNA expression,
real-time PCR was performed using a LightCycler System (Roche Diagnostics; Mannheim,
Germany) using SYBR Green fluorescence signals as described previously (22).
Oligonucleotide primers of human and mouse 36B4 and PPARα target genes used in this
study were designed using a PCR primer selection program found in the website of the Virtual
Genomic Center from the GenBank database, as previously described (Table 1) (23). To
compare mRNA expression levels among samples, copy numbers of all transcripts were
divided by that of human and mouse 36B4, showing a constant expression level. All mRNA
expression levels are represented relative to the control in each experiment.
Measurement of oxygen consumption rate (OCR) in Caco-2 cells
by guest, on August 28, 2018
ww
w.jlr.org
Dow
nloaded from
7
The cellular oxygen consumption rate (OCR) was measured using a Seahorse
Bioscience XF analyzer in 24-well plates at 37°C, with correction for positional temperature
variations adjusted for the four empty wells in the plate (24, 25). Caco-2 cells were cultured
for 2 weeks after seeding on the plate and were treated with PPARα agonist, 50 μM
bezafibrate, or either 1 µM or 25 µM DHA. Immediately before the measurement, cells were
washed, and 675 μL of non-buffered (sodium-carbonate-free) pH 7.4 DMEM medium
supplemented with 0.2 mM palmitic acid, 0.2 mM l-carnitine, and 2% FA-free BSA was
added to each well. After equilibration for 30 min, 2-min measurements were performed at
3-min intervals with inter-measurement mixing to homogenize the oxygen in the medium.
Measurement of TG and apolipoprotein B (apoB) secretion in Caco-2 cells
To measure TG secretion, we used the triglyceride E Test WAKO (Wako Pure
Chemicals). To measure apolipoprotein B (apoB) secretion, an enzyme-linked immunosorbent
assay (ELISA) was performed using an anti-human low-density lipoprotein apo B antibody
(Clone 12G10; Monosan; Uden, Netherlands), affinity-purified anti-apolipoprotein B
(Rockland; Gilbertsville, PA, USA), and horse radish peroxidase (HRP)-conjugated anti-goat
IgG (Promega) as the capture, primary, and secondary antibodies, respectively. Details of
these procedures have been previously described (15). HRP activity was detected using a
3,3′,5,5′-tetramethylbenzidine (TMB) peroxidase substrate (KPL; Gaithersburg, MD, USA).
Animal experiments
DHA-rich oil containing 25.4% DHA and 8% EPA was a gift from Nichiyu (Kanagawa,
Japan). EPA-rich oil containing 28.4% EPA and 12.3% DHA was a gift from Nissui
Pharmaceutical Co., Ltd. (Tokyo, Japan). All other chemicals were from Sigma or Nacalai
Tesque and were guaranteed to be reagent or tissue-culture grade.
All mice were maintained separately in a temperature-controlled (23°C) facility under a
constant 12 h light/dark cycle with free access to water. To analyze the effects of DHA on
by guest, on August 28, 2018
ww
w.jlr.org
Dow
nloaded from
8
intestinal lipid metabolism and postprandial hyperlipidemia, 9-week-old male C57BL/6 mice
(CLEA Japan; Tokyo, Japan) were fed a high-fat diet (HFD) consisting of 60% (kcal%) fat
from dietary oil, 26% protein, and 14% carbohydrate for 1 week to induce postprandial
hyperlipidemia (26), and were then divided into three groups with the same average serum TG
level and body weight after 16 h fasting. Ten-week-old male C57BL/6 mice were maintained
for 1 week either on a 60% HFD or on a diet containing 1.9% DHA or 3.7% DHA,
maintaining the total amount of fat at 60%. The detailed composition of the experimental diets
is described in Table 2 (27). As shown in Supplemental Fig. 3, EPA-rich oil containing 28.4%
EPA and 12.3% DHA was diluted with corn oil to prepare an HFD with final concentrations
of 3.4% EPA and 1.5% DHA, maintaining the total amount of fat at 60%. The energy intake
of all mice was adjusted by pair feeding, and food intake was determined daily for seven
consecutive days. Anesthesia was induced using sevoflurane in all experiments. The
procedures for animal care were approved by the Animal Research Committee of Kyoto
University.
To clarify whether the effects of DHA-rich oil on intestinal lipid metabolism and
postprandial hyperlipidemia involves PPARα, we used PPARα-/- mice with a C57BL/6 genetic
background. PPARα-/- mice were fed HFD consisting of 60% (kcal%) fat for 1 week, and
were then divided into two groups with the same average serum TG level and body weight
after 16 h fasting. Ten-week-old male PPARα-/- mice were maintained for 1 week either on a
60% HFD or on a 60% HFD containing 3.7% DHA or 0.2% bezafibrate.
For RNA analysis, the proximal intestine and the liver were harvested from the mice.
After washing, intestinal epithelial cells were collected using a slide glass. Collected tissue
was stored in RNAlater (Ambion; Austin TX, USA; Applied Biosystems, Foster City, CA,
USA) at -80°C until use.
Measurement of fatty acid oxidation
Fatty acid (FA) oxidation with isolated intestinal epithelial cells and hepatocytes were
by guest, on August 28, 2018
ww
w.jlr.org
Dow
nloaded from
9
analyzed as previously described (15, 25). Briefly, collected intestinal epithelial cells and
hepatocytes were washed with 1% FBS/DMEM three times and used for experiments. Cells
were incubated with a piece of filter paper containing 200 μL 3 N NaOH in DMEM
containing 200 μM palmitic acid, 0.1% FA-free BSA, 200 μM l-carnitine, and [14C] palmitic
acid (1 μCi /mL) (American Radiolabeled Chemicals; St. Louis, MO, USA) at 37°C for 2 h.
The tubes were gently shaken every 30 min during incubation. After 2 h of incubation, 200 μL
of 12 N HCl was added to the cells to release [14C]-CO2 and incubated at 37°C overnight to
trap [14C]-CO2. The saturated filter paper containing trapped [14C]-CO2 was assessed for
radioactivity in a liquid scintillation counter (LS6500, Beckman Coulter; Brea, CA, USA).
The acidified medium was centrifuged, and 200 μL of supernatant was assessed to determine
the amount of [14C]-labeled acid-soluble metabolites, which includes ketone bodies. Protein
concentration was determined using a Protein Assay Kit (Bio-Rad; Hercules, CA, USA).
Postprandial TG and apoB secretion
To measure plasma TG concentration, mice were administrated an oral gavage of 300
μL olive oil after a 16-h fast, and blood samples were collected every 30 min to 240 min after
olive oil administration from the tail vein of non-anesthetized mice.
To measure TG secretion from intestinal epithelial cells, mice were injected with 500
mg/kg body weight Tyloxapol (T0307, Sigma) into the intraperitoneal cavity to block serum
lipase activity after a 16-h fast (28). After 30 min, mice were administrated an oral gavage of
300 μL olive oil. Blood samples were obtained before Tyloxapol injection and every 30 min
for 240 min after olive oil administration. Plasma TG concentration was determined using the
triglyceride E Test Wako kit (Wako Pure Chemicals).
To measure postprandial apoB48 secretion, plasma collected at 120 min was mixed
with Laemmli Sample buffer (Bio-Rad) (1:8) and boiled for 5 min at 95°C. Plasma samples
were subjected to SDS-PAGE on a 5% gel. Separated proteins were transferred
electrophoretically to polyvinylidene fluoride membranes (Millipore Corporation, Billerica,
by guest, on August 28, 2018
ww
w.jlr.org
Dow
nloaded from
10
MA, USA), which were blocked with 5% non-fat dried milk in phosphate-buffered saline. The
membranes were incubated with the anti-mouse apoB48/100 antibodies (Meridian Life
Science, Memphis, TN, USA), and then with peroxidase-conjugated anti-rabbit IgG
antibodies (Santa Cruz Biotechnologies, Santa Cruz, CA, USA), respectively. Protein bands
were detected using an enhanced chemiluminescence (ECL) Western blotting detection
system (Millipore Corporation). The bands were quantitatively evaluated using National
Institutes of Health (NIH) Image J software.
Measurement of intestinal TG in mice
Lipids in intestinal mucosa were extracted using the hexane/isopropanol (3:2)
extraction methods (29). Briefly, intestinal mucosa was homogenized using
hexane/isopropanol (3/2) for 1 min, the suspension was centrifuged, and the pellet was rinsed
with the same solvent. The entire liquid phase was evaporated, the dried extract dissolved in
isopropanol, and TG content was measured as above. Triolein dissolved in isopropanol was
used as the standard for TG. The efficiency of extraction was measured by comparing the
recovery of triolein in samples that had been spiked and samples that had not been spiked
with known quantities of triolein standard. The assessed recovery was 81.2 ± 4.65%.
Measurement of TG in feces of mice
The feces were dried at 60°C overnight and the lipids were extracted using the Folch
method (30). This analysis enables measurement of lipids extracted per gram of dried fecal
samples. Briefly, lipids present in the feces were extracted using chloroform/methanol (2:1),
dissolved in isopropanol, and TG content was measured as above.
Statistical analysis
Data are presented as means ±S.E.M. For analyses of two groups, unpaired Student’s
t-test was used. To analyze three or more groups, analysis of variance (ANOVA) was used
by guest, on August 28, 2018
ww
w.jlr.org
Dow
nloaded from

11
along with Tukey-Kramer’s multiple comparison tests to determine statistical significance.
Differences were considered significant at P < 0.05.
by guest, on August 28, 2018
ww
w.jlr.org
Dow
nloaded from
12
Results
DHA activated PPARα in CV-1cells and Caco-2 cells
First, we investigated whether DHA activated PPARα based on a luciferase assay using
the GAL4/PPARα chimera system. DHA activated luciferase activity of PPARα in CV-1 cells
in a dose-dependent manner (Fig. 1A). Furthermore, DHA stimulated PPAR-response element
(PPRE)-luciferase activity in Caco-2 cells (Fig. 1B). DHA also activated luciferase activity of
PPARα in Caco-2 cells (Fig. 1C). The effects of DHA on PPARα activation were higher than
those of EPA under our experimental conditions (approximately 5.9- and 2.6-fold increases at
25 µM DHA and EPA, respectively), as shown in Fig. 1C. Moreover, DHA enhanced the
activation of PPARγ by approximately 1.7-fold (Fig. 1D). However, DHA did not increase
PPARδ activation in Caco-2 cells (Fig. 1E and Supplemental Fig. 1). Cytotoxicity was not
observed following 25 µM DHA treatment of Caco-2 cells (data not shown). These results
suggest that DHA induces PPARα activation in intact cells.
DHA induced the genes involved in FA oxidation and OCR in Caco-2 cells
To investigate the effects of PPARα activation by DHA on intestinal lipid metabolism, we
measured mRNA expression levels of genes involved in FA oxidation in DHA-treated Caco-2
cells. DHA treatment induced mRNA expression of genes involved in FA oxidation, such as
acyl-CoA synthase (Acs), carnitine-palmitoyltransferase-1A (Cpt1a), and acyl-CoA oxidase
(Aox) and other PPARα target genes such as uncoupling protein-2 (Ucp2) and fatty acid
binding protein (Fabp) (Fig. 2A–E). Moreover, the oxygen consumption rate (OCR),
determined using extracellular flux analysis, was enhanced following DHA treatment as
shown in Fig. 2F. In contrast, decanoic acid (C10), which had little activity toward PPARα,
did not affect mRNA expression of Cpt1a, and palmitic acid (C16), which showed lower
PPARα activity than DHA, did not significantly induce Cpt1a expression in Caco-2 cells
(Supplemental Fig. 2A and B). These findings suggest that DHA enhances FA oxidation in
by guest, on August 28, 2018
ww
w.jlr.org
Dow
nloaded from
13
Caco-2 cells.
DHA decreased the secretion of TG and apoB from Caco-2 cells
To determine the effects of PPARα activation by DHA on lipid secretion from Caco-2
cells, we examined the amounts of lipid secreted from DHA-treated Caco-2 cells. TG
secretion from DHA-treated Caco-2 cells was significantly decreased (to 77% and 72% with
either 1 or 25 µM DHA treatment, respectively), as shown in Fig. 3A. DHA treatment reduced
the secretion of apoB, which is the primary apolipoprotein of chylomicrons, to 67% and 59%
with either 1 or 25 µM DHA treatment, respectively (Fig. 3B). The effects of DHA on
secretion were similar to those of bezafibrate, a potent PPARα agonist (Fig. 3A and B). While
C10 did not inhibit TG secretion, C16 did decrease TG secretion from Caco-2 cells. However,
the effect of C16 on decrease of TG secretion was lower than that of DHA (Supplemental Fig.
2C). These results suggest that lipid secretion from intestinal epithelial cells is related to
PPARα activity.
DHA-rich oil enhanced FA oxidation in intestinal epithelial cells of C57BL/6 mice
Next, we examined whether the effects of DHA in vitro also occurred in vivo. Since
PPARα agonists are known to reduce food intake in rodents (32), all mice were housed in
pair-fed conditions in each experiment; there was no difference in food intake between groups.
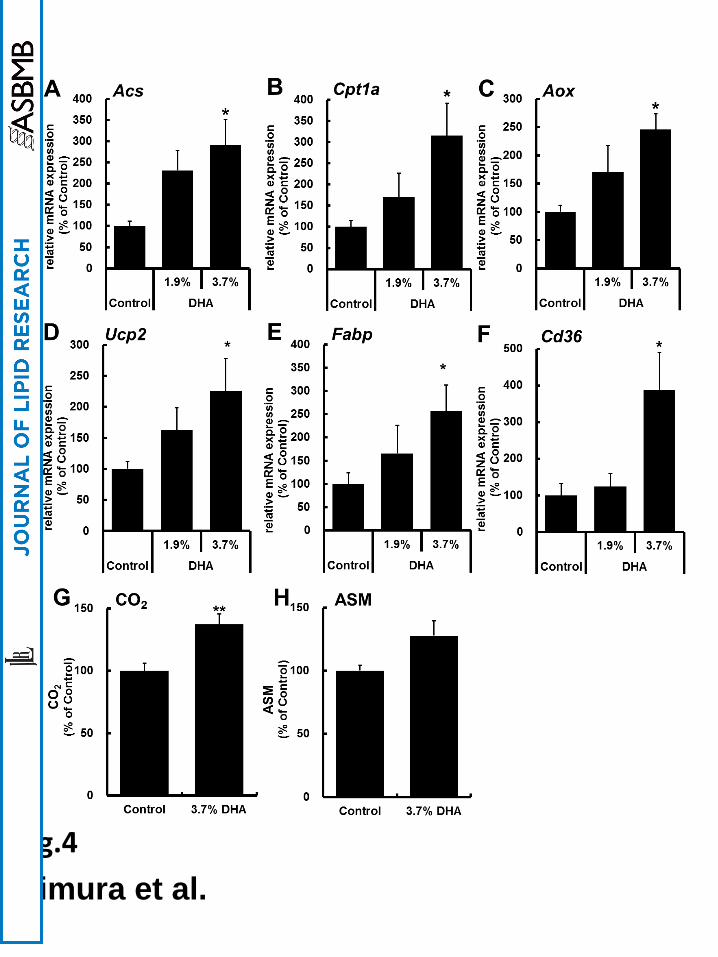
The mRNA expression levels of FA oxidation-related genes such as Acs, Cpt1a, and Aox and
other PPARα target genes such as Ucp2, Fabp and Cd36 were increased in C57BL/6 mice fed
high-fat diet (HFD) containing DHA-rich oil for one week (Fig. 4A–F). When the cells were
incubated with [14C] palmitic acid for 2 h, oxidation of [14C] palmitic acid to CO2 and
acid-soluble metabolites (ASM) were enhanced in intestinal epithelial cells of DHA-rich
oil-fed mice compared to control (Fig. 4G and H). However, surprisingly, DHA-rich oil-fed
mice showed no increase in mRNA expression levels of FA oxidation-related genes in the
liver under the same conditions as shown in Fig. 5A–C. Moreover, the production of CO2 and
by guest, on August 28, 2018
ww
w.jlr.org
Dow
nloaded from
14
ASM were not augmented in the liver of DHA-rich oil-fed mice compared to control mice
(Fig. 5D and E). These findings suggest that DHA-rich oil enhances FA oxidation in intestinal
epithelial cells of mice.
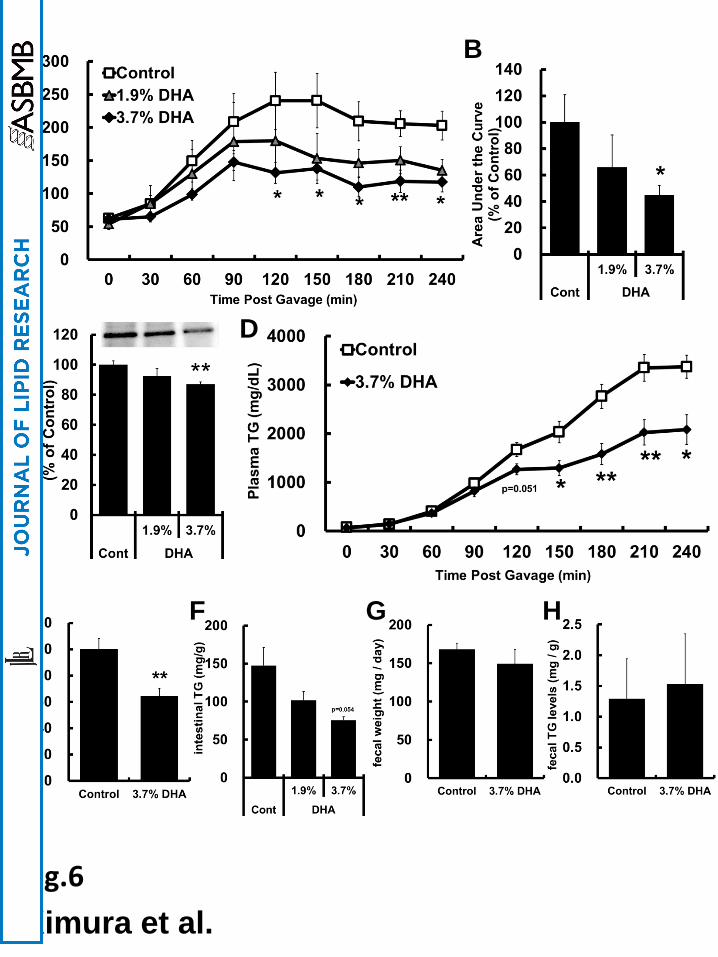
DHA-rich oil attenuated postprandial TG levels by reducing TG secretion from
intestinal epithelial cells in mice
To investigate whether DHA-rich oil decreases postprandial TG levels in mice, we
measured plasma TG levels every 30 min to 240 min after oral administration of olive oil.
Plasma TG levels were significantly lower in DHA-rich oil-fed mice than those in control
from 120 to 240 min after administration (Fig. 6A). It was also confirmed that postprandial
triglyceridemic response determined based on the area under the curve (AUC) was lowered to
66% and 45% in 1.9% and 3.7% DHA-rich oil-fed mice, respectively (Fig. 6B). In addition,
plasma apoB48 was also reduced at 120 min in 3.7% DHA-rich oil-fed mice (Fig. 6C). To
clarify whether DHA-rich oil altered postprandial TG secretion from intestinal epithelial cells,
we measured plasma TG levels after oral administration of olive oil in the presence of
Tyloxapol, an inhibitor of TG clearance. Plasma TG levels were significantly decreased after
150 min and AUC was reduced to 66% in 3.7% DHA-rich oil fed mice compared to control
(Fig. 6D and E). Furthermore, TG accumulation in intestinal epithelial cells was lower in
DHA-rich oil-fed mice than control and there was no difference in the weight of feces and
fecal TG levels between control and DHA-rich oil fed mice (Fig. 6F–H). In contrast, EPA did
not affect postprandial lipid metabolism compared to DHA (Supplemental Fig. 3). These
results suggest that DHA attenuates postprandial hypertriglyceridemia by decreasing TG
secretion from intestinal epithelial cells.
Effects of DHA on postprandial lipid metabolism were mediated by the activation of
intestinal PPARα
To clarify the involvement of PPARα in the effects of DHA on postprandial lipid
by guest, on August 28, 2018
ww
w.jlr.org
Dow
nloaded from

15
metabolism, we examined the effects of DHA in PPARα-/- mice. The baseline characteristics
of PPARα-/- mice compared to control mice are shown in Supplemental Table 1. The mRNA
expression levels of genes involved in FA oxidation (Acs, Cpt1a, and Aox), and the
production of CO2 and ASM did not change significantly in intestinal epithelial cells of
DHA-rich oil-fed PPARα-/- mice or bezafibrate-fed PPARα-/- mice (Fig. 7A-E and
Supplemental Fig. 4A-C). Moreover, there was no difference in intestinal TG levels between
DHA-rich oil-fed PPARα-/- mice and control mice (Fig. 7F). Finally, the effects of DHA-rich
oil on plasma TG and apoB levels after olive oil administration were abolished in PPARα-/-
mice without and with Tyloxapol, similar to the results of bezafibrate (Fig. 7G-I and
Supplemental Fig. 4D-F), suggesting that lipid secretion from intestinal epithelial cells is
related to PPARα activity. These findings suggest that the activation of intestinal PPARα is a
key factor for attenuating postprandial hyperlipidemia by decreasing TG secretion from
intestinal epithelial cells.
by guest, on August 28, 2018
ww
w.jlr.org
Dow
nloaded from

16
Discussion
Activation of PPARα is well known to decrease plasma TG levels through FA oxidation
in the liver and skeletal muscle (9-11). Although the role of PPARα expressed in intestinal
epithelial cells remained obscure (8, 33), we and others have recently demonstrated that
PPARα agonists improve postprandial hyperlipidemia through increasing FA oxidation in
intestinal epithelial cells (15, 16). It is suggested that PPARα activation reduces TG secretion
from intestinal epithelial cells, which attenuates postprandial hyperlipidemia (15, 16 and
Supplemental Fig. 4). To clarify the contribution of intestinal PPARα activation to
postprandial systemic lipid metabolism, further investigation is necessary, including studies
involving intestinal epithelial cell-specific PPARα knockout mice. However, these findings
indicate that intestinal PPARα activation plays a critical role in positive regulation of
postprandial systemic lipid metabolism.
Although it has been shown that PPARα activation in intestinal epithelial cells reduces
postprandial hyperlipidemia, it was unknown whether postprandial hyperlipidemia is also
improved by dietary lipids, which generally show lower PPARα activation than synthesized
PPARα agonists (34, 35). Previous studies have indicated that DHA increases mRNA
expression levels of FA oxidation-related genes in intestinal epithelial cells (36, 37) and that
PUFAs including DHA enhance FA oxidation in hepatocytes (38). The present study showed
that DHA enhanced FA oxidation and decreased TG secretion in Caco-2 cells and intestinal
epithelial cells (Fig. 2-4 and 6), resulting in reduction of postprandial hyperlipidemia via
PPARα activation in mice (Fig. 6 and 7). However, surprisingly, no induction of the genes
involved in FA oxidation was observed in the liver of DHA rich oil-fed mice under our
experimental conditions (Fig. 5). Our findings presented here strongly indicate that effects of
DHA in attenuating postprandial hyperlipidemia are attributed to the decrease of TG secretion
from intestinal epithelial cells. During early stages after a meal, most TG secretion into
circulation is thought to be derived from dietary fat absorbed in intestinal epithelial cells
by guest, on August 28, 2018
ww
w.jlr.org
Dow
nloaded from

17
because they are directly exposed to dietary fat, while insulin prevents hepatic VLDL
secretion during the postprandial state (39, 40). In DHA rich oil-fed mice, plasma TG levels
were decreased after olive oil administration with Tyloxapol, which inhibits plasma
lipoprotein lipase, suggesting that TG secretion from intestinal epithelial cells was reduced
(Fig. 6D). This was supported by the results that DHA reduced TG and apoB secretion in
Caco-2 cells, as shown in Fig. 3. Moreover, we observed that TG accumulation in intestinal
epithelial cells was generally decreased (Fig. 6F) and the level in the weight of feces and fecal
TG did not change in DHA rich oil-fed mice (Figs. 6G and H). These findings suggest that
DHA is a potent factor to reduce TG secretion from intestinal epithelial cells via FA oxidation
by PPARα activation, resulting in attenuating postprandial hyperlipidemia.
In this study, mRNA expression levels of intestinal FA oxidation-related genes in
DHA-rich oil-fed PPARα-/- mice were increased, although the increases were not significant
(Fig. 7A and C). Previous reports have indicated that PPARδ compensates for the lack of
PPARα in the skeletal muscles of PPARα-/- mice (41) and that PPARδ activates FA oxidation
(42). DHA and bezafibrate did not activate PPARδ in our luciferase assays (Fig. 1E and
Supplemental Fig. 1). However, the concentration of DHA exposed to intestinal epithelial
cells may have been much higher than that used in Caco-2 cells. Therefore, the increase in
intestinal FA oxidation-related genes in Fig. 7A and C may be related to the PPARδ effect.
The present study showed higher mRNA expression levels of Cd36 (Fig. 4), which is
involved in FA transport in intestinal epithelial cells of DHA rich oil-fed mice. Cd36 is
thought to be involved in regulating chylomicron production (43, 44). Interestingly, Cd36
knockout mice showed both fasting and postprandial hyperlipidemia and have been used as a
model of postprandial hyperlipidemia (45). A recent study showed that Cd36 critically
regulates FA oxidation in skeletal muscle (46). Additionally, Cd36 is one of PPARα target
genes (47). Therefore, an increase of Cd36 may contribute to reduction of postprandial
hyperlipidemia via intestinal FA oxidation in DHA-rich oil-fed mice.
In conclusion, we found that DHA directly reduced TG secretion from intestinal epithelial
by guest, on August 28, 2018
ww
w.jlr.org
Dow
nloaded from
18
cells by activation of PPARα-induced FA oxidation, resulting in improving postprandial
hyperlipidemia. The present work suggests that a dietary lipid such as DHA, which activates
PPARα, is a promising factor to attenuate postprandial hyperlipidemia via intestinal FA
oxidation.
by guest, on August 28, 2018
ww
w.jlr.org
Dow
nloaded from
19
Acknowledgments
The authors would like to thank Y. Tada, M. Hirata and Y. Mine for their technical
support. This work was supported by Grants-in-Aid for Scientific Research from the Ministry
of Education, Culture, Sport, Science and Technology of Japan (22228001 and 22380075).
by guest, on August 28, 2018
ww
w.jlr.org
Dow
nloaded from
20
References
1. Ogden, C. L., S. Z. Yanovski, M. D. Carroll, and K. M. Flegal. 2007. The epidemiology
of obesity. Gastroenterology. 132: 2087-102.
2. Bansal, S., J. E. Buring, N. Rifai, S. Mora, F. M. Sacks, and P. M. Ridker. 2007. Fasting
compared with nonfasting triglycerides and risk of car diovascular events in women.
JAMA. 298: 309-16.
3. Freiberg, J. J., A. Tybjaerg-Hansen, J. S. Jensen, and B.G. Nordestgaard. 2008.
Nonfasting triglycerides and risk of ischemic stroke in the general population. JAMA.
300: 2142-52.
4. Iso, H., Y. Naito, S. Sato, A. Kitamura, T. Okamura, T. Sankai, T. Shimamoto, M. Iida,
and Y. Komachi. 2001. Serum triglycerides and risk of coronary heart disease among
Japanese men and women. Am J Epidemiol. 153: 490-9.
5. Boquist, S., G. Ruotolo, R. Tang, J. Björkegren, M. G. Bond, U. de Faire, F. Karpe, and
A. Hamsten. 1999. Alimentary lipemia, postprandial triglyceride-rich lipoproteins, and
common carotid intima-media thickness in healthy, middle-aged men. Circulation. 100:
723-8.
6. Patsch, J. R., G. Miesenböck, T. Hopferwieser, V. Mühlberger, E. Knapp, J. K. Dunn, A.
M. Gotto, Jr., and W. Patsch. 1992. Relation of triglyceride metabolism and coronary
artery disease. Studies in the postprandial state. Arterioscler Thromb. 12: 1336-45.
7. Björkegren J, S. Boquist, A. Samnegârd, P. Lundman, P. Tornvall, C. G. Ericsson, and A.
Hamsten. 2000. Accumulation of apolipoprotein C-I-rich and cholesterol-rich VLDL
remnants during exaggerated postprandial triglyceridemia in normolipidemic patients
with coronary artery disease. Circulation. 101: 227-30.
8. M. Bunger, H. M. Van Den Bosch, J. Van Der Meijde, S. Kersten, G. Hooiveld, and M.
Muller. 2007. Genome-wide analysis of PPARalpha activation in murine small intestine.
Physiol. Genomics, 30: 192–204
by guest, on August 28, 2018
ww
w.jlr.org
Dow
nloaded from
21
9. Kerste, S., B. Desvergne, and W. Wahli. 2000. Roles of PPARs in health and disease.
Nature. 405: 421–424.
10. Hashimoto, T., W. Cook, C. Qi, A. Yeldandi, J. Reddy, and M. Rao. 2000. Defect in
peroxisome proliferator-activated receptor alpha inducible fatty acid oxidation
determines the severity of hepatic steatosis in response to fasting. J. Biol. Chem. 275:
28918–28928.
11. Minnich, A., N. Tian, L. Byan, and G. Bilder. 2001. A potent PPAR agonist stimulates
mitochondrial fatty acid-oxidation in liver and skeletal muscle. Am. J. Physiol.
Endocrinol. Metab. 280: E270–E279.
12. Schoonjans, K., B. Staels, and J. Auwerx. 1996. Role of the peroxisome
proliferator-activated receptor (PPAR) in mediating the effects of fibrates and fatty acids
on gene expression. J. Lipid Res. 37: 907–925.
13. Akiyama, T. E., C. J. Nicol, C. Fievet, B. Staels, J. M. Ward, J. Auwerx, S. S. Lee, F. J.
Gonzalez, and J. M. Peters. 2001. Peroxisome proliferator-activated receptor-alpha
regulates lipid homeostasis, but is not associated with obesity: studies with congenic
mouse lines. J. Biol. Chem. 276: 39088–39093.
14. Lindén, D., M. Alsterholm, H. Wennbo, and J. Oscarsson. 2001. PPARalpha deficiency
increases secretion and serum levels of apolipoprotein B-containing lipoproteins. J Lipid
Res. 42:1831-40.
15. Kimura, R, N. Takahashi, K. Murota, Y. Yamada, S. Niiya, N. Kanzaki, Y. Murakami, T.
Moriyama, T. Goto, and T. Kawada. 2011. Activation of peroxisome
proliferator-activated receptor-α (PPARα) suppresses postprandial lipidemia through
fatty acid oxidation in enterocytes. Biochem. Biophys. Res. Commun. 410: 1-6.
16. Uchida, A., M. N. Slipchenko, J. X. Cheng, and K. K. Buhman. 2011. Fenofibrate, a
peroxisome proliferator-activated receptor α agonist, alters triglyceride metabolism in
enterocytes of mice. Biochim. Biophys. Acta. 1811: 170-6.
17. Wong, S. H., E. A. Fisher, and J. B. Marsh. 1989. Effects of eicosapentaenoic and
by guest, on August 28, 2018
ww
w.jlr.org
Dow
nloaded from

22
docosahexaenoic acids on apoprotein B mRNA and secretion of very low density
lipoprotein in HepG2 cells. Arteriosclerosis. 9:836-41.
18. Nestel, P.J., W.E. Connor, M.F. Reardon, S. Connor, S. Wong, and R. Boston. 1984.
Suppression by diets rich in fish oil of very low density lipoprotein production in man. J.
Clin. Invest. 74:82–89.
19. Park, Y., and W.S. Harris, Omega-3 fatty acid supplementation accelerates chylomicron
triglyceride clearance. 2003. J. Lipid Res. 44:455–463.
20. van Schothorst, E. M., P. Flachs, N. L. Franssen-van Hal, O. Kuda, A. Bunschoten, J.
Molthoff, C. Vink, G. J. Hooiveld, J. Kopecky, and J. Keijer. 2009. Induction of lipid
oxidation by polyunsaturated fatty acids of marine origin in small intestine of mice fed a
high-fat diet. BMC Genomics. 10: 110.
21. Goto, T., N. Takahashi, S. Kato, K. Egawa, S. Ebisu, T. Moriyama, T. Fushiki, and T.
Kawada. 2005. Phytol directly activates peroxisome proliferator-activated receptor alpha
(PPAR alpha) and regulates gene expression involved in lipid metabolism in PPAR
alpha-expressing HepG2 hepatocytes. Biochem. Biophys. Res. Commun. 337: 440-5.
22. Kuroyanagi, K., M. S. Kang, T. Goto, S. Hirai, K. Ohyama, T. Kusudo, R. Yu, M. Yano,
T. Sasaki, N. Takahashi, and T. Kawada. 2008. Citrus auraptene acts as an agonist for
PPARs and enhances adiponectin production and MCP-1 reduction in 3T3–L1
adipocytes. Biochem. Biophys. Res. Commun. 366: 219–225.
23. Takahashi, N., M. Senda, S. Lin, T. Goto, M. Yano, T. Sasaki, S. Murakami, and T.
Kawada. 2011. Auraptene regulates gene expression involved in lipid metabolism
through PPARα activation in diabetic obese mice. Mol Nutr Food Res. 55:1791-7.
24. Wu, M., A. Neilson, A. L. Swift, R. Moran, J. Tamagnine, D. Parslow, S. Armistead, K.
Lemire, J. Orrell, J. Teich, S. Chomicz, and D.A. Ferrick. 2007. Multiparameter
metabolic analysis reveals a close link between attenuated mitochondrial bioenergetic
function and enhanced glycolysis dependency in human tumor cells. Am. J. Physiol. Cell
Physiol. 292: C125–C136
by guest, on August 28, 2018
ww
w.jlr.org
Dow
nloaded from
23
25. Goto, T., J. Y. Lee, A. Teraminami, Y. I. Kim, S. Hirai, T. Uemura, H. Inoue, N.
Takahashi, and T. Kawada. 2011. Activation of peroxisome proliferator-activated
receptor-alpha stimulates both differentiation and fatty acid oxidation in adipocytes. J
Lipid Res. 52: 873-84.
26. Hernández Vallejo, S. J., M. Alqub, S. Luquet, C. Cruciani-Guglielmacci, P. Delerive, J.
M. Lobaccaro, A. D. Kalopissis, J. Chambaz, M. Rousset, and J. M. Lacorte. 2009.
Short-term adaptation of postprandial lipoprotein secretion and intestinal gene
expression to a high-fat diet. Am J Physiol Gastrointest Liver Physiol. 296: G782-92.
27. Nakatani, T., H. J. Kim, Y. Kaburagi, K. Yasuda, and O. Ezaki. 2003. A low fish oil
inhibits SREBP-1 proteolytic cascade, while a high-fish-oil feeding decreases SREBP-1
mRNA in mice liver: relationship to anti-obesity. J Lipid Res. 44:369-79.
28. X. Lin, P. Yue, Z. Chen, and G. Schonfeld. 2005. Hepatic triglyceride contents are
genetically determined in mice: results of a strain survey. Am J Physiol Gastrointest
Liver Physiol. 288:G1179-89.
29. Eder, K., A. M. Reichlmayr-Lais, and M. Kirchgessner. 1993. Studies on the extraction
of phospholipids from erythrocyte membranes in the rat. Clin Chim Acta. 219: 93-104.
30. Perera, M.A., S.Y. Choi, E.S. Wurtele, and B.J. Nikolau. 2009. Quantitative analysis of
short-chain acyl-coenzymeAs in plant tissues by LC-MS-MS electrospray ionization
method. J Chromatogr B Analyt Technol Biomed Life Sci. 877:482-8.
31. Folch, J., M. Lees, and G. H. Sloane Stanley. 1957. A simple method for the isolation
and purification of total lipids from animal tissues. J. Biol. Chem. 226: 497–509.
32. Fu. J., S. Gaetani, F. Oveisi, J. Lo Verme, A. Serrano, F. Rodríguez De Fonseca, A. H.
Rosengarth, Luecke, B. Di Giacomo, G. Tarzia, and D. Piomelli. 2003.
Oleylethanolamide regulates feeding and body weight through activation of the nuclear
receptor PPAR-alpha. Nature. 425:90-3.
33. Escher, P., O. Braissant, S. Basu-Modak, L. Michalik, W. Wahli, and B. Desvergne.
2001. Rat PPARs: quantitative analysis in adult rat tissues and regulation in fasting and
by guest, on August 28, 2018
ww
w.jlr.org
Dow
nloaded from

24
refeeding. Endocrinology. 142:4195-202.
34. Kim, YI., S. Hirai, T. Goto, C. Ohyane, H. Takahashi, T. Tsugane, C. Konishi, T. Fujii, S.
Inai, Y. Iijima, K. Aoki, D. Shibata, N. Takahashi, and T. Kawada. 2012. Potent PPARα
activator derived from tomato juice, 13-oxo-9,11-octadecadienoic acid, decreases plasma
and hepatic triglyceride in obese diabetic mice. PLoS One. 7:e31317
35. Shen. P., M. H. Liu, T. Y. Ng, Y. H. Chan, and E. L. Yong. 2006. .Differential effects of
isoflavones, from Astragalus membranaceus and Pueraria thomsonii, on the activation of
PPARalpha, PPARgamma, and adipocyte differentiation in vitro. J Nutr. 136:899-905.
36. de Vogel-van den Bosch, H.M., M. Bünger, P.J. de Groot, H. Bosch-Vermeulen, G.J.
Hooiveld, and M. Müller. 2008. PPARalpha-mediated effects of dietary lipids on
intestinal barrier gene expression. BMC Genomics. 9:231.
37. Mori, T., H. Kondo, T. Hase, I. Tokimitsu, and T. Murase. 2007. Dietary fish oil
upregulates intestinal lipid metabolism and reduces body weight gain in C57BL/6J
mice. J Nutr. 137:2629-34.
38. Shearer, G..C., O.V. Savinova, and W.S. Harris. 2012. Fish oil - How does it reduce
plasma triglycerides? Biochim Biophys Acta. 1821:843-51.
39. Lewis, G.F., K. D. Uffelman, L. W. Szeto, and G.. Steiner. 1993. Effects of acute
hyperinsulinemia on VLDL triglyceride and VLDL apoB production in normal weight
and obese individuals. Diabetes. 42:833-42.
40. Baker, P.W. and G.F. Gibbons. 2000. Effect of dietary fish oil on the sensitivity of
hepatic lipid metabolism to regulation by insulin. J Lipid Res. 41:719-26.
41. Muoio, D.M., P.S. MacLean, D.B. Lang, S. Li, J.A. Houmard, J.M. Way, D.A. Winegar
J.C. Corton, G.L. Dohm, and W.E. Kraus. 2002. Fatty acid homeostasis and induction of
lipid regulatory genes in skeletal muscles of peroxisome proliferator-activated receptor
(PPAR) alpha knock-out mice. Evidence for compensatory regulation by PPAR delta. J
Biol Chem. 277:26089-97.
42. Kleiner. S., V. Nguyen-Tran, O. Baré, X. Huang, B. Spiegelman, and Z . Wu. 2009.
by guest, on August 28, 2018
ww
w.jlr.org
Dow
nloaded from

25
PPAR{delta} agonism activates fatty acid oxidation via PGC-1{alpha} but does not
increase mitochondrial gene expression and function. J Biol Chem. 284:18624-33.
43. Drover, V.A., M. Ajmal, F. Nassir, N.O. Davidson, A.M. Nauli, D. Sahoo, P. Tso, and
N.A. Abumrad. 2005. CD36 deficiency impairs intestinal lipid secretion and clearance of
chylomicrons from the blood. J Clin Invest. 115: 1290-7.
44. Tran, T.T., H. Poirier, L. Clément, F. Nassir, M.M. Pelsers, V. Petit, P. Degrace, M.C.
Monnot, J.F. Glatz, N.A. Abumrad, P. Besnard, and Niot I. 2011. Luminal lipid regulates
CD36 levels and downstream signaling to stimulate chylomicron synthesis. J Biol Chem.
286: 25201-10.
45. Masuda, D., K. Hirano, H. Oku, J.C. Sandoval, R. Kawase, M. Yuasa-Kawase, Y.
Yamashita, M. Takada, K. Tsubakio-Yamamoto, Y. Tochino, M. Koseki, F. Matsuura, M.
Nishida, T. Kawamoto, M. Ishigami, M. Hori, I. Shimomura, and S. Yamashita. 2009.
Chylomicron remnants are increased in the postprandial state in CD36 deficiency. J Lipid
Res. 50:999-1011.
46. McFarlan, J.T., Y. Yoshida, S.S. Jain, X.X. Han, L.A. Snook, J. Lally, B.K. Smith, J.F.
Glatz, J.J. Luiken, R.A. Sayer, A.R. Tupling, A. Chabowski, G.P. Holloway, and A.
Bonen. 2012. In vivo, fatty acid translocase (CD36) critically regulates skeletal muscle
fuel selection, exercise performance, and training-induced adaptation of fatty acid
oxidation. J Biol Chem. 287:23502-16.
47. Rakhshandehroo M, B. Knoch, M. Müller, and S. Kersten. 2010. Peroxisome
proliferator-activated receptor alpha target genes. PPAR Res. 2010: 612089.
.
by guest, on August 28, 2018
ww
w.jlr.org
Dow
nloaded from
26
Figure legends
Fig. 1 DHA activated PPARα in luciferase assays using the GAL4 chimera and
PPRE-luc systems
(A) Luciferase assay using the GAL4/ PPARα chimera system in CV-1 cells. Reporter
plasmids (p4XUASg-luc and pRL-CMV) were transfected into CV-1 cells together with pM-h
PPARα. Transfected cells were treated with bezafibrate or DHA at the indicated
concentrations for 24 h. (B) Luciferase assay using a PPRE-luc system in Caco-2 cells.
Reporter plasmids (p4XPPRE-tk-luc and pRL-CMV) were transfected into Caco-2 cells.
Transfected cells were treated with bezafibrate or DHA at the indicated concentrations for 24
h. (C-E) Luciferase assay using the GAL4/ PPARα, PPARγ and PPARδ chimera system in
Caco-2 cells. Reporter plasmids were transfected with pM-hPPARα, pM-hPPARγ and
pM-hPPARδ in Caco-2 cells. Transfected cells were treated with 25 µM DHA and EPA, and
50 µM bezafibrate, 1 µM pioglitazone or 1 µM GW501516 as positive controls for 24 h. The
average activity of luciferase in a vehicle control was set at 100% and the relative activities
were represented as fold induction relative to that of control. Values are means ± S.E.M. of
5-10 tests. *P < 0.05 and **P < 0.01 compared to each control.
Fig. 2 FA oxidation-related gene expressions and oxygen consumption rate (OCR)
were increased in DHA-treated Caco-2 cells
(A–E) The mRNA expression levels of FA oxidation-related genes (Acs, Cpt1a, and Aox)
and other PPARα target genes (Ucp2 and Fabp) were quantified. (F) Oxygen consumption
rate (OCR) was determined using extracellular flux analysis as described in the “Materials
and methods” section. Values of controls were set at 100% and the relative values were
represented as fold induction relative to that of control. Values are means ± S.E.M. of 6 tests.
*P < 0.05 and **P < 0.01 compared to each control.
by guest, on August 28, 2018
ww
w.jlr.org
Dow
nloaded from

27
Fig. 3 DHA decreased TG and apoB secretion from Caco-2 cells
TG (A) and apoB (B) secretion from Caco-2 cells into the basolateral side were measured
as described in the “Materials and methods” section. Control values were set at 100% and the
relative values were represented as fold induction relative to that of control. Values are means
± S.E.M. of 6 tests. *P < 0.05 and **P < 0.01 compared to each control.
Fig. 4 FA oxidation was enhanced in intestinal epithelial cells of DHA-rich oil fed
C57BL/6 mice
(A–F) The mRNA expression levels of FA oxidation-related genes (Acs, Cpt1a and Aox)
and other PPARα target genes (Ucp2, Fabp, and Cd36) in intestinal epithelial cells were
quantified. (G and H) Production of CO2 and ASM in intestinal epithelial cells was
determined using [14C] palmitic acid. Control values were set at 100% and the relative values
are represented as fold induction relative to that of control. The values are means ± S.E.M. of
6 tests. *P < 0.05 and **P < 0.01 compared to each control.
Fig. 5 FA oxidation was not enhanced in the liver of DHA-rich oil fed C57BL/6 mice
(A–C) The mRNA expression levels of FA oxidation-related genes (Acs, Cpt1a and Aox)
in the liver were determined by real-time PCR. (D and E) Production of CO2 and ASM in the
liver was determined using [14C] palmitic acid. Control values were set at 100% and the
relative values are represented as fold induction relative to that of control. The values are
means ± S.E.M. of 6 tests.
Fig. 6 Postprandial hyperlipidemia was attenuated by decreasing TG secretion from
intestinal epithelial cells of DHA-rich oil fed C57BL/6 mice
(A and B) Plasma TG levels every 30 to 240 min and plasma apoB48 levels at 120 min
after oral administration of olive oil were measured in control and DHA-rich oil-fed C57BL/6
mice. Plasma TG level was measured by enzymatic colorimetric assay. Plasma apoB48
by guest, on August 28, 2018
ww
w.jlr.org
Dow
nloaded from
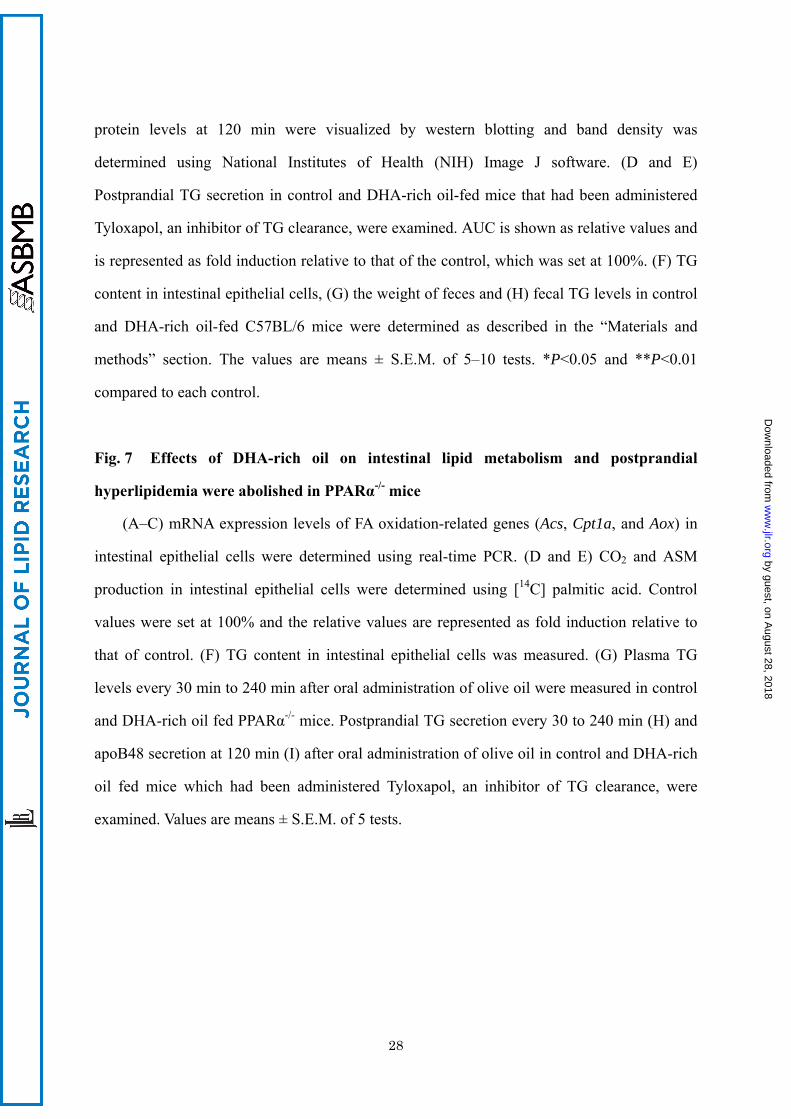
28
protein levels at 120 min were visualized by western blotting and band density was
determined using National Institutes of Health (NIH) Image J software. (D and E)
Postprandial TG secretion in control and DHA-rich oil-fed mice that had been administered
Tyloxapol, an inhibitor of TG clearance, were examined. AUC is shown as relative values and
is represented as fold induction relative to that of the control, which was set at 100%. (F) TG
content in intestinal epithelial cells, (G) the weight of feces and (H) fecal TG levels in control
and DHA-rich oil-fed C57BL/6 mice were determined as described in the “Materials and
methods” section. The values are means ± S.E.M. of 5–10 tests. *P<0.05 and **P<0.01
compared to each control.
Fig. 7 Effects of DHA-rich oil on intestinal lipid metabolism and postprandial
hyperlipidemia were abolished in PPARα-/- mice
(A–C) mRNA expression levels of FA oxidation-related genes (Acs, Cpt1a, and Aox) in
intestinal epithelial cells were determined using real-time PCR. (D and E) CO2 and ASM
production in intestinal epithelial cells were determined using [14C] palmitic acid. Control
values were set at 100% and the relative values are represented as fold induction relative to
that of control. (F) TG content in intestinal epithelial cells was measured. (G) Plasma TG
levels every 30 min to 240 min after oral administration of olive oil were measured in control
and DHA-rich oil fed PPARα-/- mice. Postprandial TG secretion every 30 to 240 min (H) and
apoB48 secretion at 120 min (I) after oral administration of olive oil in control and DHA-rich
oil fed mice which had been administered Tyloxapol, an inhibitor of TG clearance, were
examined. Values are means ± S.E.M. of 5 tests.
by guest, on August 28, 2018
ww
w.jlr.org
Dow
nloaded from

29
Table
Table 1 Primers used for quantitative real-time PCR Gene Primer sequences (5’-3’)
human 36b4 Fw: AAACTGCTGCCTCATATCCGG
Rev: TTGTAGATGCTGCCATTGTCGA
human Acs Fw: AGCAGAGCTTCGCAGCGGC
Rev: CTGCTGTTTTCGCTGGGTCC
human Cpt1a Fw: AATCATCAAGAAATGTCGCACGA
Rev: AGGCAGAAGAGGTGACGATCG
human Aox Fw: GGCATGGTGTCCTATTTGAACG
Rev: AAGCAACAGCATCTGAGCGAAT
human Ucp2 Fw: CAAATGAGCTTTGCCTCTGTC
Rev: ATGGTCTTGTAGGCATTGACG
human Fabp Fw: CCTTCATGAAGGCAATCGGTC
Rev: AATGTCATGGTATTGGTGATTATGTCG
mouse 36b4 Fw:TGTGTGTCTGCAGATCGGGTAC
Rev: CTTTGGCGGGATTAGTCGAAG
mouse Acs Fw: ACGTATCCCTGGACTAGGACCG
Rev: GAGATATTCTGGCCACCGATCA
mouse Cpt1a Fw: CTCAGTGGGAGCGACTCTTCA
Rev: GGCCTCTGTGGTACACGACAA
mouse Aox Fw: CTTGTTCGCGCAAGTGAGG
Rev: CAGGATCCGACTGTTTACC
mouse Ucp2 Fw: CCCAGCCTACAGATGTGGTAA
Rev: GAGGTTGGCTTTCAGGAGAGT
mouse Fabp Fw: AAGACAGCTCCTCCTCGAAGGTT
Rev: TGACCAAATCCCCTAAATGCG
mouse Cd36 Fw: ATTGTACCTGGGAGTTGGCGAGAA
Rev: AACTGTCTGTAGACAGTGGTGCCT
by guest, on August 28, 2018
ww
w.jlr.org
Dow
nloaded from

30
Table 2 Composition of experimental diets
experimental diet control 1.9% DHA 3.7% DHA
DHA rich oil (%b) 0 4.13 8.25
Corn oil (%) 33.5 29.38 25.25
Casein (%) 29 29 29
Sucrose (%) 23.29 23.29 23.29
Vitamin mix (%) 1.45 1.45 1.45
Mineral mix (%) 5.08 5.08 5.08
Cellulose powder (%) 7.25 7.25 7.25
L-Cysteine (%) 0.44 0.44 0.44
Fat energy (en %) a 60.5 60.6 60.7
DHA (en %) a 0 1.85 3.69
EPA (en %) a 0 0.58 1.16
DHA, docosahexaenoic acid; EPA, eicosapentaenoic acid.
a Percent of energy from total energy intake
b Percent of weight from total food weight
by guest, on August 28, 2018
ww
w.jlr.org
Dow
nloaded from

Fig.1
Kimura et al.
B PPRE-luc
C PPARα-luc D PPARγ-luc E PPARδ-luc
A PPARα-luc (CV-1)
by guest, on August 28, 2018
ww
w.jlr.org
Dow
nloaded from
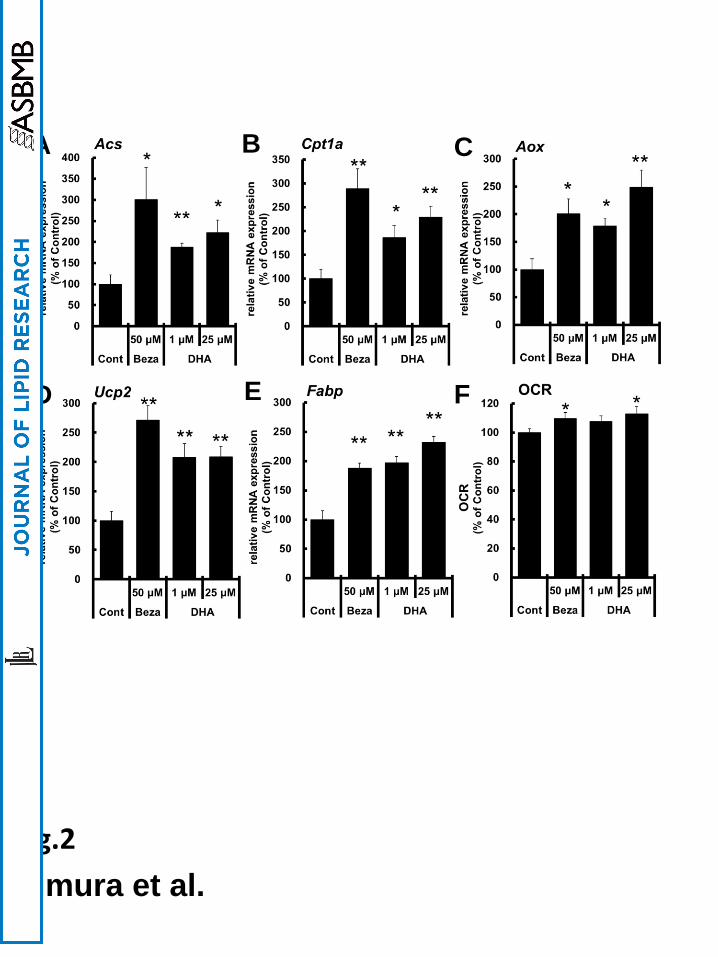
Fig.2
Kimura et al.
B C
D E
A
F by guest, on August 28, 2018
ww
w.jlr.org
Dow
nloaded from
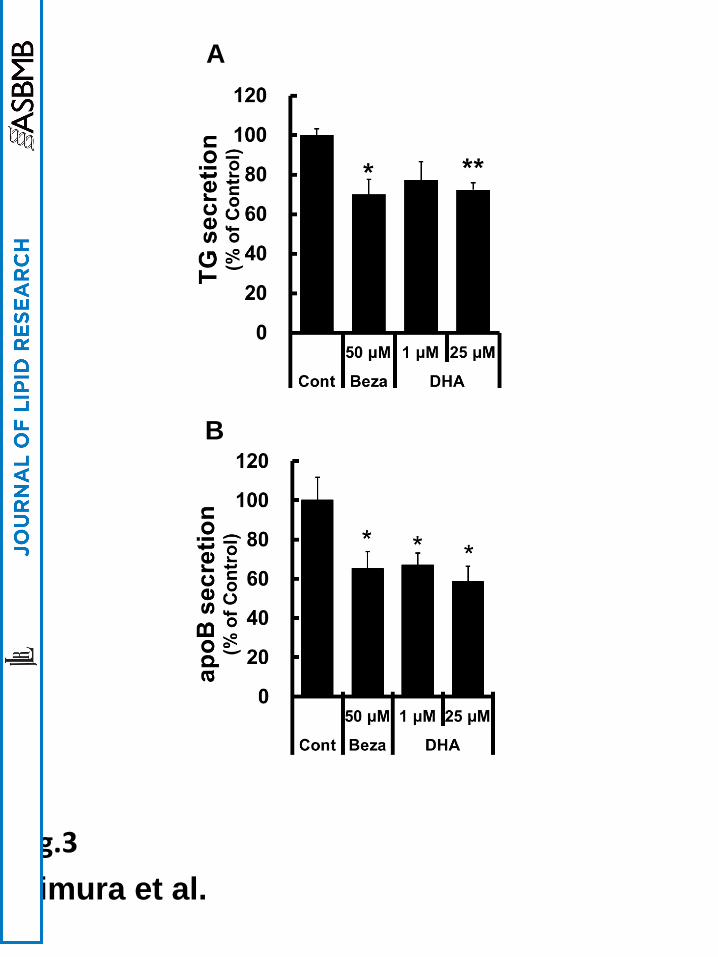
Fig.3
Kimura et al.
A
B
by guest, on August 28, 2018
ww
w.jlr.org
Dow
nloaded from
F G H
A
Fig.6
Kimura et al.
B
C D
E
by guest, on August 28, 2018
ww
w.jlr.org
Dow
nloaded from
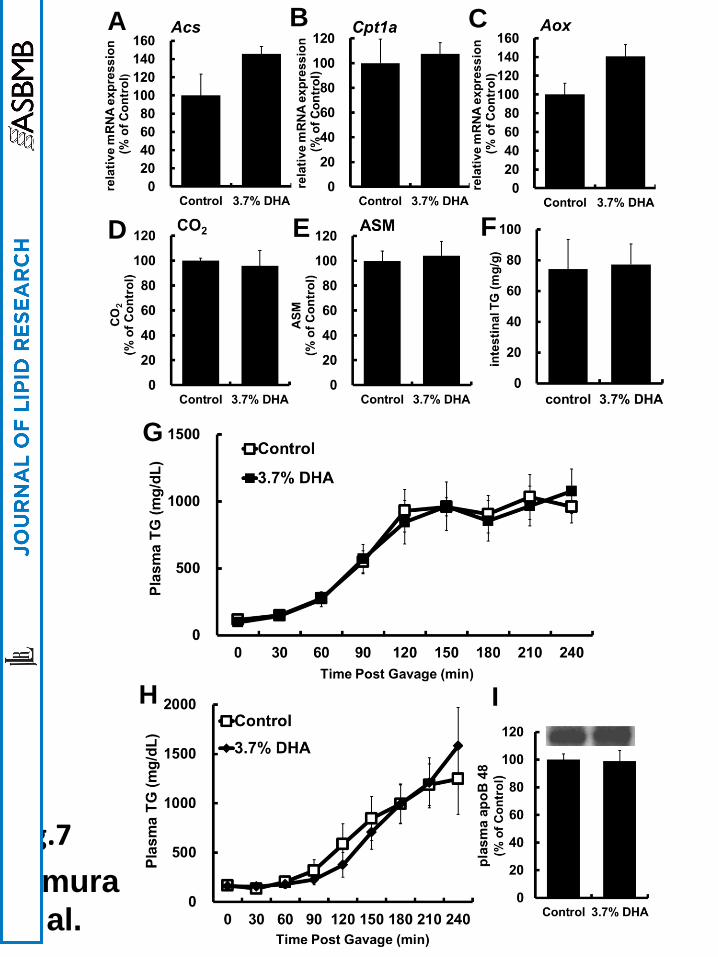
Fig.7
Kimura
et al.
I
G
H
E
B C
D
A
F
by guest, on August 28, 2018
ww
w.jlr.org
Dow
nloaded from