DEVELOPMENT REVIEW - City of Huntsville · The Huntsville Development Review is a compilation of...
36
THE HUNTSVILLE DEVELOPMENT REVIEW 2017
Transcript of DEVELOPMENT REVIEW - City of Huntsville · The Huntsville Development Review is a compilation of...

THE
HUNTSVILLE
DEVELOPMENT
REVIEW 2017
Table of Contents
Map of Census Tracts, City Limits……………3
Residential…………………………………….....4
Subdivisions……………………………………. 10
Real Estate……………………………………….13
Commercial and Other………………………… 23
Annexations, Zonings and Rezonings.……….25
Population and Housing Estimates…………...29
Definitions………………………………………..35
About
The Huntsville Development Review is a compilation of construction and real estate data published annually by the City of Huntsville’s Long-Range Planning Division. Data for this report is obtained from city records and the North Alabama Multiple Listing Service (NALMLS). Special thanks also go to the City’s Inspection Department for their assistance.
Questions or comments about the Review? Email the editor at [email protected].
Cover Photos
Clockwise, from top left: AC Hotel, Sanctuary Cove, Limestone Creek Apartments, Shoppes at Redstone
Disclaimer
The editor and contributing staff members of the Long-Range Planning, Planning Services and Geographic Information Systems (GIS) divisions have worked hard to ensure the accuracy of the data within this document. However, no guarantee of accuracy can be made with regard to such data. The City of Huntsville and any employee, individual, organization, or agency which has contributed toward the substance or format of this document shall not be held liable for any damage or loss resulting from the use of or reliance on any information contained within this document.
THE
HUNTSVILLE
DEVELOPMENT
REVIEW
2017 Annual Edition
Volume 34, Published January 2018
A Publication of the City of Huntsville
Department of Urban Development, Long Range Planning Division
PO Box 308 Huntsville, AL 35804
Planning Director
Michelle Jordan
Manager of Urban and Long-
Range Planning
Dennis Madsen
Manager of Planning Services
Jim McGuffey
Editor
James Vandiver
Contributing Staff Members
Connie Graham
Amy Kenum
Ashley Nichols
Thomas Nunez
2

£¤431
£¤231
£¤231 £¤431
£¤72£¤72
¬«53
¬«255
§̈¦565
§̈¦65
§̈¦65
NEW MARKET
HUNTSVILLE
OWENSCROSS ROADS
NEW HOPE
REDSTONE ARSENAL
TRIANA
TRIANA
MOORESVILLEDECATUR
HARVEST
US
23
1/4
31
WINCHE ST ER RD
WINCHE ST ER RD
HWY 72 E AS T
GOO SE CREE K
FLINTRIVER
AL
DR
IDG
EC
REE
K
VE DRA
MO
NTE
GRE ENCOV E RD
MT. GAP
RD
WE ATHE RLY R D
HIC
KO
RY
HIL
L L
N
FOUR M ILE
GOV E RNORS
WH
ITE
SB
UR
G
JOHNS ONRD
R. R.
PK
WY
HWY 72
ME
MO
RIA
L P
KWY
UNIV E RSIT Y DR
JOR
DA
N LN
PU
LA
SK
I PIK
E
BO B WA DE LN
NICK DAV IS DR
JEF
F R
D
OLD MA DIS ON P IKE
MILL RD
HWY 20
I - 565
HWY 72 W ES T
OLD US 3
1
I - 65
PINE
Y CR
EEK
LIMESTONE CO.MORGAN CO.
MO
RGAN CO
.
MADIS
ON CO.
MADISON
ATHENS
14.01
31
30
106.23106.24
13.0213.01
110.12
107.01
112
102
101
29.22
114
113
110.11
104.02
110.22
110.14
29.11
28.01 27.2127.01
26
25.02
24
23
22
19.03
18.01171512
9.02
7.02
7.01
6.026.01
5.035.02
5.01
3.02 3.01 2.02
108
105.02
106.22106.12
110.13
105.01
106.21
29.21
29.12
28.02
27.22
25.01
2120
19.02
19.01
14.02
10
9.01
4.03
2.01
110.21
107.02
109.02
109.01
111
202.01201.01
212
209
207
211
208.02
206 208.01
City Limits as of 1/11/2018
2010 Census Tracts
3

Residential
BUILDING PERMITS
There were 1,574 residential dwellings issued building permits in the City of
Huntsville in 2017, a decrease of 12.2 percent over 2016’s total of 1,792.
o The number of multi-family units issued building permits decreased by 40.7
percent over 2016. Apartment and condominium projects were concentrated
in Research Park and Limestone County.
o The number of single-family building permits issued (1,120) increased by 5.1
percent over 2016.
Single-family attached (townhome) units permitted more than
quadrupled between 2016 and 2017.
o The census tract with the largest total number of units permitted was 14.02
(Research Park).
Table R-1. TOP CENSUS TRACTS- RESIDENTIAL BUILDING PERMITS (NEW
CONSTRUCTION), BY NUMBER OF UNITS PERMITTED
Census Tract (2010)
Areas Included # of Units Permitted
14.02 Research Park 282
109.01 Hampton Cove 271
112 Martin-Zierdt 196
212 Greenbrier 186
113 Green Mountain 132
TOTAL CITYWIDE 1,574
Table R-2. RESIDENTIAL BUILDING PERMITS, CITYWIDE
The total contract amount of residential projects permitted in Huntsville in 2017
was $89,101,980, down 4.2 percent from 2016.
Building Type Total Units Contract
Amount Total Single Family, Detached 1,067 $51,380,094
Single Family, Attached (Townhomes)
53 $4,238,823
Multi-Family, Apartment 420 $30,593,063
Multi-Family, Condominium 34 $2,890,000
4

CERTIFICATES OF OCCUPANCY
A total of 1,726 certificates of occupancy were issued for residential dwellings in the
City of Huntsville in 2017, an increase of 8.4 percent over 2016’s total of 1,592.
o The top census tract for residential CO’s, by the number of units, was 106.22
(Providence).
Table R-3. TOP CENSUS TRACTS- RESIDENTIAL CERTIFICATES OF
OCCUPANCY (NEW CONSTRUCTION), BY NUMBER OF UNITS
Census Tract (2010)
Areas Included # of Units Granted
106.22 Providence 436
109.01 Hampton Cove 251
112 Martin-Zierdt 219
106.12 72 West 159
212 Greenbrier 120
TOTAL CITYWIDE 1,726
Table R-4. RESIDENTIAL CERTIFICATES OF OCCUPANCY, CITYWIDE
The total contract amount of residential units granted CO’s increased by 34.6
percent between 2016 and 2017.
Building Type Total Units Contract
Amount Total Single Family, Detached 1,017 $48,618,449 Single Family, Attached
(Townhomes) 32 $1,677,538
Multi-Family, Apartment 652 $43,960,036 Multi-Family, Condominium
25 $1,680,000
5
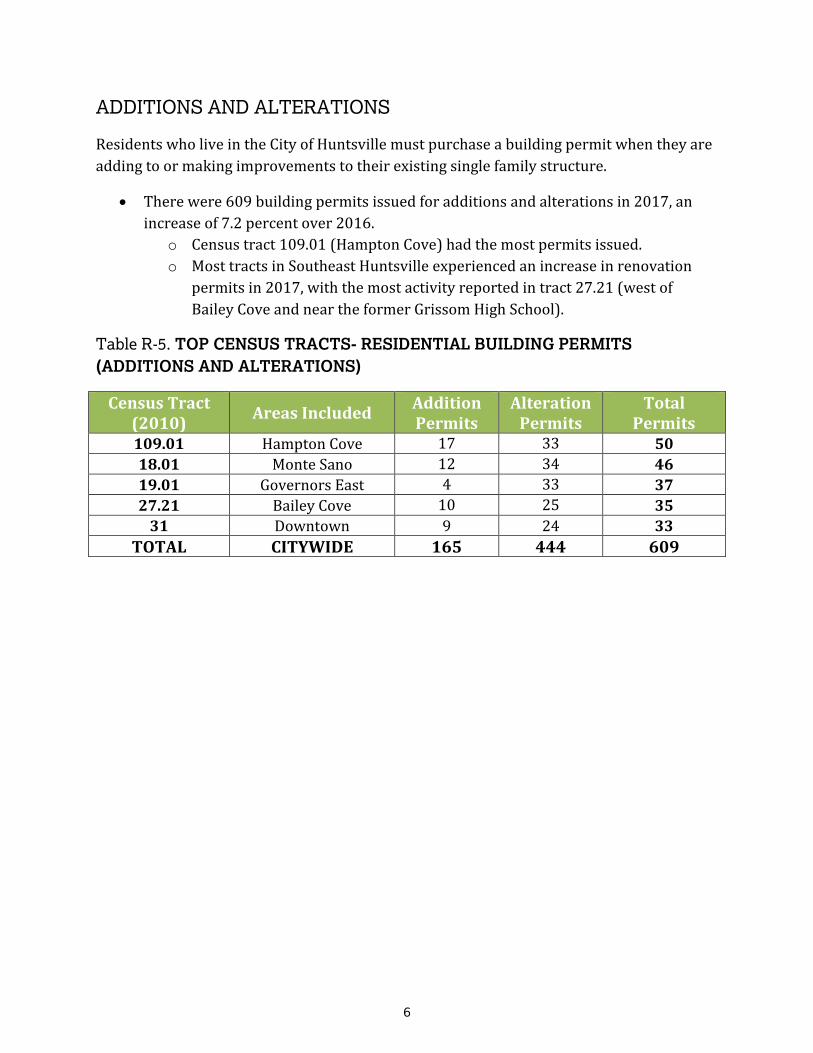
ADDITIONS AND ALTERATIONS
Residents who live in the City of Huntsville must purchase a building permit when they are
adding to or making improvements to their existing single family structure.
There were 609 building permits issued for additions and alterations in 2017, an
increase of 7.2 percent over 2016.
o Census tract 109.01 (Hampton Cove) had the most permits issued.
o Most tracts in Southeast Huntsville experienced an increase in renovation
permits in 2017, with the most activity reported in tract 27.21 (west of
Bailey Cove and near the former Grissom High School).
Table R-5. TOP CENSUS TRACTS- RESIDENTIAL BUILDING PERMITS
(ADDITIONS AND ALTERATIONS)
Census Tract (2010)
Areas Included Addition Permits
Alteration Permits
Total Permits
109.01 Hampton Cove 17 33 50
18.01 Monte Sano 12 34 46
19.01 Governors East 4 33 37
27.21 Bailey Cove 10 25 35
31 Downtown 9 24 33
TOTAL CITYWIDE 165 444 609
6

431
231
231 431
7272
53
255
565
65
65
NEW MARKET
HUNTSVILLE
OWENSCROSS ROADS
NEW HOPE
REDSTONE ARSENAL
TRIANA
TRIANA
MOORESVILLEDECATUR
HARVEST
US
231/
431
WINCHESTER RD
WINCHESTER RD
HWY 72 EAST
GOOSE CREEK
FLINTRIVER
ALD
RID
GE
CR
EEK
VEDRA
MO
NTE
GREENCOVE RD
MT. GAP
RD
WEATHERLY RD
HIC
KO
RY
HIL
L LN
FOUR MILE
GOVERNORS
WH
ITESBU
RG
JOHNSON RD
R. R.
PKW
Y
HWY 72
ME
MO
RIA
L PK
WY
UNIVERSITY DR
JORDAN LN
PULA
SK
I PIKE
BOB WADE LN
NICK DAVIS DR
JEFF R
D
OLD MADISON PIKE
MILL RD
HWY 20
I - 565
HWY 72 WEST
OLD U
S 31
I - 65
PINEY C
REEK
LIMESTONE CO.MORGAN CO.
MORGAN C
O.
MADIS
ON CO.
MADISON
14.01
31
30
106.23106.24
13.0213.01
110.12
107.01
112
102
101
29.22
114
113
110.11
104.02
110.22
110.14
29.11
28.01 27.2127.01
26
25.02
24
23
22
19.03
18.011715
12
9.02
7.02
7.01
6.026.01
5.035.025.01
3.02 3.01 2.02
108
105.02
106.22106.12
110.13
105.01
106.21
29.21
29.12
28.02
27.22
25.01
2120
19.02
19.01
14.02
10
9.01
4.03
2.01
110.21
107.02
109.02
109.01
111
202.01
201.01
212
209
207
211
208.02
206 208.01
Residential Building Permitsby Census Tract
Building Permits Issued0-1011-5051-100101-200201-282
Note: Number of units shown were permitted within Huntsville city limits between Jan. 2017-Dec. 2017 7

431
231
231 431
7272
53
255
565
65
65
NEW MARKET
HUNTSVILLE
OWENSCROSS ROADS
NEW HOPE
REDSTONE ARSENAL
TRIANA
TRIANA
MOORESVILLEDECATUR
HARVEST
US
231/
431
WINCHESTER RD
WINCHESTER RD
HWY 72 EAST
GOOSE CREEK
FLINTRIVER
ALD
RID
GE
CR
EEK
VEDRA
MO
NTE
GREENCOVE RD
MT. GAP
RD
WEATHERLY RD
HIC
KO
RY
HIL
L LN
FOUR MILE
GOVERNORS
WH
ITESBU
RG
JOHNSON RD
R. R.
PKW
Y
HWY 72
ME
MO
RIA
L PK
WY
UNIVERSITY DR
JORDAN LN
PULA
SK
I PIKE
BOB WADE LN
NICK DAVIS DR
JEFF R
D
OLD MADISON PIKE
MILL RD
HWY 20
I - 565
HWY 72 WEST
OLD U
S 31
I - 65
PINEY C
REEK
LIMESTONE CO.MORGAN CO.
MORGAN C
O.
MADIS
ON CO.
MADISON
14.01
31
30
106.23106.24
13.0213.01110.12
107.01
112
102
101
29.22
114
113
110.11
104.02
110.22
110.14
29.11
28.01 27.2127.01
26
25.02
24
23
22
19.03
18.011715
12
9.02
7.02
7.01
6.026.01
5.035.025.01
3.02 3.01 2.02
108
105.02
106.22106.12
110.13
105.01
106.21
29.21
29.12
28.02
27.22
25.01
2120
19.02
19.01
14.02
10
9.01
4.03
2.01
110.21
107.02
109.02
109.01
111
202.01
201.01
212
209
207
211
208.02
206 208.01
Residential Certificates of Occupancyby Census TractCertificates of Occupancy Issued
0-10
51-100101-200201-436
11-50
Note: Number of units shown were granted Certificates of Occupancy within Huntsville city limits between Jan. 2017-Dec. 2017. 8

431
231
231 431
7272
53
255
565
65
65
NEW MARKET
HUNTSVILLE
OWENSCROSS ROADS
NEW HOPE
REDSTONE ARSENAL
TRIANA
TRIANA
MOORESVILLEDECATUR
HARVEST
US
231/
431
WINCHESTER RD
WINCHESTER RD
HWY 72 EAST
GOOSE CREEK
FLINTRIVER
ALD
RID
GE
CR
EEK
VEDRA
MO
NTE
GREENCOVE RD
MT. GAP
RD
WEATHERLY RD
HIC
KO
RY
HIL
L LN
FOUR MILE
GOVERNORS
WH
ITESBU
RG
JOHNSON RD
R. R.
PKW
Y
HWY 72
ME
MO
RIA
L PK
WY
UNIVERSITY DR
JORDAN LN
PULA
SK
I PIKE
BOB WADE LN
NICK DAVIS DR
JEFF R
D
OLD MADISON PIKE
MILL RD
HWY 20
I - 565
HWY 72 WEST
OLD U
S 31
I - 65
PINEY C
REEK
LIMESTONE CO.MORGAN CO.
MORGAN C
O.
MADIS
ON CO.
MADISON
14.01
31
30
106.23106.24
13.0213.01110.12
107.01
112
102
101
29.22
114
113
110.11
104.02
110.22
110.14
29.11
28.01 27.2127.01
26
25.02
24
23
22
19.03
18.011715
12
9.02
7.02
7.01
6.026.01
5.035.025.01
3.02 3.01 2.02
108
105.02
106.22106.12
110.13
105.01
106.21
29.21
29.12
28.02
27.22
25.01
2120
19.02
19.01
14.02
10
9.01
4.03
2.01
110.21
107.02
109.02
109.01
111
202.01
201.01
212
209
207
211
208.02
206 208.01
Addition/Alteration Building Permitsby Census TractBuilding Permits Issued
0-56-1011-2021-3031-50
Note: Number of units shown were permitted within Huntsville city limits between Jan. 2017-Dec. 2017 9

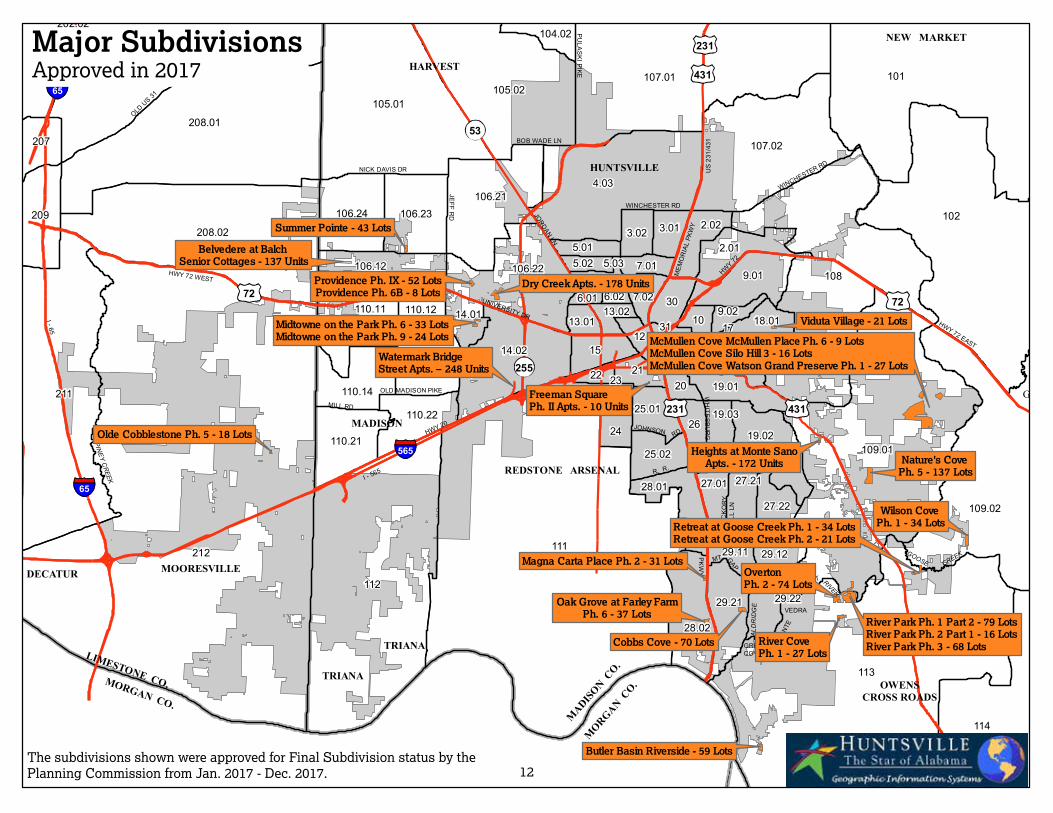
Subdivisions
HIGHLIGHTS
Between 2016 and 2017, the total number of single family subdivision lots approved
increased by 30.8 percent. The number of multi-family units approved increased by
148 percent, from 300 units to 745.
o The largest single-family residential subdivision approved in 2017 was the
137-lot Nature’s Cove Phase 5 near Hampton Cove in East Huntsville.
o The largest multi-family project given approval was the 248-unit Watermark
Bridge Street in Research Park.
Only final approval for new subdivisions and boundary plat approval for apartments are
included in these tables.
Table S-1. SUBDIVISION LOTS/UNITS APPROVED, BY PROJECT TYPE
Subdivision Type Number of Lots/Units
Approved Largest Project, by # of
Lots/Units Commercial 49 MidCity Phase 2
Single-Family 968 Nature’s Cove Phase 5 Multi-Family 745 Watermark Bridge Street Public/Other 0
TOTAL 1,762
Table S-2. TOP CENSUS TRACTS-- NUMBER OF MAJOR SUBDIVISION
LOTS/UNITS APPROVED
Census Tract (2010)
Areas Included # of Lots/Units
Permitted 113 Green Mountain 383
109.01 Hampton Cove 367
14.02 Research Park 258
106.22 Providence 240
106.12 72 West 139
TOTAL CITYWIDE 1,762
10
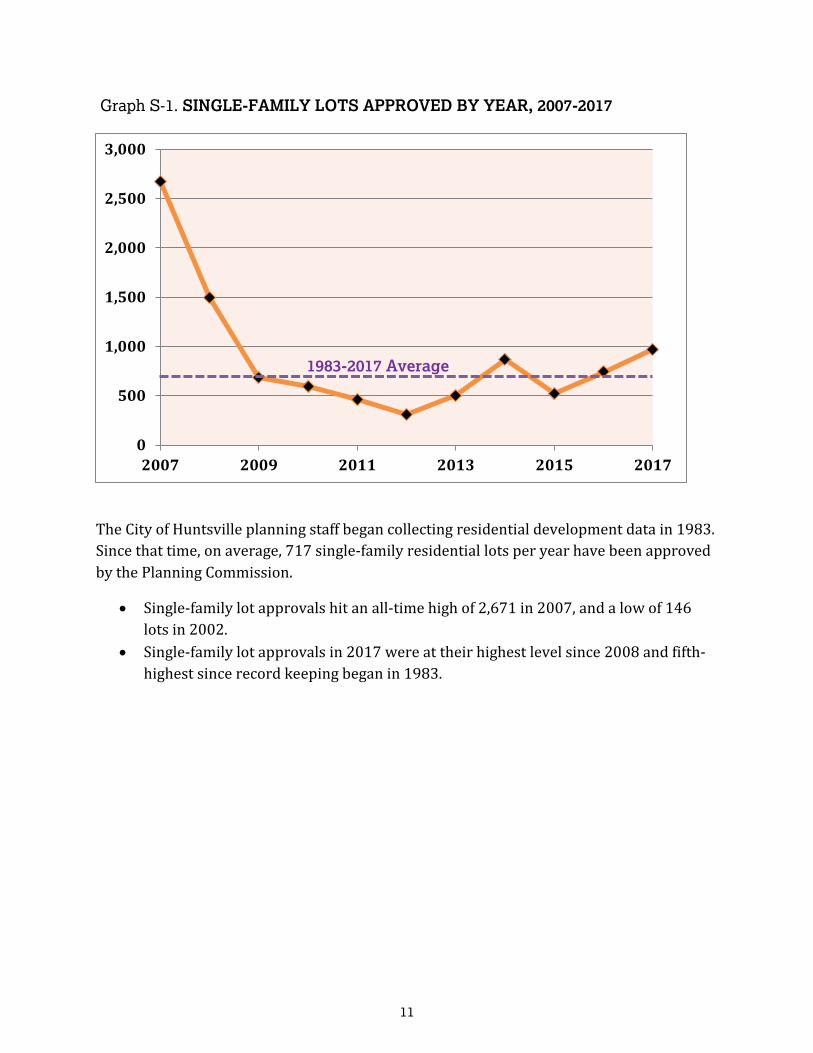
Graph S-1. SINGLE-FAMILY LOTS APPROVED BY YEAR, 2007-2017
The City of Huntsville planning staff began collecting residential development data in 1983.
Since that time, on average, 717 single-family residential lots per year have been approved
by the Planning Commission.
Single-family lot approvals hit an all-time high of 2,671 in 2007, and a low of 146
lots in 2002.
Single-family lot approvals in 2017 were at their highest level since 2008 and fifth-
highest since record keeping began in 1983.
0
500
1,000
1,500
2,000
2,500
3,000
2007 2009 2011 2013 2015 2017
1983-2017 Average
11
14.0131
30
106.23106.24
13.0213.01
110.12
107.01
112
102
101
29.22
114
113
110.11
104.02
110.22
110.14
29.11
28.01 27.2127.01
26
25.02
24
2322
19.03
18.0117
1512
9.027.02
7.01
6.026.01
5.035.025.01
3.02 3.01 2.02
108
105.02
106.22106.12
110.13
105.01
106.21
29.21
29.12
28.02
27.22
25.01
2120
19.02
19.01
14.02
10
9.01
4.03
2.01
110.21
107.02
109.02
109.01
111
202.01
202.02
201.01
212
209
207
211
208.02
208.01
431
231
231 431
7272
53
255
565
65
65
NEW MARKET
HUNTSVILLE
GURLE
OWENSCROSS ROADS
NEW HOPE
REDSTONE ARSENAL
TRIANA
TRIANA
MOORESVILLEDECATUR
HARVEST
US
231/
431
WINCHESTER RD
WINCHESTER RD
HWY 72 EAST
GOOSE CREEK
FLINT RIVER
ALD
RID
GE
CR
EEK
VEDRA
MO
NTE
GREENCOVE RD
MT. GAP
RD
WEATHERLY RD
HIC
KO
RY
HIL
L LN
FOUR MILE
GOVERNORS
WH
ITESBU
RG
JOHNSON RD
R. R.
PKW
Y
HWY 72
ME
MO
RIA
L PK
WY
UNIVERSITY DR
JORDAN LN
PULA
SK
I PIKE
BOB WADE LN
NICK DAVIS DR
JEFF R
D
OLD MADISON PIKE
MILL RD
HWY 20
I - 565
HWY 72 WEST
OLD U
S 31
I - 65
PINEY C
REEK
LIMESTONE CO.MORGAN CO.
MORGAN C
O.
MADIS
ON CO.
MADISON
Summer Pointe - 43 Lots
Providence Ph. IX - 52 LotsProvidence Ph. 6B - 8 Lots
Dry Creek Apts. - 178 Units
Midtowne on the Park Ph. 6 - 33 LotsMidtowne on the Park Ph. 9 - 24 Lots
Viduta Village - 21 Lots
McMullen Cove McMullen Place Ph. 6 - 9 LotsMcMullen Cove Silo Hill 3 - 16 LotsMcMullen Cove Watson Grand Preserve Ph. 1 - 27 Lots
Heights at Monte SanoApts. - 172 Units Nature's Cove
Ph. 5 - 137 Lots
Wilson Cove Ph. 1 - 34 LotsRetreat at Goose Creek Ph. 1 - 34 Lots
Retreat at Goose Creek Ph. 2 - 21 Lots
Olde Cobblestone Ph. 5 - 18 Lots
Oak Grove at Farley FarmPh. 6 - 37 Lots
Cobbs Cove - 70 Lots
Butler Basin Riverside - 59 Lots
Magna Carta Place Ph. 2 - 31 Lots
River Park Ph. 1 Part 2 - 79 LotsRiver Park Ph. 2 Part 1 - 16 LotsRiver Park Ph. 3 - 68 Lots
OvertonPh. 2 - 74 Lots
River CovePh. 1 - 27 Lots
Freeman Square Ph. II Apts. - 10 Units
Belvedere at Balch Senior Cottages - 137 Units
Watermark Bridge Street Apts. – 248 Units
Major Subdivisions Approved in 2017
The subdivisions shown were approved for Final Subdivision status by the Planning Commission from Jan. 2017 - Dec. 2017. 12

Real Estate
HIGHLIGHTS
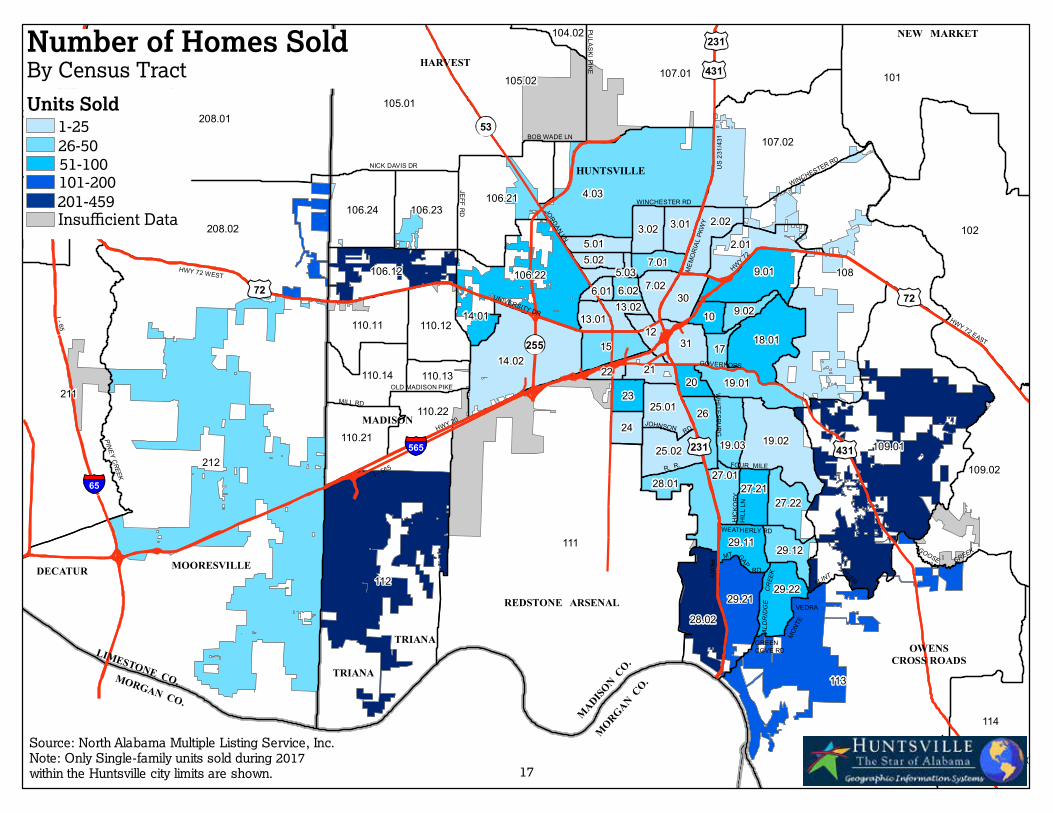
According to the North Alabama Multiple Listing Service (NALMLS), there were
3,269 single-family residential units sold within Huntsville city limits in 2017, a 7.9
percent increase from 2016’s total of 3,030.
o 459 homes were sold in Census Tract 109.01 (Hampton Cove), more than any
other tract in the city.
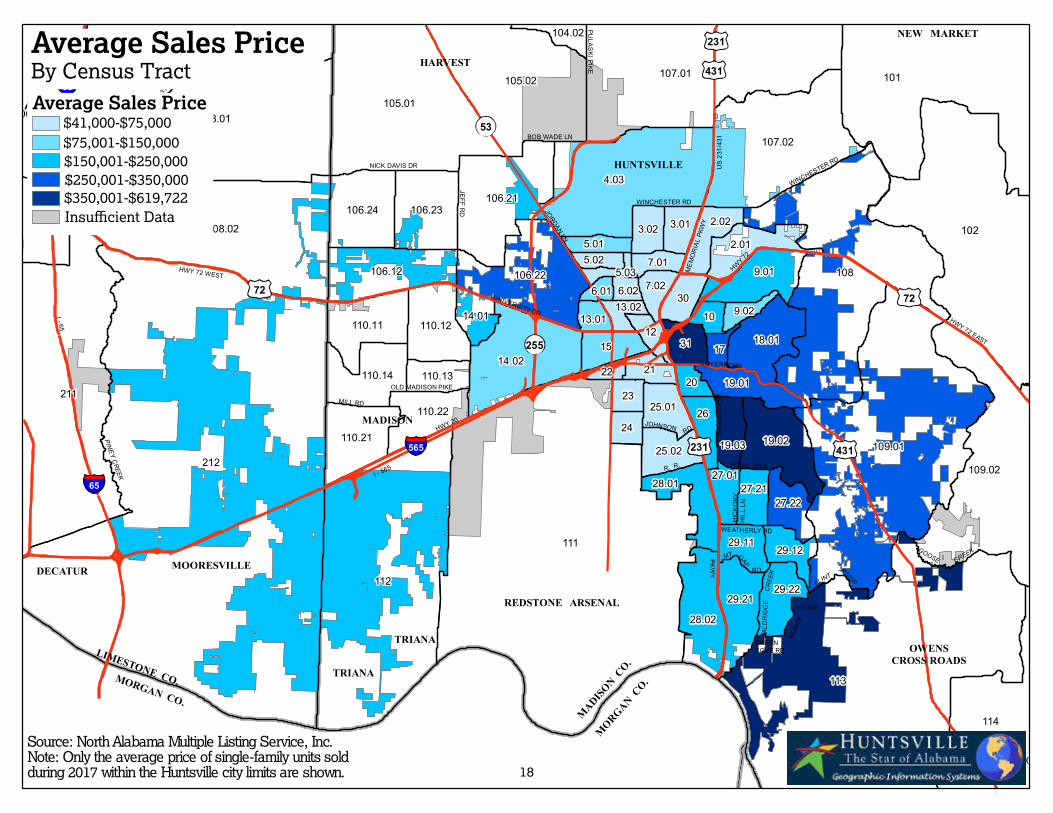
The average sale price for a single-family residence was $222,662, a 5.2 percent
increase from 2016’s average of $211,700.
o The average sales price increased from 2016 to 2017 in 37 of 55 census
tracts where homes were sold in the City both years.
Several tracts in South Huntsville registered decreases, including
Green Mountain and neighborhoods south of Mountain Gap Road.
Many North Huntsville neighborhoods, particularly west of Memorial
Parkway, experienced significant price increases year-over-year.
Prices in the Lowe Mill and Providence areas also saw increases over
2016.
Looking at longer-range trends, housing prices increased in 45 of 54
census tracts where homes were sold in both 2013 and 2017.
Three of the five tracts with the largest price increases since
2013 are located in North Huntsville, particularly around
Alabama A&M University and the Rolling Hills area.
Four of the five tracts with the largest price decreases are
located east of Memorial Parkway, including Jones Valley and
Downtown.
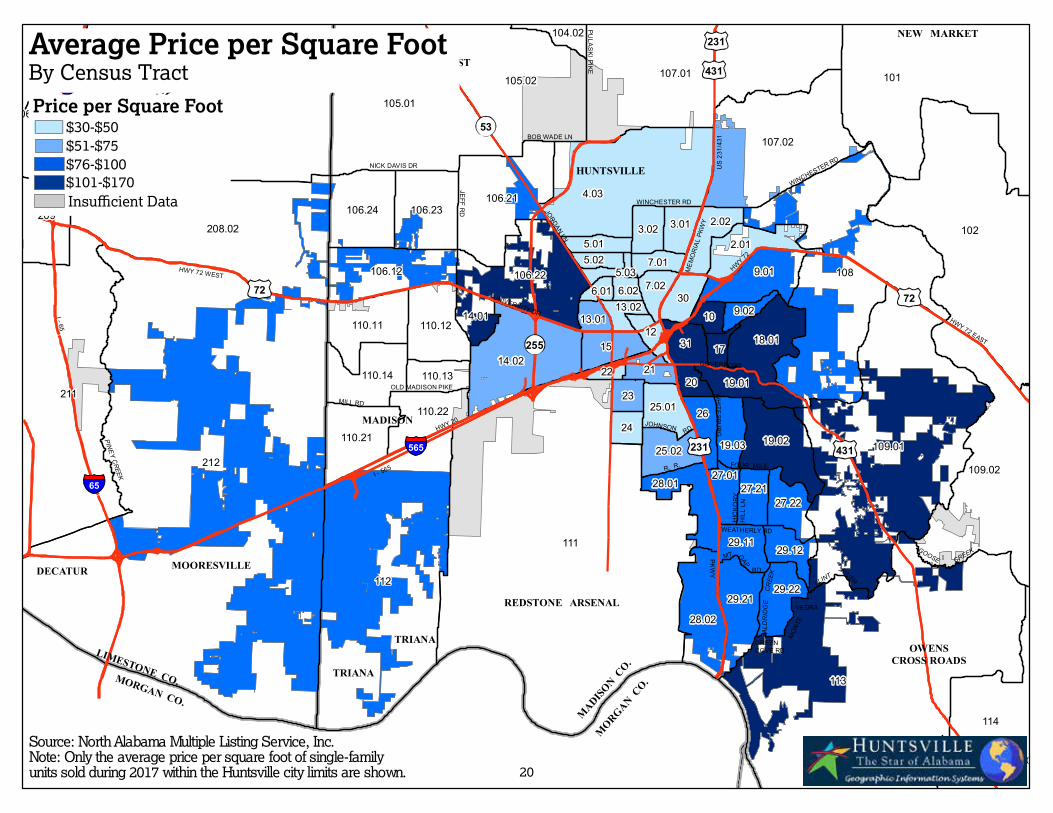
o The average price per square foot for a single-family home was $90.19, a 2.8
percent increase from 2016’s $87.71.
o 2017 marks the first time since record-keeping began in 1983 that the
citywide average price per square foot topped $90.
The average days on market for homes sold in 2017 were 76, down from 89 in 2016.
o The census tracts with the lowest average days on market were 21 (Lowe
Mill) and 25.01 (Brahan Spring) with 22 and 27 days, respectively.
o The census tracts with the highest average days on market were 106.24
(Capshaw) and 106.21 (53 North), with 233 and 181 days, respectively.
13

Table RE-1. TOP CENSUS TRACTS- SINGLE FAMILY RESIDENTIAL UNITS SOLD
Tract Area(s) Included Number of Units 109.01 Hampton Cove 459
112 Martin-Zierdt 335 28.02 English Village/Bell Mtn. 236
106.12 72 West 228 113 Green Mountain 122
TOTAL CITYWIDE 3,269
Table RE-2. TOP CENSUS TRACTS- AVERAGE SALES PRICE (SINGLE FAMILY
HOUSING)
Tract Area(s) Included Average Price 19.02 The Ledges $619,722
31 Downtown $457,494 113 Green Mountain $355,157
19.03 Jones Valley $354,433 18.01 Monte Sano $330,131
AVERAGE CITYWIDE $222,662
The city’s Downtown, East Central and far Southeast census tracts had the highest
average sales prices in 2017.
Citywide, the average sales price for new construction homes in 2017 was $292,812;
for resale homes, it was $198,363.
Table RE-3. TOP CENSUS TRACTS- PRICE PER SQUARE FOOT (SINGLE FAMILY
HOUSING)
Tract Area(s) Included Average Price 31 Downtown $169.66
19.02 The Ledges $149.03 17 Blossomwood $134.03 20 Mayfair Park $131.65
106.22 Providence $121.48
AVERAGE CITYWIDE $90.19
14

Table RE-4. TOP CENSUS TRACTS- FEWEST DAYS ON MARKET (SINGLE
FAMILY HOUSING)
Tract Area(s) Included Average DOM 21 Lowe Mill 22
25.01 Brahan Spring 27 5.03 Scenic View 29 5.02 Mastin Lake 38 7.02 Montview 40
AVERAGE CITYWIDE 76
Graph RE-1. AVERAGE PRICE PER SQUARE FOOT, SINGLE FAMILY HOMES IN
THE CITY OF HUNTSVILLE
$75
$77
$79
$81
$83
$85
$87
$89
$91
$93
$95
2007 2009 2011 2013 2015 2017
2007 $86/SF
2017 $90.19/SF
15

Graph RE-2. TOTAL SINGLE-FAMILY HOME SALES BY PRICE RANGE*
$300,000+ 662 (20%)
$225,000-$299,999 728 (22%)
$150,000-$224,999 847 (26%)
$75,000-$149,999 708 (22%)
$74,999 Or Less
367 (10%)
*City of Huntsville, 2017 data only
16
431
231
231 431
7272
53
255
565
65
65
NEW MARKET
HUNTSVILLE
OWENSCROSS ROADS
NEW HOPE
REDSTONE ARSENAL
TRIANA
TRIANA
MOORESVILLEDECATUR
HARVEST
US
231/
431
WINCHESTER RD
WINCHESTER RD
HWY 72 EAST
GOOSE CREEK
FLINTRIVER
ALD
RID
GE
CR
EEK
VEDRA
MO
NTE
GREENCOVE RD
MT. GAP
RD
WEATHERLY RD
HIC
KO
RY
HIL
L LN
FOUR MILE
GOVERNORS
WH
ITESBU
RG
JOHNSON RD
R. R.
PKW
Y
HWY 72
ME
MO
RIA
L PK
WY
UNIVERSITY DR
JORDAN LN
PULA
SK
I PIKE
BOB WADE LN
NICK DAVIS DR
JEFF R
D
OLD MADISON PIKE
MILL RD
HWY 20
I - 565
HWY 72 WEST
OLD U
S 31
I - 65
PINEY C
REEK
LIMESTONE CO.MORGAN CO.
MORGAN C
O.
MADIS
ON CO.
MADISON
14.01
31
30
106.23106.24
13.0213.01110.12
107.01
112
102
101
29.22
114
113
110.11
104.02
110.22
110.14
29.11
28.01 27.2127.01
26
25.02
24
23
22
19.03
18.011715
12
9.02
7.02
7.01
6.026.01
5.035.025.01
3.02 3.01 2.02
108
105.02
106.22106.12
110.13
105.01
106.21
29.21
29.12
28.02
27.22
25.01
2120
19.02
19.01
14.02
10
9.01
4.03
2.01
110.21
107.02
109.02
109.01
111
202.01
201.01
212
209
207
211
208.02
206 208.01
Number of Homes SoldBy Census Tract
Units Sold1-2526-5051-100101-200201-459Insufficient Data
Source: North Alabama Multiple Listing Service, Inc.Note: Only Single-family units sold during 2017within the Huntsville city limits are shown. 17
431
231
231 431
7272
53
255
565
65
65
NEW MARKET
HUNTSVILLE
OWENSCROSS ROADS
NEW HOPE
REDSTONE ARSENAL
TRIANA
TRIANA
MOORESVILLEDECATUR
HARVEST
US
231/
431
WINCHESTER RD
WINCHESTER RD
HWY 72 EAST
GOOSE CREEK
FLINTRIVER
ALD
RID
GE
CR
EEK
VEDRA
MO
NTE
GREENCOVE RD
MT. GAP
RD
WEATHERLY RD
HIC
KO
RY
HIL
L LN
FOUR MILE
GOVERNORS
WH
ITESBU
RG
JOHNSON RD
R. R.
PKW
Y
HWY 72
ME
MO
RIA
L PK
WY
UNIVERSITY DR
JORDAN LN
PULA
SK
I PIKE
BOB WADE LN
NICK DAVIS DR
JEFF R
D
OLD MADISON PIKE
MILL RD
HWY 20
I - 565
HWY 72 WEST
OLD U
S 31
I - 65
PINEY C
REEK
LIMESTONE CO.MORGAN CO.
MORGAN C
O.
MADIS
ON CO.
MADISON
14.01
31
30
106.23106.24
13.0213.01110.12
107.01
112
102
101
29.22
114
113
110.11
104.02
110.22
110.14
29.11
28.01 27.2127.01
26
25.02
24
23
22
19.03
18.011715
12
9.02
7.02
7.01
6.026.01
5.035.025.01
3.02 3.01 2.02
108
105.02
106.22106.12
110.13
105.01
106.21
29.21
29.12
28.02
27.22
25.01
2120
19.02
19.01
14.02
10
9.01
4.03
2.01
110.21
107.02
109.02
109.01
111
202.01
201.01
212
209
207
211
208.02
206 208.01
Average Sales PriceBy Census TractAverage Sales Price
$41,000-$75,000$75,001-$150,000$150,001-$250,000$250,001-$350,000$350,001-$619,722Insufficient Data
Source: North Alabama Multiple Listing Service, Inc.Note: Only the average price of single-family units soldduring 2017 within the Huntsville city limits are shown. 18

431
231
231 431
7272
53
255
565
65
65
NEW MARKET
HUNTSVILLE
OWENSCROSS ROADS
NEW HOPE
REDSTONE ARSENAL
TRIANA
TRIANA
MOORESVILLEDECATUR
HARVEST
US
231/
431
WINCHESTER RD
WINCHESTER RD
HWY 72 EAST
GOOSE CREEK
FLINTRIVER
ALD
RID
GE
CR
EEK
VEDRA
MO
NTE
GREENCOVE RD
MT. GAP
RD
WEATHERLY RD
HIC
KO
RY
HIL
L LN
FOUR MILE
GOVERNORS
WH
ITESBU
RG
JOHNSON RD
R. R.
PKW
Y
HWY 72
ME
MO
RIA
L PK
WY
UNIVERSITY DR
JORDAN LN
PULA
SK
I PIKE
BOB WADE LN
NICK DAVIS DR
JEFF R
D
OLD MADISON PIKE
MILL RD
HWY 20
I - 565
HWY 72 WEST
OLD U
S 31
I - 65
PINEY C
REEK
LIMESTONE CO.MORGAN CO.
MORGAN C
O.
MADIS
ON CO.
MADISON
14.01
31
30
106.23106.24
13.0213.01110.12
107.01
112
102
101
29.22
114
113
110.11
104.02
110.22
110.14
29.11
28.01 27.2127.01
26
25.02
24
23
22
19.03
18.011715
12
9.02
7.02
7.01
6.026.01
5.035.025.01
3.02 3.01 2.02
108
105.02
106.22106.12
110.13
105.01
106.21
29.21
29.12
28.02
27.22
25.01
2120
19.02
19.01
14.02
10
9.01
4.03
2.01
110.21
107.02
109.02
109.01
111
202.01
201.01
212
209
207
211
208.02
206 208.01
Source: North Alabama Multiple Listing Service, Inc.Note: Only the sales price of single-family units sold between 2016- 2017 within the Huntsville city limits are shown.
Sales Price Change 2016-2017By Census Tract
-22%-0%1%-20%21%-50%51%-76%Insufficient Data
Annual Sales Price Change (Percent)
19
431
231
231 431
7272
53
255
565
65
65
NEW MARKET
HUNTSVILLE
OWENSCROSS ROADS
NEW HOPE
REDSTONE ARSENAL
TRIANA
TRIANA
MOORESVILLEDECATUR
HARVEST
US
231/
431
WINCHESTER RD
WINCHESTER RD
HWY 72 EAST
GOOSE CREEK
FLINTRIVER
ALD
RID
GE
CR
EEK
VEDRA
MO
NTE
GREENCOVE RD
MT. GAP
RD
WEATHERLY RD
HIC
KO
RY
HIL
L LN
FOUR MILE
GOVERNORS
WH
ITESBU
RG
JOHNSON RD
R. R.
PKW
Y
HWY 72
ME
MO
RIA
L PK
WY
UNIVERSITY DR
JORDAN LN
PULA
SK
I PIKE
BOB WADE LN
NICK DAVIS DR
JEFF R
D
OLD MADISON PIKE
MILL RD
HWY 20
I - 565
HWY 72 WEST
OLD U
S 31
I - 65
PINEY C
REEK
LIMESTONE CO.MORGAN CO.
MORGAN C
O.
MADIS
ON CO.
MADISON
14.01
31
30
106.23106.24
13.0213.01110.12
107.01
112
102
101
29.22
114
113
110.11
104.02
110.22
110.14
29.11
28.01 27.2127.01
26
25.02
24
23
22
19.03
18.011715
12
9.02
7.02
7.01
6.026.01
5.035.025.01
3.02 3.01 2.02
108
105.02
106.22106.12
110.13
105.01
106.21
29.21
29.12
28.02
27.22
25.01
2120
19.02
19.01
14.02
10
9.01
4.03
2.01
110.21
107.02
109.02
109.01
111
202.01
201.01
212
209
207
211
208.02
206 208.01
Average Price per Square FootBy Census Tract
Price per Square Foot$30-$50$51-$75$76-$100$101-$170Insufficient Data
Source: North Alabama Multiple Listing Service, Inc.Note: Only the average price per square foot of single-family units sold during 2017 within the Huntsville city limits are shown. 20

431
231
231 431
7272
53
255
565
65
65
NEW MARKET
HUNTSVILLE
OWENSCROSS ROADS
NEW HOPE
REDSTONE ARSENAL
TRIANA
TRIANA
MOORESVILLEDECATUR
HARVEST
US
231/
431
WINCHESTER RD
WINCHESTER RD
HWY 72 EAST
GOOSE CREEK
FLINTRIVER
ALD
RID
GE
CR
EEK
VEDRA
MO
NTE
GREENCOVE RD
MT. GAP
RD
WEATHERLY RD
HIC
KO
RY
HIL
L LN
FOUR MILE
GOVERNORS
WH
ITESBU
RG
JOHNSON RD
R. R.
PKW
Y
HWY 72
ME
MO
RIA
L PK
WY
UNIVERSITY DR
JORDAN LN
PULA
SK
I PIKE
BOB WADE LN
NICK DAVIS DR
JEFF R
D
OLD MADISON PIKE
MILL RD
HWY 20
I - 565
HWY 72 WEST
OLD U
S 31
I - 65
PINEY C
REEK
LIMESTONE CO.MORGAN CO.
MORGAN C
O.
MADIS
ON CO.
MADISON
14.01
31
30
106.23106.24
13.0213.01110.12
107.01
112
102
101
29.22
114
113
110.11
104.02
110.22
110.14
29.11
28.01 27.2127.01
26
25.02
24
23
22
19.03
18.011715
12
9.02
7.02
7.01
6.026.01
5.035.025.01
3.02 3.01 2.02
108
105.02
106.22106.12
110.13
105.01
106.21
29.21
29.12
28.02
27.22
25.01
2120
19.02
19.01
14.02
10
9.01
4.03
2.01
110.21
107.02
109.02
109.01
111
202.01
201.01
212
209
207
211
208.02
206 208.01
Price per Square Foot Change2016-2017, by Census TractPercent
-15%- -0.01%0.01%- 20%20.01%-40%40.01%-59%Insufficient Data
Source: North Alabama Multiple Listing Service, Inc.Note: Only single-family units sold during 2016-2017 within the Huntsville city limits are shown. 21

431
231
231 431
7272
53
255
565
65
65
NEW MARKET
HUNTSVILLE
OWENSCROSS ROADS
NEW HOPE
REDSTONE ARSENAL
TRIANA
TRIANA
MOORESVILLEDECATUR
HARVEST
US
231/
431
WINCHESTER RD
WINCHESTER RD
HWY 72 EAST
GOOSE CREEK
FLINTRIVER
ALD
RID
GE
CR
EEK
VEDRA
MO
NTE
GREENCOVE RD
MT. GAP
RD
WEATHERLY RD
HIC
KO
RY
HIL
L LN
FOUR MILE
GOVERNORS
WH
ITESBU
RG
JOHNSON RD
R. R.
PKW
Y
HWY 72
ME
MO
RIA
L PK
WY
UNIVERSITY DR
JORDAN LN
PULA
SK
I PIKE
BOB WADE LN
NICK DAVIS DR
JEFF R
D
OLD MADISON PIKE
MILL RD
HWY 20
I - 565
HWY 72 WEST
OLD U
S 31
I - 65
PINEY C
REEK
LIMESTONE CO.MORGAN CO.
MORGAN C
O.
MADIS
ON CO.
MADISON
14.01
31
30
106.23106.24
13.0213.01
110.12
107.01
112
102
101
29.22
114
113
110.11
104.02
110.22
110.14
29.11
28.01 27.2127.01
26
25.02
24
23
22
19.03
18.011715
12
9.02
7.02
7.01
6.026.01
5.035.025.01
3.02 3.01 2.02
108
105.02
106.22106.12
110.13
105.01
106.21
29.21
29.12
28.02
27.22
25.01
2120
19.02
19.01
14.02
10
9.01
4.03
2.01
110.21
107.02
109.02
109.01
111
202.01
201.01
212
209
207
211
208.02
206 208.01
Average Days on MarketBy Census Tract
Days on Market22-6061-9091-120121-233Insufficient Data
Source: North Alabama Multiple Listing Service, Inc.Note: Only the average days on market of single-family units sold during 2017 within the Huntsville city limits are shown. 22

Commercial and Other Developments
HIGHLIGHTS
A total of 482 non-residential building permits (Commercial, Office, Industrial, etc.)
were issued in 2017, an increase of 18.1 percent from 2016’s total of 408.
o The top census tract for non-residential building permits was 14.02, home to
Research Park. 76 permits were issued in that area.
o Large commercial or mixed-use projects that began or continued in 2017
included MidCity Huntsville on the former site of Madison Square Mall, City
Centre at Big Spring downtown, and two grocery-anchored shopping centers
in West Huntsville.
Table C-1. NON-RESIDENTIAL BUILDING PERMITS, BY PROJECT TYPE
(CITYWIDE)
Project Type Examples
Number of Permits
Commercial Retail, Restaurants, Hotels
195
Office Commercial Office Buildings
128
Industrial Manufacturing, warehouses
47
Other Churches, Schools, Hospitals, Recreation,
Public Facilities 112
TOTAL 482
23
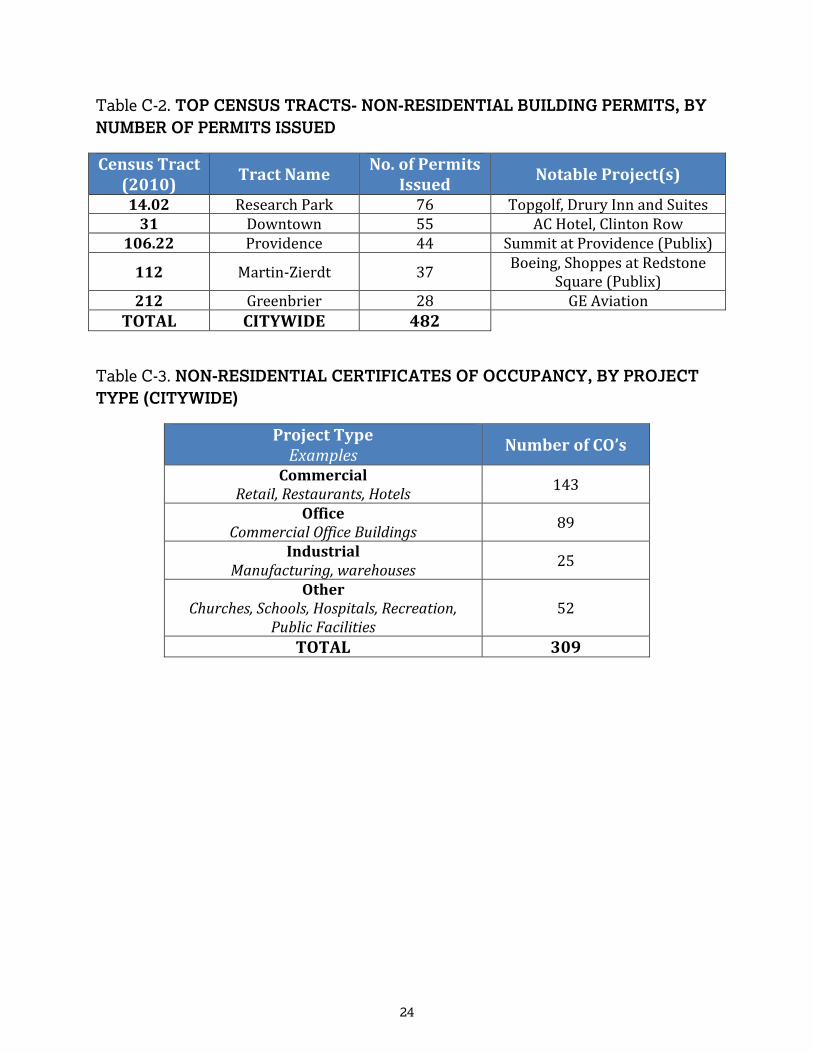
Table C-2. TOP CENSUS TRACTS- NON-RESIDENTIAL BUILDING PERMITS, BY
NUMBER OF PERMITS ISSUED
Census Tract (2010)
Tract Name No. of Permits
Issued Notable Project(s)
14.02 Research Park 76 Topgolf, Drury Inn and Suites 31 Downtown 55 AC Hotel, Clinton Row
106.22 Providence 44 Summit at Providence (Publix)
112 Martin-Zierdt 37 Boeing, Shoppes at Redstone
Square (Publix) 212 Greenbrier 28 GE Aviation
TOTAL CITYWIDE 482
Table C-3. NON-RESIDENTIAL CERTIFICATES OF OCCUPANCY, BY PROJECT
TYPE (CITYWIDE)
Project Type Examples
Number of CO’s
Commercial Retail, Restaurants, Hotels
143
Office Commercial Office Buildings
89
Industrial Manufacturing, warehouses
25
Other Churches, Schools, Hospitals, Recreation,
Public Facilities 52
TOTAL 309
24
Annexations, Zonings and Rezonings
ANNEXATIONS
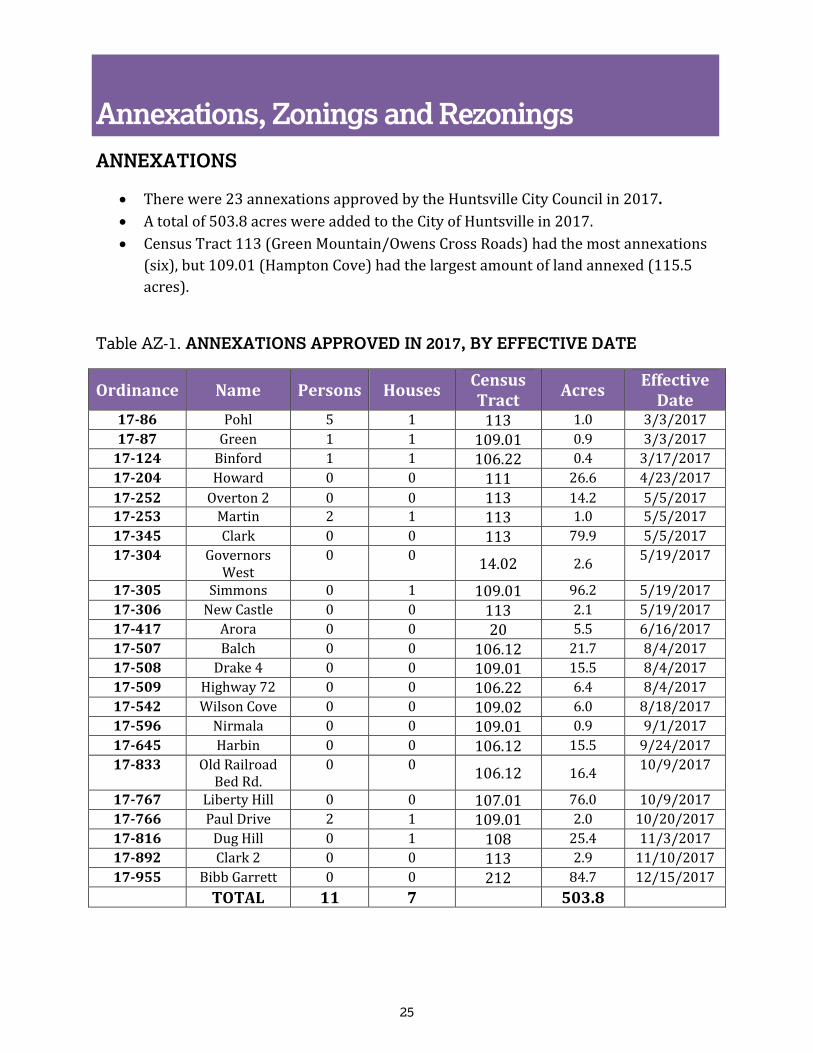
There were 23 annexations approved by the Huntsville City Council in 2017.
A total of 503.8 acres were added to the City of Huntsville in 2017.
Census Tract 113 (Green Mountain/Owens Cross Roads) had the most annexations
(six), but 109.01 (Hampton Cove) had the largest amount of land annexed (115.5
acres).
Table AZ-1. ANNEXATIONS APPROVED IN 2017, BY EFFECTIVE DATE
Ordinance Name Persons Houses Census Tract
Acres Effective
Date 17-86 Pohl 5 1 113 1.0 3/3/2017
17-87 Green 1 1 109.01 0.9 3/3/2017
17-124 Binford 1 1 106.22 0.4 3/17/2017
17-204 Howard 0 0 111 26.6 4/23/2017
17-252 Overton 2 0 0 113 14.2 5/5/2017
17-253 Martin 2 1 113 1.0 5/5/2017
17-345 Clark 0 0 113 79.9 5/5/2017
17-304 Governors West
0 0 14.02 2.6
5/19/2017
17-305 Simmons 0 1 109.01 96.2 5/19/2017
17-306 New Castle 0 0 113 2.1 5/19/2017
17-417 Arora 0 0 20 5.5 6/16/2017
17-507 Balch 0 0 106.12 21.7 8/4/2017
17-508 Drake 4 0 0 109.01 15.5 8/4/2017
17-509 Highway 72 0 0 106.22 6.4 8/4/2017
17-542 Wilson Cove 0 0 109.02 6.0 8/18/2017
17-596 Nirmala 0 0 109.01 0.9 9/1/2017
17-645 Harbin 0 0 106.12 15.5 9/24/2017
17-833 Old Railroad Bed Rd.
0 0 106.12 16.4
10/9/2017
17-767 Liberty Hill 0 0 107.01 76.0 10/9/2017
17-766 Paul Drive 2 1 109.01 2.0 10/20/2017
17-816 Dug Hill 0 1 108 25.4 11/3/2017
17-892 Clark 2 0 0 113 2.9 11/10/2017
17-955 Bibb Garrett 0 0 212 84.7 12/15/2017
TOTAL 11 7 503.8
25

ZONING AND REZONING APPROVALS
There were 24 zonings and 12 rezonings approved by the Huntsville City Council in
2017.
The largest single zoning in 2017 was for 96.2 acres near Old Big Cove Road. The
previously un-zoned land was designated Residential R2.
The largest single rezoning in 2017 was for 282 acres near Pulaski Pike that was
previously zoned as Industrial Park IP. The land was rezoned Planned Industrial PI.
Table AZ-2. ZONING APPROVALS IN 2017, BY EFFECTIVE DATE
Ordinance New Zone Map Sheet Census Tract
Acres Effective
Date 16-922 R1A 10-15 109.01 1.2 2/3/2017
17-7 R1B 07-14 113 1.3 3/3/2017
17-82 R1A 09-14 109.01 1.2 3/31/2017
17-80 R1A 09-14 109.01 38.9 3/31/2017
17-240 R1B 07-14 113 1.0 6/2/2017
17-242 R1A 09-14, 10-14 109.01 0.9 6/2/2017
17-330 R1B 12-09 106.22 0.4 6/30/2017
17-408 R2 08-11 28.01 26.6 8/4/2017
17-410 R2 07-13 113 79.9 8/4/2017
17-412 R1B 07-14 113 1.0 8/4/2017
17-414 R1B 08-14 113 14.2 8/4/2017
17-488 R2 08-11 111 24.4 9/1/2017
17-492 CIP 11-08 14.02 2.6 9/1/2017
17-494 R2 10-13, 10-14 109.01 96.2 9/1/2017
17-496 R2A 05-13 113 2.1 9/1/2017
17-589 C4 11-11 20 5.5 10/9/2017
17-691 R2A 13-06 106.12 21.7 11/3/2017
17-693 R1A 09-14 109.01 15.5 11/3/2017
17-695 C4 12-08 106.22 6.4 11/3/2017
17-808 R2 09-15, 09-16 109.02 6.0 11/24/2017
17-810 C4 09-14 109.01 0.9 11/24/2017
17-875 R2 13-07 106.24 15.5 12/29/2017
17-877 R2 13-06 106.12 16.4 12/29/2017
17-879 PI 16-10 107.01 76.0 12/29/2017
26

Table AZ-3. REZONING APPROVALS IN 2017, BY EFFECTIVE DATE
Ordinance Old Zone New Zone Map Sheet Census Tract Acres Effective Date 16-924 R2A C1 11-10 22 2.4 2/3/2017
17-3 R1B C4, PI 12-04 212 101.3 3/3/2017
17-5 M C3 11-11 31 2.1 3/3/2017
17-80 R1C, RO2 C6 11-11 21 4.0 5/5/2017
17-238 LI R2A 09-07 112 21.1 6/2/2017
17-244 R2A R2 12-11 7.02 10.5 6/2/2017
17-246 IP PI 15-10, 16-10 107.01 282.0 6/2/2017
17-332 R1A C1 13-10 3.02 3.7 6/30/2017
17-490 HI C6 11-11 21 1.3 9/1/2017
17-587 R1B R2 09-16 109.02 62.0 9/28/2017
17-742 R1, IP PI 15-10, 16-10 107.01 171.4 11/10/2017
17-881 R1A, CIP RP 12-09 106.22 23.9 12/29/2017
Official printed zoning maps are available at the Planning Office (City Hall, 2nd Floor) for $15 each. An
“unofficial” zoning map is also available for viewing at maps.huntsvilleal.gov.
27

14.01
31
30
106.23106.24
13.0213.01
110.12
107.01
112
102
101
29.22
114
113
110.11
104.02
110.22
110.14
29.11
28.01
27.2127.01
26
25.0224
2322
19.03
18.011715
12
9.02
7.02
7.01
6.026.015.03
5.02
5.01 3.02 3.01 2.02
108
105.02
106.22106.12
110.13
105.01
106.21
29.21
29.12
28.02
27.22
25.0121
20
19.02
19.01
14.02
10
9.01
4.03
2.01
110.21
107.02
109.02109.01
111
202.01
201.01
212
209
207
211
208.02
206 208.01
431
231
231
431
7272
53
255
565
65
65
NEW MARKET
HUNTSVILLE
OWENSCROSS ROADS
NEW HOPE
REDSTONE ARSENAL
TRIANA
TRIANA
MOORESVILLEDECATUR
HARVEST
US
231/
431
WINCHESTER RD
WINCHESTER RD
HWY 72 EAST
GOOSE CREEK
FLINTRIVER
ALD
RID
GE
CR
EEK
VEDRA
MO
NTE
GREENCOVE RD
MT. GAP
RD
WEATHERLY RD
HIC
KO
RY
HIL
L LN
FOUR MILE
GOVERNORS
WH
ITESBU
RG
JOHNSON RD
R. R.
PKW
Y
HWY 72
ME
MO
RIA
L PK
WY
UNIVERSITY DR
JORDAN LN
PULA
SK
I PIKE
BOB WADE LN
NICK DAVIS DR
JEFF R
D
OLD MADISON PIKE
MILL RD
HWY 20
I - 565
HWY 72 WEST
OLD U
S 31
I - 65
PINEY C
REEK
LIMESTONE CO.MORGAN CO.
MORGAN C
O.
MADIS
ON CO.
MADISON
Ord. #17-955Eff. Date12/15/2017
84.7 Acres
Ord. #17-833Eff. Date 10/20/2017
16.4 Acres
Ord. #17-507Eff. Date 8/4/2017
21.7 Acres
Ord. #17-645Eff. Date 9/25/2017
15.5 Acres
Ord. #17-767Eff. Date 10/9/2017
76 Acres
Ord. #17-417Eff. Date 6/16/2017
5.5 Acres
Ord. #17-204Eff. Date 4/23/2017
26.6 Acres
Ord. #17-250Eff. Date 5/5/2017
79.9 Acres
Ord. #17-892Eff. Date 11/10/2017
2.9 Acres
Ord. #17-306Eff. Date 5/19/2017
2.1 Acres
Ord. #17-86Eff. Date 3/3/2017
1 Acres
Ord. #17-252Eff. Date 5/5/2017
14.2 Acres
Ord. #17-508Eff. Date 8/4/2017
15.5 Acres
Ord. #17-542Eff. Date 8/18/2017
6 Acres
Ord. #17-816Eff. Date 11/3/2017
25.4 Acres
Ord. #17-305Eff. Date 5/19/2017
96.2 Acres
Ord. #17-766Eff. Date 10/20/2017
2 Acres
Ord. #17-87Eff. Date 3/3/2017
0.9 Acres
Ord. #17-124Eff. Date 3/17/2017
0.4 Acres
Ord. #17-253Eff. Date 5/5/2017
1 Acres
Ord. #17-304Eff. Date 5/19/2017
2.6 Acres
Ord. #17-509Eff. Date 8/4/2017
6.4 Acres
Ord. #17-596Eff. Date 9/1/2017
0.9 Acres
2017 Annexations
28

Population and Housing Estimates
POPULATION
The US Census Bureau takes a census of the United States every ten years.
o The last census was performed on April 1, 2010.
The City of Huntsville Planning staff calculates intercensal estimates of the City’s
population every July.
o On July 1, 2017, the population of the City of Huntsville was estimated at
196,289, an increase of 9 percent since 2010.
o Huntsville continues to be the fastest-growing major city in Alabama, with an
average annual growth rate of 1.3 percent over the past decade.
Table PH-1. POPULATION AND HOUSING, 2000-2017
Population Housing Units Census 2000 158,635 73,903 Census 2010 180,105 84,949 City Estimate
July 2016 194,057 93,243
City Estimate July 2017
196,289 94,853
Graph PH-1. POPULATION OF ALABAMA CITIES OVER 100,000 (2000-2017)
150000
160000
170000
180000
190000
200000
210000
220000
230000
240000
250000
2000 2002 2004 2006 2008 2010 2012 2014 2016
To
tal
Po
pu
lati
on
Huntsville Birmingham Montgomery Mobile
29
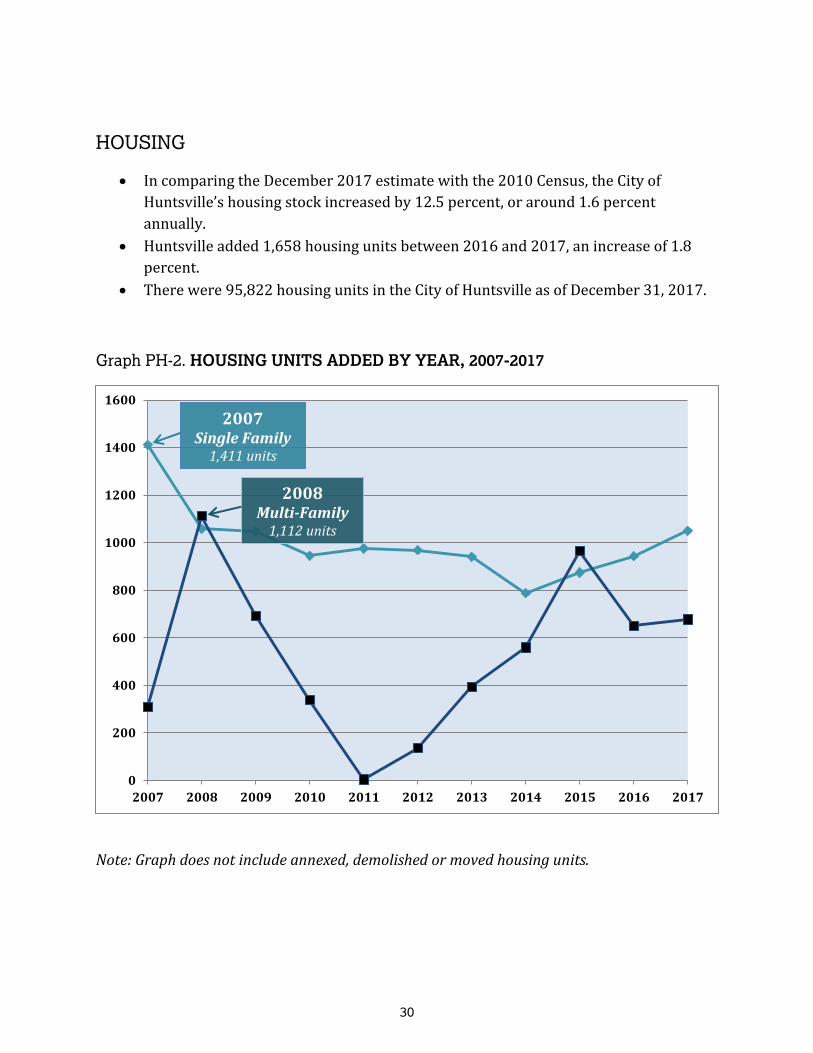
HOUSING
In comparing the December 2017 estimate with the 2010 Census, the City of
Huntsville’s housing stock increased by 12.5 percent, or around 1.6 percent
annually.
Huntsville added 1,658 housing units between 2016 and 2017, an increase of 1.8
percent.
There were 95,822 housing units in the City of Huntsville as of December 31, 2017.
Graph PH-2. HOUSING UNITS ADDED BY YEAR, 2007-2017
Note: Graph does not include annexed, demolished or moved housing units.
0
200
400
600
800
1000
1200
1400
1600
2007 2008 2009 2010 2011 2012 2013 2014 2015 2016 2017
2007 Single Family
1,411 units
2008 Multi-Family
1,112 units
30
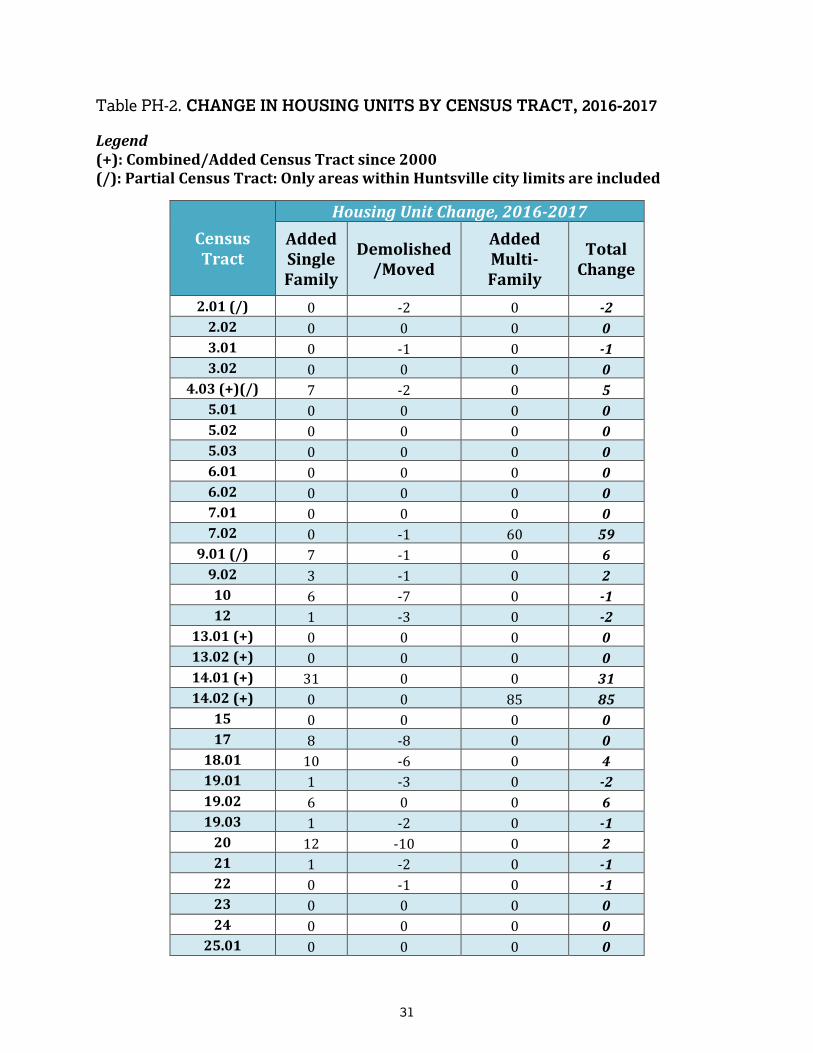
Table PH-2. CHANGE IN HOUSING UNITS BY CENSUS TRACT, 2016-2017
Legend (+): Combined/Added Census Tract since 2000 (/): Partial Census Tract: Only areas within Huntsville city limits are included
Census Tract
Housing Unit Change, 2016-2017
Added Single Family
Demolished/Moved
Added Multi-Family
Total Change
2.01 (/) 0 -2 0 -2
2.02 0 0 0 0
3.01 0 -1 0 -1
3.02 0 0 0 0
4.03 (+)(/) 7 -2 0 5
5.01 0 0 0 0
5.02 0 0 0 0
5.03 0 0 0 0
6.01 0 0 0 0
6.02 0 0 0 0
7.01 0 0 0 0
7.02 0 -1 60 59
9.01 (/) 7 -1 0 6
9.02 3 -1 0 2
10 6 -7 0 -1
12 1 -3 0 -2
13.01 (+) 0 0 0 0
13.02 (+) 0 0 0 0
14.01 (+) 31 0 0 31
14.02 (+) 0 0 85 85
15 0 0 0 0
17 8 -8 0 0
18.01 10 -6 0 4
19.01 1 -3 0 -2
19.02 6 0 0 6
19.03 1 -2 0 -1
20 12 -10 0 2
21 1 -2 0 -1
22 0 -1 0 -1
23 0 0 0 0
24 0 0 0 0
25.01 0 0 0 0
31

25.02 0 -1 0 -1
26 2 0 0 2
27.01 3 -3 0 0
27.21 1 -1 0 0
27.22 5 0 0 5
28.01 0 -1 0 -1
28.02 87 0 0 87
29.11 0 0 0 0
29.12 3 0 0 3
29.21 5 0 4 9
29.22 3 0 0 3
30 (+) 0 -2 0 -2
31 (+) 0 0 0 0
105.02 (/) 0 0 0 0
106.12 (/) 159 0 0 159
106.21 (/) 23 0 0 23
106.22 (/) 40 -9 396 427
106.23 (/)(+) 9 0 0 9
106.24 (/)(+) 1 0 0 1
107.01 (/) 0 0 0 0
107.02 (/) 6 0 0 6
108 (/) 0 0 0 0
109.01 (/) 251 0 0 251
109.02 (/) 0 0 0 0
110.11 (/) 0 0 0 0
110.12 (/) 0 0 0 0
110.22 (/) 0 0 0 0
111 (/) 0 0 0 0
112 (/) 195 0 24 219
113 (/) 99 0 0 99
208.02 (/) 51 0 0 51
212 (/) 12 -1 108 119
Citywide 1049 -68 677 1,658
Only inhabited census tracts within city limits are included in this table.
32

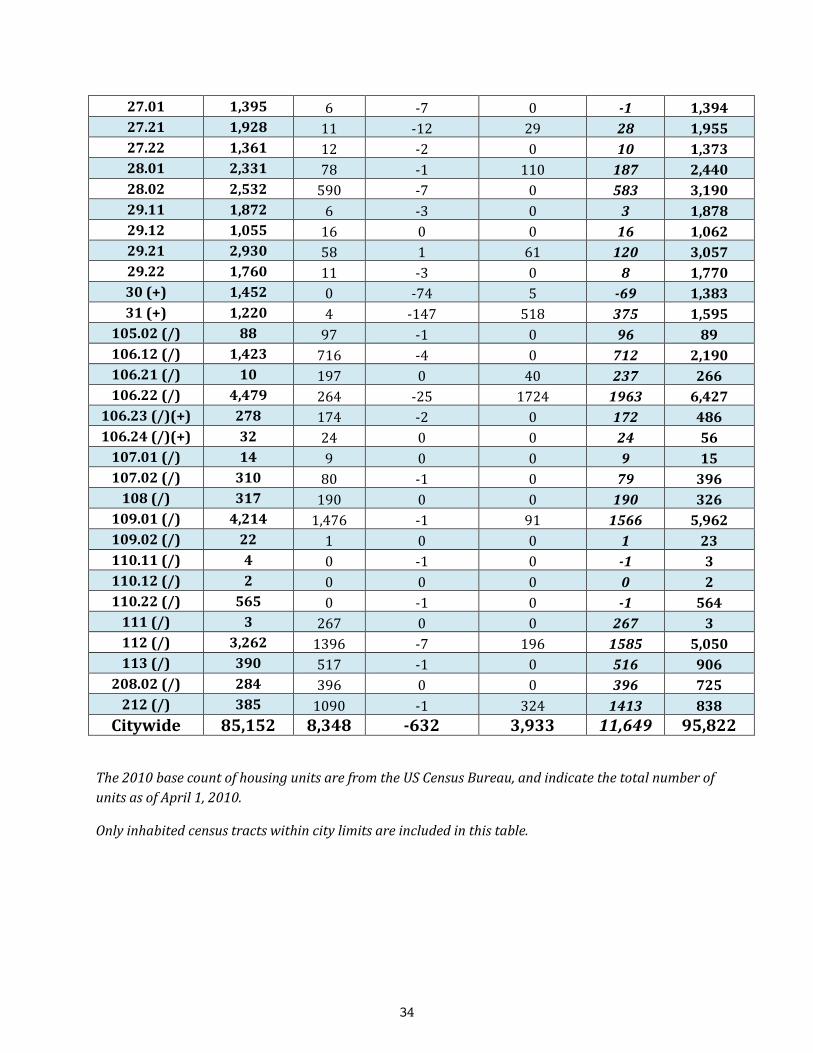
Table PH-3. TOTAL HOUSING UNITS BY CENSUS TRACT, 2010-2017
Census Tract
Total Housing
Units (4/2010)
Housing Unit Change, 2010-2017 Total
Housing Units
(2017)
Added Single Family
Demolished/Moved
Added Multi-Family
Total Change,
2010-2017
2.01 (/) 409 4 -3 0 1 409
2.02 1,069 2 -2 40 40 1,109
3.01 1,651 0 -3 0 -3 1,649
3.02 1,538 2 -1 0 1 1,537
4.03 (+)(/) 1,891 23 -6 0 17 1,908
5.01 751 19 -1 0 18 771
5.02 1,007 1 -1 0 0 1,007
5.03 756 0 0 0 0 756
6.01 670 0 -2 0 -2 668
6.02 909 0 0 0 0 909
7.01 1,384 3 -3 0 0 1,381
7.02 1,451 26 -1 60 85 1,530
9.01 (/) 1,974 49 -3 1 47 2,028
9.02 1,218 18 -5 1 14 1,222
10 1,884 63 -53 0 10 1,901
12 1,392 26 -28 0 -2 1,395
13.01 (+) 2,276 1 0 0 1 2,277
13.02 (+) 1,023 19 -4 0 15 1,019
14.01 (+) 755 172 0 233 405 1,177
14.02 (+) 2,823 5 -1 252 256 3,080
15 1,896 5 -7 0 -2 1,891
17 899 40 -38 0 2 899
18.01 1,620 36 -25 0 11 1,634
19.01 1,533 21 -14 0 7 1,542
19.02 665 35 -5 248 278 940
19.03 966 23 -10 0 13 977
20 1,206 53 -58 0 -5 1,206
21 1,851 6 -33 0 -27 1,825
22 979 1 -1 0 0 979
23 2,452 0 -7 0 -7 2,445
24 2,492 1 -2 0 -1 2,490
25.01 1,859 0 -7 0 -7 1,853
25.02 1,775 1 -2 0 -1 1,773
26 2,210 6 -5 0 1 2,211
33
27.01 1,395 6 -7 0 -1 1,394
27.21 1,928 11 -12 29 28 1,955
27.22 1,361 12 -2 0 10 1,373
28.01 2,331 78 -1 110 187 2,440
28.02 2,532 590 -7 0 583 3,190
29.11 1,872 6 -3 0 3 1,878
29.12 1,055 16 0 0 16 1,062
29.21 2,930 58 1 61 120 3,057
29.22 1,760 11 -3 0 8 1,770
30 (+) 1,452 0 -74 5 -69 1,383
31 (+) 1,220 4 -147 518 375 1,595
105.02 (/) 88 97 -1 0 96 89
106.12 (/) 1,423 716 -4 0 712 2,190
106.21 (/) 10 197 0 40 237 266
106.22 (/) 4,479 264 -25 1724 1963 6,427
106.23 (/)(+) 278 174 -2 0 172 486
106.24 (/)(+) 32 24 0 0 24 56
107.01 (/) 14 9 0 0 9 15
107.02 (/) 310 80 -1 0 79 396
108 (/) 317 190 0 0 190 326
109.01 (/) 4,214 1,476 -1 91 1566 5,962
109.02 (/) 22 1 0 0 1 23
110.11 (/) 4 0 -1 0 -1 3
110.12 (/) 2 0 0 0 0 2
110.22 (/) 565 0 -1 0 -1 564
111 (/) 3 267 0 0 267 3
112 (/) 3,262 1396 -7 196 1585 5,050
113 (/) 390 517 -1 0 516 906
208.02 (/) 284 396 0 0 396 725
212 (/) 385 1090 -1 324 1413 838
Citywide 85,152 8,348 -632 3,933 11,649 95,822
The 2010 base count of housing units are from the US Census Bureau, and indicate the total number of
units as of April 1, 2010.
Only inhabited census tracts within city limits are included in this table.
34

Definitions
GLOSSARY OF TERMS
Added Housing- includes units for which certificates of occupancy have been issued and
housing units annexed into the city. It does not include changes in the number of mobile
homes.
Building Permit- permits that are issued by the City of Huntsville Building Inspection
Department and required for any building construction valued greater than $250 within
Huntsville city limits, except for painting, wallpapering, flooring or fencing.
Census Tracts- Small, contiguous statistical divisions of a county, designed to be relatively
homogeneous units with respect to population characteristics, economic status, and living
conditions at the time of establishment with an average population of 4,000 inhabitants.
Certificate of Occupancy (CO) - Issued by the City of Huntsville Building Inspection
Department when construction is completed and in conformity with City building codes
and ordinances. A CO must be issued before a building can be occupied.
Minor Subdivisions (Residential)- a division of a tract of land into no more than three
lots or an unlimited number of lots if each lot is 10 acres or more in size, where each lot
fronts an existing paved road and does not require the construction of any new
infrastructure except sidewalks or water main extensions.
Rezoning- A reclassification of previously annexed and zoned land to accommodate new
uses not compatible under the current designation. Approval by the Huntsville City Council
is required for all rezoning requests within the city of Huntsville.
Subdivision- A tract of land surveyed and divided into lots. Approval by the City of
Huntsville Planning Commission is required for all subdivisions within Huntsville.
Zoning- A classification of previously un-zoned land for its current and/or desired use.
Zoning requests are usually made for newly annexed land. Approval by the Huntsville City
Council is required for all zoning requests within the city of Huntsville.
35

TRACT NAMES
Throughout this report, Tract Names are used to relate census tracts with familiar city
neighborhoods and landmarks. Below is a table of census tracts and their tract names. Note: The
name used may describe only part of the census tract area. Readers should consult the census tract
map on page three for exact boundaries.
Census Tract Tract Name Census Tract Tract Name
2.01 Edmonton Heights 25.02 Golf Rd./Chelsea
2.02 Colonial Hills/A&M 26 Piedmont/Fleming Meadows
3.01 Lakewood 27.01 Whitesburg
3.02 Rolling Hills 27.21 Bailey Cove
4.03 Wade Mountain 27.22 Willowbrook
5.01 Stoner Park 28.01 Chaffee
5.02 Mastin Lake 28.02 English Village/Bell Mountain
5.03 Scenic View 29.11 Weatherly Heights
6.01 Highlands 29.12 Box Canyon
6.02 Oakmont Park 29.21 Challenger
7.01 Davis Hills 29.22 Camelot/McGucken Park
7.02 Montview 30 Lincoln Village
9.01 Chapman 31 Downtown
9.02 Oak Park 105.02 Carters Gin
10 Five Points 106.12 72 West
12 Terry Heights 106.21 53 North
13.01 University Central 106.22 Providence
13.02 Oakwood West 106.23 Monrovia
14.01 Creekwood Park 106.24 Capshaw
14.02 Research Park 107.01 Meridianville
15 University Park 107.02 Moores Mill
17 Blossomwood 108 72 East/Dug Hill
18.01 Monte Sano 109.01 Hampton Cove
19.01 Governors East 109.02 Gurley
19.02 The Ledges 110.11 NW Madison
19.03 Jones Valley 110.12 NE Madison
20 Mayfair Park 110.22 SE Madison
21 Lowe Mill 111 Redstone Arsenal
22 Westlawn 112 Martin-Zierdt
23 Merrimack 113 Green Mountain
24 McDonnell 208.02 East Limestone
25.01 Brahan Spring 212 Greenbrier
36