Development of methods for analysis of synthetic ... · PDF fileDevelopment of methods for...
80
Universität Basel Philosophisch-Naturwissenschaftliche Fakultät Departement Pharmazeutische Wissenschaften Institut für Pharmazeutische Biologie Development of methods for analysis of synthetic adulterants in herbal medicines by HPTLC Diploma Thesis Seraina Caprez Supervision: Prof. Matthias Hamburger, Universität Basel Dr. Eike Reich, CAMAG Muttenz Anne Schibli, CAMAG Muttenz May - September 2005
Transcript of Development of methods for analysis of synthetic ... · PDF fileDevelopment of methods for...
Universität Basel Philosophisch-Naturwissenschaftliche Fakultät Departement Pharmazeutische Wissenschaften
Institut für Pharmazeutische Biologie
Development of methods for analysis of synthetic adulterants in herbal
medicines by HPTLC
Diploma Thesis
Seraina Caprez
Supervision: Prof. Matthias Hamburger, Universität Basel
Dr. Eike Reich, CAMAG Muttenz Anne Schibli, CAMAG Muttenz
May - September 2005

3
Danksagung Mein Dank geht an:
- Prof. Dr. Matthias Hamburger für die Leitung der Arbeit
- Die Firma CAMAG für den Arbeitsplatz und die Materialien
- Dr. Eike Reich und Anne Schibli für die Betreuung und die fachliche Unterstützung
- Valeria Widmer für die Hilfe bei der Informationssuche in den Weiten des Internets,
Daniel Handloser für die Hilfe bei Laborfragen und Katherine Gessler für das Tei-
len von Freund und Leid während der Arbeit
- Dr. Olivier Potterat für die Hilfe bei der HPLC-Analytik
- Dr. Hans-Ruedi Schmutz und Dr. Christelle Jablonski-Lorin für die Hilfe bei der
NMR-, IR-, und MS-Analytik
- Meine Familie, meine Freundinnen und alle, die mich während dieser Zeit unter-
stützt haben
4
Table of contents Danksagung.................................................................................................................. 3
Abstract......................................................................................................................... 6
Zusammenfassung ....................................................................................................... 7
1. Introduction............................................................................................................ 9
1.1. Chinese herbal medicine............................................................................ 9
1.2. Aim of this Diploma Thesis....................................................................... 10
1.3. Thin-layer chromatography ...................................................................... 11
1.3.1. Principle ................................................................................................ 11
1.3.2. Influencing factors................................................................................. 12
1.3.3. Method development ............................................................................ 13
1.3.4. Quantitative evaluation ......................................................................... 15
1.3.5. Problems with natural products ............................................................ 15
2. Material and Methods.......................................................................................... 17
2.1. Material ..................................................................................................... 17
2.1.1. Samples ................................................................................................ 17
2.1.2. Standards.............................................................................................. 21
2.1.3. Plates .................................................................................................... 22
2.1.4. Chemicals ............................................................................................. 23
2.1.5. Equipment and accessories.................................................................. 24
2.1.6. Chemicals and Equipment for HPLC.................................................... 25
2.1.7. Chemicals and Equipment for NMR ..................................................... 25
2.2. Methods.................................................................................................... 26
2.2.1. Sample preparation .............................................................................. 26
2.2.2. Standard preparation ............................................................................ 27
2.2.3. Methods for HPTLC .............................................................................. 29
2.2.4. Methods for derivatization..................................................................... 32
2.2.5. Method for HPLC .................................................................................. 32
3. Results and Discussion ....................................................................................... 33
3.1. Method optimization for anti-impotency drugs ......................................... 33
3.1.1. Existing method and optimization......................................................... 33
3.1.2. Sample analysis.................................................................................... 34
3.1.3. Results from HPLC-analysis................................................................. 36
5
3.1.4. Reproducibility, influence of relative humidity and chamber saturation37
3.1.5. Quantification of Sildenafil .................................................................... 39
3.1.6. Discussion............................................................................................. 42
3.2. Method development for anti-rheumatic drugs ........................................ 43
3.2.1. Existing methods................................................................................... 43
3.2.2. Method development ............................................................................ 43
3.2.3. Sample analysis.................................................................................... 46
3.2.4. Results from NMR-, MS- and IR-analysis............................................. 49
3.2.5. Discussion............................................................................................. 50
3.3. Method development for anti-diabetic drugs............................................ 51
3.3.1. Existing method .................................................................................... 51
3.3.2. Method optimization.............................................................................. 51
3.3.2.1. Developing solvent ........................................................................ 51
3.3.2.2. Derivatization reagent.................................................................... 52
3.3.3. Sample analysis.................................................................................... 53
3.3.4. Discussion............................................................................................. 56
3.4. Final Discussion ....................................................................................... 57
4. List of Figures...................................................................................................... 59
5. Literature References.......................................................................................... 60
6. Annex .................................................................................................................. 62
6.1. List of Abbreviations ................................................................................. 62
6.2. LC/MS spectra of anti-impotency drugs ................................................... 64
6.3. NMR spectrum of anti-rheumatic drug ..................................................... 72
6.4. MS spectrum of anti-rheumatic drug ........................................................ 73
6.5. IR spectrum of anti-rheumatic drug.......................................................... 80
6
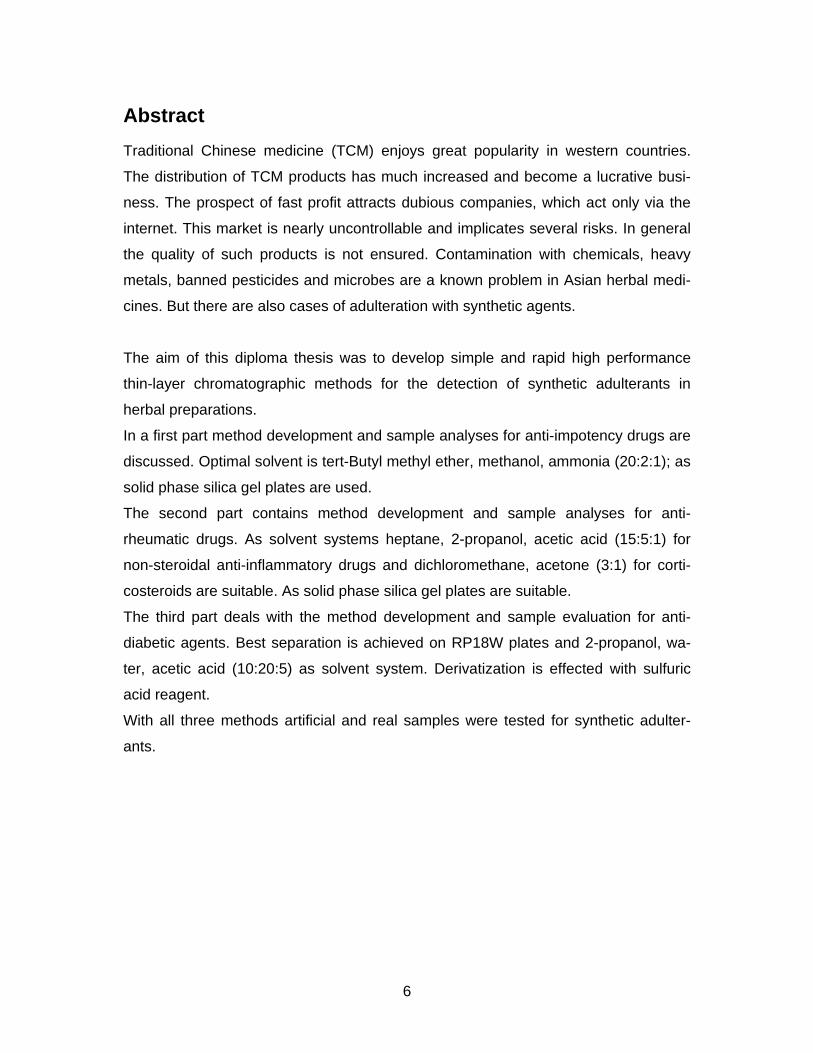
Abstract Traditional Chinese medicine (TCM) enjoys great popularity in western countries.
The distribution of TCM products has much increased and become a lucrative busi-
ness. The prospect of fast profit attracts dubious companies, which act only via the
internet. This market is nearly uncontrollable and implicates several risks. In general
the quality of such products is not ensured. Contamination with chemicals, heavy
metals, banned pesticides and microbes are a known problem in Asian herbal medi-
cines. But there are also cases of adulteration with synthetic agents.
The aim of this diploma thesis was to develop simple and rapid high performance
thin-layer chromatographic methods for the detection of synthetic adulterants in
herbal preparations.
In a first part method development and sample analyses for anti-impotency drugs are
discussed. Optimal solvent is tert-Butyl methyl ether, methanol, ammonia (20:2:1); as
solid phase silica gel plates are used.
The second part contains method development and sample analyses for anti-
rheumatic drugs. As solvent systems heptane, 2-propanol, acetic acid (15:5:1) for
non-steroidal anti-inflammatory drugs and dichloromethane, acetone (3:1) for corti-
costeroids are suitable. As solid phase silica gel plates are suitable.
The third part deals with the method development and sample evaluation for anti-
diabetic agents. Best separation is achieved on RP18W plates and 2-propanol, wa-
ter, acetic acid (10:20:5) as solvent system. Derivatization is effected with sulfuric
acid reagent.
With all three methods artificial and real samples were tested for synthetic adulter-
ants.
7
Zusammenfassung Traditionelle chinesische Medizin (TCM) erfreut sich in westlichen Ländern als Teil
der Komplementärmedizin immer grösserer Beliebtheit. Der Vertrieb von Arzneimit-
teln nahm in den letzten Jahren massiv zu und ist zu einem lukrativen Markt ge-
wachsen. Die Aussicht auf schnellen Profit zieht aber auch viele dubiose Firmen, die
ihre Geschäfte mitunter nur über das Internet abwickeln, an. Dieser Markt ist sehr
schwer kontrollierbar und birgt einige Risiken. Die Qualität von solchen Arzneimitteln
ist im Allgemeinen nicht gewährleistet. Kontamination mit Chemikalien, Schwermetal-
len, verbotenen Pestiziden und Mikroben sind ein bekanntes Problem bei pflanzli-
chen Arzneimitteln asiatischer Herkunft. Immer wieder treten aber auch Fälle von
Verfälschungen mit synthetischen Wirkstoffen auf.
Ziel dieser Diplomarbeit war es, einfache dünnschichtchromatographische Methoden
zu entwickeln, um solche Verfälschungen rasch und zuverlässig nachweisen zu kön-
nen.
In einem ersten Teil wird eine Methodenentwicklung und Probenuntersuchung für
Potenzmittel besprochen. Optimales Laufmittel ist tert-Butylmethylether, Methanol,
Ammoniak (20:2:1), als feste Phase werden Silicagel-Platten verwendet.
Der zweite Teil enthält eine Methodenentwicklung und Probenanalyse für Antirheu-
matika. Als Fliessmittel eignet sich für Nicht-steroidale Antirheumatika Heptan,
Isopropanol, Essigsäure (15:5:1), für Corticosteroide Dichlormethan, Aceton (3:1).
Als feste Phase werden Silicagel-Platten eingesetzt.
Der dritte Teil befasst sich mit der Methodentwicklung und Probenauswertung für
antidiabetische Medikamente. Die beste Trennung von verschiedenen oral wirksa-
men Antidiabetika wird auf RP18W-Platten mit Isopropanol, Wasser, Essigsäure
(10:20:5) erreicht. Derivatisierung erfolgt mit Schwefelsäurereagens.
Mit allen drei Methoden wurden künstliche und echte Proben auf Verfälschungen mit
synthetischen Wirkstoffen untersucht.

9
1. Introduction
1.1. Chinese herbal medicine
Pharmaceutical products from traditional Chinese medicine (TCM) contain one or
more active substances, all of which are derived wholly from plants, animals or min-
erals. The medicinal products or all of its active substances are described in the cur-
rent edition of “The Chinese Herbal Medicine Materia Medica” or an equivalent publi-
cation. TCM does not include any medicinal product that contains as an active sub-
stance any chemically defined, isolated constituents of plants, animals or minerals
[1], [2].
TCM is gaining popularity in western countries as a form of complementary and al-
ternative medicine (CAM). Very little is known concerning the reasons for the in-
creased popularity of CAM in developed countries. Untested assumptions include the
side-effects of synthetic drugs, general dissatisfaction of orthodox treatment, dis-
eases that can not be cured with conventional therapies and patients with chronic
illnesses demanding more attention from western practitioners.
However several problems may be associated with herbal medicinal products. They
may be contaminated with excessive or banned pesticides, microbial contaminants,
heavy metals and chemical toxins [3]. Whereas problems relating to the toxicity of
their herbal ingredients have been repeatedly reviewed, other important safety issues
have been neglected for a long time. One such topic is the possibility of adulteration
of TCM products with conventional drugs [4].
Recently more and more attention is paid to this problem. Many reports about adul-
terations and adverse reactions due to synthetic ingredients have been elaborated
[3-10]. Most common adulterants are all sorts of pain killers, Cortisone and its deriva-
tives, anti-allergic substances, oral anti-diabetic agents and lifestyle medicines as
anorexic drugs and anti-impotency drugs. Problems resulting from this kind of adul-
terants are not negligible.
People’s Republic of China is in the endeavor to improve manufacturing conditions
and to apply actual Good Manufacturing Practice (GMP) guidelines to comply with
the expected quality standard of the growing western markets. Quality control is in-
creased and inspection reinforced.
10
However the opposite side is not inactive either. Inventive producer try to defy ana-
lytical control by decreasing the quantity of the ingredient below the limit of detection.
Other manufacturers add structure-modified compounds that are hard to determine.
Among others, four anti-impotency drug analogues have been determined and their
chemical structures have been elucidated. As these substances are synthesized un-
der dubiously conditions and effects and toxicity have not been tested, they may ex-
ceed Sildenafil’s risks and complications [11].
Furthermore many companies sell their products through the internet, which can
hardly be supervised and it will be a big challenge to governmental controlling bod-
ies.
1.2. Aim of this Diploma Thesis
TCM is gaining popularity in western countries. Distribution of TCM products has be-
come a lucrative business. Besides reputable manufacturers a multitude of dubious
internet shops try to get their piece of the action. Drugs purchased via the internet
are often labeled only in Chinese. Specifications of ingredients are rarely declared.
Where effectiveness is insufficient impostors adulterate so called purely herbal TCM
medicines with chemical active ingredients.
So far most analytical methods for the detection of synthetic adulterants in herbal
medicines were developed for HPLC/MS.
The aim of this diploma thesis was to develop simple and rapid HPTLC methods for
the detection of synthetic adulterants in herbal preparations as a contribution to the
pharmaceutical drug safety.
11
1.3. Thin-layer chromatography
Thin-layer chromatography is of great importance for the analysis of natural products.
A large number of complex samples can rapidly be analyzed under the same condi-
tions. Analysis and sample preparation time is generally short; many samples can
easily be compared side by side on the same plate. This advantage is especially
convenient for the analysis of fingerprints. A broad spectrum of constituents can thus
be detected and described without the need to know the chemical nature of each
zone of the chromatogram. Results are not only reported as peak data but can also
easily be presented and communicated as images [12].
The availability of modern, usually computer-controlled, equipment has unlocked the
full power of the method and opened new fields of qualitative and quantitative appli-
cations of planar chromatography. Today’s instruments, such as automatic applica-
tion devices, sophisticated developing devices, scanning densitometers, and video
documentation systems, have complemented the inherent advantages of TLC with
increased reliability, better sensitivity, and improved precision and accuracy of the
analytical result. Even tough all modern TLC equipments can also be used with con-
ventional plates, it should be understood that only with HPTLC plates is the maxi-
mum performance achieved and all advantages of the technique realized. [13].
However HPTLC is not always a suitable method. Other chromatographic techniques
(GC, HPLC) with a higher resolving power combined with a detector (MS, IR, NMR)
are still best choice for many problems.
1.3.1. Principle
Thin-layer chromatography is an analytical technique for the separation of mixtures. It
involves passing a sample (the analyte) in the mobile phase through the stationary
phase. Usually, each component has a characteristic migration distance that can be
used to identify it and thus the composition of the original mixture. Depending on the
plate material different mechanisms like absorption, partition, ion exchange and com-
plexation have an impact.
TLC is a flexible, versatile, and economical process in which the various stages
(sample preparation, application, chromatogram development and evaluation) are
12
carried out independently. The advantages of this off-line arrangement as compared
to an on-line process, such as column high performance liquid chromatography
(HPLC), have been outlined and include the following (according to [14]):
1. Availability of a great range of stationary phases with unique selectivities for
mixture components
2. Ability to choose solvents for the mobile phase is not restricted by low UV
transparency or the need for ultra-high purity
3. Repetition of densitometric evaluation can be achieved under different condi-
tions without repeating the chromatography in order to optimize quantification
since all sample fractions are stored on the plate
4. High sample throughput since many samples can be chromatographed simul-
taneously
5. Minimal cost of solvent purchase and disposal since the required amount of
mobile phase per sample is small
6. Specific components can be optimized selectively
7. No cross contamination as plates are used only once
1.3.2. Influencing factors
Influencing factors in HPTLC are various. As HPTLC-Systems are open systems and
therefore sensitive to variations, reproducibility is only warranted if influencing factors
are kept constant. A standardized methodology allows reproducible results. Never-
theless, some parameters are tested in the following.
13
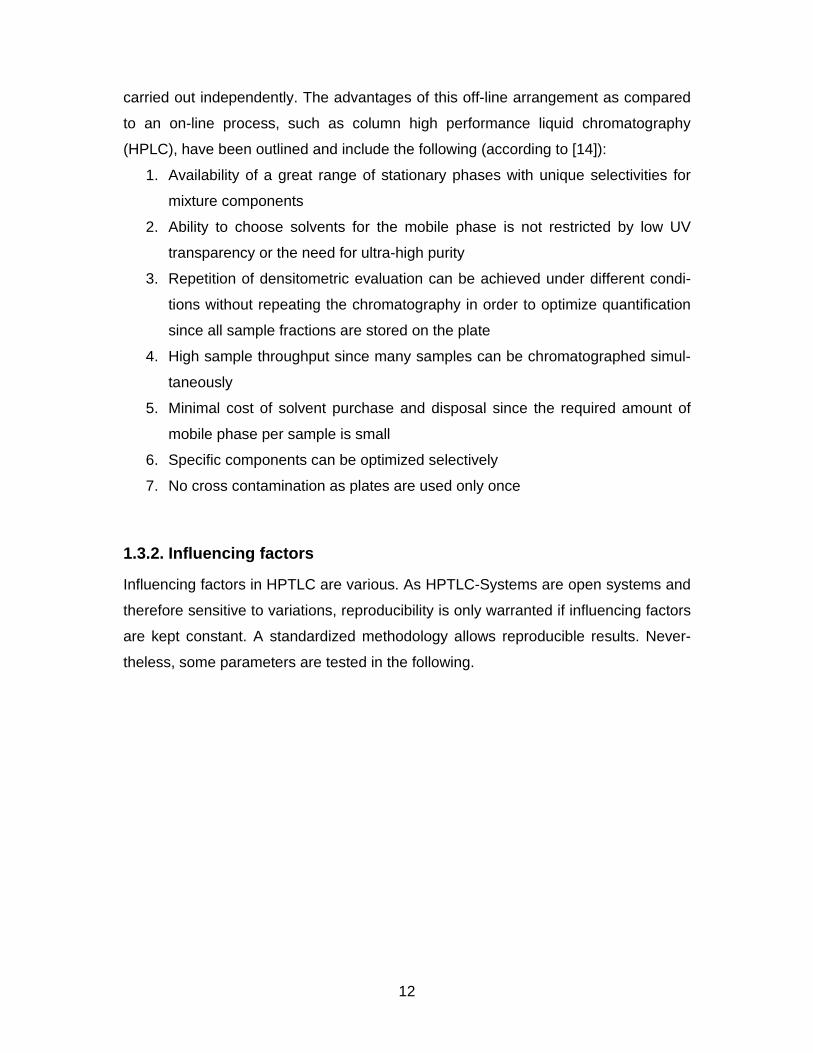
1.3.3. Method development
Figure 1-1 Method development schema
Figure 1-1 shows a schematic overview of a method development. At the beginning
sample preparation, chromatographic system and stationary phase have to be de-
fined. Then the mobile phase can be composed and the detection optimized.
For the mobile phase, it is advisable to search the literature for methods for similar
substances and to test them. If the existing methods do not yield satisfying results,
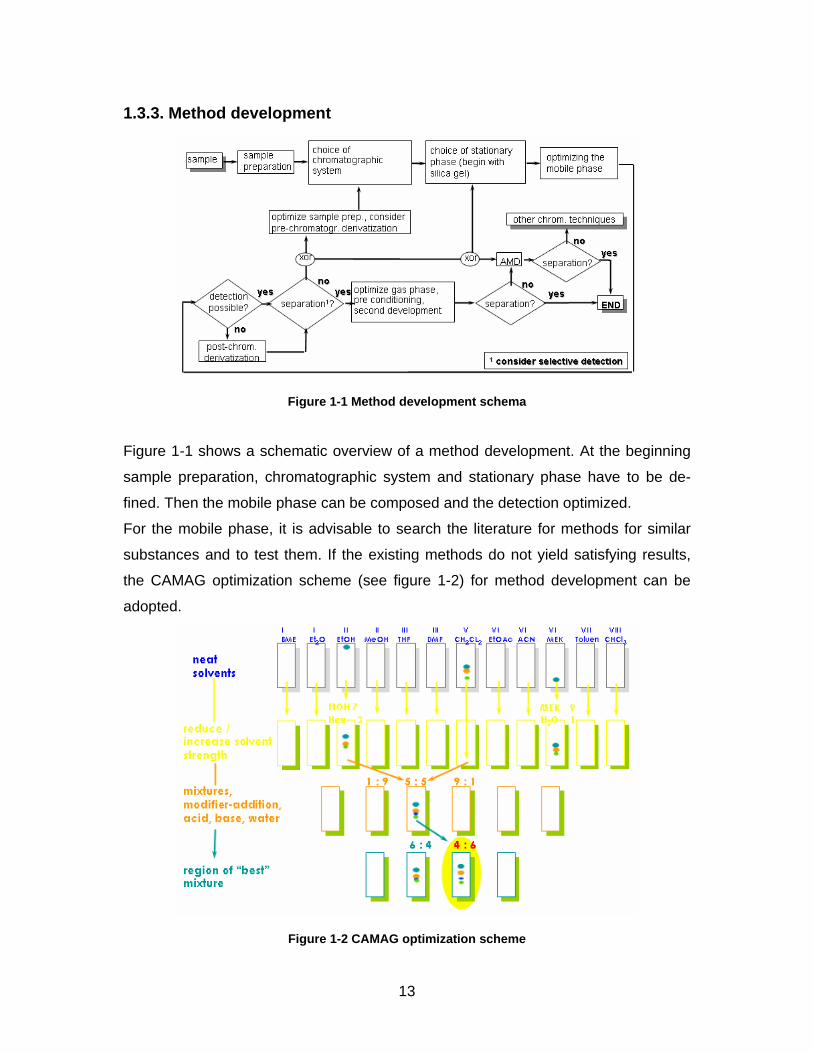
the CAMAG optimization scheme (see figure 1-2) for method development can be
adopted.
Figure 1-2 CAMAG optimization scheme
14
Chamber At the beginning of an optimization the chamber should be determined. In this work
saturated twin trough chambers according to the HPTLC SOP of CAMAG were used.
They permit a high reproducibility and reduce the risk of solvent demixing.
Stationary phase Silica gel is the most commonly used plate material. The porous texture allows an
excellent separation for a majority of substances.
Chemically modified plates with RP18-, diol-, cyano- or amino-phases may be useful
if silica gel does not yield the required separation.
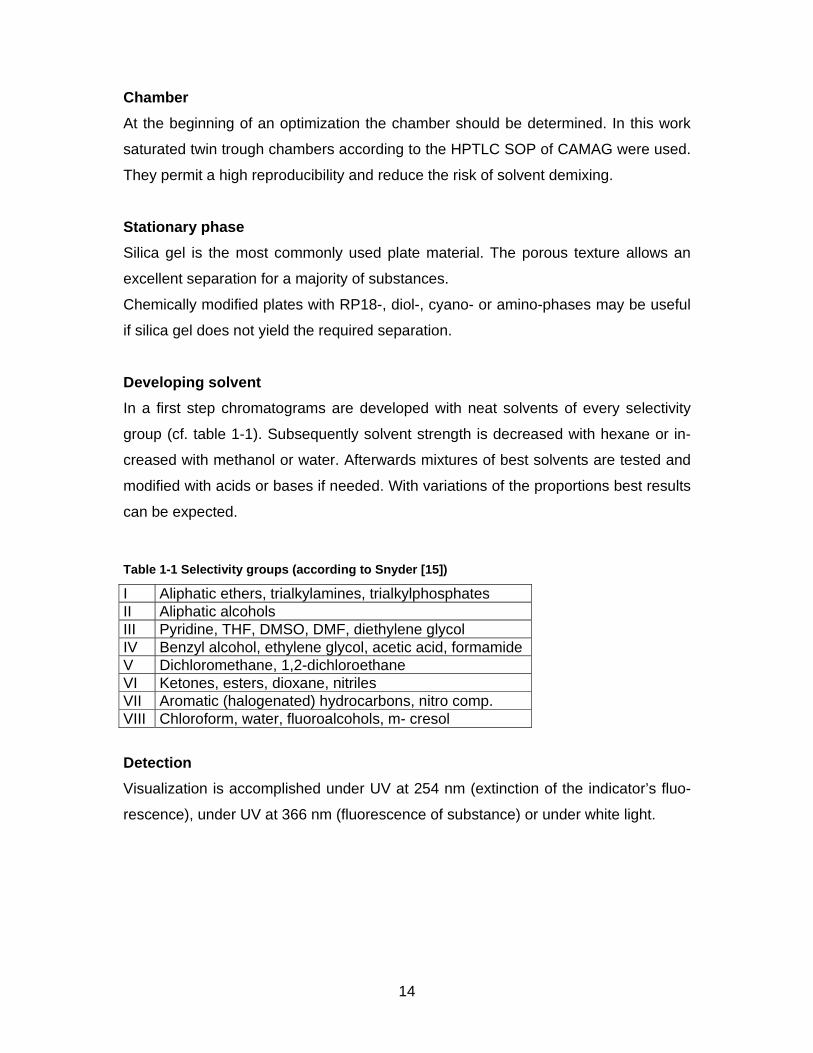
Developing solvent In a first step chromatograms are developed with neat solvents of every selectivity
group (cf. table 1-1). Subsequently solvent strength is decreased with hexane or in-
creased with methanol or water. Afterwards mixtures of best solvents are tested and
modified with acids or bases if needed. With variations of the proportions best results
can be expected.
Table 1-1 Selectivity groups (according to Snyder [15])
I Aliphatic ethers, trialkylamines, trialkylphosphates II Aliphatic alcohols III Pyridine, THF, DMSO, DMF, diethylene glycol IV Benzyl alcohol, ethylene glycol, acetic acid, formamide V Dichloromethane, 1,2-dichloroethane VI Ketones, esters, dioxane, nitriles VII Aromatic (halogenated) hydrocarbons, nitro comp. VIII Chloroform, water, fluoroalcohols, m- cresol
Detection Visualization is accomplished under UV at 254 nm (extinction of the indicator’s fluo-
rescence), under UV at 366 nm (fluorescence of substance) or under white light.
15
1.3.4. Quantitative evaluation
Quantitative evaluation is possible with densitometric analysis of the chromatogram.
During evaluation with a modern densitometer the separation tracks are scanned
with a light beam of defined size. The densitometer is, therefore, commonly referred
to as scanner.
A photo sensor in the densitometer measures diffusely reflected light. The difference
between the optical signal from the sample-free background and that from a sample
zone is measured. The signal must be correlated with those from different amounts
of calibration standards chromatographed on the same plate [16].
To define the optimal wavelength for measurement, a spectrum of the designated
substance is taken.
1.3.5. Problems with natural products
Asian herbal medicines generally consist of a combination of different natural prod-
ucts. Samples are complex mixtures of compounds, active principles are often un-
known. This makes analytical investigations rather difficult. Furthermore RF values
and UV spectra provide only limited information about the sample constitution. Reli-
able analyses are therefore not always evident.

17
2. Material and Methods
2.1. Material
2.1.1. Samples
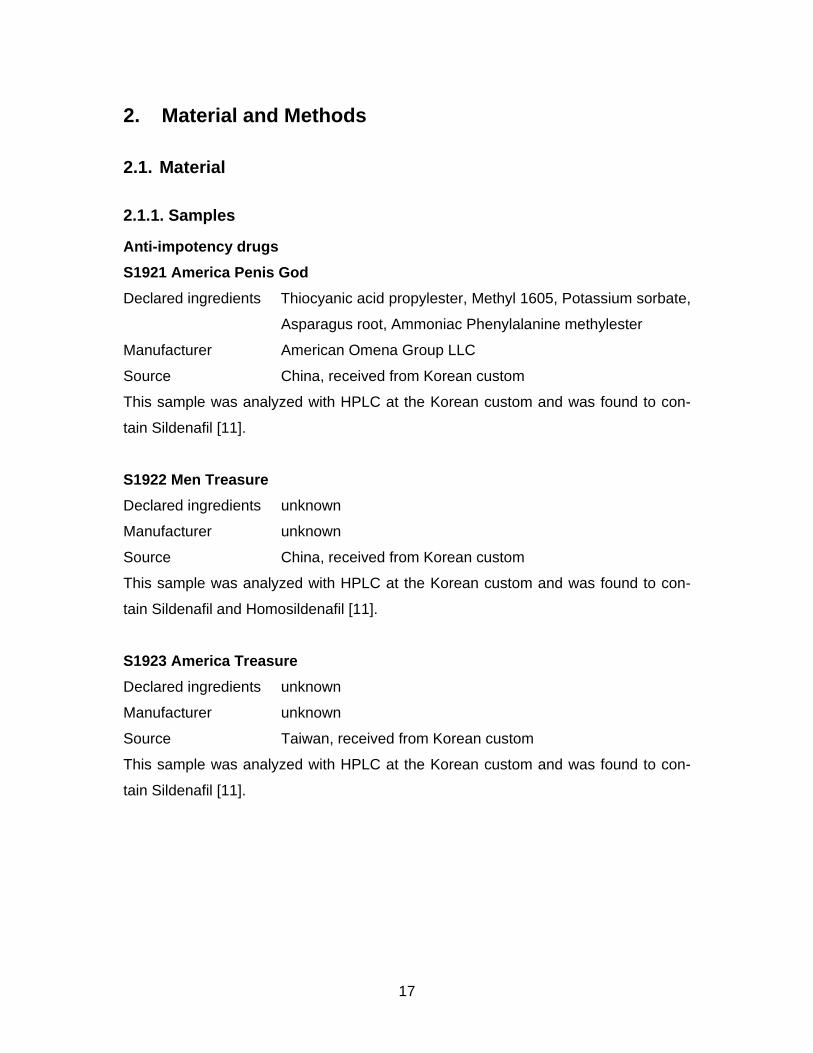
Anti-impotency drugs S1921 America Penis God
Declared ingredients Thiocyanic acid propylester, Methyl 1605, Potassium sorbate,
Asparagus root, Ammoniac Phenylalanine methylester
Manufacturer American Omena Group LLC
Source China, received from Korean custom
This sample was analyzed with HPLC at the Korean custom and was found to con-
tain Sildenafil [11].
S1922 Men Treasure
Declared ingredients unknown
Manufacturer unknown
Source China, received from Korean custom
This sample was analyzed with HPLC at the Korean custom and was found to con-
tain Sildenafil and Homosildenafil [11].
S1923 America Treasure Declared ingredients unknown
Manufacturer unknown
Source Taiwan, received from Korean custom
This sample was analyzed with HPLC at the Korean custom and was found to con-
tain Sildenafil [11].
18
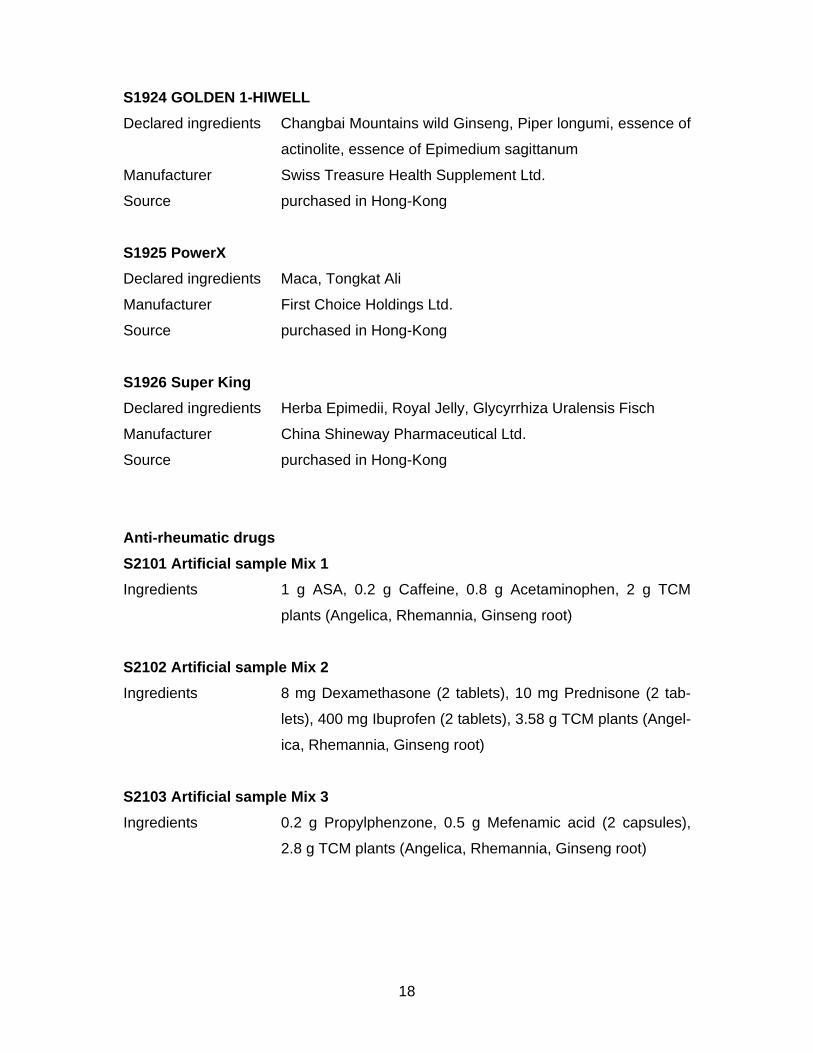
S1924 GOLDEN 1-HIWELL Declared ingredients Changbai Mountains wild Ginseng, Piper longumi, essence of
actinolite, essence of Epimedium sagittanum
Manufacturer Swiss Treasure Health Supplement Ltd.
Source purchased in Hong-Kong
S1925 PowerX
Declared ingredients Maca, Tongkat Ali
Manufacturer First Choice Holdings Ltd.
Source purchased in Hong-Kong
S1926 Super King
Declared ingredients Herba Epimedii, Royal Jelly, Glycyrrhiza Uralensis Fisch
Manufacturer China Shineway Pharmaceutical Ltd.
Source purchased in Hong-Kong
Anti-rheumatic drugs S2101 Artificial sample Mix 1
Ingredients 1 g ASA, 0.2 g Caffeine, 0.8 g Acetaminophen, 2 g TCM
plants (Angelica, Rhemannia, Ginseng root)
S2102 Artificial sample Mix 2
Ingredients 8 mg Dexamethasone (2 tablets), 10 mg Prednisone (2 tab-
lets), 400 mg Ibuprofen (2 tablets), 3.58 g TCM plants (Angel-
ica, Rhemannia, Ginseng root)
S2103 Artificial sample Mix 3
Ingredients 0.2 g Propylphenzone, 0.5 g Mefenamic acid (2 capsules),
2.8 g TCM plants (Angelica, Rhemannia, Ginseng root)
19
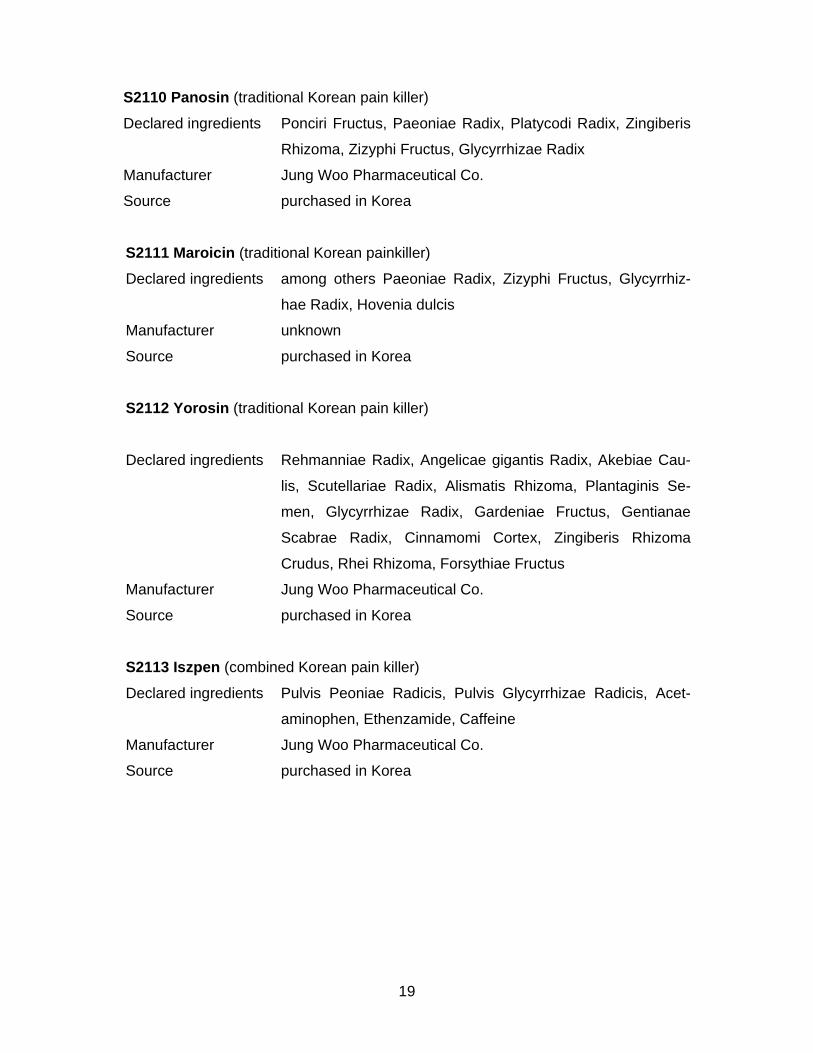
S2110 Panosin (traditional Korean pain killer)
Declared ingredients Ponciri Fructus, Paeoniae Radix, Platycodi Radix, Zingiberis
Rhizoma, Zizyphi Fructus, Glycyrrhizae Radix
Manufacturer Jung Woo Pharmaceutical Co.
Source purchased in Korea
S2111 Maroicin (traditional Korean painkiller)
Declared ingredients among others Paeoniae Radix, Zizyphi Fructus, Glycyrrhiz-
hae Radix, Hovenia dulcis
Manufacturer unknown
Source purchased in Korea
S2112 Yorosin (traditional Korean pain killer)
Declared ingredients Rehmanniae Radix, Angelicae gigantis Radix, Akebiae Cau-
lis, Scutellariae Radix, Alismatis Rhizoma, Plantaginis Se-
men, Glycyrrhizae Radix, Gardeniae Fructus, Gentianae
Scabrae Radix, Cinnamomi Cortex, Zingiberis Rhizoma
Crudus, Rhei Rhizoma, Forsythiae Fructus
Manufacturer Jung Woo Pharmaceutical Co.
Source purchased in Korea
S2113 Iszpen (combined Korean pain killer)
Declared ingredients Pulvis Peoniae Radicis, Pulvis Glycyrrhizae Radicis, Acet-
aminophen, Ethenzamide, Caffeine
Manufacturer Jung Woo Pharmaceutical Co.
Source purchased in Korea
20
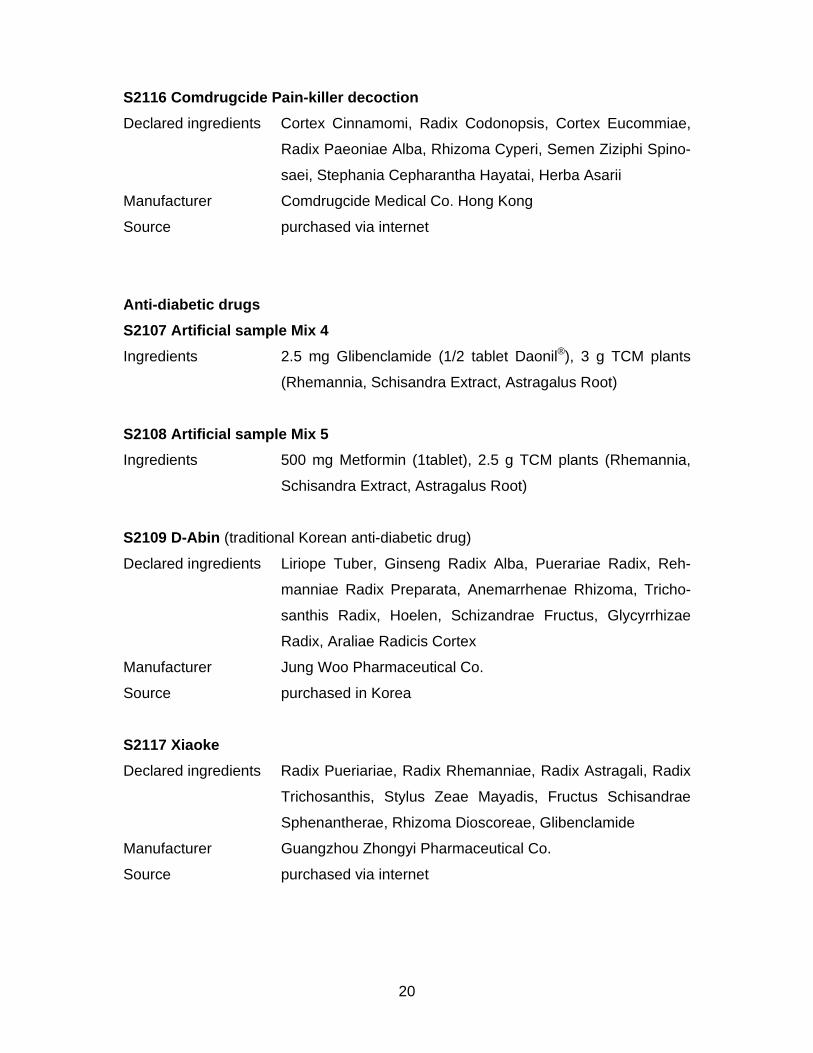
S2116 Comdrugcide Pain-killer decoction
Declared ingredients Cortex Cinnamomi, Radix Codonopsis, Cortex Eucommiae,
Radix Paeoniae Alba, Rhizoma Cyperi, Semen Ziziphi Spino-
saei, Stephania Cepharantha Hayatai, Herba Asarii
Manufacturer Comdrugcide Medical Co. Hong Kong
Source purchased via internet
Anti-diabetic drugs S2107 Artificial sample Mix 4
Ingredients 2.5 mg Glibenclamide (1/2 tablet Daonil®), 3 g TCM plants
(Rhemannia, Schisandra Extract, Astragalus Root)
S2108 Artificial sample Mix 5
Ingredients 500 mg Metformin (1tablet), 2.5 g TCM plants (Rhemannia,
Schisandra Extract, Astragalus Root)
S2109 D-Abin (traditional Korean anti-diabetic drug)
Declared ingredients Liriope Tuber, Ginseng Radix Alba, Puerariae Radix, Reh-
manniae Radix Preparata, Anemarrhenae Rhizoma, Tricho-
santhis Radix, Hoelen, Schizandrae Fructus, Glycyrrhizae
Radix, Araliae Radicis Cortex
Manufacturer Jung Woo Pharmaceutical Co.
Source purchased in Korea
S2117 Xiaoke
Declared ingredients Radix Pueriariae, Radix Rhemanniae, Radix Astragali, Radix
Trichosanthis, Stylus Zeae Mayadis, Fructus Schisandrae
Sphenantherae, Rhizoma Dioscoreae, Glibenclamide
Manufacturer Guangzhou Zhongyi Pharmaceutical Co.
Source purchased via internet
21
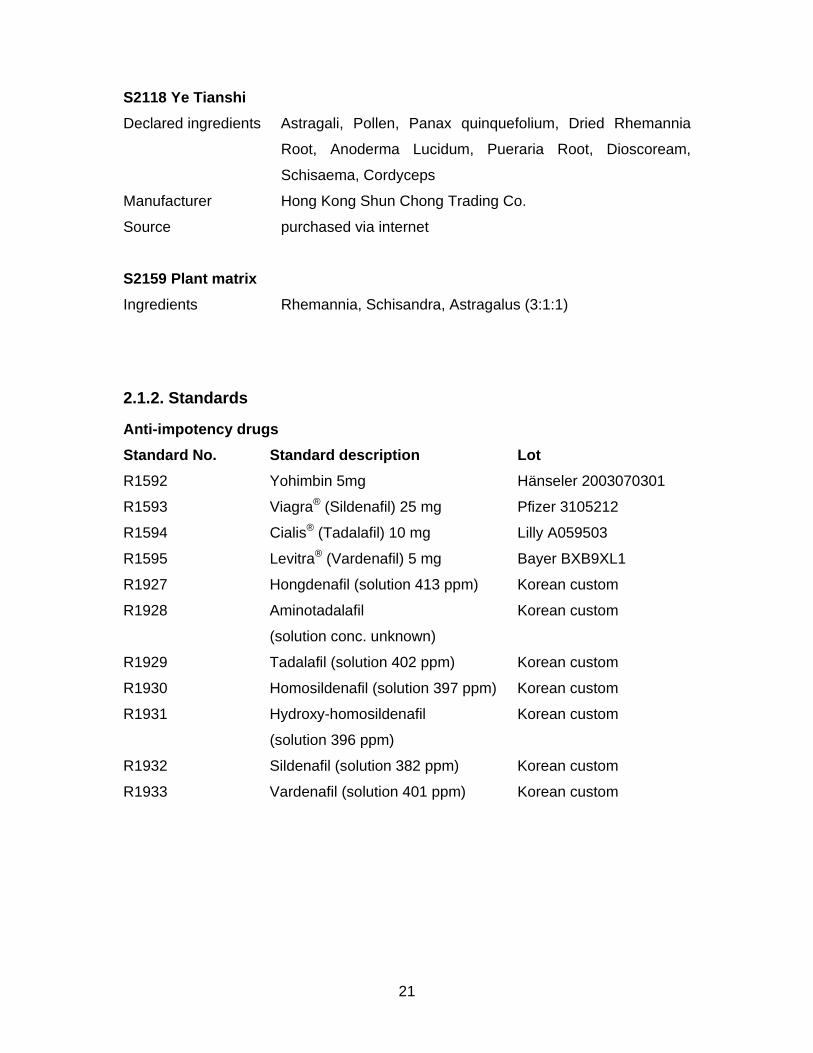
S2118 Ye Tianshi Declared ingredients Astragali, Pollen, Panax quinquefolium, Dried Rhemannia
Root, Anoderma Lucidum, Pueraria Root, Dioscoream,
Schisaema, Cordyceps
Manufacturer Hong Kong Shun Chong Trading Co.
Source purchased via internet
S2159 Plant matrix Ingredients Rhemannia, Schisandra, Astragalus (3:1:1)
2.1.2. Standards
Anti-impotency drugs Standard No. Standard description Lot R1592 Yohimbin 5mg Hänseler 2003070301
R1593 Viagra® (Sildenafil) 25 mg Pfizer 3105212
R1594 Cialis® (Tadalafil) 10 mg Lilly A059503
R1595 Levitra® (Vardenafil) 5 mg Bayer BXB9XL1
R1927 Hongdenafil (solution 413 ppm) Korean custom
R1928 Aminotadalafil Korean custom
(solution conc. unknown)
R1929 Tadalafil (solution 402 ppm) Korean custom
R1930 Homosildenafil (solution 397 ppm) Korean custom
R1931 Hydroxy-homosildenafil Korean custom
(solution 396 ppm)
R1932 Sildenafil (solution 382 ppm) Korean custom
R1933 Vardenafil (solution 401 ppm) Korean custom
22
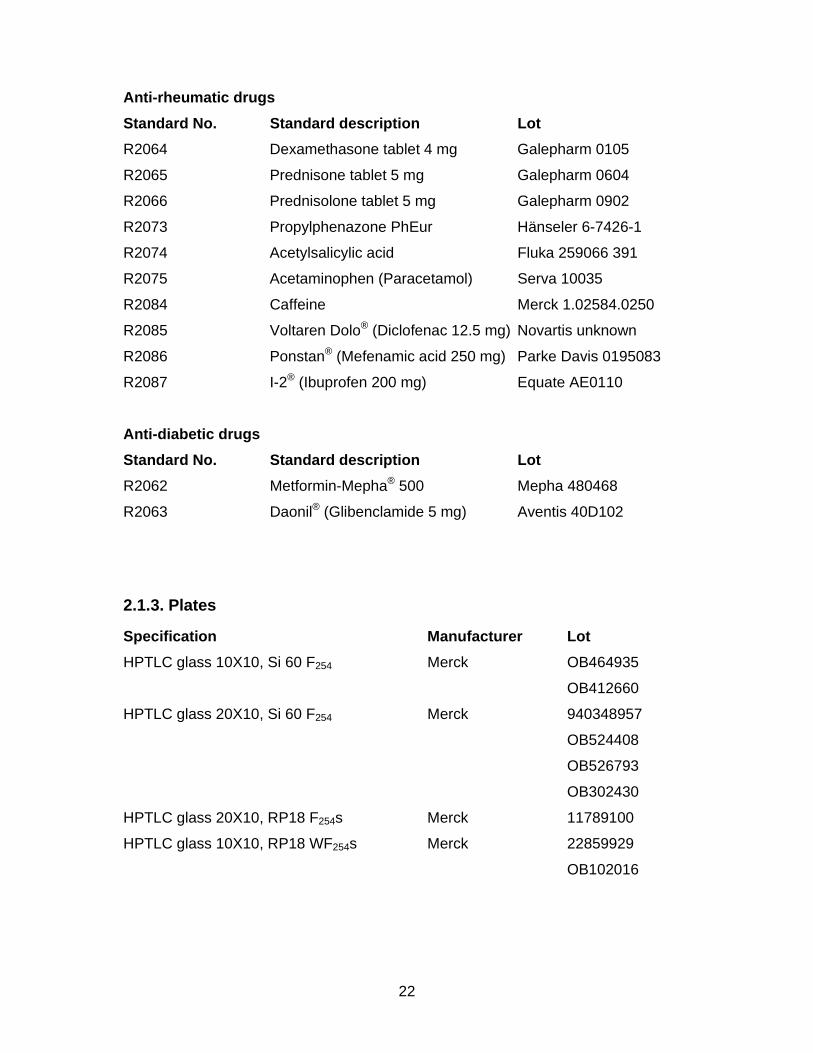
Anti-rheumatic drugs
Standard No. Standard description Lot R2064 Dexamethasone tablet 4 mg Galepharm 0105
R2065 Prednisone tablet 5 mg Galepharm 0604
R2066 Prednisolone tablet 5 mg Galepharm 0902
R2073 Propylphenazone PhEur Hänseler 6-7426-1
R2074 Acetylsalicylic acid Fluka 259066 391
R2075 Acetaminophen (Paracetamol) Serva 10035
R2084 Caffeine Merck 1.02584.0250
R2085 Voltaren Dolo® (Diclofenac 12.5 mg) Novartis unknown
R2086 Ponstan® (Mefenamic acid 250 mg) Parke Davis 0195083
R2087 I-2® (Ibuprofen 200 mg) Equate AE0110
Anti-diabetic drugs
Standard No. Standard description Lot R2062 Metformin-Mepha® 500 Mepha 480468
R2063 Daonil® (Glibenclamide 5 mg) Aventis 40D102
2.1.3. Plates
Specification Manufacturer Lot HPTLC glass 10X10, Si 60 F254 Merck OB464935
OB412660
HPTLC glass 20X10, Si 60 F254 Merck 940348957
OB524408
OB526793
OB302430
HPTLC glass 20X10, RP18 F254s Merck 11789100
HPTLC glass 10X10, RP18 WF254s Merck 22859929
OB102016
23
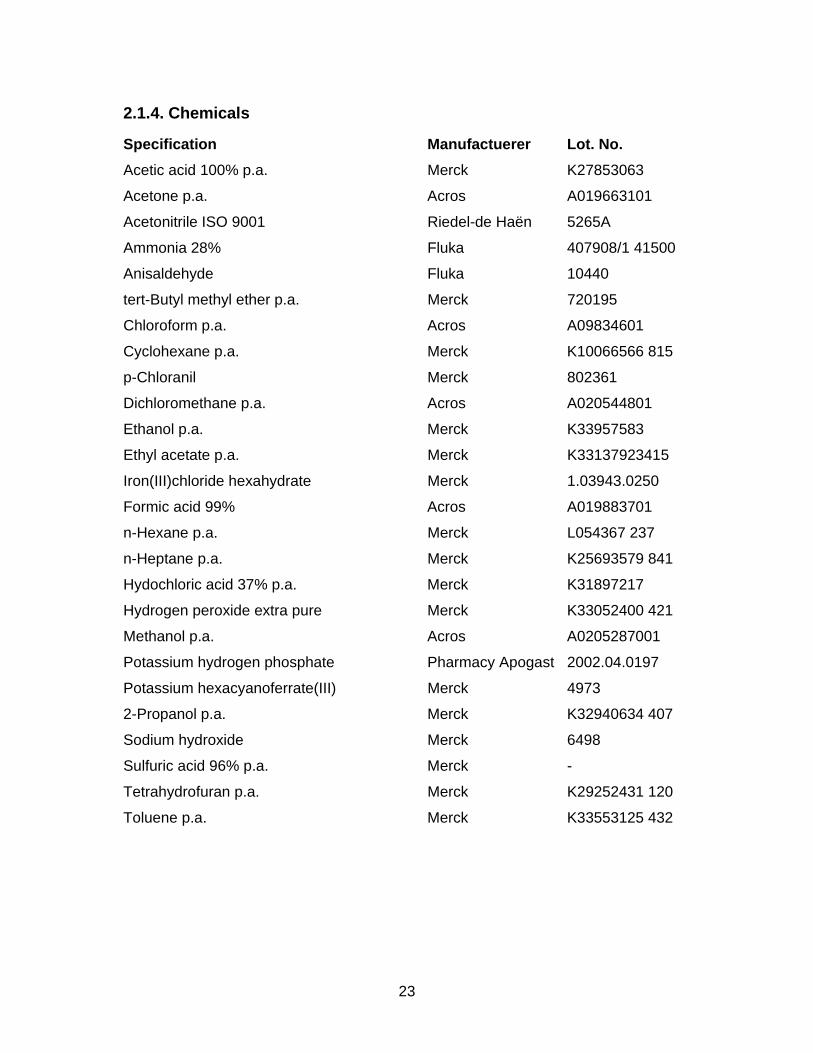
2.1.4. Chemicals
Specification Manufactuerer Lot. No. Acetic acid 100% p.a. Merck K27853063
Acetone p.a. Acros A019663101
Acetonitrile ISO 9001 Riedel-de Haën 5265A
Ammonia 28% Fluka 407908/1 41500
Anisaldehyde Fluka 10440
tert-Butyl methyl ether p.a. Merck 720195
Chloroform p.a. Acros A09834601
Cyclohexane p.a. Merck K10066566 815
p-Chloranil Merck 802361
Dichloromethane p.a. Acros A020544801
Ethanol p.a. Merck K33957583
Ethyl acetate p.a. Merck K33137923415
Iron(III)chloride hexahydrate Merck 1.03943.0250
Formic acid 99% Acros A019883701
n-Hexane p.a. Merck L054367 237
n-Heptane p.a. Merck K25693579 841
Hydochloric acid 37% p.a. Merck K31897217
Hydrogen peroxide extra pure Merck K33052400 421
Methanol p.a. Acros A0205287001
Potassium hydrogen phosphate Pharmacy Apogast 2002.04.0197
Potassium hexacyanoferrate(III) Merck 4973
2-Propanol p.a. Merck K32940634 407
Sodium hydroxide Merck 6498
Sulfuric acid 96% p.a. Merck -
Tetrahydrofuran p.a. Merck K29252431 120
Toluene p.a. Merck K33553125 432
24
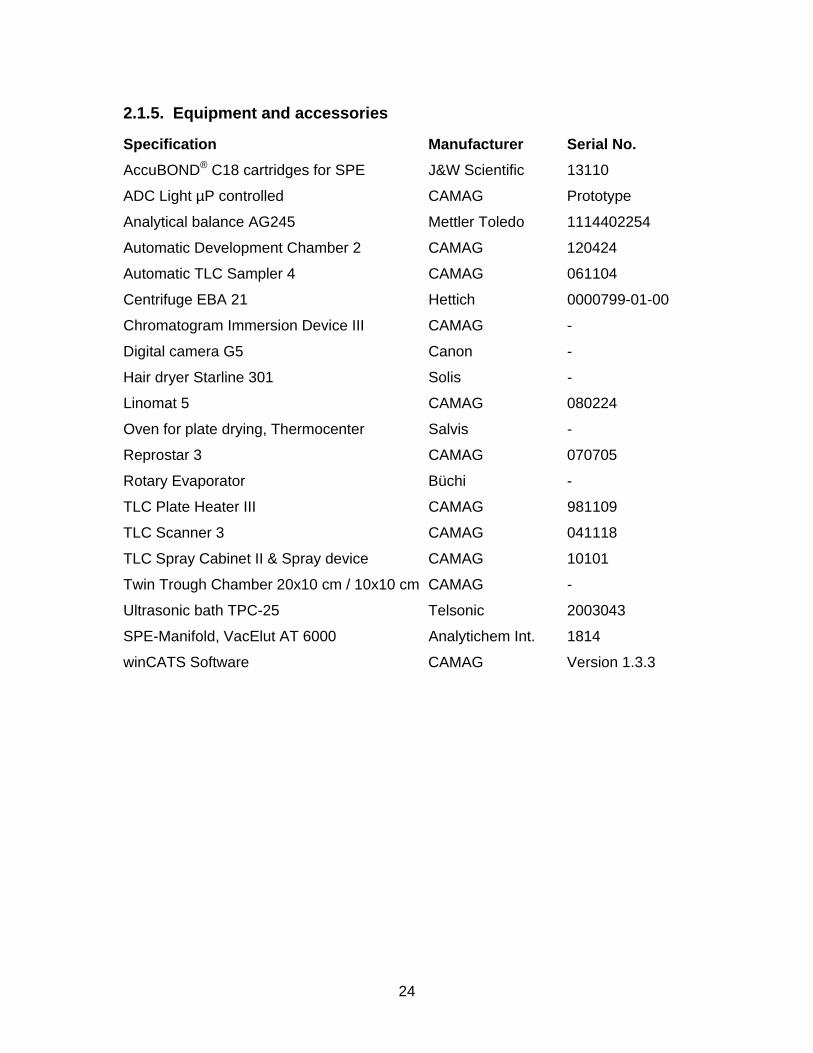
2.1.5. Equipment and accessories
Specification Manufacturer Serial No. AccuBOND® C18 cartridges for SPE J&W Scientific 13110
ADC Light µP controlled CAMAG Prototype
Analytical balance AG245 Mettler Toledo 1114402254
Automatic Development Chamber 2 CAMAG 120424
Automatic TLC Sampler 4 CAMAG 061104
Centrifuge EBA 21 Hettich 0000799-01-00
Chromatogram Immersion Device III CAMAG -
Digital camera G5 Canon -
Hair dryer Starline 301 Solis -
Linomat 5 CAMAG 080224
Oven for plate drying, Thermocenter Salvis -
Reprostar 3 CAMAG 070705
Rotary Evaporator Büchi -
TLC Plate Heater III CAMAG 981109
TLC Scanner 3 CAMAG 041118
TLC Spray Cabinet II & Spray device CAMAG 10101
Twin Trough Chamber 20x10 cm / 10x10 cm CAMAG -
Ultrasonic bath TPC-25 Telsonic 2003043
SPE-Manifold, VacElut AT 6000 Analytichem Int. 1814
winCATS Software CAMAG Version 1.3.3
25
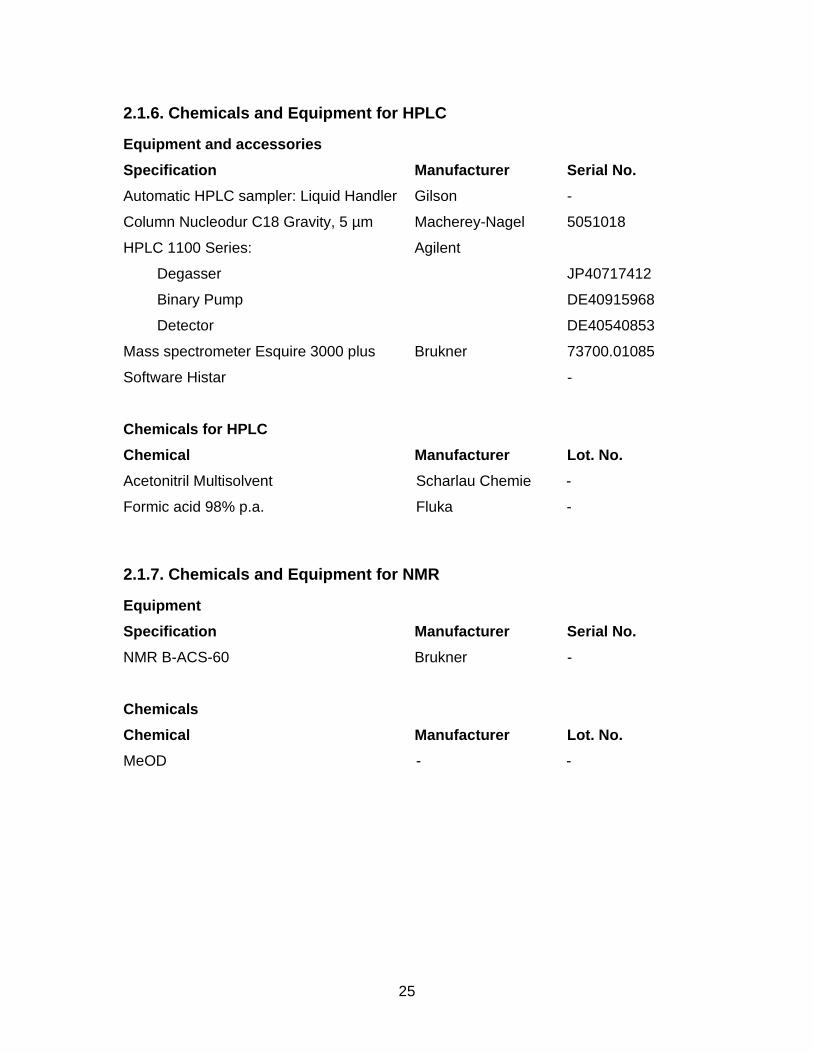
2.1.6. Chemicals and Equipment for HPLC
Equipment and accessories Specification Manufacturer Serial No. Automatic HPLC sampler: Liquid Handler Gilson -
Column Nucleodur C18 Gravity, 5 µm Macherey-Nagel 5051018
HPLC 1100 Series: Agilent
Degasser JP40717412
Binary Pump DE40915968
Detector DE40540853
Mass spectrometer Esquire 3000 plus Brukner 73700.01085
Software Histar -
Chemicals for HPLC
Chemical Manufacturer Lot. No. Acetonitril Multisolvent Scharlau Chemie -
Formic acid 98% p.a. Fluka -
2.1.7. Chemicals and Equipment for NMR
Equipment Specification Manufacturer Serial No. NMR B-ACS-60 Brukner -
Chemicals Chemical Manufacturer Lot. No. MeOD - -
26
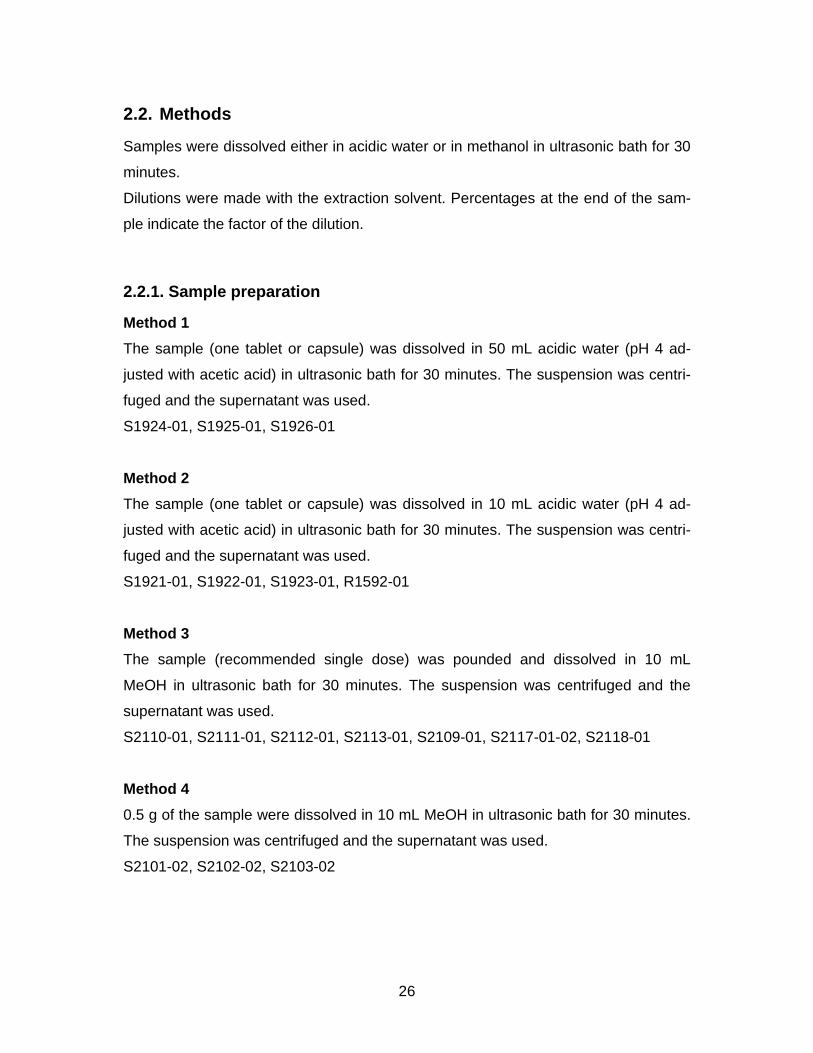
2.2. Methods
Samples were dissolved either in acidic water or in methanol in ultrasonic bath for 30
minutes.
Dilutions were made with the extraction solvent. Percentages at the end of the sam-
ple indicate the factor of the dilution.
2.2.1. Sample preparation
Method 1 The sample (one tablet or capsule) was dissolved in 50 mL acidic water (pH 4 ad-
justed with acetic acid) in ultrasonic bath for 30 minutes. The suspension was centri-
fuged and the supernatant was used. S1924-01, S1925-01, S1926-01
Method 2 The sample (one tablet or capsule) was dissolved in 10 mL acidic water (pH 4 ad-
justed with acetic acid) in ultrasonic bath for 30 minutes. The suspension was centri-
fuged and the supernatant was used. S1921-01, S1922-01, S1923-01, R1592-01
Method 3 The sample (recommended single dose) was pounded and dissolved in 10 mL
MeOH in ultrasonic bath for 30 minutes. The suspension was centrifuged and the
supernatant was used.
S2110-01, S2111-01, S2112-01, S2113-01, S2109-01, S2117-01-02, S2118-01
Method 4 0.5 g of the sample were dissolved in 10 mL MeOH in ultrasonic bath for 30 minutes.
The suspension was centrifuged and the supernatant was used.
S2101-02, S2102-02, S2103-02
27
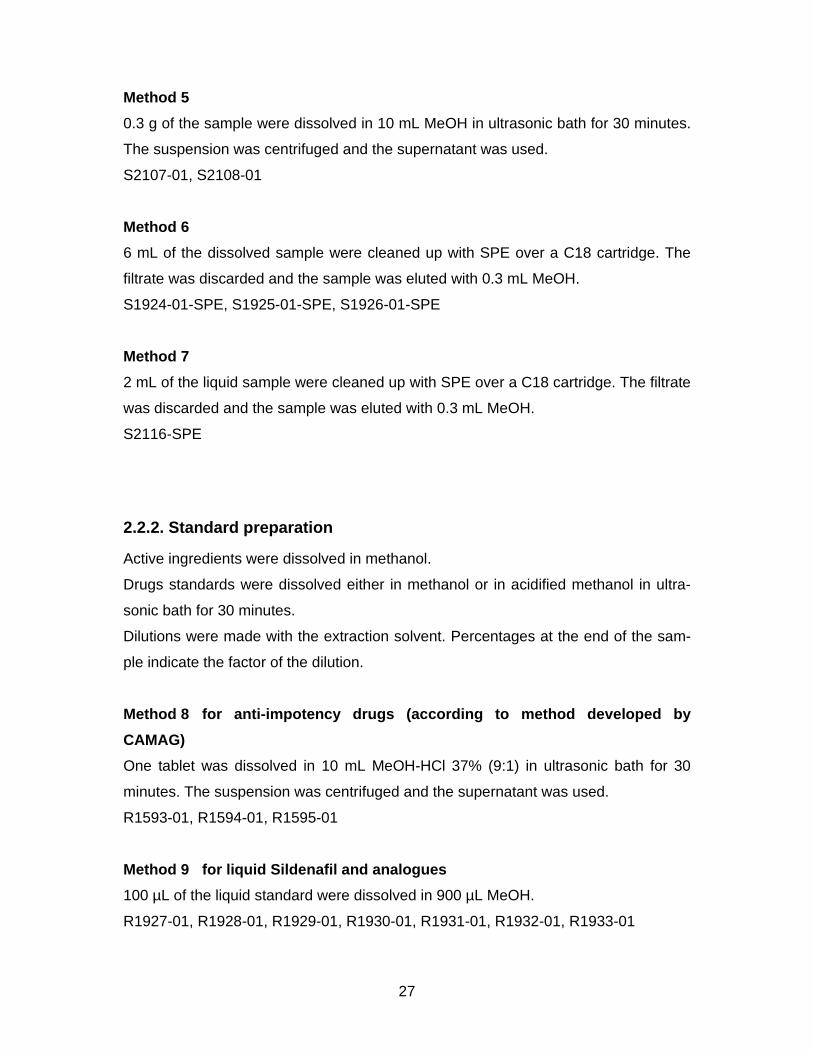
Method 5 0.3 g of the sample were dissolved in 10 mL MeOH in ultrasonic bath for 30 minutes.
The suspension was centrifuged and the supernatant was used.
S2107-01, S2108-01
Method 6
6 mL of the dissolved sample were cleaned up with SPE over a C18 cartridge. The
filtrate was discarded and the sample was eluted with 0.3 mL MeOH.
S1924-01-SPE, S1925-01-SPE, S1926-01-SPE
Method 7 2 mL of the liquid sample were cleaned up with SPE over a C18 cartridge. The filtrate
was discarded and the sample was eluted with 0.3 mL MeOH.
S2116-SPE
2.2.2. Standard preparation
Active ingredients were dissolved in methanol.
Drugs standards were dissolved either in methanol or in acidified methanol in ultra-
sonic bath for 30 minutes.
Dilutions were made with the extraction solvent. Percentages at the end of the sam-
ple indicate the factor of the dilution.
Method 8 for anti-impotency drugs (according to method developed by CAMAG) One tablet was dissolved in 10 mL MeOH-HCl 37% (9:1) in ultrasonic bath for 30
minutes. The suspension was centrifuged and the supernatant was used.
R1593-01, R1594-01, R1595-01
Method 9 for liquid Sildenafil and analogues 100 µL of the liquid standard were dissolved in 900 µL MeOH.
R1927-01, R1928-01, R1929-01, R1930-01, R1931-01, R1932-01, R1933-01
28
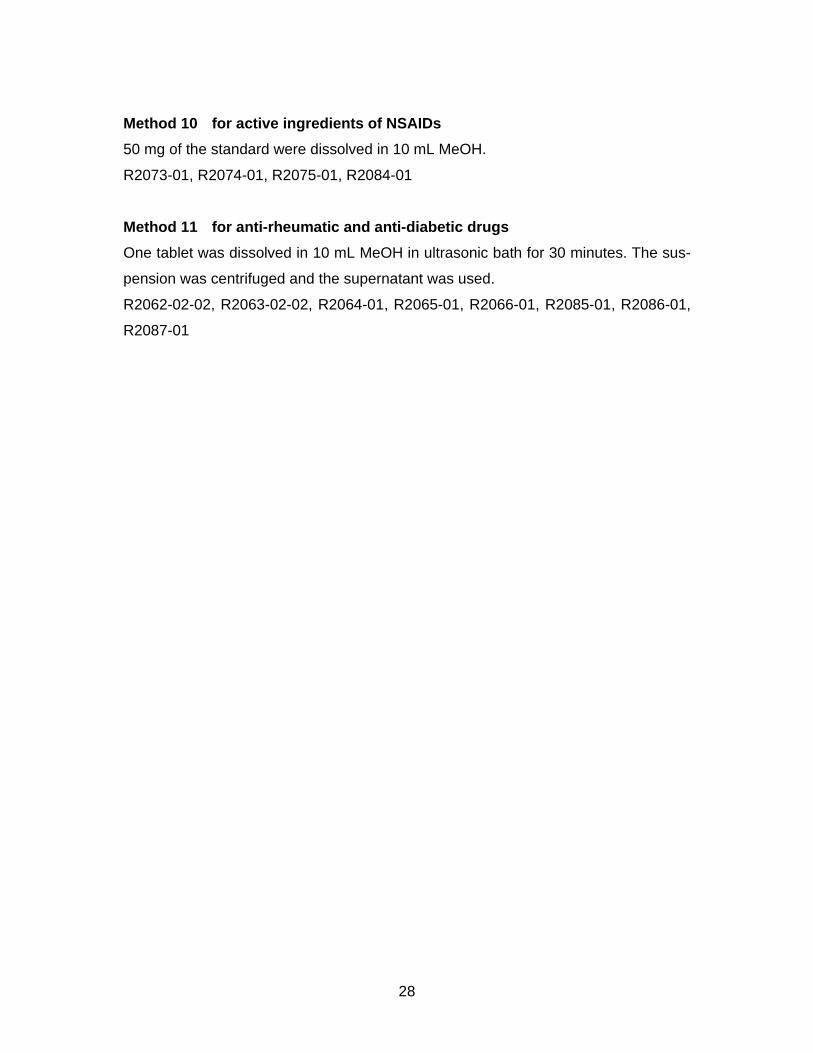
Method 10 for active ingredients of NSAIDs 50 mg of the standard were dissolved in 10 mL MeOH.
R2073-01, R2074-01, R2075-01, R2084-01
Method 11 for anti-rheumatic and anti-diabetic drugs
One tablet was dissolved in 10 mL MeOH in ultrasonic bath for 30 minutes. The sus-
pension was centrifuged and the supernatant was used.
R2062-02-02, R2063-02-02, R2064-01, R2065-01, R2066-01, R2085-01, R2086-01,
R2087-01
29
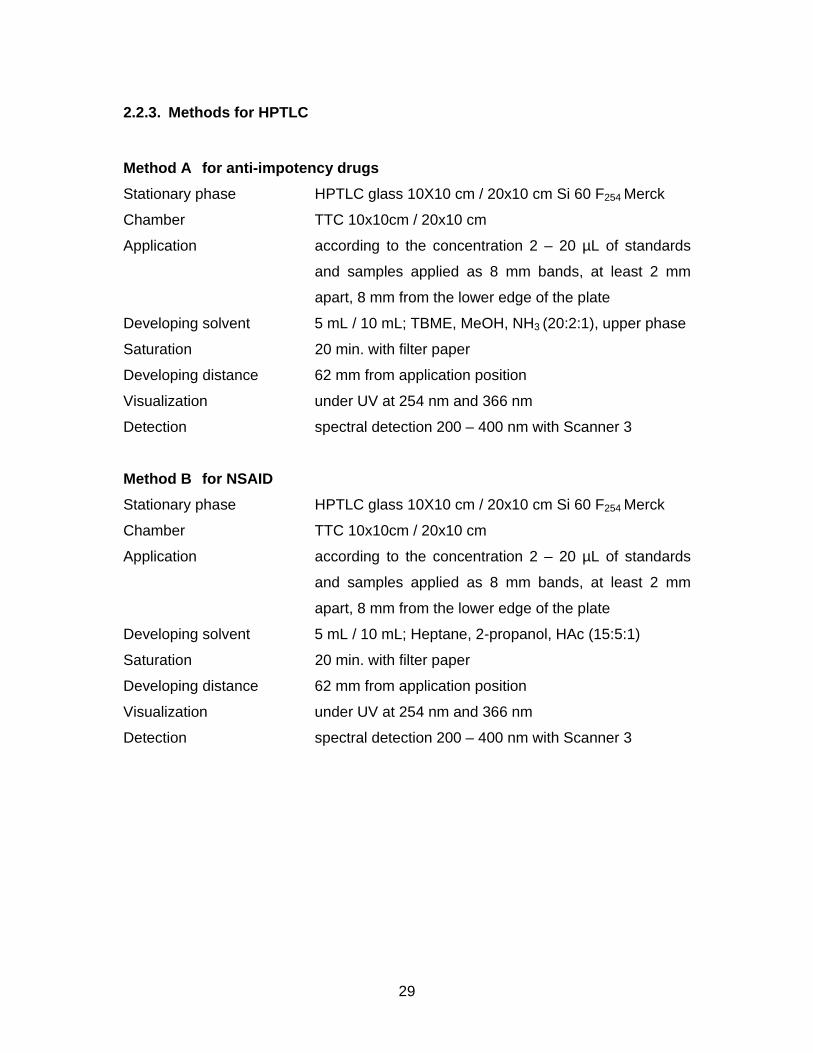
2.2.3. Methods for HPTLC
Method A for anti-impotency drugs Stationary phase HPTLC glass 10X10 cm / 20x10 cm Si 60 F254 Merck
Chamber TTC 10x10cm / 20x10 cm
Application according to the concentration 2 – 20 µL of standards
and samples applied as 8 mm bands, at least 2 mm
apart, 8 mm from the lower edge of the plate
Developing solvent 5 mL / 10 mL; TBME, MeOH, NH3 (20:2:1), upper phase
Saturation 20 min. with filter paper
Developing distance 62 mm from application position
Visualization under UV at 254 nm and 366 nm
Detection spectral detection 200 – 400 nm with Scanner 3
Method B for NSAID Stationary phase HPTLC glass 10X10 cm / 20x10 cm Si 60 F254 Merck
Chamber TTC 10x10cm / 20x10 cm
Application according to the concentration 2 – 20 µL of standards
and samples applied as 8 mm bands, at least 2 mm
apart, 8 mm from the lower edge of the plate
Developing solvent 5 mL / 10 mL; Heptane, 2-propanol, HAc (15:5:1)
Saturation 20 min. with filter paper
Developing distance 62 mm from application position
Visualization under UV at 254 nm and 366 nm
Detection spectral detection 200 – 400 nm with Scanner 3
30
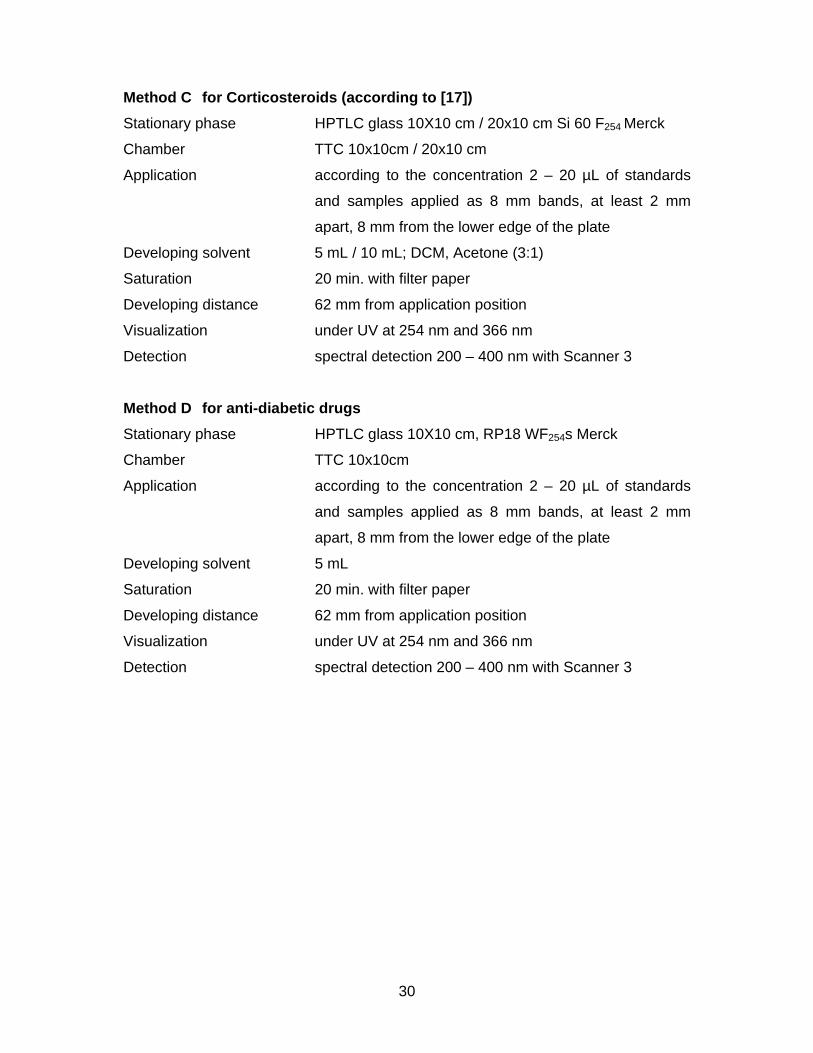
Method C for Corticosteroids (according to [17]) Stationary phase HPTLC glass 10X10 cm / 20x10 cm Si 60 F254 Merck
Chamber TTC 10x10cm / 20x10 cm
Application according to the concentration 2 – 20 µL of standards
and samples applied as 8 mm bands, at least 2 mm
apart, 8 mm from the lower edge of the plate
Developing solvent 5 mL / 10 mL; DCM, Acetone (3:1)
Saturation 20 min. with filter paper
Developing distance 62 mm from application position
Visualization under UV at 254 nm and 366 nm
Detection spectral detection 200 – 400 nm with Scanner 3
Method D for anti-diabetic drugs Stationary phase HPTLC glass 10X10 cm, RP18 WF254s Merck
Chamber TTC 10x10cm
Application according to the concentration 2 – 20 µL of standards
and samples applied as 8 mm bands, at least 2 mm
apart, 8 mm from the lower edge of the plate
Developing solvent 5 mL
Saturation 20 min. with filter paper
Developing distance 62 mm from application position
Visualization under UV at 254 nm and 366 nm
Detection spectral detection 200 – 400 nm with Scanner 3
31
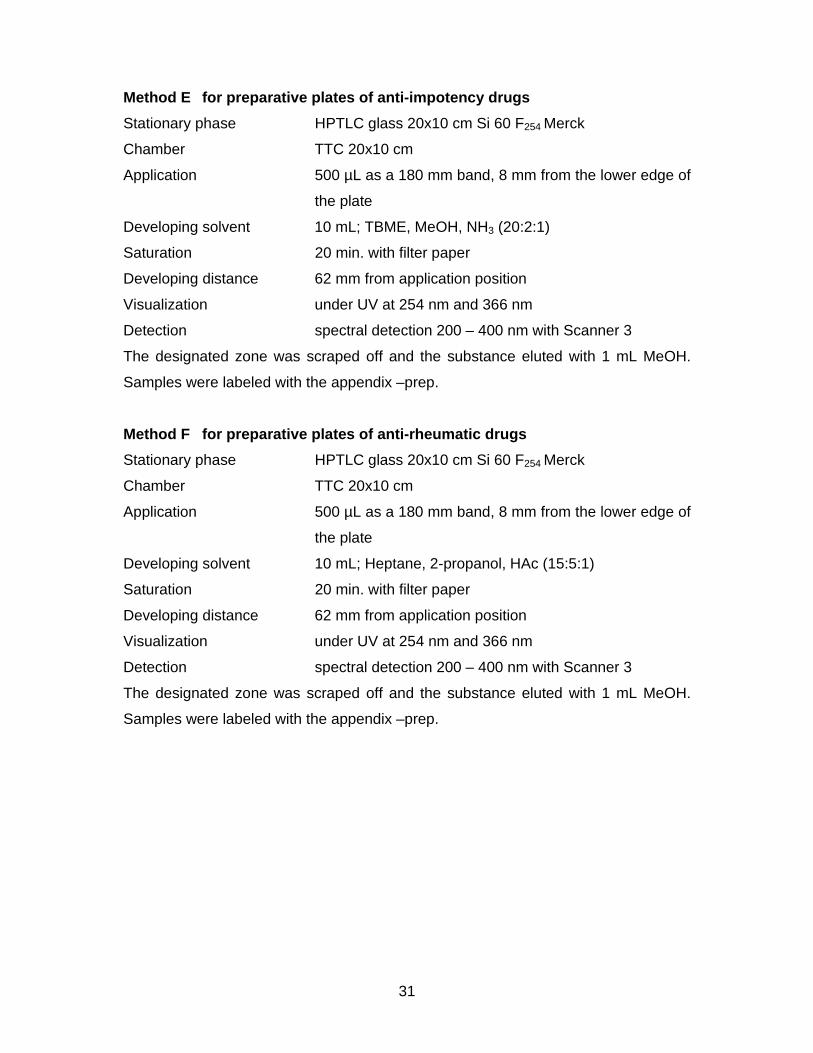
Method E for preparative plates of anti-impotency drugs Stationary phase HPTLC glass 20x10 cm Si 60 F254 Merck
Chamber TTC 20x10 cm
Application 500 µL as a 180 mm band, 8 mm from the lower edge of
the plate
Developing solvent 10 mL; TBME, MeOH, NH3 (20:2:1)
Saturation 20 min. with filter paper
Developing distance 62 mm from application position
Visualization under UV at 254 nm and 366 nm
Detection spectral detection 200 – 400 nm with Scanner 3
The designated zone was scraped off and the substance eluted with 1 mL MeOH.
Samples were labeled with the appendix –prep.
Method F for preparative plates of anti-rheumatic drugs Stationary phase HPTLC glass 20x10 cm Si 60 F254 Merck
Chamber TTC 20x10 cm
Application 500 µL as a 180 mm band, 8 mm from the lower edge of
the plate
Developing solvent 10 mL; Heptane, 2-propanol, HAc (15:5:1)
Saturation 20 min. with filter paper
Developing distance 62 mm from application position
Visualization under UV at 254 nm and 366 nm
Detection spectral detection 200 – 400 nm with Scanner 3
The designated zone was scraped off and the substance eluted with 1 mL MeOH.
Samples were labeled with the appendix –prep.
32
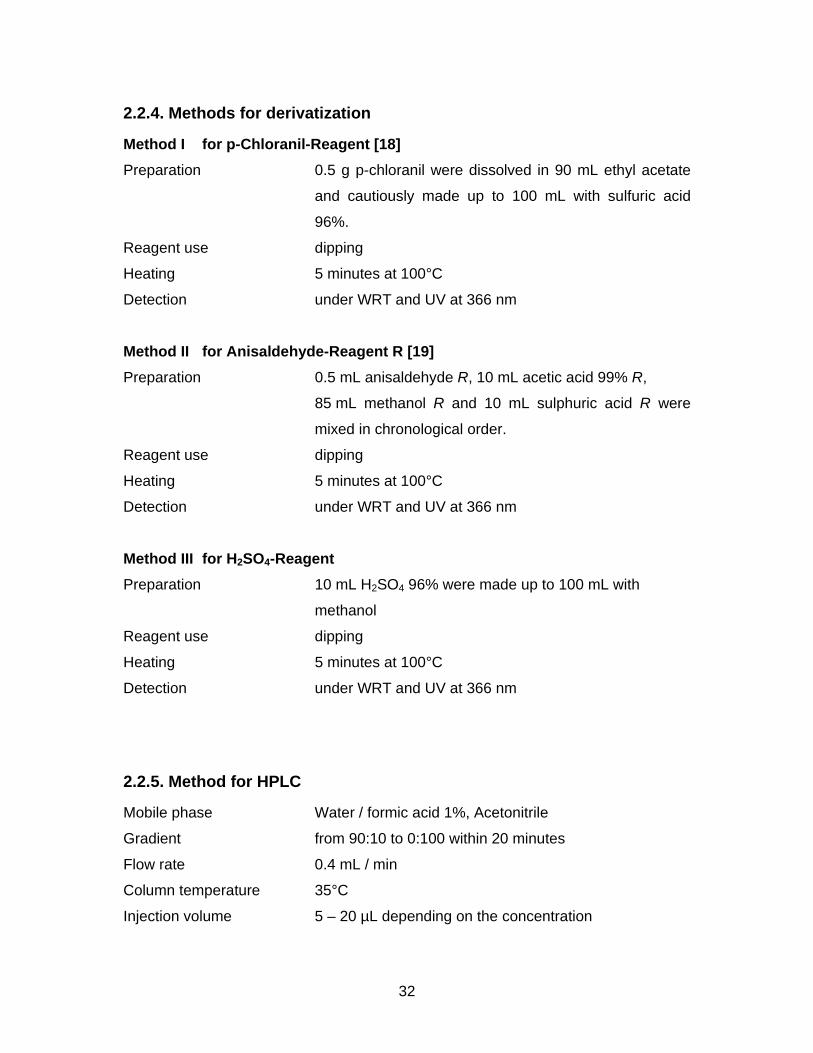
2.2.4. Methods for derivatization
Method I for p-Chloranil-Reagent [18] Preparation 0.5 g p-chloranil were dissolved in 90 mL ethyl acetate
and cautiously made up to 100 mL with sulfuric acid
96%.
Reagent use dipping
Heating 5 minutes at 100°C
Detection under WRT and UV at 366 nm
Method II for Anisaldehyde-Reagent R [19] Preparation 0.5 mL anisaldehyde R, 10 mL acetic acid 99% R,
85 mL methanol R and 10 mL sulphuric acid R were
mixed in chronological order.
Reagent use dipping
Heating 5 minutes at 100°C
Detection under WRT and UV at 366 nm
Method III for H2SO4-Reagent Preparation 10 mL H2SO4 96% were made up to 100 mL with
methanol
Reagent use dipping
Heating 5 minutes at 100°C
Detection under WRT and UV at 366 nm
2.2.5. Method for HPLC
Mobile phase Water / formic acid 1%, Acetonitrile
Gradient from 90:10 to 0:100 within 20 minutes
Flow rate 0.4 mL / min
Column temperature 35°C
Injection volume 5 – 20 µL depending on the concentration
33
3. Results and Discussion
3.1. Method optimization for anti-impotency drugs
3.1.1. Existing method and optimization
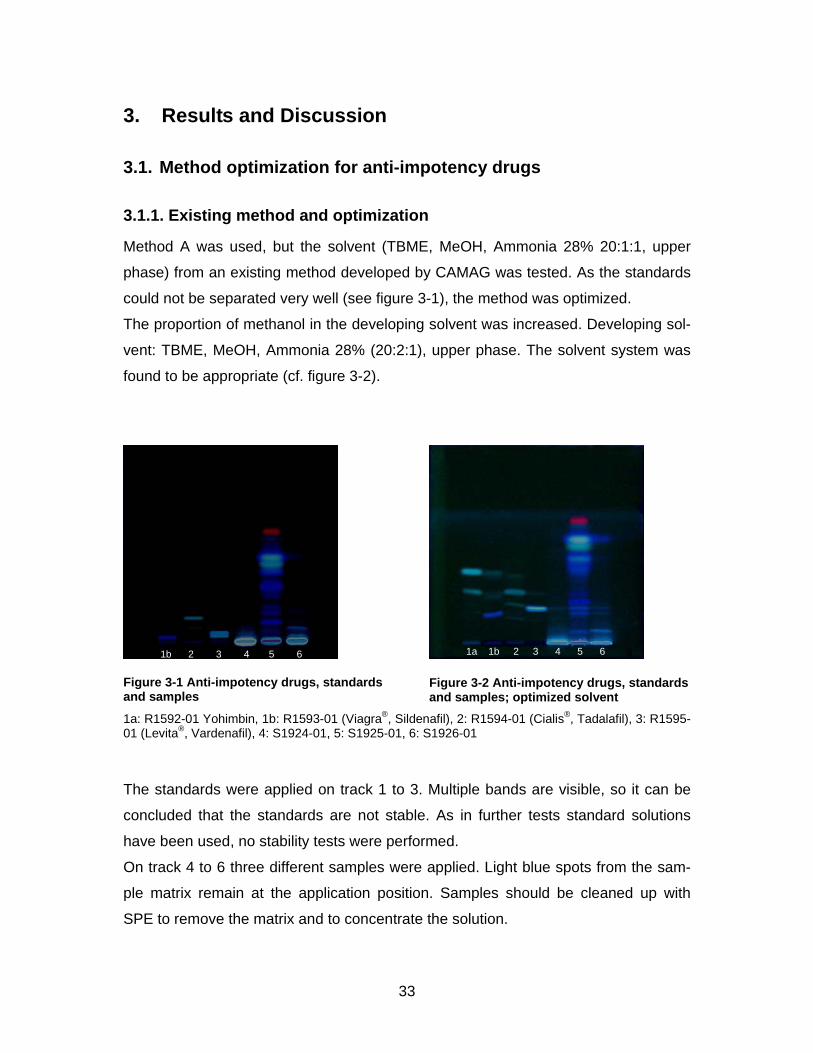
Method A was used, but the solvent (TBME, MeOH, Ammonia 28% 20:1:1, upper
phase) from an existing method developed by CAMAG was tested. As the standards
could not be separated very well (see figure 3-1), the method was optimized.
The proportion of methanol in the developing solvent was increased. Developing sol-
vent: TBME, MeOH, Ammonia 28% (20:2:1), upper phase. The solvent system was
found to be appropriate (cf. figure 3-2).
Figure 3-1 Anti-impotency drugs, standards and samples
Figure 3-2 Anti-impotency drugs, standards and samples; optimized solvent
1a: R1592-01 Yohimbin, 1b: R1593-01 (Viagra®, Sildenafil), 2: R1594-01 (Cialis®, Tadalafil), 3: R1595-01 (Levita®, Vardenafil), 4: S1924-01, 5: S1925-01, 6: S1926-01
The standards were applied on track 1 to 3. Multiple bands are visible, so it can be
concluded that the standards are not stable. As in further tests standard solutions
have been used, no stability tests were performed.
On track 4 to 6 three different samples were applied. Light blue spots from the sam-
ple matrix remain at the application position. Samples should be cleaned up with
SPE to remove the matrix and to concentrate the solution.
1b 2 3 4 5 6 1a 1b 2 3 4 5 6
34
3.1.2. Sample analysis
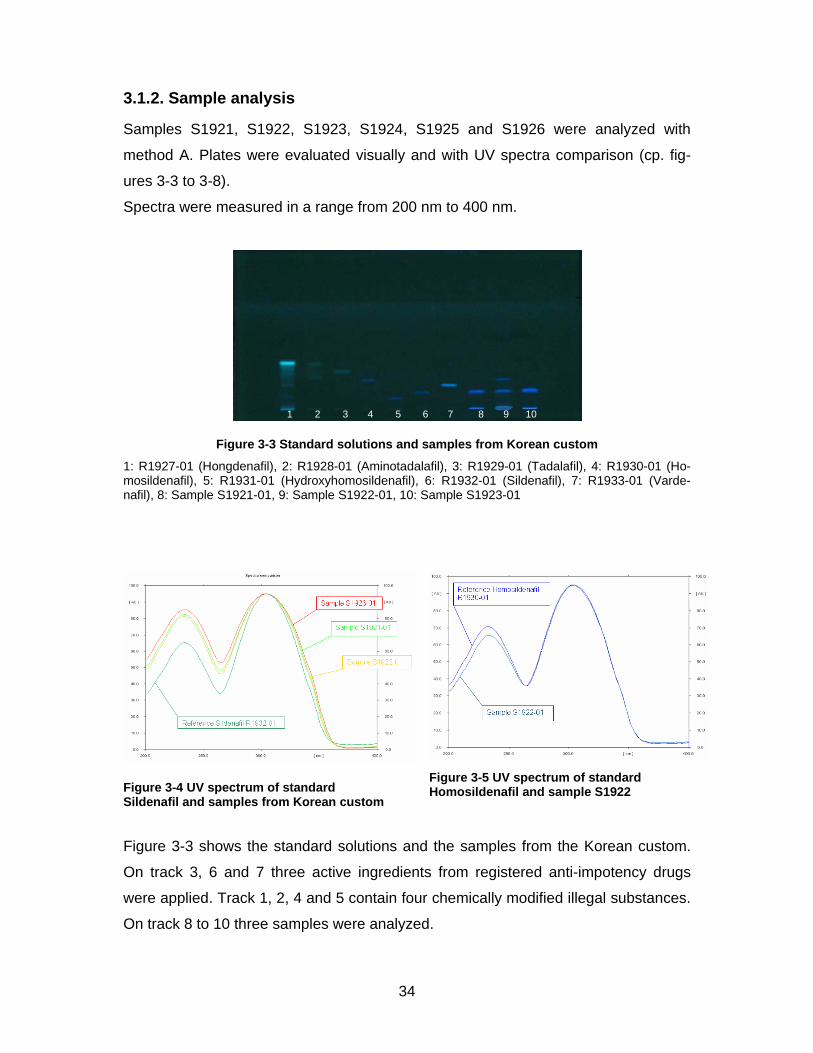
Samples S1921, S1922, S1923, S1924, S1925 and S1926 were analyzed with
method A. Plates were evaluated visually and with UV spectra comparison (cp. fig-
ures 3-3 to 3-8).
Spectra were measured in a range from 200 nm to 400 nm.
Figure 3-3 Standard solutions and samples from Korean custom
1: R1927-01 (Hongdenafil), 2: R1928-01 (Aminotadalafil), 3: R1929-01 (Tadalafil), 4: R1930-01 (Ho-mosildenafil), 5: R1931-01 (Hydroxyhomosildenafil), 6: R1932-01 (Sildenafil), 7: R1933-01 (Varde-nafil), 8: Sample S1921-01, 9: Sample S1922-01, 10: Sample S1923-01
Figure 3-4 UV spectrum of standard Sildenafil and samples from Korean custom
Figure 3-5 UV spectrum of standard Homosildenafil and sample S1922
Figure 3-3 shows the standard solutions and the samples from the Korean custom.
On track 3, 6 and 7 three active ingredients from registered anti-impotency drugs
were applied. Track 1, 2, 4 and 5 contain four chemically modified illegal substances.
On track 8 to 10 three samples were analyzed.
1 2 3 4 5 6 7 8 9 10
35
Standards R1927 Hongdenafil and R1928 Aminotadalfil are not stable in solution.
Two bands with the same UV spectrum appear.
Standard Sildenafil on track 6 appears at a RF value of 0.15. On tracks 8 to 10 on the
same height a bright blue band can be seen. All of these spots have the same UV
spectrum as the reference (cp. figure 3-4) and can therefore be identified as Silde-
nafil. Additionally sample S1922 on track 9 shows a band at the position of Homosil-
denafil. Spectra comparison (cf. figure 3-5) allows a reliable identification of the pres-
ence of Homosildenafil in the sample.
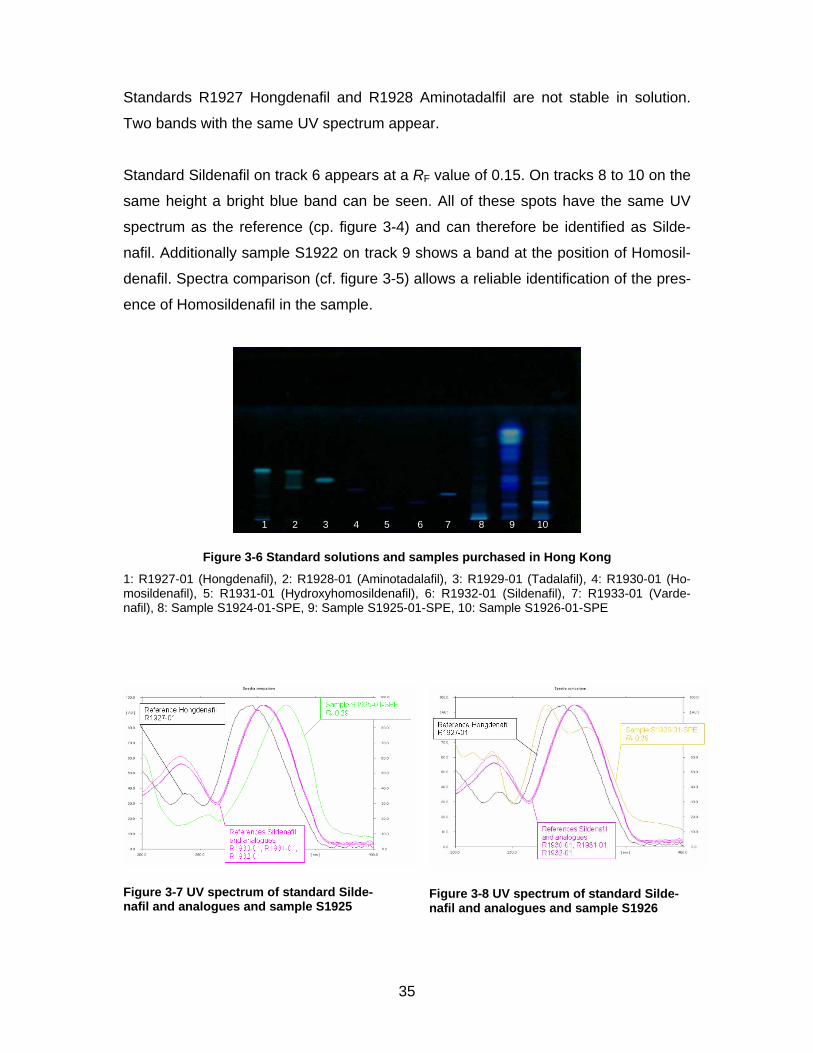
Figure 3-6 Standard solutions and samples purchased in Hong Kong
1: R1927-01 (Hongdenafil), 2: R1928-01 (Aminotadalafil), 3: R1929-01 (Tadalafil), 4: R1930-01 (Ho-mosildenafil), 5: R1931-01 (Hydroxyhomosildenafil), 6: R1932-01 (Sildenafil), 7: R1933-01 (Varde-nafil), 8: Sample S1924-01-SPE, 9: Sample S1925-01-SPE, 10: Sample S1926-01-SPE
Figure 3-7 UV spectrum of standard Silde-nafil and analogues and sample S1925
Figure 3-8 UV spectrum of standard Silde-nafil and analogues and sample S1926
1 2 3 4 5 6 7 8 9 10
36
Figure 3-6 shows the Standard solutions and samples purchased in Hong Kong.
Samples S1924, S1925 and S1926 were rather difficult to evaluate because of the
complex composition. The UV spectrum of each spot was compared to the spectra of
the reference substances. Zones with a similar spectrum were examined more
closely.
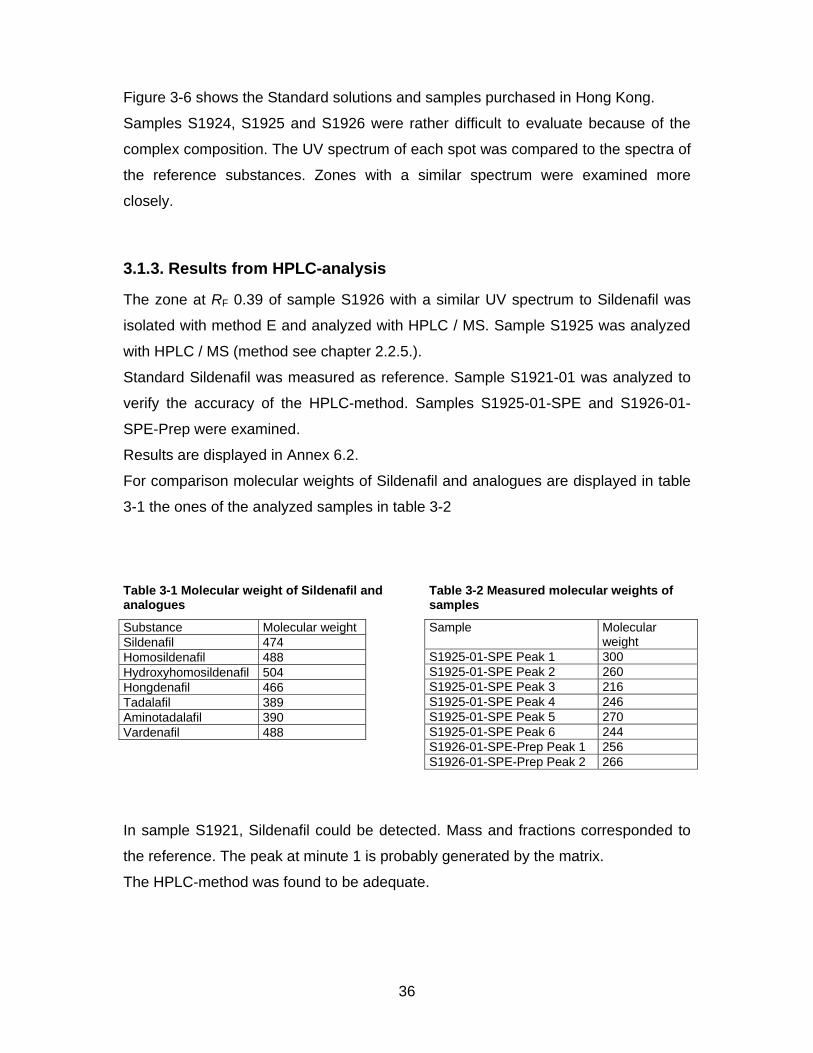
3.1.3. Results from HPLC-analysis
The zone at RF 0.39 of sample S1926 with a similar UV spectrum to Sildenafil was
isolated with method E and analyzed with HPLC / MS. Sample S1925 was analyzed
with HPLC / MS (method see chapter 2.2.5.).
Standard Sildenafil was measured as reference. Sample S1921-01 was analyzed to
verify the accuracy of the HPLC-method. Samples S1925-01-SPE and S1926-01-
SPE-Prep were examined.
Results are displayed in Annex 6.2.
For comparison molecular weights of Sildenafil and analogues are displayed in table
3-1 the ones of the analyzed samples in table 3-2
Table 3-1 Molecular weight of Sildenafil and analogues
Substance Molecular weight Sildenafil 474 Homosildenafil 488 Hydroxyhomosildenafil 504 Hongdenafil 466 Tadalafil 389 Aminotadalafil 390 Vardenafil 488
Table 3-2 Measured molecular weights of samples
Sample Molecular weight
S1925-01-SPE Peak 1 300 S1925-01-SPE Peak 2 260 S1925-01-SPE Peak 3 216 S1925-01-SPE Peak 4 246 S1925-01-SPE Peak 5 270 S1925-01-SPE Peak 6 244 S1926-01-SPE-Prep Peak 1 256 S1926-01-SPE-Prep Peak 2 266
In sample S1921, Sildenafil could be detected. Mass and fractions corresponded to
the reference. The peak at minute 1 is probably generated by the matrix.
The HPLC-method was found to be adequate.
37
In sample S1925-01-SPE no measured molecular weight corresponded to one of the
references. As detected masses are much lower than those of the references, a so
far unknown illegal analogue could be excluded.
In sample S1926-01-SPE-Prep two peaks could be detected with HPLC. Conse-
quently the sample was not as pure as presumed. The designated compound ap-
peared at minute 10.2. Its molecular weight is 256 which is not within the range of the
references. As in sample S1925, it is very unlikely, that the isolated substance is a
structure-modified anti-impotency substance.
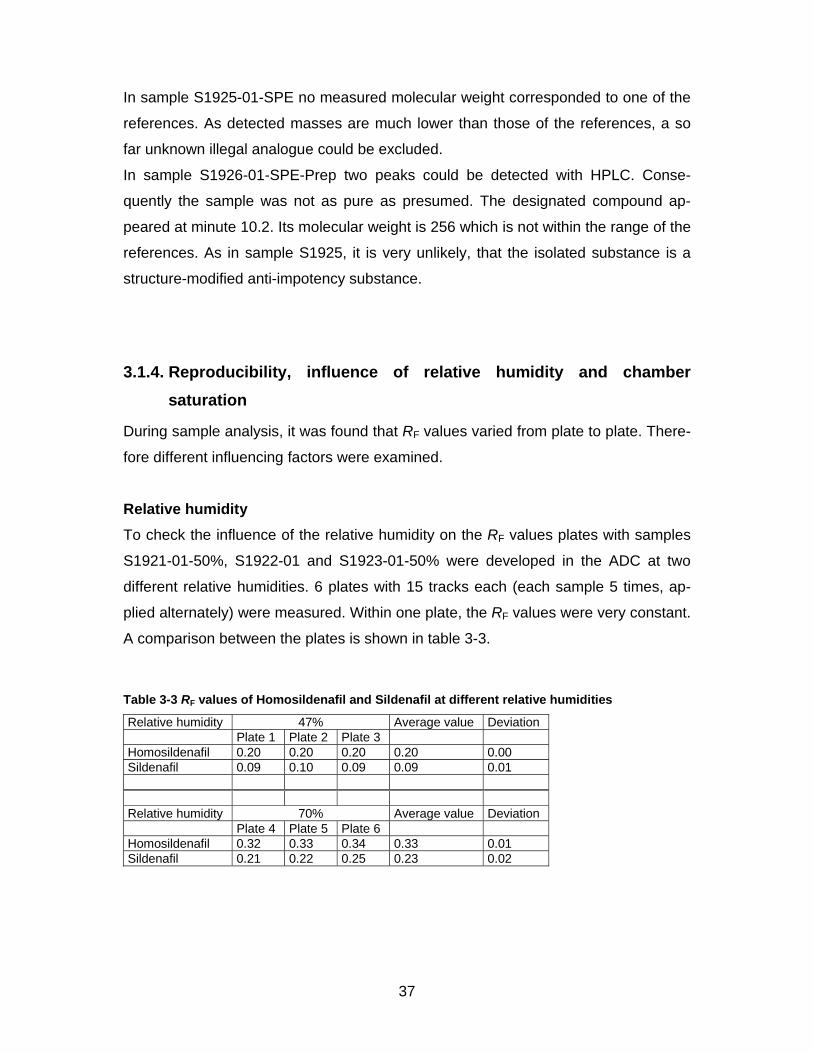
3.1.4. Reproducibility, influence of relative humidity and chamber saturation
During sample analysis, it was found that RF values varied from plate to plate. There-
fore different influencing factors were examined.
Relative humidity To check the influence of the relative humidity on the RF values plates with samples
S1921-01-50%, S1922-01 and S1923-01-50% were developed in the ADC at two
different relative humidities. 6 plates with 15 tracks each (each sample 5 times, ap-
plied alternately) were measured. Within one plate, the RF values were very constant.
A comparison between the plates is shown in table 3-3.
Table 3-3 RF values of Homosildenafil and Sildenafil at different relative humidities
Relative humidity 47% Average value Deviation Plate 1 Plate 2 Plate 3 Homosildenafil 0.20 0.20 0.20 0.20 0.00 Sildenafil 0.09 0.10 0.09 0.09 0.01 Relative humidity 70% Average value Deviation Plate 4 Plate 5 Plate 6 Homosildenafil 0.32 0.33 0.34 0.33 0.01 Sildenafil 0.21 0.22 0.25 0.23 0.02
38
RF values rose when relative humidity was increased. If the relative humidity was
controlled by ADC, RF values remained constant. The results at a humidity of 47%
were more stable than at a humidity of 70%. To ensure the reproducibility, relative
humidity should be kept constant.
Chamber saturation
Chambers were always saturated for 20 minutes. But as the highly volatile Ammonia
is in the solvent system, slight differences in plate handling might cause changes in
the gas phase and therefore influence chromatography. However systematic tests
were not performed. As RF values did not change on plates developed with the ADC,
the use of this device is recommendable.
39
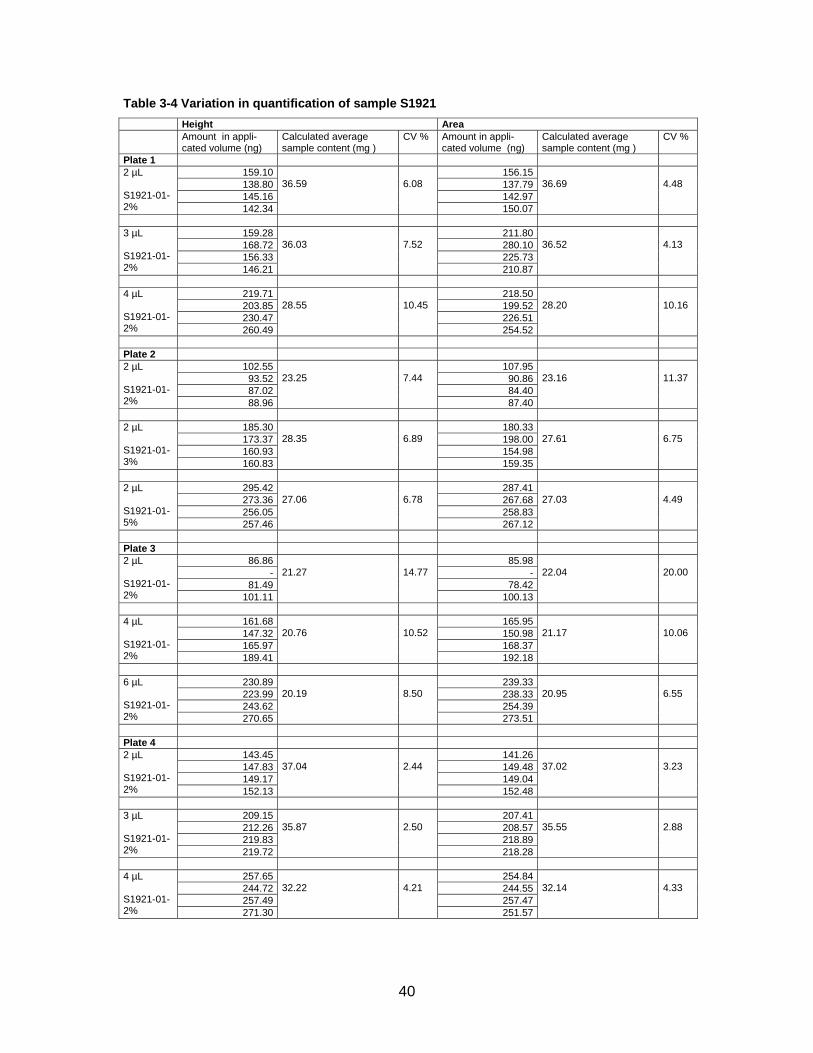
3.1.5. Quantification of Sildenafil
For the quantification of Sildenafil method A was used. Silica gel plates were pre-
washed with methanol.
From the UV spectrum of the compound the absorption maximum was determined at
wavelength 300 nm. Thus quantification test were performed at that wavelength.
The results were not reproducible. Measurements varied within one plate and be-
tween different plates. Test with different application modes did not improve the
situation. Results are displayed in tables 3-4 and 3-5 and figure 3-9.
On plate 1 different volumes were applied blockwise. On plates 2 to 4 different vol-
umes and concentrations respectively were distributed over the plate to minimize the
influence of varieties in between one plate. On plate 2 the same volume of different
concentrations was applied. On plate 4 syringe was filled twice before application to
prevent a dilution of the sample with the rinsing solution.
On plates 2 to 4 amounts tend to increase from one edge of the plate to the other.
Furthermore amounts calculated over height and over area vary slightly. This is also
visible on the displayed calibration curve on figure 3-9.
It is remarkable, that measured amounts decrease with increasing application vol-
ume.
If outliers are removed, fluctuations are slightly reduced but variations between plates
persist.
Variations between different plates are shown in table 3-5. No regular pattern is ob-
servable. Values do not decrease or augment with the time.
40
Table 3-4 Variation in quantification of sample S1921 Height Area Amount in appli-
cated volume (ng) Calculated average sample content (mg )
CV % Amount in appli-cated volume (ng)
Calculated average sample content (mg )
CV %
Plate 1 159.10 156.15138.80 137.79145.16 142.97
2 µL S1921-01-2% 142.34
36.59
6.08
150.07
36.69
4.48
159.28 211.80168.72 280.10156.33 225.73
3 µL S1921-01-2% 146.21
36.03
7.52
210.87
36.52
4.13
219.71 218.50203.85 199.52230.47 226.51
4 µL S1921-01-2% 260.49
28.55
10.45
254.52
28.20
10.16
Plate 2
102.55 107.9593.52 90.8687.02 84.40
2 µL S1921-01-2% 88.96
23.25
7.44
87.40
23.16
11.37
185.30 180.33173.37 198.00160.93 154.98
2 µL S1921-01-3% 160.83
28.35
6.89
159.35
27.61
6.75
295.42 287.41273.36 267.68256.05 258.83
2 µL S1921-01-5% 257.46
27.06
6.78
267.12
27.03
4.49
Plate 3
86.86 85.98- -
81.49 78.42
2 µL S1921-01-2% 101.11
21.27
14.77
100.13
22.04
20.00
161.68 165.95147.32 150.98165.97 168.37
4 µL S1921-01-2% 189.41
20.76
10.52
192.18
21.17
10.06
230.89 239.33223.99 238.33243.62 254.39
6 µL S1921-01-2% 270.65
20.19
8.50
273.51
20.95
6.55
Plate 4
143.45 141.26147.83 149.48149.17 149.04
2 µL S1921-01-2% 152.13
37.04
2.44
152.48
37.02
3.23
209.15 207.41212.26 208.57219.83 218.89
3 µL S1921-01-2% 219.72
35.87
2.50
218.28
35.55
2.88
257.65 254.84244.72 244.55257.49 257.47
4 µL S1921-01-2% 271.30
32.22
4.21
251.57
32.14
4.33
41
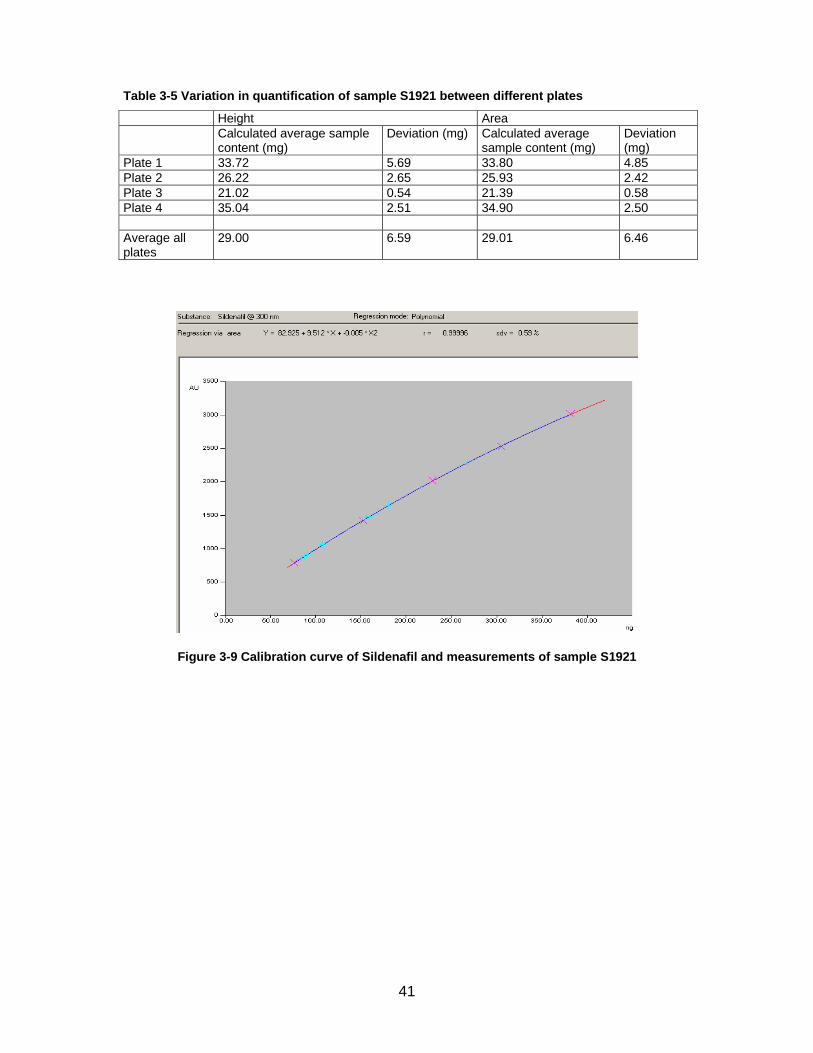
Table 3-5 Variation in quantification of sample S1921 between different plates
Height Area Calculated average sample
content (mg) Deviation (mg) Calculated average
sample content (mg) Deviation (mg)
Plate 1 33.72 5.69 33.80 4.85 Plate 2 26.22 2.65 25.93 2.42 Plate 3 21.02 0.54 21.39 0.58 Plate 4 35.04 2.51 34.90 2.50 Average all plates
29.00 6.59 29.01 6.46
Figure 3-9 Calibration curve of Sildenafil and measurements of sample S1921
42
3.1.6. Discussion
The solvent system TBME, MeOH, Ammonia (20:2:1) was found to yield best separa-
tion (method A). To ensure unchanging RF values, influencing factors such as cham-
ber saturation, relative humidity and temperature should be kept constant.
In samples S1921, S1922 and S1923 the presence of Sildenafil and Homosildenafil
respectively, could be proven.
In sample S1924 no synthetic adulterant could be detected. The complexity of sam-
ples S1925 and S1926 made the evaluation difficult. Zones with UV spectra similar to
known compounds were analyzed with HPLC/MS. No indications for the presence of
Sildenafil or analogues could be found.
The quantification of Sildenafil and Homosildenafil proved to be difficult. Problems
with high variations within one plate and between different plates could not be solved.
However it is conceivable, that the instable reference solution may have contributed
to the varying results. Quantifications should be performed with reference substance
in solid state.
43
3.2. Method development for anti-rheumatic drugs
For separation of non-steroidal anti-inflammatory drugs (NSAIDs) various methods
are described in literature, but none of them allows the simultaneous detection of dif-
ferent types of anti-rheumatic drugs (mainly NSAIDs and corticosteroids).
3.2.1. Existing methods
Different solvent systems described in literature were tested.
1) Tol, MeOH, NH3 (15:5:0.05) [20]
2) Cyclohexane, CHCl3, HAc (10:1:1) [21]
3) Tol, Acetone (8:2) (CAMAG method for analgetics)
4) DCM, EtOAc, Cyclohexane, 2-propanol, HCl, HFo (9:8:1.5:0.2:0.2)[22]
5) DCM, EtOAc, EtOH, HFo (3.5:2:4:0.5) [23]
6) EtOAc, MeOH, NH3 (8.5:1.5:0.5) [24]
Results are shown in table 3-6.
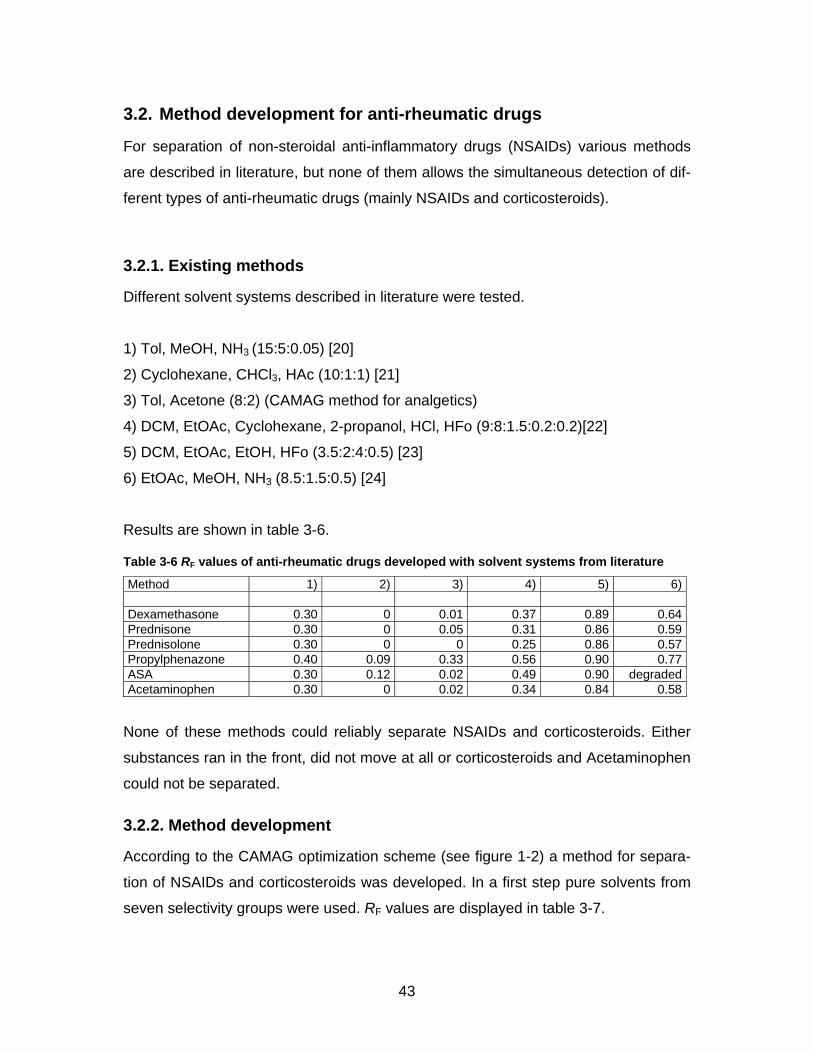
Table 3-6 RF values of anti-rheumatic drugs developed with solvent systems from literature
Method 1) 2) 3) 4) 5) 6) Dexamethasone 0.30 0 0.01 0.37 0.89 0.64Prednisone 0.30 0 0.05 0.31 0.86 0.59Prednisolone 0.30 0 0 0.25 0.86 0.57Propylphenazone 0.40 0.09 0.33 0.56 0.90 0.77ASA 0.30 0.12 0.02 0.49 0.90 degradedAcetaminophen 0.30 0 0.02 0.34 0.84 0.58
None of these methods could reliably separate NSAIDs and corticosteroids. Either
substances ran in the front, did not move at all or corticosteroids and Acetaminophen
could not be separated.
3.2.2. Method development
According to the CAMAG optimization scheme (see figure 1-2) a method for separa-
tion of NSAIDs and corticosteroids was developed. In a first step pure solvents from
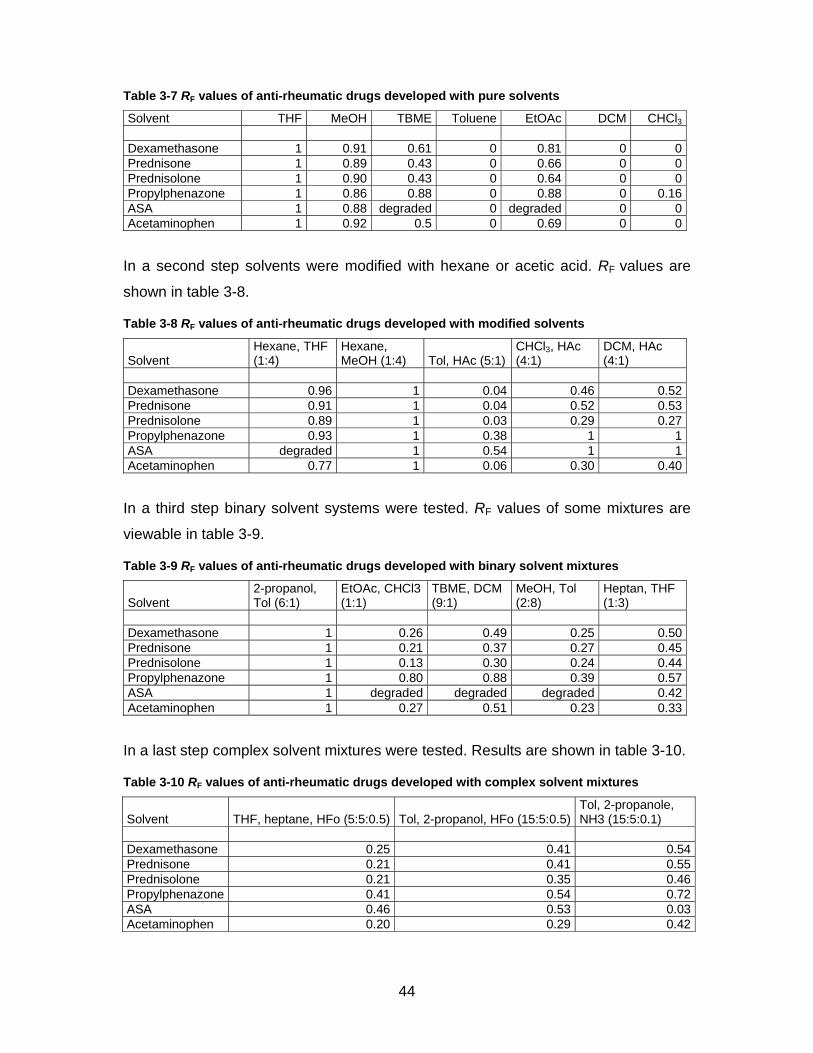
seven selectivity groups were used. RF values are displayed in table 3-7.
44
Table 3-7 RF values of anti-rheumatic drugs developed with pure solvents
Solvent THF MeOH TBME Toluene EtOAc DCM CHCl3 Dexamethasone 1 0.91 0.61 0 0.81 0 0Prednisone 1 0.89 0.43 0 0.66 0 0Prednisolone 1 0.90 0.43 0 0.64 0 0Propylphenazone 1 0.86 0.88 0 0.88 0 0.16ASA 1 0.88 degraded 0 degraded 0 0Acetaminophen 1 0.92 0.5 0 0.69 0 0
In a second step solvents were modified with hexane or acetic acid. RF values are
shown in table 3-8.
Table 3-8 RF values of anti-rheumatic drugs developed with modified solvents
Solvent Hexane, THF (1:4)
Hexane, MeOH (1:4) Tol, HAc (5:1)
CHCl3, HAc (4:1)
DCM, HAc (4:1)
Dexamethasone 0.96 1 0.04 0.46 0.52Prednisone 0.91 1 0.04 0.52 0.53Prednisolone 0.89 1 0.03 0.29 0.27Propylphenazone 0.93 1 0.38 1 1ASA degraded 1 0.54 1 1Acetaminophen 0.77 1 0.06 0.30 0.40
In a third step binary solvent systems were tested. RF values of some mixtures are
viewable in table 3-9.
Table 3-9 RF values of anti-rheumatic drugs developed with binary solvent mixtures
Solvent 2-propanol, Tol (6:1)
EtOAc, CHCl3 (1:1)
TBME, DCM (9:1)
MeOH, Tol (2:8)
Heptan, THF (1:3)
Dexamethasone 1 0.26 0.49 0.25 0.50Prednisone 1 0.21 0.37 0.27 0.45Prednisolone 1 0.13 0.30 0.24 0.44Propylphenazone 1 0.80 0.88 0.39 0.57ASA 1 degraded degraded degraded 0.42Acetaminophen 1 0.27 0.51 0.23 0.33
In a last step complex solvent mixtures were tested. Results are shown in table 3-10.
Table 3-10 RF values of anti-rheumatic drugs developed with complex solvent mixtures
Solvent THF, heptane, HFo (5:5:0.5) Tol, 2-propanol, HFo (15:5:0.5) Tol, 2-propanole, NH3 (15:5:0.1)
Dexamethasone 0.25 0.41 0.54Prednisone 0.21 0.41 0.55Prednisolone 0.21 0.35 0.46Propylphenazone 0.41 0.54 0.72ASA 0.46 0.53 0.03Acetaminophen 0.20 0.29 0.42
45
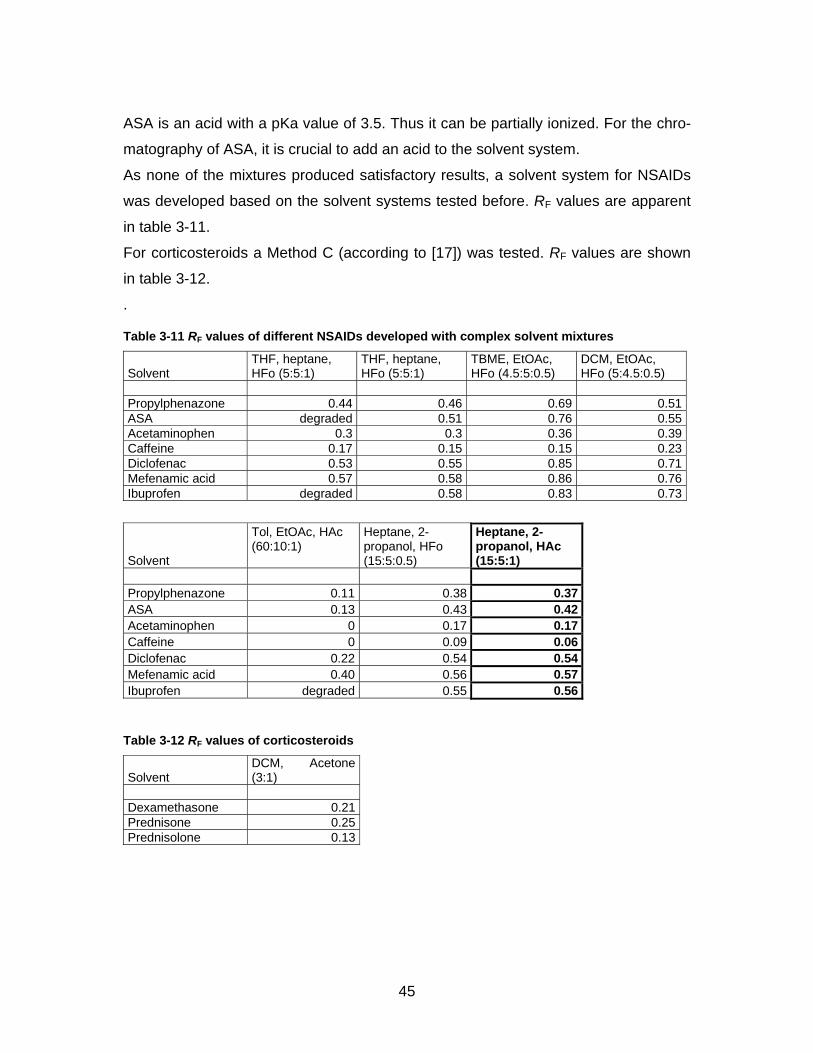
ASA is an acid with a pKa value of 3.5. Thus it can be partially ionized. For the chro-
matography of ASA, it is crucial to add an acid to the solvent system.
As none of the mixtures produced satisfactory results, a solvent system for NSAIDs
was developed based on the solvent systems tested before. RF values are apparent
in table 3-11.
For corticosteroids a Method C (according to [17]) was tested. RF values are shown
in table 3-12.
.
Table 3-11 RF values of different NSAIDs developed with complex solvent mixtures
Solvent THF, heptane, HFo (5:5:1)
THF, heptane, HFo (5:5:1)
TBME, EtOAc, HFo (4.5:5:0.5)
DCM, EtOAc, HFo (5:4.5:0.5)
Propylphenazone 0.44 0.46 0.69 0.51ASA degraded 0.51 0.76 0.55Acetaminophen 0.3 0.3 0.36 0.39Caffeine 0.17 0.15 0.15 0.23Diclofenac 0.53 0.55 0.85 0.71Mefenamic acid 0.57 0.58 0.86 0.76Ibuprofen degraded 0.58 0.83 0.73
Solvent
Tol, EtOAc, HAc (60:10:1)
Heptane, 2-propanol, HFo (15:5:0.5)
Heptane, 2-propanol, HAc (15:5:1)
Propylphenazone 0.11 0.38 0.37 ASA 0.13 0.43 0.42 Acetaminophen 0 0.17 0.17 Caffeine 0 0.09 0.06 Diclofenac 0.22 0.54 0.54 Mefenamic acid 0.40 0.56 0.57 Ibuprofen degraded 0.55 0.56
Table 3-12 RF values of corticosteroids
Solvent DCM, Acetone (3:1)
Dexamethasone 0.21Prednisone 0.25Prednisolone 0.13
46
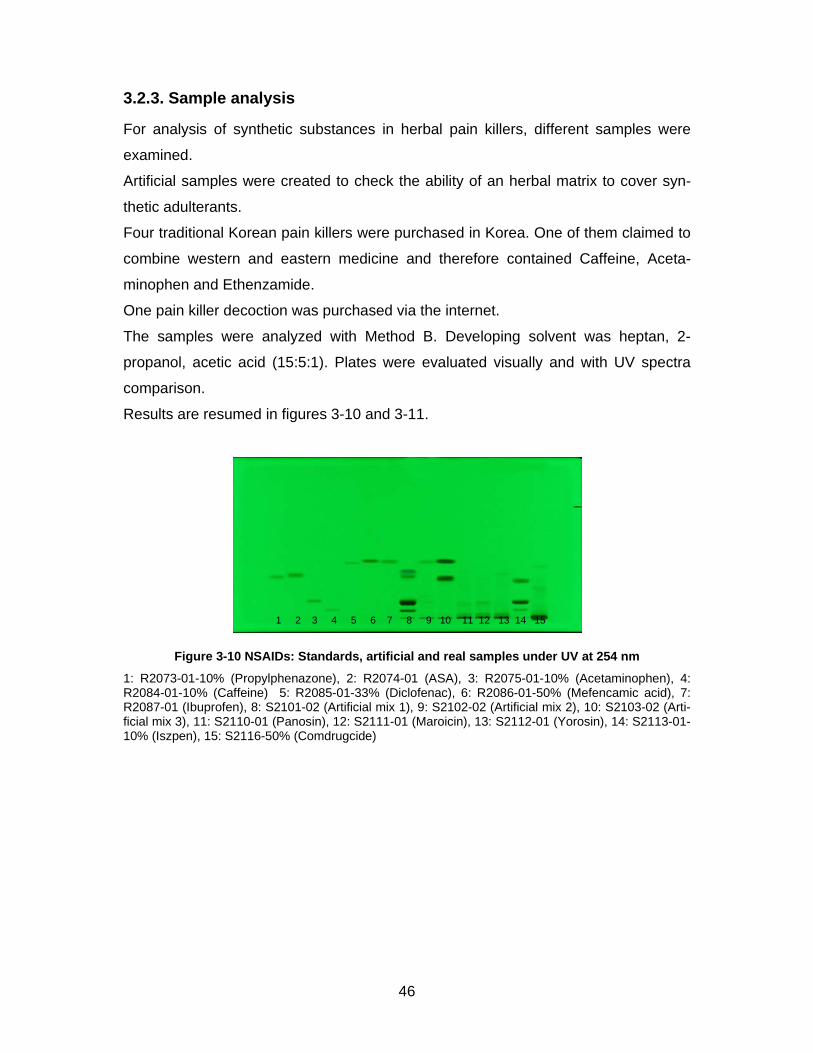
3.2.3. Sample analysis
For analysis of synthetic substances in herbal pain killers, different samples were
examined.
Artificial samples were created to check the ability of an herbal matrix to cover syn-
thetic adulterants.
Four traditional Korean pain killers were purchased in Korea. One of them claimed to
combine western and eastern medicine and therefore contained Caffeine, Aceta-
minophen and Ethenzamide.
One pain killer decoction was purchased via the internet.
The samples were analyzed with Method B. Developing solvent was heptan, 2-
propanol, acetic acid (15:5:1). Plates were evaluated visually and with UV spectra
comparison.
Results are resumed in figures 3-10 and 3-11.
Figure 3-10 NSAIDs: Standards, artificial and real samples under UV at 254 nm
1: R2073-01-10% (Propylphenazone), 2: R2074-01 (ASA), 3: R2075-01-10% (Acetaminophen), 4: R2084-01-10% (Caffeine) 5: R2085-01-33% (Diclofenac), 6: R2086-01-50% (Mefencamic acid), 7: R2087-01 (Ibuprofen), 8: S2101-02 (Artificial mix 1), 9: S2102-02 (Artificial mix 2), 10: S2103-02 (Arti-ficial mix 3), 11: S2110-01 (Panosin), 12: S2111-01 (Maroicin), 13: S2112-01 (Yorosin), 14: S2113-01-10% (Iszpen), 15: S2116-50% (Comdrugcide)
1 2 3 4 5 6 7 8 9 10 11 12 13 14 15
47
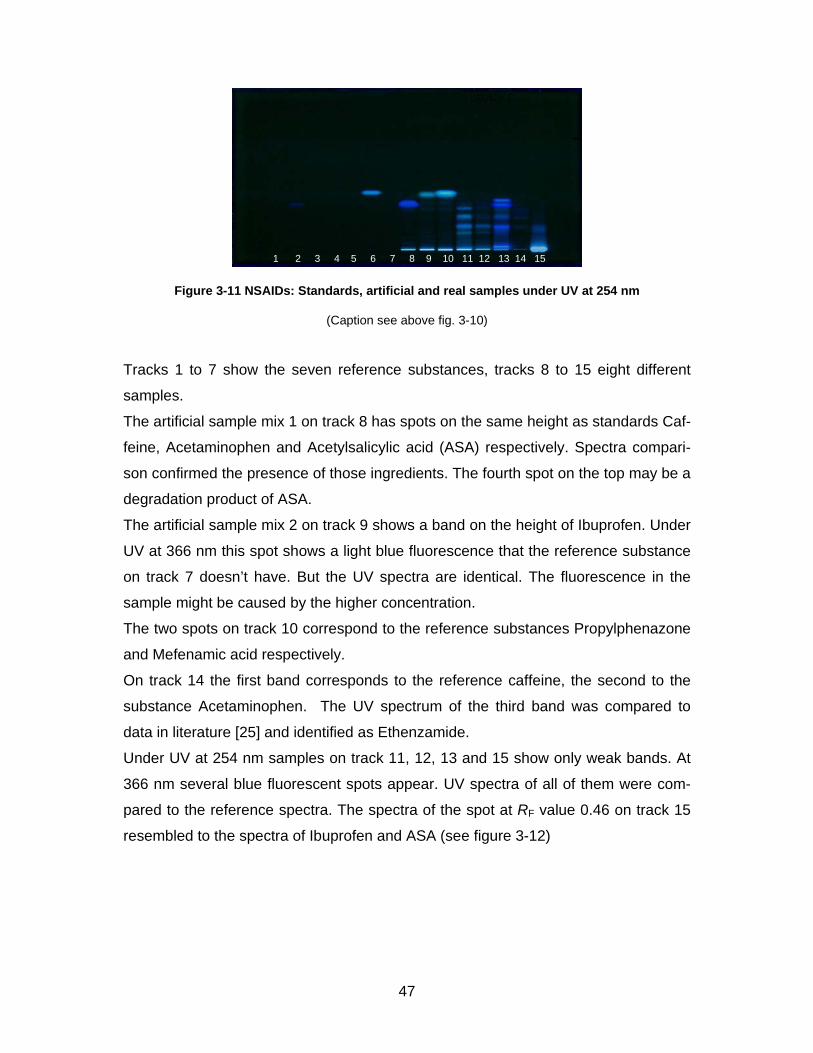
Figure 3-11 NSAIDs: Standards, artificial and real samples under UV at 254 nm
(Caption see above fig. 3-10)
Tracks 1 to 7 show the seven reference substances, tracks 8 to 15 eight different
samples.
The artificial sample mix 1 on track 8 has spots on the same height as standards Caf-
feine, Acetaminophen and Acetylsalicylic acid (ASA) respectively. Spectra compari-
son confirmed the presence of those ingredients. The fourth spot on the top may be a
degradation product of ASA.
The artificial sample mix 2 on track 9 shows a band on the height of Ibuprofen. Under
UV at 366 nm this spot shows a light blue fluorescence that the reference substance
on track 7 doesn’t have. But the UV spectra are identical. The fluorescence in the
sample might be caused by the higher concentration.
The two spots on track 10 correspond to the reference substances Propylphenazone
and Mefenamic acid respectively.
On track 14 the first band corresponds to the reference caffeine, the second to the
substance Acetaminophen. The UV spectrum of the third band was compared to
data in literature [25] and identified as Ethenzamide.
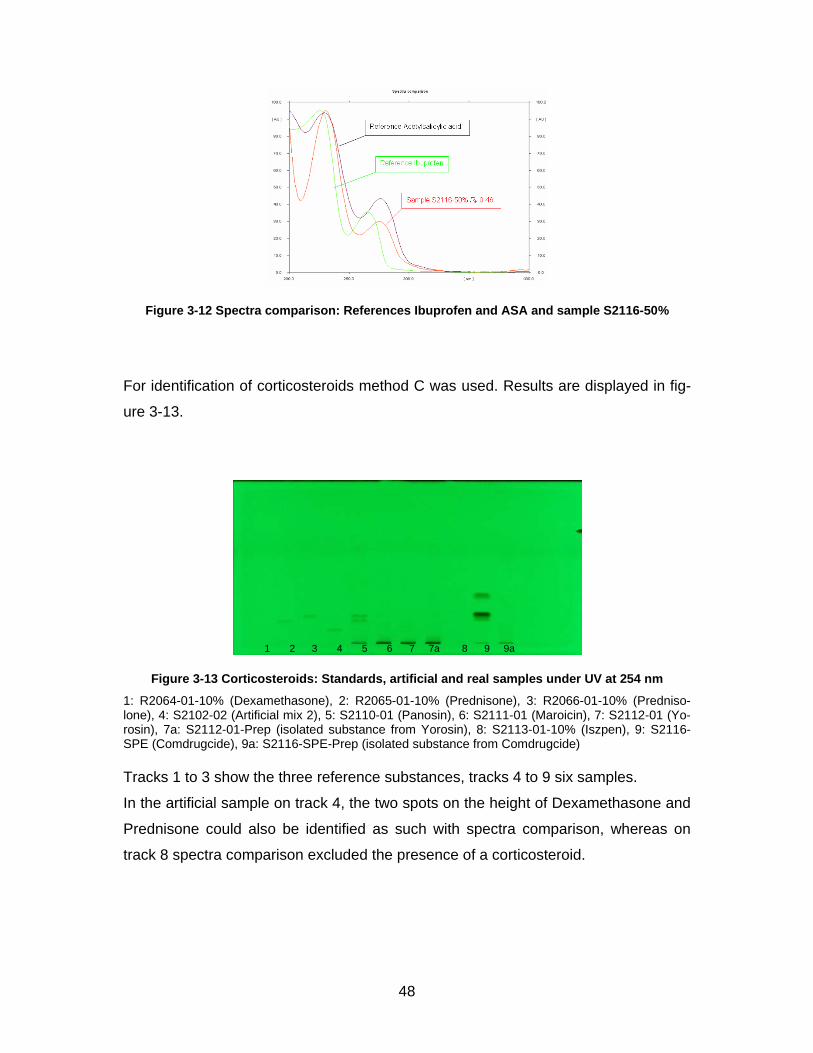
Under UV at 254 nm samples on track 11, 12, 13 and 15 show only weak bands. At
366 nm several blue fluorescent spots appear. UV spectra of all of them were com-
pared to the reference spectra. The spectra of the spot at RF value 0.46 on track 15
resembled to the spectra of Ibuprofen and ASA (see figure 3-12)
1 2 3 4 5 6 7 8 9 10 11 12 13 14 15
48
Figure 3-12 Spectra comparison: References Ibuprofen and ASA and sample S2116-50%
For identification of corticosteroids method C was used. Results are displayed in fig-
ure 3-13.
Figure 3-13 Corticosteroids: Standards, artificial and real samples under UV at 254 nm
1: R2064-01-10% (Dexamethasone), 2: R2065-01-10% (Prednisone), 3: R2066-01-10% (Predniso-lone), 4: S2102-02 (Artificial mix 2), 5: S2110-01 (Panosin), 6: S2111-01 (Maroicin), 7: S2112-01 (Yo-rosin), 7a: S2112-01-Prep (isolated substance from Yorosin), 8: S2113-01-10% (Iszpen), 9: S2116-SPE (Comdrugcide), 9a: S2116-SPE-Prep (isolated substance from Comdrugcide) Tracks 1 to 3 show the three reference substances, tracks 4 to 9 six samples.
In the artificial sample on track 4, the two spots on the height of Dexamethasone and
Prednisone could also be identified as such with spectra comparison, whereas on
track 8 spectra comparison excluded the presence of a corticosteroid.
1 2 3 4 5 6 7 7a 8 9 9a
49
3.2.4. Results from NMR-, MS- and IR-analysis
The substance in sample S2116 Comdrugcide pain decoction, which had a UV spec-
trum similar to the reference substance, was isolated with Method F (see chapter
2.2.3.). An NMR-, MS- and IR-spectrum was taken.
Results are displayed in Annex 6.3. to 6.5.
The structure could not completely be identified, as it was not possible to isolate the
required amount in an adequate purity for C-NMR analysis. However it seems to be
clear that a COOH-group is present (cp. NMR-spectrum). The peak at wavenumber
1559 in the IR-spectrum indicates the existence of a nitro-group. The measured mo-
lecular mass of 337.1 seems to be rather high for the suspected NSAIDs, which nor-
mally range between 200 and 300 g/mol. Tenoxicam, an anti-rheumatic drug, has a
molecular weight of 337.4. After comparison with chemo-physical data in literature,
this substance could be excluded. Newer NSAIDs, so known COX2-Inhibitors, tend
to have a higher molecular weight (from 314 g/mol). But it is very unlikely that the
isolated compound belongs to this group, as these drugs have only been on the mar-
ket for a short time.
50
3.2.5. Discussion
For separation of NSAIDs solvent mixture heptane, 2-propanol, HAc (15:5:1) showed
best results. Visualization was made under UV at 254 nm and 366 nm. Under UV at
366 nm Mefenamic acid shows a bright blue fluorescence and can therefore be dis-
tinguished from Ibuprofen and Diclofenac which have a similar RF value.
It was found that ASA is instable in solution. Solutions should not be stored longer
than a week.
For separation of corticosteroids the method from literature showed satisfactory re-
sults. Detection was performed under UV at 254 nm.
The synthetic active ingredients in the artificial mixes (samples S2101 to S2103)
could be detected visually and with spectra comparison.
In sample S2101 ASA had been partially degraded and a second spot was visible
just above the original spot.
In the Korean samples claimed to be purely herbal (samples S2110 to S2112), no
synthetic adulterant could be found.
In the Korean sample declared to contain Ethenzamide, Acetaminophen and Caf-
feine (sample S2113) the active ingredients could be detected. For the lack of the
reference substance Ethenzamide, identification was achieved by spectra compari-
son with data from literature [25].
The sample S2116 purchased via internet showed a band with a UV spectrum re-
sembling to that of Ibuprofen to a certain extent. Despite further analytical investiga-
tions, the structure could not be determined.
For separation of corticosteroids solvent system from literature showed good results.
In the artificial mix 2, the added active ingredients could be detected visually and with
spectra comparison. In sample S2113 on track 8 and S2116 on track 9, the spots at
height of Dexamethasone and Prednisone respectively showed a different UV spec-
trum. None of the real sample contained corticosteroids.
51
3.3. Method development for anti-diabetic drugs
3.3.1. Existing method
An existing method for separation of different oral anti-diabetic drugs described in
literature was tested [26]. Developing solvent was phosphate buffer pH6 R2, 2-
propanol (1:1), as stationary phase an RP18 glass plate was used.
The separation of Metformin and Glibenclamide was successful, but Metformin
showed tailing.
3.3.2. Method optimization
3.3.2.1. Developing solvent
To decrease tailing of Metformin, phosphate buffer was substituted for water and
HAc. Because of the increased proportion of water, RP18W glass plates were used
as stationary phase. The RF values of the two solvent systems are compared in table
3-13.
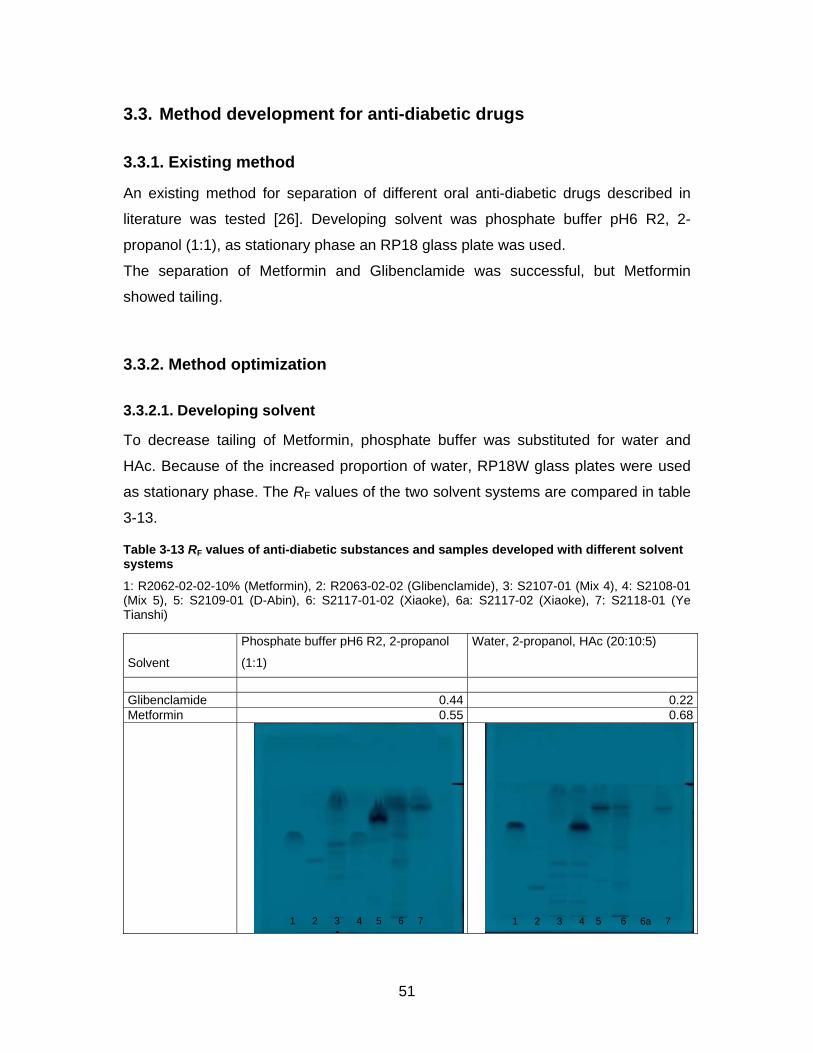
Table 3-13 RF values of anti-diabetic substances and samples developed with different solvent systems
1: R2062-02-02-10% (Metformin), 2: R2063-02-02 (Glibenclamide), 3: S2107-01 (Mix 4), 4: S2108-01 (Mix 5), 5: S2109-01 (D-Abin), 6: S2117-01-02 (Xiaoke), 6a: S2117-02 (Xiaoke), 7: S2118-01 (Ye Tianshi)
Solvent
Phosphate buffer pH6 R2, 2-propanol
(1:1)
Water, 2-propanol, HAc (20:10:5)
Glibenclamide 0.44 0.22Metformin 0.55 0.68
1 2 3 4 5 6 7 1 2 3 4 5 6 6a 7
52
Acetic acid in the developing solvent sharpens bands and increases separation of
Metformin and Glibenclamide. Further tests were performed with water, 2-propanol,
HAc (20:10:5) as solvent system and RP18W glass plates as stationary phase (cp.
method D, chapter 2.2.3.)
3.3.2.2. Derivatization reagent
To stain oral anti-diabetic substances, different derivatization reagents were tested.
Results are listed below in table 3-14.
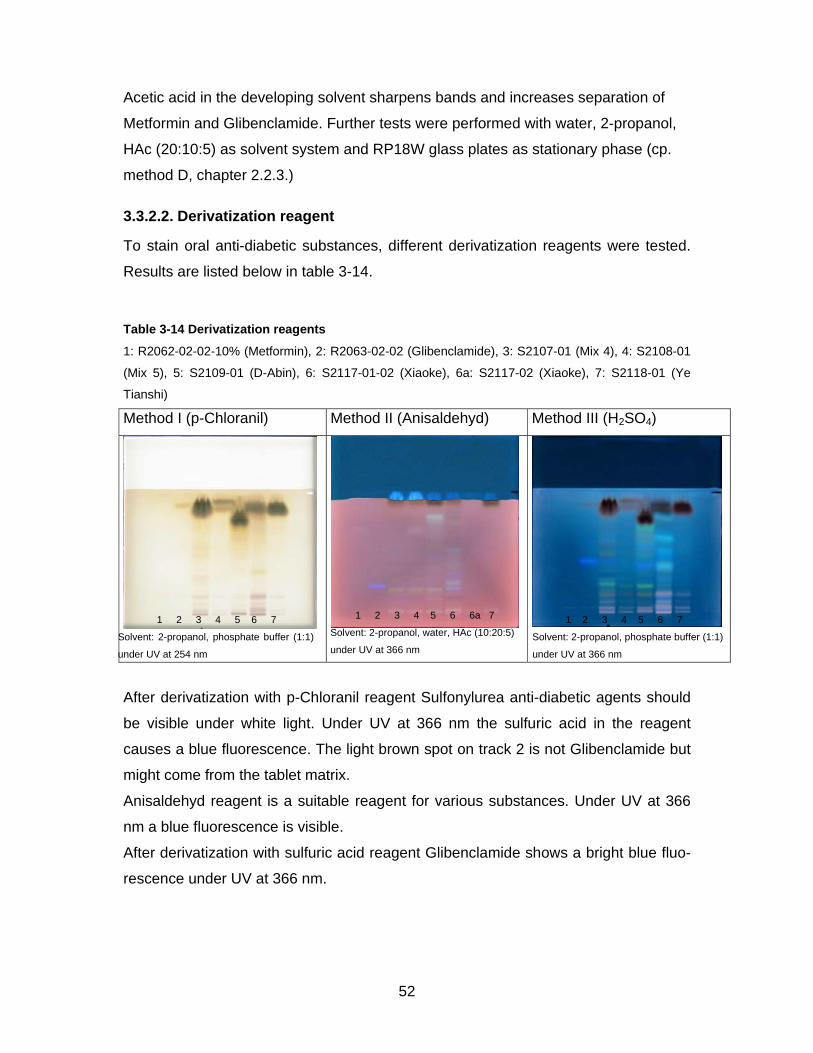
Table 3-14 Derivatization reagents
1: R2062-02-02-10% (Metformin), 2: R2063-02-02 (Glibenclamide), 3: S2107-01 (Mix 4), 4: S2108-01
(Mix 5), 5: S2109-01 (D-Abin), 6: S2117-01-02 (Xiaoke), 6a: S2117-02 (Xiaoke), 7: S2118-01 (Ye
Tianshi)
Method I (p-Chloranil) Method II (Anisaldehyd) Method III (H2SO4)
After derivatization with p-Chloranil reagent Sulfonylurea anti-diabetic agents should
be visible under white light. Under UV at 366 nm the sulfuric acid in the reagent
causes a blue fluorescence. The light brown spot on track 2 is not Glibenclamide but
might come from the tablet matrix.
Anisaldehyd reagent is a suitable reagent for various substances. Under UV at 366
nm a blue fluorescence is visible.
After derivatization with sulfuric acid reagent Glibenclamide shows a bright blue fluo-
rescence under UV at 366 nm.
1 2 3 4 5 6 6a 7
Solvent: 2-propanol, water, HAc (10:20:5)
under UV at 366 nm
1 2 3 4 5 6 7
Solvent: 2-propanol, phosphate buffer (1:1)
under UV at 366 nm
1 2 3 4 5 6 7
Solvent: 2-propanol, phosphate buffer (1:1)
under UV at 254 nm
53
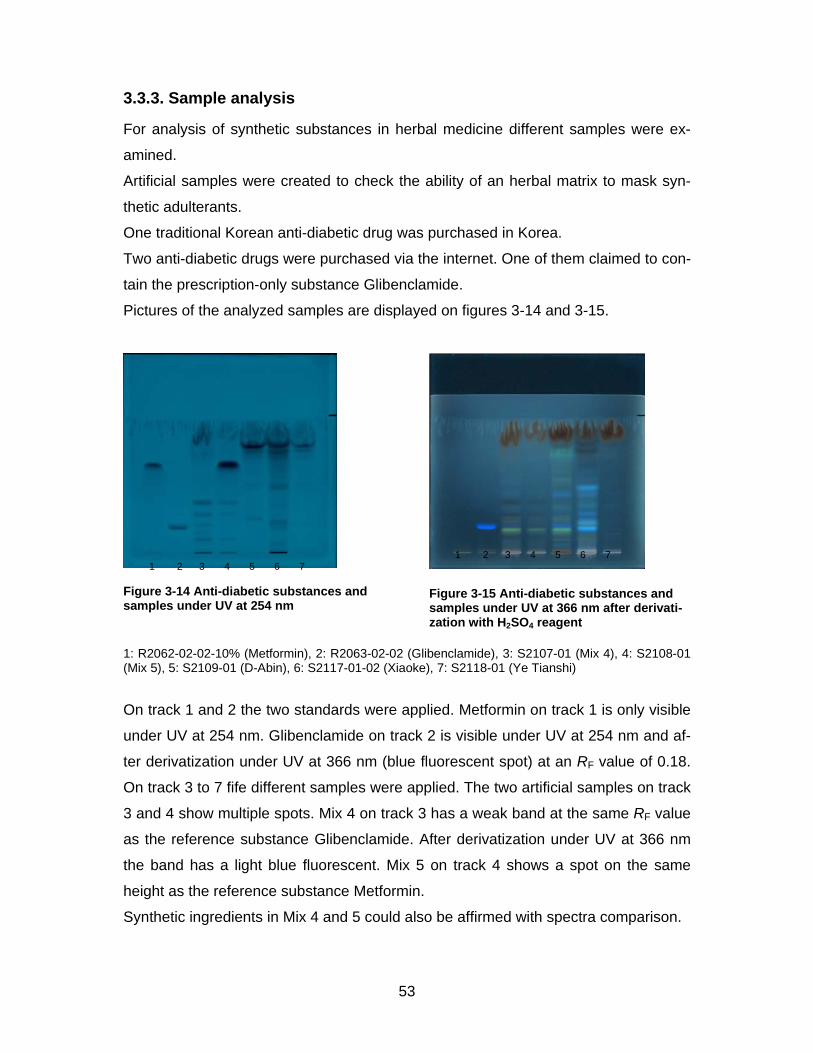
3.3.3. Sample analysis
For analysis of synthetic substances in herbal medicine different samples were ex-
amined.
Artificial samples were created to check the ability of an herbal matrix to mask syn-
thetic adulterants.
One traditional Korean anti-diabetic drug was purchased in Korea.
Two anti-diabetic drugs were purchased via the internet. One of them claimed to con-
tain the prescription-only substance Glibenclamide.
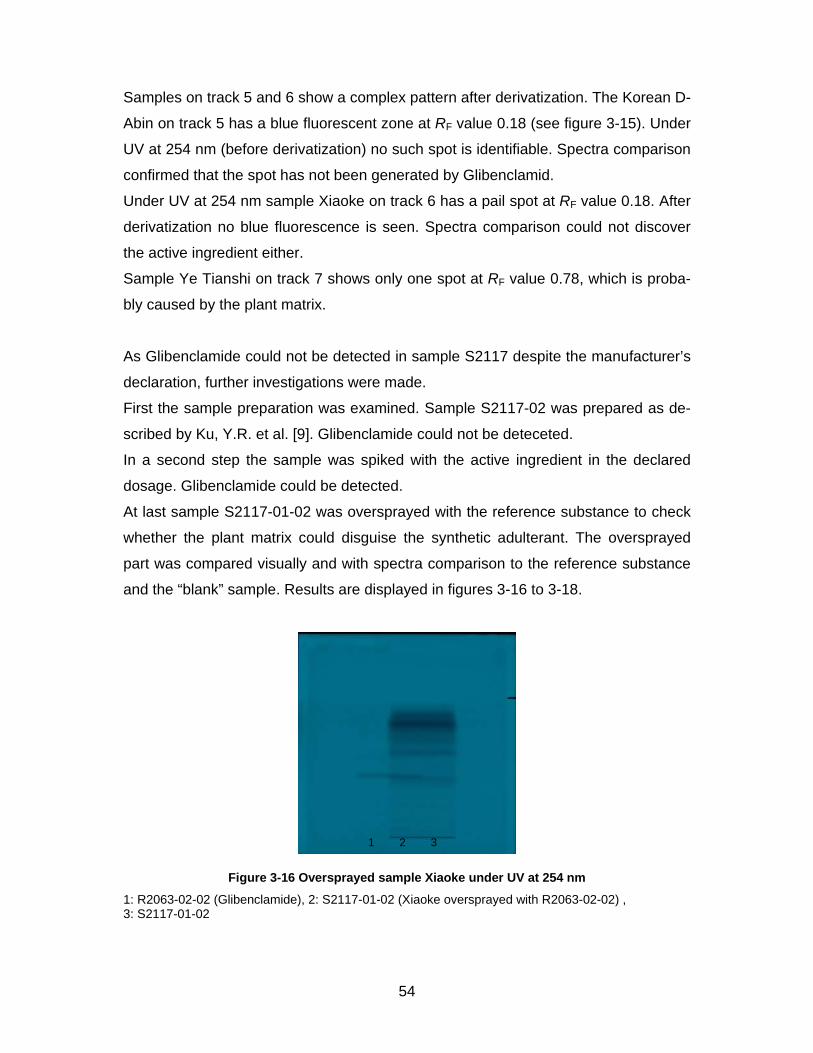
Pictures of the analyzed samples are displayed on figures 3-14 and 3-15.
Figure 3-14 Anti-diabetic substances and samples under UV at 254 nm
Figure 3-15 Anti-diabetic substances and samples under UV at 366 nm after derivati-zation with H2SO4 reagent
1: R2062-02-02-10% (Metformin), 2: R2063-02-02 (Glibenclamide), 3: S2107-01 (Mix 4), 4: S2108-01 (Mix 5), 5: S2109-01 (D-Abin), 6: S2117-01-02 (Xiaoke), 7: S2118-01 (Ye Tianshi)
On track 1 and 2 the two standards were applied. Metformin on track 1 is only visible
under UV at 254 nm. Glibenclamide on track 2 is visible under UV at 254 nm and af-
ter derivatization under UV at 366 nm (blue fluorescent spot) at an RF value of 0.18.
On track 3 to 7 fife different samples were applied. The two artificial samples on track
3 and 4 show multiple spots. Mix 4 on track 3 has a weak band at the same RF value
as the reference substance Glibenclamide. After derivatization under UV at 366 nm
the band has a light blue fluorescent. Mix 5 on track 4 shows a spot on the same
height as the reference substance Metformin.
Synthetic ingredients in Mix 4 and 5 could also be affirmed with spectra comparison.
1 2 3 4 5 6 7 1 2 3 4 5 6 7
54
Samples on track 5 and 6 show a complex pattern after derivatization. The Korean D-
Abin on track 5 has a blue fluorescent zone at RF value 0.18 (see figure 3-15). Under
UV at 254 nm (before derivatization) no such spot is identifiable. Spectra comparison
confirmed that the spot has not been generated by Glibenclamid.
Under UV at 254 nm sample Xiaoke on track 6 has a pail spot at RF value 0.18. After
derivatization no blue fluorescence is seen. Spectra comparison could not discover
the active ingredient either.
Sample Ye Tianshi on track 7 shows only one spot at RF value 0.78, which is proba-
bly caused by the plant matrix.
As Glibenclamide could not be detected in sample S2117 despite the manufacturer’s
declaration, further investigations were made.
First the sample preparation was examined. Sample S2117-02 was prepared as de-
scribed by Ku, Y.R. et al. [9]. Glibenclamide could not be deteceted.
In a second step the sample was spiked with the active ingredient in the declared
dosage. Glibenclamide could be detected.
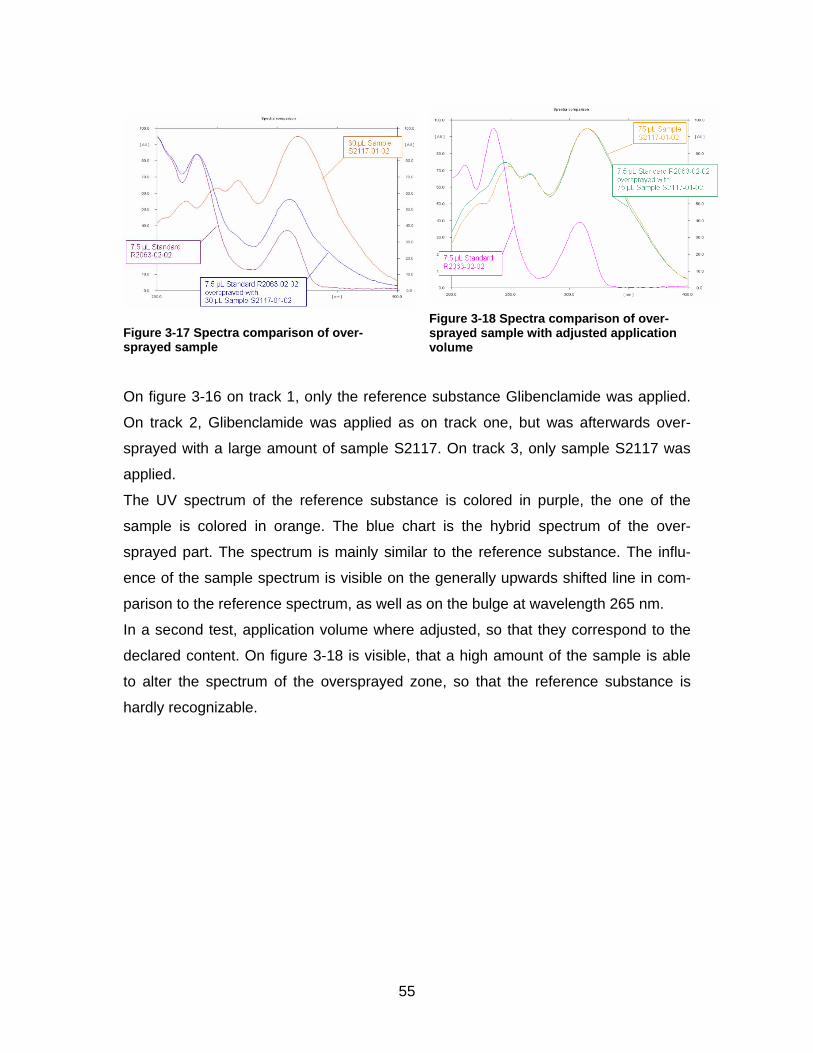
At last sample S2117-01-02 was oversprayed with the reference substance to check
whether the plant matrix could disguise the synthetic adulterant. The oversprayed
part was compared visually and with spectra comparison to the reference substance
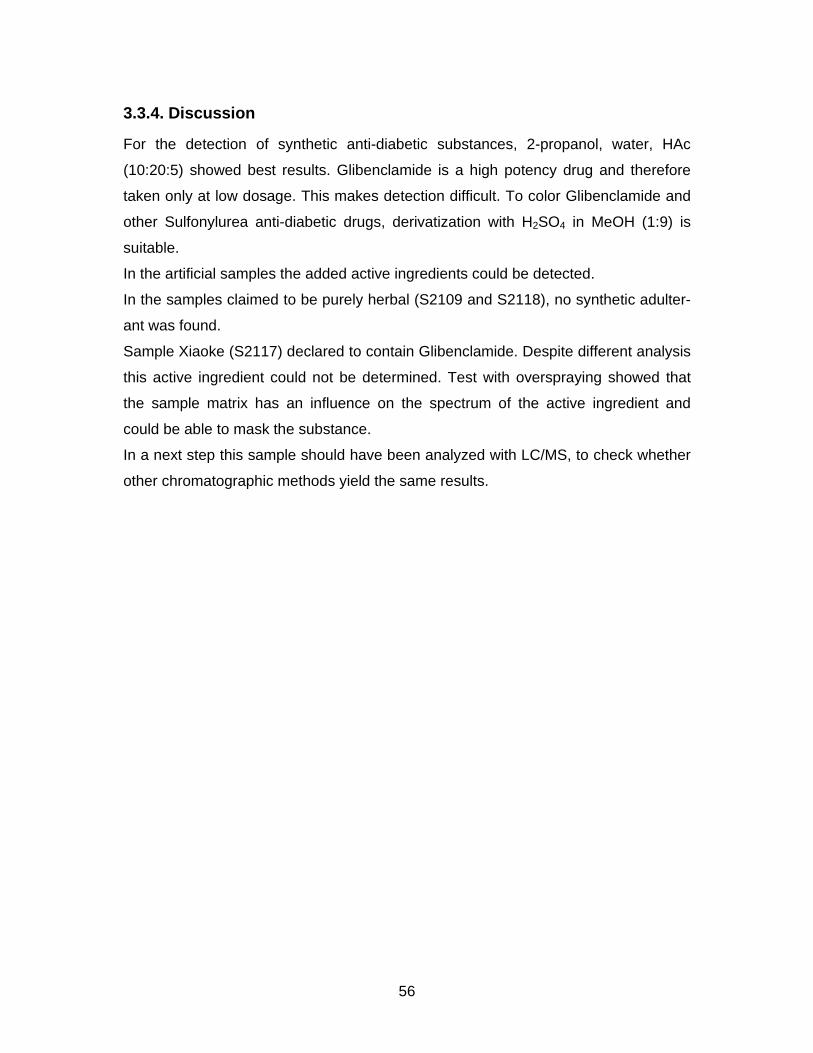
and the “blank” sample. Results are displayed in figures 3-16 to 3-18.
Figure 3-16 Oversprayed sample Xiaoke under UV at 254 nm
1: R2063-02-02 (Glibenclamide), 2: S2117-01-02 (Xiaoke oversprayed with R2063-02-02) , 3: S2117-01-02
1 2 3
55
Figure 3-17 Spectra comparison of over-sprayed sample
Figure 3-18 Spectra comparison of over-sprayed sample with adjusted application volume
On figure 3-16 on track 1, only the reference substance Glibenclamide was applied.
On track 2, Glibenclamide was applied as on track one, but was afterwards over-
sprayed with a large amount of sample S2117. On track 3, only sample S2117 was
applied.
The UV spectrum of the reference substance is colored in purple, the one of the
sample is colored in orange. The blue chart is the hybrid spectrum of the over-
sprayed part. The spectrum is mainly similar to the reference substance. The influ-
ence of the sample spectrum is visible on the generally upwards shifted line in com-
parison to the reference spectrum, as well as on the bulge at wavelength 265 nm.
In a second test, application volume where adjusted, so that they correspond to the
declared content. On figure 3-18 is visible, that a high amount of the sample is able
to alter the spectrum of the oversprayed zone, so that the reference substance is
hardly recognizable.
56
3.3.4. Discussion
For the detection of synthetic anti-diabetic substances, 2-propanol, water, HAc
(10:20:5) showed best results. Glibenclamide is a high potency drug and therefore
taken only at low dosage. This makes detection difficult. To color Glibenclamide and
other Sulfonylurea anti-diabetic drugs, derivatization with H2SO4 in MeOH (1:9) is
suitable.
In the artificial samples the added active ingredients could be detected.
In the samples claimed to be purely herbal (S2109 and S2118), no synthetic adulter-
ant was found.
Sample Xiaoke (S2117) declared to contain Glibenclamide. Despite different analysis
this active ingredient could not be determined. Test with overspraying showed that
the sample matrix has an influence on the spectrum of the active ingredient and
could be able to mask the substance.
In a next step this sample should have been analyzed with LC/MS, to check whether
other chromatographic methods yield the same results.
57
3.4. Final Discussion
Three methods for analysis of synthetic adulterants in herbal medicines were devel-
oped. Evaluation was always achieved visually and with UV spectra comparison.
For anti-impotency drugs the solvent system tert-Butyl methyl ether, methanol, am-
monia (20:2:1) showed best results. Stationary phase was a common silica gel plate.
Six samples were analyzed. Three of them contained illegally added Sildenafil and
Homosildenafil respectively.
Heptane, 2-propanol, acetic acid (15:5:1) was found to be appropriate for analytics of
anti-rheumatic drugs. For corticosteroids dichloromethane, acetone (3:1) led to ade-
quate separation. Stationary phases were in both cases silica gel plates. Eight sam-
ples were analyzed. The declared synthetic ingredients in the three artificial samples
and in one Korean pain killer could be detected. Three samples did not contain any
synthetic adulterants. One sample probably contained an adulterant, but its identity
could not definitely be elucidated.
For anti-diabetic agents the solvent system 2-propanol, water, acetic acid (10:20:5)
was suitable. As stationary phase RP18W plates were used. Fife samples were ex-
amined. The active ingredients in the two artificial samples were recovered. Other
two samples did not contain any synthetic adulterant. One sample declared to con-
tain an active ingredient that could not be detected by HPTLC. In this work it could
not be determined whether the substance was not in the sample or it could not be
discovered.
In a future project the quantitative evaluation should be re-investigated with special
respect to stability of the components. Preparative isolation of potentially synthetic
substances from the investigated herbal drugs in larger quantities should be at-
tempted. Elucidation of structures would then be possible

59
4. List of Figures
Figure 1-1 Method development schema................................................................... 13
Figure 1-2 CAMAG optimization scheme................................................................... 13
Figure 3-1 Anti-impotency drugs, standards and samples......................................... 33
Figure 3-2 Anti-impotency drugs, standards and samples; optimized solvent........... 33
Figure 3-3 Standard solutions and samples from Korean custom............................. 34
Figure 3-4 UV spectrum of standard Sildenafil and samples from Korean custom .. 34
Figure 3-5 UV spectrum of standard Homosildenafil and sample S1922 ................. 34
Figure 3-6 Standard solutions and samples purchased in Hong Kong...................... 35
Figure 3-7 UV spectrum of Standard Sildenafil and analogues and sample S1925.. 35
Figure 3-8 UV spectrum of Standard Sildenafil and analogues and sample S1926.. 35
Figure 3-9 Calibration curve of Sildenafil and measurements of sample S1921....... 41
Figure 3-10 NSAIDs: Standards, artificial and real samples under UV at 254 nm .... 46
Figure 3-11 NSAIDs: Standards, artificial and real samples under UV at 254 nm .... 47
Figure 3-12 Spectra comparison: References Ibuprofen and ASA and sample………..
S2116-50%.............................................................................................. 48
Figure 3-13 Corticosteroids: Standards, artificial and real samples under UV at ……...
254 nm..................................................................................................... 48
Figure 3-14 Anti-diabetic substances and samples under UV at 254 nm.................. 53
Figure 3-15 Anti-diabetic substances and samples under UV at 366 nm after…………
derivatization with H2SO4 reagent ........................................................... 53
Figure 3-16 Oversprayed sample Xiaoke under UV at 254 nm ................................. 54
Figure 3-17 Spectra comparison of oversprayed sample .......................................... 55
Figure 3-18 Spectra comparison of oversprayed sample with adjusted application…...
volume ..................................................................................................... 55
60
5. Literature References 1. Koh, H.L., Woo, S.O., 2000. Chinese proprietary medicine in Singapore: regu latory control of toxic heavy metals and undeclared drugs. Drug Safety, 23(5): p. 351-62. 2. Yee, S.K., Chu, S.S., Xu, Y.M., 2005. Regulatory control of Chinese Proprie tary Medicines in Singapore. Health Policy, 71(2): p. 133-49. 3. Chan, K., 2003. Some aspects of toxic contaminants in herbal medicines.
Chemosphere, 52(9): p. 1361-71. 4. Ernst, E., 2002. Adulteration of Chinese herbal medicines with synthetic drugs:
a systematic review. Jounal of Internal Medicine, 252(2): p. 107-13. 5. De Smet, P.A., 2004. Health risks of herbal remedies: An update. Clinical Pharmacology & Therapeutics, 76(1): p. 1-17. 6. Gertner, E., Marshall, P.S., Filandrinos, D., Potek, A.S., Smith, T.M., 1995.
Complications resulting from the use of Chinese herbal medications containing undeclared prescription drugs. Arthritis and Rheumatism, 38(5): p. 614-7.
7. Huang, W.F., Wen, K.C., Hsiao, M.L., 1997. Adulteration by synthetic thera peutic substances of traditional Chinese medicines in Taiwan. Journal of Clini cal Pharmacology, 37(4): p. 344-50. 8. Ko, R.J., 1998. Adulterants in Asian patent medicines. New England Journal of Medicine, 339(12): p. 847. 9. Ku, Y.R., Chag, L.Y., Ho, L.K., Lin, J.H., 2003. Analysis of synthetic anti-
diabetic drugs in adulterated traditional Chinese medicines by high-performance capillary electrophoresis. Journal of Pharmaceutical and Bio-medical Analysis, 33(2): p. 329-34.
10. Schnädelbach, D., 1999. The counterfeiting of pharmaceuticals: containing
risks., in The Pharmacists at the crossroads of new health risks: An indispen-sable partner for their man agement. Strasbourg, France, Council of Europe.
11. Hong, M.-K., et al., 2005. Private communication, CAMAG. 12. Reich, E. and A. Blatter, 2004. Modern TLC: A key technique for identification
and quality control of botanicals and dietary supplements. Inside Laboratory Management, May/June p. 14-18.
13. Reich, E., 2003. Instrumental Thin-layer Chromatography, in Handbook of
Thin-layer Chromatography, Sherma, J., Fried, B. (Eds). Marcel Dekker, Inc., New York, p. 135-151.
61
14. Sherma, J., 2002. Chromatographic Methods of Analysis - Thin Layer Chro-matography in Encyclopedia of Pharmaceutical Technology, D. Encyclocedia, (Ed.). Marcel Dekker Inc., New York, p. 426-439.
15. Snyder, L.R., 1978. Classification of the solvent properties of common liquids.
Journal of Chromatographic Science, 16: p. 223-234. 16. Dammertz, W., Reich, E., 2001. Planar chromatography and densitometry, in
Planar chromatography, S. Nyiredy (Ed.). Springer Scientific Publisher, Buda-pest, Hungary, p. 234 - 246.
17. Pachaly, P., 1989. Steroidhormon-Derivate. Deutsche Apotheker Zeitung. 129:
p. 1538-1539. 18. Jork, H., Funk, W., Fischer, W., Wimmer, H., 1994. Thin-Layer Chromatogra-
phy: Reagents and Detection Methods. VHC Verlagsgesellschaft mbH. 19. European Pharmacopoeia. 4 ed. Swiss Edition, 2002. Deutscher Apotheker
Verlag, Stuttgart. 20. Sethi, P.D., Charegaonkar, D., 1999. Musculoskeletal Disorders, in Identifica-
tion of drugs in pharmaceutical formulations by thin-layer chromatography, CBS Publishers & Distributors, New Delhi, India. p. 83-132.
21. CAMAG, 2003. Quantitation of acetylsalicylic acid, salicylic acid and salicyla-
mide by HPTLC. 22. Franeta, J.T., Agbaba, D.D., Eric, S.M., Pavkov, S.P., Vladimirov, S.D., Alek-
sic, M.B., 2001. Quantitative analysis of analgoantipyretics in dosage form us-ing planar chromatography. Journal of Pharmaceutical and Biomedical Analy-sis, 24(5-6): p. 1169-1173.
23. El Sadek, M., El Shanawany, A., Aboul Khier, A., Ruckner, G., 1990. Determi- nation of the components of analgesic mixtures using high-performance thin- layer chromatography. Analyst, 115(9): p. 1181-1184. 24. Bebawy, L.I., El-Kousy, N.M., 1999. Simultaneous determination of some mul-
ticomponent dosage forms by quantitative thin layer chromatography densi-tometric method. Journal of Pharmaceutical and Biomedical Analysis, 20(4): p. 663-670.
25. http://chrom.tutms.tut.ac.jp/JINNO/DRUGDATA/14ethenzamide.html. Last vis-
ited on 21.09.2005. 26. Gumieniczek, A., Hopalka, H., Berecka, A., Kowalczuk, D., 2003. Normal-
and reversed-phase thin-layer chromatography of seven oral antidiabetic agents. Journal of Planar Chromatography, 16: p. 271-275.
62
6. Annex
6.1. List of Abbreviations
ACN Acetonitrile
ADC Automatic Development Chamber
AMD Automated multiple development
ASA Acetylsalicylic acid
CHCl3 Chloroform
CH2Cl2 Dichloromethane
CAM Complementary and alternative Medicine
DCM Dichloromethane
DMF Dimethylformamide
EtOAc Ethyl acetate
EtOH Ethanol GC Gas chromatography
GMP Good Manufacturing Practice
HAc Acetic acid
HCl Hydrochloric acid
HFo Formic acid
H2SO4 Sulfuric acid
HPLC High Performance Liquid Chromatography
HPTLC High Performance Thin Layer Chromatography
IR Infrared
MEK Methyl ethyl ketone
MeOD Deuterized methanol
MeOH Methanol
MS Mass Spectrometry
NaOH Sodium hydroxide
NH3 Ammonia 28%
NMR Nuclear Magnetic Resonance
NSAID Non-steroidal anti-inflammatory drug
p.a. pro analysi
63
RF Retention Factor
RP Reversed Phase
SPE Solid Phase Extraction
TBME tert-Butyl methyl ether
TCM Traditional Chinese Medicine
THF Tetrahydrofuran
TLC Thin Layer Chromatography
Tol Toluene
TTC Twin Trough Chamber
UV Ultraviolet
WRT White light Reflection and Transmission
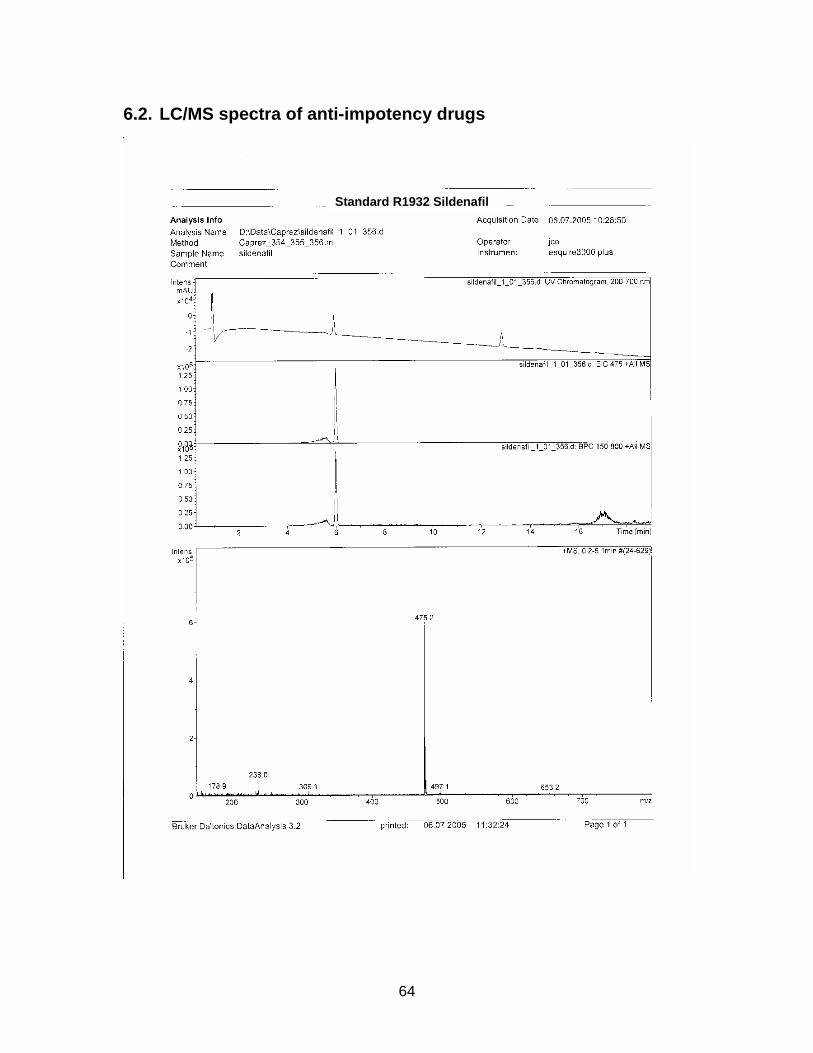
64
6.2. LC/MS spectra of anti-impotency drugs
Standard R1932 Sildenafil
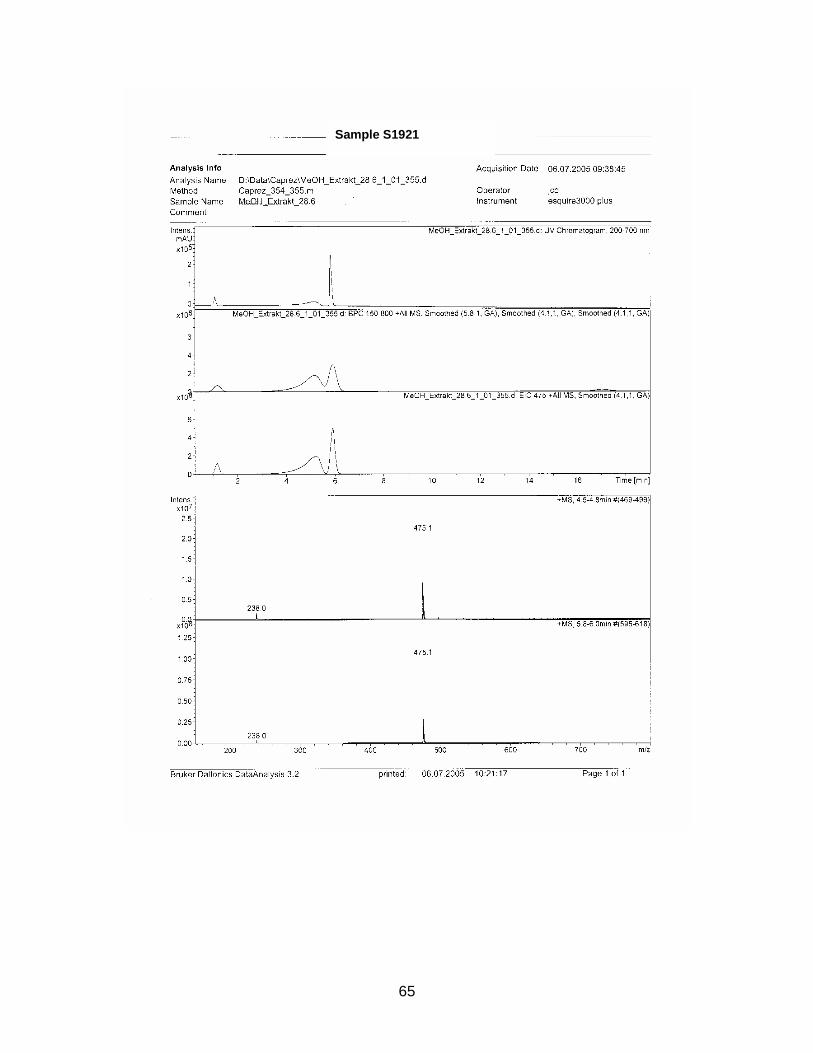
65
Sample S1921
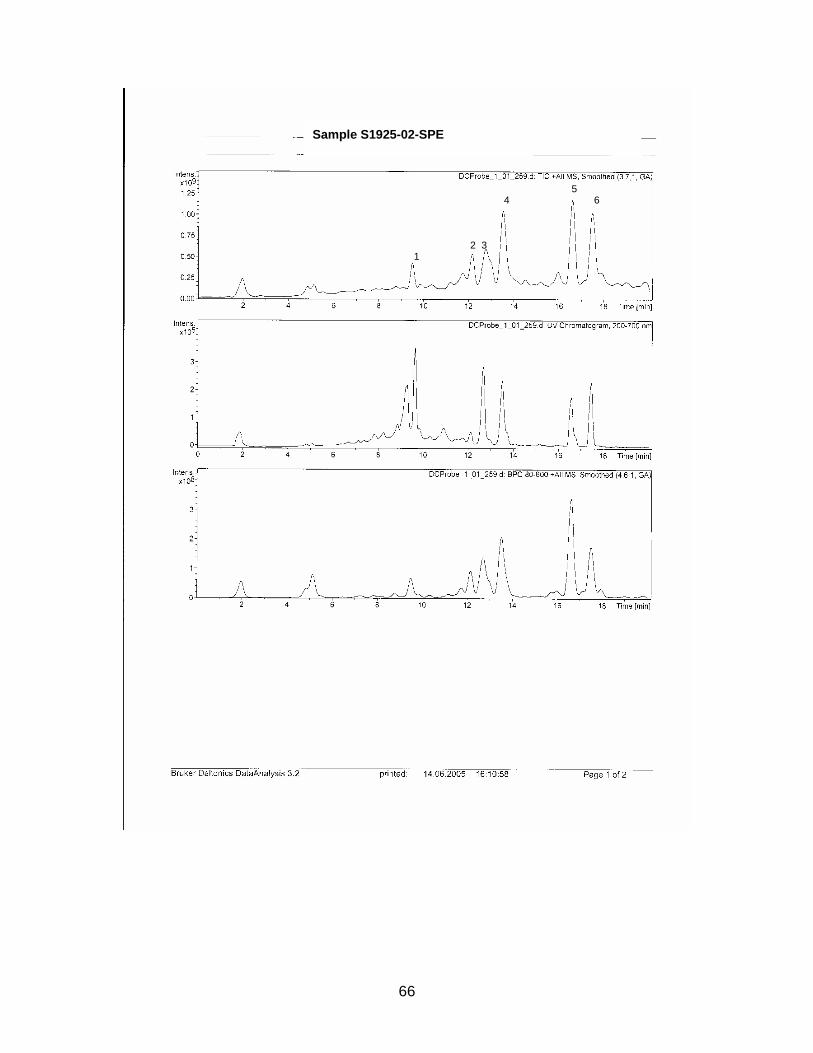
66
Sample S1925-02-SPE
12 3
45
6
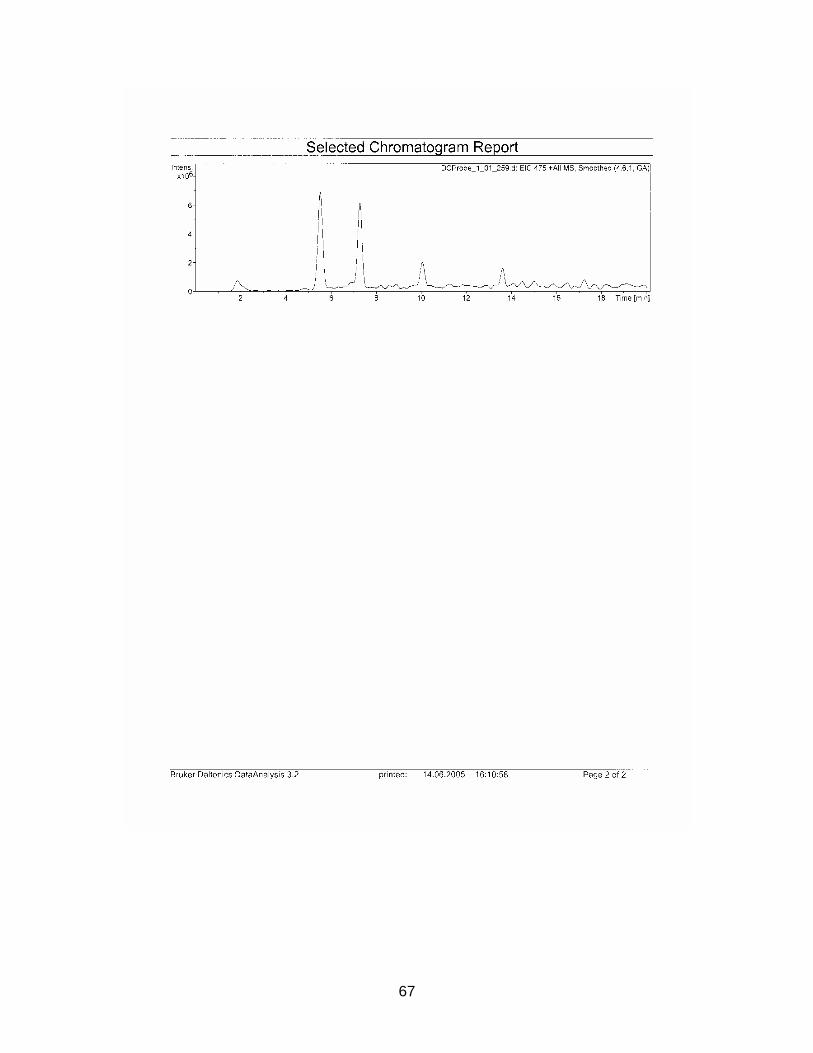
67
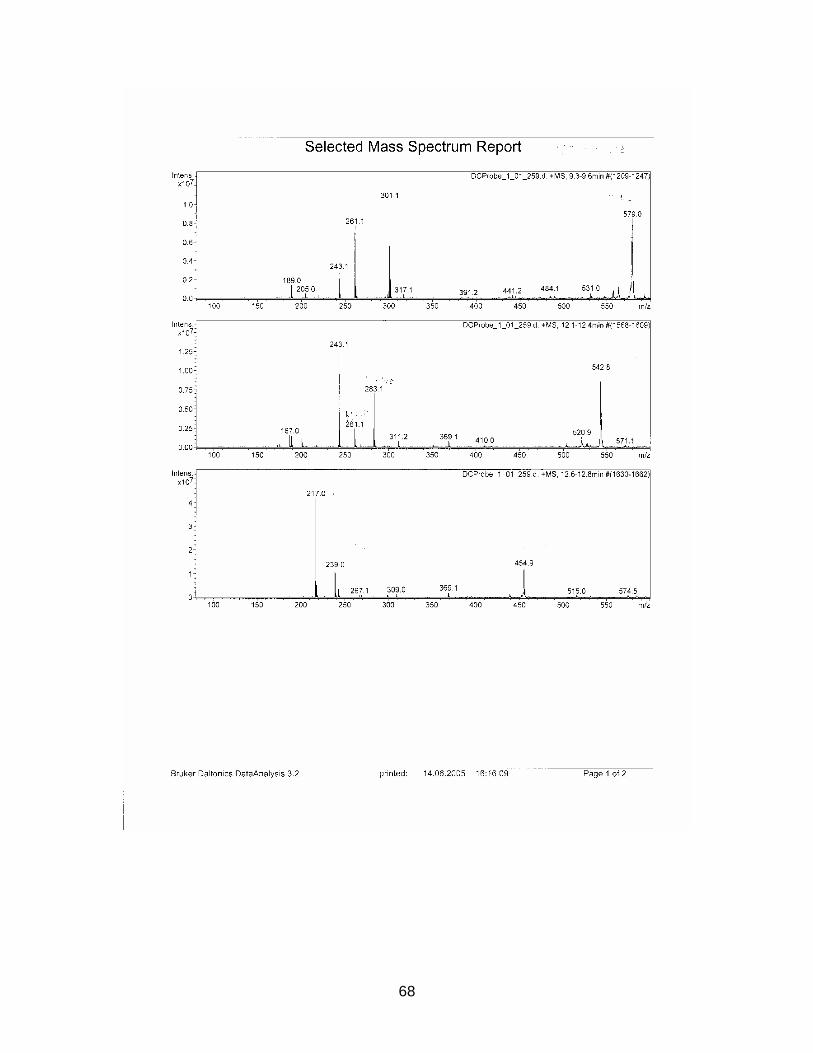
68
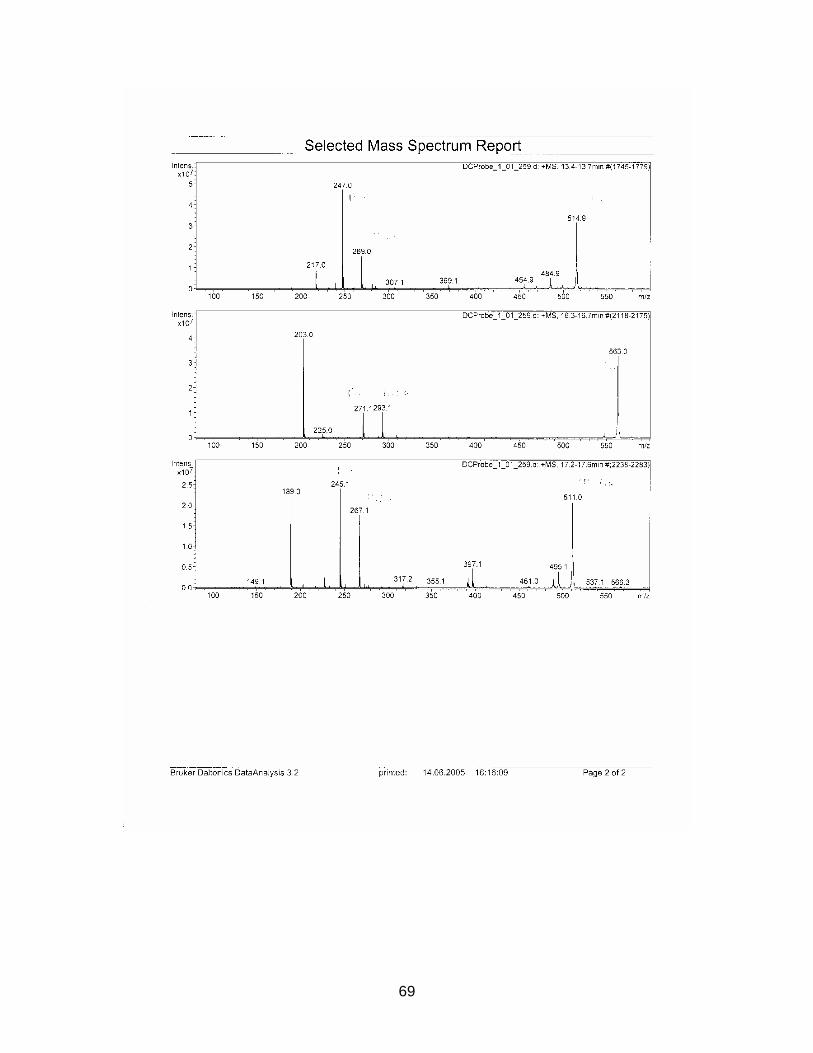
69
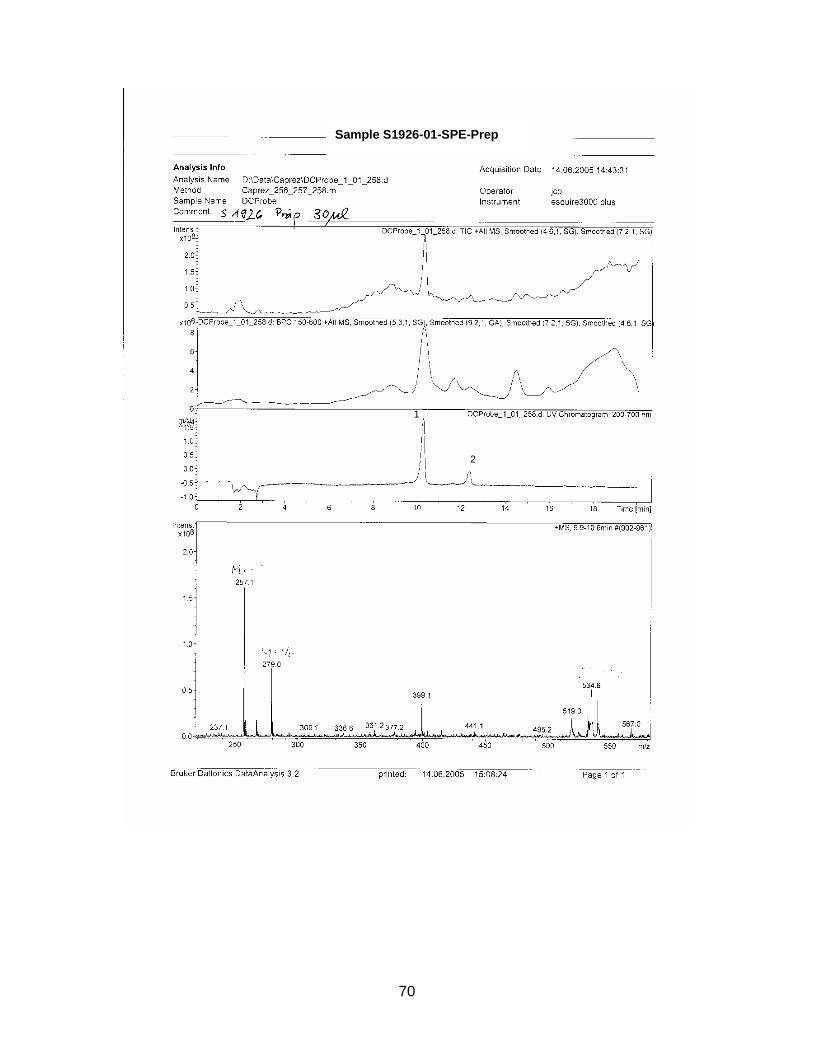
70
Sample S1926-01-SPE-Prep
1
2
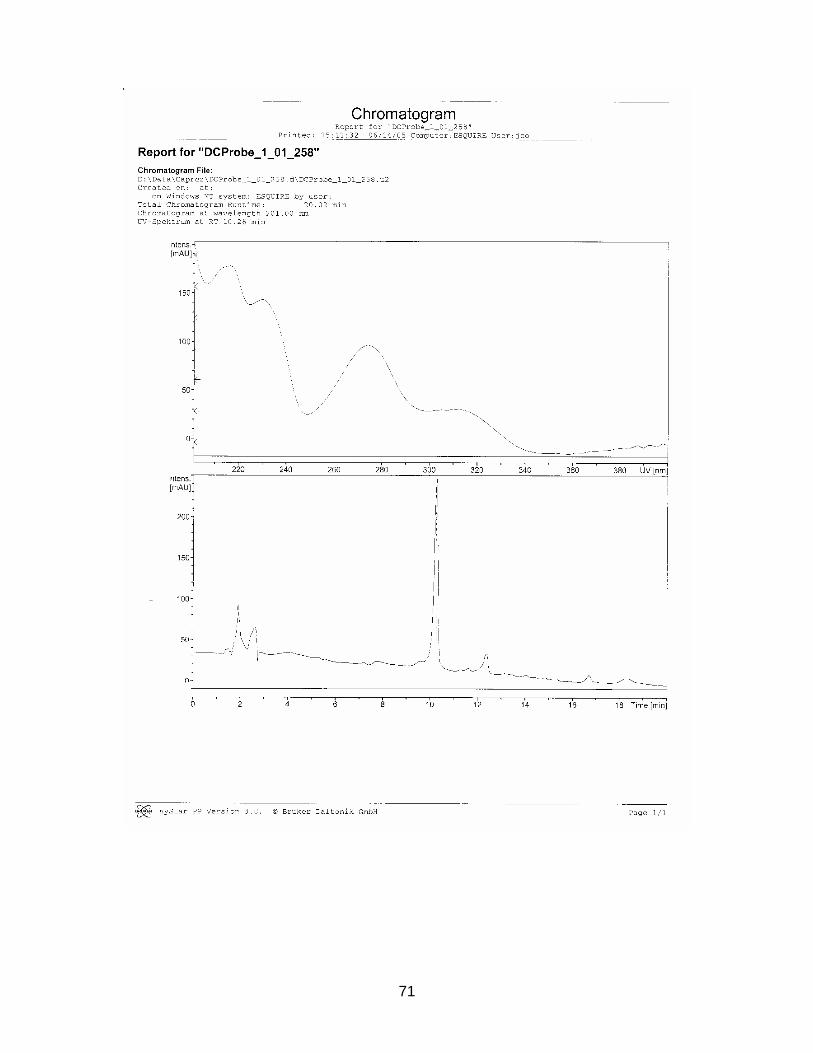
71
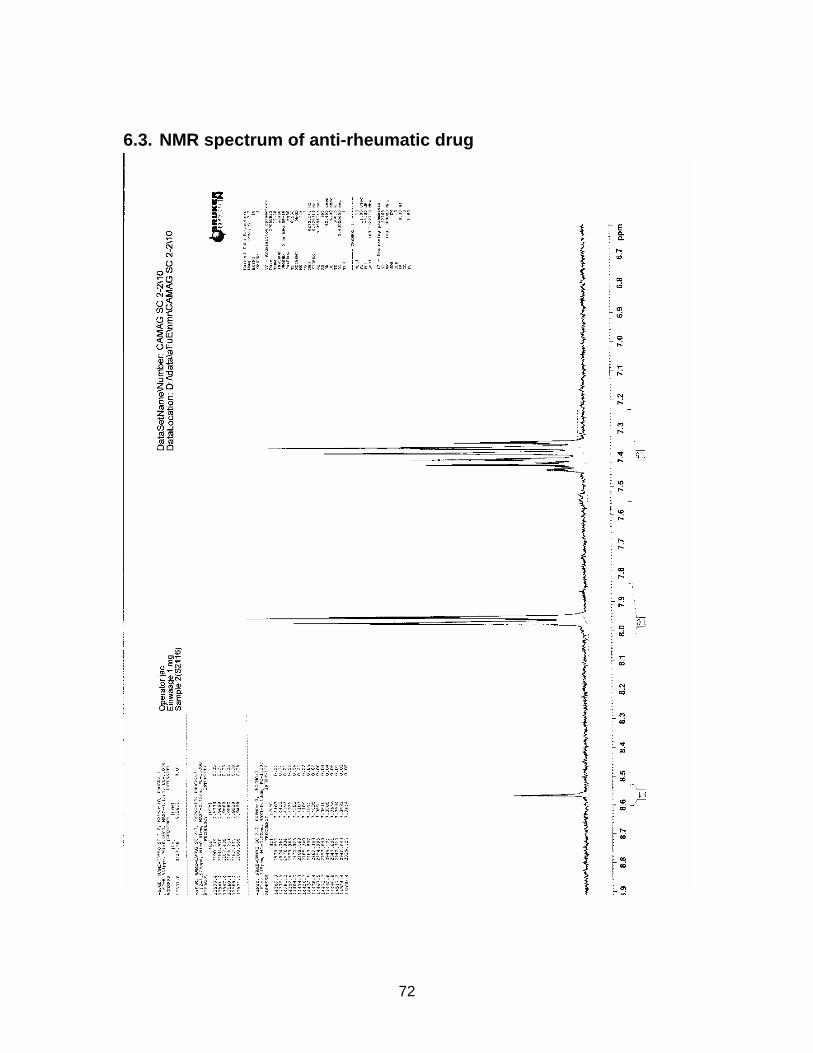
72
6.3. NMR spectrum of anti-rheumatic drug
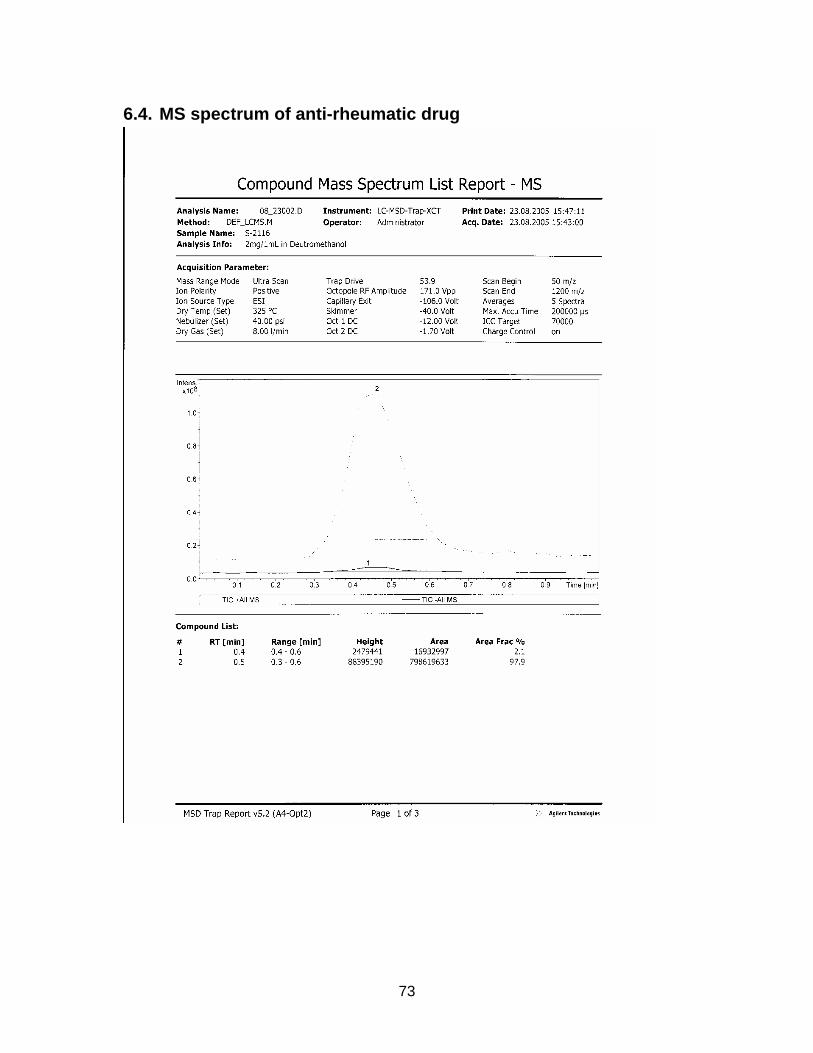
73
6.4. MS spectrum of anti-rheumatic drug
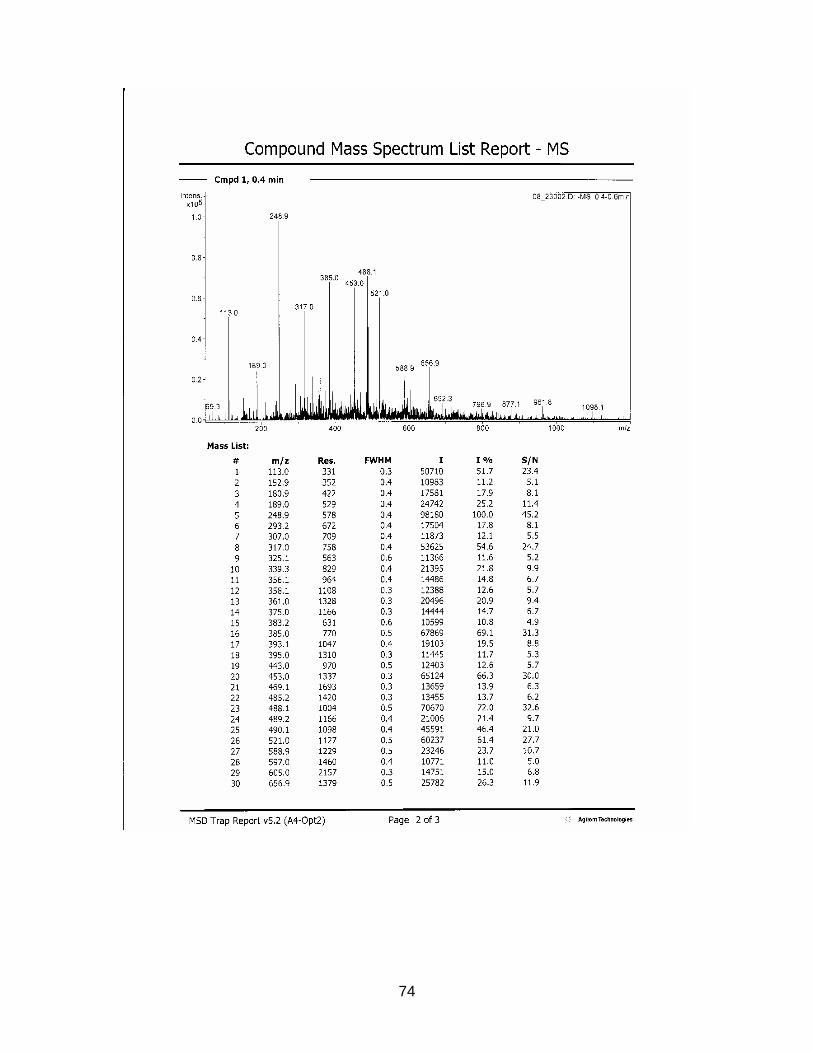
74
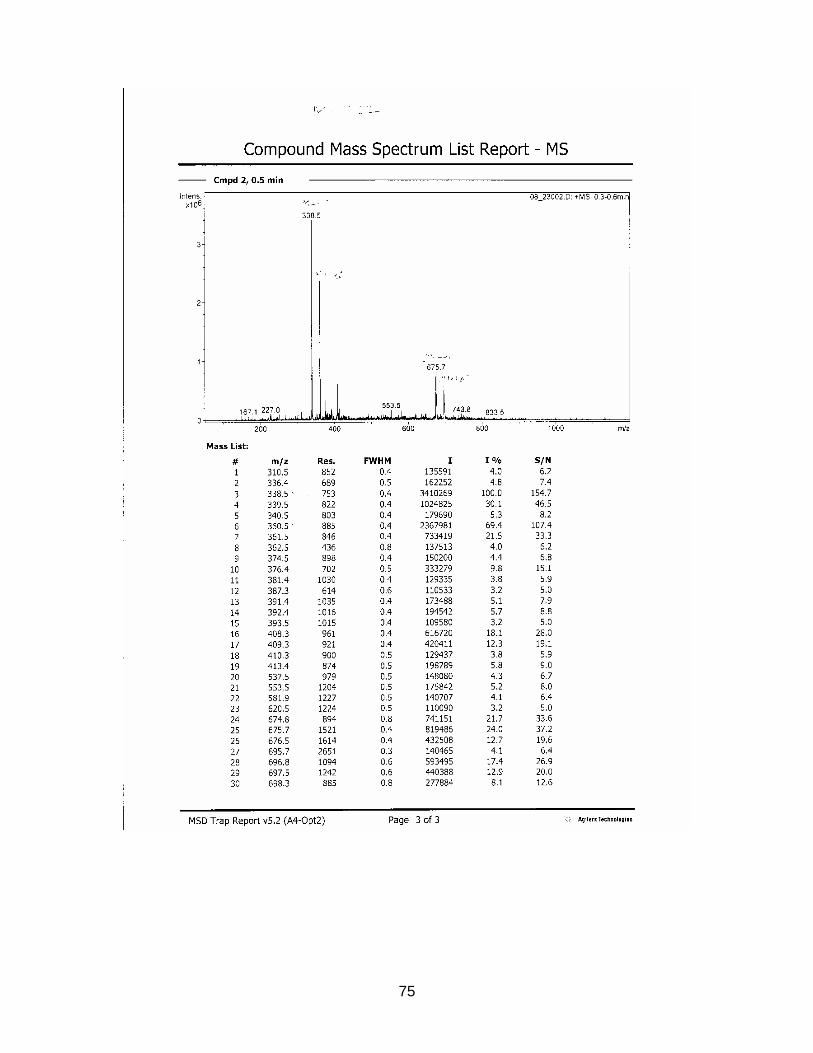
75
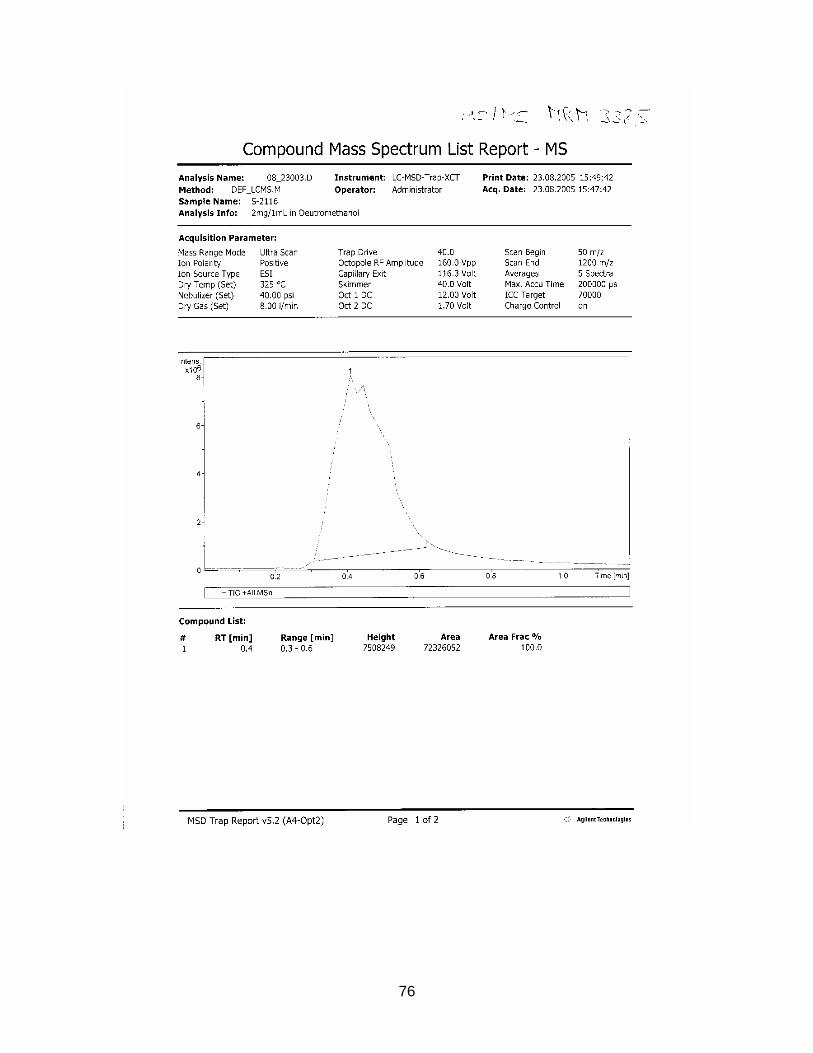
76
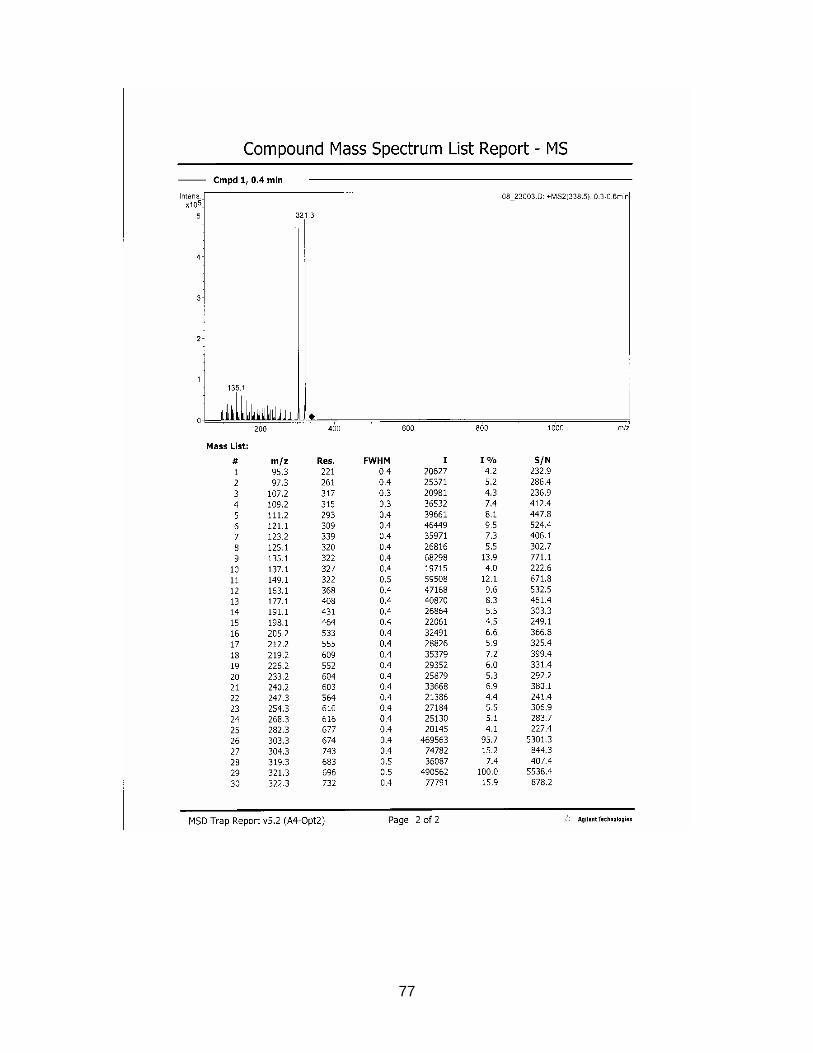
77
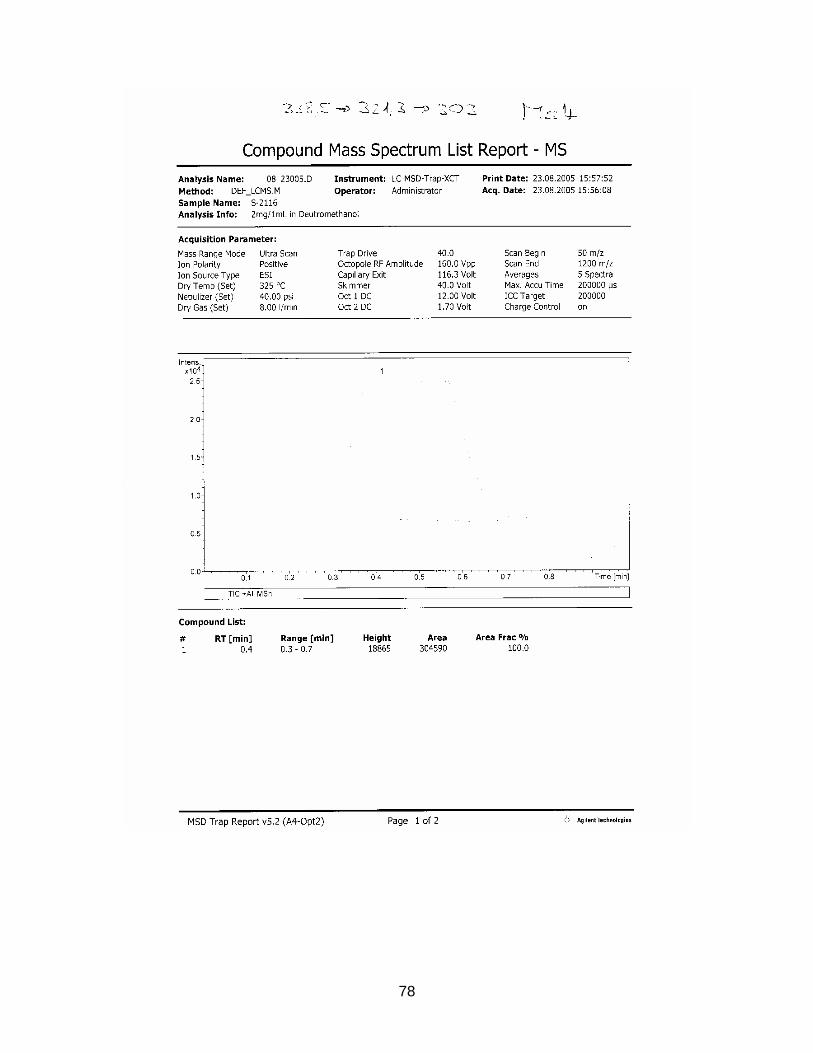
78
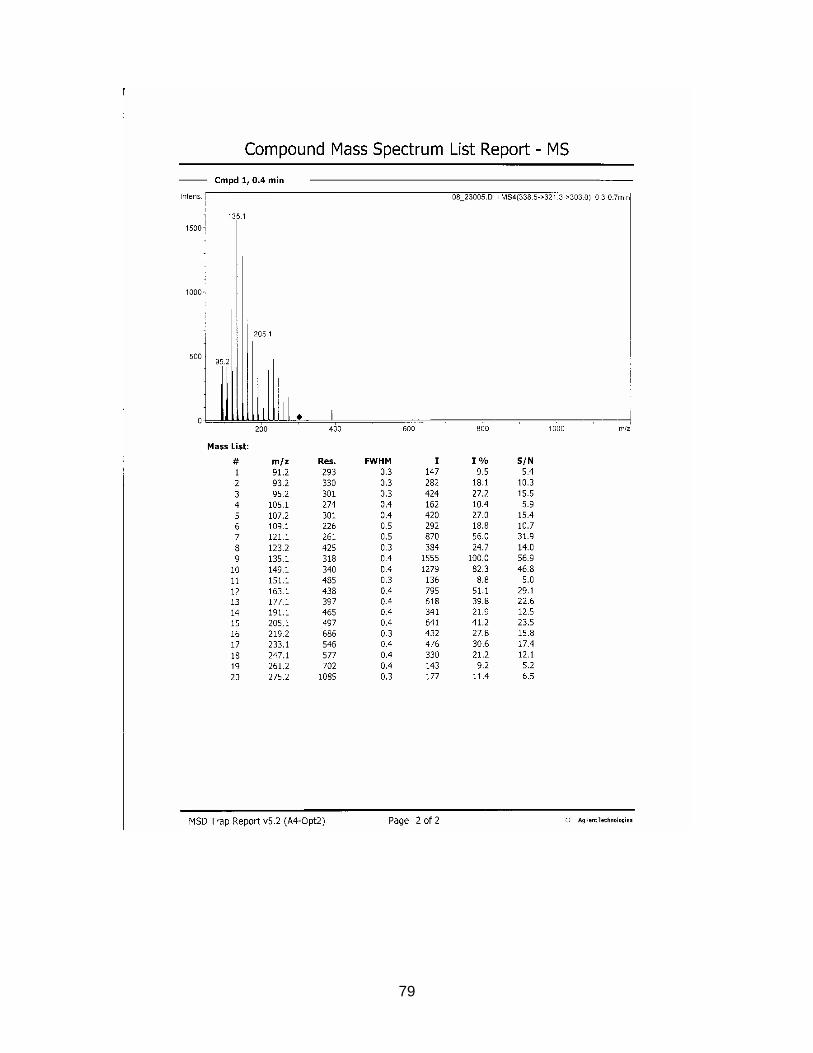
79
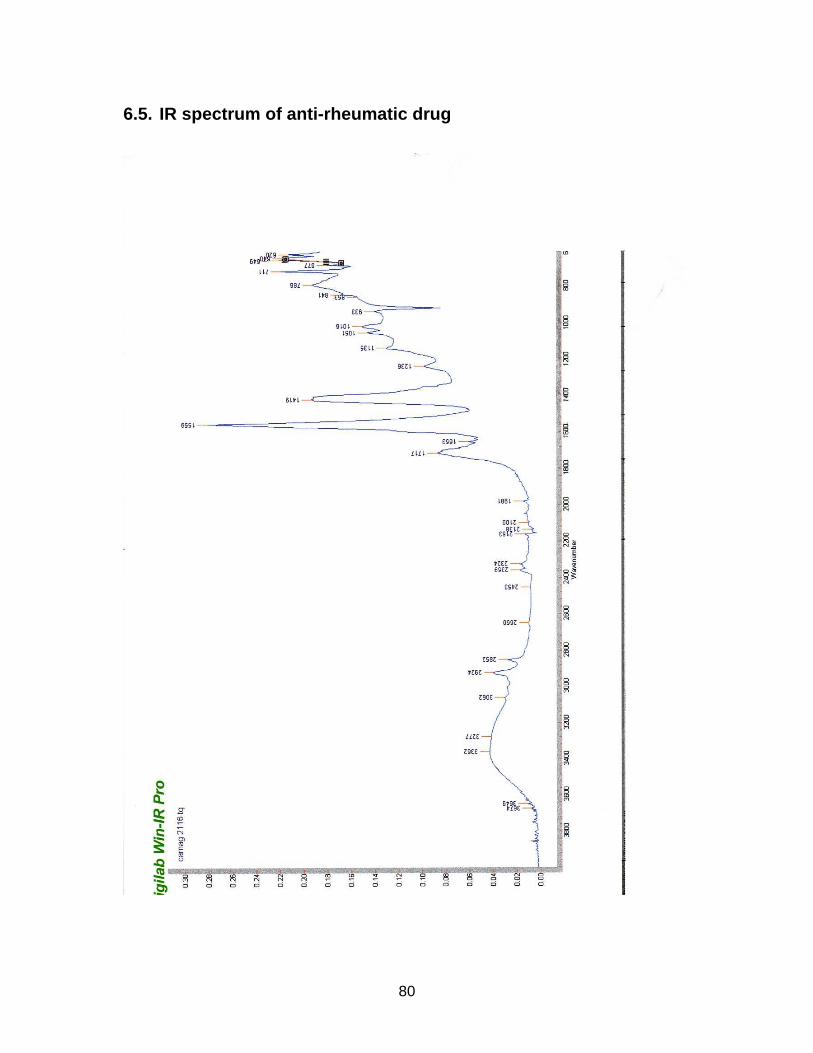
80
6.5. IR spectrum of anti-rheumatic drug