Development cycle - uaf.edu.pk · Cereal system Initiative for South Asia CONSERVATION AGRICULTURE...
16
Cereal system Initiative for South Asia CONSERVATION AGRICULTURE – a climate friendly approach Dr. M. Aqil Khan Country Coordinator IRRI-CIMMYT, Pakistan 1. Agricultural situation 2. Climate change scenario 3. Agricultural options 4. CSISA role & partnership - Knowledge banks, -CKB -HCP Climate change changing world contours Climate change changing world contours o Population ( 9b in 2050) o Industrialization o Agriculture and its input use o Globalization and market integration o Consumerism Resource base exploitation/deterioration Development cycle Anthropogenic effects more Anthropogenic effects more pronounced today pronounced today ‐ CO CO 2 values up from 280 to 390 ppm values up from 280 to 390 ppm ‐ Emission up 31%, projection Emission up 31%, projection ≈ 2ppm Year 2ppm Year ‐1 ‐ Earth temperature up 0.74 Earth temperature up 0.74 ˚C ‐ Poised to increase 2.4 Poised to increase 2.4 ˚C ‐ Decreasing water availability Decreasing water availability ‐ Receding Himalayan glaciers (20% ) Receding Himalayan glaciers (20% ) ‐ Vanishing poles (100 k Vanishing poles (100 km 3 /year) Climate change causes GHGs 1. Water vapors (33‐66%GHGs) 2. CO 2 (9‐26%) 3. Methane x20(4‐9%) 4. N 2 O x298 5. O 3 x25 6. CFCs
Transcript of Development cycle - uaf.edu.pk · Cereal system Initiative for South Asia CONSERVATION AGRICULTURE...
Cereal system Initiative for South Asia
CONSERVATION AGRICULTURE – a climate friendly approach
Dr. M. Aqil KhanCountry Coordinator
IRRI-CIMMYT, Pakistan
1. Agricultural situation
2. Climate change scenario
3. Agricultural options
4. CSISA role & partnership- Knowledge banks, -CKB -HCP
Climate change changing world contoursClimate change changing world contours
o Population (�9b in 2050)o Industrializationo Agriculture and its input useo Globalization and market integration o Consumerism
Resource base exploitation/deterioration
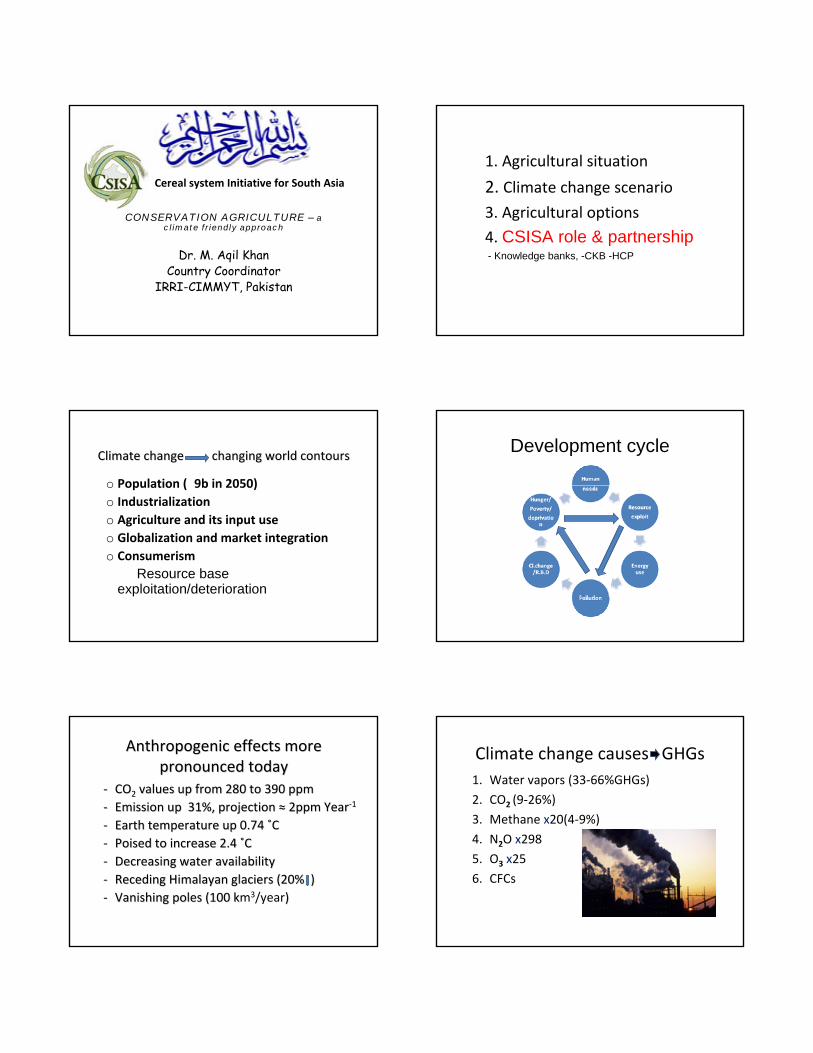
Development cycle
Anthropogenic effects more Anthropogenic effects more pronounced todaypronounced today
‐‐ COCO22 values up from 280 to 390 ppmvalues up from 280 to 390 ppm‐‐ Emission up 31%, projection Emission up 31%, projection ≈≈ 2ppm Year2ppm Year‐‐11
‐‐ Earth temperature up 0.74 Earth temperature up 0.74 ˚̊CC‐‐ Poised to increase 2.4 Poised to increase 2.4 ˚̊CC‐‐ Decreasing water availabilityDecreasing water availability‐‐ Receding Himalayan glaciers (20% )Receding Himalayan glaciers (20% )‐‐ Vanishing poles (100 kVanishing poles (100 km3/year) )
Climate change causes GHGs1. Water vapors (33‐66%GHGs)
2. CO2 (9‐26%)
3. Methane x20(4‐9%)
4. N2O x298
5. O3 x25
6. CFCs
Increasing CO2 concentration in atmosphere Global anthropogenic carbon emission
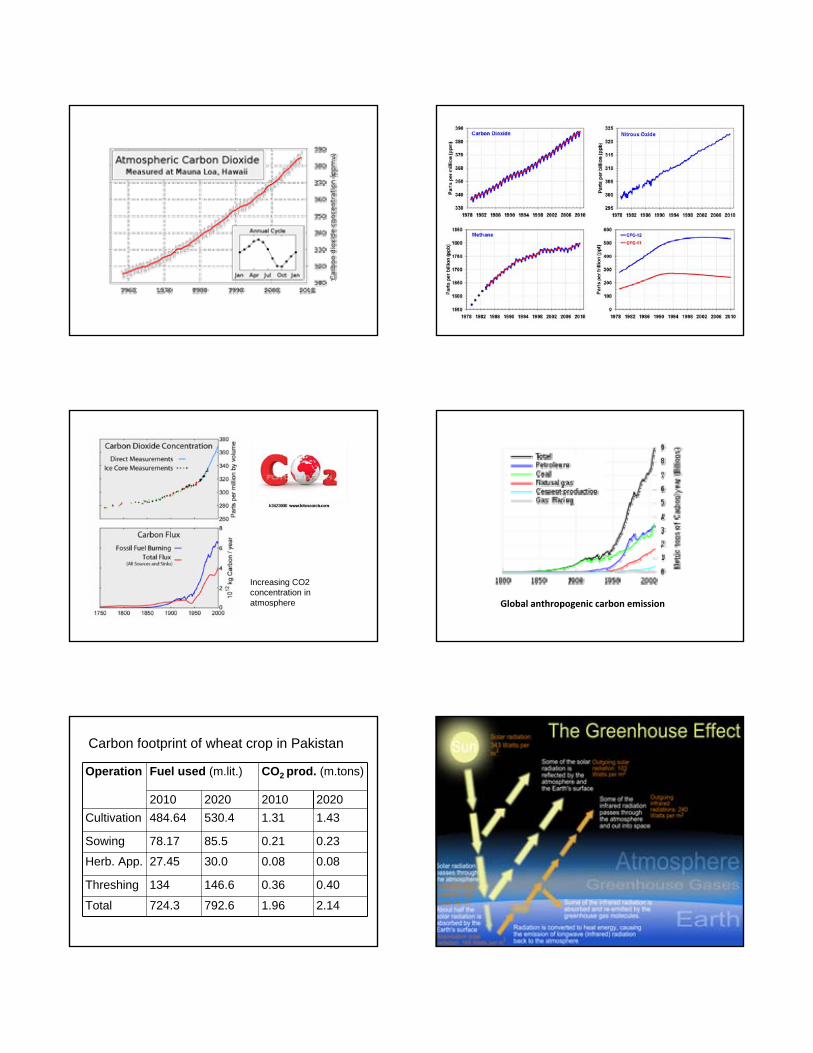
Carbon footprint of wheat crop in Pakistan
Operation Fuel used (m.lit.) CO2 prod. (m.tons)
2010 2020 2010 2020Cultivation 484.64 530.4 1.31 1.43
Sowing 78.17 85.5 0.21 0.23
Herb. App. 27.45 30.0 0.08 0.08
Threshing 134 146.6 0.36 0.40
Total 724.3 792.6 1.96 2.14
CO2 and solar radiation
Global temperature changes. Left: 1880-89. Right: 2000-09. NASA conducted the analysis using ship-based and satellite observations of sea-surface temperature, and data from Antarctic research stations and 6,300 meteorological stations around the world. Earth's average surface temperature has increased by about 0.7 °C (1.3 °F) since 1880. Two-thirds of the warming has occurred since 1975, at a rate of roughly 0.15 to 0.20 °C per decade.Credit: NASA GISS. Courtesy of the NASA Earth Observatory and Mike Carlowicz.
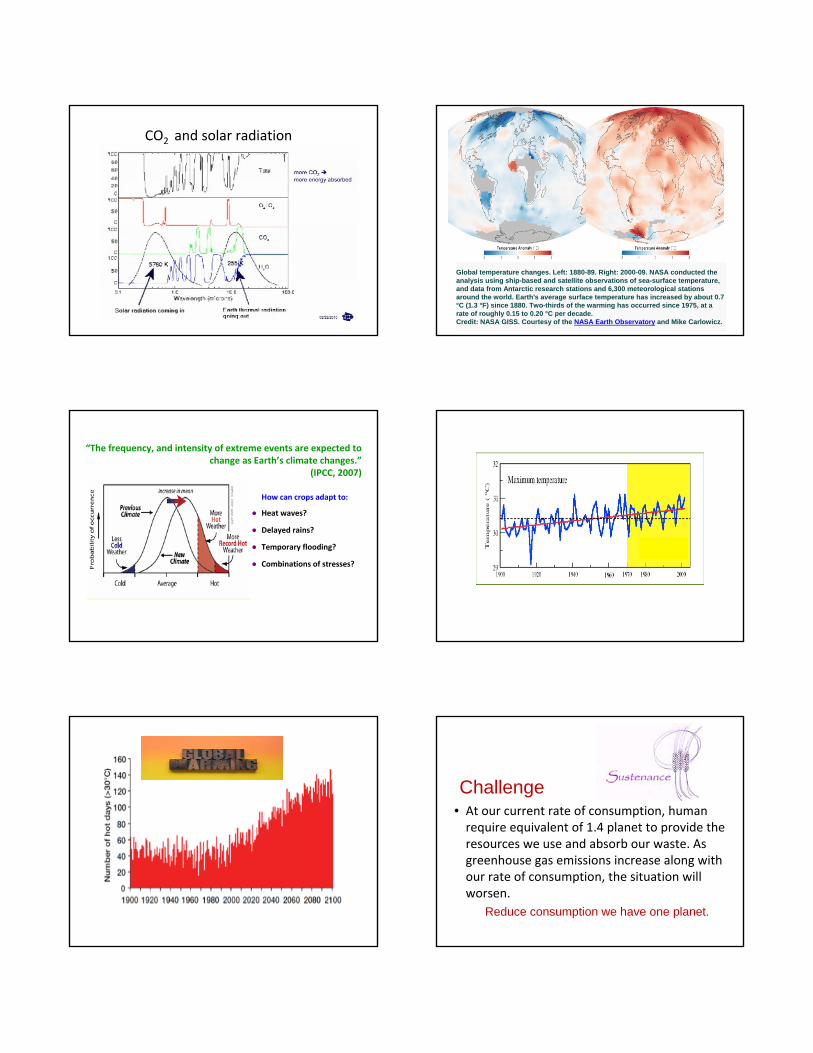
“The frequency, and intensity of extreme events are expected to change as Earth’s climate changes.”
(IPCC, 2007)
How can crops adapt to:
● Heat waves?
● Delayed rains?
● Temporary flooding?
● Combinations of stresses?
Challenge• At our current rate of consumption, human require equivalent of 1.4 planet to provide the resources we use and absorb our waste. As greenhouse gas emissions increase along with our rate of consumption, the situation will worsen.
Reduce consumption we have one planet.
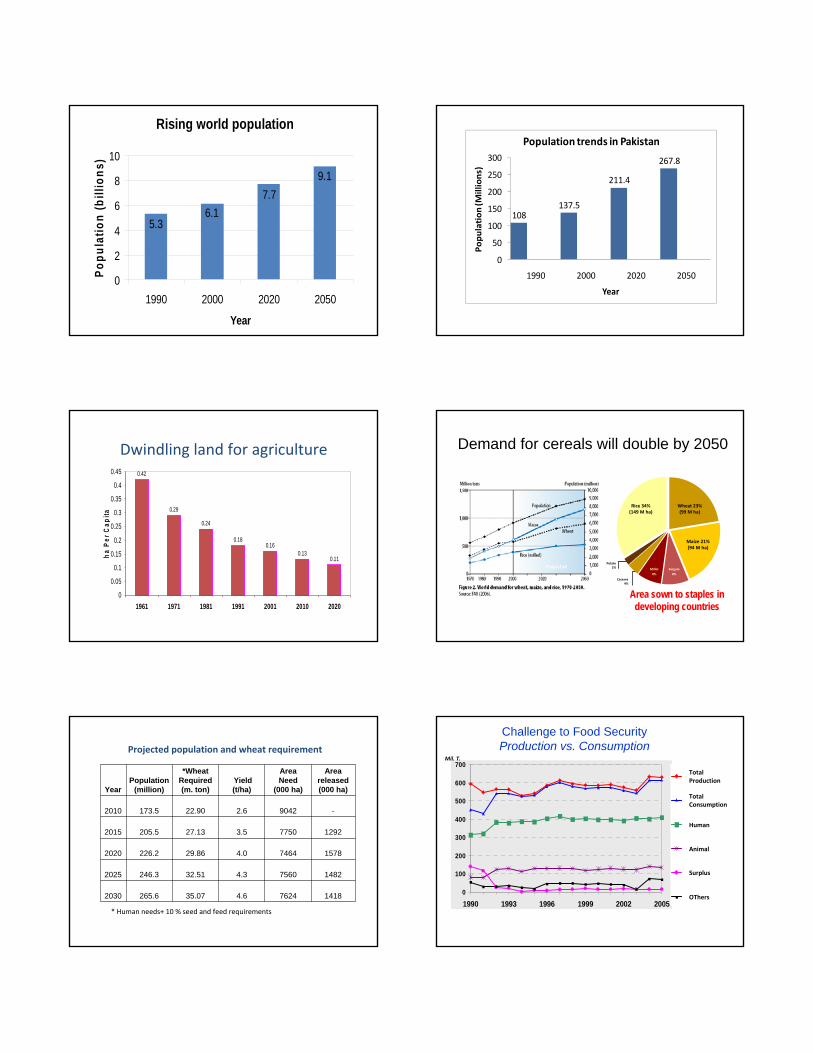
Rising world population
9.17.7
5.36.1
0
2
4
6
8
10
1990 2000 2020 2050
Year
Popu
latio
n (b
illio
ns)
108137.5
211.4
267.8
0
50
100
150
200
250
300
1990 2000 2020 2050
Popu
lation
(Millions)
Year
Population trends in Pakistan
0.42
0.29
0.24
0.160.13
0.11
0.18
0
0.05
0.1
0.15
0.2
0.25
0.3
0.35
0.4
0.45
1961 1971 1981 1991 2001 2010 2020
ha P
er C
apita
Dwindling land for agriculture Demand for cereals will double by 2050
Sorgum
8%
Millet
8%
Cassava4%
Potato2%
Rice 34%(149 M ha)
Wheat 23%(99 M ha)
Maize 21%(94 M ha)
Area sown to staples in developing countries
* Human needs+ 10 % seed and feed requirements
YearPopulation
(million)
*WheatRequired (m. ton)
Yield (t/ha)
Area Need
(000 ha)
Area released (000 ha)
2010 173.5 22.90 2.6 9042 -
2015 205.5 27.13 3.5 7750 1292
2020 226.2 29.86 4.0 7464 1578
2025 246.3 32.51 4.3 7560 1482
2030 265.6 35.07 4.6 7624 1418
Projected population and wheat requirement
Challenge to Food SecurityProduction vs. Consumption
0
100
200
300
400
500
600
700
1990 1993 1996 1999 2002 2005
Total Production
Total Consumption
Human
Animal
Surplus
OThers
Mil. T.
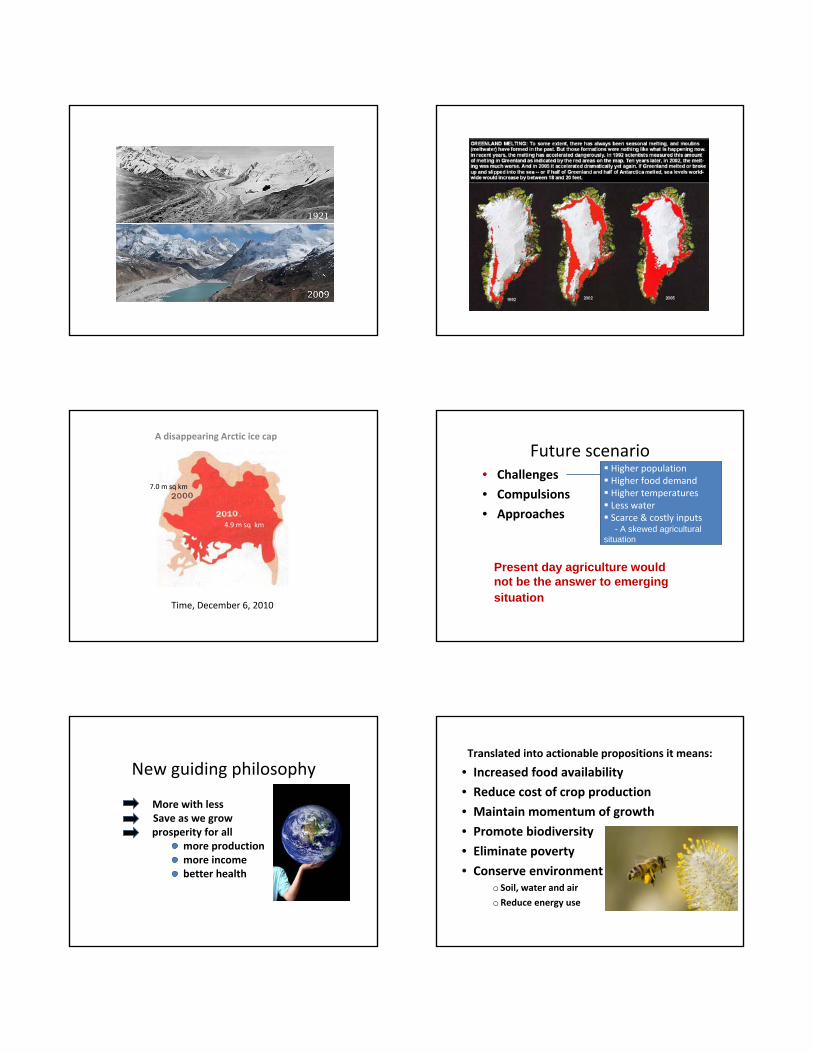
Rising temperatures and crop production• Land reclassification by 2050
• 1 ˚C rise would mean ≈ 7 % wheat yield loss
• 1 ˚C rise would mean ≈10% yield loss in rice
• 44% yield loss in rainfed wheat yield
• Significant pests, pathogen and weeds changes
• Deleterious effects on grain quality and nutrients
• 3 IPCC Climate Models• Increasing Heat Stress (wheat)• 17‐38% Reduction in High Potential Zone
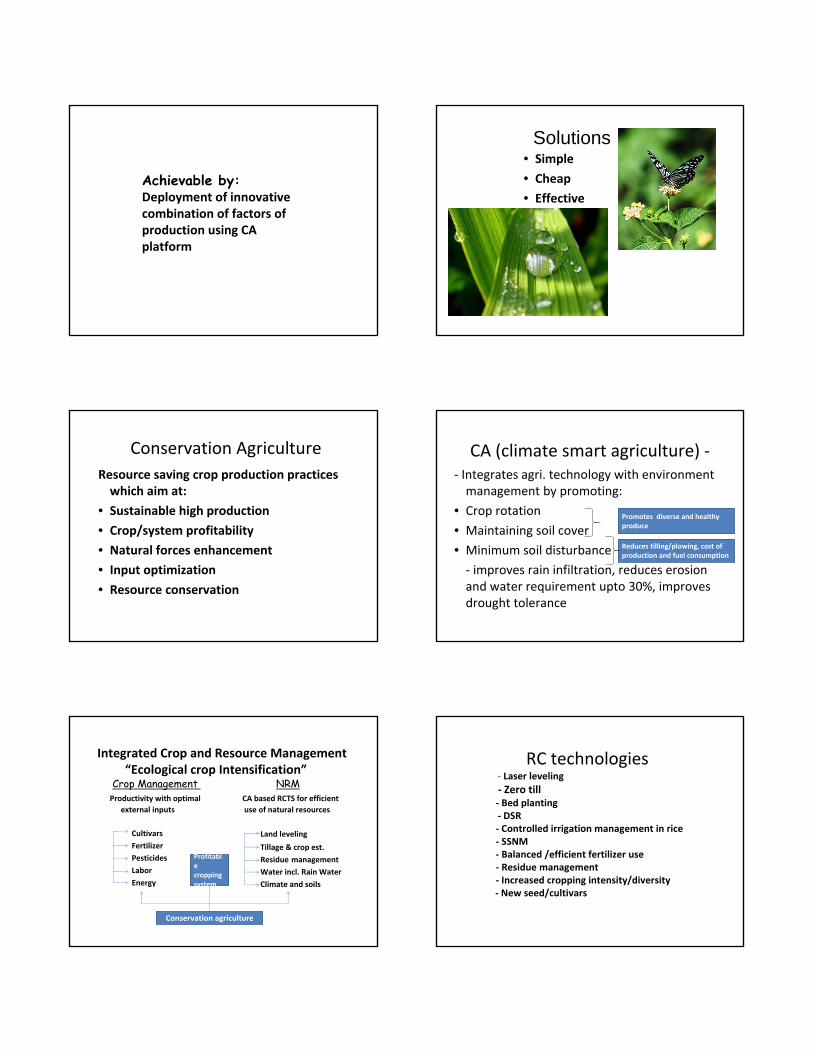
Per capita water availability m3/year/person, Pakistan
PER CAPITA WATER AVAILABILITY VS POPULATION GROWTH
0
1000
2000
3000
4000
5000
6000
1951 1961 1972 1981 1992 2000 2003 2012 2020
Per C
apita
Wat
er a
vaila
bilit
y(In
Cub
ic m
eter
)
0
50
100
150
200
250
Popu
latio
n (In
Mill
ions
)
Population Water
Parameters/Years 1951 1961 1972 1981 1992 2000 2003 2012 2020
Water availability Per Capita 5650 4000 2800 1900 1700 1400 1200 1000 885
Population 33.7 42.8 65.3 84.2 132.0 140.0 149.0 176.0 216.8
Water scarcity level: 1700 CM /capita
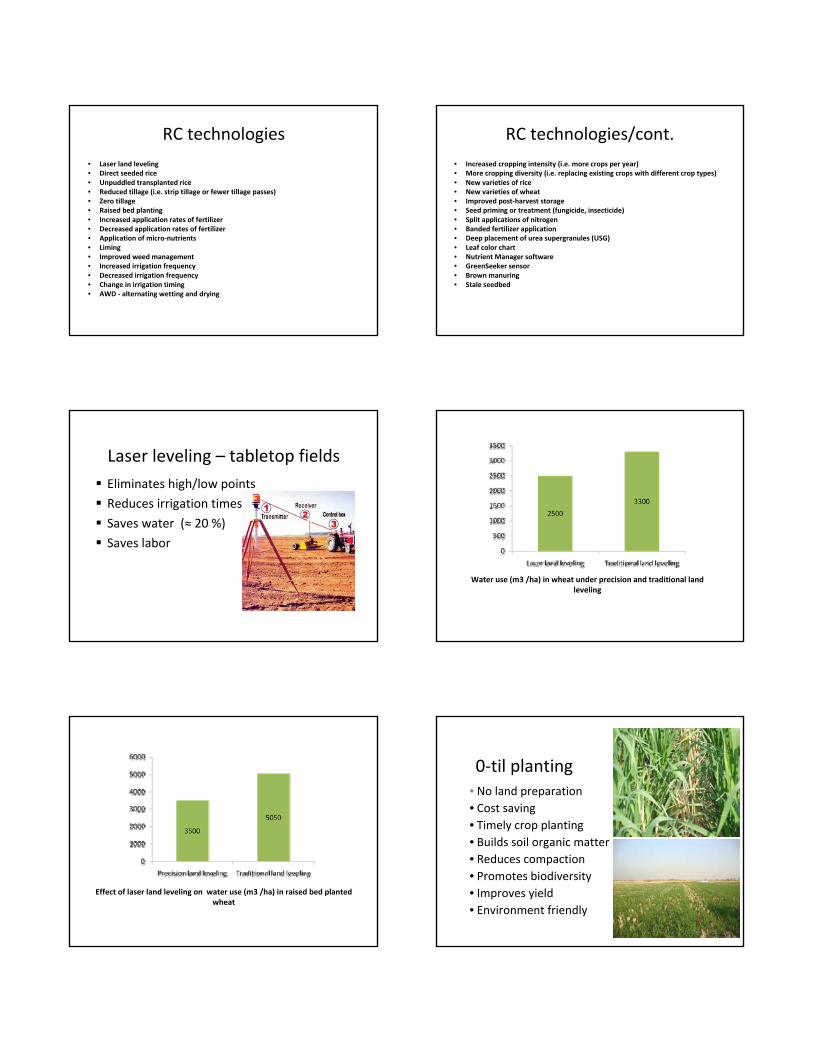
A disappearing Arctic ice cap
Time, December 6, 2010
7.0 m sq km
4.9 m sq km
Future scenario • Challenges
• Compulsions
• Approaches
Present day agriculture would not be the answer to emerging situation
Higher populationHigher food demandHigher temperaturesLess waterScarce & costly inputs- A skewed agricultural
situation
New guiding philosophy
More with lessSave as we growprosperity for all
more productionmore incomebetter health
Translated into actionable propositions it means:
• Increased food availability
• Reduce cost of crop production
• Maintain momentum of growth
• Promote biodiversity
• Eliminate poverty
• Conserve environmento Soil, water and air
oReduce energy use
Achievable by:Deployment of innovative combination of factors of production using CA platform
Solutions• Simple
• Cheap
• Effective
Conservation AgricultureResource saving crop production practices which aim at:
• Sustainable high production
• Crop/system profitability
• Natural forces enhancement
• Input optimization
• Resource conservation
CA (climate smart agriculture) ‐‐ Integrates agri. technology with environment management by promoting:
• Crop rotation
• Maintaining soil cover
• Minimum soil disturbance
‐ improves rain infiltration, reduces erosion and water requirement upto 30%, improves drought tolerance
Promotes diverse and healthy produce
Reduces tilling/plowing, cost of production and fuel consumption
Integrated Crop and Resource Management“Ecological crop Intensification”
Crop Management NRMProductivity with optimal CA based RCTS for efficient
external inputs use of natural resources
Cultivars
FertilizerPesticides
Labor
Energy
Land leveling
Tillage & crop est.
Residue managementWater incl. Rain Water
Climate and soils
Profitable cropping system
Conservation agriculture
RC technologies‐ Laser leveling‐ Zero till‐ Bed planting ‐ DSR‐ Controlled irrigation management in rice ‐ SSNM‐ Balanced /efficient fertilizer use ‐ Residue management ‐ Increased cropping intensity/diversity‐ New seed/cultivars
RC technologies• Laser land leveling • Direct seeded rice• Unpuddled transplanted rice • Reduced tillage (i.e. strip tillage or fewer tillage passes) • Zero tillage• Raised bed planting• Increased application rates of fertilizer• Decreased application rates of fertilizer• Application of micro‐nutrients • Liming • Improved weed management• Increased irrigation frequency• Decreased irrigation frequency• Change in irrigation timing• AWD ‐ alternating wetting and drying
RC technologies/cont.• Increased cropping intensity (i.e. more crops per year)• More cropping diversity (i.e. replacing existing crops with different crop types) • New varieties of rice • New varieties of wheat• Improved post‐harvest storage • Seed priming or treatment (fungicide, insecticide)• Split applications of nitrogen• Banded fertilizer application • Deep placement of urea supergranules (USG)• Leaf color chart • Nutrient Manager software• GreenSeeker sensor • Brown manuring• Stale seedbed
Laser leveling – tabletop fieldsEliminates high/low points
Reduces irrigation times
Saves water (≈ 20 %)
Saves labor
Water use (m3 /ha) in wheat under precision and traditional land leveling
Effect of laser land leveling on water use (m3 /ha) in raised bed planted wheat
0‐til planting• No land preparation• Cost saving• Timely crop planting• Builds soil organic matter• Reduces compaction• Promotes biodiversity• Improves yield• Environment friendly
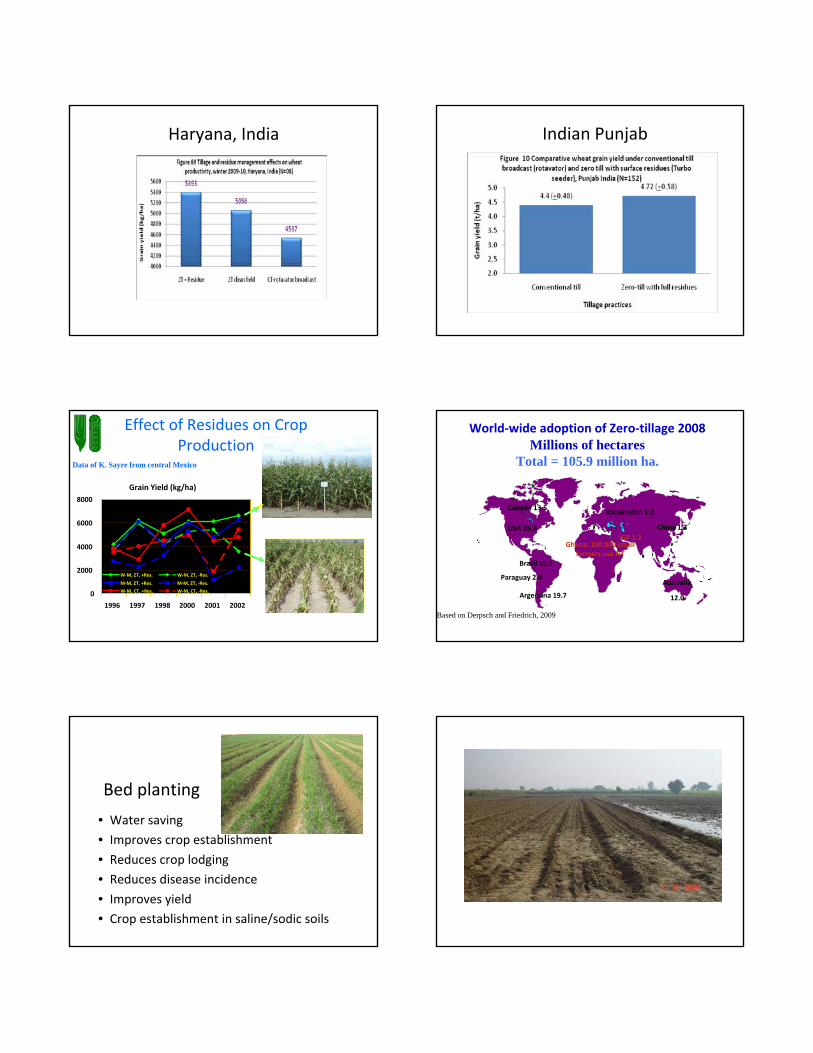
Haryana, India Indian Punjab
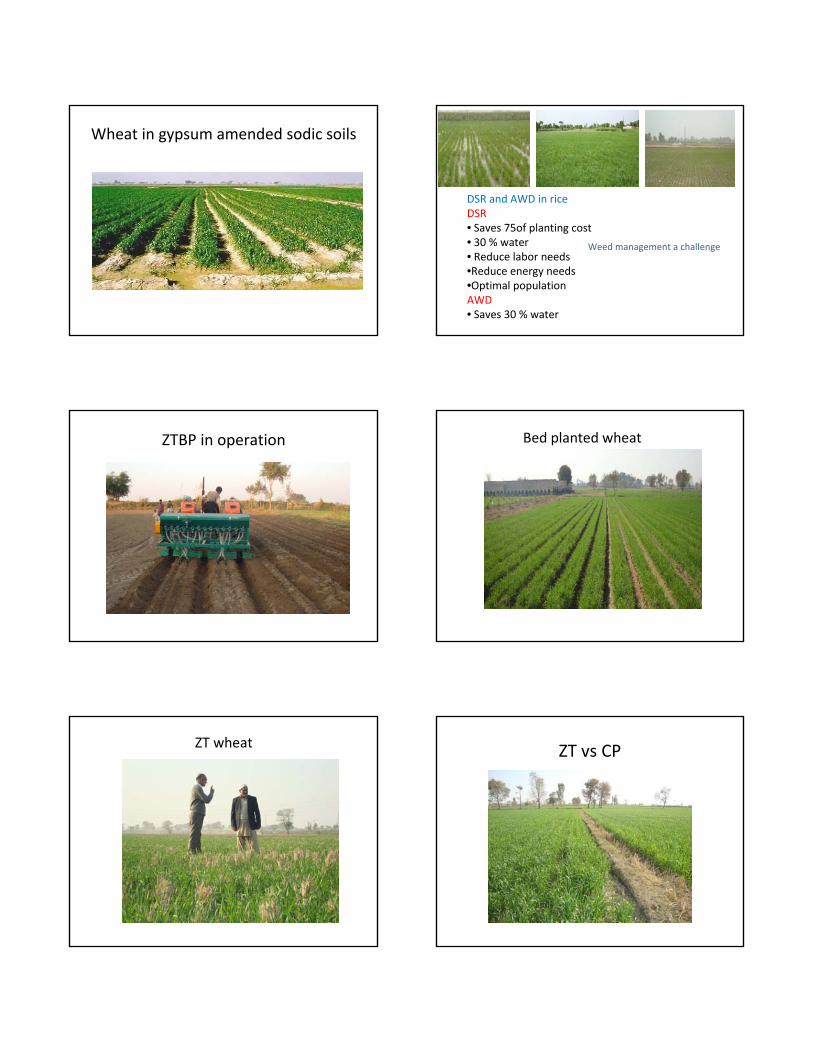
Effect of Residues on Crop Production
Data of K. Sayre from central Mexico
Grain Yield (kg/ha)
0
2000
4000
6000
8000
1996 1997 1998 2000 2001 2002
W‐M, ZT, +Res. W‐M, ZT, ‐Res.
M‐M, ZT, +Res. M‐M, ZT, ‐Res.
W‐M, CT, +Res. W‐M, CT, ‐Res.
World‐wide adoption of Zero‐tillage 2008Millions of hectares
Total = 105.9 million ha.
Australia
12.0
Ghana: 100.000 small farmers use NT
Canada 13.5
USA 26.6
Brazil 25.5
Paraguay 2.4
Argentina 19.7
IGP 1.2China 1.3
Based on Derpsch and Friedrich, 2009
Kazakhstan 1.2
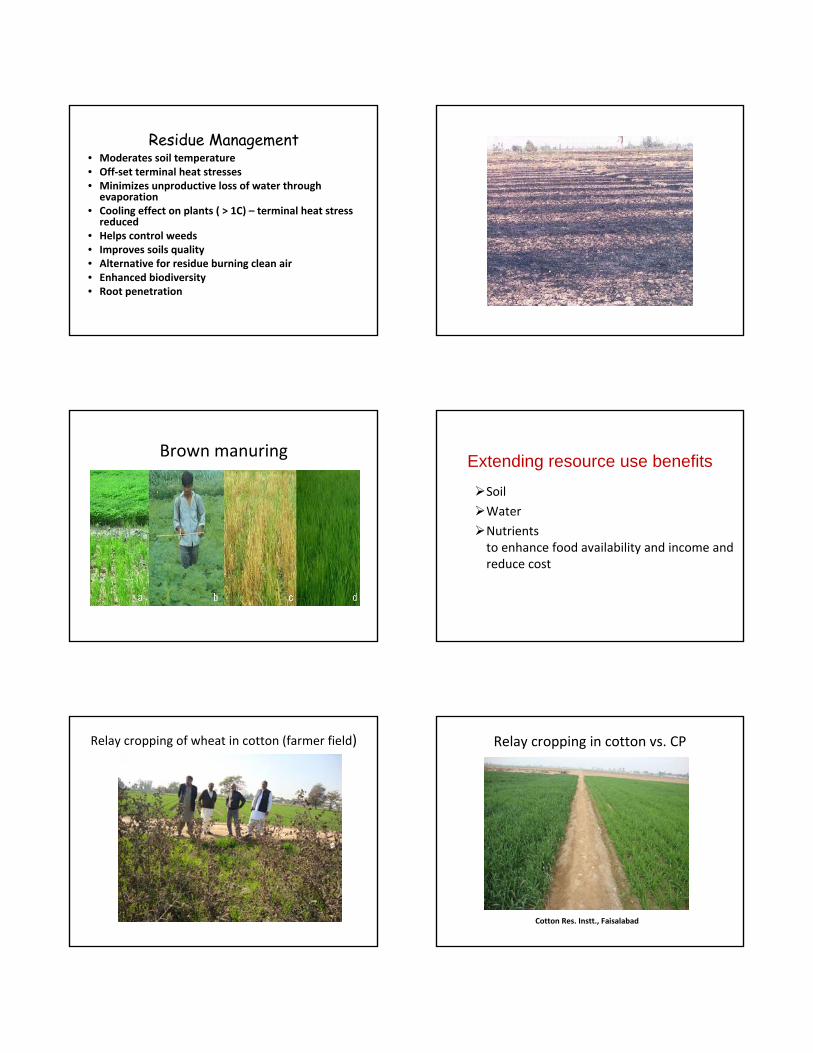
Bed planting
• Water saving
• Improves crop establishment
• Reduces crop lodging
• Reduces disease incidence
• Improves yield
• Crop establishment in saline/sodic soils
Wheat in gypsum amended sodic soils
DSR and AWD in riceDSR• Saves 75of planting cost• 30 % water• Reduce labor needs•Reduce energy needs•Optimal populationAWD• Saves 30 % water
Weed management a challenge
ZTBP in operation Bed planted wheat
ZT wheat ZT vs CP
Residue Management • Moderates soil temperature• Off‐set terminal heat stresses• Minimizes unproductive loss of water through evaporation
• Cooling effect on plants ( > 1C) – terminal heat stress reduced
• Helps control weeds• Improves soils quality• Alternative for residue burning clean air• Enhanced biodiversity• Root penetration
Brown manuring Extending resource use benefits
Soil
Water
Nutrientsto enhance food availability and income and reduce cost
Relay cropping of wheat in cotton (farmer field) Relay cropping in cotton vs. CP
Cotton Res. Instt., Faisalabad
Mungbean relay planting in wheat
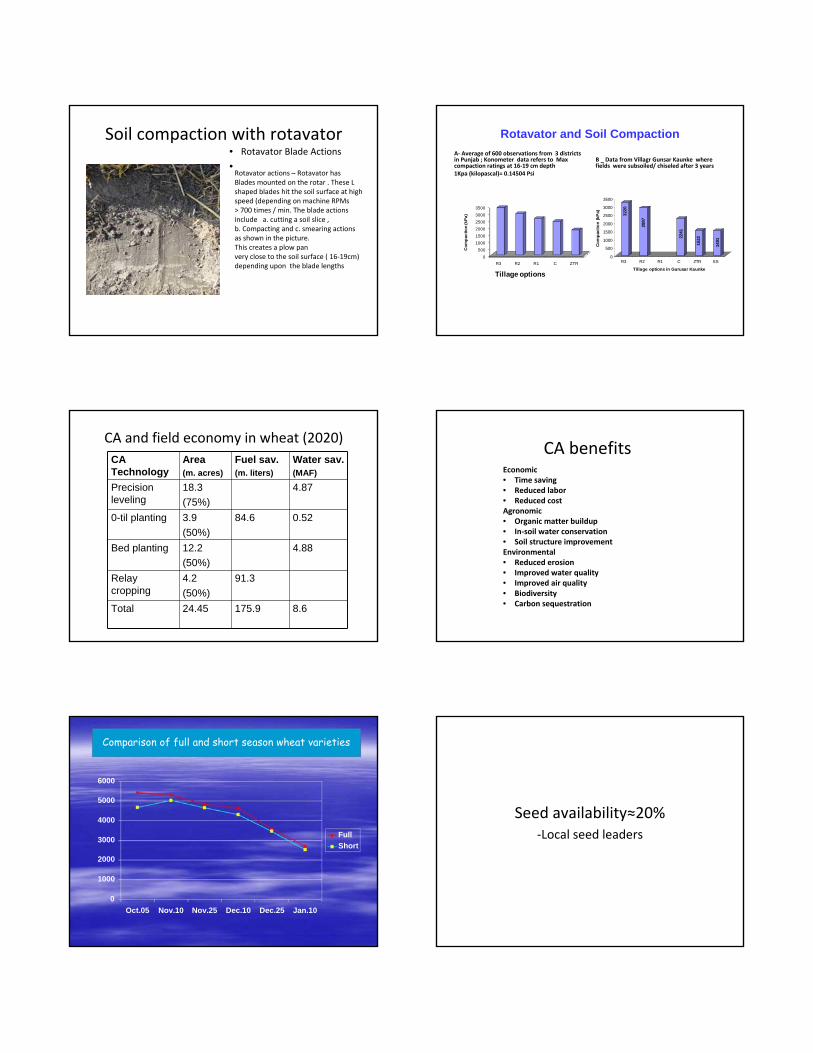
Soil compaction with rotavator• Rotavator Blade Actions
•Rotavator actions – Rotavator has Blades mounted on the rotar . These L shaped blades hit the soil surface at high speed (depending on machine RPMs > 700 times / min. The blade actions include a. cutting a soil slice , b. Compacting and c. smearing actions as shown in the picture. This creates a plow pan very close to the soil surface ( 16‐19cm) depending upon the blade lengths
Rotavator and Soil Compaction A‐ Average of 600 observations from 3 districts in Punjab ; Konometer data refers to Max compaction ratings at 16‐19 cm depth 1Kpa (kilopascal)= 0.14504 Psi
0500
100015002000250030003500
R3 R2 R1 C ZTR
Com
pact
ion
(kPa
)
Tillage options
B _ Data from Villagr Gunsar Kaunke where fields were subsoiled/ chiseled after 3 years
3220
2887
2241
1522
1491
0
500
1000
1500
2000
2500
3000
3500
Com
pact
ion
(kP
a)
R3 R2 R1 C ZTR SS
Tillage options in Gurusar Kaunke
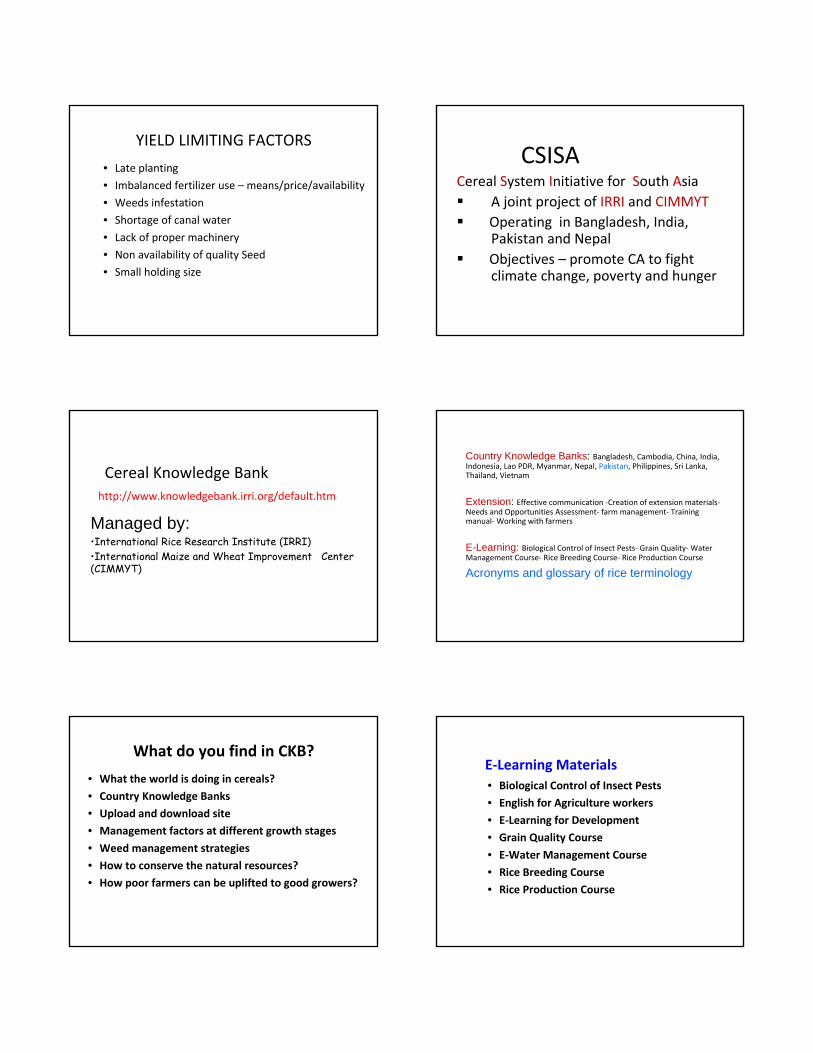
CA and field economy in wheat (2020)CA Technology
Area (m. acres)
Fuel sav.(m. liters)
Water sav.(MAF)
Precision leveling
18.3(75%)
4.87
0-til planting 3.9(50%)
84.6 0.52
Bed planting 12.2(50%)
4.88
Relay cropping
4.2(50%)
91.3
Total 24.45 175.9 8.6
CA benefitsEconomic• Time saving• Reduced labor• Reduced costAgronomic• Organic matter buildup• In‐soil water conservation• Soil structure improvementEnvironmental• Reduced erosion• Improved water quality• Improved air quality• Biodiversity• Carbon sequestration
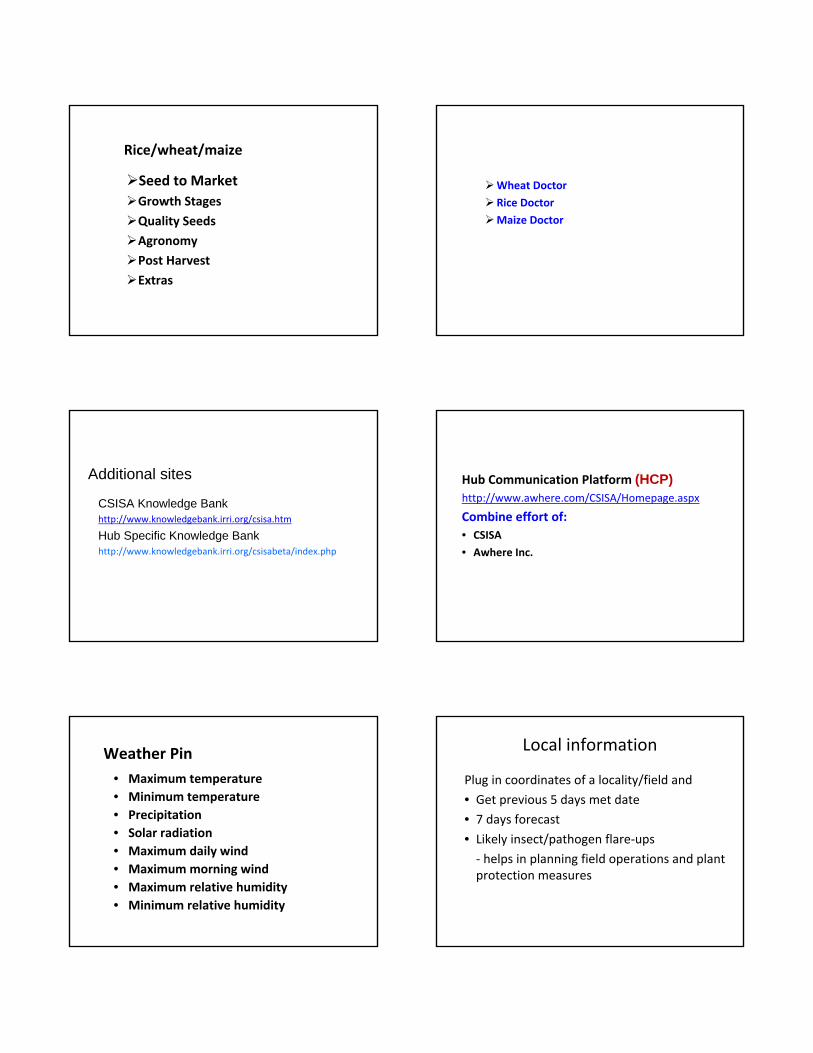
Comparison of full and short season wheat varieties
6000
5000
4000
3000
2000
1000
0 Oct.05 Nov.10 Nov.25 Dec.10 Dec.25 Jan.10
Full Short
Seed availability≈20%‐Local seed leaders
YIELD LIMITING FACTORS
• Late planting
• Imbalanced fertilizer use – means/price/availability
• Weeds infestation
• Shortage of canal water
• Lack of proper machinery
• Non availability of quality Seed
• Small holding size
CSISA Cereal System Initiative for South Asia
A joint project of IRRI and CIMMYTOperating in Bangladesh, India, Pakistan and NepalObjectives – promote CA to fight climate change, poverty and hunger
Managed by:•International Rice Research Institute (IRRI) •International Maize and Wheat Improvement Center (CIMMYT)
Cereal Knowledge Bankhttp://www.knowledgebank.irri.org/default.htm
Country Knowledge Banks: Bangladesh, Cambodia, China, India, Indonesia, Lao PDR, Myanmar, Nepal, Pakistan, Philippines, Sri Lanka, Thailand, Vietnam
Extension: Effective communication ‐Creation of extension materials‐Needs and Opportunities Assessment‐ farm management‐ Training manual‐Working with farmers
E-Learning: Biological Control of Insect Pests‐ Grain Quality‐Water Management Course‐ Rice Breeding Course‐ Rice Production Course
Acronyms and glossary of rice terminology
What do you find in CKB?
• What the world is doing in cereals?
• Country Knowledge Banks
• Upload and download site
• Management factors at different growth stages
• Weed management strategies
• How to conserve the natural resources?
• How poor farmers can be uplifted to good growers?
E‐Learning Materials• Biological Control of Insect Pests
• English for Agriculture workers
• E‐Learning for Development
• Grain Quality Course
• E‐Water Management Course
• Rice Breeding Course
• Rice Production Course
Rice/wheat/maize
Seed to MarketGrowth Stages
Quality Seeds
Agronomy
Post Harvest
Extras
Wheat Doctor
Rice Doctor
Maize Doctor
Additional sites
CSISA Knowledge Bankhttp://www.knowledgebank.irri.org/csisa.htm
Hub Specific Knowledge Bankhttp://www.knowledgebank.irri.org/csisabeta/index.php
Hub Communication Platform (HCP)http://www.awhere.com/CSISA/Homepage.aspx
Combine effort of:• CSISA
• Awhere Inc.
Weather Pin • Maximum temperature• Minimum temperature• Precipitation• Solar radiation• Maximum daily wind• Maximum morning wind• Maximum relative humidity• Minimum relative humidity
Local information
Plug in coordinates of a locality/field and
• Get previous 5 days met date
• 7 days forecast
• Likely insect/pathogen flare‐ups
‐ helps in planning field operations and plant protection measures
Pakistan AMAP‐ downloadable
Following information in map forms is available:• Political (Admin, country)• Demographic (populated places, urbanized points)• Ecological ( grass type, crop land, tundra and marshland)• Hydrographic (water points, water courses and inland water)• Infrastructure (airports, transportation, mines, pipelines, rail
roads)• Topographic (elevation points and contours)• IWMI climate data (month wise precipitation, PET, min/max
temperature)
AWhere Map- Jan min. temperature
Make maps ‐ changes in water table depth
Per kg water use in selected crops1 kg wheat 1 kg rice 1 kg maize 1kg Sugar cane
1350 L 3,000 – 5,000 L 900 L 170 L
3000 Cal Daily req.
30000 beaf cal
300 000 Corn Cal
30 000 000 Solar cal
1.5 acre corn Thank you for your attention