Data Mining Oriented CRM Systems Based on MUSASHI: C- · PDF fileData Mining Oriented CRM...
22
Data Mining Oriented CRM Systems Based on MUSASHI: C-MUSASHI Katsutoshi Yada 1 , Yukinobu Hamuro 2 , Naoki Katoh 3 , Takashi Washio 4 , Issey Fusamoto 1 , Daisuke Fujishima 1 , and Takaya Ikeda 1 1 Faculty of Commerce, Kansai University, 3-3-35, Yamate, Suita, Osaka 564-8680, Japan {yada, da00587, da00591, da00039}@kansai-u.ac.jp http://www2.ipcku.kansai-u.ac.jp/~yada/ 2 Department of Business administration, Osaka Sangyo University, 3-1-1 Nakagaito, Daito, Osaka, 567-8530 Japan [email protected] 3 Graduate School of Engineering, Kyoto University, Kyoto University Katsura, Nishikyo-ku, Kyoto, 615-8540 Japan [email protected] 4 Institute for the Scientific and Industrial Research, Osaka University 8-1 Mihogaoka, Ibaraki, Osaka, 567-0047 Japan [email protected] Abstract. MUSASHI is a set of commands which enables us to effi- ciently execute various types of data manipulations in a flexible manner, mainly aiming at data processing of huge amount of data required for data mining. Data format which MUSASHI can deal with is either an XML table written in XML or plain text file with table structure. In this paper we shall present a business application system of MUSASHI, called C-MUSASHI, dedicated to CRM oriented systems. Integrating a large amount of customer purchase histories in XML databases with the marketing tools and data mining technology based on MUSASHI, C-MUSASHI offers various basic tools for customer analysis and store management based on which data mining oriented CRM systems can be developed at extremely low cost. We apply C-MUSASHI to supermarkets and drugstores in Japan to discover useful knowledge for their market- ing strategy and present possibility to construct useful CRM systems at extremely low cost by introducing MUSASHI. 1 Introduction MUSASHI is an open-source software that provides a set of commands with which various types of data manipulations for a large amount of data mainly required for data mining in business field can be executed in an flexible manner Research of this paper is partly supported by the Grant-in-Aid for Scientific Research on Priority Areas (2) by the Ministry of Education, Science, Sports and Culture of Japan and the Kansai University Special Research fund, 2002. S. Tsumoto et al. (Eds.): AM 2003, 3430, pp. 152–173, 2005. c Springer-Verlag Berlin Heidelberg 2005 LNAI
Transcript of Data Mining Oriented CRM Systems Based on MUSASHI: C- · PDF fileData Mining Oriented CRM...
Data Mining Oriented CRM Systems Based on
MUSASHI: C-MUSASHI �
Katsutoshi Yada1, Yukinobu Hamuro2, Naoki Katoh3, Takashi Washio4,Issey Fusamoto1, Daisuke Fujishima1, and Takaya Ikeda1
1 Faculty of Commerce, Kansai University,3-3-35, Yamate, Suita, Osaka 564-8680, Japan
{yada, da00587, da00591, da00039}@kansai-u.ac.jphttp://www2.ipcku.kansai-u.ac.jp/~yada/
2 Department of Business administration, Osaka Sangyo University,3-1-1 Nakagaito, Daito, Osaka, 567-8530 Japan
[email protected] Graduate School of Engineering, Kyoto University,
Kyoto University Katsura, Nishikyo-ku, Kyoto, 615-8540 [email protected]
4 Institute for the Scientific and Industrial Research, Osaka University8-1 Mihogaoka, Ibaraki, Osaka, 567-0047 Japan
Abstract. MUSASHI is a set of commands which enables us to effi-ciently execute various types of data manipulations in a flexible manner,mainly aiming at data processing of huge amount of data required fordata mining. Data format which MUSASHI can deal with is either anXML table written in XML or plain text file with table structure. Inthis paper we shall present a business application system of MUSASHI,called C-MUSASHI, dedicated to CRM oriented systems. Integratinga large amount of customer purchase histories in XML databases withthe marketing tools and data mining technology based on MUSASHI,C-MUSASHI offers various basic tools for customer analysis and storemanagement based on which data mining oriented CRM systems can bedeveloped at extremely low cost. We apply C-MUSASHI to supermarketsand drugstores in Japan to discover useful knowledge for their market-ing strategy and present possibility to construct useful CRM systems atextremely low cost by introducing MUSASHI.
1 Introduction
MUSASHI is an open-source software that provides a set of commands withwhich various types of data manipulations for a large amount of data mainlyrequired for data mining in business field can be executed in an flexible manner� Research of this paper is partly supported by the Grant-in-Aid for Scientific Research
on Priority Areas (2) by the Ministry of Education, Science, Sports and Culture ofJapan and the Kansai University Special Research fund, 2002.
S. Tsumoto et al. (Eds.): AM 2003, 3430, pp. 152–173, 2005.c© Springer-Verlag Berlin Heidelberg 2005
LNAI
[11][3][4][5]. We have developed a data mining oriented CRM system that runson MUSASHI by integrating several marketing tools and data mining technol-ogy. Discussing the cases regarding simple customer management in Japanesesupermarkets and drugstores, we shall describe general outlines, components,and analytical tools for CRM system which we have developed.
With the progress of deflation in recent Japanese economy, retailers in Japanare now under competitive environment and severe pressure. Many of these enter-prises are now trying to encompass and maintain their loyal customers throughthe introduction of FSP (Frequent Shoppers Program) [6][14]. FSP is definedas one of the CRM systems to accomplish effective sales promotion by accu-mulating purchase history of the customers with membership cards in its owndatabase and by recognizing the nature and the behavior of the loyal customers.However, it is very rare that CRM system such as FSP has actually contributedto successful business activities of the enterprises in recent years.
There are several reasons why the existing CRM system cannot contribute tothe acquisition of customers and to the attainment of competitive advantage inthe business. First of all, the cost to construct CRM system is very high. In fact,some of the enterprises have actually spent a large amount of money merely forthe construction of data warehouse to accumulate purchase history data of thecustomers and, as a result, no budget is left for carrying out customer analysis.Secondly, it happens very often that although data are actually accumulated,techniques, software and human resources in their firms to analyze these data arein shortage, and thus the analysis of the customers is not in progress. Therefore,in many cases, enterprises are simply accumulat-ing the data but do not carryout the analysis of the customers.
In this paper, we shall introduce a CRM system, named C-MUSASHI, whichcan be constructed at very low cost by the use of the open-source softwareMUSASHI, and thus can be adopted freely even by a small enterprise. C-MUSASHI consists of three components, basic tools for customer analysis, storemanagement systems and data mining oriented CRM systems. These compo-nents have been developed through joint research activities with various typesof enterprises. With C-MUSASHI, it is possible to carry out the analysis of thecustomers without investing a large amount of budget for building up a newanalytical system. In this paper we will explain the components of C-MUSASHIand cases where C-MUSASHI is applied to a large amount of customer historydata of supermarkets and drugstores in Japan to discover useful knowledge formarketing strategy.
2 C-MUSASHI in Retailers
2.1 MUSASHI and Operation Systems
MUSASHI, the Mining Utilities and System Architecture for Scalable processingof Historical data, is a data mining platform [3][5] that efficiently and flexiblyprocesses large-scale data that has been described in XML data. One of its re-
Data Mining Oriented CRM Systems Based on MUSASHI: C-MUSASHI 153
amounts of raw data in the knowledge discovery process. The development ofMUSASHI has been progressed as an open source software, and thus everybodycan download it freely from [11].
MUSASHI has a set of small data processing commands designed for retriev-ing and processing large datasets efficiently for various purposes such as dataextraction, cleaning, reporting and data mining. Such data processing can beexecuted simply by running MUSASHI commands as a shell script. These com-mands also includes various data mining commands such as sequential mining,association rule, decision tree, graph mining and clustering commands.
MUSASHI uses XML as a data structure to integrate multiple databases, bywhich various types of data can be represented. MUSASHI makes it feasible tocarry out the flexible and low-cost integration of the structured and vast businessdata in companies.
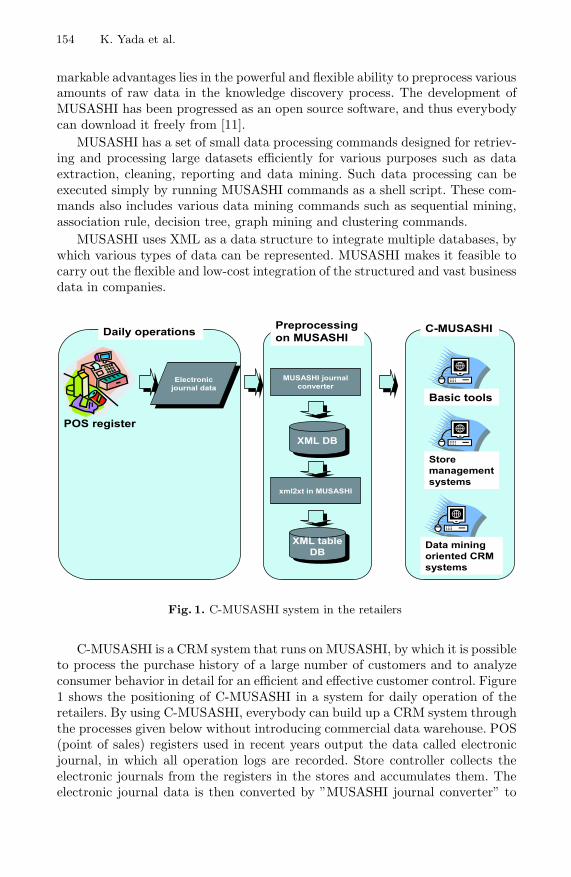
Fig. 1. C-MUSASHI system in the retailers
C-MUSASHI is a CRM system that runs on MUSASHI, by which it is possibleto process the purchase history of a large number of customers and to analyzeconsumer behavior in detail for an efficient and effective customer control. Figure1 shows the positioning of C-MUSASHI in a system for daily operation of theretailers. By using C-MUSASHI, everybody can build up a CRM system throughthe processes given below without introducing commercial data warehouse. POS(point of sales) registers used in recent years output the data called electronicjournal, in which all operation logs are recorded. Store controller collects theelectronic journals from the registers in the stores and accumulates them. Theelectronic journal data is then converted by ”MUSASHI journal converter” to
markable advantages lies in the powerful and flexible ability to preprocess various
154 K. Yada et al.
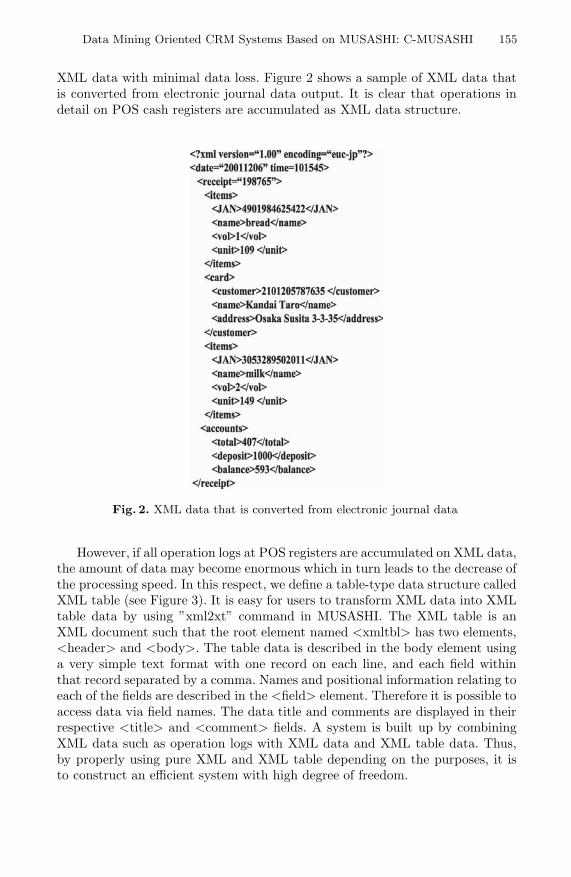
XML data with minimal data loss. Figure 2 shows a sample of XML data thatis converted from electronic journal data output. It is clear that operations indetail on POS cash registers are accumulated as XML data structure.
Fig. 2. XML data that is converted from electronic journal data
However, if all operation logs at POS registers are accumulated on XML data,the amount of data may become enormous which in turn leads to the decrease ofthe processing speed. In this respect, we define a table-type data structure calledXML table (see Figure 3). It is easy for users to transform XML data into XMLtable data by using ”xml2xt” command in MUSASHI. The XML table is anXML document such that the root element named <xmltbl> has two elements,<header> and <body>. The table data is described in the body element usinga very simple text format with one record on each line, and each field withinthat record separated by a comma. Names and positional information relating toeach of the fields are described in the <field> element. Therefore it is possible toaccess data via field names. The data title and comments are displayed in theirrespective <title> and <comment> fields. A system is built up by combiningXML data such as operation logs with XML data and XML table data. Thus,by properly using pure XML and XML table depending on the purposes, it isto construct an efficient system with high degree of freedom.
Data Mining Oriented CRM Systems Based on MUSASHI: C-MUSASHI 155
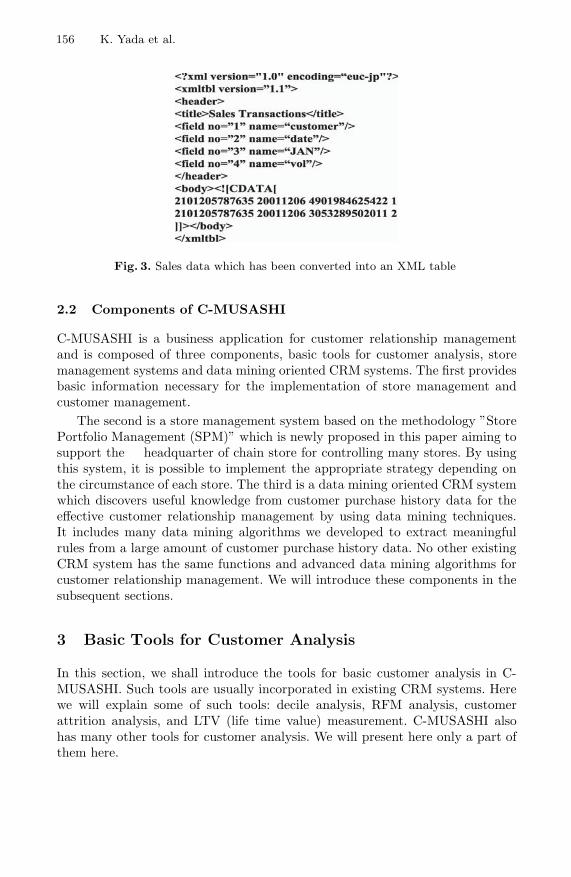
Fig. 3. Sales data which has been converted into an XML table
2.2 Components of C-MUSASHI
C-MUSASHI is a business application for customer relationship managementand is composed of three components, basic tools for customer analysis, storemanagement systems and data mining oriented CRM systems. The first providesbasic information necessary for the implementation of store management andcustomer management.
The second is a store management system based on the methodology ”StorePortfolio Management (SPM)” which is newly proposed in this paper aiming tosupport the headquarter of chain store for controlling many stores. By usingthis system, it is possible to implement the appropriate strategy depending onthe circumstance of each store. The third is a data mining oriented CRM systemwhich discovers useful knowledge from customer purchase history data for theeffective customer relationship management by using data mining techniques.It includes many data mining algorithms we developed to extract meaningfulrules from a large amount of customer purchase history data. No other existingCRM system has the same functions and advanced data mining algorithms forcustomer relationship management. We will introduce these components in thesubsequent sections.
3 Basic ools for Customer Analysis
In this section, we shall introduce the tools for basic customer analysis in C-MUSASHI. Such tools are usually incorporated in existing CRM systems. Herewe will explain some of such tools: decile analysis, RFM analysis, customerattrition analysis, and LTV (life time value) measurement. C-MUSASHI alsohas many other tools for customer analysis. We will present here only a part ofthem here.
T
156 K. Yada et al.
3.1 Decile Analysis
In decile analysis, based on the ranking of the customers derived from the amountof purchase, customers are divided into ten groups of equal size, and then basicindices such as average amount of purchase, number of visits to the store, etc.are computed for each group [6][14]. From this report, it can be understood thatall customers do not have an equal value for the store, but only a small fractionof the customers contribute to most of the profit in the store.
3.2 RFM Analysis
RFM analysis [14][8] is one of the tools most frequently used in the applicationpurpose such as direct-mail marketing. The customers are classified according tothree factors, i.e. recency of the last date of purchase, frequency of purchase, andmonetary factor (purchase amount). Based on this classification, adequate salespromotion is executed for each customer group. For instance, in a supermarket, ifa customer had the highest purchase frequency and the highest purchase amount,and did not visit to the store within one month, sufficient efforts must be madeto bring back this customer from the stores of the competitors.
3.3 Customer Attrition Analysis
This analysis indicates which fraction of customers in a certain customer groupwould continuously visit the store in the next period (e.g. one month later) [8].In other words, this is an analysis to predict how many customers will go awayto the other stores. These output are also used for the calculation of LTV asdescribed below.
3.4 LTV (Life Time Value)
LTV is a net present value of the profit which an average customer in a certaincustomer group brings to a store (an enterprise) within a given period [8][1].It is calculated from the data such as sales amount of the customer group,customer maintaining rate, and discount rate such as the rate of interest on anational bond. Long-term customer strategy should be set up based on LTV,and it is an important factor relating to CRM system. However, the componentfor calculation of LTV prepared in C-MUSASHI is currently very simple and itmust be customized depending on enterprises to use it.
These four tools are minimally required as well as very important for CRMin business field. It is possible to set up various types of marketing strategiesbased on the results of analysis. However, they are general and conventional, andthen do not necessarily bring new knowledge to support differentiation strategyof the enterprise.
Data Mining Oriented CRM Systems Based on MUSASHI: C-MUSASHI 157
4 Store Management Systems Based on SPM
Store management systems in C-MUSASHI are to support for strategic plan-ning of chain stores based on Store Portfolio Management (SPM) we proposed.SPM is the strategic store management methods based on Product PortfolioManagement in strategic management theory in order to support for planningchain store strategy from the viewpoints of an overall firm to provide significantinformation of stores such as store
�
s profitability and effectiveness of store salespromotion.
4.1 Product Portfolio Management in Strategic Management
Product Portfolio Management (PPM) is the strategic method for optimal allo-cation of management resources among multiple SBU (Strategic Business Units)in an enterprise to understand demand and supply of cash flow in each SBU[7]. It is not easy to completely understand demand and supply of cash flow ineach SBU because of the multiplicity and the diversity of the circumstances ofSBU. So ”Growth-Share Matrix” has been employed in PPM in order to recog-nize clusters of SBU which exhibit the similar tendency of cash flow (See Figure4). The growth-share matrix has two dimensions; the one is the growth dimen-sion which is ratio of market growth in which each SBU belongs to, and theother is the share dimension which is relative market share of SBU to the rivalcompany. These two dimensions come from the product lifecycle theory and theexperience curve theory. Product lifecycle theory is to explain the dynamics ofa product market by comparing a product to a living creature, and to proposethat the growth process of product market is composed of four stages; intro-duction, growth, maturity and decline. In PPM the ratio of market growth inthese four stages are associated with demand and supply of cash flow in eachSBU. In the stage of introduction, the rate of market growth is high and thegrowth increases demand of cash flow to expand overall market and to penetratetheir products into the market, while the market growth rate is low in stages ofmaturity and decline which decreases demand of cash flow. Based on the marketgrowth dimension, it is possible to relatively evaluate which SBU demands cashflow in their enterprises.
Experience curve has been known as the linear relationship between thecosts of production and the cumulative production quantity, which was firstobserved by a management consultant at the Boston Consulting Group in 1960s.It appears that the real value-added production cost decline by 20 to 30 percentfor each doubling of cumulative production quantity. If a firm could acquire moreexperience of production by increasing its market share, it could achieve a costadvantage in its market (industry). Therefore high relative market share to arival company which emerges a cost advantage is associated with capability ofSBU to supply cash flow.
Four cells of the Growth-Share Matrix in Figure 4 are named such as ”stars””cash cows,” ”question marks” and ”dogs”. SBU in stars which has high marketshare and high growth rate, not only generates large amounts of cash, but also
158 K. Yada et al.
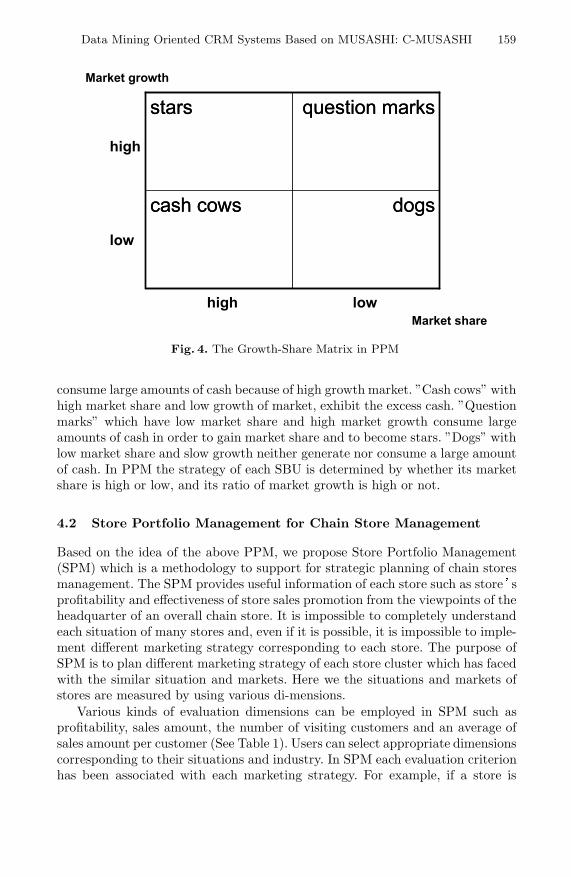
Fig. 4. The Growth-Share Matrix in PPM
consume large amounts of cash because of high growth market. ”Cash cows” withhigh market share and low growth of market, exhibit the excess cash. ”Questionmarks” which have low market share and high market growth consume largeamounts of cash in order to gain market share and to become stars. ”Dogs” withlow market share and slow growth neither generate nor consume a large amountof cash. In PPM the strategy of each SBU is determined by whether its marketshare is high or low, and its ratio of market growth is high or not.
4.2 Store Portfolio Management for Chain Store Management
Based on the idea of the above PPM, we propose Store Portfolio Management(SPM) which is a methodology to support for strategic planning of chain storesmanagement. The SPM provides useful information of each store such as store
�
sprofitability and effectiveness of store sales promotion from the viewpoints of theheadquarter of an overall chain store. It is impossible to completely understandeach situation of many stores and, even if it is possible, it is impossible to imple-ment different marketing strategy corresponding to each store. The purpose ofSPM is to plan different marketing strategy of each store cluster which has facedwith the similar situation and markets. Here we the situations and markets ofstores are measured by using various di-mensions.
Various kinds of evaluation dimensions can be employed in SPM such asprofitability, sales amount, the number of visiting customers and an average ofsales amount per customer (See Table 1). Users can select appropriate dimensionscorresponding to their situations and industry. In SPM each evaluation criterionhas been associated with each marketing strategy. For example, if a store is
Data Mining Oriented CRM Systems Based on MUSASHI: C-MUSASHI 159
recognized as low profitability store, an appropriate pricing strategy has to beimplemented to improve the profitability.
Table 1. List of store’s evaluation dimensions which can be used in SPM
Name of dimension Function
Profitability The ratio of profit to sales amount of a store
Sales amount Sales amount per store and month
# of customers The number of visiting customer in a month
Sales / a customer An average of sales amount per customer ina month
Effectiveness of sales promotion The ratio of waste sales promotion to allsales promotion of the store in a month
4.3 Store Evaluation
It is difficult for the marketing stuff of a chain store to categorize their storesinto a number of clusters by using all the above dimensions because of lowinterpretability of the resulting clusters. According to our experience, it seemsto be appropriate way to use two or three dimensions to clustering stores intosome meaningful groups.
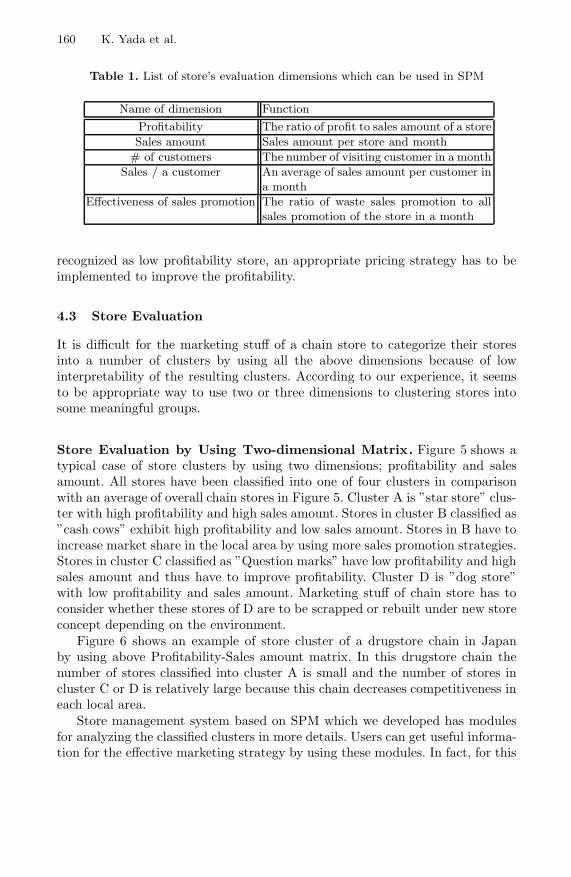
Store Evaluation by Using Two-dimensional Matrix Figure 5 shows atypical case of store clusters by using two dimensions; profitability and salesamount. All stores have been classified into one of four clusters in comparisonwith an average of overall chain stores in Figure 5. Cluster A is ”star store” clus-ter with high profitability and high sales amount. Stores in cluster B classified as”cash cows” exhibit high profitability and low sales amount. Stores in B have toincrease market share in the local area by using more sales promotion strategies.Stores in cluster C classified as ”Question marks” have low profitability and highsales amount and thus have to improve profitability. Cluster D is ”dog store”with low profitability and sales amount. Marketing stuff of chain store has toconsider whether these stores of D are to be scrapped or rebuilt under new storeconcept depending on the environment.
Figure 6 shows an example of store cluster of a drugstore chain in Japanby using above Profitability-Sales amount matrix. In this drugstore chain thenumber of stores classified into cluster A is small and the number of stores incluster C or D is relatively large because this chain decreases competitiveness ineach local area.
Store management system based on SPM which we developed has modulesfor analyzing the classified clusters in more details. Users can get useful informa-tion for the effective marketing strategy by using these modules. In fact, for this
.
160 K. Yada et al.
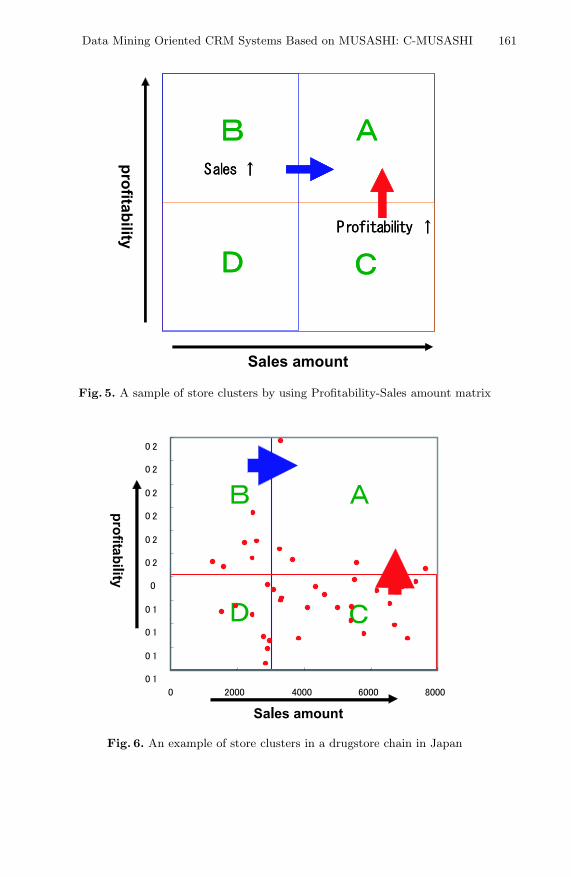
Fig. 5. A sample of store clusters by using Profitability-Sales amount matrix
Fig. 6. An example of store clusters in a drugstore chain in Japan
Data Mining Oriented CRM Systems Based on MUSASHI: C-MUSASHI 161
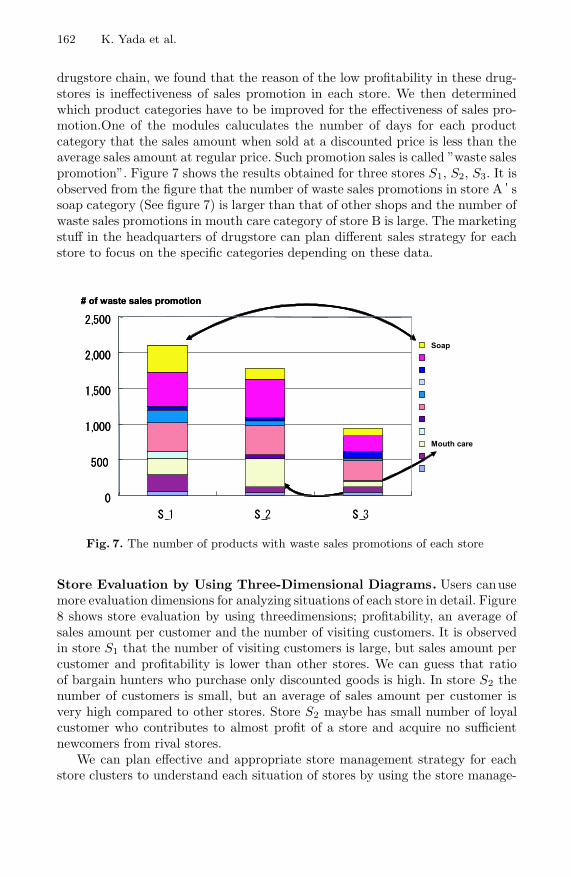
drugstore chain, we found that the reason of the low profitability in these drug-stores is ineffectiveness of sales promotion in each store. We then determinedwhich product categories have to be improved for the effectiveness of sales pro-motion.One of the modules caluculates the number of days for each productcategory that the sales amount when sold at a discounted price is less than theaverage sales amount at regular price. Such promotion sales is called ”waste salespromotion”. Figure 7 shows the results obtained for three stores S1, S2, S3. It isobserved from the figure that the number of waste sales promotions in store A
�
ssoap category (See figure 7) is larger than that of other shops and the number ofwaste sales promotions in mouth care category of store B is large. The marketingstuff in the headquarters of drugstore can plan different sales strategy for eachstore to focus on the specific categories depending on these data.
Fig. 7. The number of products with waste sales promotions of each store
Store Evaluation by Using Three-Dimensional Diagrams Users canusemore evaluation dimensions for analyzing situations of each store in detail. Figure8 shows store evaluation by using threedimensions; profitability, an average ofsales amount per customer and the number of visiting customers. It is observedin store S1 that the number of visiting customers is large, but sales amount percustomer and profitability is lower than other stores. We can guess that ratioof bargain hunters who purchase only discounted goods is high. In store S2 thenumber of customers is small, but an average of sales amount per customer isvery high compared to other stores. Store S2 maybe has small number of loyalcustomer who contributes to almost profit of a store and acquire no sufficientnewcomers from rival stores.
We can plan effective and appropriate store management strategy for eachstore clusters to understand each situation of stores by using the store manage-
.
162 K. Yada et al.
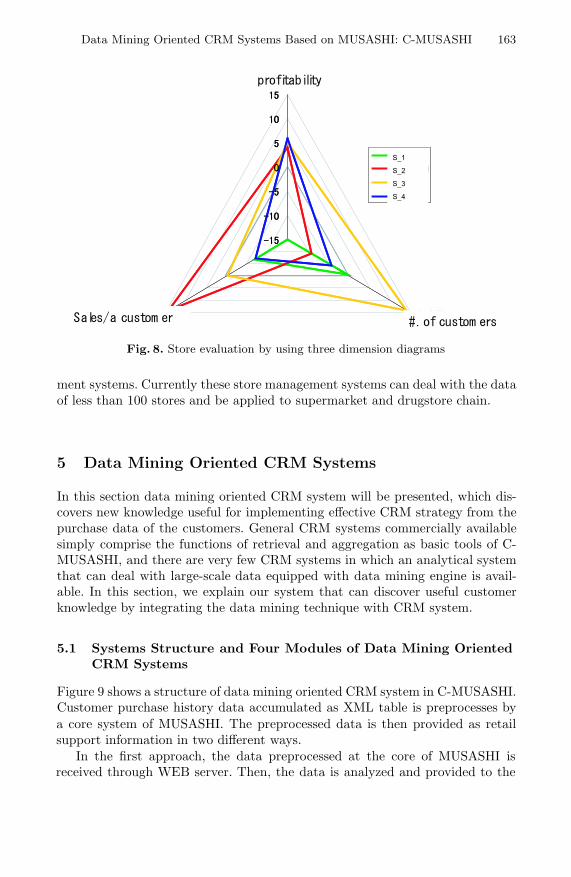
ment systems. Currently these store management systems can deal with the dataof less than 100 stores and be applied to supermarket and drugstore chain.
Fig. 8. Store evaluation by using three dimension diagrams
5 Data Mining Oriented CRM Systems
In this section data mining oriented CRM system will be presented, which dis-covers new knowledge useful for implementing effective CRM strategy from thepurchase data of the customers. General CRM systems commercially availablesimply comprise the functions of retrieval and aggregation as basic tools of C-MUSASHI, and there are very few CRM systems in which an analytical systemthat can deal with large-scale data equipped with data mining engine is avail-able. In this section, we explain our system that can discover useful customerknowledge by integrating the data mining technique with CRM system.
5.1 Systems Structure and Four Modules of Data Mining OrientedCRM Systems
Figure 9 shows a structure of data mining oriented CRM system in C-MUSASHI.Customer purchase history data accumulated as XML table is preprocesses bya core system of MUSASHI. The preprocessed data is then provided as retailsupport information in two different ways.
In the first approach, the data preprocessed at the core of MUSASHI isreceived through WEB server. Then, the data is analyzed and provided to the
Data Mining Oriented CRM Systems Based on MUSASHI: C-MUSASHI 163
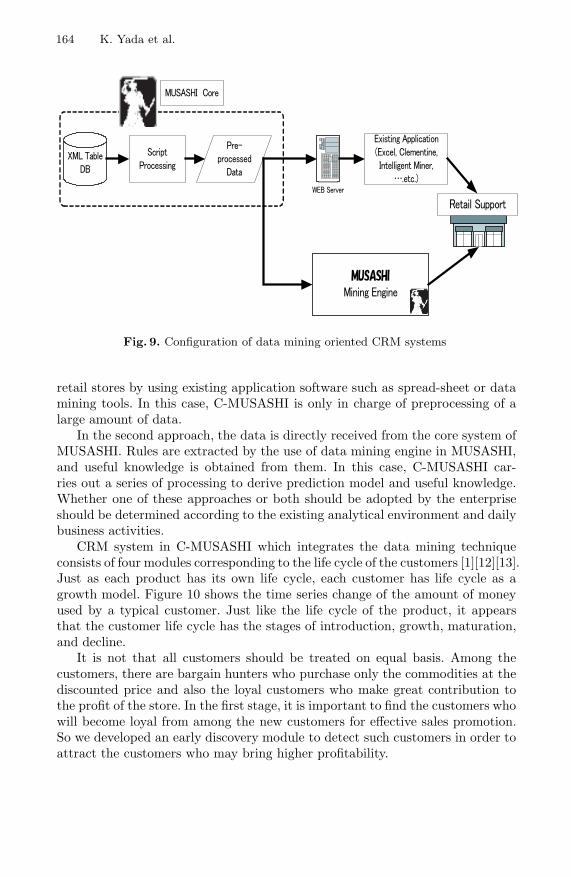
Fig. 9. Configuration of data mining oriented CRM systems
retail stores by using existing application software such as spread-sheet or datamining tools. In this case, C-MUSASHI is only in charge of preprocessing of alarge amount of data.
In the second approach, the data is directly received from the core system ofMUSASHI. Rules are extracted by the use of data mining engine in MUSASHI,and useful knowledge is obtained from them. In this case, C-MUSASHI car-ries out a series of processing to derive prediction model and useful knowledge.Whether one of these approaches or both should be adopted by the enterpriseshould be determined according to the existing analytical environment and dailybusiness activities.
CRM system in C-MUSASHI which integrates the data mining techniqueconsists of four modules corresponding to the life cycle of the customers [1][12][13].Just as each product has its own life cycle, each customer has life cycle as agrowth model. Figure 10 shows the time series change of the amount of moneyused by a typical customer. Just like the life cycle of the product, it appearsthat the customer life cycle has the stages of introduction, growth, maturation,and decline.
It is not that all customers should be treated on equal basis. Among thecustomers, there are bargain hunters who purchase only the commodities at thediscounted price and also the loyal customers who make great contribution tothe profit of the store. In the first stage, it is important to find the customers whowill become loyal from among the new customers for effective sales promotion.So we developed an early discovery module to detect such customers in order toattract the customers who may bring higher profitability.
164 K. Yada et al.
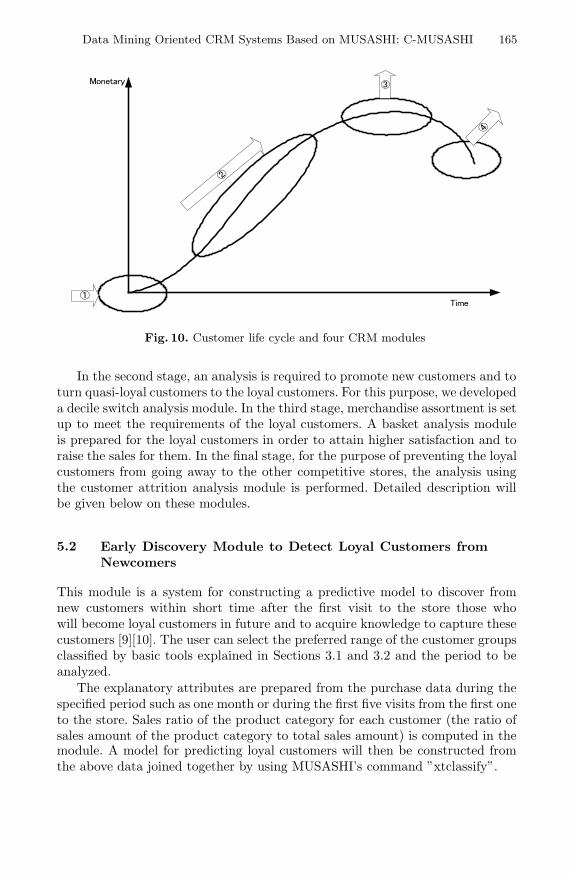
Fig. 10. Customer life cycle and four CRM modules
In the second stage, an analysis is required to promote new customers and toturn quasi-loyal customers to the loyal customers. For this purpose, we developeda decile switch analysis module. In the third stage, merchandise assortment is setup to meet the requirements of the loyal customers. A basket analysis moduleis prepared for the loyal customers in order to attain higher satisfaction and toraise the sales for them. In the final stage, for the purpose of preventing the loyalcustomers from going away to the other competitive stores, the analysis usingthe customer attrition analysis module is performed. Detailed description willbe given below on these modules.
5.2
This module is a system for constructing a predictive model to discover fromnew customers within short time after the first visit to the store those whowill become loyal customers in future and to acquire knowledge to capture thesecustomers [9][10]. The user can select the preferred range of the customer groupsclassified by basic tools explained in Sections 3.1 and 3.2 and the period to beanalyzed.
The explanatory attributes are prepared from the purchase data during thespecified period such as one month or during the first five visits from the first oneto the store. Sales ratio of the product category for each customer (the ratio ofsales amount of the product category to total sales amount) is computed in themodule. A model for predicting loyal customers will then be constructed fromthe above data joined together by using MUSASHI’s command ”xtclassify”.
Early Discovery Module to Detect Loyal Customers fromNewcomers
Data Mining Oriented CRM Systems Based on MUSASHI: C-MUSASHI 165
As a result, the model tells us which category of purchasing features thesenew prospective loyal customers have. Such information provides valuable impli-cation as to how loyal customers are obtained from the competitive stores or todetermine on which product category the emphasis should be put when a newstore will be opened.
5.3 Decile Switch Analysis Module
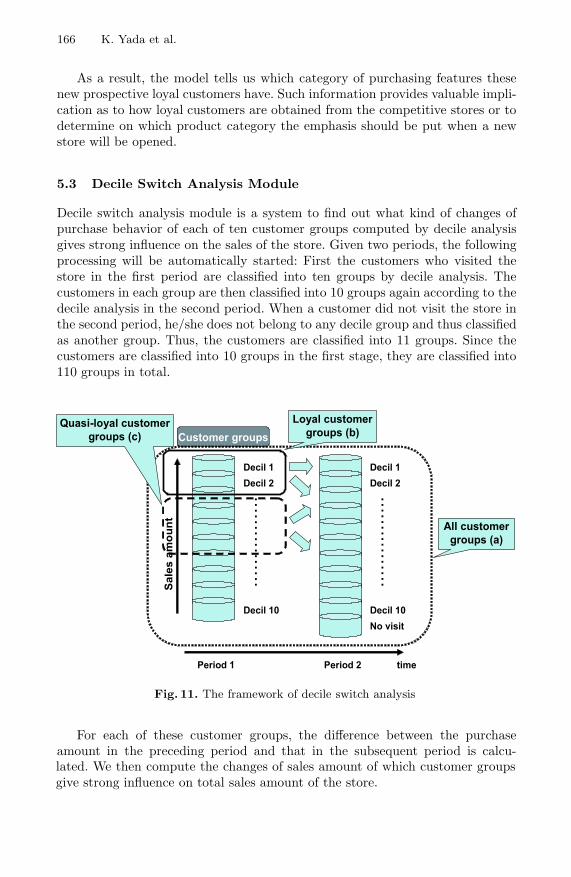
Decile switch analysis module is a system to find out what kind of changes ofpurchase behavior of each of ten customer groups computed by decile analysisgives strong influence on the sales of the store. Given two periods, the followingprocessing will be automatically started: First the customers who visited thestore in the first period are classified into ten groups by decile analysis. Thecustomers in each group are then classified into 10 groups again according to thedecile analysis in the second period. When a customer did not visit the store inthe second period, he/she does not belong to any decile group and thus classifiedas another group. Thus, the customers are classified into 11 groups. Since thecustomers are classified into 10 groups in the first stage, they are classified into110 groups in total.
Fig. 11. The framework of decile switch analysis
For each of these customer groups, the difference between the purchaseamount in the preceding period and that in the subsequent period is calcu-lated. We then compute the changes of sales amount of which customer groupsgive strong influence on total sales amount of the store.
166 K. Yada et al.
Next, judging from the above numerical values (influence on total salesamount of the store), the user decides which of the following data he/she wantsto see, e.g., decile switch of (a) all customers, (b) loyal customers of the store,or (c) quasi-loyal customers (See Figure 11). If the user wants to see the decileswitch of quasi-loyal customers, sales ratio of each product category for therelevant customer group in the preceding period is calculated, and a decisiontree is generated, which shows the difference in the purchased categories be-tween the quasi-loyal customers whose decile increased in the subsequent period(decile-up) and those whose decile value decreased (decile-down). Based on therules obtained from the decision tree, the user can judge which product categoryshould be recommended to quasi-loyal customers in order to increase the totalsales of the store in future.
5.4 Basket Analysis Module of the oyal ustomer
For the purpose of increasing the sales amount of a store, it is the most importantand also minimally required to keep loyal customers exclusively for a store. Ingeneral, the loyal customers have the tendency to continue to visit a particularstore. As far as the merchandises and services to satisfy these customers areprovided, it is easy to continuously keep these customers to the store than tomake efforts to acquire the new customers from the rival stores. This module isto find out the merchandises preferred by loyal customers according to the resultof the basket analysis on their purchase data [2].
From the results obtained by this module, it is possible not only to find outwhich product category the loyal customer prefers, but also to extract the mostfrequently purchased merchandise and to indicate the product belonging to Crank in ABC analysis. In the store control practiced in the past, if sales amountof the products preferred by the loyal customers is not very large, then the prod-uct often tends to disappear from the sales counter. Based on such informationextracted from this module, the store manager can display the particular mer-chandise on the sales counter which loyal customer prefers and can pay specialattention so that the merchandise will not be out of stock.
5.5 Module for Customer Attrition Analysis
Customer attrition analysis module is a system for extracting the purchase be-havior of the loyal customers who left the store and to provide information foreffective sales promotion in order to keep such loyal customers. When the userdefines the loyal customers, the group of the customers is extracted, who hadbeen loyal customers continuously for the past few months and had gone there-after to the other stores. Using the sales ratio of product category preceding theattrition of the customers as explanatory variable, a classification model of thecustomer group is generated. By elucidating which group of customers is moreeasily diverted to the other store and which category of products these customers
L C
Data Mining Oriented CRM Systems Based on MUSASHI: C-MUSASHI 167
had been purchasing, the store manager can obtain useful information on theimprovement of merchandise lineup at the store to keep loyal customers.
Four modules explained above are briefly summarized in Table 2.
Table 2. The summary of four modules in data mining oriented CRM systems
Name of module The purpose of module
Early discovery ofloyal customer
To construct a prediction model to discover potential loyalcustomers from newcomers.
Decile switch analysis To find out what kind of changes of purchase behavior of cus-tomer groups derived from decile analysis give strong effectson the sales of the store.
Basket analysis forloyal customer
To discover the merchandises preferred by loyal customersaccording to the result of the basket analysis to keep themto the store.
Customer attritionanalysis
To extract the purchase behavior of loyal customers who leftthe store and to provide information for effective sales pro-motion in order to keep loyal customers.
6 Case Studies of C-MUSASHI in Japanese upermarket
In this section we will discuss the cases of C-MUSASHI in real business world.Since we cannot deal with all of the cases of the four modules in this paper, wewill introduce the cases of decile switch analysis and customer attrition analysismodules in a large-scale supermarket.
6.1
There is a chain store of supermarket in Japan, selling a wide range of goodsincluding fresh foods, groceries and medicine. Recently, the sales amount inalmost all stores of them has been decreased because of the price reduction underlocal competitive market and deflation in Japan. However, one store graduallyincreased the sales amount more than those of the other stores during the periodwe are concerned with in this case. The purpose of this analysis is to find outwhich customer groups had positive effects on sales amount of the store andthen to discover the feature of the product categories they purchased, in orderto implement the effective sales promotions in other stores for increasing totalsales of a chain store.
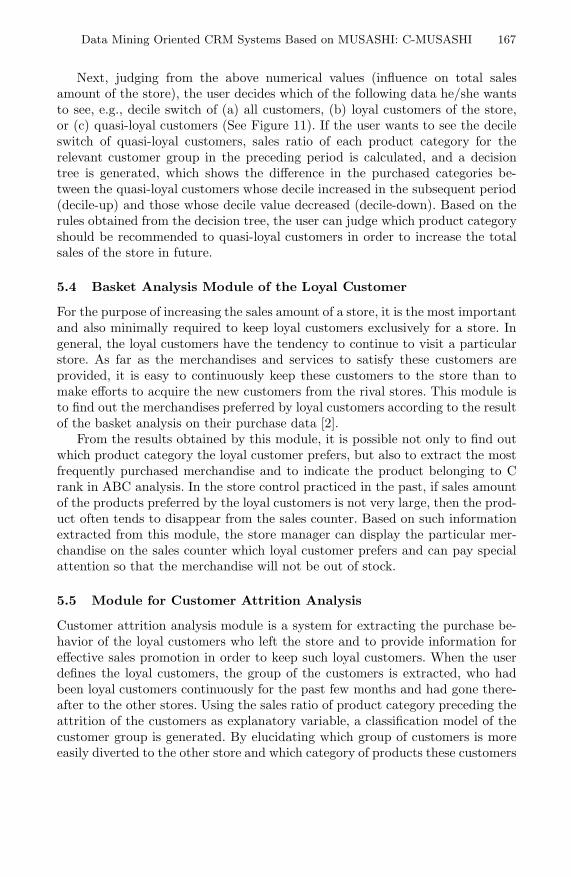
First, two periods, i.e. April and May of 2003, were set up for analysis by themarketing stuff in this supermarket. Figure 12 shows the number of customers
S
The Case of Customer Growth by Using Decile SwitchAnalysis Module in a Supermarket
168 K. Yada et al.
categorized in each decile switch group. There are many customers staying indecile 1 in both April and May, who are the most important loyal customersto the store. However they do not have so strong effects on sales of this storethough the number of them is larger than that of the other decile switch groups.
Fig. 12. The number of customers in each decile group
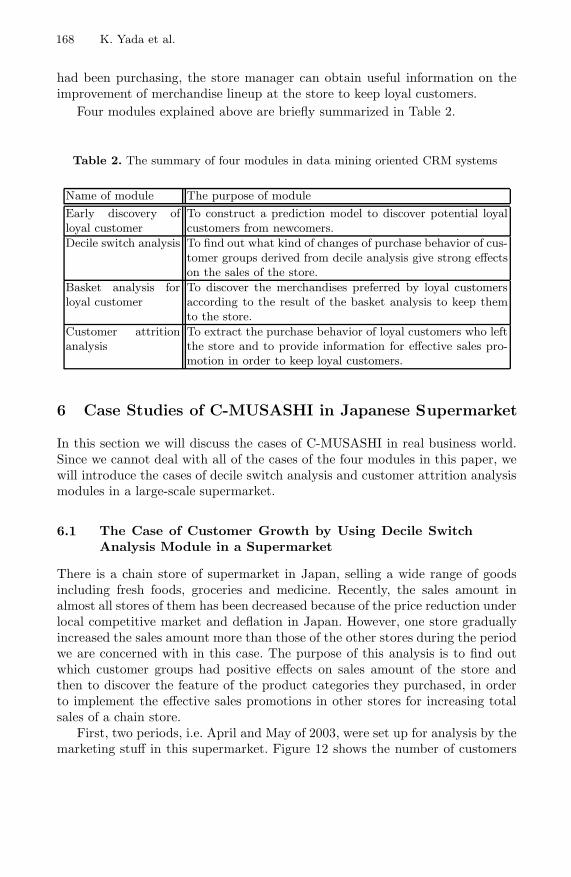
Figure 13 shows the changes of the purchase amounts in April and May of thecustomer groups classified according to the decile values of both periods. In thefigure, the portion indicated by a circle shows that the sales for the quasi-loyalcustomer groups (the customers with decile 2-4) in April increases in May. Fromthe figure, it is easy to observe that the sales increase of quasi-loyal customersmakes great contribution to the increase of the total sales amount of the store.
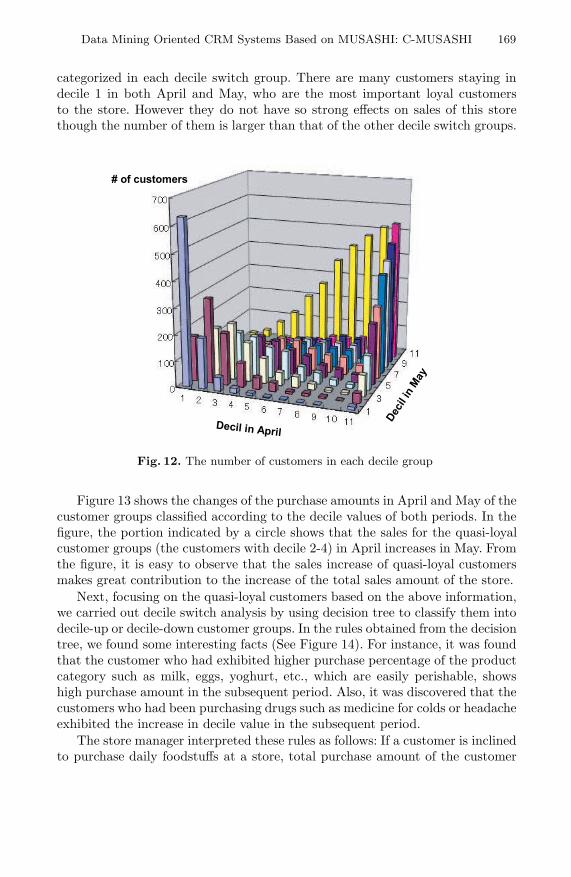
Next, focusing on the quasi-loyal customers based on the above information,we carried out decile switch analysis by using decision tree to classify them intodecile-up or decile-down customer groups. In the rules obtained from the decisiontree, we found some interesting facts (See Figure 14). For instance, it was foundthat the customer who had exhibited higher purchase percentage of the productcategory such as milk, eggs, yoghurt, etc., which are easily perishable, showshigh purchase amount in the subsequent period. Also, it was discovered that thecustomers who had been purchasing drugs such as medicine for colds or headacheexhibited the increase in decile value in the subsequent period.
The store manager interpreted these rules as follows: If a customer is inclinedto purchase daily foodstuffs at a store, total purchase amount of the customer
Data Mining Oriented CRM Systems Based on MUSASHI: C-MUSASHI 169
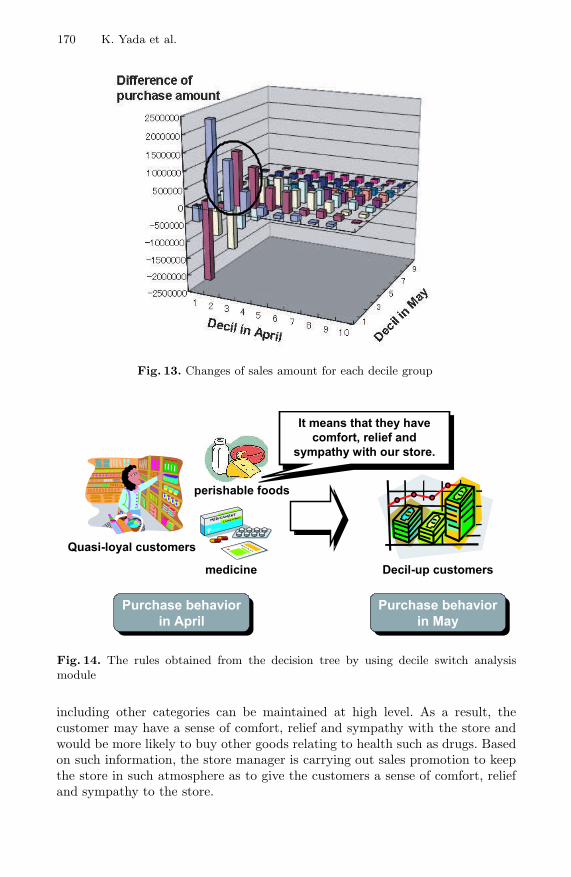
Fig. 13. Changes of sales amount for each decile group
Fig. 14. The rules obtained from the decision tree by using decile switch analysismodule
including other categories can be maintained at high level. As a result, thecustomer may have a sense of comfort, relief and sympathy with the store andwould be more likely to buy other goods relating to health such as drugs. Basedon such information, the store manager is carrying out sales promotion to keepthe store in such atmosphere as to give the customers a sense of comfort, reliefand sympathy to the store.
170 K. Yada et al.
6.2
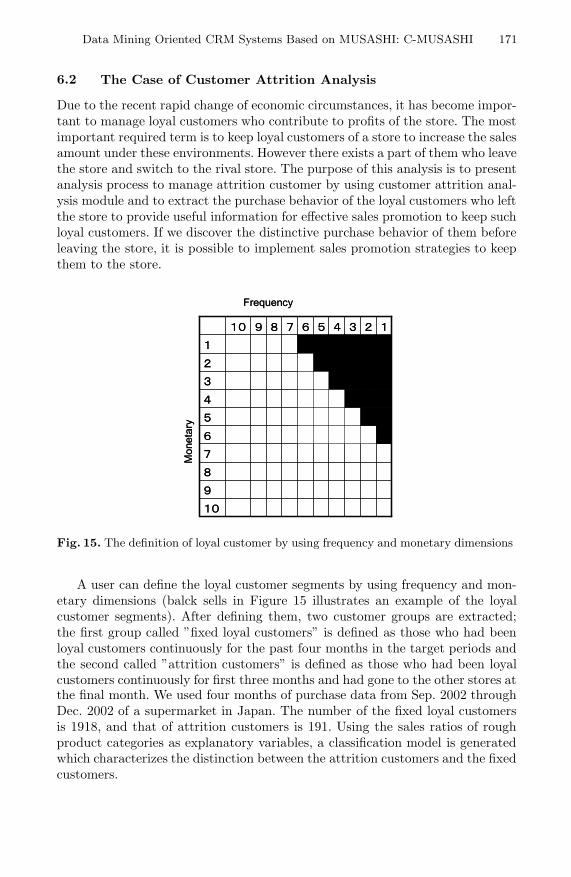
Due to the recent rapid change of economic circumstances, it has become impor-tant to manage loyal customers who contribute to profits of the store. The mostimportant required term is to keep loyal customers of a store to increase the salesamount under these environments. However there exists a part of them who leavethe store and switch to the rival store. The purpose of this analysis is to presentanalysis process to manage attrition customer by using customer attrition anal-ysis module and to extract the purchase behavior of the loyal customers who leftthe store to provide useful information for effective sales promotion to keep suchloyal customers. If we discover the distinctive purchase behavior of them beforeleaving the store, it is possible to implement sales promotion strategies to keepthem to the store.
Fig. 15. The definition of loyal customer by using frequency and monetary dimensions
A user can define the loyal customer segments by using frequency and mon-etary dimensions (balck sells in Figure 15 illustrates an example of the loyalcustomer segments). After defining them, two customer groups are extracted;the first group called ”fixed loyal customers” is defined as those who had beenloyal customers continuously for the past four months in the target periods andthe second called ”attrition customers” is defined as those who had been loyalcustomers continuously for first three months and had gone to the other stores atthe final month. We used four months of purchase data from Sep. 2002 throughDec. 2002 of a supermarket in Japan. The number of the fixed loyal customersis 1918, and that of attrition customers is 191. Using the sales ratios of roughproduct categories as explanatory variables, a classification model is generatedwhich characterizes the distinction between the attrition customers and the fixedcustomers.
The Case of Customer Attrition Analysis
Data Mining Oriented CRM Systems Based on MUSASHI: C-MUSASHI 171
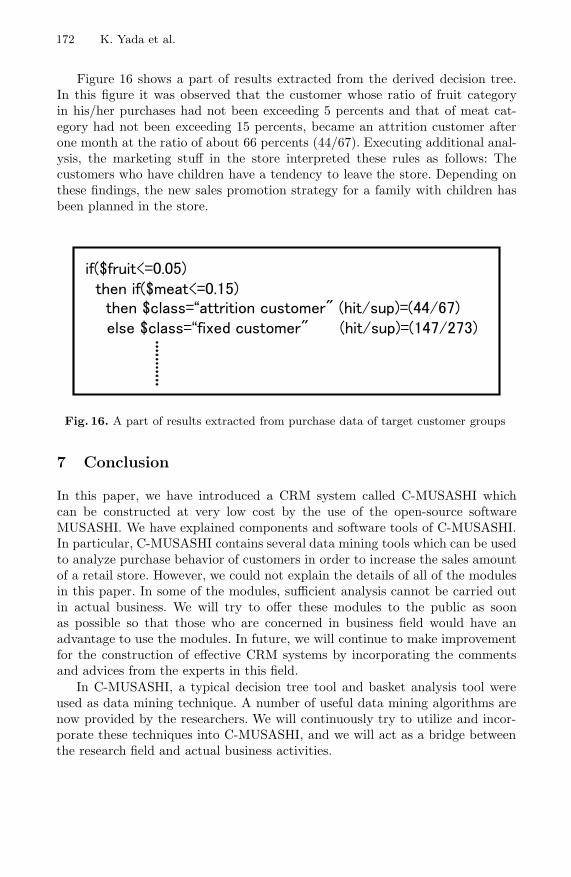
Figure 16 shows a part of results extracted from the derived decision tree.In this figure it was observed that the customer whose ratio of fruit categoryin his/her purchases had not been exceeding 5 percents and that of meat cat-egory had not been exceeding 15 percents, became an attrition customer afterone month at the ratio of about 66 percents (44/67). Executing additional anal-ysis, the marketing stuff in the store interpreted these rules as follows: Thecustomers who have children have a tendency to leave the store. Depending onthese findings, the new sales promotion strategy for a family with children hasbeen planned in the store.
Fig. 16. A part of results extracted from purchase data of target customer groups
7 Conclusion
In this paper, we have introduced a CRM system called C-MUSASHI whichcan be constructed at very low cost by the use of the open-source softwareMUSASHI. We have explained components and software tools of C-MUSASHI.In particular, C-MUSASHI contains several data mining tools which can be usedto analyze purchase behavior of customers in order to increase the sales amountof a retail store. However, we could not explain the details of all of the modulesin this paper. In some of the modules, sufficient analysis cannot be carried outin actual business. We will try to offer these modules to the public as soonas possible so that those who are concerned in business field would have anadvantage to use the modules. In future, we will continue to make improvementfor the construction of effective CRM systems by incorporating the commentsand advices from the experts in this field.
In C-MUSASHI, a typical decision tree tool and basket analysis tool wereused as data mining technique. A number of useful data mining algorithms arenow provided by the researchers. We will continuously try to utilize and incor-porate these techniques into C-MUSASHI, and we will act as a bridge betweenthe research field and actual business activities.
172 K. Yada et al.
References
1. Blattberg, R. C., Getz, G., Thomas, J. S.: Customer Equity: Building and Man-aging Relationships as Valuable Assets. Harvard Business School Press. (2001)
2. Fujisawa, K., Hamuro, Y., Katoh, N., Tokuyama, T. and Yada, K.: Approximationof Optimal Two-Dimensional Association Rules for Categorical Attributes UsingSemidefinite Programming. Lecture Notes in Artificial Intelligence 1721. Proceed-ings of First International Conference DS’99. (1999) 148–159
3. Hamuro, Y., Katoh, N. and Yada, K.: Data Mining oriented System for BusinessApplications. Lecture Notes in Artificial Intelligence 1532. Proceedings of FirstInternational Conference DS’98. (1998) 441–442
4. Hamuro, Y., Katoh, N., Matsuda, Y. and Yada, K.: Mining Pharmacy Data Helpsto Make Profits. Data Mining and Knowledge Discovery. 2 (1998) 391–398
5. Hamuro, Y., Katoh, N. and Yada, K.: MUSASHI: Flexible and Efficient Data Pre-processing Tool for KDD based on XML. DCAP2002 Workshop held in conjunctionwith ICDM2002. (2002) 38–49
6. Hawkins, G. E.: Building the Customer Specific Retail Enterprise. Breezy HeightsPublishing. (1999)
7. Hedley, B.: Strategy and the business portfolio. Long Range Planning. 10 1 (1977)9–15
8. Hughes, A. M.: Strategic Database Marketing. The McGraw-Hill. (1994)9. Ip, E., Johnson, J., Yada, K., Hamuro, Y., Katoh, N. and Cheung, S.: A Neural
Network Application to Identify High-Value Customer for a Large Retail Storein Japan. Neural Networks in Business: Techniques and Applications. Idea GroupPublishing. (2002) 55–69
10. Ip, E., Yada, K., Hamuro, Y. and Katoh, N.: A Data Mining System for Man-aging Customer Relationship. Proceedings of the 2000 Americas Conference onInformation Systems. (2000) 101–105
11. MUSASHI: Mining Utilities and System Architecture for Scalable processing ofHistorical data. URL: http://musashi.sourceforge.jp/.
12. Reed, T.: Measure Your Customer Lifecycle. DM News 21. 33 (1999) 2313. Rongstad, N.: Find Out How to Stop Customers from Leaving. Target Marketing
22. 7 (1999) 28–2914. Woolf, B. P.: Customer Specific Marketing. Teal Books. (1993)
Data Mining Oriented CRM Systems Based on MUSASHI: C-MUSASHI 173