Daniela Matilde Marques Correia - Universidade do Minho ... · Daniela Matilde Marques Correia...
286
Daniela Matilde Marques Correia maio de 2014 Systems analysis of metabolism in Helicobacter pylori Universidade do Minho Escola de Engenharia
-
Upload
duongkhuong -
Category
Documents
-
view
228 -
download
0
Transcript of Daniela Matilde Marques Correia - Universidade do Minho ... · Daniela Matilde Marques Correia...

Daniela Matilde Marques Correia
maio de 2014UM
inho
|201
4
Systems analysis of metabolism in Helicobacter pylori
Sys
tem
s a
na
lysi
s o
f m
eta
bo
lism
in
Hel
icobac
ter
pyl
ori
Dan
iela
Mat
ilde
Mar
ques
Cor
reia
Universidade do Minho
Escola de Engenharia
Tese de Doutoramento em Engenharia Química e Biológica
Daniela Matilde Marques Correia
maio de 2014
Universidade do Minho
Escola de Engenharia
Trabalho efetuado sob a orientação daDoutora Isabel Cristina de Almeida Pereira da RochadaDoutora Maria João Lopes da Costa Vieirae doDoutor Nuno Filipe Ribeiro Pinto de Oliveira Azevedo
Systems analysis of metabolism in Helicobacter pylori
Autor: Daniela Matilde Marques Correia
E-mail: [email protected]
Título da tese:
Systems analysis of metabolism in Helicobacter pylor i
Orientadores:
Doutora Isabel Cristina de Almeida Pereira da Rocha
Doutora Maria João Lopes da Costa Vieira
Doutor Nuno Filipe Ribeiro Pinto de Oliveira Azevedo
Ano de conclusão: 2014
Doutoramento em Engenharia Química e Biológica
É AUTORIZADA A REPRODUÇÃO INTEGRAL DESTA TESE APENAS PARA EFEITOS DE
INVESTIGAÇÃO, MEDIANTE AUTORIZAÇÃO ESCRITA DO INTERESSADO, QUE A TAL SE
COMPROMETE.
Universidade do Minho, 23 de maio de 2014
iii
Acknowledgments/Agradecimentos
Ao terminar esta longa jornada não poderia deixar de mostrar a minha gratidão a todos os
que de alguma forma contribuíram para que este dia chegasse.
Em primeiro lugar queria agradecer aos meus orientadores Doutora Isabel Rocha, Doutor
Nuno Azevedo e Doutora Maria João Vieira, por me terem dado a oportunidade de
desenvolver este trabalho, pelo apoio, incentivo e orientação científica. Um agradecimento
muito especial à Doutora Isabel Rocha por todo o empenho e dedicação, especialmente
na fase final deste trabalho.
À instituição de acolhimento, Centro de Engenharia Biológica da Universidade do Minho.
Às pessoas que contribuíram diretamente para este trabalho: Tiago Resende, Rafael
Carreira, Sophia Santos, Ana Guimarães e Lucinda Bessa.
Aos colegas do LMA, por todo o apoio a nível laboratorial e pessoal, em especial aqueles
de quem me tornei mais próxima. Laura, Carina e Sónia, muito obrigada pela vossa
amizade, incentivo e boa disposição que tornaram os dias “menos bons” no laboratório
mais fáceis de suportar.
Aos meus colegas do grupo de Biologia de Sistemas e Bioinformática pelo bom ambiente
proporcionado e partilha de ideias, com especial atenção às pessoas com quem partilhei o
espaço de trabalho, e tive o prazer de almoçar nestes últimos anos (não menciono nomes
para não me esquecer de ninguém, mas vocês sabem quem são). Rui e Sónia, obrigada
pelo apoio e discussões científicas.
Aos colegas e amigos que descobri nos últimos dias de escrita e que muito me apoiaram.
Sophia, Tiago, Ana, André, Filipe e Pedro, o vosso apoio foi muito importante! Uma nota
iv
especial para o Tiago, por todo o seu empenho. E claro, para a Sophia, que se tem
mostrado uma grande amiga e que foi incansável na fase final deste trabalho. Foi muito
bom cruzar-me com pessoas como vocês!
Aos meus amigos por todo o apoio demonstrado.
À minha família por todo o amor e apoio incondicional que sempre me dedicaram.
Ao Paulo, pelo seu amor e dedicação, mas em especial pela sua paciência.
Sem vocês jamais teria sido possível!
The work presented in this thesis was only possible thanks to the finantial support from the
research grant SFRH/BD/47596/2008 financed by FCT (Fundação para a Ciência e a
Tecnologia).
This work was supported in part by the ERDF—European Regional Development Fund
through the COMPETE Programme (operational programme for competitiveness), and
National Funds through the FCT within the project FCOMP-01-0124-FEDER-009707
(HeliSysBio—molecular Systems Biology in Helicobacter pylori).
v
Abstract
Helicobacter pylori is associated with gastric diseases, such as gastritis, peptic and
duodenal ulcers, mucosa associated lymphoid tissue lymphoma and gastric
adenocarcinomas. Despite more than half of the global population being infected with this
bacterium, not all individuals will develop clinical symptoms. Nevertheless, its association
with gastric cancer, the high infection rate, as well as the failures on eradication efforts
and vaccine development lead to an important health concern. In order to better
understand the mechanisms leading to disease and also to develop effective ways to fight
H. pylori infection, it is important to understand its physiological and metabolic behavior.
H. pylori is a microaerophilic, gram negative, fastidious organism, for which no
effective defined medium has been developed. Furthermore, current cultivation procedures
use media that, even when semi-defined, have a variety of nutrients that can be used as
carbon and energy sources. Under those conditions, the metabolic and physiological
characterization of H. pylori is very difficult.
The aim of this work was thus to study the physiology and metabolism of H. pylori
to allow a better understanding of the behavior and pathogenicity of this organism. For that
aim, a systems biology approach was used where Gas Chromatography-Mass
Spectrometry (GC-MS) based metabolomics and genomics data were used to characterize
the nutritional requirements and the preferred carbon sources and to build a reliable
metabolic model.
Data on H. pylori’s exometabolome was for the first time collected from
experiments performed with semi-defined media and allowed to establish the essentiality
of several amino acids: L-histidine, L-leucine, L-methionine, L-valine, L-isoleucine and L-
phenylalanine. Moreover, this analysis indicated that L-aspartate, L-glutamate, L-proline
and L-alanine could be potential carbon sources for H. pylori. Thus, a comparative analysis
of different amino and organic acids as carbon sources was performed and glutamine /
glutamate emerged as the most effective compounds. However, since glutamine is
vi
unstable under the conditions used, glutamate was selected the most adequate carbon
source for growing H. pylori.
Then, a simplified medium containing only the essential amino acids and L-
glutamate, besides vitamins and salts, as well as 5% of fetal bovine serum (FBS) was used
to perform physiological studies. Under those conditions, the specific growth rate was
determined to be 0.126 h-1, while the use of uniformly labeled 13C L-glutamate together with
GC-MS measurements of proteinogenic amino acids allowed to confirm the essential
amino acids and raise some clues about L-proline and L-alanine which, given their
presence in FBS, had still unclear roles. L-proline, although not labeled, is probably not
essential and could be obtained from arginine, while L-alanine showed very low labeling
patterns and is hypothesized to originate from pyruvate. Finally, labeling experiments
allowed to confirm the presence of a complete tricarboxylic acid cycle.
These collected data, together with genomics and other information available,
were used to build and validate the first genome-scale metabolic model of H. pylori that is
able to make quantitative predictions, covering roughly 23% of the genome. This model
can be used, in the future, to investigate novel drug targets and elucidate the metabolic
basis of infection.
Furthermore, a comparative study was performed that analyzed different methods
for assessing growth, viability, culturability and morphology, as these are important
physiological parameters.
vii
Resumo
A caracterização fenotípica é de extrema importância para entender o
metabolismo celular, especialmente em organismos patogénicos, para os quais, na sua
maioria, a informação disponível é limitada. Compreender o metabolismo de um
organismo patogénico é fundamental para desvendar os mecanismos de interação
patogénio-hospedeiro, com vista à identificação de alvos para desenvolvimento de
fármacos.
Neste trabalho estudou-se o metabolismo da bactéria Helicobacter pylori, um
micro-organismo patogénico associado a doenças gástricas, usando uma estratégia de
Biologia de Sistemas.
As experiências realizadas usando um meio liquido semi-definido para crescer H.
pylori provaram a existência de um fator de stress associado a uma paragem do seu
crescimento, acompanhada de uma mudança de morfologia. Sendo conhecido o caracter
pleiomórfico da H. pylori quando sujeita a determinadas condições de stress, e dado que
os requisitos nutricionais não se encontravam completamente definidos, foi levantada a
hipótese deste fator de stress estar associado à falta de um nutriente essencial. Assim, foi
efetuada uma análise de exometaboloma com vista a determinar os seus requisitos
nutricionais e preferências. Verificou-se a existência de aminoácidos essenciais ao
crescimento, e comprovou-se a preferência dos aminoácidos como fonte de carbono
(glutamato, prolina, alanina e aspartato). No entanto, algumas dúvidas persistiram
relativamente à essencialidade de prolina e alanina.
Para identificar a fonte de carbono preferencial foram testados diversos
aminoácidos. Identificou-se que o aminoácido L-glutamato é o mais indicado ao
crescimento de H. pylori, tendo-se efetuado a caracterização do seu crescimento com o
referido aminoácido como fonte de carbono.
Como forma de comprovar a efetiva utilização de L-glutamato como fonte de
carbono, foram efetuadas experiências com 13C L-glutamato, tendo-se utilizado
cromatografia gasosa com espectroscopia de massas para a análise das amostras. A

viii
análise dos aminoácidos do hidrolisado de biomassa de H. pylori permitiu comprovar a
utilização de L-glutamato como fonte de carbono. Comprovou-se ainda a essencialidade
dos aminoácidos isoleucina, histidina, leucina, metionina, fenilalanina e valina. Foi possível
também identificar algumas vias metabólicas ativas para as quais residiam dúvidas, como
o caso da existência do ciclo de Krebs completo. As experiências realizadas permitiram
ainda levantar hipóteses acerca da biossíntese de L-prolina e L-alanina em H. pylori a
partir de L-arginina e piruvato, respetivamente.
Com a informação recolhida, associada à anotação do genoma recentemente
efetuada foi possível reconstruir um modelo metabólico à escala genómica para H. pylori
26695. As previsões obtidas com o referido modelo estão de acordo com os dados
experimentais. Este modelo contém informação biológica relevante para este organismo,
com possível aplicação na identificação de potenciais alvos metabólicos, para a obtenção
de fármacos mais efetivos na erradicação de H. pylori.
ix
Table of Contents
1 Introduction ............................................................................................................ 1
1.1 Thesis motivation and objectives ................................................................. 3
1.2 Structure of the thesis ................................................................................. 4
1.3 References .................................................................................................. 6
2 State of the art ........................................................................................................ 7
2.1 Helicobacter pylori – General Aspects .......................................................... 9
2.1.1 Taxonomy ............................................................................................ 9
2.1.2 Microbiological characteristics ............................................................ 10
2.2 Epidemiology of Helicobacter pylori infection .............................................. 11
2.2.1 Prevalence of infection ....................................................................... 11
2.2.2 Pathologies associated with H. pylori infection .................................... 12
2.3 In vitro growth of Helicobacter pylori .......................................................... 13
2.3.1 In vitro growth media ......................................................................... 13
2.3.2 Environmental conditions ................................................................... 30
2.4 Helicobacter pylori’s Metabolism ............................................................... 31
2.4.1 Carbohydrates utilization .................................................................... 31
2.4.2 Central carbon metabolism ................................................................ 32
2.4.2.1 Glycolysis and gluconeogenesis ................................................ 32
2.4.2.2 Entner-Doudoroff and Pentose Phosphate pathways ................. 33
2.4.2.3 Pyruvate metabolism ............................................................... 33
2.4.2.4 Tricarboxylic acid cycle ............................................................. 35
2.5 Systems Biology ........................................................................................ 37
2.5.1 “Omics” Technologies ....................................................................... 38
2.5.1.1 Metabolomics .......................................................................... 39
2.5.1.2 H. pylori “Omics” data ............................................................. 44
2.5.2 Genome-scale metabolic models (GSMM) ........................................... 58
x
2.5.2.1 Reconstruction process ............................................................ 58
2.5.2.2 H. pylori 26695 GSMMs .......................................................... 63
2.6 References................................................................................................ 65
3. Growth and morphology assessment methods for Helicobacter pylori in liquid
medium .............................................................................................................. 89
3.1. Abstract .................................................................................................... 91
3.2. Introduction .............................................................................................. 93
3.3. Methods ................................................................................................... 95
3.3.1. Culture conditions ............................................................................. 95
3.3.2. Cell-to-cell disaggregation ................................................................... 95
3.3.3. Growth assessment ........................................................................... 96
3.3.4. Colony forming unit assay .................................................................. 96
3.3.5. Staining methods ............................................................................... 96
3.4. Results and Discussion ............................................................................. 98
3.4.1. Cell-to-cell disaggregation ................................................................... 98
3.4.2. Growth assessment and cell counts ................................................. 100
3.4.3. Cellular Viability ............................................................................... 103
3.4.4. Cellular Morphology ......................................................................... 106
3.5. Conclusions ............................................................................................ 107
3.6. References.............................................................................................. 109
3.7. Supplementary material .......................................................................... 115
4. Exometabolome analysis in H. pylori for the elucidation of nutritional requirements
and preferences: reconciliation of in silico and in vitro metabolic
capabilities….………. ..........................................................................................121
4.1. Abstract .................................................................................................. 123
4.2. Introduction ............................................................................................ 124
4.3. Methods ................................................................................................. 126
4.3.1. Culture conditions ........................................................................... 126
xi
4.3.2. Growth assessment ......................................................................... 126
4.3.3. Extracellular metabolite analysis ....................................................... 127
4.4. Results.................................................................................................... 131
4.4.1. Exometabolome analysis .................................................................. 131
4.5. Discussion .............................................................................................. 139
4.5.1. Exometabolome analysis .................................................................. 139
4.5.2. Metabolic model simulations ............................................................ 149
4.6. Conclusions ............................................................................................ 151
4.7. References .............................................................................................. 152
4.8. Supplementary material .......................................................................... 156
5. Evaluation of different carbon sources for the growth of H. pylori 26695 in liquid
medium.. .......................................................................................................... 163
5.1. Abstract .................................................................................................. 165
5.2. Introduction ............................................................................................ 166
5.3. Methods ................................................................................................. 168
5.3.1. Culture conditions ............................................................................ 168
5.3.2. Media and Carbon Sources .............................................................. 169
5.3.3. Growth assessment and carbon source consumption ....................... 170
5.4. Results and discussion ............................................................................ 170
5.4.1. H. pylori growth with different carbon sources .................................. 170
5.4.1. Metabolites analysis ......................................................................... 176
5.5. Conclusions ............................................................................................ 180
5.6. References .............................................................................................. 182
5.7. Supplementary material .......................................................................... 187
xii
6. Characterization of the growth of H. pylori using glutamate as the main carbon
source... ............................................................................................................193
6.1. Abstract .................................................................................................. 195
6.2. Introduction ............................................................................................ 196
6.3. Methods ................................................................................................. 197
6.3.1. Culture conditions ........................................................................... 197
6.3.2. Culture medium .............................................................................. 198
6.3.3. Growth assessment ......................................................................... 198
6.3.4. Metabolites analysis ........................................................................ 199
6.3.5. 13C labeling experiments ................................................................... 199
6.3.6. Data analysis ................................................................................... 200
6.4. Results and Discussion ........................................................................... 201
6.4.1. Growth of H. pylori with glutamate ................................................... 201
6.4.2. Extracellular metabolites analysis ..................................................... 203
6.4.3. 13C labeling analysis ......................................................................... 205
6.5. Conclusions ............................................................................................ 211
6.6. References.............................................................................................. 212
6.7. Supplementary material .......................................................................... 215
7 Reconstruction and validation of a genome--scale metabolic model for Helicobacter
pylori 26695............................................................................................................... 221
7.1 Abstract .................................................................................................. 223
7.2 Introduction ............................................................................................ 224
7.3 Methods ................................................................................................. 225
7.3.1 Metabolic network assembly ............................................................ 226
7.3.2 Reactions compartmentation ........................................................... 226
7.3.3 Assignment of reversibility to reactions ............................................. 226
7.3.4 Reactions stoichiometry ................................................................... 227
7.3.5 Gene-protein-reaction associations ................................................... 227
7.3.6 Biomass formation .......................................................................... 228
xiii
7.3.7 Growth medium requirements .......................................................... 229
7.3.8 Model curation ................................................................................. 229
7.3.9 Simulation and model optimization................................................... 230
7.3.10 Model validation............................................................................... 230
7.4 Results and Discussion ........................................................................... 231
7.4.1 Genome re-annotation and network assembly ................................... 231
7.4.2 Biomass formation ........................................................................... 232
7.4.2.1 Protein entity ............................................................................ 232
7.4.2.2 Nucleotide content ................................................................... 233
7.4.2.3 Peptidoglycans and Lipopolysaccharides ................................... 234
7.4.2.4 Lipids ....................................................................................... 234
7.4.2.5 Cofactors ................................................................................. 235
7.4.2.6 Energy requirements ................................................................ 236
7.4.3 Model curation ................................................................................. 237
7.4.4 Model Evaluation ............................................................................. 237
7.4.4.1 Model characterization ............................................................. 237
7.4.4.2 Gene essentiality ...................................................................... 239
7.4.4.3 Prediction of physiological data ................................................. 240
7.4.5 Flux distribution analysis .................................................................. 245
7.5 Conclusions ............................................................................................ 248
8. Concluding Remarks ........................................................................................... 255

xiv
xv
List of Figures
Figure 2.1. Worldwide prevalence of H. pylori. .............................................................. 12
Figure 2.2. TCA cycle in H. pylori with possible enzymes involved in each reaction. . ...... 36
Figure 2.3 “Omes” and respective “omics” technologies. ............................................. 38
Figure 2.4. Workflow in a metabolomics approach . ....................................................... 40
Figure 2.5. Genome-scale metabolic model reconstruction overview. ............................. 58
Figure 3.1. Growth of H. pylori 26695…………………………………………………………………99
Figure 3.2. Epifluorescence microscope images of H. pylori 26695 in liquid culture after
cell disaggregation... ................................................................................................... 102
Figure 3.3. Measurements of optical density (600 nm), culturable cells, and total cell
counts with DAPI stain and PNA FISH probe counts. .................................................... 103
Figure 3.4. Percentage of viable cells and total cell counts (Live/Dead kit) and culturable
cell counts along time in an H. pylori 26695 culture in liquid medium ......................... 104
Figure 3.5. Epifluorescence microscope images of a H. pylori 26695 culture stained with
Syto9/Propidium iodide (Live/Dead kit). ...................................................................... 105
Figure 3.6. Cell morphology of H. pylori 26695 along culture time. .............................. 107
Figure 3.7. OD600 and CFU/mL in disaggregation assays………………………..……………116
Figure 4.1. Evolution of organic acids (lactate, pyruvate, citrate, succinate) percentage
along time in the extracellular medium and Optical Density measured at 600 nm.. ...... 131
Figure 4.2. Analysis of the amino acids profiles obtained from the H. pylori culture. ..... 134
Figure 4.3. Evolution of glucose and acetate concentrations .. ..................................... 136
Figure 4.4. Schematic diagram of H. pylori’s metabolic map, and metabolites evolution
analyzed in the extracellular medium during the culture.. ............................................. 148
Figure 5.1. Growth (OD600) of H. pylori 26695 using different carbon sources................ 172
Figure 5.2. Factor increase in optical density (OD600 nm) after 48 hours of culture and
specific growth rate (exponential phase) for each carbon source tested. ....................... 172
xvi
Figure 5.3. Catabolic pathways predicted to be utilized by H. pylori 26695 for the
utilization of the carbon sources tested........................................................................ 176
Figure 5.4. Carbon source consumption after 48 hours of culture. ............................... 177
Figure 6.1. Flowchart applied for extracellular metabolites and biomass hydrolysates
analysis by GC-MS. ..................................................................................................... 200
Figure 6.2. Biomass concentration represented by Cell Dry Weight (CDW) and L-glutamate
in the culture medium along time as a percentage of the initial concentration.. ............ 202
Figure 6.3. Heat map obtained with MeV representing the compounds identified in the
supernatant of the H. pylori culture along the fermentation . ........................................ 204
Figure 6.4. Fractional labeling (with and without unlabeled biomass correction) calculated
for each amino acid present in the protein of biomass hydrolysates ............................. 206
Figure 6.5. Schematic representation of H. pylori’s metabolic pathways active under the
conditions of the described experiments ...................................................................... 210
Figure 6.6. Biomass calibration curve. ........................................................................ 215
Figure 7.1. Genome-scale metabolic model reconstruction workflow. .......................... 225
Figure 7.2. H. pylori 26695 re-annotation results and statistics.................................... 231
Figure 7.3. Metabolites and flux distribution in the central carbon pathways when
simulating iTR370 in minimal medium. ....................................................................... 247
xvii
List of Tables
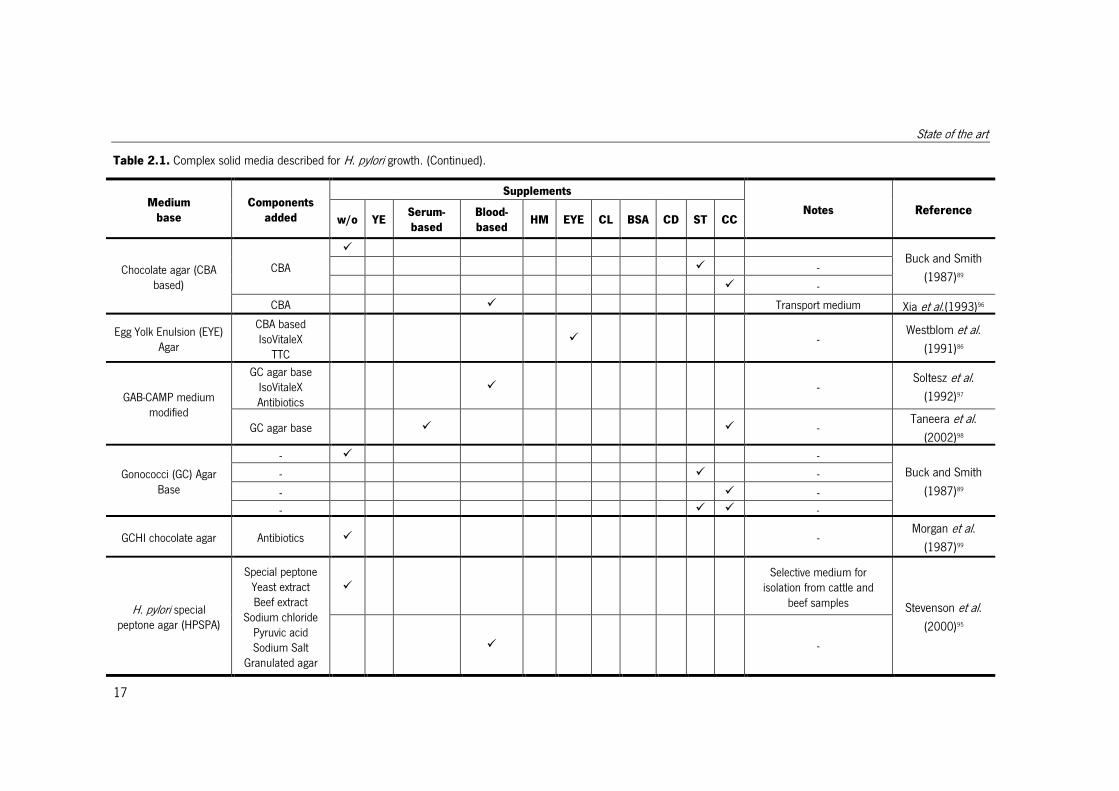
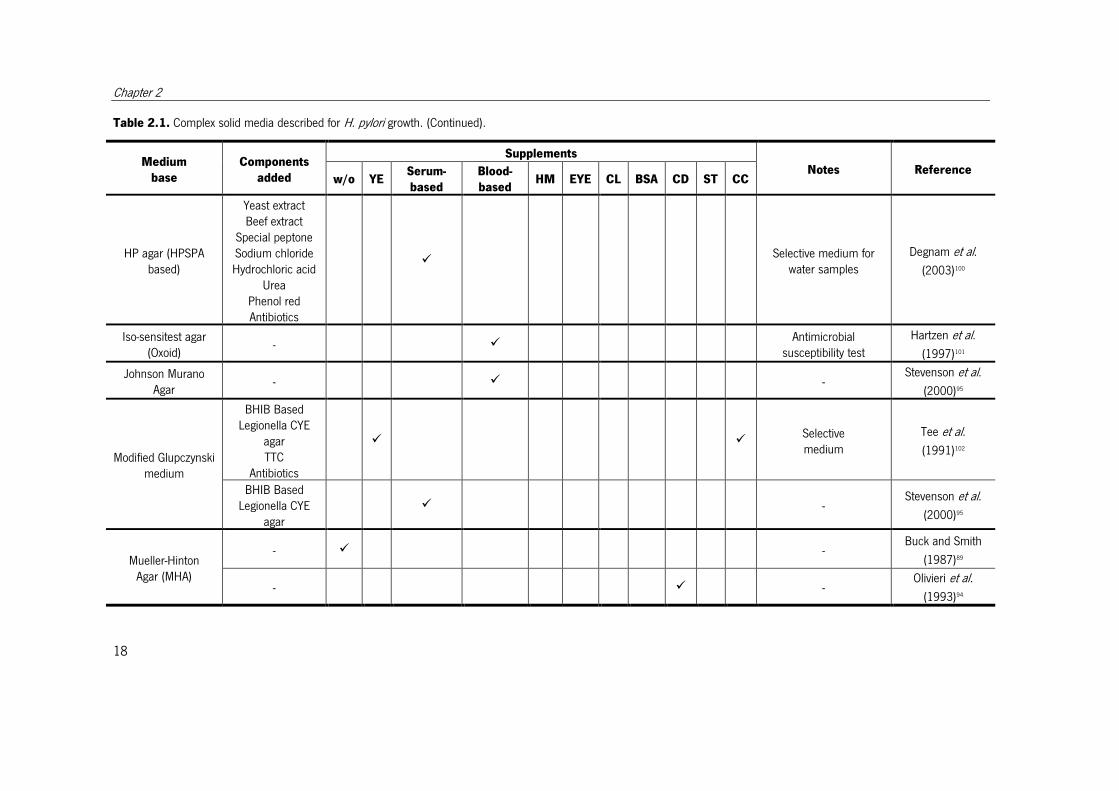
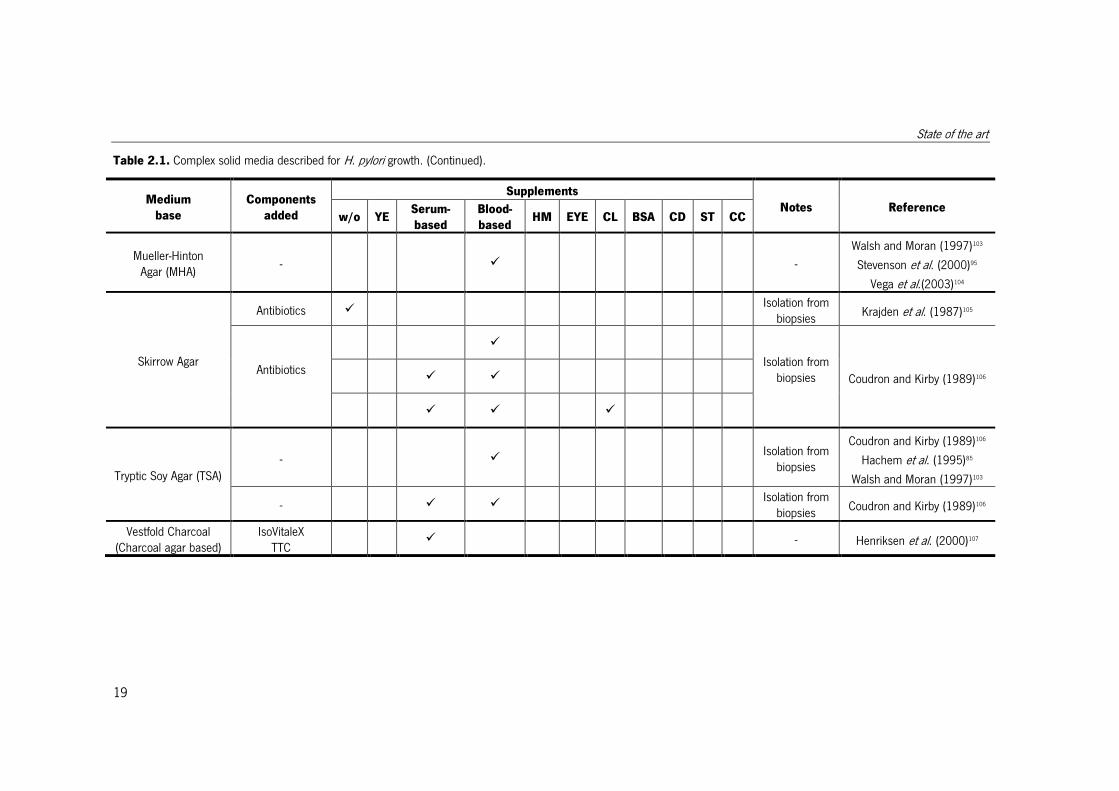
Table 2.1. Complex solid media described for H. pylori growth. ..................................... 16
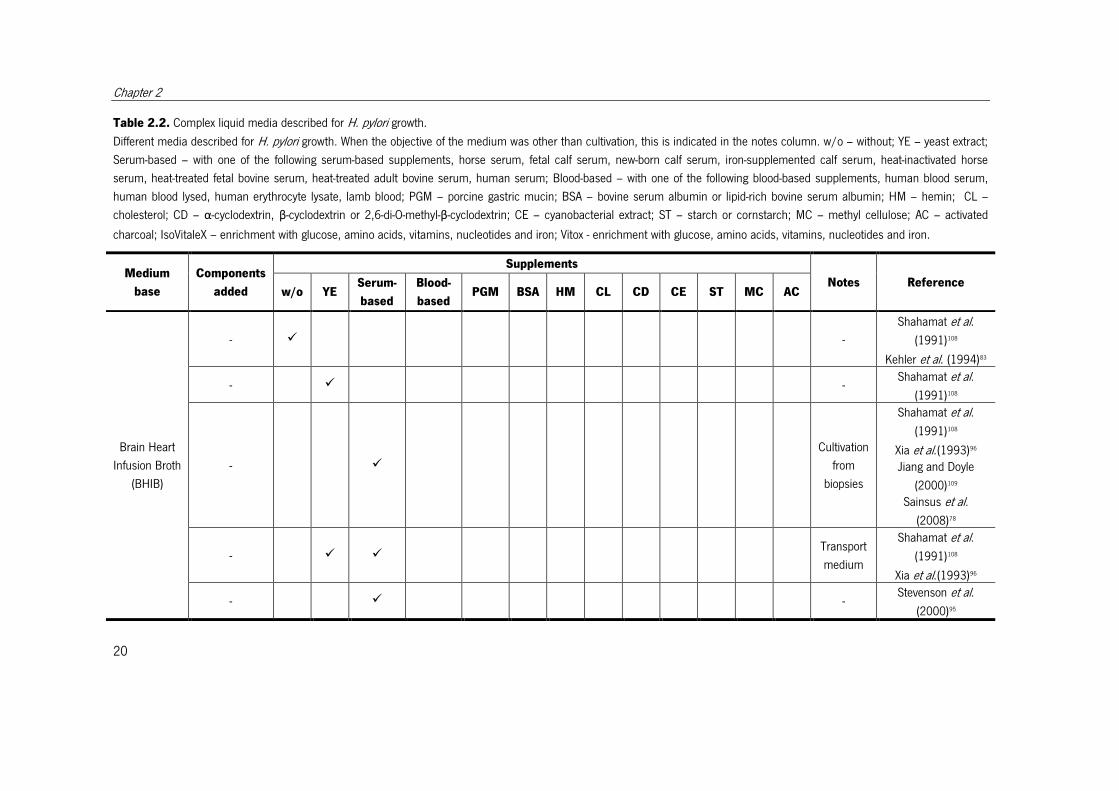
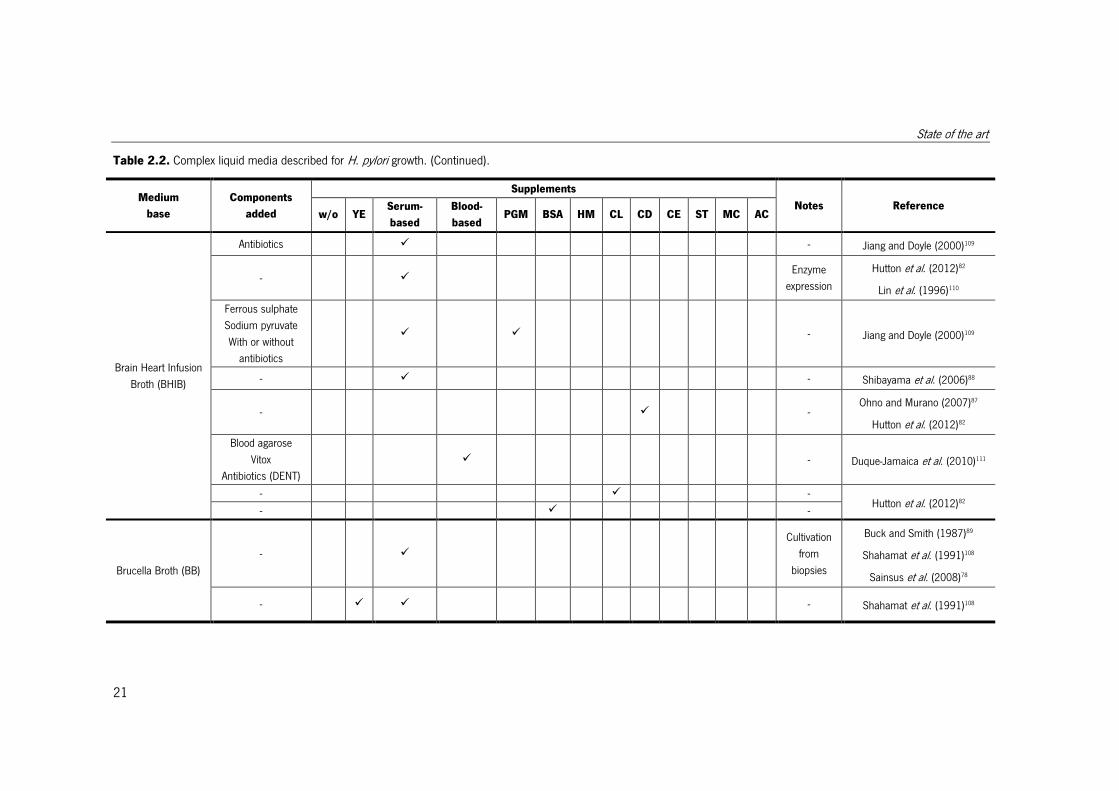
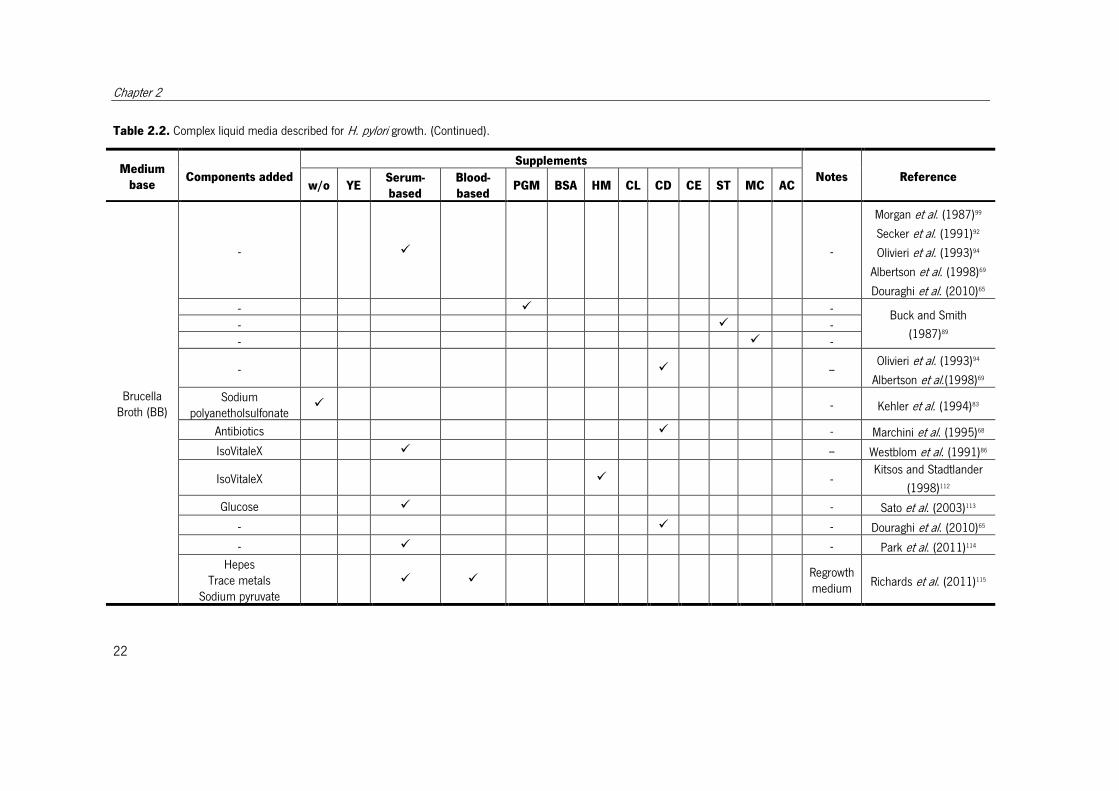
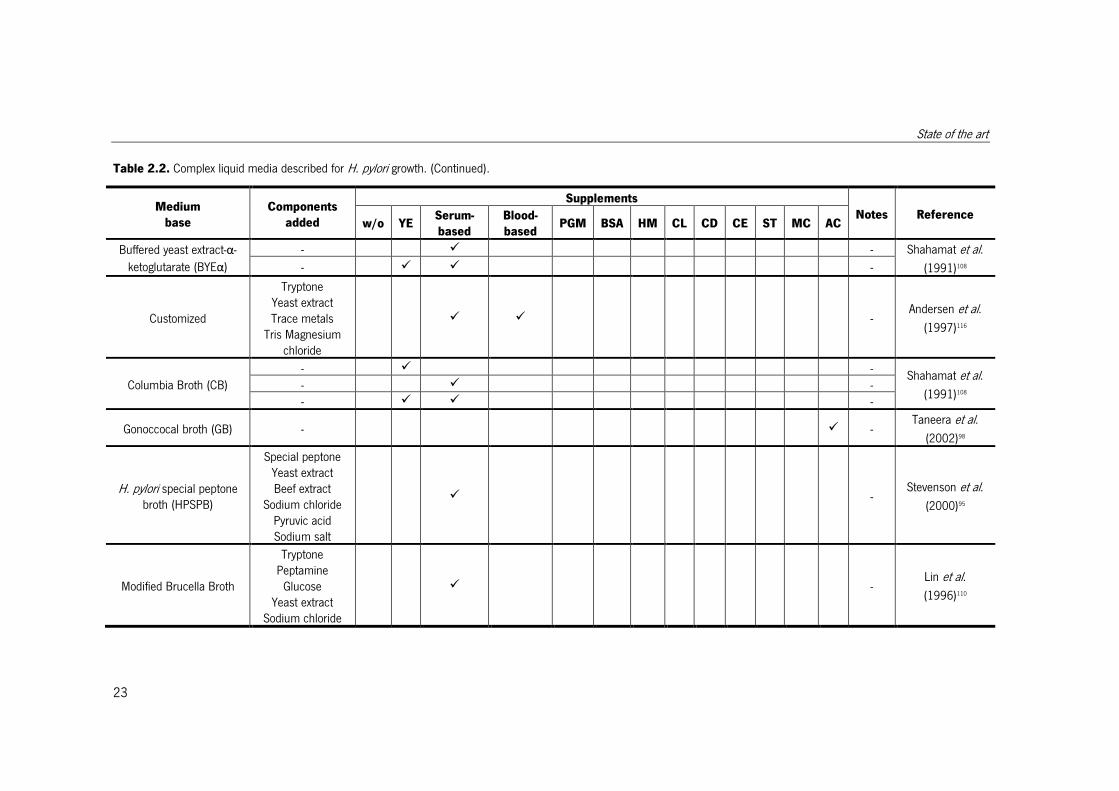
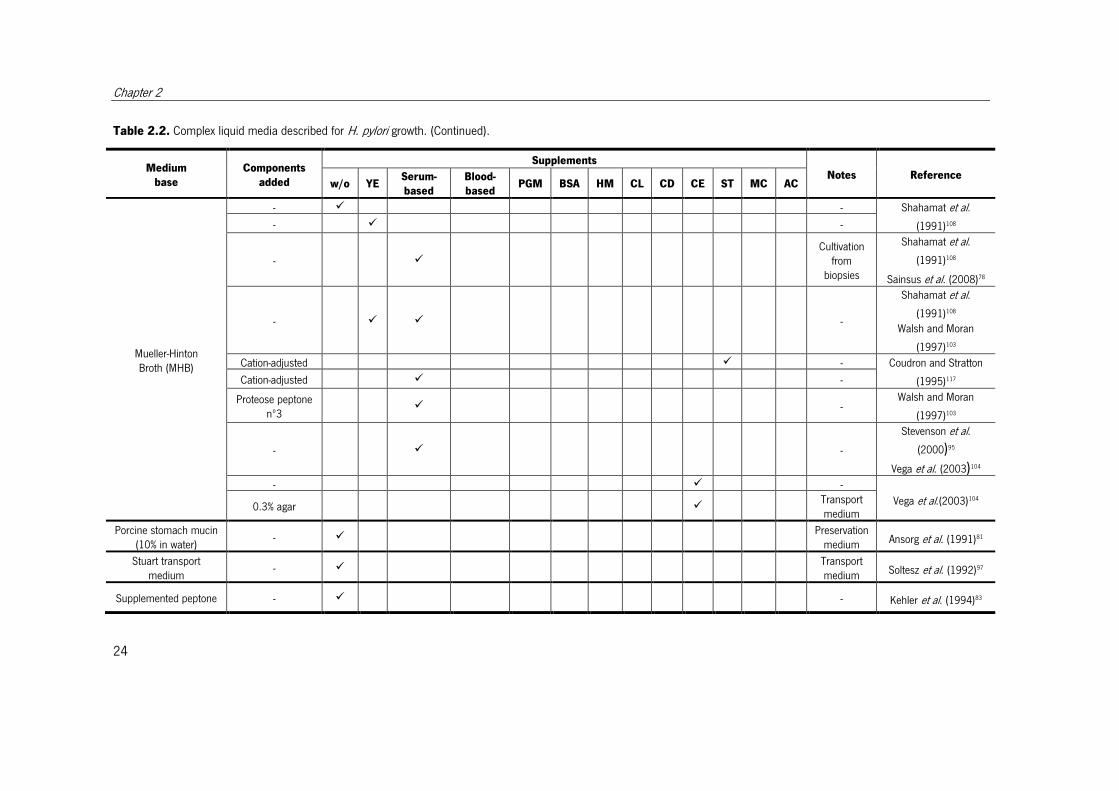
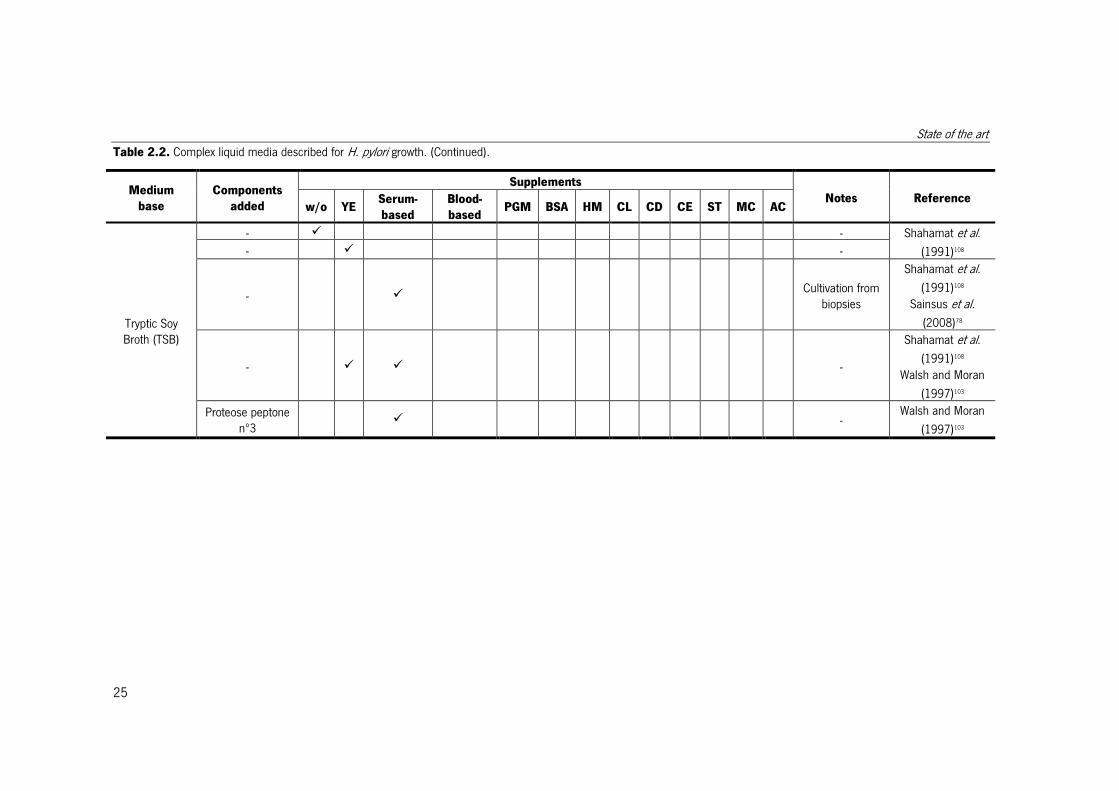
Table 2.2. Complex liquid media described for H. pylori growth. .................................... 21
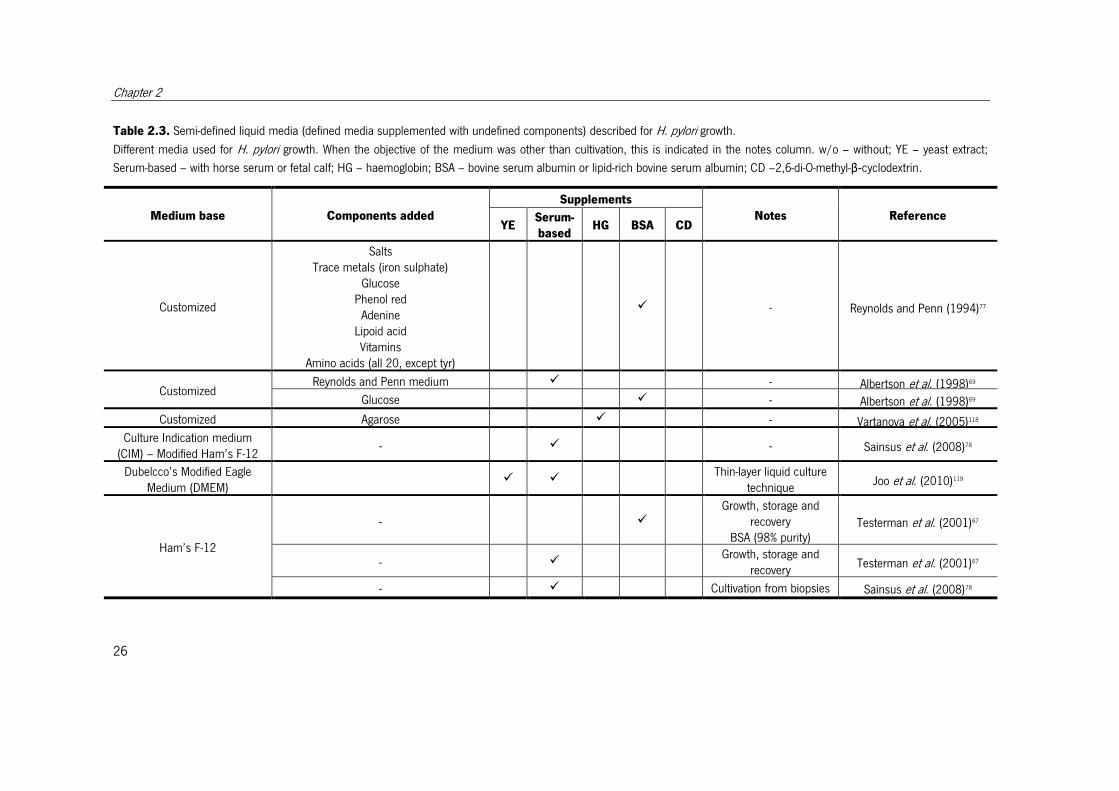
Table 2.3. Semi-defined liquid media (defined media supplemented with undefined
components) described for H. pylori growth. .................................................................. 27
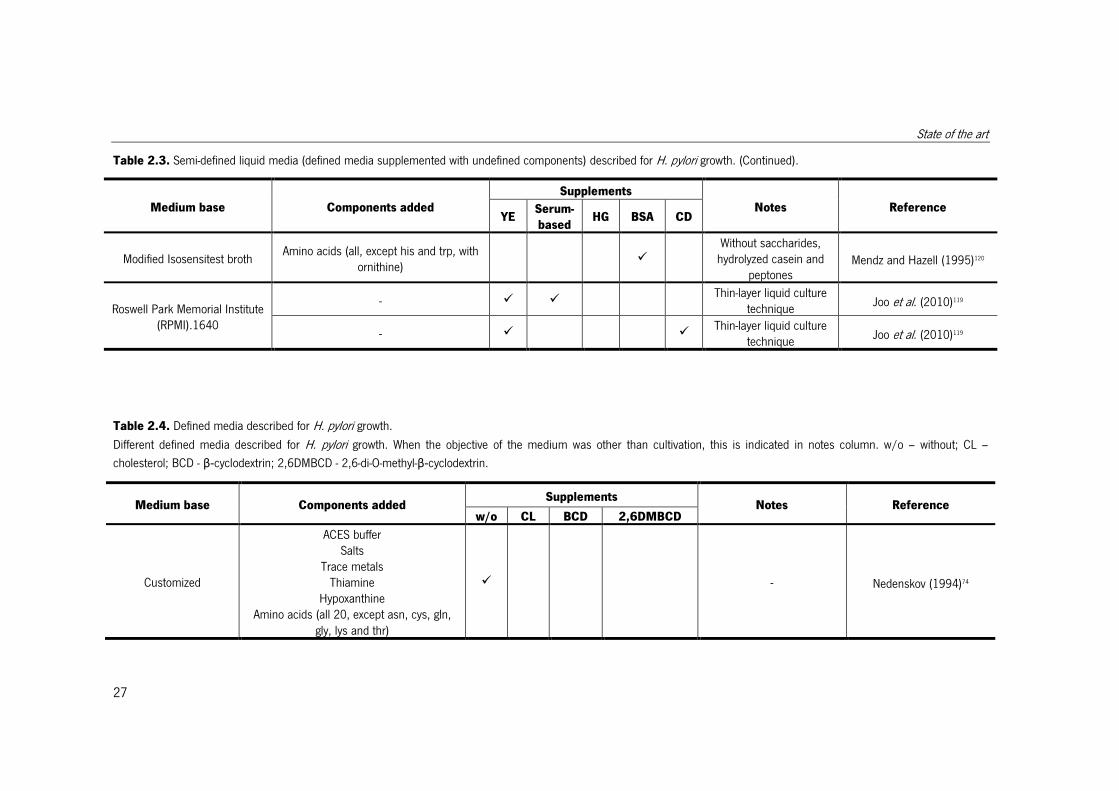
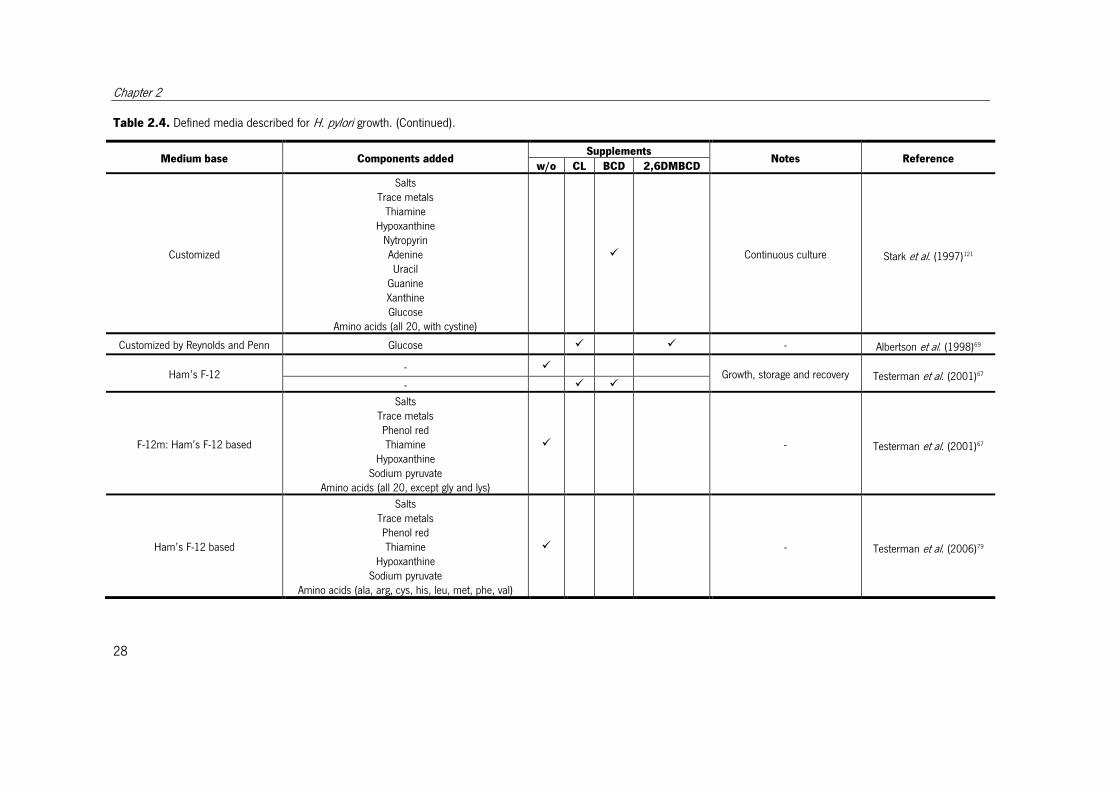
Table 2.4. Defined media described for H. pylori growth. ............................................... 28
Table 2.5 Terms and respective definitions applied in metabolomic analysis.. ................ 40
Table 2.6. H. pylori genomic features, obtained from the average of 54 fully-sequenced
strains ......................................................................................................................... 45
Table 2.7. Transcriptomics studies with H. pylori.. ......................................................... 47
Table 2.8. Proteomics studies with H. pylori. ................................................................. 51
Table 2.9. Model curation steps .................................................................................... 61
Table 2.10. Steps to be performed to evaluate the reconstructed metabolic model. ........ 63
Table 2.11. In silico H. pylori 26695 metabolic networks characterization. ..................... 64
Table 3.1. Composition of the hybridization solution. ................................................... 115
Table 3.2. Composition of the washing solution. .......................................................... 115
Table 3.3. Mean values of cell counts for each method performed for three biological
replicates. ................................................................................................................... 117
Table 3.4. Total and viable cell counts using the Live/dead kit performed for three
biological replicates.. .................................................................................................. 118
Table 3.5. Mean percentage of spiral cell counts for each method performed for three
biological replicates. ................................................................................................... 119
Table 3.6. Mean percentage of intermediate and coccoid cell counts for each method
performed for three biological replicates. ..................................................................... 120
xviii
Table 4.1. Results of the simulations performed with the iIT 341 GSM/GPR model, using
Flux Balance Analysis in Optflux, showing the environmental conditions tested and the
biomass predicted for each simulation. ....................................................................... 138
Table 4.2. Comparison of amino acids essentiality (in vitro and in silico), or consumption
reported in the published studies for H. pylori and results of the present study. ........... 142
Table 4.3. Composition of the Ham’s F-12 medium..................................................... 156
Table 4.4. Compounds used to prepare the standards for GC-MS analysis. .................. 158
Table 4.5. Mass to charge ratios for the molecular ions, major fragments and retention
times for each compound in the in-house library. ........................................................ 160
Table 4.6. Percentage of compounds detected in the extracellular culture medium along
time ........................................................................................................................... 161
Table 5.1. Composition of the media tested. ............................................................... 169
Table 5.2. Composition of the Ham’s F-12 medium and characteristics of the compounds
used to prepare the mixture. ....................................................................................... 187
Table 5.3. Compounds identified in the fetal bovine serum by GC-MS, mean of two
technical replicates and the corresponding concentration in the final broth. ................. 189
Table 5.4. Essential amino acids identified in the culture medium by GC/MS at 48 h of H.
pylori culture in percentage. ........................................................................................ 190
Table 5.5. Compounds identified in the culture medium by GC/MS at 48 h of culture in
percentage compared to the concentration at 0 h of culture.. ...................................... 191
Table 6.1. Culture medium composition. ..................................................................... 198
Table 6.2. Growth parameters for H. pylori 26695 growing in liquid medium with L-
glutamate. .................................................................................................................. 202
Table 6.3. Evolution of the compounds identified in the culture medium as a percentage
of the initial concentrations obtained by GC/MS. ........................................................ 216
Table 6.4. Mass fractions calculated for mass isotopomers of each derivatized amino acid
in biomass hydrolysates. ............................................................................................. 217
Table 6.5. Fractional labeling determined for the fragments used for each amino acid.. 220
xix
Table 7.1. Macromolecular composition of the biomass of H. pylori and respective
contribution to the overall biomass. ............................................................................. 232
Table 7.2 Total amount of amino acids in biomass composition ................................... 233
Table 7.3. Total amount of dNTPs in the biomass composition. .................................. 233
Table 7.4. Total amount of NTPs in the biomass composition. .................................... 234
Table 7.5. Total amount of cell wall metabolites in the biomass composition. ............... 234
Table 7.6. Total amount of different lipids in the biomass composition. ........................ 235
Table 7.7. Different cofactors in the biomass composition with the respective coefficient
.................................................................................................................................. 236
Table 7.8. Metabolic model characteristics. ................................................................. 238
Table 7.9. Comparison between the iIT341 GSM/GPR model and the metabolic model
developed in this work (iTR370). ................................................................................. 239
Table 7.10. Comparison between essential genes verified experimentally and retrieved
from the OGEE database and model predictions. ......................................................... 240
Table 7.11. Metabolic model simulations performed using experimental data on uptake
rates as environmental conditions and varying the flux of the ATP Maintenance reaction in
the model..................................................................................................................242

xx
xxi
Abbreviations
∆fG – free Gibbs energy
∆G - Gibbs energy
ala - alanine
AMDIS - automated mass spectral deconvolution and identification system
ADP - adenosine diphosphate
ANOVA - analysis of variance
Arg – arginine
Asn – asparagine
Asp – aspartic acid
ATP - adenosine triphosphate
BLAST – basic local alignment search tool
CBA - Columbia base agar
CDS – coding sequences
CDW - cell dry weight
CE-MS - capillary electrophoresis–mass spectrometry
CFU - colony-forming units
CTP - cytosine triphosphate
Cys - cysteine
DAPI - 4',6-diamidino-2-phenylindole
DNA - deoxyribonucleic acid
dATP – deoxyadenine triphosphate
dCTP - deoxycytosine triphosphate
dGTP - deoxyguanine triphosphate
dNTP – deoxyribonucleotide triphosphate
dTTP - deoxythymine triphosphate
DW – dry weight
EC - enzyme commission
xxii
ED - Entner-Doudoroff
EI - electron ionization
ELISA - enzyme-linked immunosorbent assay
FBA - flux balance analysis
FBS - fetal bovine serum
FMOC - 9-fluorenylmethyl chloroformate
FTIR - fourier transform infrared spectroscopy
gDW – grams dry weight
GC - gas chromatography
GC-MS - gas chromatography–mass spectrometry
GEO - gene expression omnibus
GPR - gene-protein-reaction
GSM – genome scale model
GSMM - genome scale metabolic model
GTP - guanine triphosphate
HCL - hierarchical clustering
His - histidine
HMMs – hiden Markov models
HPLC – high pressure liquid chromatography
Ile - isoleucine
KEGG - kyoto encyclopedia of genes and genomes
KMC - K-Means clustering
LC - liquid chromatography
LC-MS - liquid chromatography-mass spectrometry
Leu – leucine
LPS – lipopolysaccharides
Lys - lysine
MALDI - matrix-assisted laser desorption/ionization
MALT - mucosa associated lymphoid tissue
MCF - methyl chloroformate
xxiii
merlin – metabolic models reconstruction using genome-scale information
Met – methionine
MS - mass spectrometry
m/z – mass to charge ratio
NADP - nicotinamide adenine dinucleotide phosphate
NADPH - nicotinamide adenine dinucleotide phosphate-oxidase
NCBI - National Center for Biotechnology Information
NGS - next-generation sequencing
NIST - National Institute of Standards and Technology
NMR - nuclear magnetic resonance
NTPs – nucleosides triphosphate
OD - optical density
OGEE – online gene essentiality database
OMP - outer membrane proteins
OPA - o-phthalaldehyde
ORF - open reading frames
PBS - phosphate saline buffer
Phe - phenylalanine
PNA FISH - peptic nucleic acid fluorescence in situ hybridization
PP - pentose phosphate
Pro - proline
RNA - ribonucleic acid
rRNA - ribosomal ribonucleic acid
RSD - relative standard deviation
SBML - systems biology markup language
SD – standard deviation
Ser – serine
TCA - tricarboxylic acid
Thr – threonine
tRNA – transfer ribonucleic acid

xxiv
Trp - tryptophan
TSA - tryptic soy agar
Tyr - tyrosine
UHPLC - ultra high performance liquid chromatography
UV – ultra violet
UTP – uracil triphosphate
v/v – volume by volume
Val - valine
VBNC - viable but non culturable
w/o – without
w/v – weight by volume

Chapter 1
1 Introduction

Introduction
3
1.1 Thesis motivation and objectives
Helicobacter pylori is one of the most thriving human pathogens, being
disseminated all over the world1. Unless treated, H. pylori can persist in the human
stomach for life, although not all individuals will develop disease. The disease outcome can
vary from gastritis, peptic ulcer, gastric cancer to mucosal-associated lymphoid tissue
lymphoma.
To fully understand the mechanisms associated with host colonization and host-
pathogen interaction, it is indispensable to understand the pathogen’s metabolism inside
the host, where it must extract nutrients to fulfill its metabolic requirements2. In the
particular case of H. pylori, its metabolism and physiology are not well studied, owing, in
part, to the difficulties found until now in growing this pathogen in vitro under defined
conditions.
Using Systems Biology approaches, different tools can be applied to understand
the system as a whole. The use of “omics” data has made possible the reconstruction of
genome-scale metabolic models for a large number of organisms. This type of in silico
models allows to predict cellular behavior, bridging the gap between genotypes and
phenotypes, aiding efforts to diverse areas, including drug discovery3,4. The availability of
the genome sequence of H. pylori 26695 and its annotation have allowed the construction
of metabolic models for this organism5,6. However, the accuracy of model predictions is
associated with the data used to build and validate the model, which is limited for H.
pylori.
This work aimed at studying H. pylori’s metabolism using a Systems Biology
approach. The specific goals included:
- Contribute to understand the nutritional requirements and preferences of H.
pylori;
- Collect physiological and metabolomics data that can help to understand more
of H. pylori’s metabolism;
Chapter 1
4
- Reconstruct a new genome-scale metabolic model based on novel results on
genome (re-)annotation;
- Use the physiological data collected to validate the genome-scale metabolic
model.
1.2 Structure of the thesis
This thesis is composed of eight chapters. Chapter 2 is a general introduction to
the topics, and can be divided into two main subjects: H. pylori and Systems Biology. The
part devoted to H. pylori addresses mainly topics related with H. pylori’s microbiological
characteristics, growth, physiology and metabolism. In the Systems Biology part, emphasis
on “omics” technologies is given, with an overview on omics studies reported for H. pylori.
The Metabolomics approach, which is the “omics” technology used in this thesis, is further
explored. Finally, the process of genome-scale metabolic model reconstruction is
described.
Considering the well-known H. pylori’s pleiomorphic nature, in Chapter 3 a study
of growth and morphology assessment methods for H. pylori growing in liquid medium is
presented. This study allowed concluding about the suitable methods to monitor H. pylori’s
growth.
Chapter 4 presents a reconciliation of H. pylori’s nutritional requirements,
gathering experimental results and in silico predictions. A metabolic footprinting approach
was applied to understand which are the components being used when H. pylori was
growing using a “complete” liquid medium (containing all 20 amino acids) and thus, infer
about amino acids requirements.
Chapter 5 and 6 are devoted to the study of H. pylori’s preferred carbon sources.
In Chapter 5, different compounds (mainly amino acids) were tested and compared as
carbon sources for H. pylori’s growth. Based on the results obtained in Chapter 5,
glutamate was selected as the preferred carbon source, and the growth using this
Introduction
5
substrate was further characterized in Chapter 6. A strategy of using an isotopically
labelled substrate (13C glutamate) was performed in order to determine the labelling profile
in several biomass constituents.
The reconstruction of an updated genome-scale metabolic model for H. pylori
26695 is presented in Chapter 7. This chapter includes several steps: genome re-
annotation, reconstruction using a semi-automated method, manual curation, definition of
biomass composition (determined experimentally) and model validation with the
experimental data obtained in previous chapters.
To conclude, in Chapter 8 the main conclusions and considerations about future
work are presented.
Chapter 1
6
1.3 References
1. Azevedo, N. F., Guimarães, N., Figueiredo, C., Keevil, C. W. & Vieira, M. J. A new model for
the transmission of Helicobacter pylori: Role of environmental reservoirs as gene pools to
increase strain diversity. Crit. Rev. Microbiol. 33, 157–169 (2007).
2. Rohmer, L., Hocquet, D. & Miller, S. I. Are pathogenic bacteria just looking for food?
Metabolism and microbial pathogenesis. Trends Microbiol. 19, 341–348 (2011).
3. Yeh, I., Hanekamp, T., Tsoka, S., Karp, P. D. & Altman, R. B. Computational analysis of
Plasmodium falciparum metabolism: Organizing genomic information to facilitate drug
discovery. Genome Res. 14, 917–924 (2004).
4. Chavali, A. K., Whittemore, J. D., Eddy, J. A, Williams, K. T. & Papin, J. A. Systems analysis
of metabolism in the pathogenic trypanosomatid Leishmania major. Mol. Syst. Biol. 4, 1–
19 (2008).
5. Schilling, C. H. et al. Genome-scale metabolic model of Helicobacter pylori 26695. J.
Bacteriol. 184, 4582–4593 (2002).
6. Thiele, I., Vo, T. D., Price, N. D. & Palsson, B. Ø. Expanded metabolic reconstruction of
Helicobacter pylori (iIT341 GSM/GPR ): an in silico genome-scale characterization of
single- and double-deletion mutants. J. Bacteriol. 187, 5818–5830 (2005).

Chapter 2
2 State of the art

State of the art
9
2.1 Helicobacter pylori – General Aspects
In 1982, Barry J. Marshall and J. Robin Warren identified a bacillary organism in
the gastric epithelium1, and, at that time, they could not imagine that their discovery would
result in the awarding of the Nobel Prize in Physiology and Medicine in 20052. With their
discovery, they changed the assumption that peptic ulcer was caused by stress and
lifestyle1,2. In fact, the association of Helicobacter pylori with gastritis and peptic ulcer
disease was proved later through studies with human volunteers1–4.
Due to its relation with gastric diseases, in the last 20 years intense research has
been performed around H. pylori, proved by the number of publications that increased
from around 500 in 1992 to around 1500 in 2012, totalizing more than 32 000
publications in international peer-reviewed journals (searched with “Helicobacter pylori”
terms in the PUBMED database)5.
2.1.1 Taxonomy
H. pylori is a member of the Proteobacteria phylum, belonging to the class
Epsilonproteobacteria, Campylobacterales order, Helicobacteraceae family6. Despite the
differences found in flagella, in 1984 H. pylori was included in the Campylobacter genus
and was named Campylobacter pyloridis 7. In 1987, the nomenclature was revised and the
species name was corrected to Campylobacter pylori 8. In the following years, several
studies revealed significant differences between this organism and Campylobacter species,
being more closely related with Wolinella succinogenes 9,10. In 1989, C. pylori was included
in a new genus - Helicobacter. The name refers to its helical morphology, and this species
was designated Helicobacter pylori 11. In the Helicobacter genus there are more than 20
species, including human and animal pathogens, with new Helicobacter species being
regularly discovered6,12–14. The features that can be used to differentiate Helicobacter
species are: host, location, morphological characteristics (cell size, flagella), growth
conditions, antibiotics susceptibility, biochemical characteristics (such as catalase, oxidase
and urease activity, nitrate reduction, among others), or G+C content6,13,14. There are two
Chapter 2
10
major groups of Helicobacter species: the gastric Helicobacter species (such as H. felis, H.
mustelae, H. acinonychis, H. pylori, among others) and non-gastric (enterohepatic)
Helicobacter species (such as H. hepaticus, H. pullorum, H. cinaedi, H. canis, among
others)13–15. These groups present a high level of specificity relatively to the organ they
colonize15.
2.1.2 Microbiological characteristics
H. pylori is a gram-negative bacterium, measuring 2.0-5.0 µm in length and 0.5-
1.0 µm in width15–17. Although it usually exhibits a spiral or curved rod shape15,16, coccoid
shapes can appear when the organism is subjected to certain adverse conditions, such as
prolonged in vitro culture, increased temperature, alkaline pH, increased oxygen tension,
or antibiotic treatment18. There is some controversy about the nature of these coccoidal
forms, with some authors reporting that they represent a morphological manifestation of
cell death19, and others a viable but non culturable state (VBNC)20,21. It is thought that these
forms cannot be cultured in vitro, although they are metabolically active. Despite evidences
that these forms can induce infection, this is another controversial topic. The recovery of
coccoid to spiral forms in H. pylori was reported, and notwithstanding this fact was proven
in other species such as E. coli or S. tiphymurum, this result is still not universally
accepted by the scientific community, since other authors were not able to prove these
findings in H. pylori. During the conversion of H. pylori spiral to coccoid forms,
intermediate U forms can also be observed22.
H. pylori is motile, with 2-6 sheathed unipolar flagella of approximately 3 µm long
and 2.5 nm thick. Each flagellum frequently carries a distinctive terminal bulb, which is an
expansion of the flagellar sheath16,23–25. The sheath is an extension of the outer membrane
and its role can be to protect the flagellar structure from the acidic environment of the
stomach16,17,24. The flagella, in association with the spiral shape, are essential for host
colonization, allowing the movement in viscous solutions such as the mucus layer of the
gastric epithelium25–27. When cultured in plates with solid medium, H. pylori colonies appear
State of the art
11
translucent, not clearly haemolytic and with 1-2 mm in diameter23. H. pylori is a
microaerophilic and non-sporulating organism28.
2.2 Epidemiology of Helicobacter pylori infection
2.2.1 Prevalence of infection
H. pylori is the agent of one of the most disseminated infections in the world29.
There are many studies reporting the prevalence of H. pylori infection in different countries
along time, with review articles being published every year within the last years30–35. The
prevalence of H. pylori infection varies with geographical areas, age, race and
socioeconomic status30. The global prevalence of H. pylori is depicted in Figure 2.1.
In general, more than 50% of the global population is infected with H. pylori 29,
ranging from 25-50% of infection in developed countries to 70-90% in developing
countries12. The infection rate observed in developing countries might be related with
factors such as unsanitary conditions and contaminated water12. It is important to highlight
that a high H. pylori prevalence does not mean a high rate of disease. For instance, in
developed countries there is a low infection rate and a relatively high prevalence of gastric
cancer and the opposite is also true for some countries36.
H. pylori is mostly acquired in childhood, probably from close family members12,15
and, if not treated, may become a lifelong infection15,29. It is clear that the infection rates
have been decreasing in the last years, with emphasis in developed and developing
countries35, although this fact is more noticeable in developed countries and can be linked
to improvements in hygiene practices30 and with the decrease of family sizes37.
Chapter 2
12
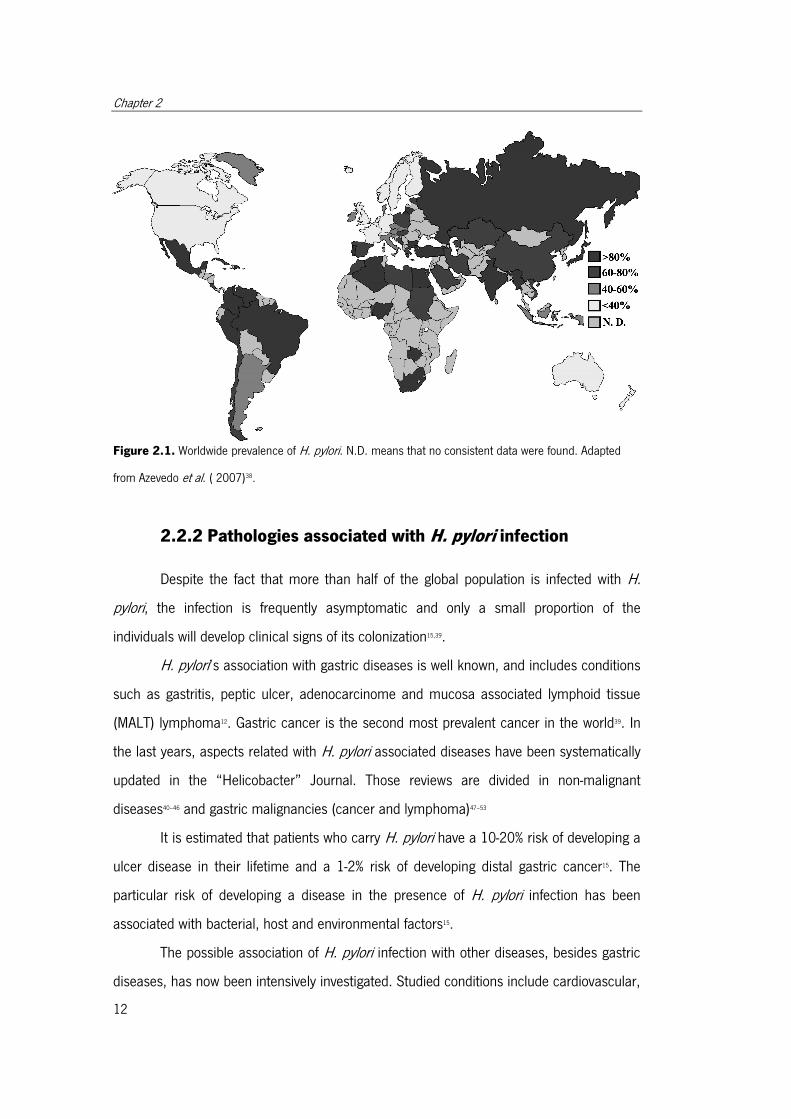
Figure 2.1. Worldwide prevalence of H. pylori. N.D. means that no consistent data were found. Adapted
from Azevedo et al. ( 2007)38.
2.2.2 Pathologies associated with H. pylori infection
Despite the fact that more than half of the global population is infected with H.
pylori, the infection is frequently asymptomatic and only a small proportion of the
individuals will develop clinical signs of its colonization15,39.
H. pylori’s association with gastric diseases is well known, and includes conditions
such as gastritis, peptic ulcer, adenocarcinome and mucosa associated lymphoid tissue
(MALT) lymphoma12. Gastric cancer is the second most prevalent cancer in the world39. In
the last years, aspects related with H. pylori associated diseases have been systematically
updated in the “Helicobacter” Journal. Those reviews are divided in non-malignant
diseases40–46 and gastric malignancies (cancer and lymphoma)47–53
It is estimated that patients who carry H. pylori have a 10-20% risk of developing a
ulcer disease in their lifetime and a 1-2% risk of developing distal gastric cancer15. The
particular risk of developing a disease in the presence of H. pylori infection has been
associated with bacterial, host and environmental factors15.
The possible association of H. pylori infection with other diseases, besides gastric
diseases, has now been intensively investigated. Studied conditions include cardiovascular,
State of the art
13
respiratory and ear, nose and throat diseases, hematologic, ophthalmology, oral mucosa
and skin diseases, hepatobiliary diseases, diabetes mellitus and metabolic disorders,
immunologic diseases, and neurological disorders. For some disorders, for instance
Idiopathic Thrombocytopenic Purpura (ITP) there are strong evidences that there is a link
between the disease and H. pylori infection54,55, whilst for other diseases more studies are
needed in order to prove H. pylori association. The studies published on extra gastric
manifestations of H. pylori infection have been systematically reviewed in the last years in
the “Helicobacter” Journal54–63.
2.3 In vitro growth of Helicobacter pylori
2.3.1 In vitro growth media
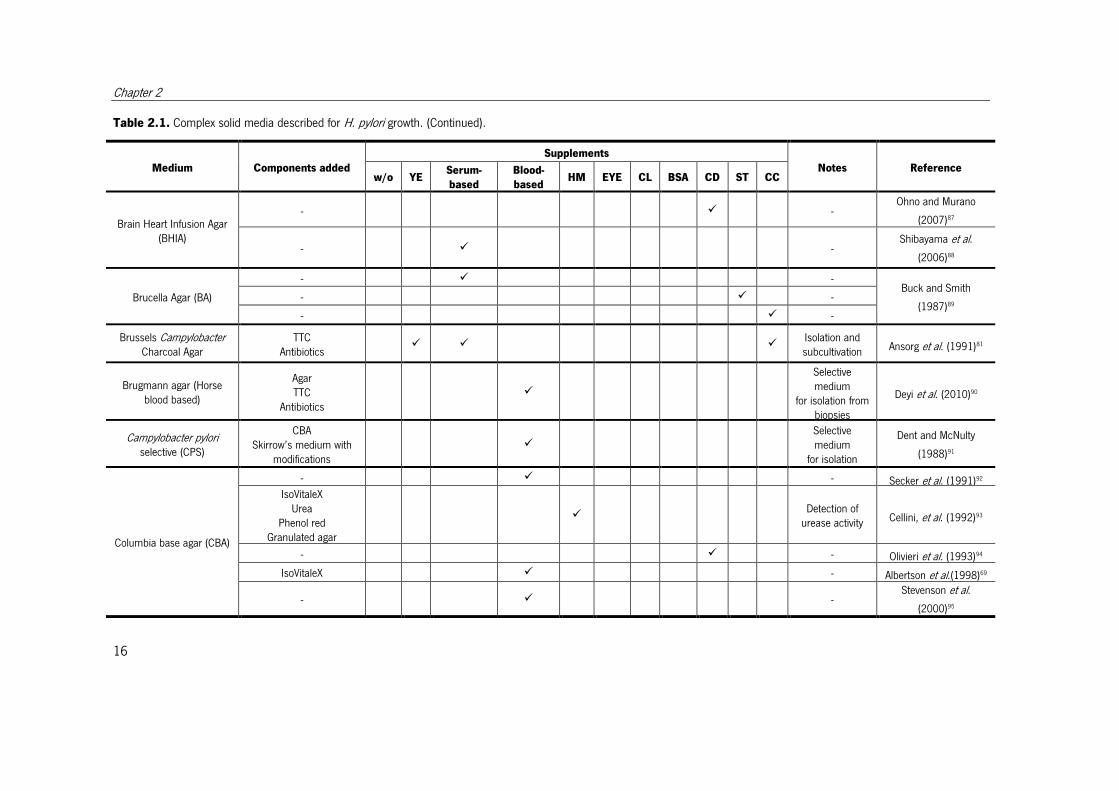
Since its first culture in 1984, a considerable number of studies describing media
have been published, either to transport, isolate, preserve or cultivate H. pylori in vitro. The
use of both solid and liquid media has been reported, although the best results were
obtained using solid media, frequently supplemented with sheep or horse blood (Table
2.1).
Growth in liquid media is not straightforward to achieve, as H. pylori grows very
slowly even in rich media, and contamination with other organisms is a concern. Thus,
antibiotics (vancomycin, polymyxin, trimethoprim, amphotericin, polymyxin, among others)
are often added. Complex liquid media are mostly used (Table 2.2), although a few semi-
defined media have also been developed, where defined medium are used but
supplemented with undefined components (Table 2.3). The use of some defined
supplements (cyclodextrins or cholesterol) has also been described as an adequate
replacement for the complex supplements (Table 2.4). However, the cell densities
obtained are quite low and the supplementation with undefined components drastically
improves growth. The use of undefined components such as fetal bovine serum (FBS),
horse serum (HS) or bovine serum albumin (BSA) is a setback when cultures with defined
Chapter 2
14
media are required, such as in proteomics or metabolomics studies. The exact function of
the supplements added to the culture medium is unknown, and it is not yet clear whether
supplements have a nutritional function. Animal serum, for example, is a very rich mixture
of components, considered undefined and variable, although some compounds have been
identified such as protein components, hormones, fatty acids, vitamins and growth factors,
among others64. It is hypothesized that serum may act as a growth-stimulating factor65,66,
but it can also be speculated that it acts as an attachment and/or detoxifying factor by
binding to and inactivating toxic compounds, like in cell culture media64.
Cyclodextrin, another frequently used supplement, was described to increase
medium viscosity and osmolarity67 and/or to act by chelating toxic molecules present in the
culture medium or produced by microbial metabolism65,67,68. Cholesterol is considered a
growth-enhancing compound67,69, and it is present in serum and blood. It was found that H.
pylori can incorporate cholesterol and it comprises around 25% of the lipid membrane
content of H. pylori 70–73, although it seems that H. pylori cannot synthesize it, neither it is
an absolute requirement for growth67.
In fact, the use of defined liquid media for H. pylori was reported74–76. All of the
described media have similar basis, with differences, in some cases, only in one amino
acid74. Inorganic salts and vitamins are also present, although some media have only
thiamine75. Other components are present, such as glucose74–76, pyruvate67, lipoic acid67,77
among others. Ham’s F-12 is the most complete medium in terms of compounds, but with
lower concentrations of amino acids. In addition, it was described to support robust
growth, even using small inocula67,78.
However, in none of the reported studies has H. pylori survived in the defined
medium without adaptation. This adaptation to completely defined media, without
supplements, was achieved by either replacing complex by defined medium in continuous
cultures75 or by diluting semi-defined medium with fresh medium without supplements with
subsequent passages to defined medium79. In other cases, H. pylori only survives in
defined media if it is directly inoculated from plates for each liquid experiment.

State of the art
15
Table 2.1. Complex solid media described for H. pylori growth.
Different media described for H. pylori growth. When the medium is a derivation from another medium this is indicated in the components column. When the purpose of the
medium was other than cultivation, it is indicated in the notes column. Supplements: w/o – without; YE – yeast extract; Serum-based – with one of the following serum-based
supplements, horse serum, fetal calf serum, calf serum, iron-supplemented calf serum, heat-treated fetal bovine serum; heat-treated adult bovine serum; Blood-based – with one of
the following blood-based supplements, human blood, rabbit blood, horse blood, heated horse blood; lysed horse blood, defibrinated horse blood, sheep blood, defibrinated sheep
blood; HM – hemin; EYE – egg yolk emulsion, CL – cholesterol; BSA – bovine serum albumin or lipid-rich bovine serum albumin; CD – β-cyclodextrin or 2,6-di-O-methyl-β-
cyclodextrin; ST – starch or cornstarch; CC – charcoal or activated charcoal. TTC - Triphenyl tetrazolium chloride; IsoVitaleX – enrichment with glucose, amino acids, vitamins,
nucleotides and iron.
Medium Components
added
Supplements
Notes Reference w/o YE
Serum-
based
Blood-
based HM EYE CL BSA CD ST CC
Belo Horizonte
Medium
BHIA
TTC � - Queiroz et al. (1987)80
Blood Agar
Base
- � Isolation and
subcultivation Ansorg et al. (1991)81
- � -
Hutton et al. (2012)82 - � -
- � --
- � -
Brain Heart Infusion
Agar (BHIA)
- � - Kehler et al. (1994)83
IsoVitaleX
Antibiotics � - Goodwin et al. (1985)84
- � Isolation Hachem et al. (1995)85 IsoVitaleX � - Westblom et al. (1991)86
Chapter 2
16
Table 2.1. Complex solid media described for H. pylori growth. (Continued).
Medium Components added
Supplements
Notes Reference w/o YE
Serum-
based
Blood-
based HM EYE CL BSA CD ST CC
Brain Heart Infusion Agar (BHIA)
- � - Ohno and Murano
(2007)87
- � - Shibayama et al.
(2006)88
Brucella Agar (BA)
- � - Buck and Smith
(1987)89 - � -
- � -
Brussels Campylobacter Charcoal Agar
TTC Antibiotics
� � � Isolation and subcultivation Ansorg et al. (1991)81
Brugmann agar (Horse blood based)
Agar TTC
Antibiotics �
Selective medium
for isolation from biopsies
Deyi et al. (2010)90
Campylobacter pylori selective (CPS)
CBA Skirrow’s medium with
modifications �
Selective medium
for isolation
Dent and McNulty
(1988)91
Columbia base agar (CBA)
- � - Secker et al. (1991)92 IsoVitaleX
Urea Phenol red
Granulated agar
� Detection of
urease activity Cellini, et al. (1992)93
- � - Olivieri et al. (1993)94
IsoVitaleX � - Albertson et al.(1998)69
- � - Stevenson et al.
(2000)95
State of the art
17
Table 2.1. Complex solid media described for H. pylori growth. (Continued).
Medium
base
Components
added
Supplements
Notes Reference w/o YE
Serum-
based
Blood-
based HM EYE CL BSA CD ST CC
Chocolate agar (CBA based)
CBA
� Buck and Smith
(1987)89 � -
� -
CBA � Transport medium Xia et al.(1993)96
Egg Yolk Enulsion (EYE) Agar
CBA based IsoVitaleX
TTC � -
Westblom et al.
(1991)86
GAB-CAMP medium modified
GC agar base IsoVitaleX Antibiotics
� - Soltesz et al.
(1992)97
GC agar base � � - Taneera et al.
(2002)98
Gonococci (GC) Agar Base
- � -
Buck and Smith
(1987)89
- � -
- � -
- � � -
GCHI chocolate agar Antibiotics � - Morgan et al.
(1987)99
H. pylori special peptone agar (HPSPA)
Special peptone Yeast extract Beef extract
Sodium chloride Pyruvic acid Sodium Salt
Granulated agar
� Selective medium for
isolation from cattle and beef samples Stevenson et al.
(2000)95
� -
Chapter 2
18
Table 2.1. Complex solid media described for H. pylori growth. (Continued).
Medium
base
Components
added
Supplements
Notes Reference w/o YE
Serum-
based
Blood-
based HM EYE CL BSA CD ST CC
HP agar (HPSPA based)
Yeast extract Beef extract
Special peptone Sodium chloride Hydrochloric acid
Urea Phenol red Antibiotics
� Selective medium for
water samples
Degnam et al.
(2003)100
Iso-sensitest agar (Oxoid)
- � Antimicrobial
susceptibility test
Hartzen et al.
(1997)101
Johnson Murano Agar
- � - Stevenson et al.
(2000)95
Modified Glupczynski medium
BHIB Based Legionella CYE
agar TTC
Antibiotics
� � Selective medium
Tee et al.
(1991)102
BHIB Based Legionella CYE
agar � -
Stevenson et al.
(2000)95
Mueller-Hinton Agar (MHA)
- � - Buck and Smith
(1987)89
- � - Olivieri et al.
(1993)94
State of the art
19
Table 2.1. Complex solid media described for H. pylori growth. (Continued).
Medium
base
Components
added
Supplements
Notes Reference w/o YE
Serum-
based
Blood-
based HM EYE CL BSA CD ST CC
Mueller-Hinton Agar (MHA)
- � -
Walsh and Moran (1997)103
Stevenson et al. (2000)95
Vega et al.(2003)104
Skirrow Agar
Antibiotics � Isolation from
biopsies Krajden et al. (1987)105
Antibiotics
�
Isolation from biopsies
Coudron and Kirby (1989)106 � �
� � �
Tryptic Soy Agar (TSA)
- � Isolation from
biopsies
Coudron and Kirby (1989)106
Hachem et al. (1995)85
Walsh and Moran (1997)103
- � � Isolation from
biopsies Coudron and Kirby (1989)106
Vestfold Charcoal (Charcoal agar based)
IsoVitaleX TTC
� - Henriksen et al. (2000)107
Chapter 2
20
Table 2.2. Complex liquid media described for H. pylori growth.
Different media described for H. pylori growth. When the objective of the medium was other than cultivation, this is indicated in the notes column. w/o – without; YE – yeast extract;
Serum-based – with one of the following serum-based supplements, horse serum, fetal calf serum, new-born calf serum, iron-supplemented calf serum, heat-inactivated horse
serum, heat-treated fetal bovine serum, heat-treated adult bovine serum, human serum; Blood-based – with one of the following blood-based supplements, human blood serum,
human blood lysed, human erythrocyte lysate, lamb blood; PGM – porcine gastric mucin; BSA – bovine serum albumin or lipid-rich bovine serum albumin; HM – hemin; CL –
cholesterol; CD – α-cyclodextrin, β-cyclodextrin or 2,6-di-O-methyl-β-cyclodextrin; CE – cyanobacterial extract; ST – starch or cornstarch; MC – methyl cellulose; AC – activated
charcoal; IsoVitaleX – enrichment with glucose, amino acids, vitamins, nucleotides and iron; Vitox - enrichment with glucose, amino acids, vitamins, nucleotides and iron.
Medium
base
Components
added
Supplements
Notes Reference w/o YE
Serum-
based
Blood-
based PGM BSA HM CL CD CE ST MC AC
Brain Heart
Infusion Broth
(BHIB)
- � -
Shahamat et al.
(1991)108
Kehler et al. (1994)83
- � - Shahamat et al.
(1991)108
- �
Cultivation
from
biopsies
Shahamat et al.
(1991)108
Xia et al.(1993)96 Jiang and Doyle
(2000)109 Sainsus et al.
(2008)78
- � � Transport
medium
Shahamat et al.
(1991)108
Xia et al.(1993)96
- � - Stevenson et al.
(2000)95
State of the art
21
Table 2.2. Complex liquid media described for H. pylori growth. (Continued).
Medium
base
Components
added
Supplements
Notes Reference w/o YE
Serum-
based
Blood-
based PGM BSA HM CL CD CE ST MC AC
Brain Heart Infusion
Broth (BHIB)
Antibiotics � - Jiang and Doyle (2000)109
- � Enzyme
expression
Hutton et al. (2012)82
Lin et al. (1996)110
Ferrous sulphate
Sodium pyruvate
With or without
antibiotics
� � - Jiang and Doyle (2000)109
- � - Shibayama et al. (2006)88
- � - Ohno and Murano (2007)87
Hutton et al. (2012)82
Blood agarose
Vitox
Antibiotics (DENT)
� - Duque-Jamaica et al. (2010)111
- � - Hutton et al. (2012)82
- � -
Brucella Broth (BB)
- �
Cultivation
from
biopsies
Buck and Smith (1987)89
Shahamat et al. (1991)108
Sainsus et al. (2008)78
- � � - Shahamat et al. (1991)108
Chapter 2
22
Table 2.2. Complex liquid media described for H. pylori growth. (Continued).
Medium
base Components added
Supplements
Notes Reference w/o YE
Serum-
based
Blood-
based PGM BSA HM CL CD CE ST MC AC
Brucella Broth (BB)
- � -
Morgan et al. (1987)99
Secker et al. (1991)92
Olivieri et al. (1993)94
Albertson et al. (1998)69
Douraghi et al. (2010)65
- � - Buck and Smith
(1987)89 - � -
- � -
- � -- Olivieri et al. (1993)94
Albertson et al.(1998)69
Sodium polyanetholsulfonate
� - Kehler et al. (1994)83
Antibiotics � - Marchini et al. (1995)68
IsoVitaleX � -- Westblom et al. (1991)86
IsoVitaleX � - Kitsos and Stadtlander
(1998)112
Glucose � - Sato et al. (2003)113
- � - Douraghi et al. (2010)65
- � - Park et al. (2011)114
Hepes Trace metals
Sodium pyruvate � �
Regrowth medium
Richards et al. (2011)115
State of the art
23
Table 2.2. Complex liquid media described for H. pylori growth. (Continued).
Medium
base
Components
added
Supplements
Notes Reference w/o YE
Serum-
based
Blood-
based PGM BSA HM CL CD CE ST MC AC
Buffered yeast extract-α-
ketoglutarate (BYEα)
- � - Shahamat et al.
(1991)108 - � � -
Customized
Tryptone Yeast extract Trace metals
Tris Magnesium chloride
� � - Andersen et al.
(1997)116
Columbia Broth (CB)
- � - Shahamat et al.
(1991)108 - � - - � � -
Gonoccocal broth (GB) - � - Taneera et al.
(2002)98
H. pylori special peptone broth (HPSPB)
Special peptone Yeast extract Beef extract
Sodium chloride Pyruvic acid Sodium salt
� - Stevenson et al.
(2000)95
Modified Brucella Broth
Tryptone Peptamine
Glucose Yeast extract
Sodium chloride
� - Lin et al.
(1996)110
Chapter 2
24
Table 2.2. Complex liquid media described for H. pylori growth. (Continued).
Medium
base
Components
added
Supplements
Notes Reference w/o YE
Serum-
based
Blood-
based PGM BSA HM CL CD CE ST MC AC
Mueller-Hinton Broth (MHB)
- � - Shahamat et al.
(1991)108 - � -
- � Cultivation
from biopsies
Shahamat et al.
(1991)108
Sainsus et al. (2008)78
- � � -
Shahamat et al.
(1991)108 Walsh and Moran
(1997)103
Cation-adjusted � - Coudron and Stratton
(1995)117 Cation-adjusted � -
Proteose peptone nº3
� - Walsh and Moran
(1997)103
- � -
Stevenson et al.
(2000)95
Vega et al. (2003)104
- � -
Vega et al.(2003)104 0.3% agar � Transport medium
Porcine stomach mucin (10% in water)
- � Preservation
medium Ansorg et al. (1991)81
Stuart transport medium
- � Transport medium Soltesz et al. (1992)97
Supplemented peptone - � - Kehler et al. (1994)83
State of the art
25
Table 2.2. Complex liquid media described for H. pylori growth. (Continued).
Medium
base
Components
added
Supplements
Notes Reference w/o YE
Serum-
based
Blood-
based PGM BSA HM CL CD CE ST MC AC
Tryptic Soy Broth (TSB)
- � - Shahamat et al.
(1991)108 - � -
- � Cultivation from
biopsies
Shahamat et al.
(1991)108 Sainsus et al.
(2008)78
- � � -
Shahamat et al.
(1991)108 Walsh and Moran
(1997)103
Proteose peptone nº3
� - Walsh and Moran
(1997)103
Chapter 2
26
Table 2.3. Semi-defined liquid media (defined media supplemented with undefined components) described for H. pylori growth.
Different media used for H. pylori growth. When the objective of the medium was other than cultivation, this is indicated in the notes column. w/o – without; YE – yeast extract;
Serum-based – with horse serum or fetal calf; HG – haemoglobin; BSA – bovine serum albumin or lipid-rich bovine serum albumin; CD –2,6-di-O-methyl-β-cyclodextrin.
Medium base Components added
Supplements
Notes Reference YE
Serum-
based HG BSA CD
Customized
Salts Trace metals (iron sulphate)
Glucose Phenol red
Adenine Lipoid acid Vitamins
Amino acids (all 20, except tyr)
� - Reynolds and Penn (1994)77
Customized Reynolds and Penn medium � - Albertson et al. (1998)69
Glucose � - Albertson et al. (1998)69
Customized Agarose � - Vartanova et al. (2005)118 Culture Indication medium
(CIM) – Modified Ham’s F-12 - � - Sainsus et al. (2008)78
Dubelcco’s Modified Eagle Medium (DMEM)
� � Thin-layer liquid culture
technique Joo et al. (2010)119
Ham’s F-12
- � Growth, storage and
recovery BSA (98% purity)
Testerman et al. (2001)67
- � Growth, storage and
recovery Testerman et al. (2001)67
- � Cultivation from biopsies Sainsus et al. (2008)78
State of the art
27
Table 2.3. Semi-defined liquid media (defined media supplemented with undefined components) described for H. pylori growth. (Continued).
Medium base Components added
Supplements
Notes Reference YE
Serum-
based HG BSA CD
Modified Isosensitest broth Amino acids (all, except his and trp, with
ornithine) �
Without saccharides, hydrolyzed casein and
peptones Mendz and Hazell (1995)120
Roswell Park Memorial Institute (RPMI).1640
- � � Thin-layer liquid culture
technique Joo et al. (2010)119
- � � Thin-layer liquid culture technique
Joo et al. (2010)119
Table 2.4. Defined media described for H. pylori growth.
Different defined media described for H. pylori growth. When the objective of the medium was other than cultivation, this is indicated in notes column. w/o – without; CL –
cholesterol; BCD - β-cyclodextrin; 2,6DMBCD - 2,6-di-O-methyl-β-cyclodextrin.
Medium base Components added Supplements
Notes Reference w/o CL BCD 2,6DMBCD
Customized
ACES buffer Salts
Trace metals Thiamine
Hypoxanthine Amino acids (all 20, except asn, cys, gln,
gly, lys and thr)
� - Nedenskov (1994)74
Chapter 2
28
Table 2.4. Defined media described for H. pylori growth. (Continued).
Medium base Components added Supplements
Notes Reference w/o CL BCD 2,6DMBCD
Customized
Salts Trace metals
Thiamine Hypoxanthine
Nytropyrin Adenine Uracil
Guanine Xanthine Glucose
Amino acids (all 20, with cystine)
� Continuous culture Stark et al. (1997)121
Customized by Reynolds and Penn Glucose � � - Albertson et al. (1998)69
Ham’s F-12 - �
Growth, storage and recovery Testerman et al. (2001)67 - � �
F-12m: Ham’s F-12 based
Salts Trace metals Phenol red Thiamine
Hypoxanthine Sodium pyruvate
Amino acids (all 20, except gly and lys)
� - Testerman et al. (2001)67
Ham’s F-12 based
Salts Trace metals Phenol red Thiamine
Hypoxanthine Sodium pyruvate
Amino acids (ala, arg, cys, his, leu, met, phe, val)
� - Testerman et al. (2006)79
State of the art
29
2.3.2 Environmental conditions
H. pylori has been considered a microaerophilic bacterium, growing at low
percentages of oxygen. However, in the last years, some studies proved that percentages
of oxygen between 5 and 21% are tolerated by H. pylori. In fact, H. pylori can grow in
aerobic conditions at high cell concentrations, although at low cell densities H. pylori
behaves more like an oxygen-sensitive microarophile114,122. An absolute requirement of
carbon dioxide in the growth atmosphere has been reported, showing that H. pylori is a
capnophilic organism114,122. Whereas some anaerobic features were identified in H. pylori’s
metabolism, its growth under strictly anaerobic conditions has not been successfully
reported122–124, being oxygen an absolute requirement for growth. In fact, several
experiments have been performed under the absence of oxygen with evidence for some
metabolic activity such as substrates consumption and by-products formation and those
will be mentioned along this text. Nevertheless, none of those authors has reported any
growth in the absence of oxygen.
Despite the fact that H. pylori can grow in vitro under aerobic conditions,
microaerobiosis seems to mimic better the physiology of the organisms grown in their
natural habitat122,125. Thus, usually H. pylori is grown in vitro using an atmosphere with a
mixture of 5% O2, 10% CO2 and 85% N2, generated by microaerophilic gas-generating
systems in jars, or in incubators where the gas mixture is continuously flushed, under high
humidity content and at 37ºC.
Usually, the pH is not adjusted during H. pylori cultures in vitro, and the media
used are frequently buffered. Some studies in fermenters with pH control were also
performed121,126. It is assumed that the optimal pH for H. pylori growth is around 7, although
H. pylori can support a wide range of pH values (2-8.6)127. H. pylori has mechanisms to
survive under acidic conditions, such as the urease enzyme, which decompose urea,
generating bicarbonate and ammonia, thus, increasing pH. The adjustment of the pH by
H. pylori during cultures was reported by Andersen et al. (1997), concluding that optimal
growth occurs until the pH reaches 8.5128.
Chapter 2
30
Cultures with and without shaking have been described, although agitation is used
the majority of times, since generally higher cell densities are obtained, unless small
volumes of liquid and high interface areas are used95.
A few studies111,129 attempted to improve liquid cultivation based rational
optimization strategies like statistical experimental design of culture conditions
(atmosphere, pH, shaking speed, inoculum concentration, volume of culture).
2.4 Helicobacter pylori’s Metabolism
H. pylori is very well adapted to its specific niche and able to persist in the human
stomach lifelong. This ability is conferred by unique metabolic and physiological features130.
However, the knowledge acquired about the metabolism of H. pylori is still very limited,
needing further exploration. In this section, the current information on the most important
metabolic pathways of this bacterium is summarized.
2.4.1 Carbohydrates utilization
The capability of H. pylori to acquire and metabolize carbohydrates is very limited.
The capacity of consuming glucose was initially denied but the first genome sequencing131
disproved this assumption, corroborating experimental data obtained by Mendz et al.
(1993)132. Further enzymatic experiments proved that, notwithstanding glucose is minimally
utilized by H. pylori, this organism presents a complex glucose metabolism133.
A D-glucose sodium-dependent transport system was experimentally identified for
H. pylori 134 and was also verified by genome analysis with the identification of a
glucose/galactose transporter (gluP, HP1174)131,135. Psakis et al. (2009) showed that D-
mannose can also be transported by the HP1174 transporter136. Further genome analyses
indicate that this gene is possibly the only gene encoding a transport protein for sugars in
H. pylori 136,137. Glucose phosphorylation was proved to be associated with a glucokinase
activity, that was both detected in vitro 138 and identified in the genomic sequence
State of the art
31
(HP1103)131. Glucose catabolism via the pentose phosphate pathway was proved by Mendz
et al. (1991)139, who also suggested there is another pathway involved in glucose
metabolism140, with the main metabolic product detected from glucose being lactate. In
contrast, Chalk et al. (1994) reported glucose oxidation via the Entner-Doudoroff (ED)
pathway with mainly acetate as a product (aerobically). Sorbitol and gluconate were also
identified as glucose products when dense cell suspensions were incubated with 13C
labeled glucose under anaerobic conditions141. In spite of the existing enzymatic capabilities
for the utilization of glucose as the main source of carbon and energy, there are evidences
that amino or organic acids are effectively the preferred carbon and energy sources for H.
pylori growth120. This topic will be further explored in the next chapters.
2.4.2 Central carbon metabolism
2.4.2.1 Glycolysis and gluconeogenesis
In the glycolysis pathway, glucose is converted into pyruvate with ATP generation,
providing part of the energy utilized by most organisms. Gluconeogenesis, the formation of
glucose from non-carbohydrate sources, such as pyruvate, shares the enzymes with
glycolysis with the exception of irreversible reactions that are only glycolytic or
gluconeogenic. The presence of glycolysis in H. pylori is doubtful. Hoffman et al. (1996)
reported enzymatic activities for all glycolytic enzymes, as well as gluconeogenic enzymatic
activities. However, he found less enzymatic activity in exclusive glycolytic enzymes when
compared with exclusive gluconegenic enzymes133. In contrast, Mendz et al. (1994) and
Chalk et al. (1994) were not able to detect the presence of the glycolytic pathway141,142.
Homologues to enzymes involved in glycolysis and gluconeogenesis are present in H.
pylori with the exception of the glycolytic enzymes catalyzing irreversible reactions, the
phosphofructose kinase and pyruvate kinase, which were not identified in the
genome130,131,135. The absence of these two enzymes, and the presence of the irreversible
gluconeogenic enzymes (fructose-1,6-biphosphatase and pyruvate dikinase) indicates that
the gluconeogenesis pathway is active, but glycolysis is not 130,135.
Chapter 2
32
2.4.2.2 Entner-Doudoroff and Pentose Phosphate pathways
In alternative to glycolysis, glucose can be catabolized by the Entner-Doudoroff
(ED) or the Pentose Phosphate (PP) pathways. In agreement with the genomic sequence131,
there is experimental evidence for the presence of the ED pathway in H. pylori, proved with
NMR141,143, and enzymatic experiments133. Although the ED pathway can be viewed as an
option for H. pylori to utilize glucose as an energy source, experiments with H. pylori in
mice proved that this metabolic pathway is not essential for colonization of the mouse
gastric mucosa144, being a non-inducible pathway. It has been suggested that this pathway
can also be used to consume gluconate or other aldonic acids, but without experimental
evidence144.
Evidences for the existence of the PP pathway (both oxidative and reductive
branches) have been reported for H. pylori 133,139. The PP pathway can provide NADPH for
reductive biosynthesis and ribose-5-phosphate for nucleotides synthesis139. Chalk et al.
(1994), in their experiments using 13C NMR spectroscopy were not able to detect glucose
oxidation by the PP pathway, suggesting that in H. pylori it may be mainly a biosynthetic
route141. Regarding sequence similarity, all encoding enzymes of the PP pathway were
identified in the genome, with the exception of the 6-phosphogluconate dehydrogenase,
which is responsible for the oxidative decarboxylation of 6-phosphogluconate to ribulose-5-
phosphate, leading to conclude that H. pylori may have another protein with a similar
function135 or that indeed only the reductive branch is active in this organism.
2.4.2.3 Pyruvate metabolism
Pyruvate is a key metabolite, being an important intermediary in H. pylori’s
metabolism both for anabolic pathways or an intermediary for cofactors oxidation. The
main sources for pyruvate in H. pylori were found to be lactate, L-alanine, L-serine and D-
amino acids130,142.
It has been described that H. pylori converts pyruvate to acetyl coenzyme A only
by pyruvate:flavodoxin oxidoreductase (PFOR)145,146. The presence of this enzyme
contributes to H. pylori’s microaerophilic phenotype, since PFOR is oxygen labile146. St

State of the art
33
Maurice et al. (2007) identified activity of NADPH flavodoxin and quinone reductase (FqrB)
(HP1164). FqrB is coupled by flavodoxin to the PFOR system and catalyzes a pyruvate-
dependent production of NADPH147. The reverse reaction produces pyruvate via CO2
fixation, which is consistent with H. pylori’s capnophilic nature147.
According to experimental results, pyruvate is not a principal nutrient but it is
quickly metabolized by cells, often with production of acetate, formate, lactate, succinate
and alanine microaerobically120,142. However, homologues for pyruvate formate-lyase and
pyruvate oxidase were not detected in H. pylori’s genome130, and thus the enzyme
associated with formate production is not known. In acetate formation from pyruvate,
pyruvate is first converted to acetyl-CoA by PFOR, then to acetyl-phosphate by a
phosphotransacetylase, (HP905) and finally to acetate by acetate kinase (HP903). Also,
acetyl-CoA synthetase, that converts acetyl-CoA to acetate in a single step was identified
(acoE, HP1045)130. D-Lactate dehydrogenase, responsible for D-lactate production was also
identified by sequence homology (dld, HP1222)148. As shown experimentally, H. pylori
exhibit some metabolic features characteristic of anaerobic organisms, such as the
production of acetate and formate in mixed-acid fermentation. The presence of mixed-acid
fermentation can be interpreted as a metabolic adaptation of its specific niche, as stressed
by Mendz et al. (1995)142. The formation of succinate suggests that part of the TCA cycle is
active and operating in the reductive direction, also characteristic of anaerobiosis142.
Although, as referred previously, H. pylori fails to grow under strict anaerobic conditions in
the laboratory, the mentioned anaerobic features may be important in vivo for survival
under determined conditions, and may play an important role in transmission.
2.4.2.4 Tricarboxylic acid cycle
The existence of a complete oxidative tricarboxylic acid (TCA) cycle has been a
controversial point about H. pylori’s metabolism. Genomic evidences had previously
indicated that H. pylori does not have a complete TCA cycle, lacking genes codifying
enzymes for three usual TCA cycle enzymes (alpha-ketoglutarate dehydrogenase, succinyl-
CoA synthetase and malate dehydrogenase)131,135. The presence of the TCA cycle in H. pylori
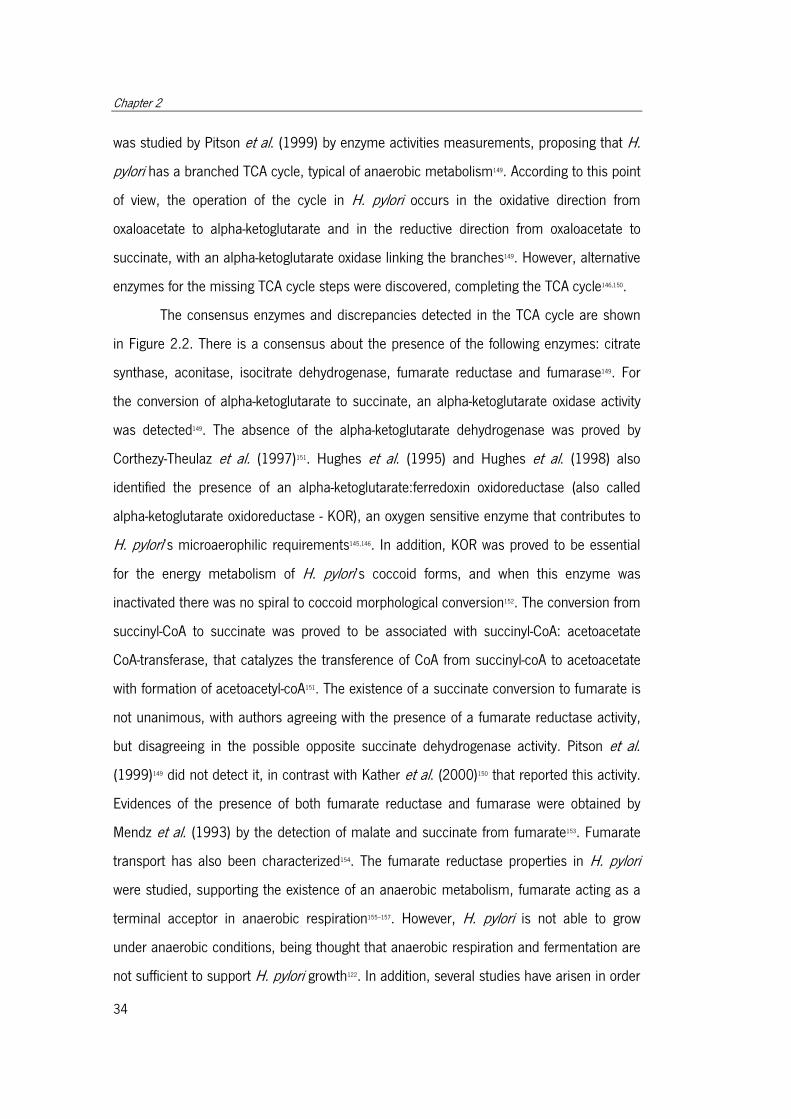
Chapter 2
34
was studied by Pitson et al. (1999) by enzyme activities measurements, proposing that H.
pylori has a branched TCA cycle, typical of anaerobic metabolism149. According to this point
of view, the operation of the cycle in H. pylori occurs in the oxidative direction from
oxaloacetate to alpha-ketoglutarate and in the reductive direction from oxaloacetate to
succinate, with an alpha-ketoglutarate oxidase linking the branches149. However, alternative
enzymes for the missing TCA cycle steps were discovered, completing the TCA cycle146,150.
The consensus enzymes and discrepancies detected in the TCA cycle are shown
in Figure 2.2. There is a consensus about the presence of the following enzymes: citrate
synthase, aconitase, isocitrate dehydrogenase, fumarate reductase and fumarase149. For
the conversion of alpha-ketoglutarate to succinate, an alpha-ketoglutarate oxidase activity
was detected149. The absence of the alpha-ketoglutarate dehydrogenase was proved by
Corthezy-Theulaz et al. (1997)151. Hughes et al. (1995) and Hughes et al. (1998) also
identified the presence of an alpha-ketoglutarate:ferredoxin oxidoreductase (also called
alpha-ketoglutarate oxidoreductase - KOR), an oxygen sensitive enzyme that contributes to
H. pylori’s microaerophilic requirements145,146. In addition, KOR was proved to be essential
for the energy metabolism of H. pylori’s coccoid forms, and when this enzyme was
inactivated there was no spiral to coccoid morphological conversion152. The conversion from
succinyl-CoA to succinate was proved to be associated with succinyl-CoA: acetoacetate
CoA-transferase, that catalyzes the transference of CoA from succinyl-coA to acetoacetate
with formation of acetoacetyl-coA151. The existence of a succinate conversion to fumarate is
not unanimous, with authors agreeing with the presence of a fumarate reductase activity,
but disagreeing in the possible opposite succinate dehydrogenase activity. Pitson et al.
(1999)149 did not detect it, in contrast with Kather et al. (2000)150 that reported this activity.
Evidences of the presence of both fumarate reductase and fumarase were obtained by
Mendz et al. (1993) by the detection of malate and succinate from fumarate153. Fumarate
transport has also been characterized154. The fumarate reductase properties in H. pylori
were studied, supporting the existence of an anaerobic metabolism, fumarate acting as a
terminal acceptor in anaerobic respiration155–157. However, H. pylori is not able to grow
under anaerobic conditions, being thought that anaerobic respiration and fermentation are
not sufficient to support H. pylori growth122. In addition, several studies have arisen in order

State of the art
35
to investigate fumarate reductase as a potential therapeutic target156–158. The role of
fumarate reductase in host colonization was studied by Ge et al. (2000), concluding that,
although it is not essential for H. pylori’s survival in vitro, it is very important for survival in
gastric mice mucosa158.
For the conversion of malate to oxaloacetate, the activity of a malate
dehydrogenase was detected149,159, whereas Kather et al. (2000) proved the presence of a
malate:quinone oxidoreductase for the same conversion, without evidence of the
reversibility of this step (reduction of oxaloacetate), showing that, in some situations, the
TCA cycle of H. pylori can operate in the oxidizing direction150. In the genome, however, the
gene codifying for malate dehydrogenase was not identified131, but a malate:quinone
oxidoreductase was identified (HP0086)150. The activity of the anaplerotic enzymes pyruvate
carboxylase, phosphoenolpyruvate carboxylase and phosphoenolpyruvate carboxykinase
was not detected146 or was very low159. Anaplerotic reactions would nevertheless be very
important to replenish oxaloacetate159. Additionally, the glyoxylate bypass was not identified,
being only detected the activity of malate synthase and missing isocitrate lyase to
complete the pathway149. The presence of malate synthase can be viewed as a direct entry
for glyoxylate into the TCA cycle or into a glyoxylate oxidizing cycle149. However, malate
synthase was not identified in the genomic sequence131.
The gamma-aminobutyrate shunt, an alternative to convert alpha-ketoglutarate to
succinate, was not detected in H. pylori 149 although it was detected in H. bizzozeronii, a
canine-adapted organism cultivated from human gastric biopsies160.
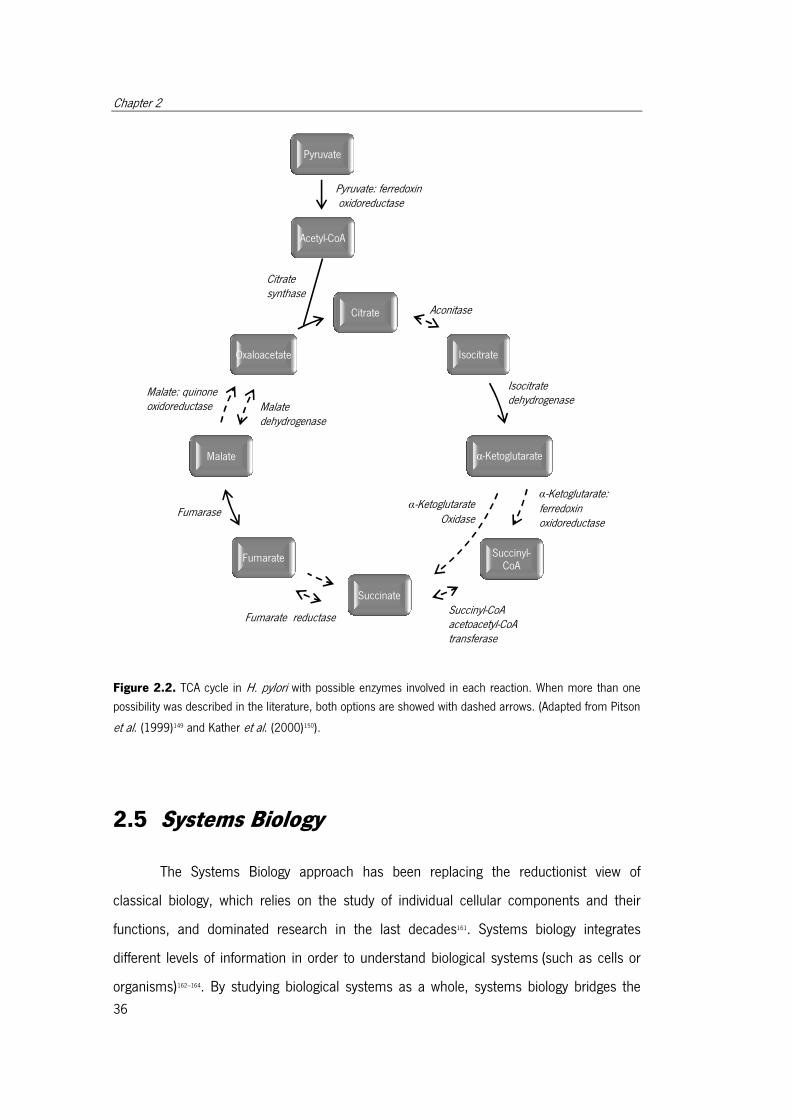
Chapter 2
36
Figure 2.2. TCA cycle in H. pylori with possible enzymes involved in each reaction. When more than one
possibility was described in the literature, both options are showed with dashed arrows. (Adapted from Pitson
et al. (1999)149 and Kather et al. (2000)150).
2.5 Systems Biology
The Systems Biology approach has been replacing the reductionist view of
classical biology, which relies on the study of individual cellular components and their
functions, and dominated research in the last decades161. Systems biology integrates
different levels of information in order to understand biological systems (such as cells or
organisms)162–164. By studying biological systems as a whole, systems biology bridges the
Citrate
Isocitrate
α-Ketoglutarate
Succinyl-CoA
Fumarate
Malate
Oxaloacetate
Succinate
Acetyl-CoA
Pyruvate
Citrate synthase
Pyruvate: ferredoxinoxidoreductase
Aconitase
Succinyl-CoAacetoacetyl-CoAtransferase
Isocitratedehydrogenase
α-Ketoglutarate:ferredoxinoxidoreductase
α-KetoglutarateOxidase
Fumarate reductase
Fumarase
Malate: quinoneoxidoreductase Malate
dehydrogenase
State of the art
37
gap between molecules and physiology165. In the last years, with the advances in molecular
biosciences, genome-sequencing and the development of high-throughput molecular
methods that allow to characterize cellular components at a given time, the notion of
cellular networks has arisen and turned into the research focus161,165.
The systems biology approach is only possible by the integration of experimental
and computational knowledge with the use of a range of analytical techniques,
measurement technologies, experimental methods and software tools162,163. It is accepted
that Systems Biology is inter-disciplinary, applying the knowledge of disciplines such as
biology, physics, chemistry, engineering and computer science166.
Depending on the goal to achieve, there are two different systems biology
approaches that can be applied. One approach starts from the bottom (constitutive parts)
and applies detailed knowledge about the system to construct mathematical models that
can be used to simulate the system’s behavior (bottom-up systems biology). In the other
approach, biological information is extracted from “omics” data with the goal to disclose
and characterize molecular mechanisms (top-down systems biology)165,167–169.
2.5.1 “Omics” Technologies
The “omics” era started with the use of the word “genomics” by Thomas H.
Roderick in 1986, to name a journal, which included sequencing data, discovery of new
genes, gene mapping and new genetic technologies170. Nowadays, the term “omics” is
largely applied to refer the study of a variety of “omes”, encompassing the study of a
complete set of a given type of system components. As such, genomics, transcriptomics,
proteomics and metabolomics refer to the analysis of the genome (complete set of genes);
transcriptome (complete set of transcripts), proteome (complete set of proteins) and
metabolome (complete set of metabolites), respectively. The evolution in analytical
methods and technologies and the introduction of high-throughput methods has supported
the “omics” concept, allowing the analysis of cellular functions. The “omics” technologies
rely on the generation of large-scale datasets, being a systems biology challenge to deal
with all of these data, to extract the biological meaning and to integrate the different levels
Chapter 2
38
of information with the final goal of understanding the system as a whole and characterize
phenotypes.
In Figure 2.3 the various “omics” technologies are outlined, targeting different
levels of cellular information, with indication of the most applied technologies in each
“omic”.
Figure 2.3 “Omes” and respective “omics” technologies. Examples of methods that allow their analysis.
According to the work developed under this dissertation, metabolomics is further
explored in the next few pages.
2.5.1.1 Metabolomics
Metabolomics is the “omics” technology that aims to identify and quantify the
complete set of small molecules (metabolites or metabolic intermediates) associated with
an organism, tissue, cell or biological sample. In the last years, this approach has been
largely applied to understand biological systems, having some definitions emerged in this
field (Table 2.5).
The level and type of metabolites can be associated with the physiological,
pathological or developmental status of a biological system, representing the closest
indicator of a cell’s phenotype171.
DNA RNA Metabolites
Genomics
DNA Sequencing
Metabolomics
Mass Spectrometry
Nuclear MagneticRessonance
Transcriptomics
MicroarraysOligonucleotide
ChipsRNA Seq
Proteomics
2-D Electrophoresis
Mass Spectrometry
Transcriptome Proteome Metabolome
Proteins MetabolitesRNADNA
Genome
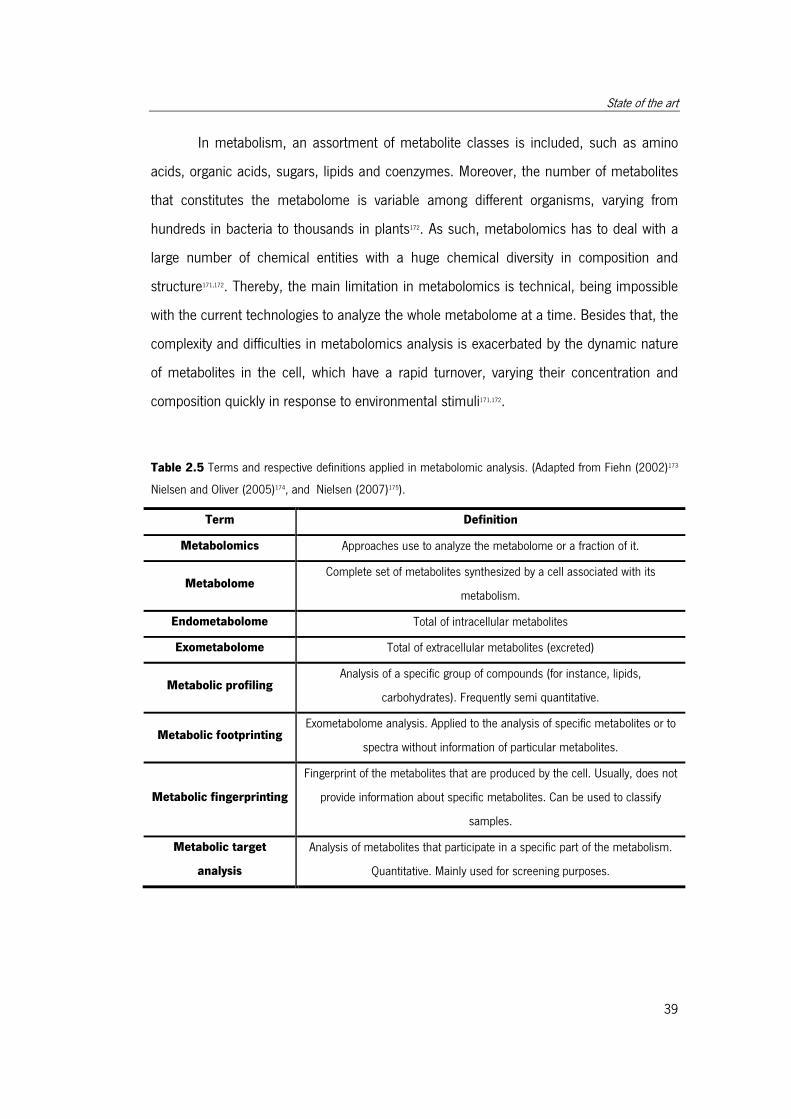
State of the art
39
In metabolism, an assortment of metabolite classes is included, such as amino
acids, organic acids, sugars, lipids and coenzymes. Moreover, the number of metabolites
that constitutes the metabolome is variable among different organisms, varying from
hundreds in bacteria to thousands in plants172. As such, metabolomics has to deal with a
large number of chemical entities with a huge chemical diversity in composition and
structure171,172. Thereby, the main limitation in metabolomics is technical, being impossible
with the current technologies to analyze the whole metabolome at a time. Besides that, the
complexity and difficulties in metabolomics analysis is exacerbated by the dynamic nature
of metabolites in the cell, which have a rapid turnover, varying their concentration and
composition quickly in response to environmental stimuli171,172.
Table 2.5 Terms and respective definitions applied in metabolomic analysis. (Adapted from Fiehn (2002)173
Nielsen and Oliver (2005)174, and Nielsen (2007)175).
Term Definition
Metabolomics Approaches use to analyze the metabolome or a fraction of it.
Metabolome Complete set of metabolites synthesized by a cell associated with its
metabolism.
Endometabolome Total of intracellular metabolites
Exometabolome Total of extracellular metabolites (excreted)
Metabolic profiling Analysis of a specific group of compounds (for instance, lipids,
carbohydrates). Frequently semi quantitative.
Metabolic footprinting Exometabolome analysis. Applied to the analysis of specific metabolites or to
spectra without information of particular metabolites.
Metabolic fingerprinting
Fingerprint of the metabolites that are produced by the cell. Usually, does not
provide information about specific metabolites. Can be used to classify
samples.
Metabolic target
analysis
Analysis of metabolites that participate in a specific part of the metabolism.
Quantitative. Mainly used for screening purposes.
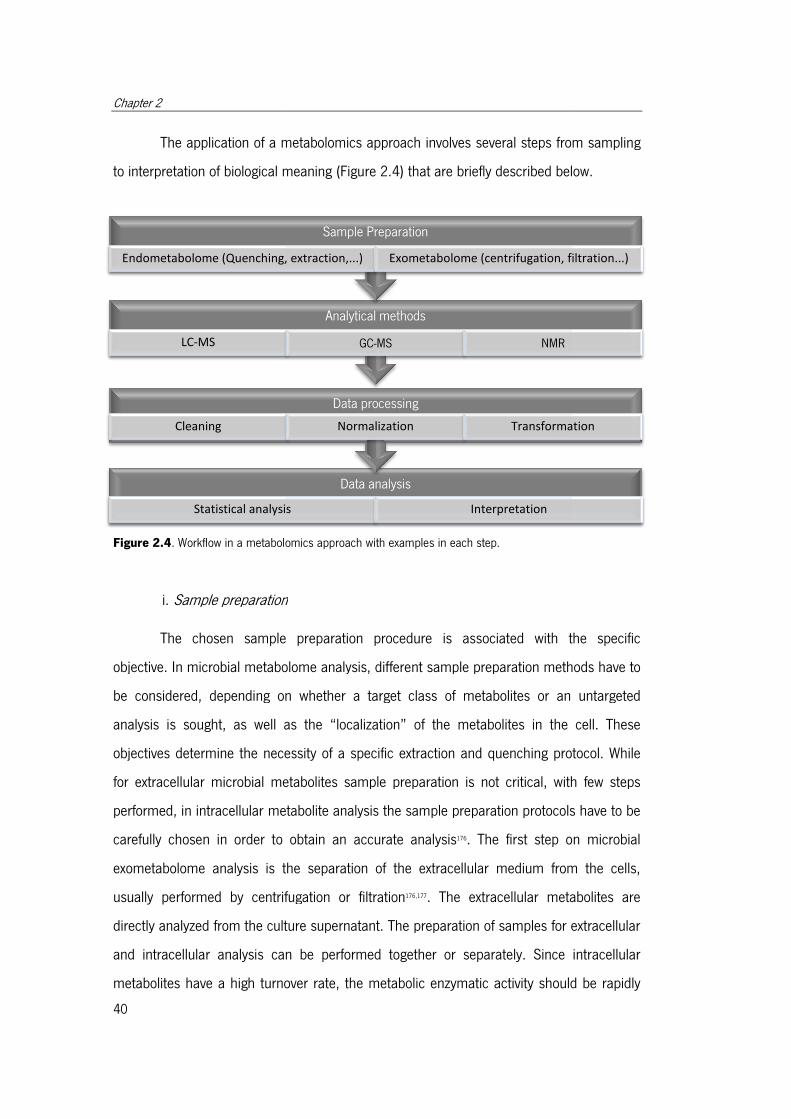
Chapter 2
40
The application of a metabolomics approach involves several steps from sampling
to interpretation of biological meaning (
Figure 2.4. Workflow in a metabolomics approach with examples in each step.
i. Sample preparation
The chosen sample preparation procedure is associated with the specific
objective. In microbial metabolome analysis, different sample
be considered, depending on whether a target class of metabolites or an untargeted
analysis is sought, as well as the “localization” of the metabolites in the cell. These
objectives determine the necessity of a specific extracti
for extracellular microbial metabolites sample preparation is not critical, with few steps
performed, in intracellular metabolite analysis the sample preparation protocols have to be
carefully chosen in order to obtain an a
exometabolome analysis is the separation of the extracellular medium from the cells,
usually performed by centrifugation or filtration
directly analyzed from the culture supernatant. The preparation of samples for extracellular
and intracellular analysis can be performed together or separately. Since intracellular
metabolites have a high turnover rate, the metabolic enzymatic
Statistical analysis
Cleaning
LC-MS
Endometabolome (Quenching, extraction,...)
The application of a metabolomics approach involves several steps from sampling
to interpretation of biological meaning (Figure 2.4) that are briefly described below.
. Workflow in a metabolomics approach with examples in each step.
Sample preparation
The chosen sample preparation procedure is associated with the specific
objective. In microbial metabolome analysis, different sample preparation methods have to
be considered, depending on whether a target class of metabolites or an untargeted
analysis is sought, as well as the “localization” of the metabolites in the cell. These
objectives determine the necessity of a specific extraction and quenching protocol. While
for extracellular microbial metabolites sample preparation is not critical, with few steps
performed, in intracellular metabolite analysis the sample preparation protocols have to be
carefully chosen in order to obtain an accurate analysis176. The first step on microbial
exometabolome analysis is the separation of the extracellular medium from the cells,
centrifugation or filtration176,177. The extracellular metabolites are
directly analyzed from the culture supernatant. The preparation of samples for extracellular
and intracellular analysis can be performed together or separately. Since intracellular
metabolites have a high turnover rate, the metabolic enzymatic activity should be rapidly
Data analysis
Statistical analysis Interpretation
Data processing
Normalization Transformation
Analytical methods
GC-MS NMR
Sample Preparation
Endometabolome (Quenching, extraction,...) Exometabolome (centrifugation, filtration...)
The application of a metabolomics approach involves several steps from sampling
at are briefly described below.
The chosen sample preparation procedure is associated with the specific
preparation methods have to
be considered, depending on whether a target class of metabolites or an untargeted
analysis is sought, as well as the “localization” of the metabolites in the cell. These
on and quenching protocol. While
for extracellular microbial metabolites sample preparation is not critical, with few steps
performed, in intracellular metabolite analysis the sample preparation protocols have to be
. The first step on microbial
exometabolome analysis is the separation of the extracellular medium from the cells,
abolites are
directly analyzed from the culture supernatant. The preparation of samples for extracellular
and intracellular analysis can be performed together or separately. Since intracellular
activity should be rapidly
Transformation
Exometabolome (centrifugation, filtration...)
State of the art
41
stopped (quenching) after cells harvesting for intracellular metabolite analysis178. The
quenching and extraction steps can be done simultaneously with solvents or separately178.
The quenching/extraction protocols applied are variable and can include for instance rapid
changes of temperature (low : < -40°C or high : > 80°C), pH (high alcali: KOH or NaOH or
high acid: perchloric or trichloroacetic acid), the use of cold methanol, cold glycerol-saline
solution, liquid nitrogen or fast filtration176,177,179. For further details, the methods applied for
sample preparation have been thoroughly revised175,180. It should however be emphasized
that different quenching/extraction protocols are being developed and applied for several
organisms, for instance E. coli 181–183, C. glutamicum 182, B. subtilis 184, L. bulgaricus 185, S.
aureus 186, or S. cerevisiae 182,187–189.
In terms of statistical analysis, it is important that a sufficient number of replicates
is performed. Smart et al. (2010) recommend five technical replicates from three
biological replicates for intracellular analysis and three technical replicates from each
biological replicate for extracellular metabolite analysis177.
Since the level of extracellular metabolites sometimes is very low and intracellular
metabolites are often diluted during extraction procedures, a step of sample concentration
is frequently needed, which can be achieved by freeze-drying at low temperatures to avoid
metabolite degradation177.
ii. Analytical Methods
There are various analytical platforms suitable to be applied to metabolomics
analysis, such as Nuclear Magnetic Resonance (NMR) spectroscopy, several separation
methods coupled with Mass Spectrometry (MS) or Fourier Transform Infrared
Spectroscopy (FTIR). Nevertheless, NMR spectroscopy and MS are the mostly used
analytical platforms in metabolomics. Both techniques exhibit advantages and limitations,
and the choice depends on the sample characteristics and the purposes of the study 190.
NMR detects the specific resonance of absorption profiles of metabolites in a
magnetic field. The most important advantages of NMR spectroscopy are that, besides the
simple and easy sample preparation, it is a non-destructive technique that does not need
further sample separation, and has high reproducibility190,191. The low sensitivity of this
Chapter 2
42
platform compared with MS, and the requirement of large sample volumes are its major
limitations190,191.
Gas Chromatography (GC) or Liquid Chromatography (LC), where the compounds
are separated, coupled with MS, which is based on ion molecular mass-to-charge ratio
(m/z) determination is often used179. In the last years, a new evolution of LC, Ultra High
Performance Liquid Chromatography (UHPLC), has been applied, increasing the sensitivity
in comparison with LC190. UHPLC-MS has some advantages compared to the other
platforms used, such as short separation time, analysis of a larger range of metabolites
than GC-MS, high mass accuracy and resolution, and simple sample preparation190,191.
However, unlike GC-MS, it presents a low reproducibility of retention times between
different systems190. The high reproducibility of retention times and fragmentation patterns,
allowing the construction of libraries and enabling compound identification without
standards, makes the GC-MS the most popular platform in metabolomics studies. The
consistent mass spectrum obtained for each compound in GC-MS is achieved by the use
of electron ionization (EI), which is the most frequently used ionization method191. A very
complete collection of studies published using GC-MS as the analytical platform in
metabolomics was published by Koek et al. (2011)192.
Besides the presented advantages, GC-MS exhibits some limitations related with
the requirement for volatile samples, increasing the steps and difficulty on sample
preparation due to the derivatization procedure, which can also lead to the introduction of
additional sample to sample variation. The derivatization is a chemical modification of
molecules that yields compounds with a similar chemical structure (derivative) but with
specific characteristics, which in the case of GC-MS are volatility, less-polarity and thermal
stability. In chemical derivatization, active hydrogens in functional groups, such as –COOH,
–OH, –NH, and –SH are replaced by other chemical groups. The most applied
derivatization method for analysis by GC-MS is using silylation reagents (reviewed by Koek
et al. (2011).192). Alternative reagents, such as chloroformates are also used193. For
instance, a propylchloroformate derivatization was applied in short-chain fatty acids and
branched-chain amino acids analysis194,195, an ethylclhoroformate derivatization was applied
for analysis of amino and organic acids, fatty acids, phenolic compounds and amines196,197,
State of the art
43
and a methylchloroformate derivatization was applied in amino, organic and fatty acids
analysis198–200.
iii. Data Processing and Analysis
After performing the analyses in MS or NMR, in order to prepare the data for
statistical analysis, a data processing step is needed. This stage can encompass some
steps such as data cleaning, normalization and transformation. In MS data, an overlapping
of the signal compounds is frequently observed. The deconvolution is thus a frequent
treatment of data used to extract the individual metabolite signals from the raw signal201.
The Automated Mass Spectral Deconvolution and Identification System (AMDIS)202 from the
National Institute of Standards and Technology (NIST) is one of most used software
packages to perform the deconvolution and to match unknown spectra with libraries to
identify detected compounds203. The next steps that could be necessary to perform are the
baseline correction, normalization and sculling (data transformation included) (detailed in
Liland, (2011)204).
The data analysis is the subsequent step, where statistical methods are applied
with the final goal of extracting the biological meaning of the generated data. Here,
supervised or unsupervised methods are applied.
2.5.1.2 H. pylori “Omics” data
H. pylori 26695 was one of the first bacteria to have its genome completely
sequenced in 1997131. Since then, “omics” high-throughput methods have been applied to
study the genome, proteome and transcriptome of H. pylori. The advances in omics
technologies have allowed to make progress in targeting H. pylori and its association with
disease, giving important clues about its inactivation, although it is not yet possible to
uncover all mechanisms involved in H. pylori pathogenesis and host-pathogen
interaction205.
Recent advances in genomics made accessible next-generation sequencing
(NGS) methods, which enabled the sequencing of a large variety of H. pylori strains, with
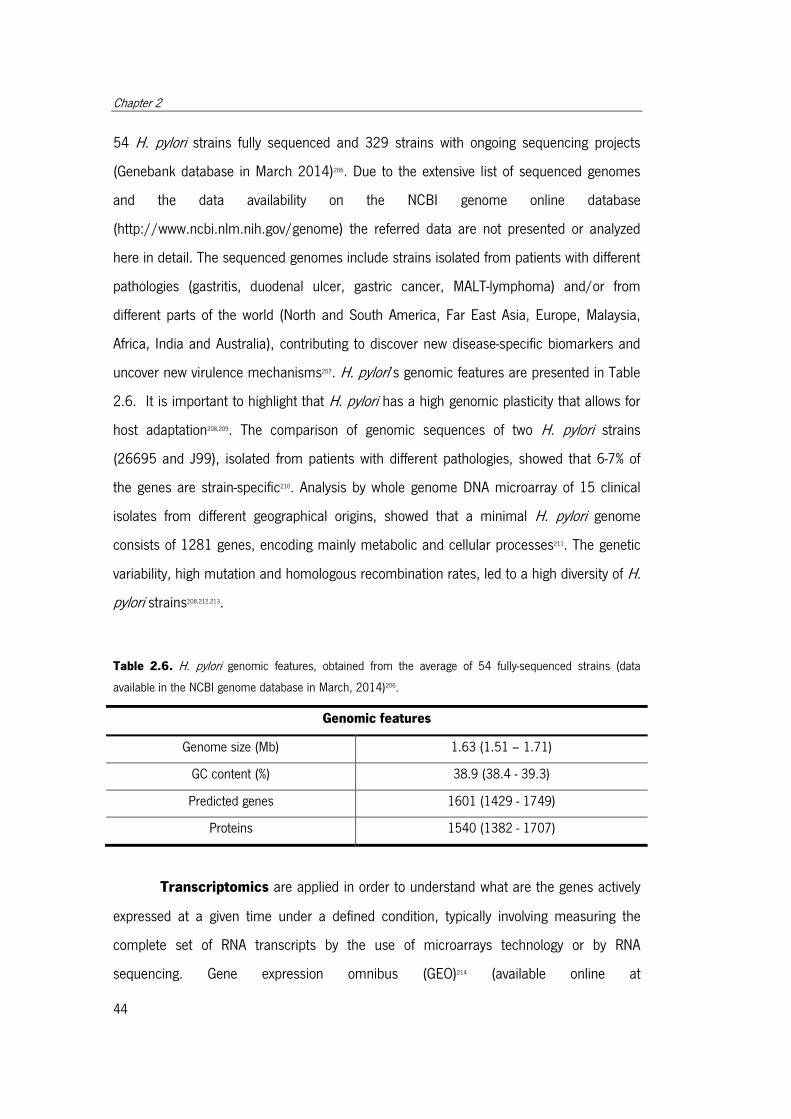
Chapter 2
44
54 H. pylori strains fully sequenced and 329 strains with ongoing sequencing projects
(Genebank database in March 2014)206. Due to the extensive list of sequenced genomes
and the data availability on the NCBI genome online database
(http://www.ncbi.nlm.nih.gov/genome) the referred data are not presented or analyzed
here in detail. The sequenced genomes include strains isolated from patients with different
pathologies (gastritis, duodenal ulcer, gastric cancer, MALT-lymphoma) and/or from
different parts of the world (North and South America, Far East Asia, Europe, Malaysia,
Africa, India and Australia), contributing to discover new disease-specific biomarkers and
uncover new virulence mechanisms207. H. pylori’s genomic features are presented in Table
2.6. It is important to highlight that H. pylori has a high genomic plasticity that allows for
host adaptation208,209. The comparison of genomic sequences of two H. pylori strains
(26695 and J99), isolated from patients with different pathologies, showed that 6-7% of
the genes are strain-specific210. Analysis by whole genome DNA microarray of 15 clinical
isolates from different geographical origins, showed that a minimal H. pylori genome
consists of 1281 genes, encoding mainly metabolic and cellular processes211. The genetic
variability, high mutation and homologous recombination rates, led to a high diversity of H.
pylori strains208,212,213.
Table 2.6. H. pylori genomic features, obtained from the average of 54 fully-sequenced strains (data
available in the NCBI genome database in March, 2014)206.
Genomic features
Genome size (Mb) 1.63 (1.51 – 1.71)
GC content (%) 38.9 (38.4 - 39.3)
Predicted genes 1601 (1429 - 1749)
Proteins 1540 (1382 - 1707)
Transcriptomics are applied in order to understand what are the genes actively
expressed at a given time under a defined condition, typically involving measuring the
complete set of RNA transcripts by the use of microarrays technology or by RNA
sequencing. Gene expression omnibus (GEO)214 (available online at

State of the art
45
http://www.ncbi.nlm.nih.gov/geo/) is a public repository for functional genomics data that
gathers high-throughput gene expression data for a large variety of organisms. The studies
present in this database on H. pylori are gathered in Table 2.7. Owing to the scope of the
present work, transcriptomics studies were filtered to “genome expression profiling”, being
excluded other types of studies such as “genome variation profiling by array” The
published transcriptomics studies address topics such as gene expression under different
conditions and stimuli in order to uncover regulatory mechanisms.
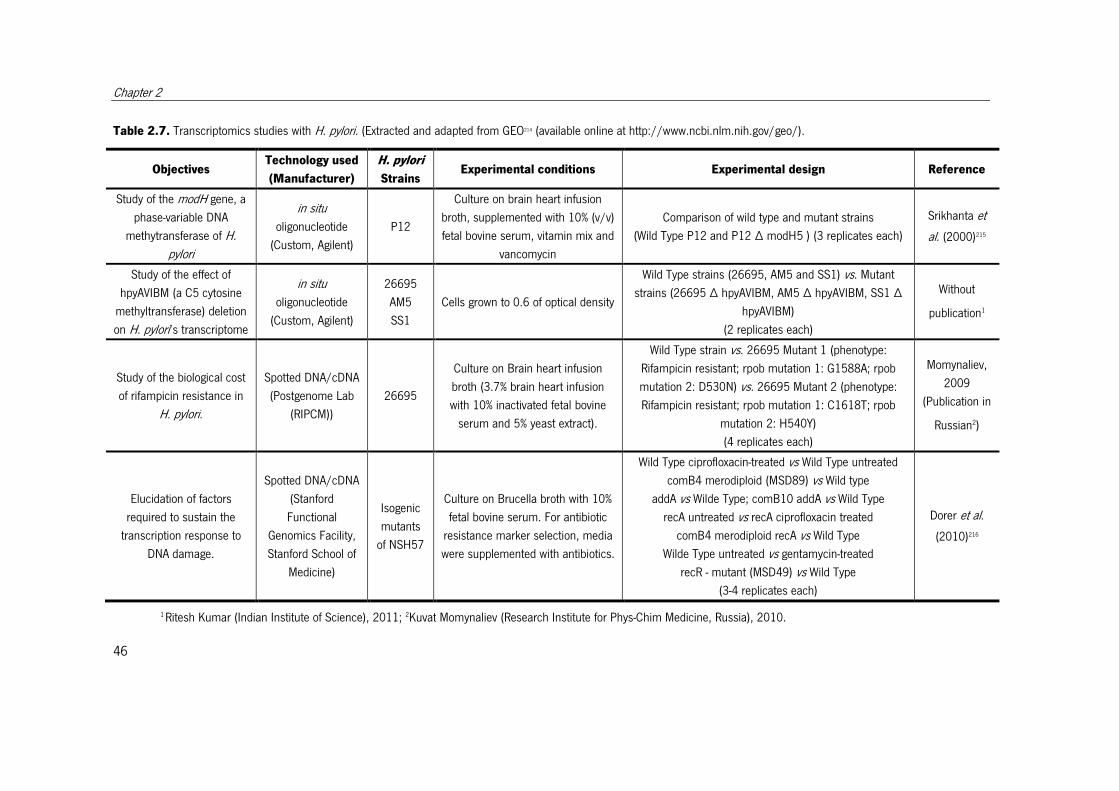
Chapter 2
46
Table 2.7. Transcriptomics studies with H. pylori. (Extracted and adapted from GEO214 (available online at http://www.ncbi.nlm.nih.gov/geo/).
Objectives Technology used
(Manufacturer)
H. pylori
Strains Experimental conditions Experimental design Reference
Study of the modH gene, a
phase-variable DNA
methytransferase of H.
pylori
in situ
oligonucleotide
(Custom, Agilent)
P12
Culture on brain heart infusion
broth, supplemented with 10% (v/v)
fetal bovine serum, vitamin mix and
vancomycin
Comparison of wild type and mutant strains
(Wild Type P12 and P12 ∆ modH5 ) (3 replicates each)
Srikhanta et
al. (2000)215
Study of the effect of
hpyAVIBM (a C5 cytosine
methyltransferase) deletion
on H. pylori’s transcriptome
in situ
oligonucleotide
(Custom, Agilent)
26695
AM5
SS1
Cells grown to 0.6 of optical density
Wild Type strains (26695, AM5 and SS1) vs. Mutant
strains (26695 ∆ hpyAVIBM, AM5 ∆ hpyAVIBM, SS1 ∆
hpyAVIBM)
(2 replicates each)
Without
publication1
Study of the biological cost
of rifampicin resistance in
H. pylori.
Spotted DNA/cDNA
(Postgenome Lab
(RIPCM))
26695
Culture on Brain heart infusion
broth (3.7% brain heart infusion
with 10% inactivated fetal bovine
serum and 5% yeast extract).
Wild Type strain vs. 26695 Mutant 1 (phenotype:
Rifampicin resistant; rpob mutation 1: G1588A; rpob
mutation 2: D530N) vs. 26695 Mutant 2 (phenotype:
Rifampicin resistant; rpob mutation 1: C1618T; rpob
mutation 2: H540Y)
(4 replicates each)
Momynaliev,
2009
(Publication in
Russian2)
Elucidation of factors
required to sustain the
transcription response to
DNA damage.
Spotted DNA/cDNA
(Stanford
Functional
Genomics Facility,
Stanford School of
Medicine)
Isogenic
mutants
of NSH57
Culture on Brucella broth with 10%
fetal bovine serum. For antibiotic
resistance marker selection, media
were supplemented with antibiotics.
Wild Type ciprofloxacin-treated vs Wild Type untreated
comB4 merodiploid (MSD89) vs Wild type
addA vs Wilde Type; comB10 addA vs Wild Type
recA untreated vs recA ciprofloxacin treated
comB4 merodiploid recA vs Wild Type
Wilde Type untreated vs gentamycin-treated
recR - mutant (MSD49) vs Wild Type
(3-4 replicates each)
Dorer et al.
(2010)216
1 Ritesh Kumar (Indian Institute of Science), 2011; 2Kuvat Momynaliev (Research Institute for Phys-Chim Medicine, Russia), 2010.
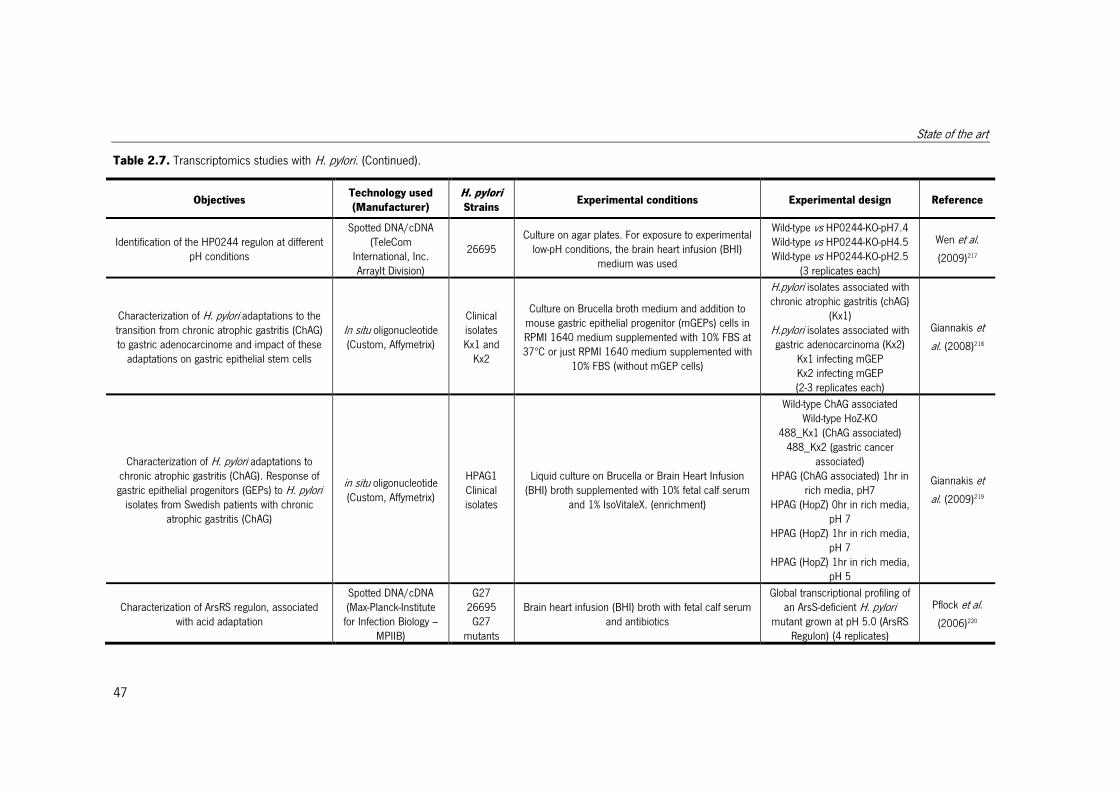
State of the art
47
Table 2.7. Transcriptomics studies with H. pylori. (Continued).
Objectives Technology used
(Manufacturer)
H. pylori
Strains Experimental conditions Experimental design Reference
Identification of the HP0244 regulon at different pH conditions
Spotted DNA/cDNA (TeleCom
International, Inc. ArrayIt Division)
26695 Culture on agar plates. For exposure to experimental
low-pH conditions, the brain heart infusion (BHI) medium was used
Wild-type vs HP0244-KO-pH7.4 Wild-type vs HP0244-KO-pH4.5 Wild-type vs HP0244-KO-pH2.5
(3 replicates each)
Wen et al.
(2009)217
Characterization of H. pylori adaptations to the transition from chronic atrophic gastritis (ChAG) to gastric adenocarcinome and impact of these
adaptations on gastric epithelial stem cells
In situ oligonucleotide (Custom, Affymetrix)
Clinical isolates Kx1 and
Kx2
Culture on Brucella broth medium and addition to mouse gastric epithelial progenitor (mGEPs) cells in RPMI 1640 medium supplemented with 10% FBS at 37ºC or just RPMI 1640 medium supplemented with
10% FBS (without mGEP cells)
H.pylori isolates associated with chronic atrophic gastritis (chAG)
(Kx1) H.pylori isolates associated with gastric adenocarcinoma (Kx2)
Kx1 infecting mGEP Kx2 infecting mGEP (2-3 replicates each)
Giannakis et
al. (2008)218
Characterization of H. pylori adaptations to chronic atrophic gastritis (ChAG). Response of gastric epithelial progenitors (GEPs) to H. pylori
isolates from Swedish patients with chronic atrophic gastritis (ChAG)
in situ oligonucleotide (Custom, Affymetrix)
HPAG1 Clinical isolates
Liquid culture on Brucella or Brain Heart Infusion (BHI) broth supplemented with 10% fetal calf serum
and 1% IsoVitaleX. (enrichment)
Wild-type ChAG associated Wild-type HoZ-KO
488_Kx1 (ChAG associated) 488_Kx2 (gastric cancer
associated) HPAG (ChAG associated) 1hr in
rich media, pH7 HPAG (HopZ) 0hr in rich media,
pH 7 HPAG (HopZ) 1hr in rich media,
pH 7 HPAG (HopZ) 1hr in rich media,
pH 5
Giannakis et
al. (2009)219
Characterization of ArsRS regulon, associated with acid adaptation
Spotted DNA/cDNA (Max-Planck-Institute for Infection Biology –
MPIIB)
G27 26695 G27
mutants
Brain heart infusion (BHI) broth with fetal calf serum and antibiotics
Global transcriptional profiling of an ArsS-deficient H. pylori
mutant grown at pH 5.0 (ArsRS Regulon) (4 replicates)
Pflock et al.
(2006)220
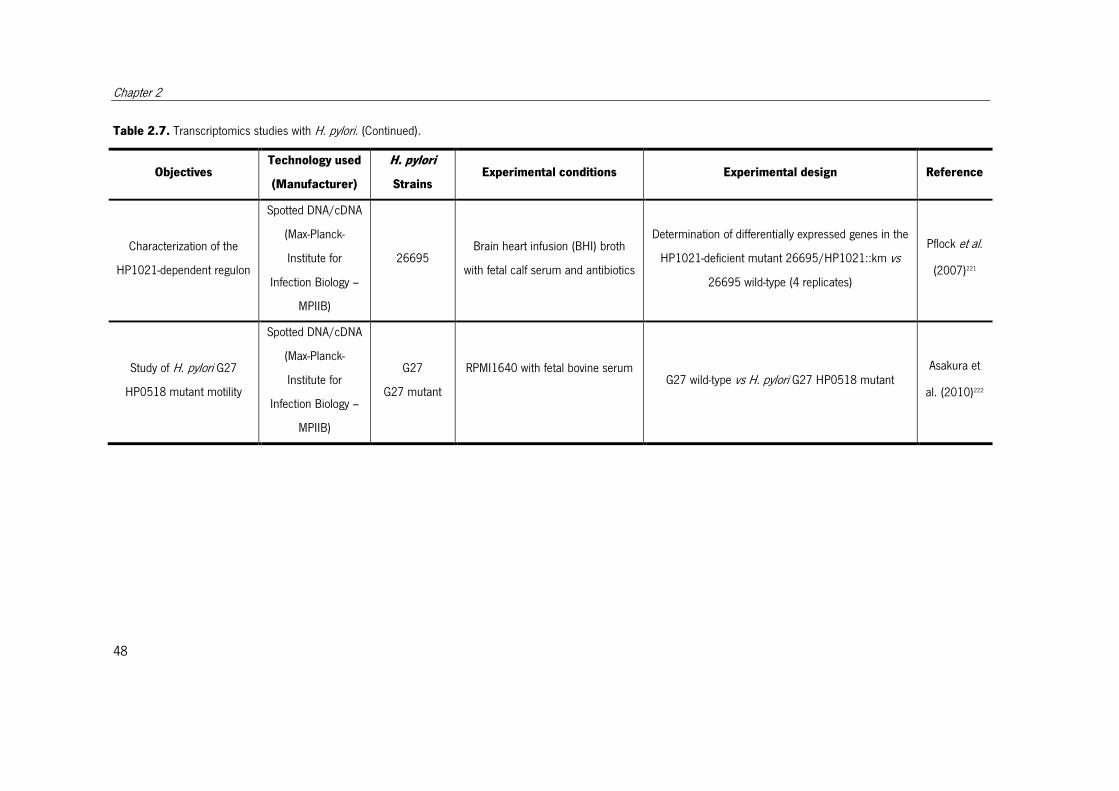
Chapter 2
48
Table 2.7. Transcriptomics studies with H. pylori. (Continued).
Objectives Technology used
(Manufacturer)
H. pylori
Strains Experimental conditions Experimental design Reference
Characterization of the
HP1021-dependent regulon
Spotted DNA/cDNA
(Max-Planck-
Institute for
Infection Biology –
MPIIB)
26695 Brain heart infusion (BHI) broth
with fetal calf serum and antibiotics
Determination of differentially expressed genes in the
HP1021-deficient mutant 26695/HP1021::km vs
26695 wild-type (4 replicates)
Pflock et al.
(2007)221
Study of H. pylori G27
HP0518 mutant motility
Spotted DNA/cDNA
(Max-Planck-
Institute for
Infection Biology –
MPIIB)
G27
G27 mutant
RPMI1640 with fetal bovine serum
G27 wild-type vs H. pylori G27 HP0518 mutant
Asakura et
al. (2010)222
State of the art
49
Proteomics, the large-scale analysis of cellular proteins, with the use of two-
dimensional gel electrophoresis for protein separation and identification by mass
spectrometry, is the most applied technology in “omics” studies of H. pylori. The
published studies in this field were mainly driven by the aim of discovering new proteins
that can be used as vaccine candidates, or to investigate proteins differentially expressed
under different conditions (mutant strains, environmental and / or stress conditions,
among others). There are many different types of proteomic approaches that are being
applied; notwithstanding, according to the aims of the present work, which include the
reconstruction of a genome-scale metabolic model, the collection of proteomics data was
focused on expression proteomics (Table 2.8).
Regarding metabolomics or fluxomics, to our knowledge, there are no H. pylori
data published. The studies that covered topics related with metabolite analysis only
analyzed specific internal or external metabolites.
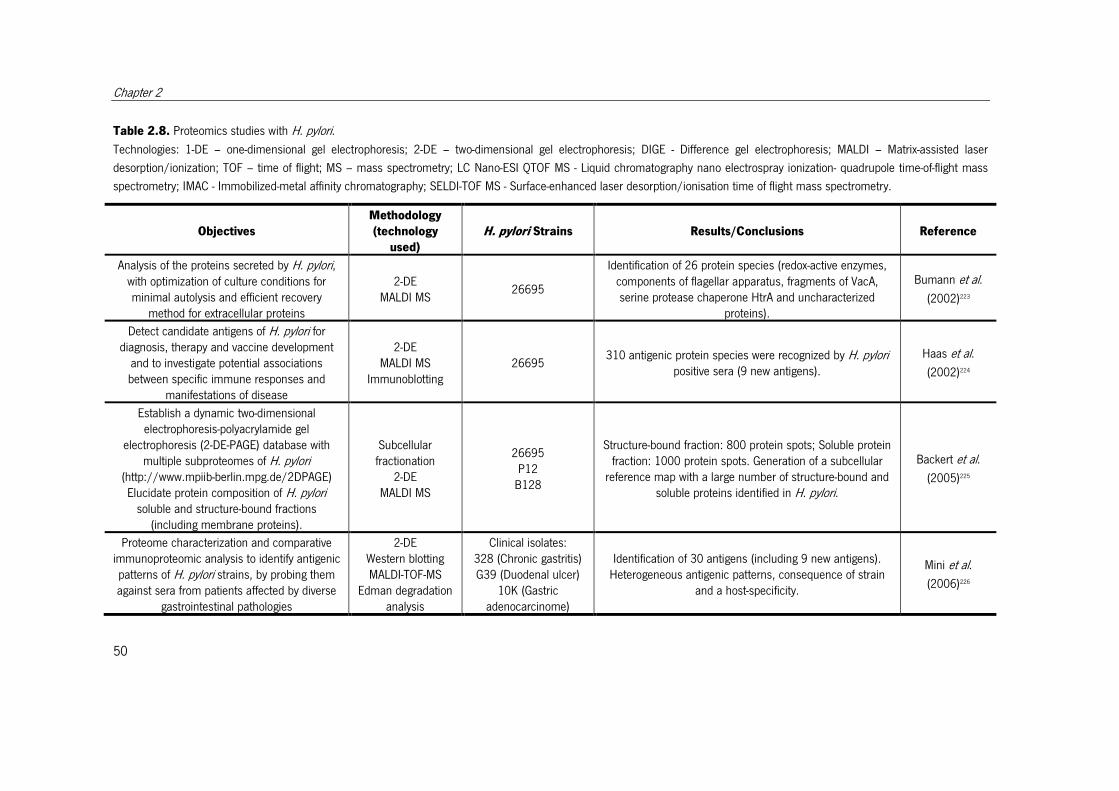
Chapter 2
50
Table 2.8. Proteomics studies with H. pylori.
Technologies: 1-DE – one-dimensional gel electrophoresis; 2-DE – two-dimensional gel electrophoresis; DIGE - Difference gel electrophoresis; MALDI – Matrix-assisted laser
desorption/ionization; TOF – time of flight; MS – mass spectrometry; LC Nano-ESI QTOF MS - Liquid chromatography nano electrospray ionization- quadrupole time-of-flight mass
spectrometry; IMAC - Immobilized-metal affinity chromatography; SELDI-TOF MS - Surface-enhanced laser desorption/ionisation time of flight mass spectrometry.
Objectives
Methodology
(technology
used)
H. pylori Strains Results/Conclusions Reference
Analysis of the proteins secreted by H. pylori, with optimization of culture conditions for minimal autolysis and efficient recovery
method for extracellular proteins
2-DE MALDI MS
26695
Identification of 26 protein species (redox-active enzymes, components of flagellar apparatus, fragments of VacA, serine protease chaperone HtrA and uncharacterized
proteins).
Bumann et al.
(2002)223
Detect candidate antigens of H. pylori for diagnosis, therapy and vaccine development
and to investigate potential associations between specific immune responses and
manifestations of disease
2-DE MALDI MS
Immunoblotting 26695
310 antigenic protein species were recognized by H. pylori positive sera (9 new antigens).
Haas et al.
(2002)224
Establish a dynamic two-dimensional electrophoresis-polyacrylamide gel
electrophoresis (2-DE-PAGE) database with multiple subproteomes of H. pylori
(http://www.mpiib-berlin.mpg.de/2DPAGE) Elucidate protein composition of H. pylori
soluble and structure-bound fractions (including membrane proteins).
Subcellular fractionation
2-DE MALDI MS
26695 P12
B128
Structure-bound fraction: 800 protein spots; Soluble protein fraction: 1000 protein spots. Generation of a subcellular
reference map with a large number of structure-bound and soluble proteins identified in H. pylori.
Backert et al.
(2005)225
Proteome characterization and comparative immunoproteomic analysis to identify antigenic patterns of H. pylori strains, by probing them against sera from patients affected by diverse
gastrointestinal pathologies
2-DE Western blotting MALDI-TOF-MS
Edman degradation analysis
Clinical isolates: 328 (Chronic gastritis) G39 (Duodenal ulcer)
10K (Gastric adenocarcinome)
Identification of 30 antigens (including 9 new antigens). Heterogeneous antigenic patterns, consequence of strain
and a host-specificity.
Mini et al.
(2006)226
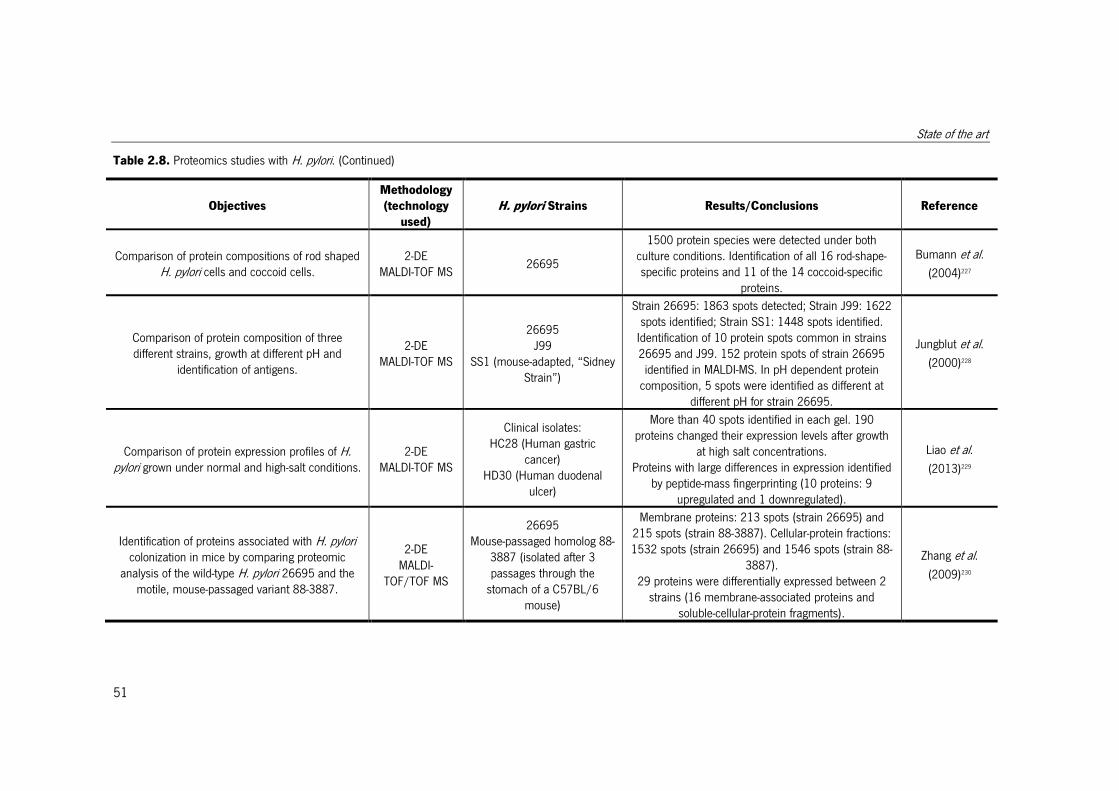
State of the art
51
Table 2.8. Proteomics studies with H. pylori. (Continued)
Objectives
Methodology
(technology
used)
H. pylori Strains Results/Conclusions Reference
Comparison of protein compositions of rod shaped H. pylori cells and coccoid cells.
2-DE MALDI-TOF MS
26695
1500 protein species were detected under both culture conditions. Identification of all 16 rod-shape-specific proteins and 11 of the 14 coccoid-specific
proteins.
Bumann et al.
(2004)227
Comparison of protein composition of three different strains, growth at different pH and
identification of antigens.
2-DE MALDI-TOF MS
26695 J99
SS1 (mouse-adapted, “Sidney Strain”)
Strain 26695: 1863 spots detected; Strain J99: 1622 spots identified; Strain SS1: 1448 spots identified.
Identification of 10 protein spots common in strains 26695 and J99. 152 protein spots of strain 26695 identified in MALDI-MS. In pH dependent protein
composition, 5 spots were identified as different at different pH for strain 26695.
Jungblut et al.
(2000)228
Comparison of protein expression profiles of H. pylori grown under normal and high-salt conditions.
2-DE MALDI-TOF MS
Clinical isolates: HC28 (Human gastric
cancer) HD30 (Human duodenal
ulcer)
More than 40 spots identified in each gel. 190 proteins changed their expression levels after growth
at high salt concentrations. Proteins with large differences in expression identified
by peptide-mass fingerprinting (10 proteins: 9 upregulated and 1 downregulated).
Liao et al.
(2013)229
Identification of proteins associated with H. pylori colonization in mice by comparing proteomic
analysis of the wild-type H. pylori 26695 and the motile, mouse-passaged variant 88-3887.
2-DE MALDI-
TOF/TOF MS
26695 Mouse-passaged homolog 88-
3887 (isolated after 3 passages through the
stomach of a C57BL/6 mouse)
Membrane proteins: 213 spots (strain 26695) and 215 spots (strain 88-3887). Cellular-protein fractions: 1532 spots (strain 26695) and 1546 spots (strain 88-
3887). 29 proteins were differentially expressed between 2
strains (16 membrane-associated proteins and soluble-cellular-protein fragments).
Zhang et al.
(2009)230
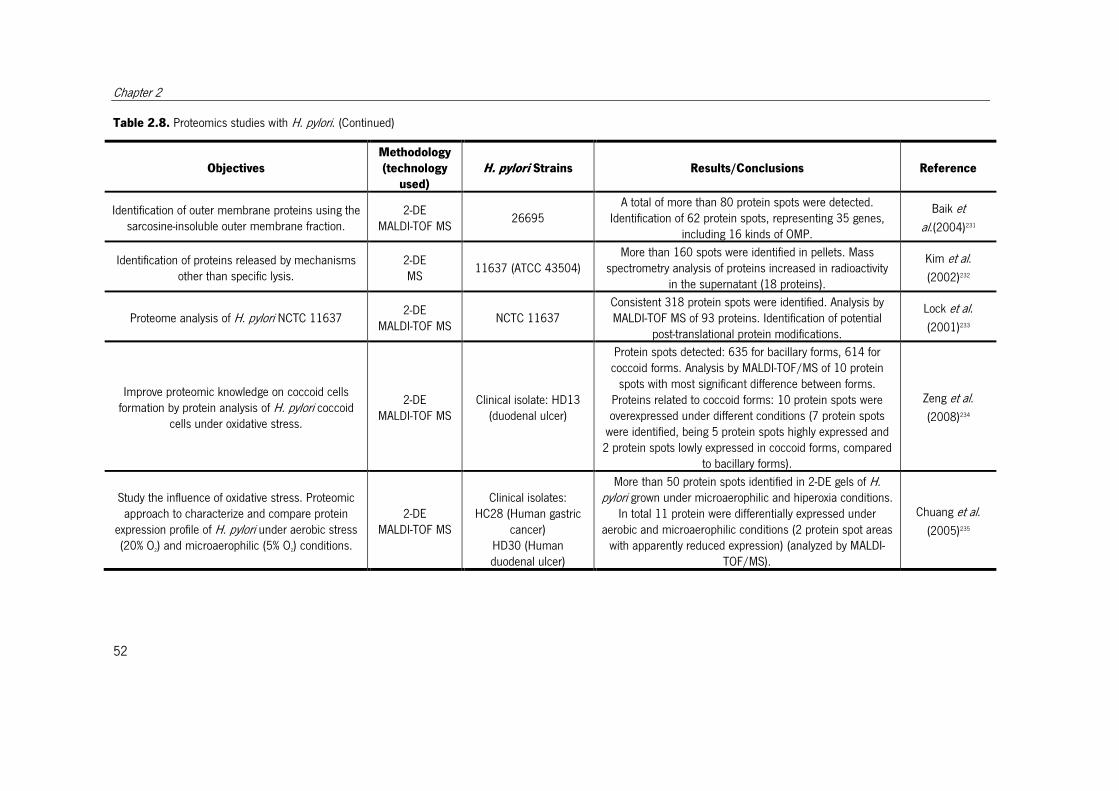
Chapter 2
52
Table 2.8. Proteomics studies with H. pylori. (Continued)
Objectives
Methodology
(technology
used)
H. pylori Strains Results/Conclusions Reference
Identification of outer membrane proteins using the sarcosine-insoluble outer membrane fraction.
2-DE MALDI-TOF MS
26695 A total of more than 80 protein spots were detected.
Identification of 62 protein spots, representing 35 genes, including 16 kinds of OMP.
Baik et
al.(2004)231
Identification of proteins released by mechanisms other than specific lysis.
2-DE MS
11637 (ATCC 43504) More than 160 spots were identified in pellets. Mass
spectrometry analysis of proteins increased in radioactivity in the supernatant (18 proteins).
Kim et al.
(2002)232
Proteome analysis of H. pylori NCTC 11637 2-DE
MALDI-TOF MS NCTC 11637
Consistent 318 protein spots were identified. Analysis by MALDI-TOF MS of 93 proteins. Identification of potential
post-translational protein modifications.
Lock et al.
(2001)233
Improve proteomic knowledge on coccoid cells formation by protein analysis of H. pylori coccoid
cells under oxidative stress.
2-DE MALDI-TOF MS
Clinical isolate: HD13 (duodenal ulcer)
Protein spots detected: 635 for bacillary forms, 614 for coccoid forms. Analysis by MALDI-TOF/MS of 10 protein
spots with most significant difference between forms. Proteins related to coccoid forms: 10 protein spots were overexpressed under different conditions (7 protein spots
were identified, being 5 protein spots highly expressed and 2 protein spots lowly expressed in coccoid forms, compared
to bacillary forms).
Zeng et al.
(2008)234
Study the influence of oxidative stress. Proteomic approach to characterize and compare protein
expression profile of H. pylori under aerobic stress (20% O2) and microaerophilic (5% O2) conditions.
2-DE MALDI-TOF MS
Clinical isolates:
HC28 (Human gastric cancer)
HD30 (Human duodenal ulcer)
More than 50 protein spots identified in 2-DE gels of H. pylori grown under microaerophilic and hiperoxia conditions.
In total 11 protein were differentially expressed under aerobic and microaerophilic conditions (2 protein spot areas
with apparently reduced expression) (analyzed by MALDI-TOF/MS).
Chuang et al.
(2005)235
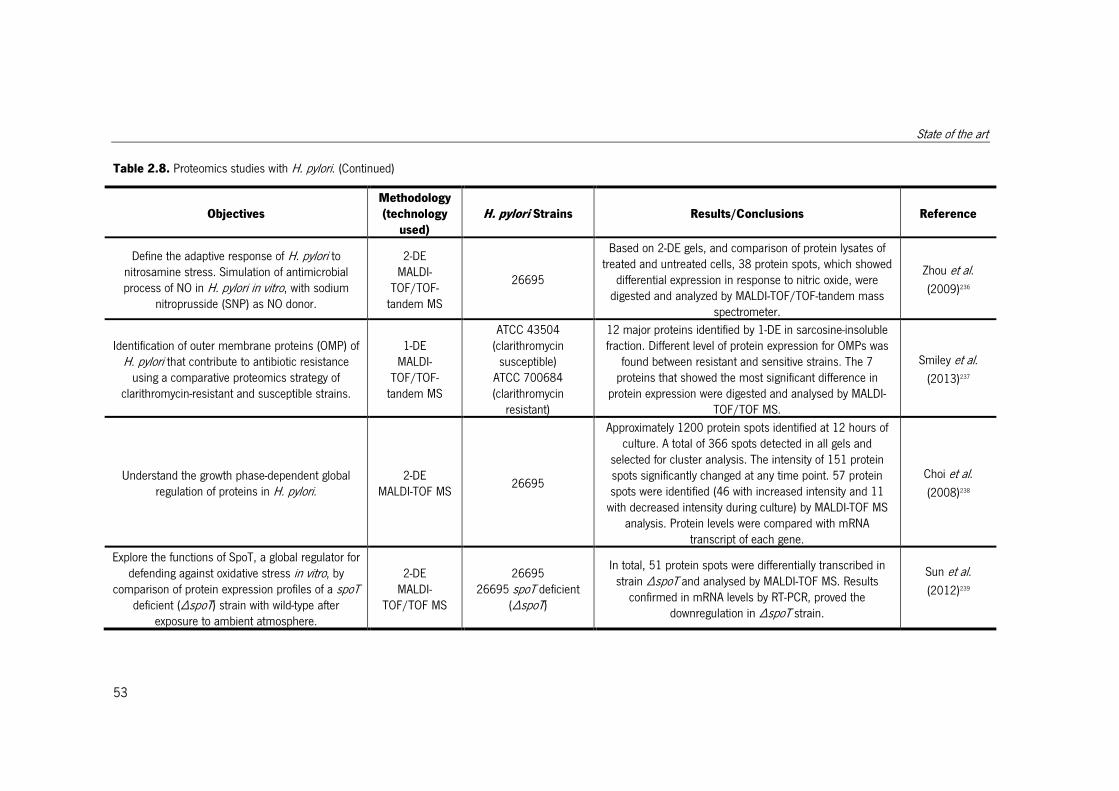
State of the art
53
Table 2.8. Proteomics studies with H. pylori. (Continued)
Objectives
Methodology
(technology
used)
H. pylori Strains Results/Conclusions Reference
Define the adaptive response of H. pylori to nitrosamine stress. Simulation of antimicrobial process of NO in H. pylori in vitro, with sodium
nitroprusside (SNP) as NO donor.
2-DE MALDI-
TOF/TOF-tandem MS
26695
Based on 2-DE gels, and comparison of protein lysates of treated and untreated cells, 38 protein spots, which showed
differential expression in response to nitric oxide, were digested and analyzed by MALDI-TOF/TOF-tandem mass
spectrometer.
Zhou et al.
(2009)236
Identification of outer membrane proteins (OMP) of H. pylori that contribute to antibiotic resistance
using a comparative proteomics strategy of clarithromycin-resistant and susceptible strains.
1-DE MALDI-
TOF/TOF-tandem MS
ATCC 43504 (clarithromycin
susceptible) ATCC 700684 (clarithromycin
resistant)
12 major proteins identified by 1-DE in sarcosine-insoluble fraction. Different level of protein expression for OMPs was
found between resistant and sensitive strains. The 7 proteins that showed the most significant difference in
protein expression were digested and analysed by MALDI-TOF/TOF MS.
Smiley et al.
(2013)237
Understand the growth phase-dependent global regulation of proteins in H. pylori.
2-DE MALDI-TOF MS
26695
Approximately 1200 protein spots identified at 12 hours of culture. A total of 366 spots detected in all gels and
selected for cluster analysis. The intensity of 151 protein spots significantly changed at any time point. 57 protein spots were identified (46 with increased intensity and 11
with decreased intensity during culture) by MALDI-TOF MS analysis. Protein levels were compared with mRNA
transcript of each gene.
Choi et al.
(2008)238
Explore the functions of SpoT, a global regulator for defending against oxidative stress in vitro, by
comparison of protein expression profiles of a spoT deficient (∆spoT) strain with wild-type after
exposure to ambient atmosphere.
2-DE MALDI-
TOF/TOF MS
26695 26695 spoT deficient
(∆spoT)
In total, 51 protein spots were differentially transcribed in strain ∆spoT and analysed by MALDI-TOF MS. Results
confirmed in mRNA levels by RT-PCR, proved the downregulation in ∆spoT strain.
Sun et al.
(2012)239
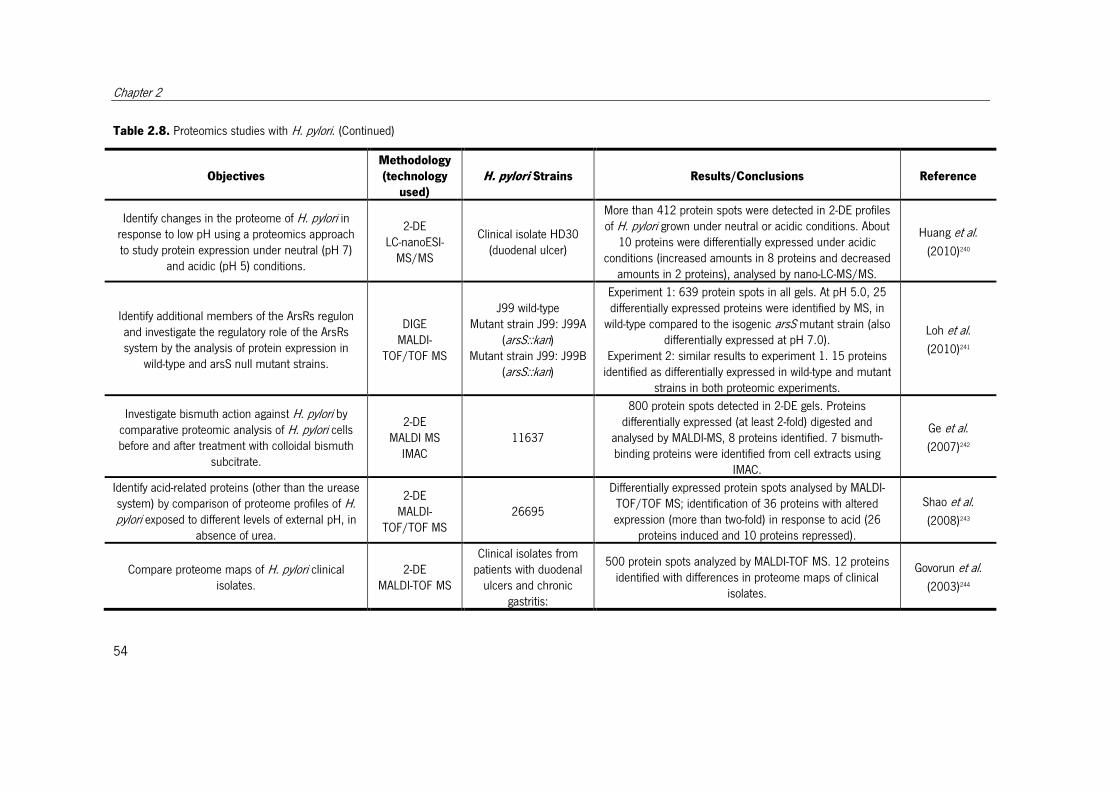
Chapter 2
54
Table 2.8. Proteomics studies with H. pylori. (Continued)
Objectives
Methodology
(technology
used)
H. pylori Strains Results/Conclusions Reference
Identify changes in the proteome of H. pylori in response to low pH using a proteomics approach to study protein expression under neutral (pH 7)
and acidic (pH 5) conditions.
2-DE LC-nanoESI-
MS/MS
Clinical isolate HD30 (duodenal ulcer)
More than 412 protein spots were detected in 2-DE profiles of H. pylori grown under neutral or acidic conditions. About
10 proteins were differentially expressed under acidic conditions (increased amounts in 8 proteins and decreased
amounts in 2 proteins), analysed by nano-LC-MS/MS.
Huang et al.
(2010)240
Identify additional members of the ArsRs regulon and investigate the regulatory role of the ArsRs system by the analysis of protein expression in
wild-type and arsS null mutant strains.
DIGE MALDI-
TOF/TOF MS
J99 wild-type Mutant strain J99: J99A
(arsS::kan) Mutant strain J99: J99B
(arsS::kan)
Experiment 1: 639 protein spots in all gels. At pH 5.0, 25 differentially expressed proteins were identified by MS, in
wild-type compared to the isogenic arsS mutant strain (also differentially expressed at pH 7.0).
Experiment 2: similar results to experiment 1. 15 proteins identified as differentially expressed in wild-type and mutant
strains in both proteomic experiments.
Loh et al.
(2010)241
Investigate bismuth action against H. pylori by comparative proteomic analysis of H. pylori cells before and after treatment with colloidal bismuth
subcitrate.
2-DE MALDI MS
IMAC 11637
800 protein spots detected in 2-DE gels. Proteins differentially expressed (at least 2-fold) digested and
analysed by MALDI-MS, 8 proteins identified. 7 bismuth-binding proteins were identified from cell extracts using
IMAC.
Ge et al.
(2007)242
Identify acid-related proteins (other than the urease system) by comparison of proteome profiles of H. pylori exposed to different levels of external pH, in
absence of urea.
2-DE MALDI-
TOF/TOF MS 26695
Differentially expressed protein spots analysed by MALDI-TOF/TOF MS; identification of 36 proteins with altered expression (more than two-fold) in response to acid (26
proteins induced and 10 proteins repressed).
Shao et al.
(2008)243
Compare proteome maps of H. pylori clinical isolates.
2-DE MALDI-TOF MS
Clinical isolates from patients with duodenal
ulcers and chronic gastritis:
500 protein spots analyzed by MALDI-TOF MS. 12 proteins identified with differences in proteome maps of clinical
isolates.
Govorun et al.
(2003)244
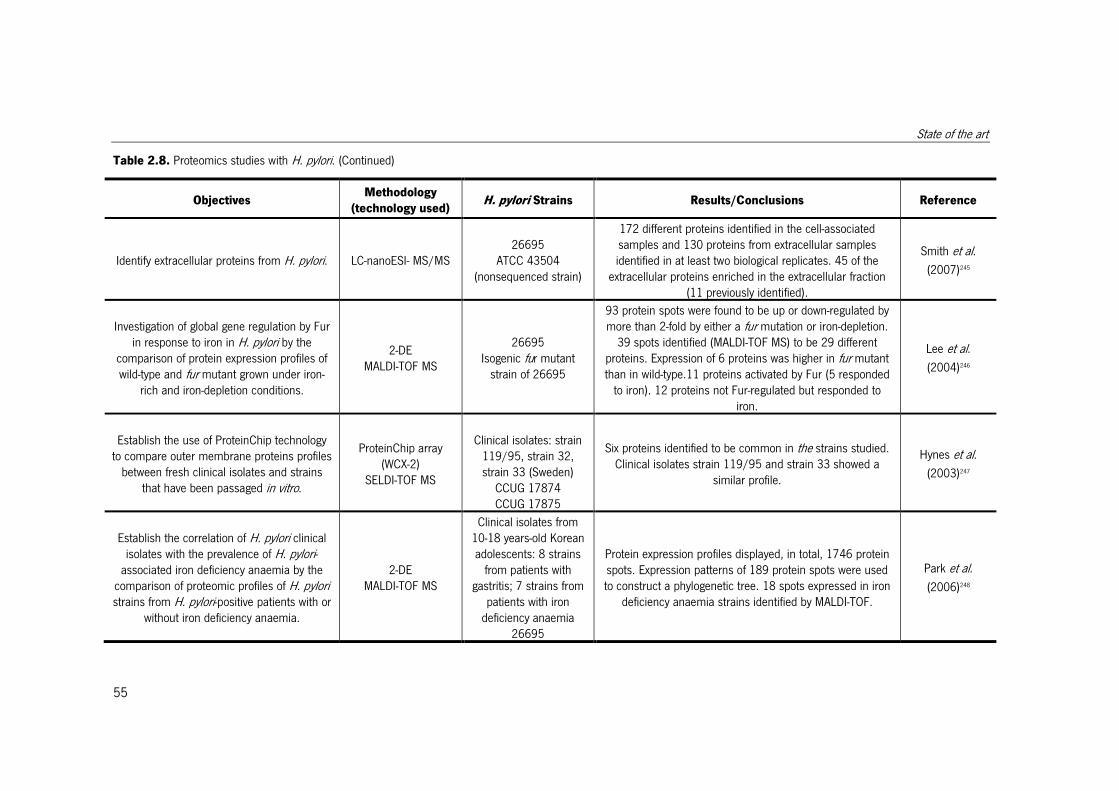
State of the art
55
Table 2.8. Proteomics studies with H. pylori. (Continued)
Objectives Methodology
(technology used) H. pylori Strains Results/Conclusions Reference
Identify extracellular proteins from H. pylori. LC-nanoESI- MS/MS 26695
ATCC 43504 (nonsequenced strain)
172 different proteins identified in the cell-associated samples and 130 proteins from extracellular samples identified in at least two biological replicates. 45 of the
extracellular proteins enriched in the extracellular fraction (11 previously identified).
Smith et al.
(2007)245
Investigation of global gene regulation by Fur in response to iron in H. pylori by the
comparison of protein expression profiles of wild-type and fur mutant grown under iron-
rich and iron-depletion conditions.
2-DE MALDI-TOF MS
26695 Isogenic fur mutant
strain of 26695
93 protein spots were found to be up or down-regulated by more than 2-fold by either a fur mutation or iron-depletion.
39 spots identified (MALDI-TOF MS) to be 29 different proteins. Expression of 6 proteins was higher in fur mutant than in wild-type.11 proteins activated by Fur (5 responded
to iron). 12 proteins not Fur-regulated but responded to iron.
Lee et al.
(2004)246
Establish the use of ProteinChip technology to compare outer membrane proteins profiles
between fresh clinical isolates and strains that have been passaged in vitro.
ProteinChip array (WCX-2)
SELDI-TOF MS
Clinical isolates: strain
119/95, strain 32, strain 33 (Sweden)
CCUG 17874 CCUG 17875
Six proteins identified to be common in the strains studied. Clinical isolates strain 119/95 and strain 33 showed a
similar profile.
Hynes et al.
(2003)247
Establish the correlation of H. pylori clinical isolates with the prevalence of H. pylori-
associated iron deficiency anaemia by the comparison of proteomic profiles of H. pylori strains from H. pylori-positive patients with or
without iron deficiency anaemia.
2-DE MALDI-TOF MS
Clinical isolates from 10-18 years-old Korean adolescents: 8 strains
from patients with gastritis; 7 strains from
patients with iron deficiency anaemia
26695
Protein expression profiles displayed, in total, 1746 protein spots. Expression patterns of 189 protein spots were used to construct a phylogenetic tree. 18 spots expressed in iron
deficiency anaemia strains identified by MALDI-TOF.
Park et al.
(2006)248
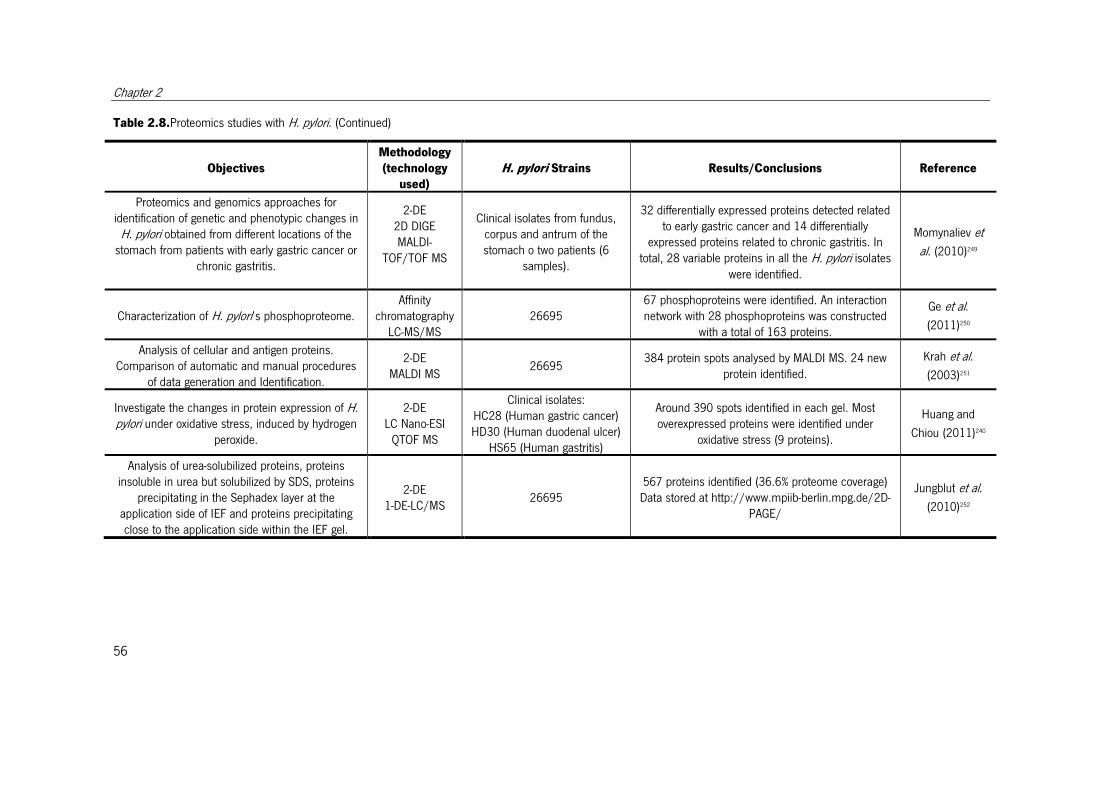
Chapter 2
56
Table 2.8.Proteomics studies with H. pylori. (Continued)
Objectives
Methodology
(technology
used)
H. pylori Strains Results/Conclusions Reference
Proteomics and genomics approaches for identification of genetic and phenotypic changes in H. pylori obtained from different locations of the
stomach from patients with early gastric cancer or chronic gastritis.
2-DE 2D DIGE MALDI-
TOF/TOF MS
Clinical isolates from fundus, corpus and antrum of the stomach o two patients (6
samples).
32 differentially expressed proteins detected related to early gastric cancer and 14 differentially
expressed proteins related to chronic gastritis. In total, 28 variable proteins in all the H. pylori isolates
were identified.
Momynaliev et
al. (2010)249
Characterization of H. pylori’s phosphoproteome. Affinity
chromatography LC-MS/MS
26695 67 phosphoproteins were identified. An interaction network with 28 phosphoproteins was constructed
with a total of 163 proteins.
Ge et al.
(2011)250
Analysis of cellular and antigen proteins. Comparison of automatic and manual procedures
of data generation and Identification.
2-DE MALDI MS
26695 384 protein spots analysed by MALDI MS. 24 new
protein identified.
Krah et al.
(2003)251
Investigate the changes in protein expression of H. pylori under oxidative stress, induced by hydrogen
peroxide.
2-DE LC Nano-ESI
QTOF MS
Clinical isolates: HC28 (Human gastric cancer) HD30 (Human duodenal ulcer)
HS65 (Human gastritis)
Around 390 spots identified in each gel. Most overexpressed proteins were identified under
oxidative stress (9 proteins).
Huang and
Chiou (2011)240
Analysis of urea-solubilized proteins, proteins insoluble in urea but solubilized by SDS, proteins
precipitating in the Sephadex layer at the application side of IEF and proteins precipitating close to the application side within the IEF gel.
2-DE 1-DE-LC/MS
26695 567 proteins identified (36.6% proteome coverage) Data stored at http://www.mpiib-berlin.mpg.de/2D-
PAGE/
Jungblut et al.
(2010)252
State of the art
57
2.5.2 Genome-scale metabolic models (GSMM)
The ultimate aim of systems biology is to develop mathematical models so that the
response of biological complex systems to any kind of perturbation can be predicted in
silico, even under conditions that are not easily accessible with experiments, and iteratively
producing polished models and insight into the system253. Each biological process can be
described using different mathematical models, depending on the problem, and the
purposes of the investigation253.
In the last years, several mathematical models for many organisms have been
developed. In particular, the development of mathematical models of metabolism and
more specifically genome-scale metabolic models is now considered a fundamental part of
the study of the cell168.
Among several types of metabolic networks, the stoichiometric models are the
most broadly used, encompassing a set of stoichiometric equations representing the
metabolic pathways of the system. Mass balance constrains on the metabolites, in a
steady state assumption, are then used to determine intracellular fluxes through all the
biochemical reactions occurring in the cell254,255. Due to the lack of information on cellular
processes such as regulatory events, this type of models does not account for information
on kinetics, regulatory or other cellular processes 256.
Since the first genome-scale metabolic model reconstruction in 1999257 by
Edwards and Palsson, an increasing number of metabolic model reconstructions are being
published with over 100 reconstructed models for more than 60 different organisms
available258.
2.5.2.1 Reconstruction process
The reconstruction of a genome-scale metabolic model is an iterative process that
begins with the collection of information about genome annotation and organism-specific
metabolic knowledge from various sources of information. After several intermediate steps,
the metabolic model is constructed and simulations are performed to compare in silico
obtained results with experimental data. The model is revised until the in silico predictions
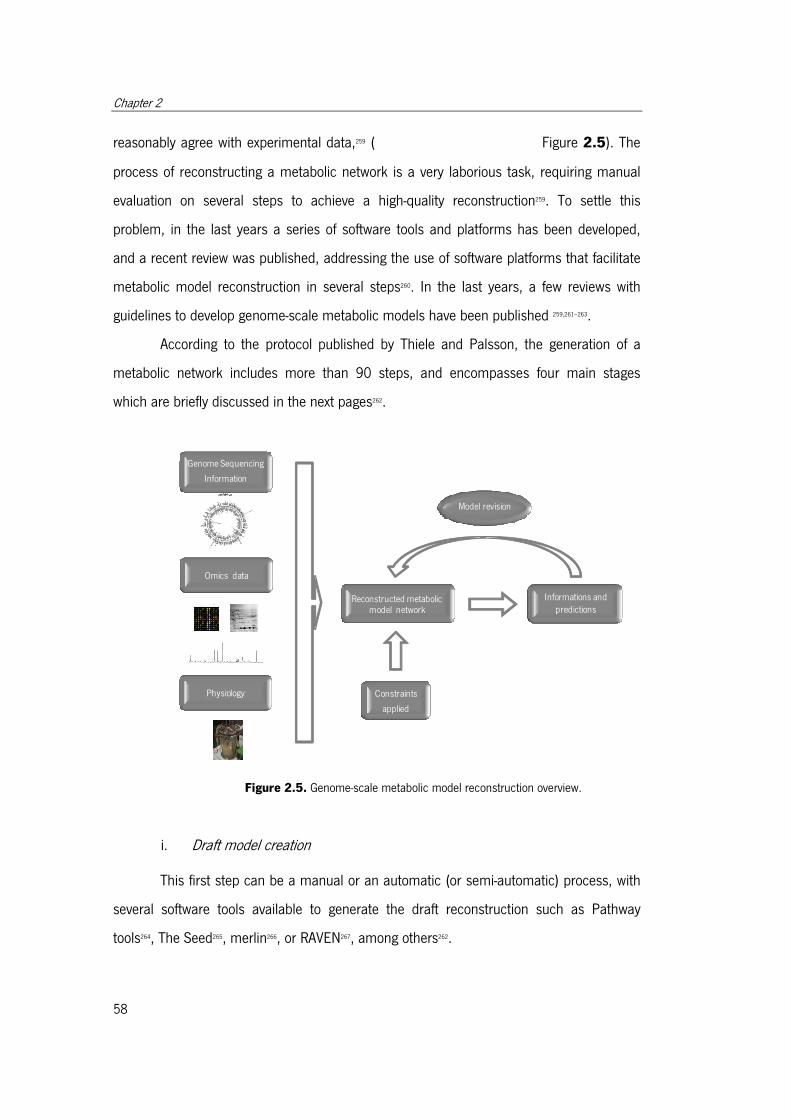
Chapter 2
58
reasonably agree with experimental data,259 ( Figure 2.5). The
process of reconstructing a metabolic network is a very laborious task, requiring manual
evaluation on several steps to achieve a high-quality reconstruction259. To settle this
problem, in the last years a series of software tools and platforms has been developed,
and a recent review was published, addressing the use of software platforms that facilitate
metabolic model reconstruction in several steps260. In the last years, a few reviews with
guidelines to develop genome-scale metabolic models have been published 259,261–263.
According to the protocol published by Thiele and Palsson, the generation of a
metabolic network includes more than 90 steps, and encompasses four main stages
which are briefly discussed in the next pages262.
Figure 2.5. Genome-scale metabolic model reconstruction overview.
i. Draft model creation
This first step can be a manual or an automatic (or semi-automatic) process, with
several software tools available to generate the draft reconstruction such as Pathway
tools264, The Seed265, merlin266, or RAVEN267, among others262.
Genome Sequencing
Information
Omics data
Physiology
Reconstructed metabolicmodel network
Constraints
applied
Informations and predictions
Model revision
State of the art
59
As each model is organism specific, the draft model creation is based on genome
annotation and specific biochemical information available for the target organism261. When
available, it is important to use the latest genome annotation for the creation of the draft
reconstruction, since the annotation is the backbone of the draft model, thus contributing
to the quality of the reconstructed model262. Nowadays, several databases with genome
annotations for a variety of organisms are available. Some of them are organism-specific
such as the PyloriGene268 (H. pylori), SGD269 (S. cerevisiae), or Ecocyc264 (E. coli), while
others contain annotations for a large spectrum of organisms, such as EntrezGene270 or
IMG271 (Integrated Microbial genome) (for a review see Thiele and Palsson (2010)262). From
these databases, data about genes, open reading frames (ORF), cellular function,
sequence similarities, and Enzyme commission (EC) number for the enzyme coding genes
can be retrieved. Only genes encoding enzymes and membrane transporters are included
in the reconstruction259. In the identification of candidate metabolic functions, other
databases that contain information about pathways and biochemical reactions can also be
used259,262, such as KEGG272, Brenda273, MetaCyc274, or Transport DB275. At this point, a list of
possible metabolic functions, possibly incomplete or with functions that are not considered
in metabolic model reconstructions (such as proteins involved in DNA methylation) is
obtained262. Subsequently, the draft reconstruction is assembled.
ii. Curation and refinement
At this stage, manual curation of the draft model has to be done by inspecting all
gene-protein-reactions to identify wrong information, gaps in network, and inconsistencies.
It is a very important step, since the databases used are not always organism-specific, and
sometimes wrong information is included262,263. In order to curate and refine the model,
there are several steps to be performed (Table 2.9), according to Rocha et al. (2007)259
and Thiele and Palsson (2010)262.
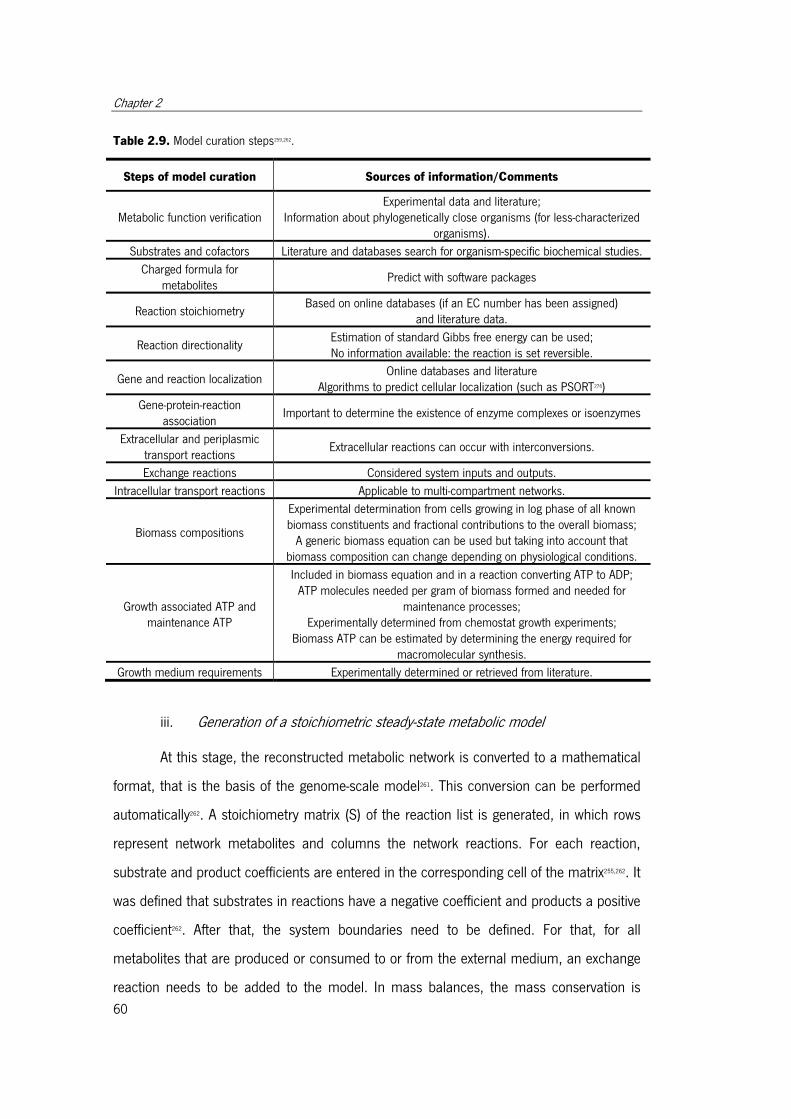
Chapter 2
60
Table 2.9. Model curation steps259,262.
Steps of model curation Sources of information/Comments
Metabolic function verification Experimental data and literature;
Information about phylogenetically close organisms (for less-characterized organisms).
Substrates and cofactors Literature and databases search for organism-specific biochemical studies.
Charged formula for metabolites
Predict with software packages
Reaction stoichiometry Based on online databases (if an EC number has been assigned)
and literature data.
Reaction directionality Estimation of standard Gibbs free energy can be used; No information available: the reaction is set reversible.
Gene and reaction localization Online databases and literature
Algorithms to predict cellular localization (such as PSORT276)
Gene-protein-reaction association
Important to determine the existence of enzyme complexes or isoenzymes
Extracellular and periplasmic transport reactions
Extracellular reactions can occur with interconversions.
Exchange reactions Considered system inputs and outputs.
Intracellular transport reactions Applicable to multi-compartment networks.
Biomass compositions
Experimental determination from cells growing in log phase of all known biomass constituents and fractional contributions to the overall biomass;
A generic biomass equation can be used but taking into account that biomass composition can change depending on physiological conditions.
Growth associated ATP and maintenance ATP
Included in biomass equation and in a reaction converting ATP to ADP; ATP molecules needed per gram of biomass formed and needed for
maintenance processes; Experimentally determined from chemostat growth experiments;
Biomass ATP can be estimated by determining the energy required for macromolecular synthesis.
Growth medium requirements Experimentally determined or retrieved from literature.
iii. Generation of a stoichiometric steady-state metabolic model
At this stage, the reconstructed metabolic network is converted to a mathematical
format, that is the basis of the genome-scale model261. This conversion can be performed
automatically262. A stoichiometry matrix (S) of the reaction list is generated, in which rows
represent network metabolites and columns the network reactions. For each reaction,
substrate and product coefficients are entered in the corresponding cell of the matrix255,262. It
was defined that substrates in reactions have a negative coefficient and products a positive
coefficient262. After that, the system boundaries need to be defined. For that, for all
metabolites that are produced or consumed to or from the external medium, an exchange
reaction needs to be added to the model. In mass balances, the mass conservation is
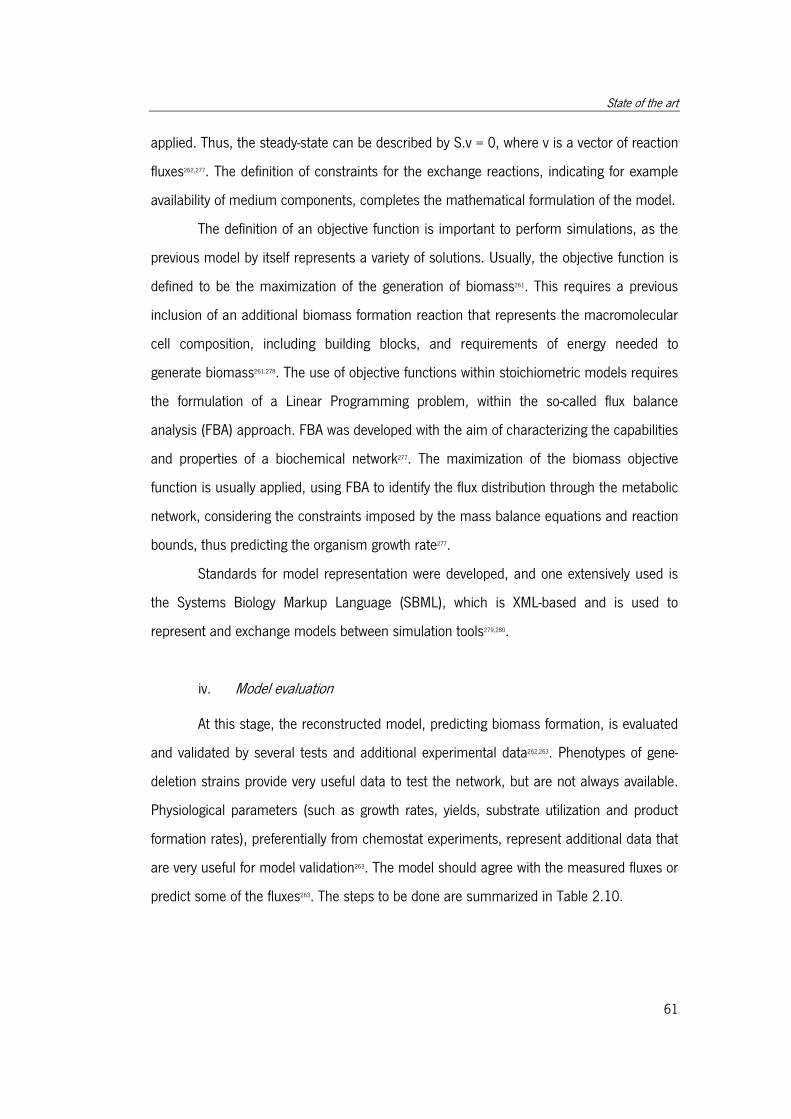
State of the art
61
applied. Thus, the steady-state can be described by S.v = 0, where v is a vector of reaction
fluxes262,277. The definition of constraints for the exchange reactions, indicating for example
availability of medium components, completes the mathematical formulation of the model.
The definition of an objective function is important to perform simulations, as the
previous model by itself represents a variety of solutions. Usually, the objective function is
defined to be the maximization of the generation of biomass261. This requires a previous
inclusion of an additional biomass formation reaction that represents the macromolecular
cell composition, including building blocks, and requirements of energy needed to
generate biomass261,278. The use of objective functions within stoichiometric models requires
the formulation of a Linear Programming problem, within the so-called flux balance
analysis (FBA) approach. FBA was developed with the aim of characterizing the capabilities
and properties of a biochemical network277. The maximization of the biomass objective
function is usually applied, using FBA to identify the flux distribution through the metabolic
network, considering the constraints imposed by the mass balance equations and reaction
bounds, thus predicting the organism growth rate277.
Standards for model representation were developed, and one extensively used is
the Systems Biology Markup Language (SBML), which is XML-based and is used to
represent and exchange models between simulation tools279,280.
iv. Model evaluation
At this stage, the reconstructed model, predicting biomass formation, is evaluated
and validated by several tests and additional experimental data262,263. Phenotypes of gene-
deletion strains provide very useful data to test the network, but are not always available.
Physiological parameters (such as growth rates, yields, substrate utilization and product
formation rates), preferentially from chemostat experiments, represent additional data that
are very useful for model validation263. The model should agree with the measured fluxes or
predict some of the fluxes263. The steps to be done are summarized in Table 2.10.
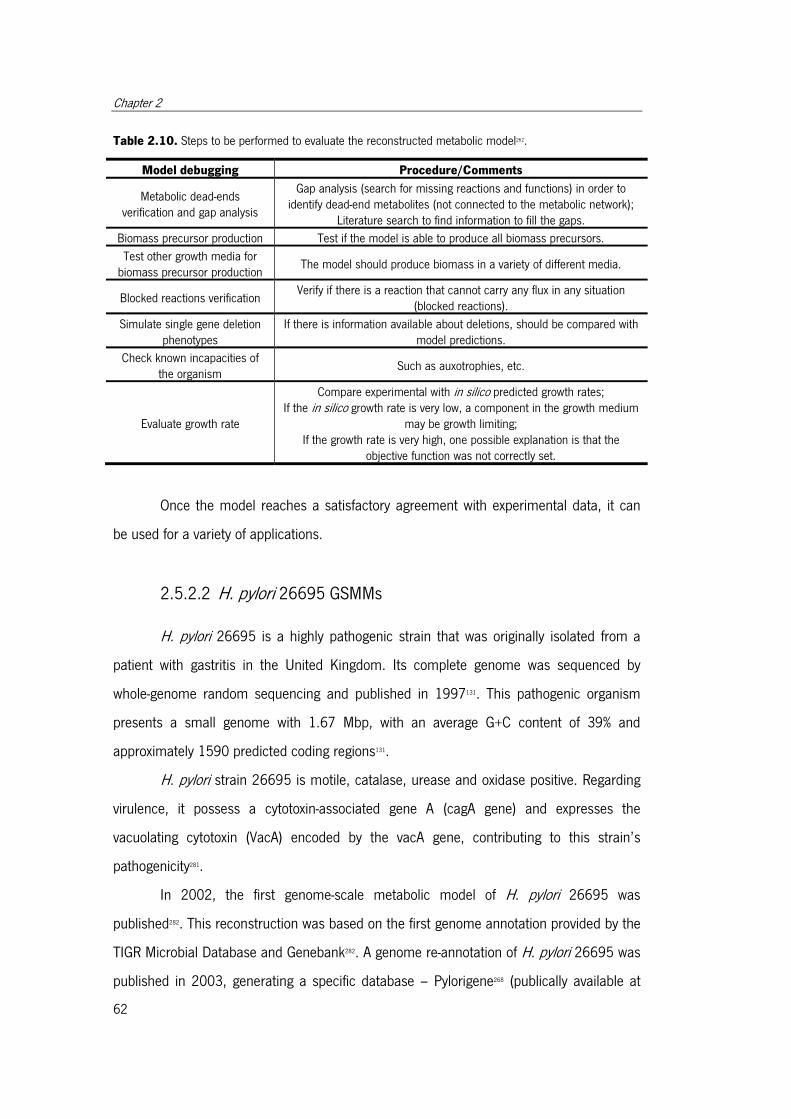
Chapter 2
62
Table 2.10. Steps to be performed to evaluate the reconstructed metabolic model262.
Model debugging Procedure/Comments
Metabolic dead-ends verification and gap analysis
Gap analysis (search for missing reactions and functions) in order to identify dead-end metabolites (not connected to the metabolic network);
Literature search to find information to fill the gaps.
Biomass precursor production Test if the model is able to produce all biomass precursors.
Test other growth media for biomass precursor production
The model should produce biomass in a variety of different media.
Blocked reactions verification Verify if there is a reaction that cannot carry any flux in any situation
(blocked reactions).
Simulate single gene deletion phenotypes
If there is information available about deletions, should be compared with model predictions.
Check known incapacities of the organism
Such as auxotrophies, etc.
Evaluate growth rate
Compare experimental with in silico predicted growth rates; If the in silico growth rate is very low, a component in the growth medium
may be growth limiting; If the growth rate is very high, one possible explanation is that the
objective function was not correctly set.
Once the model reaches a satisfactory agreement with experimental data, it can
be used for a variety of applications.
2.5.2.2 H. pylori 26695 GSMMs
H. pylori 26695 is a highly pathogenic strain that was originally isolated from a
patient with gastritis in the United Kingdom. Its complete genome was sequenced by
whole-genome random sequencing and published in 1997131. This pathogenic organism
presents a small genome with 1.67 Mbp, with an average G+C content of 39% and
approximately 1590 predicted coding regions131.
H. pylori strain 26695 is motile, catalase, urease and oxidase positive. Regarding
virulence, it possess a cytotoxin-associated gene A (cagA gene) and expresses the
vacuolating cytotoxin (VacA) encoded by the vacA gene, contributing to this strain’s
pathogenicity281.
In 2002, the first genome-scale metabolic model of H. pylori 26695 was
published282. This reconstruction was based on the first genome annotation provided by the
TIGR Microbial Database and Genebank282. A genome re-annotation of H. pylori 26695 was
published in 2003, generating a specific database – Pylorigene268 (publically available at
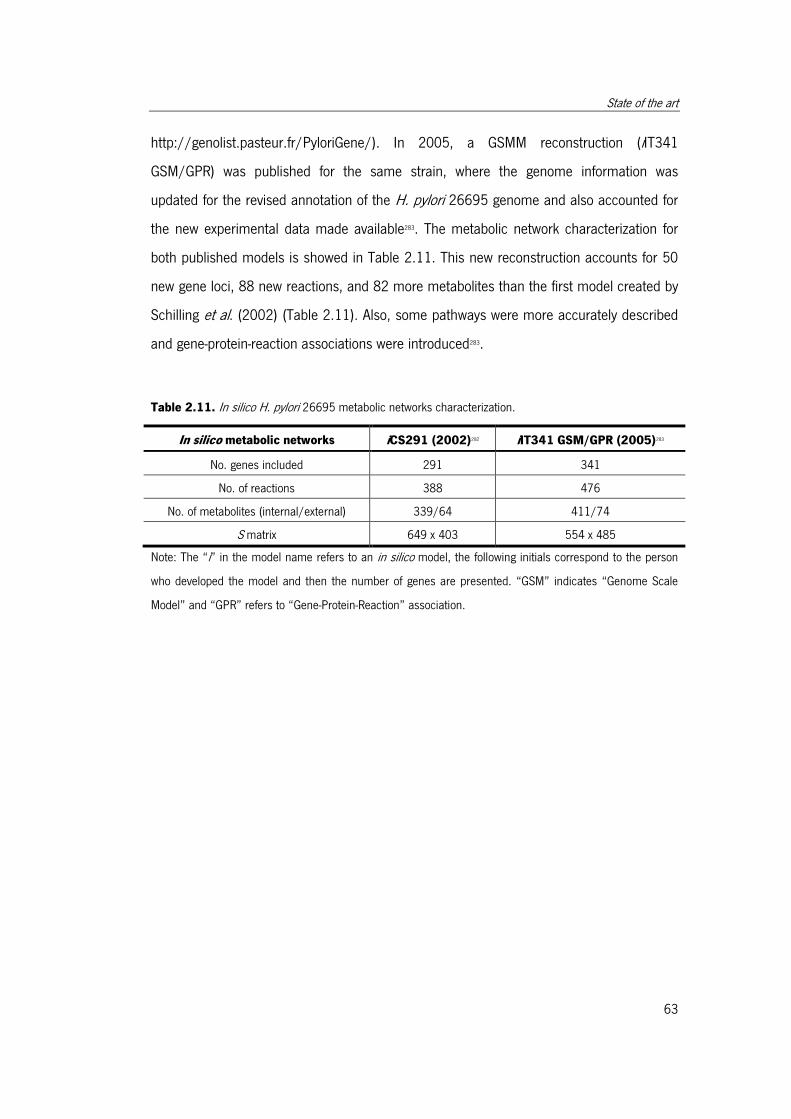
State of the art
63
http://genolist.pasteur.fr/PyloriGene/). In 2005, a GSMM reconstruction (iIT341
GSM/GPR) was published for the same strain, where the genome information was
updated for the revised annotation of the H. pylori 26695 genome and also accounted for
the new experimental data made available283. The metabolic network characterization for
both published models is showed in Table 2.11. This new reconstruction accounts for 50
new gene loci, 88 new reactions, and 82 more metabolites than the first model created by
Schilling et al. (2002) (Table 2.11). Also, some pathways were more accurately described
and gene-protein-reaction associations were introduced283.
Table 2.11. In silico H. pylori 26695 metabolic networks characterization.
In silico metabolic networks iCS291 (2002)282 iIT341 GSM/GPR (2005)283
No. genes included 291 341
No. of reactions 388 476
No. of metabolites (internal/external) 339/64 411/74
S matrix 649 x 403 554 x 485
Note: The “i” in the model name refers to an in silico model, the following initials correspond to the person
who developed the model and then the number of genes are presented. “GSM” indicates “Genome Scale
Model” and “GPR” refers to “Gene-Protein-Reaction” association.
Chapter 2
64
2.6 References
1. Marshall, B. J. & Warren, J. R. Unidentified curved Bacilli in the stomach of patients
with gastritis and peptic ulceration. Lancet 1, 1311–1315 (1984).
2. “Press Release: The 2005 Nobel Prize in Physiology or Medicine.”Nobelprize.org
3. Goodwin, C. S., Strong, J. A. & Marshall, B. J. Review article Campylobacter
pyloridis, gastritis, and peptic ulceration. J. Clin. Pathol. 39, 353–365 (1986).
4. Marshall, B. J., Armstrong, J. A., McGechie, D. B. & Glancy, R. J. Attempt to fulfil
Koch’s postulates for pyloric Campylobacter. Med. J. Aust. 142, 436–439 (1985).
5. Sayers, E. W. et al. Database resources of the National Center for Biotechnology
Information. Nucleic Acids Res. 37, D5–15 (2009).
6. Garrity, G. M., Bell, J. A. & Lilburn, T. Family II. Helicobacteraceae fam. nov. in
Bergey’s Manual of Systematic Bacteriology Volume Two The Proteobacteria.
1168–1194 (Spinger, 2005).
7. Marshall, B. J. et al. Original isolation of Campylobacter pyloridis from human
gastric mucosa. Microbios Lett. 25, 83–88 (1984).
8. Marshall, B. J. & Goodwin, C. S. Notes: Revised nomenclature of Campylobacter
pyloridis. Int. J. Syst. Bacteriol. 37, 68 (1987).
9. Romaniuk, P. J. et al. Campylobacter pylori, the spiral bacterium associated with
human gastritis, is not a true Campylobacter sp. J. Bacteriol. 169, 2137–2141
(1987).
10. Thompson, L. M., Smibert, R. M., Johnson, J. L. & Krieg, N. R. Phylogenetic study
of the genus Campylobacter. Int. J. Sist. Bacteriol. 38, 190–200 (1988).
11. Goodwin, C. S. et al. Transfer of Campylobacter pylori and Campylobacter
mustelae to Helicobacter gen. nov. as Helicobacter pylori comb. nov. and
Helicobacter mustelae comb.nov., respectively. Int. J. Sist. Bacteriol. 39, 397–405
(1989).
12. Marshall, B. Helicobacter pylori: 20 years on. Clin. Med. (Northfield. Il). 2, 147–
152 (2002).
State of the art
65
13. Hua, J.-S., Zheng, P.-Y. & Ho, B. Species differentiation and identification in the
genus of Helicobacter. World J. Gastroenterol. 5, 7–9 (1999).
14. Solnick, J. V & Schauer, D. B. Emergence of diverse Helicobacter species in the
pathogenesis of gastric and enterohepatic diseases. Clin. Microbiol. Rev. 14, 59–
97 (2001).
15. Kusters, J. G., van Vliet, A. H. M. & Kuipers, E. J. Pathogenesis of Helicobacter
pylori infection. Clin. Microbiol. Rev. 19, 449–490 (2006).
16. Goodwin, C. S., McCulloch, R. K., Armstrong, J. A. & Wee, S. H. Unusual celular
fatty acids and distinctive ultrastructure in a new spiral bacterium (Campylobacter
pyloridis) from the human gastric mucosa. J. Med. Microbiol. 19, 257–267
(1985).
17. Jones, D. M., Curry, A. & Fox, A. J. An ultrastructural study of the gastric
Campylobacter-like organism “Campylobacter pyloridis.”J. Gen. Microbiol. 131,
2335–2341 (1985).
18. Bode, G., Mauch, F. & Malfertheiner, P. The coccoid forms of Helicobacter pylori.
Criteria for their viability. Epidemiol. Infect. 111, 483–490 (1993).
19. Kusters, J. G., Gerrits, M. M., Van Strijp, J. A. G. & Vandenbroucke-Grauls, C. M. J.
E. Coccoid forms of Helicobacter pylori are the morphologic manifestation of cell
death. Infect. Immun. 65, 3672–3679 (1997).
20. Azevedo, N. F. et al. Coccoid form of Helicobacter pylori as a morphological
manifestation of cell adaptation to the environment. Appl. Environ. Microbiol. 73,
3423–3427 (2007).
21. Saito, N. et al. Plural transformation-processes from spiral to coccoid Helicobacter
pylori and its viability. J. Infect. 46, 49–55 (2003).
22. Nilsson, H., Blom, J., Al-soud, W. A., Andersen, L. P. & Wadström, T. Effect of cold
starvation, acid stress, and nutrients on metabolic activity of Helicobacter pylori.
Appl. Environ. Microbiol. 68, 11–19 (2002).
23. Goodwin, C. S. & Armstrong, J. A. Microbiological Aspects of Helicobacter pylori
(Campylobacter pyloridis). Eur. J. Clin. Microbiol. Infect. Dis. 9, 1–13 (1990).
Chapter 2
66
24. Geis, G., Suerbaum, S., Forsthoff, B., Leying, H. & Opferkuch, W. Ultrastructure
and biochemical studies of the flagellar sheath of Helicobacter pylori. J. Med.
Microbiol. 38, 371–7 (1993).
25. O’Toole, P. W., Lane, M. C. & Porwollik, S. Helicobacter pylori motility. Microbes
Infect. 2, 1207–1214 (2000).
26. Suerbaum, S. The complex flagella of gastric Helicobacter species. Trends
Microbiol. 3, 168–70; discussion 170–1 (1995).
27. Fox, J. G., Wang, T. C. & Parsonnet, J. Infections Causing Human Cancer - Chapter
10 - Helicobacter, Chronic Inflammation and Cancer. (WILEY-VCH, 2006).
28. Hill, M. The microbiology of Helicobacter pylori. Biomed & Pharmacother 51, 161–
163 (1991).
29. Beswick, E. J., Suarez, G. & Reyes, V. E. H. pylori and host interactions that
influence pathogenesis. World J. Gastroenterol. 12, 5599–565 (2006).
30. Brown, L. M. Helicobacter pylori: Epidemiology and routes of transmission.
Epidemiol. Rev. 22, 283–297 (2000).
31. Bruce, M. G. & Maaroos, H. I. Epidemiology of Helicobacter pylori infection.
Helicobacter 13 Suppl., 1–6 (2008).
32. Azevedo, N. F., Huntington, J. & Goodman, K. J. The epidemiology of Helicobacter
pylori and public health implications. Helicobacter 14 Supp.1, 1–7 (2009).
33. Ford, A. C. & Axon, A. T. R. Epidemiology of Helicobacter pylori infection and public
health implications. Helicobacter 15 Suppl., 1–6 (2010).
34. Goh, K.-L., Chan, W.-K., Shiota, S. & Yamaoka, Y. Epidemiology of Helicobacter
pylori infection and public health implications. Helicobacter 16 Suppl.1, 1–9
(2011).
35. Tonkic, A., Tonkic, M., Lehours, P. & Mégraud, F. Epidemiology and diagnosis of
Helicobacter pylori infection. Helicobacter 17 Suppl.1, 1–8 (2012).
36. Tanih, N. F., Ndip, L. M., Clarke, A. M. & Ndip, R. N. An overview of pathogenesis
and epidemiology of Helicobacter pylori infection. African J. Microbiol. Res. 4,
426–436 (2010).
State of the art
67
37. Mourad-Baars, P., Hussey, S. & Jones, N. L. Helicobacter pylori infection and
childhood. Helicobacter 15 Suppl 1, 53–59 (2010).
38. Azevedo, N. F., Guimarães, N., Figueiredo, C., Keevil, C. W. & Vieira, M. J. A new
model for the transmission of Helicobacter pylori: Role of environmental reservoirs
as gene pools to increase strain diversity. Crit. Rev. Microbiol. 33, 157–169
(2007).
39. Dunn, B. E., Cohen, H. & Blaser, M. J. Helicobacter pylori. Clin. Microbiol. Rev.
10, 720–741 (1997).
40. Isakov, V. & Malfertheiner, P. Helicobacter pylori and nonmalignant diseases.
Helicobacter 8 Suppl.1, 36–43 (2003).
41. Kuipers, E. J. & Malfertheiner, P. Helicobacter pylori and nonmalignant diseases.
Helicobacter 9 Suppl.1, 29–34 (2004).
42. Kupcinskas, L. & Malfertheiner, P. Helicobacter pylori and non-malignant diseases.
Helicobacter 10 Suppl.1, 26–33 (2005).
43. Shirin, H., Leja, M. & Niv, Y. Helicobacter pylori and non-malignant diseases.
Helicobacter 13 Suppl.1, 29–27 (2008).
44. Furuta, T. & Delchier, J.-C. Helicobacter pylori and non-malignant diseases.
Helicobacter 14 Suppl.1, 29–35 (2009).
45. Alakkari, A., Zullo, A. & O’Connor, J. H. Helicobacter pylori and nonmalignant
diseases. Helicobacter 16 Suppl.1, 33–37 (2011).
46. Shmuely, H., Katicic, M., Filipec Kanizaj, T. & Niv, Y. Helicobacter pylori and
nonmalignant diseases. Helicobacter 17 Suppl.1, 22–25 (2012).
47. Sepulveda, A. R. & Coelho, L. G. V. Helicobacter pylori and gastric malignancies.
Helicobacter 7 Suppl.1, 37–42 (2002).
48. Nardone, G. & Morgner, A. Helicobacter pylori and gastric malignancies.
Helicobacter 8 Suppl.1, 44–52 (2003).
49. Asaka, M. & Dragosics, B. A. Helicobacter pylori and gastric malignancies.
Helicobacter 9 Suppl.1, 35–41 (2004).
50. Fischbach, W., Chan, A. O. & Wong, B. C. Helicobacter pylori and gastric
malignancy. Helicobacter 10 Suppl.1, 34–39 (2005).
Chapter 2
68
51. Starzyñska, T. & Malfertheiner, P. Helicobacter and digestive malignancies.
Helicobacter 11 Suppl.1, 32–35 (2006).
52. Moss, S. F. & Malfertheiner, P. Helicobacter and gastric malignancies. Helicobacter
12 Suppl.1, 23–30 (2007).
53. Ferreira, A. C. et al. Helicobacter and gastric malignancies. Helicobacter 13
Suppl.1, 28–34 (2008).
54. Suzuki, H., Franceschi, F., Nishizawa, T. & Gasbarrini, A. Extragastric
manifestations of Helicobacter pylori infection. Helicobacter 16 Supp.1, 65–69
(2011).
55. Figura, N. et al. Extragastric manifestations of Helicobacter pylori infection.
Helicobacter 15 Suppl.1, 60–68 (2010).
56. Banić, M., Franceschi, F., Babić, Z. & Gasbarrini, A. Extragastric manifestations of
Helicobacter pylori infection. Helicobacter 17 Suppl. , 49–55 (2012).
57. Solnick, J. V, Franceschi, F., Roccarina, D. & Gasbarrini, A. Extragastric
manifestations of Helicobacter pylori infection-other Helicobacter species.
Helicobacter 11 Suppl., 46–51 (2006).
58. Bohr, U. R. M., Annibale, B., Franceschi, F., Roccarina, D. & Gasbarrini, A.
Extragastric manifestations of Helicobacter pylori infection – other Helicobacters.
Helicobacter 12 Suppl.1, 45–53 (2007).
59. Moyaert, H. et al. Extragastric manifestations of Helicobacter pylori infection : Other
Helicobacters. Helicobacter 13 Suppl.1, 47–57 (2008).
60. Gasbarrini, A., Carloni, E., Gasbarrini, G. & Chisholm, S. A. Helicobacter pylori and
extragastric diseases - other Helicobacters. Helicobacter 9 Suppl.1, 57–66
(2004).
61. Gasbarrini, A., Carloni, E., Gasbarrini, G. & Ménard, A. Helicobacter pylori and
extragastric diseases - other Helicobacters. Helicobacter 8 Suppl.1, 68–76
(2003).
62. Nilsson, H. et al. Helicobacter pylori and extragastric diseases - other
Helicobacters. 10 Suppl.1, 54–65 (2005).

State of the art
69
63. Pellicano, R. et al. Helicobacters and extragastric diseases. Helicobacter 14 Suppl
1, 58–68 (2009).
64. Brunner, D. et al. Serum-free cell culture: the serum-free media interactive online
database. ALTEX 27, 53–62 (2010).
65. Douraghi, M. et al. Comparative evaluation of three supplements for Helicobacter
pylori growth in liquid culture. Curr. Microbiol. 60, 254–262 (2010).
66. Cover, T. L. Perspectives on methodology for in vitro culture of Helicobacter pylori.
Methods Mol. Biol. 921, 2012–2015 (2012).
67. Testerman, T. L., Gee, D. J. M. C. & Mobley, H. L. T. Helicobacter pylori growth
and urease detection in the chemically defined medium Ham’s F-12 nutrient
mixture. J. Clin. Microbiol. 39, 3842–3850 (2001).
68. Marchini, A. et al. Cyclodextrins for growth of Helicobacter pylori and production of
vacuolating cytotoxin. Arch. Microbiol. 164, 290–293 (1995).
69. Albertson, N., Wenngren, I. & Sjöström, J. E. Growth and survival of Helicobacter
pylori in defined medium and susceptibility to Brij 78. J. Clin. Microbiol. 36, 1232–
1235 (1998).
70. Haque, M., Yokota, K., Hirai, Y. & Oguma, K. Lipid profiles of Helicobacter pylori
and Helicobacter mustelae grown in serum-supplemented and serum-free media.
Acta Med. Okayama 49, 205–211 (1995).
71. Hirai, Y. et al. Unique cholesteryl glucosides in Helicobacter pylori : composition
and structural analysis. Microbiology 177, 5327–5333 (1995).
72. Trampenau, C. & Müller, K.-D. Affinity of Helicobacter pylori to cholesterol and
other steroids. Microbes Infect. 5, 13–17 (2003).
73. McGee, D. J. et al. Cholesterol enhances Helicobacter pylori resistance to
antibiotics and LL-37. Antimicrob. Agents Chemother. 55, 2897–2904 (2011).
74. Nedenskov, P. Nutritional requirements for growth of Helicobacter pylori. Appl.
Environ. Microbiol. 60, 3450–3453 (1994).
75. Stark, R. M., Suleiman, M. S., Hassan, I. J., Greenman, J. & Millar, M. R. Amino
acid utilisation and deamination of glutamine and asparagine by Helicobacter
pylori. J. Med. Microbiol. 46, 793–800 (1997).
Chapter 2
70
76. Testerman, T. L., Gee, D. J. M. C. & Mobley, H. L. T. Helicobacter pylori growth
and urease detection in the chemically defined medium Ham’s F-12 nutrient
mixture. J. Clin. Microbiol. 39, 3842–3850 (2001).
77. Reynolds, D. J. & Penn, C. W. Characteristics of Helicobacter pylori growth in a
defined medium and determination of its amino acid requirements. Microbiology
140, 2649–2956 (1994).
78. Sainsus, N., Cattori, V., Lepadatu, C. & Hofmann-Lehmann, R. Liquid culture
medium for the rapid cultivation of Helicobacter pylori from biopsy specimens. Eur.
J. Clin. Microbiol. Infect. Dis. 27, 1209–1217 (2008).
79. Testerman, T. L., Conn, P. B., Mobley, H. L. T. & McGee, D. J. Nutritional
requirements and antibiotic resistance patterns of Helicobacter species in
chemically defined media. J. Clin. Microbiol. 44, 1650–1658 (2006).
80. Queiroz, D. M., Mendes, E. N. & Rocha, G. a. Indicator medium for isolation of
Campylobacter pylori. J. Clin. Microbiol. 25, 2378–2379 (1987).
81. Ansorg, R., Von Recklinghausen, G., Pomarius, R. & Schmid, E. N. Evaluation of
techniques for isolation, subcultivation, and preservation of Helicobacter pylori. J.
Clin. Microbiol. 29, 51–53 (1991).
82. Hutton, M. L., Kaparakis-Liaskos, M. & Ferrero, R. L. The use of AlbuMAX II(®) as
a blood or serum alternative for the culture of Helicobacter pylori. Helicobacter 17,
68–76 (2012).
83. Kehler, E. G., Midkiff, B. R. & Westblom, T. U. Evaluation of three commercially
available blood culture systems for cultivation of Helicobacter pylori. J. Clin.
Microbiol. 32, 1597–1598 (1994).
84. Goodwin, C. S., Mcculloch, R. K., Armstrong, J. A. & Wee, S. H. Unusual fatty acids
and distinctive ultrastructure in a new spiral bacterium (Campylobacter pyloridis)
from the human gastric mucosa. J. Med. Microbiol. 19, 257–267 (1985).
85. Hachem, C. Y., Clarridge, J. E., Evans, D. G. & Graham, D. Y. Comparison of agar
based media for primary isolation of Helicobacter pylori. J. Clin. Pathol. 48, 714–
716 (1995).
State of the art
71
86. Westblom, T. U., Madan, E. & Midkiff, B. R. Egg yolk emulsion agar, a new medium
for the cultivation of Helicobacter pylori. J. Clin. Microbiol. 29, 819–821 (1991).
87. Ohno, H. & Murano, A. Serum-free culture of H. pylori intensifies cytotoxicity. World
J. Gastroenterol. 13, 532–537 (2007).
88. Shibayama, K. et al. Usefulness of adult bovine serum for Helicobacter pylori
culture media. J. Clin. Microbiol. 44, 4255–4257 (2006).
89. Buck, G. E. & Smith, J. S. Medium supplementation for gowth of Campylobacter
pyloridis. J. Clin. Microbiol. 25, 597–599 (1987).
90. Miendje Deyi, V. Y., Van den Borre, C. & Fontaine, V. Comparative evaluation of 3
selective media for primary isolation of Helicobacter pylori from gastric biopsies
under routine conditions. Diagn. Microbiol. Infect. Dis. 68, 474–476 (2010).
91. Dent, J. & McNulty, C. A. Evaluation of a new selective medium for Campylobacter
pylori. Eur. J. Clin. Microbiol. Infect. Dis. 7, 555–558 (1988).
92. Secker, D. a, Tompkins, D. S. & Alderson, G. Gas-permeable lifecell tissue culture
flasks give improved growth of Helicobacter pylori in a liquid medium. J. Clin.
Microbiol. 29, 1060–1061 (1991).
93. Cellini, L. et al. New plate medium for growth and detection of urease activity of
Helicobacter pylori. Notes 30, 1351–1353 (1992).
94. Olivieri, R. et al. Growth of Helicobacter pylori containing cyclodextrins. J. Clin.
Microbiol. 31, 160–162 (1993).
95. Stevenson, T. H., Castillo, A., Lucia, L. M. & Acuff, G. R. Growth of Helicobacter
pylori in various liquid and plating media. Lett. Appl. Microbiol. 30, 192–196
(2000).
96. Xia, H. X., Keane, C. T. & O’Morain, C. A. Determination of the optimal transport
system for Helicobacter pylori cultures. J. Med. Microbiol. 39, 334–337 (1993).
97. Soltesz, V., Zeeberg, B. & Wadstrom, T. Optimal survival of Helicobacter pylori
under various transport conditions. Helicobacter 30, 1453–1456 (1992).
98. Taneera, J. et al. Influence of activated charcoal, porcine gastric mucin and beta-
cyclodextrin on the morphology and growth of intestinal and gastric Helicobacter
spp. Microbiology 148, 677–684 (2002).
Chapter 2
72
99. Morgan, D. R., Freedman, R., Depew, C. E. & Kraft, W. G. Growth of
Campylobacter pylori in liquid media. J. Clin. Microbiol. 25, 2123–2135 (1987).
100. Degnan, A. J., Sonzogni, W. C. & Standridge, J. H. Development of a plating
medium for selection of Helicobacter pylori from water samples. Appl. Environ.
Microbiol. 69, 2914–2918 (2003).
101. Hartzen, S. H. et al. Antimicrobial susceptibility testing of 230 Helicobacter pylori
strains: importance of medium, inoculum, and incubation time. Antimicrob. Agents
Chemother. 41, 2634–2349 (1997).
102. Tee, W., Fairley, S., Smallwood, R. & Dwyer, B. Comparative evaluation of three
selective media and a nonselective medium for the culture of Helicobacter pylori
from gastric biopsies. J. Clin. Microbiol. 29, 2587–2589 (1991).
103. Walsh, E. J. & Moran, a P. Influence of medium composition on the growth and
antigen expression of Helicobacter pylori. J. Appl. Microbiol. 83, 67–75 (1997).
104. Vega, A. E., Cortin, T. I., Mattana, C. M., Silva, H. J. & Centorbi, O. P. De. Growth
of Helicobacter pylori in medium supplemented with cyanobacterial extract. J. Clin.
Microbiol. 41, 5384–5388 (2003).
105. Krajden, S. et al. Comparison of selective and nonselective media for recovery of
Campylobacter pylori from antral biopsies. J. Clin. Microbiol. 25, 1117–1118
(1987).
106. Coudron, P. E. & Kirby, D. F. Comparison of rapid urease tests, staining
techniques, and growth on different solid media for detection of Campylobacter
pylori. J. Clin. Microbiol. 27, 1527–1530 (1989).
107. Henriksen, T. H., Brorson, O., Thoresen, T., Setegn, D. & Madebo, T. Rapid growth
of Helicobacter pylori. Rev. Infect. Dis. 14, 1008–1011 (1995).
108. Shahamat, M., Mai, U. E. H., Paszko-Kolva, C., Yamamoto, H. & Colwell, R. R.
Evaluation of liquid media for growth of Helicobacter pylori. J. Clin. Microbiol. 29,
2835–2837 (1991).
109. Jiang, X. & Doyle, M. P. Growth supplements for Helicobacter pylori. J. Clin.
Microbiol. 38, 1984–1987 (2000).

State of the art
73
110. Lin, Y. L., Lee, N. & Chan, E. C. Determination of optimal liquid medium for
enzyme expression by Helicobacter pylori. J. Clin. Pathol. 49, 818–820 (1996).
111. Duque-Jamaica, R., Arévalo-Galvis, A., Poutou-Piñales, R. A. & Trespalacios, A. A.
Sequential statistical improvement of the liquid cultivation of Helicobacter pylori.
Helicobacter 15, 303–312 (2010).
112. Kitsos, C. M. & Stadtländer, C. T. Helicobacter pylori in liquid culture: evaluation of
growth rates and ultrastructure. Curr. Microbiol. 37, 88–93 (1998).
113. Sato, F. et al. Ultrastructural observation of Helicobacter pylori in glucose-
supplemented culture media. J. Med. Microbiol. 52, 675–679 (2003).
114. Park, S. A., Ko, A. & Lee, N. G. Stimulation of growth of the human gastric
pathogen Helicobacter pylori by atmospheric level of oxygen under high carbon
dioxide tension. BMC Microbiol. 11, 1–14 (2011).
115. Richards, C. L. et al. Optimizing the growth of stressed Helicobacter pylori. J.
Microbiol. Methods 84, 174–182 (2011).
116. Andersen, A. P. et al. Growth and morphological transformations of Helicobacter
pylori in broth media. J. Clin. Microbiol. 35, 2918–2922 (1997).
117. Coudron, P. E. & Stratton, C. W. Factors affecting growth and susceptibility testing
of Helicobacter pylori in liquid media. J. Clin. Microbiol. 33, 1028–1030 (1995).
118. Vartanova, N. O., Arzumanyan, V. G., Serdyuk, O. a & Temper, R. M. Creation of a
new synthetic medium for culturing Helicobacter pylori. Bull. Exp. Biol. Med. 139,
580–584 (2005).
119. Joo, J.-S. et al. A thin-layer liquid culture technique for the growth of Helicobacter
pylori. Helicobacter 15, 295–302 (2010).
120. Mendz, G. L. & Hazell, S. L. Aminoacid utilization by Helicobacter pylori. Int. J.
Biochem. Cell Biol. 27, 1085–1093 (1995).
121. Stark, R. M., Suleiman, M. S., Hassan, I. J., Greenman, J. & Millar, M. R. Amino
acid utilisation and deamination of glutamine and asparagine by Helicobacter
pylori. J. Med. Microbiol. 46, 793–800 (1997).
122. Bury-Moné, S. et al. Is Helicobacter pylori a true microaerophile? Helicobacter 11,
296–303 (2006).
Chapter 2
74
123. Donelli, G. et al. The effect of oxygen on the growth and cell morphology of
Helicobacter pylori. FEMS Microbiol. Lett. 168, 9–15 (1998).
124. Shirai, M. et al. Accumulation of polyphosphate granules in Helicobacter pylori cells
under anaerobic conditions. J. Med. Microbiol. 49, 513–519 (2000).
125. Cottet, S., Corthésy, B. & Spertini, F. Microaerophilic conditions permit to mimic in
vitro events occurring during in vivo Helicobacter pylori infection and to identify
Rho/Ras-associated proteins in cellular signaling. J. Biol. Chem. 277, 33978–
33986 (2002).
126. Deshpande, M., Calenoff, E. & Daniels, L. Rapid large-scale growth of Helicobacter
pylori in flasks and fermentors. Appl. Environ. Microbiol. 61, 2431–2435 (1995).
127. Rektorschek, M., Weeks, D., Sachs, G. & Melchers, K. Influence of pH on
metabolism and urease activity of. Gastroenterology 115, 628–641 (1998).
128. Andersen, a P. et al. Growth and morphological transformations of Helicobacter
pylori in broth media. J. Clin. Microbiol. 35, 2918–2922 (1997).
129. Bessa, L. J., Correia, D. M., Cellini, L., Azevedo, N. F. & Rocha, I. Optimization of
culture conditions to improve Helicobacter pylori growth in Ham’s F-12 medium by
response surface methodology. Int. J. Immunopathol. Pharmacol. 25, 901–909
(2012).
130. Doig, P. et al. Helicobacter pylori physiology predicted from genomic comparison of
two strains. Microbiol. Mol. Biol. Rev. 63, 675–707 (1999).
131. Tomb, J. F. et al. The complete genome sequence of the gastric pathogen
Helicobacter pylori. Nature 388, 539–547 (1997).
132. Mendz, G. L., Hazell, S. L. & Burns, B. P. Glucose metabolism by Helicobacter
pylori. J. Gen. Microbiol. 139, 3023–3028 (1993).
133. Hoffman, P. S., Goodwin, A., Johnsen, J. O. N., Magee, K. & Veldhuyzen van
Zanten, S. J. O. Metabolic activities of metronidazole-sensitive and -resistant strains
of Helicobacter pylori: repression of pyruvate oxidoreductase and expression of
isocitrate lyase activity correlate with resistance. J. Bacteriol. 178, 4822–9
(1996).
State of the art
75
134. Mendz, G. L., Burns, B. P. & Stuart, L. H. Characterization of glucose transport in
Helicobacter pylori. Biochim. Biophys. Acta 1244, 269–276 (1995).
135. Marais, A., Mendz, G. L., Hazell, S. L. & Mégraud, F. Metabolism and genetics of
Helicobacter pylori: the genome era. Microbiol. Mol. Biol. Rev. 63, 642–674
(1999).
136. Psakis, G. et al. The sodium-dependent D-glucose transport protein of Helicobacter
pylori. Mol. Microbiol. 71, 391–403 (2009).
137. Pawłowski, K., Zhang, B., Rychlewski, L. & Godzik, A. The Helicobacter pylori
genome: from sequence analysis to structural and functional predictions. Proteins
Struct. Funct. Genet. 36, 20–30 (1999).
138. Mendz, G. L. & Hazell, S. L. Glucose phosphorylation in Helicobacter pylori. Appl.
Biochem. Biophys. 300, 522–525 (1993).
139. Mendz, G. L. & Hazell, S. L. Evidence for a pentose phosphate pathway in
Helicobacter pylori. FEMS Microbiol. Lett. 84, 331–336 (1991).
140. Mendz, G. L., Hazell, S. L. & Burns, B. P. Glucose utilization and lactate production
by Helicobacter pylori. J. Gen. Microbiol. 139, 3023–3028 (1993).
141. Chalk, P. A., Roberts, A. D. & Blows, W. M. Metabolism of pyruvate and glucose by
intact cells of Helicobacter pylori studied by 13C NMR spectroscopy. Microbiology
140, 2085–2092 (1994).
142. Mendz, G. L., Hazell, S. L. & van Gorkom, L. Pyruvate metabolism in Helicobacter
pylori. Arch. Microbiol. 162, 187–192 (1994).
143. Mendz, G. L., Hazell, S. L. & Burns, B. P. The Entner-Doudoroff pathway in
Helicobacter pylori. Arch. Biochem. Biophys. 312, 349–356 (1994).
144. Wanken, A. E., Conway, T. & Eaton, K. A. The Entner-Doudoroff pathway has little
effect on Helicobacter pylori colonization of mice. Infect. Immun. 71, 2920–2923
(2003).
145. Hughes, N. J., Chalk, P. a, Clayton, C. L. & Kelly, D. J. Identification of
carboxylation enzymes and characterization of a novel four-subunit
pyruvate:flavodoxin oxidoreductase from Helicobacter pylori. J. Bacteriol. 177,
3953–3959 (1995).
Chapter 2
76
146. Hughes, N. J., Clayton, C. L., Chalk, P. a & Kelly, D. J. Helicobacter pylori porCDAB
and oorDABC genes encode distinct pyruvate:flavodoxin and 2-
oxoglutarate:acceptor oxidoreductases which mediate electron transport to NADP.
J. Bacteriol. 180, 1119–1128 (1998).
147. St Maurice, M. et al. Flavodoxin:quinone reductase (FqrB): a redox partner of
pyruvate:ferredoxin oxidoreductase that reversibly couples pyruvate oxidation to
NADPH production in Helicobacter pylori and Campylobacter jejuni. J. Bacteriol.
189, 4764–4673 (2007).
148. Tomb, J.-F. et al. The complete genome sequence of the gastric pathogen
Helicobacter pylori. Nature 388, 539–547 (1997).
149. Pitson, S. M., Mendz, G. L., Srinivasan, S. & Hazell, S. L. The tricarboxylic acid
cycle of Helicobacter pylori. Eur. J. Biochem. 267, 258–267 (1999).
150. Kather, B., Stingl, K., van der Rest, M. E., Altendorf, K. & Molenaar, D. Another
unusual type of citric acid cycle enzyme in Helicobacter pylori: the malate:quinone
oxidoreductase. J. Bacteriol. 182, 3204–3209 (2000).
151. Corthésy-theulaz, I. E. et al. Cloning and characterization of Helicobacter pylori
Succinyl Prokaryotic member of the CoA-transferase family. J. Biol. Chem. 272,
25659–25667 (1997).
152. Tsugawa, H. et al. Alpha-ketoglutarate oxidoreductase, an essential salvage enzyme
of energy metabolism, in coccoid form of Helicobacter pylori. Biochem. Biophys.
Res. Commun. 376, 46–51 (2008).
153. Mendz, G. L. & Hazell, S. L. Fumarate catabolism in Helicobacter pylori. Biochem.
Mol. Biol. Int. 31, 325–332 (1993).
154. Mendz, G. L., Meek, D. J. & Hazell, S. L. Characterization of fumarate transport in
Helicobacter pylori. J. Membr. Biol. 76, 65–76 (1998).
155. Birkholz, S., Knipp, U., Lemma, E., Kroger, A. & Opferkuch, W. Fumarate
reductase of Helicobacter pylori-an immunogenic protein. J. Med. Microbiol. 41,
56–62 (1994).
State of the art
77
156. Mendz, G. L., Hazell, S. L. & Srinivasan, S. Fumarate reductase: a target for
therapeutic intervention against Helicobacter pylori. Arch. Biochem. Biophys. 321,
153–159 (1995).
157. Ge, Z., Jiang, Q., Kalisiak, M. S. & Taylor, D. E. Cloning and functional
characterization of Helicobacter pylori fumarate reductase operon comprising three
structural genes coding for subunits C, A and B. Gene 204, 227–234 (1997).
158. Ge, Z. et al. Fumarate reductase is essential for Helicobacter pylori colonization of
the mouse stomach. Microb. Pathog. 29, 279–287 (2000).
159. Hoffman, P. S., Goodwin, A., Johnsen, J., Magee, K. & Veldhuyzen van Zanten, S.
J. O. Metabolic activities of metronidazole-sensitive and -resistant strains of
Helicobacter pylori: repression of pyruvate oxidoreductase and expression of
isocitrate lyase activity correlate with resistance. J. Bacteriol. 178, 4822–4829
(1996).
160. Schott, T., Kondadi, P. K., Hänninen, M.-L. & Rossi, M. Comparative genomics of
Helicobacter pylori and the human-derived Helicobacter bizzozeronii CIII-1 strain
reveal the molecular basis of the zoonotic nature of non-pylori gastric Helicobacter
infections in humans. BMC Genomics 12, 1–21 (2011).
161. Barabási, A.-L. & Oltvai, Z. N. Network biology: understanding the cell’s functional
organization. Nat. Rev. Genet. 5, 101–113 (2004).
162. Kitano, H. Perspectives on Systems Biology. New Gener. Comput. 18, 199–216
(2000).
163. Kitano, H. Computational Systems Biology. Nature 420, 206–210 (2002).
164. Kitano, H. Systems biology: a brief overview. Science 295, 1662–4 (2002).
165. Bruggeman, F. J. & Westerhoff, H. V. The nature of systems biology. Trends
Microbiol. 15, 45–50 (2007).
166. Medina, M. Á. Systems biology for molecular life sciences and its impact in
biomedicine. Cell. Mol. Life Sci. 70, 1035–1053 (2013).
167. Oltvai, Z. N. & Barabási, A. Life’s complexity pyramid. Science (80-. ). 298, 763–
765 (2002).

Chapter 2
78
168. Nielsen, J. & Vidal, M. Systems biology of microorganisms. Curr. Opin. Microbiol.
13, 335–336 (2010).
169. Nielsen, J. & Lee, S. Y. Systems biology: the “new biotechnology”. Curr. Opin.
Biotechnol. 23, 583–584 (2012).
170. Kuska, B. Beer, Bethesda, and biology: how “genomics” came into being. J. Natl.
Cancer Inst. 90, 93 (1998).
171. Milne, S. B., Mathews, T. P., Myers, D. S., Ivanova, P. T. & Brown, H. A. Sum of
the parts: mass spectrometry-based metabolomics. Biochemistry 52, 3829–3840
(2013).
172. Tang, Y. J. et al. Advances in analysis of microbial metabolic fluxes via 13C isotopic
labeling. Mass Spectrom. Rev. 28, 362–375 (2009).
173. Fiehn, O. Metabolomics--the link between genotypes and phenotypes. Plant Mol.
Biol. 48, 155–71 (2002).
174. Nielsen, J. & Oliver, S. The next wave in metabolome analysis. Trends Biotechnol.
23, 544–6 (2005).
175. Nielsen, J. in Metabolome Anal. - An Introd. (Villas-Bôas, S. G., Roessner, U.,
Hansen, M. A. E., Smedsgaard, J. & Nielsen, J.) 310 (John Wiley & Sons, Inc,
2007).
176. Bolten, C. J., Kiefer, P., Letisse, F., Portais, J.-C. & Wittmann, C. Sampling for
metabolome analysis of microorganisms. Anal. Chem. 79, 3843–3849 (2007).
177. Smart, K. F., Aggio, R. B. M., Van Houtte, J. R. & Villas-Bôas, S. G. Analytical
platform for metabolome analysis of microbial cells using methyl chloroformate
derivatization followed by gas chromatography-mass spectrometry. Nat. Protoc. 5,
1709–1729 (2010).
178. Toya, Y. & Shimizu, H. Flux analysis and metabolomics for systematic metabolic
engineering of microorganisms. Biotechnol. Adv. 31, 818–826 (2013).
179. Mashego, M. R. et al. Microbial metabolomics: past, present and future
methodologies. Biotechnol. Lett. 29, 1–16 (2007).
State of the art
79
180. Álvarez-Sánchez, B., Priego-Capote, F. & Castro, M. D. L. de. Metabolomics
analysis II. Preparation of biological samples prior to detection. Trends Anal. Chem.
29, 120–127 (2010).
181. Winder, C. L. et al. Global metabolic profiling of Escherichia coli cultures: an
evaluation of methods for quenching and extraction of intracellular metabolites.
Anal. Chem. 80, 2939–2948 (2008).
182. Spura, J. et al. A method for enzyme quenching in microbial metabolome analysis
successfully applied to gram-positive and gram-negative bacteria and yeast. Anal.
Biochem. 394, 192–201 (2009).
183. Taymaz-Nikerel, H. et al. Development and application of a differential method for
reliable metabolome analysis in Escherichia coli. Anal. Biochem. 386, 9–19
(2009).
184. Meyer, H., Weidmann, H. & Lalk, M. Methodological approaches to help unravel
the intracellular metabolome of Bacillus subtilis. Microb. Cell Fact. 12, 1–13
(2013).
185. Chen, M. et al. Optimization of the quenching method for metabolomics analysis of
Lactobacillus bulgaricus. J. Zhejiang Univ. Sci. B 15, 333–342 (2014).
186. Meyer, H., Liebeke, M. & Lalk, M. A protocol for the investigation of the intracellular
Staphylococcus aureus metabolome. Anal. Biochem. 401, 250–259 (2010).
187. Villas-Bôas, S. G., Højer-Pedersen, J., Akesson, M., Smedsgaard, J. & Nielsen, J.
Global metabolite analysis of yeast: evaluation of sample preparation methods.
Yeast 22, 1155–69 (2005).
188. Canelas, A. B. et al. Leakage-free rapid quenching technique for yeast
metabolomics. Metabolomics 4, 226–239 (2008).
189. Ewald, J. C., Heux, S. & Zamboni, N. High-throughput quantitative metabolomics:
workflow for cultivation, quenching, and analysis of yeast in a multiwell format.
Anal. Chem. 81, 3623–3629 (2009).
190. Johnson, C. H. & Gonzalez, F. J. Challenges and opportunities of metabolomics. J.
Cell. Physiol. 227, 2975–2981 (2012).
Chapter 2
80
191. Putri, S. P., Yamamoto, S., Tsugawa, H. & Fukusaki, E. Current metabolomics:
technological advances. J. Biosci. Bioeng. 116, 9–16 (2013).
192. Koek, M. M., Jellema, R. H., van der Greef, J., Tas, A. C. & Hankemeier, T.
Quantitative metabolomics based on gas chromatography mass spectrometry:
status and perspectives. Metabolomics 7, 307–328 (2011).
193. Husek, P. Chloroformates in gas chromatography as general purpose derivatizing
agents. J. Chromatogr. B. Biomed. Sci. Appl. 717, 57–91 (1998).
194. Kaspar, H., Dettmer, K., Gronwald, W. & Oefner, P. J. Automated GC-MS analysis
of free amino acids in biological fluids. J. Chromatogr. B, 870, 222–232 (2008).
195. Zheng, X. et al. A targeted metabolomic protocol for short-chain fatty acids and
branched-chain amino acids. Metabolomics 9, 818–827 (2013).
196. Qiu, Y. et al. Application of ethyl chloroformate derivatization for gas
chromatography-mass spectrometry based metabonomic profiling. Anal. Chim.
Acta 583, 277–283 (2007).
197. Gao, X. et al. Metabolite analysis of human fecal water by gas
chromatography/mass spectrometry with ethyl chloroformate derivatization. Anal.
Biochem. 393, 163–75 (2009).
198. Villas-Bôas, S. G., Delicado, D. G., Akesson, M. & Nielsen, J. Simultaneous analysis
of amino and nonamino organic acids as methyl chloroformate derivatives using
gas chromatography-mass spectrometry. Anal. Biochem. 322, 134–8 (2003).
199. Kvitvang, H. F. N., Andreassen, T., Adam, T., Villas-Bôas, S. G. & Bruheim, P.
Highly sensitive GC/MS/MS method for quantitation of amino and nonamino
organic acids. Anal. Chem. 83, 2705–2711 (2011).
200. Azizan, K. A., Baharum, S. N. & Noor, N. M. Metabolic profiling of Lactococcus
lactis under different culture conditions. Molecules 17, 8022–8036 (2012).
201. Hendriks, M. M. W. B. et al. Data-processing strategies for metabolomics studies.
Trends Anal. Chem. 30, 1685–1698 (2011).
202. Stein, S. E. Chemical substructure identification by mass spectral library searching.
J. Am. Soc. Mass Spectrom. 6, 644–655 (1995).
State of the art
81
203. Lu, H., Liang, Y., Dunn, W. B., Shen, H. & Kell, D. B. Comparative evaluation of
software for deconvolution of metabolomics data based on GC-TOF-MS. TrAC
Trends Anal. Chem. 27, 215–227 (2008).
204. Liland, K. H. Multivariate methods in metabolomics – from pre-processing to
dimension reduction and statistical analysis. Trends Anal. Chem. 30, 827–841
(2011).
205. Loughlin, M. F. Using “omic” technology to target Helicobacter pylori. Expert Opin.
Drug Discov. 2, 1041–1051 (2007).
206. Benson, D. a et al. GenBank. Nucleic Acids Res. 41, D36–D42 (2013).
207. Ahmed, N., Loke, M. F., Kumar, N. & Vadivelu, J. Helicobacter pylori in 2013:
multiplying genomes, emerging insights. Helicobacter 18 Suppl 1, 1–4 (2013).
208. De Reuse, H. & Bereswill, S. Ten years after the first Helicobacter pylori genome :
comparative and functional genomics provide new insights in the variability and
adaptability of a persistent pathogen. FEMS Immunol. Med. Microbiol. 50, 165–
176 (2007).
209. Linz, B. & Schuster, S. C. Genomic diversity in Helicobacter and related organisms.
Res. Microbiol. 158, 737–744 (2007).
210. Alm, R. A. et al. Genomic-sequence comparison of two unrelated isolates of the
human gastric pathogen Helicobacter pylori. Nature 397, 176–180 (1999).
211. Salama, N. et al. A whole-genome microarray reveals genetic diversity among
Helicobacter pylori strains. Proc. Natl. Acad. Sci. U. S. A. 97, 14668–14673
(2000).
212. Suerbaum, S. & Achtman, M. Helicobacter pylori: recombination, population
structure and human migrations. Int. J. Med. Microbiol. 294, 133–139 (2004).
213. Kraft, C. & Suerbaum, S. Mutation and recombination in Helicobacter pylori:
mechanisms and role in generating strain diversity. Int. J. Med. Microbiol. 295,
299–305 (2005).
214. Edgar, R., Domrachev, M. & Lash, A. E. Gene expression omnibus: NCBI gene
expression and hybridization array data repository. Nucleic Acids Res. 30, 207–
210 (2002).
Chapter 2
82
215. Srikhanta, Y. N. et al. Phasevarion mediated epigenetic gene regulation in
Helicobacter pylori. PLoS One 6, e27569 (2011).
216. Dorer, M. S., Fero, J. & Salama, N. R. DNA damage triggers genetic exchange in
Helicobacter pylori. PLoS Pathog. 6, e1001026 (2010).
217. Wen, Y., Feng, J., Scott, D. R., Marcus, E. a & Sachs, G. The pH-responsive regulon
of HP0244 (FlgS), the cytoplasmic histidine kinase of Helicobacter pylori. J.
Bacteriol. 191, 449–460 (2009).
218. Giannakis, M., Chen, S. L., Karam, S. M., Engstrand, L. & Gordon, J. I.
Helicobacter pylori evolution during progression from chronic atrophic gastritis to
gastric cancer and its impact on gastric stem cells. Proc. Natl. Acad. Sci. U. S. A.
105, 4358–4363 (2008).
219. Giannakis, M. et al. Response of gastric epithelial progenitors to Helicobacter pylori
isolates obtained from Swedish patients with chronic atrophic gastritis. J. Biol.
Chem. 284, 30383–30394 (2009).
220. Pflock, M. et al. Characterization of the ArsRS regulon of Helicobacter pylori,
involved in acid adaptation. J. Bacteriol. 188, 3449–3462 (2006).
221. Pflock, M. et al. The orphan response regulator HP1021 of Helicobacter pylori
regulates transcription of a gene cluster presumably involved in acetone
metabolism. J. Bacteriol. 189, 2339–49 (2007).
222. Asakura, H. et al. Helicobacter pylori HP0518 affects flagellin glycosylation to alter
bacterial motility. Mol. Microbiol. 78, 1130–1144 (2010).
223. Bumann, D. et al. Proteome analysis of secreted proteins of the gastric pathogen
Helicobacter pylori. Infect. Immun. 70, 3396–3403 (2002).
224. Haas, G. et al. Immunoproteomics of Helicobacter pylori infection. Proteomics 2,
313–324 (2002).
225. Backert, S. et al. Subproteomes of soluble and structure-bound Helicobacter pylori
proteins analyzed by two-dimensional gel electrophoresis and mass spectrometry.
Proteomics 5, 1331–1345 (2005).
State of the art
83
226. Mini, R. et al. Comparative proteomics and immunoproteomics of Helicobacter
pylori related to different gastric pathologies. J. Chromatogr. B. Analyt. Technol.
Biomed. Life Sci. 833, 63–79 (2006).
227. Bumann, D. et al. Lack of stage-specific proteins in coccoid Helicobacter pylori
cells. Society 72, 6738–6742 (2004).
228. Jungblut, P. R. et al. Comparative proteome analysis of Helicobacter pylori. Mol.
Microbiol. 36, 710–25 (2000).
229. Liao, J.-H. et al. Up-regulation of neutrophil activating protein in Helicobacter pylori
under high-salt stress: structural and phylogenetic comparison with bacterial iron-
binding ferritins. Biochimie 95, 1136–45 (2013).
230. Zhang, M.-J. et al. Comparative proteomic analysis of passaged Helicobacter pylori.
J. Basic Microbiol. 49, 482–90 (2009).
231. Baik, S. et al. Proteomic analysis of the sarcosine-insoluble outer membrane
fraction of Helicobacter pylori strain 26695. Society 186, 949–955 (2004).
232. Kim, N. et al. Proteins released by Helicobacter pylori In Vitro. Society 184, 6155–
6162 (2002).
233. Lock, R. a, Cordwell, S. J., Coombs, G. W., Walsh, B. J. & Forbes, G. M. Proteome
analysis of Helicobacter pylori: major proteins of type strain NCTC 11637.
Pathology 33, 365–374 (2001).
234. Zeng, H., Guo, G., Mao, X. H., Tong, W. De & Zou, Q. M. Proteomic insights into
Helicobacter pylori coccoid forms under oxidative stress. Curr. Microbiol. 57, 281–
286 (2008).
235. Chuang, M.-H., Wu, M.-S., Lin, J.-T. & Chiou, S.-H. Proteomic analysis of proteins
expressed by Helicobacter pylori under oxidative stress. Proteomics 5, 3895–3901
(2005).
236. Qu, W. et al. Helicobacter pylori proteins response to nitric oxide stress. J.
Microbiol. 47, 486–493 (2009).
237. Smiley, R., Bailey, J., Sethuraman, M., Posecion, N. & Showkat Ali, M. Comparative
proteomics analysis of sarcosine insoluble outer membrane proteins from
Chapter 2
84
clarithromycin resistant and sensitive strains of Helicobacter pylori. J. Microbiol.
51, 612–618 (2013).
238. Choi, Y. W., Park, S. A., Lee, H. W., Kim, D. S. & Lee, N. G. Analysis of growth
phase-dependent proteome profiles reveals differential regulation of mRNA and
protein in Helicobacter pylori. Proteomics 8, 2665–2675 (2008).
239. Sun, Y. et al. Proteomic analysis of the function of spot in Helicobacter pylori anti-
oxidative stress in vitro and colonization in vivo. J. Cell. Biochem. 113, 3393–
3402 (2012).
240. Huang, C.-H. & Chiou, S.-H. Proteomic analysis of upregulated proteins in
Helicobacter pylori under oxidative stress induced by hydrogen peroxide. Kaohsiung
J. Med. Sci. 27, 544–553 (2011).
241. Loh, J. T., Gupta, S. S., Friedman, D. B., Krezel, A. M. & Cover, T. L. Analysis of
protein expression regulated by the Helicobacter pylori ArsRS two-component signal
transduction system. J. Bacteriol. 192, 2034–43 (2010).
242. Ge, R. et al. A proteomic approach for the identification of bismuth-binding proteins
in Helicobacter pylori. J. Biol. Inorg. Chem. 12, 831–842 (2007).
243. Shao, C. et al. The changes of proteomes components of Helicobacter pylori in
response to acid stress without urea. J. Microbiol. 46, 331–7 (2008).
244. Govorun, V. M. et al. Comparative analysis of proteome maps of Helicobacter pylori
clinical isolates. Biochem. Biokhimii͡a 68, 42–49 (2003).
245. Smith, T. G., Lim, J.-M., Weinberg, M. V, Wells, L. & Hoover, T. R. Direct analysis of
the extracellular proteome from two strains of Helicobacter pylori. Proteomics 7,
2240–2245 (2007).
246. Lee, H. W., Choe, Y. H., Kim, D. K., Jung, S. Y. & Lee, N. G. Proteomic analysis of
a ferric uptake regulator mutant of Helicobacter pylori: regulation of Helicobacter
pylori gene expression by ferric uptake regulator and iron. Proteomics 4, 2014–
2027 (2004).
247. Hynes, S. O., Mcguire, J., Falt, T. & Wadström, T. The rapid detection of low
molecular mass proteins differentially expressed under biological stress for four
Helicobacter spp. using ProteinChip. Proteins 273–278 (2003).
State of the art
85
248. Park, J.-W. et al. Quantitative analysis of representative proteome components and
clustering of Helicobacter pylori clinical strains. Helicobacter 11, 533–543 (2006).
249. Momynaliev, K. T. et al. Functional divergence of Helicobacter pylori related to early
gastric cancer research articles. J. Proteome Res. 9, 254–267 (2010).
250. Ge, R. et al. Phosphoproteome analysis of the pathogenic bacterium Helicobacter
pylori reveals over-representation of tyrosine phosphorylation and multiply
phosphorylated proteins. Proteomics 11, 1449–1461 (2011).
251. Krah, A. et al. Analysis of automatically generated peptide mass fingerprints of
cellular proteins and antigens from Helicobacter pylori 26695 separated by two-
dimensional electrophoresis. Mol. Cell. Proteomics 2, 1271–1283 (2003).
252. Jungblut, P. R. et al. Helicobacter pylori proteomics by 2-DE/MS, 1-DE-LC/MS and
functional data mining. Proteomics 10, 182–193 (2010).
253. Stelling, J. Mathematical models in microbial systems biology. Curr. Opin.
mMcrobiology 7, 513–518 (2004).
254. Patil, K. R., Akesson, M. & Nielsen, J. Use of genome-scale microbial models for
metabolic engineering. Curr. Opin. Biotechnol. 15, 64–69 (2004).
255. Palsson, B. Metabolic systems biology. FEBS Lett. 583, 3900–3904 (2009).
256. Price, N. D., Papin, J. a, Schilling, C. H. & Palsson, B. O. Genome-scale microbial
in silico models: the constraints-based approach. Trends Biotechnol. 21, 162–169
(2003).
257. Edwards, J. S. & Palsson, B. O. Systems properties of the Haemophilus influenzae
Rd Metabolic Genotype. Cell Biol. Metab. 274, 17410–17416 (1999).
258. Feist, A. M., Herrgård, M. J., Thiele, I., Reed, J. L. & Palsson, B. Ø. Reconstruction
of biochemical networks in microorganisms. Nat. Rev. Microbiol. 7, 129–143
(2009).
259. Rocha, I., Förster, J. & Nielsen, J. in Methods Mol. Biol. vol. 416 Gene Essentiality
(Gerdes, S. Y. & Osterman, A. L.) 416, 409–433 (Humana Press Inc., 2007).
260. Hamilton, J. J. & Reed, J. L. Software platforms to facilitate reconstructing genome-
scale metabolic networks. Environ. Microbiol. 16, 49–59 (2014).

Chapter 2
86
261. Feist, A. M., Herrgård, M. J., Thiele, I., Reed, J. L. & Palsson, B. Ø. Reconstruction
of biochemical networks in microorganisms. Nat. Rev. Microbiol. 7, 129–43
(2009).
262. Thiele, I. & Palsson, B. Ø. A Protocol for generating a high-quality genome-scale
metabolic reconstruction. Nat. Protoc. 5, 93–121 (2010).
263. Santos, F., Boele, J. & Teusink, B. in Methods Enzymol. Vol. 500 (Jameson, D.,
Verma, M. & Westerhoff, H. V) 500, 509–532 (Elsevier Inc., 2011).
264. Karp, P. D., Paley, S. & Romero, P. The Pathway Tools software. Bioinformatics 18
Suppl 1, S225–S232 (2002).
265. Overbeek, R. et al. The subsystems approach to genome annotation and its use in
the project to annotate 1000 genomes. Nucleic Acids Res. 33, 5691–5702
(2005).
266. Dias, O., Rocha, M., Ferreira, E. C. & Rocha, I. Merlin: metabolic models
reconstruction using genome-scale information. in Proc. 11th Int. Symp. Comput.
Appl. Biotechnol. (CAB 2010) (Banga, J. R., Bagaerts, P., Impe, J. Van, Dochain, D.
& Smets, I.) 120–125 (2010).
267. Agren, R. et al. The RAVEN toolbox and its use for generating a genome-scale
metabolic model for Penicillium chrysogenum. PLoS Comput. Biol. 9, e1002980
(2013).
268. Boneca, I. G., De Reuse, H., Epinat, J., Pupin, M. & Labigne, Agnès, Moszer, I. A
revised annotation and comparative analysis of Helicobacter pylori genomes.
Nucleic Acids Res. 31, 1704–1714 (2003).
269. Cherry, J. M. et al. SGD : Saccharomyces Genome Database. Nucleic Acids Res.
26, 73–79 (1998).
270. Maglott, D., Ostell, J., Pruitt, K. D. & Tatusova, T. Entrez Gene: gene-centered
information at NCBI. Nucleic Acids Res. 33, D54–D58 (2005).
271. Markowitz, V. M. et al. The integrated microbial genomes (IMG) system. Nucleic
Acids Res. 34, D344–D348 (2006).
272. Kanehisa, M. & Goto, S. KEGG: Kyoto Encyclopedia of Genes and Genomes.
Nucleic Acids Res. 28, 27–30 (2000).
State of the art
87
273. Schomburg, I., Chang, A. & Schomburg, D. BRENDA, enzyme data and metabolic
information. Nucleic Acids Res. 30, 47–49 (2002).
274. Caspi, R. et al. The MetaCyc database of metabolic pathways and enzymes and the
BioCyc collection of pathway/genome databases. Nucleic Acids Res. 40, D742–
D753 (2012).
275. Ren, Q., Chen, K. & Paulsen, I. T. TransportDB: a comprehensive database
resource for cytoplasmic membrane transport systems and outer membrane
channels. Nucleic Acids Res. 35, D274–D279 (2007).
276. Nakai, K. & Horton, P. PSORT : a program for detecting sorting signals in proteins
and predicting their subcellular localization. Trends Biochem. Sci. 24, 34–35
(1999).
277. Orth, J. D., Thiele, I. & Palsson, B. Ø. What is flux balance analysis? Nat.
Biotechnol. 28, 245–248 (2011).
278. Feist, A. M. & Palsson, B. O. The biomass objective function. Curr. Opin. Microbiol.
13, 344–349 (2010).
279. Hucka, M. et al. The systems biology markup language (SBML): a medium for
representation and exchange of biochemical network models. Bioinformatics 19,
524–531 (2003).
280. Ghosh, S., Matsuoka, Y., Asai, Y., Hsin, K.-Y. & Kitano, H. Software for systems
biology: from tools to integrated platforms. Nat. Rev. Genet. 12, 821–832 (2011).
281. Ge, Z. & Taylor, D. E. Contributions of genome sequencing to understanding the
biology of Helicobacter pylori. Annu. Rev. Microbiol. 53, 353–387 (1999).
282. Schilling, C. H. et al. Genome-scale metabolic model of Helicobacter pylori 26695.
J. Bacteriol. 184, 4582–4593 (2002).
283. Thiele, I., Vo, T. D., Price, N. D. & Palsson, B. Ø. Expanded metabolic
reconstruction of Helicobacter pylori (iIT341 GSM/GPR ): an in silico genome-scale
characterization of single- and double-deletion mutants. J. Bacteriol. 187, 5818–
5830 (2005).

Chapter 3 3. Growth and morphology assessment methods
for Helicobacter pylori in liquid medium
Daniela M. Correia, Lucinda J. Bessa, Maria J. Vieira, Nuno F. Azevedo and Isabel Rocha
Growth and morphology assessment methods for Helicobacter pylori in liquid medium
(To be submitted)

Growth and morphology assessment methods for Helicobacter pylori in liquid medium
91
3.1. Abstract
Helicobacter pylori is known to be associated with gastric diseases. The lack of
physiological data has hampered the uncovering of mechanisms associated with infection
and consequently, many aspects related with the appearance of diseases remain unclear.
It is well known that H. pylori can change cell morphology from spiral to coccoid forms
when exposed to adverse conditions. Moreover, in those circumstances, H. pylori cells can
aggregate in clusters when in liquid culture. Such phenomenon makes it difficult to assess
growth using conventional methods. Also, some authors have reported the existence of a
viable but nonculturable state of this bacterium. The development of robust methods to
grow this bacterium and reliable methods for the assessment of growth are thus needed
for a better characterization of its physiology.
The purpose of this work was thus to study H. pylori’s growth in a chemically
semi-defined medium, to compare different methods to assess growth, and observe the
changes in morphology. Cultures were grown at 37ºC under controlled conditions in a
Ham´s F-12 medium supplemented with fetal bovine serum. In order to evaluate total cell
counts, viability and cell morphology, the following methods were used and compared,
when appropriate: cultivable cell counts, total cell counts using DAPI staining, evaluation of
viability with the Live/Dead viability kit and a PNA FISH probe which evaluates the
presence of stable rRNA. Additionally, a method that allows efficient cell disaggregation
was developed, since an increasing number and size of cell clusters were observed during
cell growth, accompanied by cell morphology conversion.
Differences of cell counts between methods were observed. The Live/Dead
viability kit was not suitable for analysis of H. pylori’s viability after the exponential cell
phase, especially during morphological cell conversion. In comparison to total counts using
DAPI, cultivable cell counts displayed, in general, lower counts, particularly after cells have
reached the stationary phase, indicating the presence of nonculturable cells. Changes in
morphology and viability were also observed, with viable and culturable coccoid cells
identified, besides spiral cells. Moreover, after 60 hours of culture, cells were mainly
coccoid and nonviable.

Chapter 3
92
Keywords: Helicobacter pylori, morphology, cell-to-cell aggregation.
Growth and morphology assessment methods for Helicobacter pylori in liquid medium
93
3.2. Introduction
H. pylori is a pathogenic, spiral-shaped bacterium, but it has been described that
it can change cell morphology from spiral to coccoid when exposed to adverse conditions,
such as aerobiosis1,2, alkaline pH3, low temperature4, nutrient starvation2,5, extended
incubation6, use of proton pump inhibitors3 or treatment with antibiotics7,8. This
pleomorphic nature of H. pylori has been intensively studied in order to understand its
importance and implications in the transmission of infection. However, the nature of
coccoid forms is a controversial topic, with some studies yielding opposite evidences.
Essentially, different types of behavior for coccoid forms were reported with respect to
viability and culturability. It is thought that this different behavior might be associated with
different types of coccoid cells, which are associated with different processes of
transformation9,10. Some authors concluded that the mentioned cell forms represent a
degenerative nonviable bacterial form11 or a “morphological manifestation of cell death”12.
Culturable H. pylori coccoid cells were described9,10,13, in opposition to the most commonly
found viable but nonculturable (VBNC) form7,9,10, also proved in other bacteria14,15. This last
type of cells is the most plausible and accepted by the scientific community.
The aim of morphological change in H. pylori is a key question, being pointed out
as a strategy of survival inside and outside of the human host16,17, with some authors
claiming that coccoid forms can revert to spiral when exposed to favorable conditions, as
proved in experiments with mice18,19.
Whether coccoid forms are capable of inducing disease remains another open
question, with several authors proving that coccoid cells, like spiral cells, express virulence
factors, emphasizing their potential pathogenicity20–22. Saito et al. (2012) showed in their
experiments that, similarly to spiral cells, coccoid forms can infect human gastric epithelial
cells23.
The conversion from spiral to coccoid forms occurs through intermediary forms
such as the U-shape24, C-shape and doughnut shape. In the last years, several studies
have been published, addressing topics related with bacterial cell shape and its
modifications, with the peptidoglycan layer having a prominent role25, including in H. pylori
Chapter 3
94
26–28. Some genetic determinants involved in cell morphology and shape transition in H.
pylori were also revealed29–32.
If there is indeed a viable but nonculturable (VBNC) form of H. pylori, then the use
of culturing techniques for growth assessment is not always adequate. Since the number
of cells can be underestimated using culturable cell counts, the enumeration of total cells
by direct count of stained cells in epifluorescent microscopy can be an alternative, also
allowing to enumerate viable and nonviable cells.
In addition, H. pylori cell-to-cell aggregation in liquid culture (complex and defined
media)4,33–35, as well as in water36, was described. It has been reported that this
phenomenon is more noticeable for H. pylori in liquid culture when oxygen is scarce34. Cell-
to-cell aggregation was reported in several other gram-negative species37–39 and it is
hypothesized that aggregation represents a strategy to survive and grow in unfavorable
environments34.
In previous experiments, we observed cell-to-cell aggregation on Ham’s F-12
nutrient mixture, making it difficult to assess the growth of H. pylori using conventional
methods such as cultivable cell counts and total cell counts using fluorochromes.
The development of robust methods to grow this bacterium and reliable methods
for the assessment of growth and morphology are thus needed for a better
characterization of its physiology and morphology.
The goals of this work were to study the growth of H. pylori in a semi-chemically
defined liquid medium using optimal environmental conditions previously found by
experimental design40. More specifically, we aimed at comparing different methods for
growth assessment and morphology evaluation, in order to be able to observe changes in
morphology during growth, giving special relevance to clusters formation. Furthermore, we
aimed at developing a method that allows to disaggregate cell clusters in order to achieve
a more reliable and accurate assessment of growth.
Growth and morphology assessment methods for Helicobacter pylori in liquid medium
95
3.3. Methods
3.3.1. Culture conditions
Helicobacter pylori 26695 (strain NCTC 12455) was cultivated in Columbia Base
Agar (CBA) (Liofilchem, Italy) supplemented with 5% (v/v) defibrinated horse blood
(Probiologica, Portugal) at 37 °C under microaerophilic conditions (5% O2, 10% CO2, 85%
N2) in a Cell Culture Incubator (Incubator HERAcell 150, Kendro Laboratory, Germany) for
3 days.
An inoculum was prepared in Ham’s F-12 nutrient mixture with glutamine (catalog
no 21765-037, Invitrogen-Gibco, Spain) previously supplemented with 5% (v/v) FBS
(catalog no 10500-064, origin: South America, Invitrogen-Gibco, Spain)41, incubated at 37
°C under 120 rpm of shaking speed (Heidolph Unimax 1010 orbital shaker, Germany) in
microaerophilic (5% O2, 10% CO2, 85% N2) conditions for approximately 17 h, in order to
reach the exponential phase.
The initial cell concentration of the culture was adjusted to an optical density at
600 nm (OD600) of 0.1 (corresponding to approximately 107 CFU/mL) in 1000 mL
Erlenmeyer flasks with the same medium as described for the inoculum by manipulating
the amount of cells incubated from the inoculum. The pH was adjusted to 8.0 with 5M
NaOH (Panreac). The culture was incubated at 37 °C under 130 rpm of shaking speed
under microaerophilic conditions (6.5% O2, 10% CO2, 83.5% N2). The experiment was
carried out in triplicate and samples were collected at selected time points up to 72 hours
of culture.
3.3.2. Cell-to-cell disaggregation
At each time point 1 mL of culture was vortexed (Press-to-Mix model 34524,
Snidjers) at maximum speed during 5 minutes in a 2-mL tube with 8-10 glass beads (1
mm diameter, Sigma). Subsequently, growth and morphology were assessed using the
methods described in the following subsections.
Chapter 3
96
3.3.3. Growth assessment
At each time point, after the application of the disaggregation method, optical
density (OD) at 600 nm was immediately assessed by using an ELISA microplate reader
(Model Sunrise, Tecan, Switzerland)
3.3.4. Colony forming unit assay
The cultivable cell counts represented by Colonies Forming Units (CFU/mL) were
assessed at each time point by the method of serial dilutions in phosphate saline buffer
(PBS) (pH 7.2), after disaggregation. For each dilution, five spots of 10 µl were plated in
CBA medium and the plates were incubated under microaerophilic conditions (5% O2; 10%
CO2; 85% N2) for 5 to 7 days at 37°C. Three to thirty colonies per spot were considered for
the counting. To determine CFU/mL the dilution rate was taken into account.
Purity control was carried out at each time of sample collection by plating each
sample in Trypticase Soy Agar (TSA) (Liofilchem, Italy).
3.3.5. Staining methods
3.3.5.1. Total Cell Counts
The total cell counts at each time point were determined using 4',6-diamidino-2-
phenylindole (DAPI) (Sigma-Aldrich). Briefly, 10 µL of disaggregated bacterial culture were
filtered under vacuum in a black Nucleopore® polycarbonate membrane (0.2 µm pore size,
25 mm diameter, Whatman). Subsequently, 40 µL of the DAPI solution (100 µg/mL
dissolved in water) were added to the membrane that was then covered with a coverslip
and kept for 10 minutes in the dark at room temperature. The membrane was washed
with 10 mL of filtered water and air dried. Then, it was placed in a microscope slide and a
drop of nonfluorescent immersion oil (Merck) was placed on the top of the membrane that
was covered with a coverslip before microscopy observation.
Growth and morphology assessment methods for Helicobacter pylori in liquid medium
97
3.3.5.2. Viability evaluation
A bacterial viability Live/Dead® BacLight™ (Molecular Probes, USA) kit was used
to determine cellular viability at each time point. In short, 1 mL of bacterial culture was
centrifuged at 10 000 rpm during 5 minutes, the supernatant was discarded and the pellet
re-suspended in 1 mL of phosphate saline buffer (PBS) (pH 7.2) and 3 µL of a mixture of
Syto9 and propidium iodide (1:1) (included in kit), and stained for 15 minutes in the dark.
5 µL of suspension were placed in a clean glass microscope slide and covered with a
coverslip. All samples were observed within 15 minutes.
3.3.5.3. Evaluation of stable rRNA
The presence of stable rRNA was evaluated at each time point using a peptic
nucleic acid fluorescence in situ hybridization (PNA FISH) probe (Hpy 769)42. The whole
procedure was performed according to Guimarães et al., 200742. The composition of
solutions (hybridization and washing) and chemicals used are described in supplementary
material 1.
Ten microliters of H. pylori culture (after disaggregation) were placed in an 8-mm
well slide and let to air dry. The samples were fixed at room temperature by covering the
sample with 30 µL of 4% (w/v) paraformaldehyde (Sigma-Aldrich) for 10 minutes.
Afterwards, 30 µL of 50% (v/v) ethanol (Fisher Chemical) were added to the wells with
care to cover the entire well surface for another 10 minutes. Then, slides were allowed to
air dry. The PNA FISH probe Hpy 769 (30 µL, 200 nM prepared in hybridization solution)
was added to each well. A negative control was prepared by adding 30 µL of hybridization
solution to another well slide. The wells were covered with coverslips and incubated in the
dark, during 90 minutes at 57°C. After that, the slides (without coverslips) were placed in
a coplin jar, immersed in prewarmed washing solution for 30 minutes at 57°C. After the
washing step the slides were left to dry in the dark. A drop of nonfluorescent immersion oil
(Merck) was placed on the wells and covered with a coverslip.
Chapter 3
98
3.3.5.4. Microscopic visualization
Samples were observed in an epifluorescence microscope (BX51 Olympus,
Hamburg, Germany) equipped with a camera (DP71; Olympus) with filters adapted to the
fluorochromes used in each method at a magnification of x1000. Pictures of each sample
were taken and a total of 10-20 random fields per sample were enumerated. The total
cells per mL of sample, percentage of viable cells, as well as percentages of spiral, coccoid
and intermediate forms (U-shape, C-shape and doughnut-shape) were determined at each
time point in three biological replicates.
3.4. Results and Discussion
3.4.1. Cell-to-cell disaggregation
We observed the cell-to-cell aggregation phenomenon on Ham’s F-12 nutrient
mixture supplemented with FBS, making it difficult to assess the growth of H. pylori using
the conventional methods such as cultivable cell counts and total cell counts using
fluorochromes. Other authors also reported the presence of cell aggregates, particularly for
coccoid cells, explained by the adhesive properties of these cells43. The described behavior
was associated with an answer to adverse conditions34. In the present work, the increase
of cell clumps was also observed with the time of culture; also, bigger coccoid cell clusters
were found to be more difficult to disaggregate.
During the optimization of the cell-to-cell disaggregation method, different
numbers of glass beads and different times of shaking in the vortex were tested in order to
achieve the best cell-to-cell disaggregation, breaking the clumps of cells without cell lysis.
The influence of the time of shaking using 8-10 glass beads in CFU/mL and OD600, in a
culture of H. pylori, at exponential phase, growing in Ham’s F-12 liquid medium
supplemented with 5% (v/v) FBS is displayed in supplementary material 2. The time of
shaking was fixed in 5 minutes, with no significant difference in CFU/mL between the
tested times of shaking (p=0.57, one-way ANOVA).
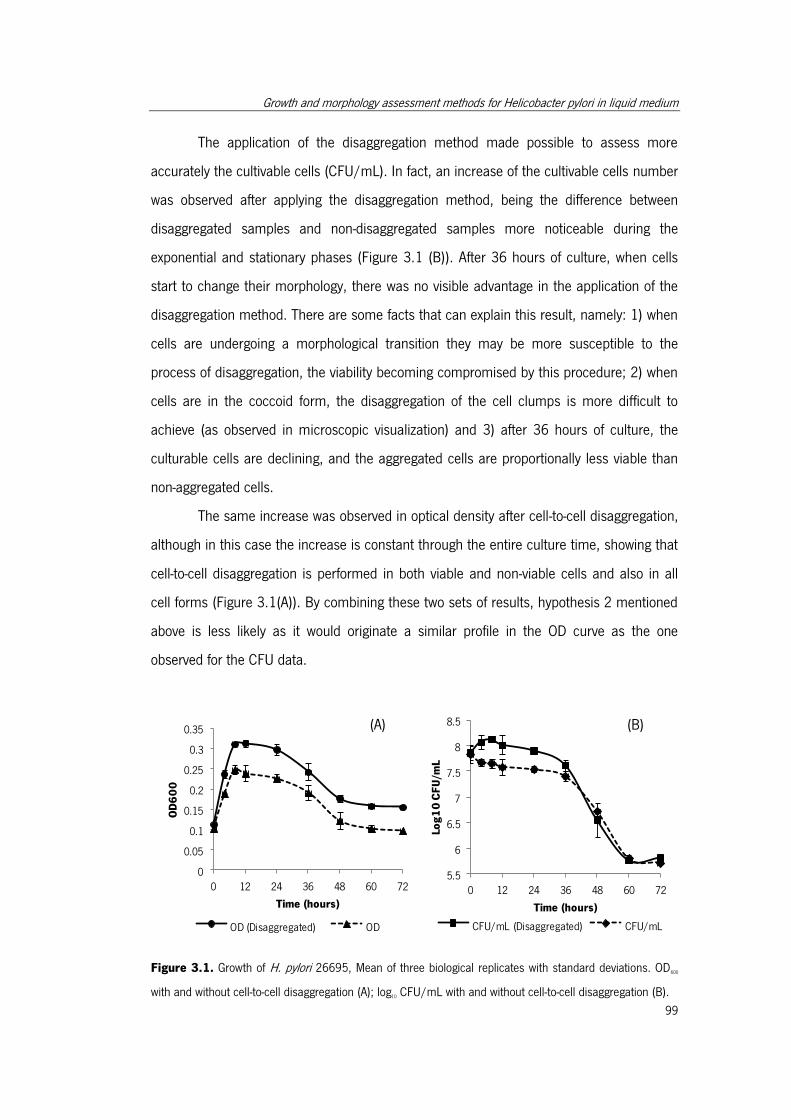
Growth and morphology assessment methods for Helicobacter pylori in liquid medium
99
The application of the disaggregation method made possible to assess more
accurately the cultivable cells (CFU/mL). In fact, an increase of the cultivable cells number
was observed after applying the disaggregation method, being the difference between
disaggregated samples and non-disaggregated samples more noticeable during the
exponential and stationary phases (Figure 3.1 (B)). After 36 hours of culture, when cells
start to change their morphology, there was no visible advantage in the application of the
disaggregation method. There are some facts that can explain this result, namely: 1) when
cells are undergoing a morphological transition they may be more susceptible to the
process of disaggregation, the viability becoming compromised by this procedure; 2) when
cells are in the coccoid form, the disaggregation of the cell clumps is more difficult to
achieve (as observed in microscopic visualization) and 3) after 36 hours of culture, the
culturable cells are declining, and the aggregated cells are proportionally less viable than
non-aggregated cells.
The same increase was observed in optical density after cell-to-cell disaggregation,
although in this case the increase is constant through the entire culture time, showing that
cell-to-cell disaggregation is performed in both viable and non-viable cells and also in all
cell forms (Figure 3.1(A)). By combining these two sets of results, hypothesis 2 mentioned
above is less likely as it would originate a similar profile in the OD curve as the one
observed for the CFU data.
Figure 3.1. Growth of H. pylori 26695, Mean of three biological replicates with standard deviations. OD600
with and without cell-to-cell disaggregation (A); log10 CFU/mL with and without cell-to-cell disaggregation (B).
0
0.05
0.1
0.15
0.2
0.25
0.3
0.35
0 12 24 36 48 60 72
OD
60
0
Time (hours)
OD (Disaggregated) OD
5.5
6
6.5
7
7.5
8
8.5
0 12 24 36 48 60 72
Log
10
CF
U/m
L
Time (hours)
CFU/mL (Disaggregated) CFU/mL
(A) (B)
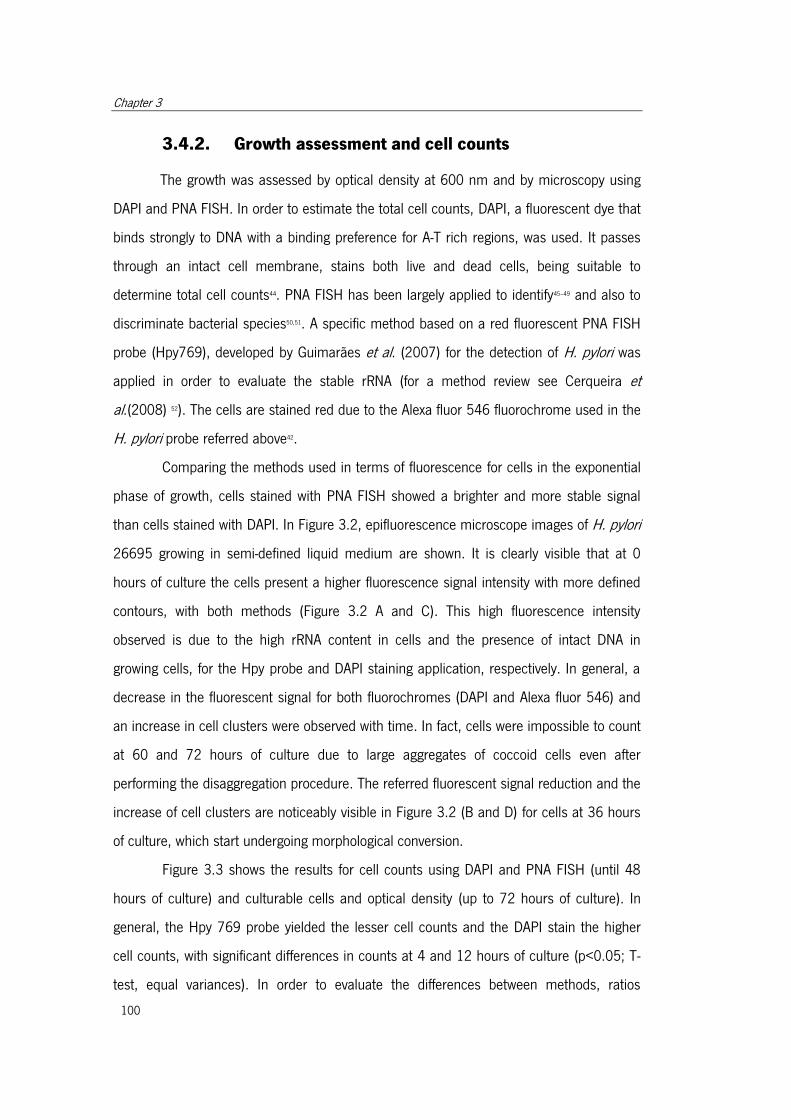
Chapter 3
100
3.4.2. Growth assessment and cell counts
The growth was assessed by optical density at 600 nm and by microscopy using
DAPI and PNA FISH. In order to estimate the total cell counts, DAPI, a fluorescent dye that
binds strongly to DNA with a binding preference for A-T rich regions, was used. It passes
through an intact cell membrane, stains both live and dead cells, being suitable to
determine total cell counts44. PNA FISH has been largely applied to identify45–49 and also to
discriminate bacterial species50,51. A specific method based on a red fluorescent PNA FISH
probe (Hpy769), developed by Guimarães et al. (2007) for the detection of H. pylori was
applied in order to evaluate the stable rRNA (for a method review see Cerqueira et
al.(2008) 52). The cells are stained red due to the Alexa fluor 546 fluorochrome used in the
H. pylori probe referred above42.
Comparing the methods used in terms of fluorescence for cells in the exponential
phase of growth, cells stained with PNA FISH showed a brighter and more stable signal
than cells stained with DAPI. In Figure 3.2, epifluorescence microscope images of H. pylori
26695 growing in semi-defined liquid medium are shown. It is clearly visible that at 0
hours of culture the cells present a higher fluorescence signal intensity with more defined
contours, with both methods (Figure 3.2 A and C). This high fluorescence intensity
observed is due to the high rRNA content in cells and the presence of intact DNA in
growing cells, for the Hpy probe and DAPI staining application, respectively. In general, a
decrease in the fluorescent signal for both fluorochromes (DAPI and Alexa fluor 546) and
an increase in cell clusters were observed with time. In fact, cells were impossible to count
at 60 and 72 hours of culture due to large aggregates of coccoid cells even after
performing the disaggregation procedure. The referred fluorescent signal reduction and the
increase of cell clusters are noticeably visible in Figure 3.2 (B and D) for cells at 36 hours
of culture, which start undergoing morphological conversion.
Figure 3.3 shows the results for cell counts using DAPI and PNA FISH (until 48
hours of culture) and culturable cells and optical density (up to 72 hours of culture). In
general, the Hpy 769 probe yielded the lesser cell counts and the DAPI stain the higher
cell counts, with significant differences in counts at 4 and 12 hours of culture (p<0.05; T-
test, equal variances). In order to evaluate the differences between methods, ratios
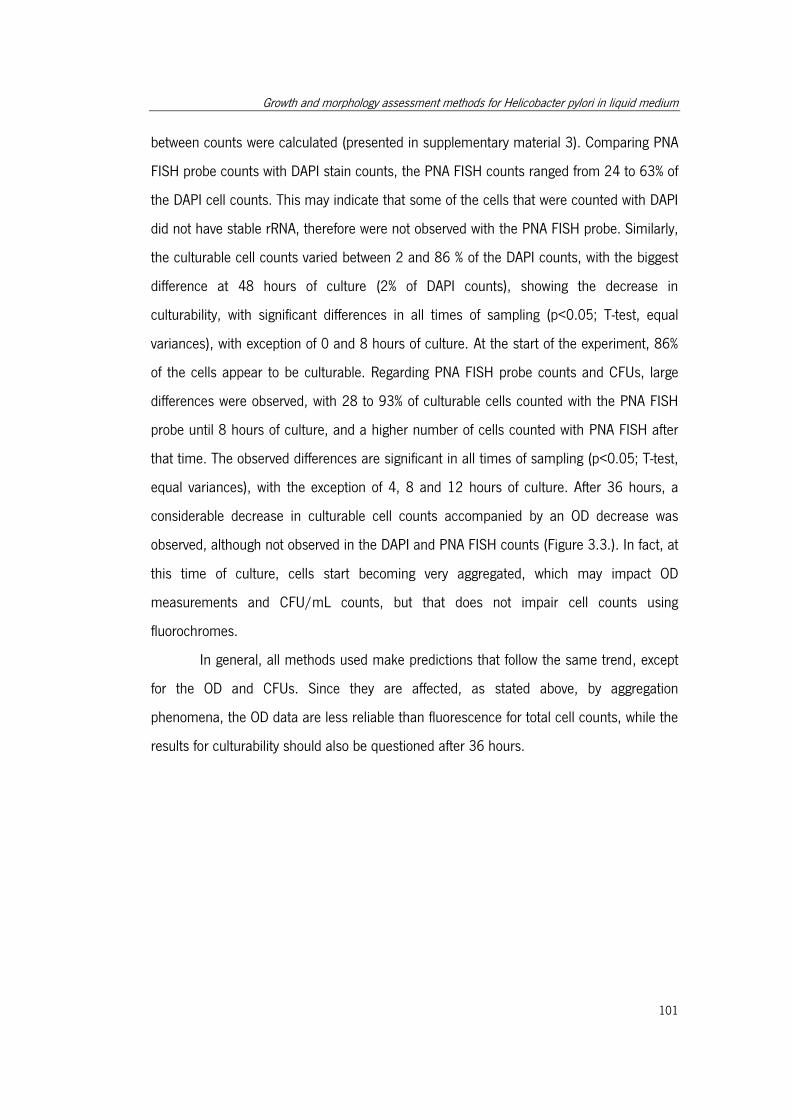
Growth and morphology assessment methods for Helicobacter pylori in liquid medium
101
between counts were calculated (presented in supplementary material 3). Comparing PNA
FISH probe counts with DAPI stain counts, the PNA FISH counts ranged from 24 to 63% of
the DAPI cell counts. This may indicate that some of the cells that were counted with DAPI
did not have stable rRNA, therefore were not observed with the PNA FISH probe. Similarly,
the culturable cell counts varied between 2 and 86 % of the DAPI counts, with the biggest
difference at 48 hours of culture (2% of DAPI counts), showing the decrease in
culturability, with significant differences in all times of sampling (p<0.05; T-test, equal
variances), with exception of 0 and 8 hours of culture. At the start of the experiment, 86%
of the cells appear to be culturable. Regarding PNA FISH probe counts and CFUs, large
differences were observed, with 28 to 93% of culturable cells counted with the PNA FISH
probe until 8 hours of culture, and a higher number of cells counted with PNA FISH after
that time. The observed differences are significant in all times of sampling (p<0.05; T-test,
equal variances), with the exception of 4, 8 and 12 hours of culture. After 36 hours, a
considerable decrease in culturable cell counts accompanied by an OD decrease was
observed, although not observed in the DAPI and PNA FISH counts (Figure 3.3.). In fact, at
this time of culture, cells start becoming very aggregated, which may impact OD
measurements and CFU/mL counts, but that does not impair cell counts using
fluorochromes.
In general, all methods used make predictions that follow the same trend, except
for the OD and CFUs. Since they are affected, as stated above, by aggregation
phenomena, the OD data are less reliable than fluorescence for total cell counts, while the
results for culturability should also be questioned after 36 hours.
Chapter 3
102
Figure 3.2. Epifluorescence microscope images of H. pylori 26695 in liquid culture after cell
disaggregation. DAPI staining, 0 hours of culture (A); DAPI staining, 36 hours of culture (B); PNA FISH probe
(Hpy469), 0 hours of culture (C); PNA FISH probe, 36 hours of culture (D). Magnification: 1000x.
10 µmA B
C D
A
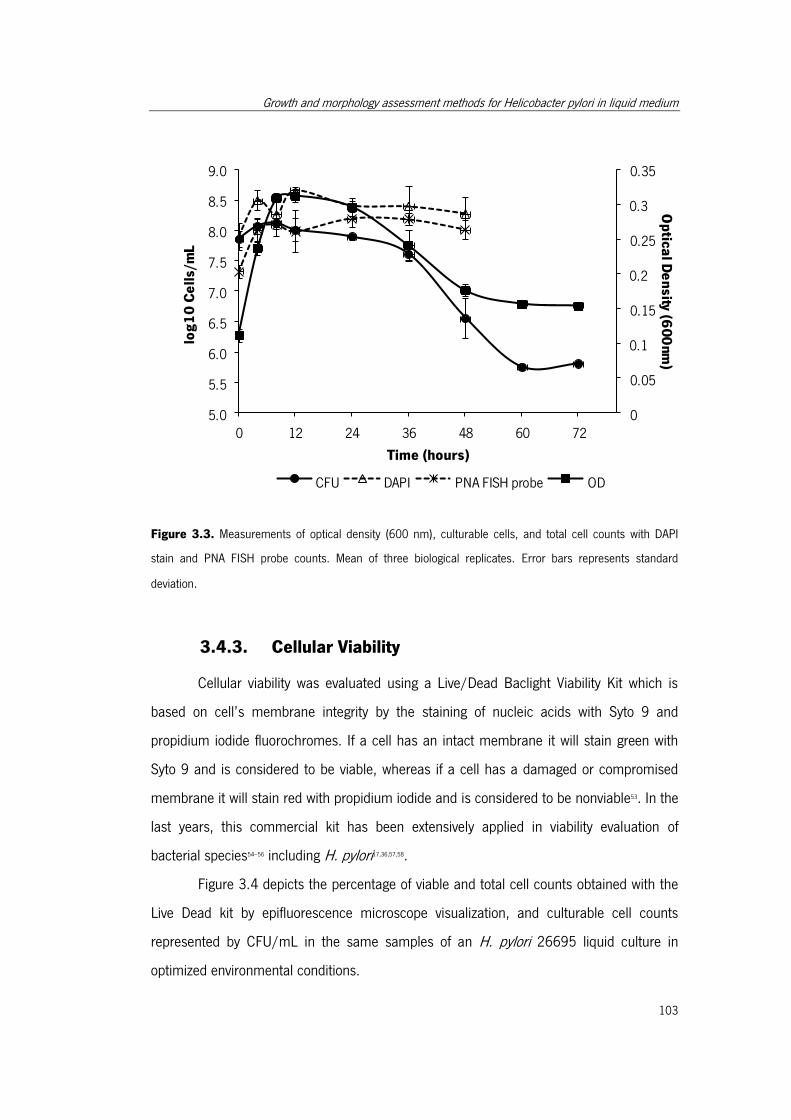
Growth and morphology assessment methods for Helicobacter pylori in liquid medium
103
0
0.05
0.1
0.15
0.2
0.25
0.3
0.35
5.0
5.5
6.0
6.5
7.0
7.5
8.0
8.5
9.0
0 12 24 36 48 60 72
Op
tical D
en
sity (60
0nm
)
log
10
Ce
lls/
mL
Time (hours)
CFU DAPI PNA FISH probe OD
Figure 3.3. Measurements of optical density (600 nm), culturable cells, and total cell counts with DAPI
stain and PNA FISH probe counts. Mean of three biological replicates. Error bars represents standard
deviation.
3.4.3. Cellular Viability
Cellular viability was evaluated using a Live/Dead Baclight Viability Kit which is
based on cell’s membrane integrity by the staining of nucleic acids with Syto 9 and
propidium iodide fluorochromes. If a cell has an intact membrane it will stain green with
Syto 9 and is considered to be viable, whereas if a cell has a damaged or compromised
membrane it will stain red with propidium iodide and is considered to be nonviable53. In the
last years, this commercial kit has been extensively applied in viability evaluation of
bacterial species54–56 including H. pylori17,36,57,58.
Figure 3.4 depicts the percentage of viable and total cell counts obtained with the
Live Dead kit by epifluorescence microscope visualization, and culturable cell counts
represented by CFU/mL in the same samples of an H. pylori 26695 liquid culture in
optimized environmental conditions.
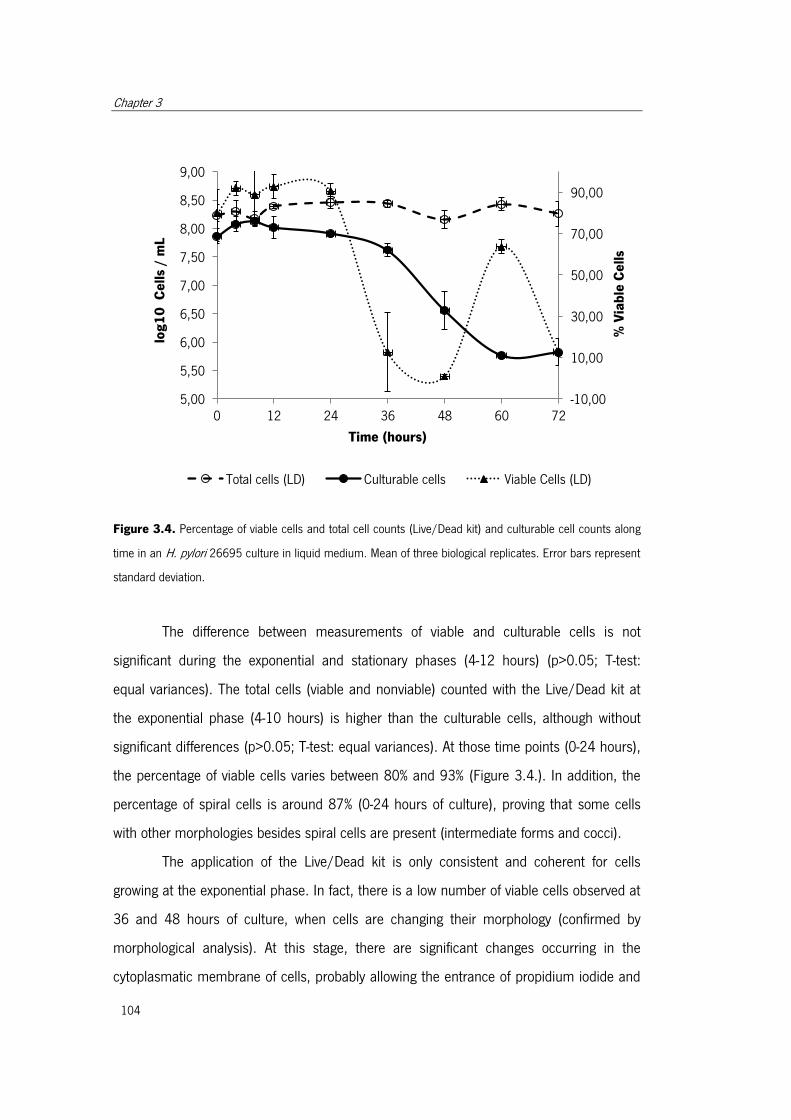
Chapter 3
104
Figure 3.4. Percentage of viable cells and total cell counts (Live/Dead kit) and culturable cell counts along
time in an H. pylori 26695 culture in liquid medium. Mean of three biological replicates. Error bars represent
standard deviation.
The difference between measurements of viable and culturable cells is not
significant during the exponential and stationary phases (4-12 hours) (p>0.05; T-test:
equal variances). The total cells (viable and nonviable) counted with the Live/Dead kit at
the exponential phase (4-10 hours) is higher than the culturable cells, although without
significant differences (p>0.05; T-test: equal variances). At those time points (0-24 hours),
the percentage of viable cells varies between 80% and 93% (Figure 3.4.). In addition, the
percentage of spiral cells is around 87% (0-24 hours of culture), proving that some cells
with other morphologies besides spiral cells are present (intermediate forms and cocci).
The application of the Live/Dead kit is only consistent and coherent for cells
growing at the exponential phase. In fact, there is a low number of viable cells observed at
36 and 48 hours of culture, when cells are changing their morphology (confirmed by
morphological analysis). At this stage, there are significant changes occurring in the
cytoplasmatic membrane of cells, probably allowing the entrance of propidium iodide and
-10,00
10,00
30,00
50,00
70,00
90,00
5,00
5,50
6,00
6,50
7,00
7,50
8,00
8,50
9,00
0 12 24 36 48 60 72
% V
iab
le C
ell
s
log
10
C
ell
s /
mL
Time (hours)
Total cells (LD) Culturable cells Viable Cells (LD)
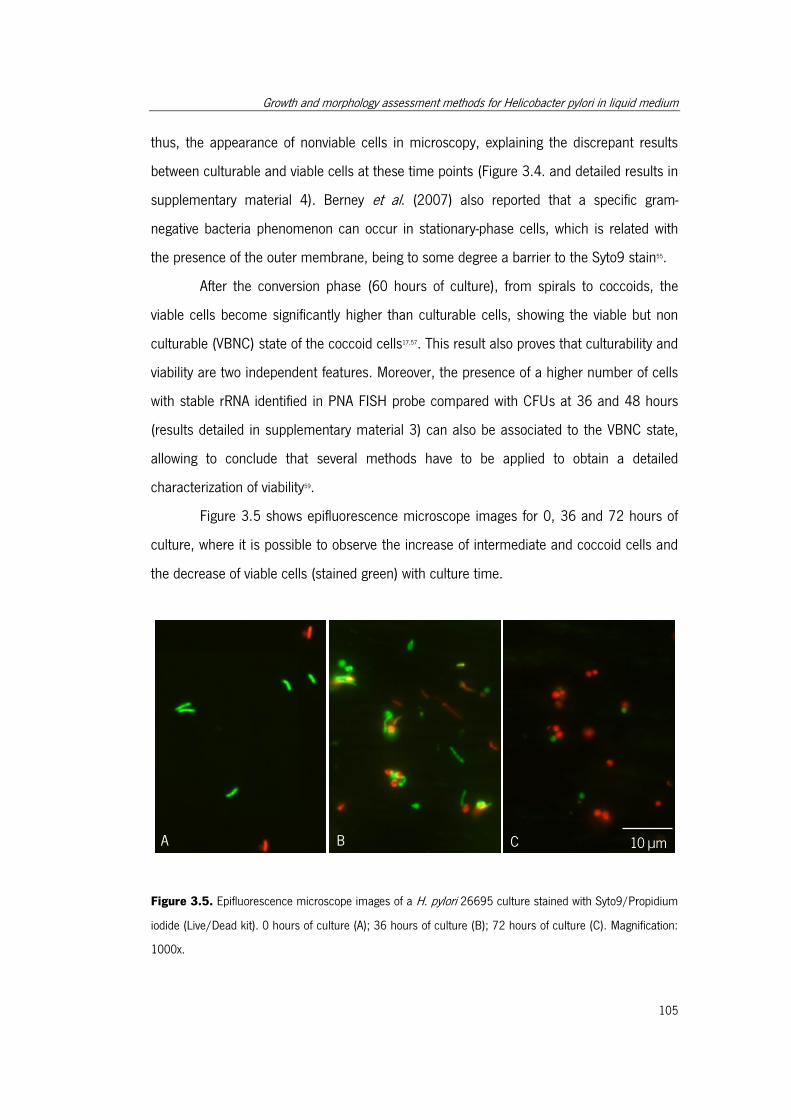
Growth and morphology assessment methods for Helicobacter pylori in liquid medium
105
thus, the appearance of nonviable cells in microscopy, explaining the discrepant results
between culturable and viable cells at these time points (Figure 3.4. and detailed results in
supplementary material 4). Berney et al. (2007) also reported that a specific gram-
negative bacteria phenomenon can occur in stationary-phase cells, which is related with
the presence of the outer membrane, being to some degree a barrier to the Syto9 stain55.
After the conversion phase (60 hours of culture), from spirals to coccoids, the
viable cells become significantly higher than culturable cells, showing the viable but non
culturable (VBNC) state of the coccoid cells17,57. This result also proves that culturability and
viability are two independent features. Moreover, the presence of a higher number of cells
with stable rRNA identified in PNA FISH probe compared with CFUs at 36 and 48 hours
(results detailed in supplementary material 3) can also be associated to the VBNC state,
allowing to conclude that several methods have to be applied to obtain a detailed
characterization of viability59.
Figure 3.5 shows epifluorescence microscope images for 0, 36 and 72 hours of
culture, where it is possible to observe the increase of intermediate and coccoid cells and
the decrease of viable cells (stained green) with culture time.
Figure 3.5. Epifluorescence microscope images of a H. pylori 26695 culture stained with Syto9/Propidium
iodide (Live/Dead kit). 0 hours of culture (A); 36 hours of culture (B); 72 hours of culture (C). Magnification:
1000x.
10 µmA B C
Chapter 3
106
3.4.4. Cellular Morphology
Cell morphology can be observed using different fluorochromes, such as
Syto9/Propidium iodide36,57, Acridine orange or DAPI44. In agreement with Guimarães et al.
(2007) the Hpy769 probe was able to detect not only spiral cells but also cells with
intermediate shapes (U, C and doughnut) and coccoid morphology, which have a low
number of rRNA copies per cell42. In the present study, cell morphology was evaluated
using DAPI, Syto 9/Propidium iodide and the Hpy 769 probe (PNA FISH probe) (Figure
3.6). The standard deviation among the methods applied is presented in supplementary
material 5 (Table 3.5 and Table 3.6) with the higher standard deviation at 48 hours of
culture, due to large differences observed between the Live/Dead kit and the other
methods applied. Even after applying the cell-to-cell disaggregation method, DAPI and PNA
FISH were not suitable to analyze cell morphology after cell conversion to the coccoid
shape, due to the formation of cell clusters, which were higher in number and size (Figure
3.6). Curiously, the application of Syto 9/Propidium iodide dyes allowed observing and
counting cells with different morphologies during the entire experiment, including coccoid
shape samples, which had smaller cell clusters with these stains.
As shown in Figure 3.6, the percentage of spiral cells decreases during the time of
experiment, with cells remaining mainly in the spiral shape until 48 hours of culture
(although showing a decrease, especially after the exponential phase - 24 hours). Until 24
hours of culture, no significant difference in the percentage of spiral cells was observed
(p=0.66; one-way ANOVA test). However, there was a significant difference between the
methods performed to estimate the percentage of spiral cells (p<0.05; one-way ANOVA
test) (detailed results in supplementary material 5, Table 3.5). In general, the percentage
of spiral cells observed with the Hpy 759 probe until 24 hours is higher than the
percentage of spiral cells counted with the other methods (supplementary material 5,
Table 3.6). As discussed above, after 48 hours of culture, it was only possible to observe
cell morphology using Syto 9/Propidium iodide stains and a huge decrease in the number
of spiral cells was observed with around 7% of spiral cells at 72 hours of culture.
In general, a slight decrease in the coccoid cells was observed in the exponential
phase (until 12 hours), and a subsequent increase was observed, with mostly coccoid cells
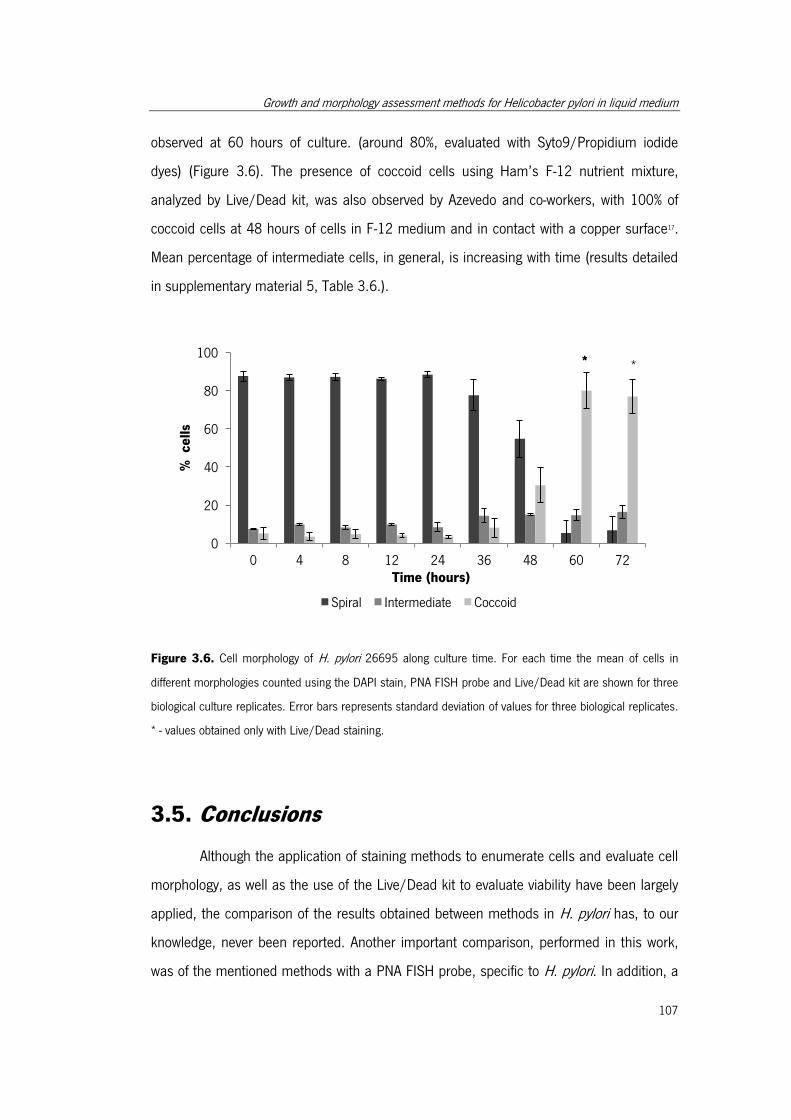
Growth and morphology assessment methods for Helicobacter pylori in liquid medium
107
observed at 60 hours of culture. (around 80%, evaluated with Syto9/Propidium iodide
dyes) (Figure 3.6). The presence of coccoid cells using Ham’s F-12 nutrient mixture,
analyzed by Live/Dead kit, was also observed by Azevedo and co-workers, with 100% of
coccoid cells at 48 hours of cells in F-12 medium and in contact with a copper surface17.
Mean percentage of intermediate cells, in general, is increasing with time (results detailed
in supplementary material 5, Table 3.6.).
Figure 3.6. Cell morphology of H. pylori 26695 along culture time. For each time the mean of cells in
different morphologies counted using the DAPI stain, PNA FISH probe and Live/Dead kit are shown for three
biological culture replicates. Error bars represents standard deviation of values for three biological replicates.
* - values obtained only with Live/Dead staining.
3.5. Conclusions
Although the application of staining methods to enumerate cells and evaluate cell
morphology, as well as the use of the Live/Dead kit to evaluate viability have been largely
applied, the comparison of the results obtained between methods in H. pylori has, to our
knowledge, never been reported. Another important comparison, performed in this work,
was of the mentioned methods with a PNA FISH probe, specific to H. pylori. In addition, a
0
20
40
60
80
100
0 4 8 12 24 36 48 60 72
% c
ells
Time (hours)
Spiral Intermediate Coccoid
* *
Chapter 3
108
cell-to-cell disaggregation method was applied, allowing improvements in the counting of
cells using “conventional” methods.
In general, differences between methods used to enumerate cells were observed,
with DAPI yielding the higher number of total cell counts when compared with the PNA
FISH probe applied. Culturable cell counts were in general less than total cell counts
performed with DAPI, especially after the exponential phase, showing the presence of
nonculturable cells. The viable but non-culturable state was observed after 60 hours of
culture. The number of culturable cells was, in general, similar to the viable cells during
the exponential phase. The evaluation of cell viability using Syto9/propidium iodide was
not effective to analyze cell morphological changes, giving exaggerated numbers of
nonviable cells, explained by the entrance of propidium iodide through the permeable
cytoplasmatic membrane. Under the referred conditions, another method to estimate cell
viability must be used, such as measurement of membrane potential59. The culturable cell
counts at 60 and 72 hours of culture were higher compared with the spiral cells observed
at these time points, thus, proving the presence of culturable coccoid cells, previously
shown by other authors9,10,57, however under controversy. After 60 hours of culture, mainly
coccoid cells were observed. Taking into account that coccoid forms represent a cell
adaptation to less favorable conditions17, the present results suggests that some stressing
factor is present that causes morphological changes, probably the unavailability of an
essential nutrient. The presence of an increasing number and size of cell clusters also
support this hypothesis.
Growth and morphology assessment methods for Helicobacter pylori in liquid medium
109
3.6. References
1. Catrenich, C. & Makin, K. Characterization of the morphologic conversion of Helicobacter
pylori from bacillary to coccoid forms . Scand. J. Gastroenterol. 181, 58–64 (1991).
2. Mizoguchi, H. et al. Diversity in protein synthesis and viability of Helicobacter pylori coccoid
forms in response to various stimuli. Infect. Immun. 66, 5555–5560 (1998).
3. Cellini, L., Allocati, N., Emanuela, D. C. & Dainelli, B. Helicobacter pylori: a fickle germ.
Microb. Immunol. 38, 25–30 (1994).
4. Shahamat, M., Mai, U., Paszko-Kolva, C., Kessel, M. & Colwell, R. R. Helicobacter pylori in
water. Use of autoradiography to assess viability of Helicobacter pylori in water. Appl.
Environ. Microbiol. 59, 1231–1235 (1993).
5. West, A. P., Millar, M. R. & Tompkins, D. S. Effect of physical environment on survival of
Helicobacter pylori. J. Clin. Pathol. 45, 228–31 (1992).
6. Sorberg, M., Nilsson, M., Handerger, H. & Nilsson, L. Morphologic conversion of
Helicobacter pylori from bacillary to coccoid form. Eur. J. Clin. Microbiol. Infect. Dis. 15,
216–219 (1996).
7. Bode, G., Mauch, F. & Malfertheiner, P. The coccoid forms of Helicobacter pylori. Criteria
for their viability. Epidemiol. Infect. 111, 483–490 (1993).
8. Berry, V., Jennings, K. & Woodnutt, G. Bactericidal and morphological effects of amoxicillin
on Helicobacter pylori. Antimicrob. Agents Chemother. 39, 1859–1861 (1995).
9. Saito, N. et al. Plural transformation-processes from spiral to coccoid Helicobacter pylori
and its viability. J. Infect. 46, 49–55 (2003).
10. Sato, F. et al. Ultrastructural observation of Helicobacter pylori in glucose-supplemented
culture media. J. Med. Microbiol. 52, 675–679 (2003).

Chapter 3
110
11. Eaton, K. A., Catrenich, C. E., Makin, K. M. & Krakowka, S. Virulence of coccoid and
bacillary forms of Helicobacter pylori in gnotobiotic piglets. J. Infect. Dis. 171, 459–462
(1995).
12. Kusters, J. G., Gerrits, M. M., Van Strijp, J. A. G. & Vandenbroucke-Grauls, C. M. J. E.
Coccoid forms of Helicobacter pylori are the morphologic manifestation of cell death.
Infect. Immun. 65, 3672–3679 (1997).
13. Brenciaglia, M. I., Fornara, A. M., Scaltrito, M. M. & Dubini, F. Helicobacter pylori:
cultivability and antibiotic susceptibility of coccoid forms. Int. J. Antimicrob. Agents 13,
237–241 (2000).
14. Oliver, J. D. The viable but nonculturable state in bacteria. J. Microbiol. 43, 93–100
(2005).
15. Oliver, J. D. Recent findings on the viable but nonculturable state in pathogenic bacteria.
FEMS Microbiol. Rev. 34, 415–425 (2010).
16. Nilsson, H., Blom, J., Al-soud, W. A., Andersen, L. P. & Wadström, T. Effect of cold
starvation, acid stress, and nutrients on metabolic activity of Helicobacter pylori. Appl.
Environ. Microbiol. 68, 11–19 (2002).
17. Azevedo, N. F. et al. Coccoid form of Helicobacter pylori as a morphological manifestation
of cell adaptation to the environment. Appl. Environ. Microbiol. 73, 3423–3427 (2007).
18. Cellini, L. et al. Coccoid Helicobacter pylori not culturable in vitro reverts in mice. Microb.
Immunol. 38, 843–850 (1994).
19. She, F.-F., Lin, J.-Y., Liu, J.-Y., Huang, C. & Su, D.-H. Virulence of water-induced coccoid
Helicobacter pylori and its experimental infection in mice. World J. Gastroenterol. 9, 516–
520 (2003).
20. Sisto, F., Brenciaglia, M. I., Scaltrito, M. M. & Dubini, F. Helicobacter pylori: ureA, cagA
and vacA expression during conversion to the coccoid form. Int. J. Antimicrob. Agents 15,
277–82 (2000).
Growth and morphology assessment methods for Helicobacter pylori in liquid medium
111
21. Can, F. et al. Urease activity and urea gene sequencing of coccoid forms of H. pylori
induced by different factors. Curr. Microbiol. 56, 150–155 (2008).
22. Poursina, F. et al. Assessment of cagE and babA mRNA expression during morphological
conversion of Helicobacter pylori from spiral to coccoid. Curr. Microbiol. 66, 406–13
(2013).
23. Saito, N. et al. Coccoid Helicobacter pylori can directly adhere and invade in agminated
formation to human gastric epithelial cells. Adv. Microbiol. 2, 112–116 (2012).
24. Benaissa, M. et al. Changes in Helicobacter pylori ultrastructure and antigens during
conversion from the bacillary to the coccoid form. Infect. Immun. 64, 2331–23355
(1996).
25. Cabeen, M. T. & Jacobs-Wagner, C. Bacterial cell shape. Nat. Rev. Microbiol. 3, 601–610
(2005).
26. Sycuro, L. K. et al. Relaxation of peptidoglycan cross-linking promotes Helicobacter pylori’s
helical shape and stomach colonization. Cell 141, 822–833 (2010).
27. Sycuro, L. K. et al. Multiple peptidoglycan modification networks modulate Helicobacter
pylori’s cell shape, motility, and colonization potential. PLoS Pathog. 8, e1002603 (2012).
28. Costa, K. et al. The morphological transition of Helicobacter pylori cells from spiral to
coccoid is preceded by a substantial modification of the cell wall. J. Bacteriol. 181, 3710–
3715 (1999).
29. Takeuchi, H., Shirai, M., Akada, J. K., Tsuda, M. & Nakazawa, T. Nucleotide sequence and
characterization of cdrA, a cell division-related gene of Helicobacter pylori . J. Bacteriol.
180, 5263–5268 (1998).
30. Chaput, C. et al. Role of AmiA in the morphological transition of Helicobacter pylori and in
immune escape. PLoS Pathog. 2, e97 (2006).
31. Waidner, B. et al. A novel system of cytoskeletal elements in the human pathogen
Helicobacter pylori. PLoS Pathog. 5, e1000669 (2009).
Chapter 3
112
32. Chiou, P.-Y., Luo, C.-H., Chang, K.-C. & Lin, N.-T. Maintenance of the cell morphology by
MinC in Helicobacter pylori. PLoS One 8, e71208 (2013).
33. Cellini, L. et al. Recovery of Helicobacter pylori ATCC43504 from a viable but not
culturable state: regrowth or resuscitation? APMIS 106, 571–579 (1998).
34. Donelli, G. et al. The effect of oxygen on the growth and cell morphology of Helicobacter
pylori. FEMS Microbiol. Lett. 168, 9–15 (1998).
35. Williams, J. C., McInnis, K. a & Testerman, T. L. Adherence of Helicobacter pylori to abiotic
surfaces is influenced by serum. Appl. Environ. Microbiol. 74, 1255–1258 (2008).
36. Azevedo, N. F., Pacheco, a P., Keevil, C. W. & Vieira, M. J. Adhesion of water Helicobacter
pylori to abiotic surfaces. J. Appl. Microbiol. 101, 718–724 (2006).
37. Monier, J. & Lindow, S. E. Frequency, size, and localization of bacterial aggregates on bean
leaf surfaces. Appl. Environ. Microbiol. 70, 346–355 (2004).
38. Klebensberger, J., Lautenschlager, K., Bressler, D., Wingender, J. & Philipp, B. Detergent-
induced cell aggregation in subpopulations of Pseudomonas aeruginosa as a preadaptive
survival strategy. Environ. Microbiol. 9, 2247–2259 (2007).
39. Maisonneuve, E., Fraysse, L., Moinier, D. & Dukan, S. Existence of abnormal protein
aggregates in healthy Escherichia coli cells. J. Bacteriol. 190, 887–893 (2008).
40. Bessa, L. J., Correia, D. M., Cellini, L., Azevedo, N. F. & Rocha, I. Optimization of culture
conditions to improve Helicobacter pylori growth in Ham’s F-12 medium by response
surface methodology. Int. J. Immunopathol. Pharmacol. 25, 901–909 (2012).
41. Testerman, T. L., Gee, D. J. M. C. & Mobley, H. L. T. Helicobacter pylori growth and urease
detection in the chemically defined medium Ham’s F-12 nutrient mixture. J. Clin.
Microbiol. 39, 3842–3850 (2001).
42. Guimarães, N., Azevedo, N. F., Figueiredo, C., Keevil, C. W. & Vieira, M. J. Development
and application of a novel peptide nucleic acid probe for the specific detection of
Growth and morphology assessment methods for Helicobacter pylori in liquid medium
113
Helicobacter pylori in gastric biopsy specimens. J. Clin. Microbiol. 45, 3089–3094
(2007).
43. Cole, S. P., Cirillo, D., Kagnoff, M. F. & Guiney, D. G. Coccoid and spiral Helicobacter pylori
differ in their abilities to adhere to gastric epithelial cells and induce interleukin-8 secretion.
Microbiology 65, 843–846 (1997).
44. Kepner, R. L. & Pratt, J. R. Use of fluorochromes for direct enumeration of total bacteria in
environmental samples: Past and present. Microbiol. Mol. Biol. Rev. 58, 603–615 (1994).
45. Almeida, C. et al. Development and application of a novel peptide nucleic acid probe for
the specific detection of Cronobacter genomospecies (Enterobacter sakazakii) in powdered
infant formula. Appl. Environ. Microbiol. 75, 2925–2930 (2009).
46. Almeida, C., Azevedo, N. F., Fernandes, R. M., Keevil, C. W. & Vieira, M. J. Fluorescence in
situ hybridization method using a peptide nucleic acid probe for identification of Salmonella
spp. in a broad spectrum of samples. Appl. Environ. Microbiol. 76, 4476–4485 (2010).
47. Almeida, C. et al. Rapid detection of urinary tract infections caused by Proteus spp. using
PNA-FISH. Eur. J. Clin. Microbiol. Infect. Dis. 32, 781–786 (2013).
48. Azevedo, N. F. et al. Application of flow cytometry for the identification of Staphylococcus
epidermidis by peptide nucleic acid fluorescence in situ hybridization (PNA FISH) in blood
samples. Antonie Van Leeuwenhoek 100, 463–470 (2011).
49. Machado, A. et al. Fluorescence in situ hybridization method using a peptide nucleic acid
probe for identification of Lactobacillus spp. in milk samples. Int. J. Food Microbiol. 162,
64–70 (2013).
50. Almeida, C., Azevedo, N. F., Santos, S., Keevil, C. W. & Vieira, M. J. Discriminating multi-
species populations in biofilms with peptide nucleic acid fluorescence in situ hybridization
(PNA FISH). PLoS One 6, e14786 (2011).
Chapter 3
114
51. Machado, A. et al. Fluorescence in situ hybridization method using peptide nucleic acid
probes for rapid detection of Lactobacillus and Gardnerella spp . BMC Microbiol. 13, 1–12
(2013).
52. Cerqueira, L. et al. DNA mimics for the rapid identification of microorganisms by
fluorescence in situ hybridization (FISH). Int. J. Mol. Sci. 9, 1944–1960 (2008).
53. LIVE / DEAD ® BacLight ™ Bacterial Viability Kits Technical Sheet. Mol. Probes , Invit.
Detect. Technol. MP 07007, (2004).
54. Alonso, J. L., Mascellaro, S., Moreno, Y., Ferru, M. A. & Hernández, J. Double-staining
method for differentiation of morphological changes and membrane integrity of
Campylobacter coli cells. Appl. Environ. Microbiol. 68, 5151–5154 (2002).
55. Berney, M., Hammes, F., Bosshard, F., Weilenmann, H.-U. & Egli, T. Assessment and
interpretation of bacterial viability by using the LIVE/DEAD BacLight Kit in combination with
flow cytometry. Appl. Environ. Microbiol. 73, 3283–3290 (2007).
56. Boulos, L., Prévost, M., Barbeau, B., Coallier, J. & Desjardins, R. Methods LIVE / DEAD ®
Bac Light TM: application of a new rapid staining method for direct enumeration of viable
and total bacteria in drinking water. J. Microbiol. Methods 37, 77–86 (1999).
57. Adams, B. L., Bates, T. C. & Oliver, J. D. Survival of Helicobacter pylori in a Natural
Freshwater Environment. Appl. Environ. Microbiol. 69, 7462–7466 (2003).
58. Queralt, N. & Araujo, R. Analysis of the survival of H. pylori within a laboratory-based
aquatic model system using molecular and classical techniques. Microb. Ecol. 54, 771–
777 (2007).
59. Keer, J. T. & Birch, L. Molecular methods for the assessment of bacterial viability. J.
Microbiol. Methods 53, 175–183 (2003).
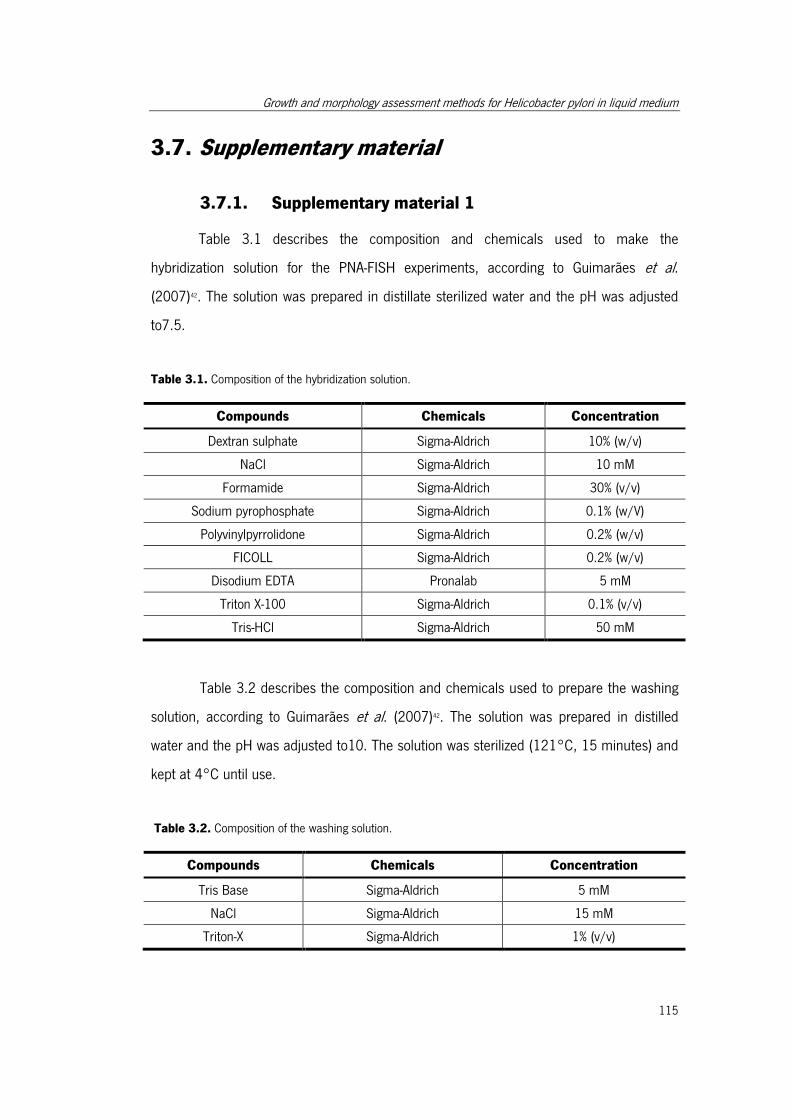
Growth and morphology assessment methods for Helicobacter pylori in liquid medium
115
3.7. Supplementary material
3.7.1. Supplementary material 1
Table 3.1 describes the composition and chemicals used to make the
hybridization solution for the PNA-FISH experiments, according to Guimarães et al.
(2007)42. The solution was prepared in distillate sterilized water and the pH was adjusted
to7.5.
Table 3.1. Composition of the hybridization solution.
Compounds Chemicals Concentration
Dextran sulphate Sigma-Aldrich 10% (w/v)
NaCl Sigma-Aldrich 10 mM
Formamide Sigma-Aldrich 30% (v/v)
Sodium pyrophosphate Sigma-Aldrich 0.1% (w/V)
Polyvinylpyrrolidone Sigma-Aldrich 0.2% (w/v)
FICOLL Sigma-Aldrich 0.2% (w/v)
Disodium EDTA Pronalab 5 mM
Triton X-100 Sigma-Aldrich 0.1% (v/v)
Tris-HCl Sigma-Aldrich 50 mM
Table 3.2 describes the composition and chemicals used to prepare the washing
solution, according to Guimarães et al. (2007)42. The solution was prepared in distilled
water and the pH was adjusted to10. The solution was sterilized (121°C, 15 minutes) and
kept at 4°C until use.
Table 3.2. Composition of the washing solution.
Compounds Chemicals Concentration
Tris Base Sigma-Aldrich 5 mM
NaCl Sigma-Aldrich 15 mM
Triton-X Sigma-Aldrich 1% (v/v)
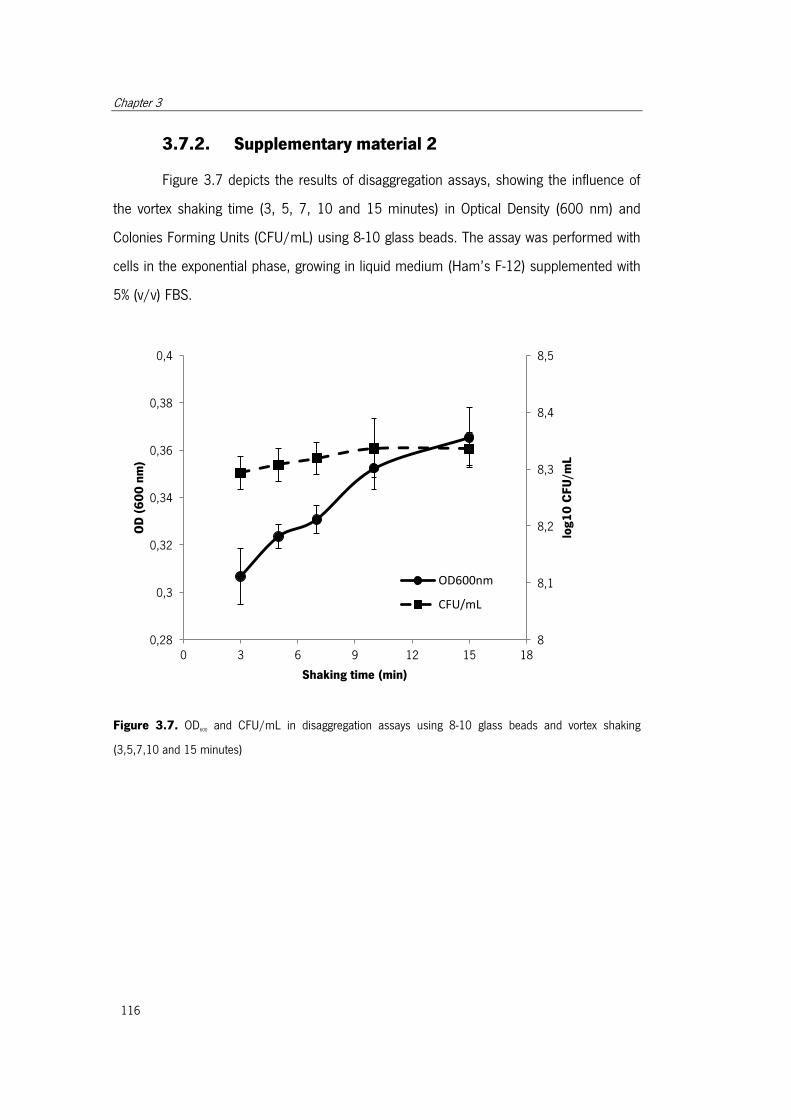
Chapter 3
116
3.7.2. Supplementary material 2
Figure 3.7 depicts the results of disaggregation assays, showing the influence of
the vortex shaking time (3, 5, 7, 10 and 15 minutes) in Optical Density (600 nm) and
Colonies Forming Units (CFU/mL) using 8-10 glass beads. The assay was performed with
cells in the exponential phase, growing in liquid medium (Ham’s F-12) supplemented with
5% (v/v) FBS.
Figure 3.7. OD600 and CFU/mL in disaggregation assays using 8-10 glass beads and vortex shaking
(3,5,7,10 and 15 minutes)
8
8,1
8,2
8,3
8,4
8,5
0,28
0,3
0,32
0,34
0,36
0,38
0,4
0 3 6 9 12 15 18
log
10
CF
U/m
L
OD
(6
00
nm
)
Shaking time (min)
OD600nm
CFU/mL
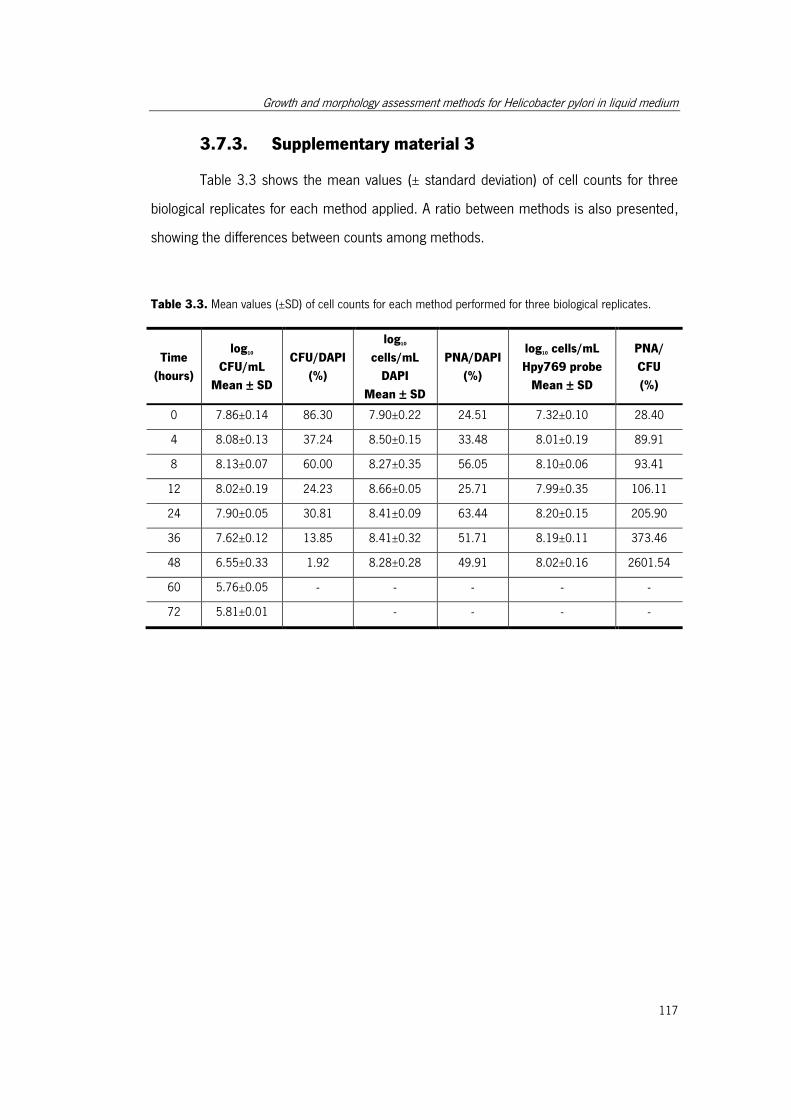
Growth and morphology assessment methods for Helicobacter pylori in liquid medium
117
3.7.3. Supplementary material 3
Table 3.3 shows the mean values (± standard deviation) of cell counts for three
biological replicates for each method applied. A ratio between methods is also presented,
showing the differences between counts among methods.
Table 3.3. Mean values (±SD) of cell counts for each method performed for three biological replicates.
Time
(hours)
log10
CFU/mL
Mean ± SD
CFU/DAPI
(%)
log10
cells/mL
DAPI
Mean ± SD
PNA/DAPI
(%)
log10 cells/mL
Hpy769 probe
Mean ± SD
PNA/
CFU
(%)
0 7.86±0.14 86.30 7.90±0.22 24.51 7.32±0.10 28.40
4 8.08±0.13 37.24 8.50±0.15 33.48 8.01±0.19 89.91
8 8.13±0.07 60.00 8.27±0.35 56.05 8.10±0.06 93.41
12 8.02±0.19 24.23 8.66±0.05 25.71 7.99±0.35 106.11
24 7.90±0.05 30.81 8.41±0.09 63.44 8.20±0.15 205.90
36 7.62±0.12 13.85 8.41±0.32 51.71 8.19±0.11 373.46
48 6.55±0.33 1.92 8.28±0.28 49.91 8.02±0.16 2601.54
60 5.76±0.05 - - - - -
72 5.81±0.01 - - - -

Chapter 3
118
3.7.4. Supplementary material 4
Table 3.4 depicts the percentage and log10 of viable cell counts obtained using
Syto9/propidium iodide stains contained in the Live/Dead kit. The values presented are
the mean of three biological replicates (± standard deviation).
Table 3.4. Total and viable cell counts using the Live/dead kit performed for three biological replicates.
Mean ± Standard deviation.
Time (hours)
Total Cells Viable Cells
log10 cells
Mean ± SD
log10cells
Mean ± SD
% cells
Mean ± SD
0 8.23±0.46 8.13±0.46 79.89±4.18
4 8.29±0.19 8.26±0.19 91.95±3.49
8 8.18±0.13 8.12±0.20 88.79±15.25
12 8.39±0.03 8.36±0.02 92.66±5.81
24 8.45±0.10 8.41±0.09 90.57±3.50
36 8.43±0.06 7.05±0.85 12.61±19.06
48 8.15±0.16 4.16±3.61 0.77±0.86
60 8.43±0.11 8.23±0.13 63.68±3.48
72 8.26±0.22 7.33±0.42 12.76±6.38
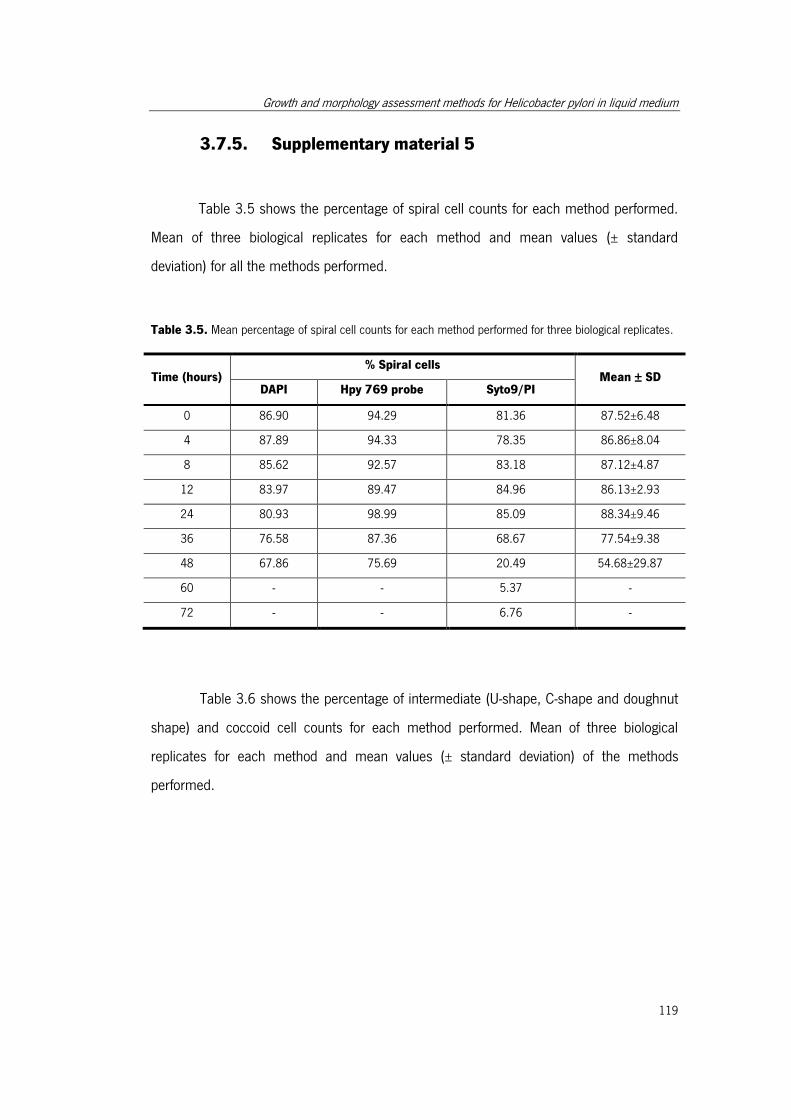
Growth and morphology assessment methods for Helicobacter pylori in liquid medium
119
3.7.5. Supplementary material 5
Table 3.5 shows the percentage of spiral cell counts for each method performed.
Mean of three biological replicates for each method and mean values (± standard
deviation) for all the methods performed.
Table 3.5. Mean percentage of spiral cell counts for each method performed for three biological replicates.
Time (hours) % Spiral cells
Mean ± SD DAPI Hpy 769 probe Syto9/PI
0 86.90 94.29 81.36 87.52±6.48
4 87.89 94.33 78.35 86.86±8.04
8 85.62 92.57 83.18 87.12±4.87
12 83.97 89.47 84.96 86.13±2.93
24 80.93 98.99 85.09 88.34±9.46
36 76.58 87.36 68.67 77.54±9.38
48 67.86 75.69 20.49 54.68±29.87
60 - - 5.37 -
72 - - 6.76 -
Table 3.6 shows the percentage of intermediate (U-shape, C-shape and doughnut
shape) and coccoid cell counts for each method performed. Mean of three biological
replicates for each method and mean values (± standard deviation) of the methods
performed.
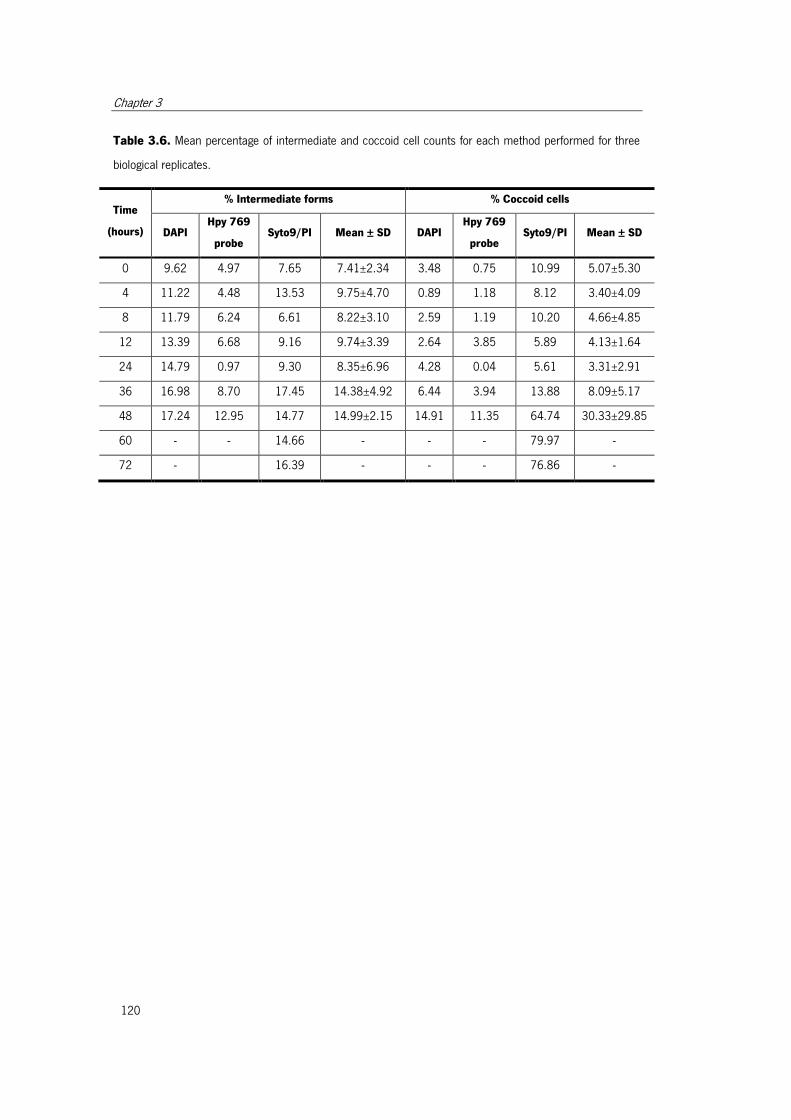
Chapter 3
120
Table 3.6. Mean percentage of intermediate and coccoid cell counts for each method performed for three
biological replicates.
Time
(hours)
% Intermediate forms % Coccoid cells
DAPI Hpy 769
probe Syto9/PI Mean ± SD DAPI
Hpy 769
probe Syto9/PI Mean ± SD
0 9.62 4.97 7.65 7.41±2.34 3.48 0.75 10.99 5.07±5.30
4 11.22 4.48 13.53 9.75±4.70 0.89 1.18 8.12 3.40±4.09
8 11.79 6.24 6.61 8.22±3.10 2.59 1.19 10.20 4.66±4.85
12 13.39 6.68 9.16 9.74±3.39 2.64 3.85 5.89 4.13±1.64
24 14.79 0.97 9.30 8.35±6.96 4.28 0.04 5.61 3.31±2.91
36 16.98 8.70 17.45 14.38±4.92 6.44 3.94 13.88 8.09±5.17
48 17.24 12.95 14.77 14.99±2.15 14.91 11.35 64.74 30.33±29.85
60 - - 14.66 - - - 79.97 -
72 - 16.39 - - - 76.86 -

Chapter 4
4. Exometabolome analysis in H. pylori for the
elucidation of nutritional requirements and
preferences: reconciliation of in silico and in vitro
metabolic capabilities
Daniela M. Correia, Ana Guimarães, Lucinda J. Bessa, Maria J. Vieira, Nuno F. Azevedo and Isabel Rocha.
Exometabolome analysis in H. pylori for the elucidation of nutritional requirements and
preferences: reconciliation of in silico and in vitro metabolic capabilities
(To be submitted).

Exometabolome analysis in H. pylori for the elucidation of nutritional requirements and preferences
123
4.1. Abstract
Helicobacter pylori is a human pathogen associated with gastric diseases.
Understanding the growth of pathogenic organisms inside the host is of major importance
to develop new and efficient drugs that can be used to treat and eradicate these microbes.
However, uncovering the mechanisms associated with H. pylori’s associated diseases has
been hindered by the difficulties found in growing this organism under defined conditions.
The present study was conducted with the goal of clarifying H. pylori’s nutritional
requirements, using a metabolic footprinting approach and bringing together in vitro and in
silico data. For that purpose, H. pylori 26695 was grown under controlled conditions,
without strain adaptation, in a defined medium supplemented with fetal bovine serum and
samples were collected to analyze extracellular metabolites using GC-MS after a chemical
derivatization.
Discrepancies among in vitro studies were found, as well as between in vitro and
in silico predictions, revealing the importance of data reconciliation. Under the conditions
used, some amino acids were identified as absolutely required for H. pylori 26695 growth:
L-arginine, L- histidine, L-isoleucine, L-leucine, L-methionine, L-phenylalanine and L-valine.
In addition, other amino acids were identified as possible preferential carbon sources,
namely, aspartate, glutamate, alanine and proline, although some doubts persist regarding
the need of proline and alanine in H. pylori. The clarification of H. pylori nutritional
requirements will allow not only to adjust the culture medium components and perform
experiments under more defined conditions, but especially to gain new insights about H.
pylori’s physiology and metabolism.
Keywords: Helicobacter pylori, exometabolome, nutritional requirements, in
silico, in vitro.
Chapter 4
124
4.2. Introduction
H. pylori is a microaerophilic, gram negative, fastidious organism, requiring 3-4
days of growth in complex solid media. Over the last 20 years, scientists have pursued the
development of defined liquid media for in vitro growth of H. pylori 1–4; however, the cell
densities obtained using these defined media are quite low, and the addition of
supplements5 (cyclodextrins, bovine serum albumin (BSA) or fetal bovine serum (FBS))
significantly improves growth, hence hampering the identification of nutritional
requirements. Moreover, growth in defined media has required previous strain adaptation
or has been mostly achieved with non-reference strains, as discussed in the state of the art
section. Also, despite several studies that tried to identify the nutritional requirements of
this pathogenic organism, there are discrepancies between published studies.
Additionally, relevant information is still missing in terms of metabolic capabilities,
and different published studies lead to different conclusions. It has been described that H.
pylori can metabolize glucose, although evidences suggest the operation of the pentose
phosphate and Entner Doudoroff pathways6,7 rather than glycolysis as the major routes for
catabolism. Nevertheless, most of the glycolytic enzymes are present, which may fulfill the
requirement for gluconeogenesis8. Mendz et al. (1995) proved that H. pylori can grow
employing aminoacids as carbon and energy sources, and suggested that even though
oxygen is essential for the growth of this organism, some aminoacids are utilized via
fermentative pathways characteristic of anaerobiosis9. H. pylori also uses some amino
acids, urea and ammonium as nitrogen sources. According to some authors, there are few
absolute requirements for H. pylori growth: nine amino acids (arginine, histidine, leucine,
methionine, phenylalanine, valine, alanine, cysteine and proline), sodium and potassium
chloride, thiamine, iron, zinc, magnesium, hypoxanthine and pyruvate3. However, those
experiments have been performed with more than one carbon source.
Uncovering the mechanisms associated with H. pylori infection has been hindered
by the lack of physiological data and consequently, many aspects related with the
appearance of diseases remain unclear.
Exometabolome analysis in H. pylori for the elucidation of nutritional requirements and preferences
125
Metabolites, the intermediates of biochemical reactions, have a key role in
connecting the many different pathways that operate within a living cell10. The group of all
metabolites synthesized or used by a biological system is called the metabolome11,12. In the
metabolomics field, metabolic footprinting has been extensively used to understand cell
physiology under diverse states or conditions on various biological systems13,14, relying on
the investigation of metabolites consumed from and secreted into the culture medium15.
Genomic information, combined with biochemical knowledge made possible the
development of metabolic models for several organisms16,17, which can be used to predict
the phenotypic behavior under different genetic and environmental conditions16. Nowadays,
there are several software tools for using stoichiometric models of microbial metabolism
for simulation and optimization18. The genome sequence of H. pylori, together with
accumulated biochemical and physiological knowledge, allowed the construction of
genome-scale metabolic models for this organism19,20. The first one was published in 2002
(iCS291)19 and an updated version was published in 2005 (iIT341 GSM/GPR)20.
Nevertheless, the predictions obtained with these stoichiometric models are only as good
as allowed by the data used to build the model. In the particular case of H. pylori,
physiological data collected under defined conditions are scarce, hindering model
validation, and consequently making the models unrealistic and inaccurate.
The present study was conducted with the main goal of elucidating H. pylori’s
preferences and nutritional requirements, with special relevance for carbon and energy
sources. One of the applications of this study is the design of a more rational H. pylori
growth medium. For those purposes, H. pylori was grown in liquid medium and samples
were collected to analyze the extracellular metabolites. Simulations were performed using
the existing genome-scale metabolic model in order to link the in vitro obtained results with
the predictions made by the model and gain new insights about the metabolism of this
pathogenic organism. The development of robust methods to grow H. pylori would allow
for a much faster and reproducible path to obtain biomass, and consequently lead to a
significant development in studies on H. pylori physiology and metabolism, as well as
protein characterization. Moreover, the identification of the nutritional requirements and
Chapter 4
126
active metabolic pathways of this organism is of major importance to understand its
growth in the host and to help to design alternative strategies for microbial inactivation.
4.3. Methods
4.3.1. Culture conditions
Helicobacter pylori 26695 (strain NCTC 12455) was cultivated in Columbia Blood
Agar (CBA) at 37 °C under microaerophilic conditions (5% O2, 10% CO2, 85% N2) in a Cell
Culture Incubator (Incubator HERAcell 150, Kendro Laboratory, Germany) for 3 days.
An inoculum was prepared in 150 mL of Ham’s F-12 nutrient mixture with
glutamine (catalog no 21765-037, Invitrogen-Gibco, Spain) (composition detailed in
supplementary material 1), previously supplemented with 5% of FBS (catalog no 10500-
064, origin: South America, Invitrogen-Gibco, Spain)21, incubated at 37 °C under 120 rpm
of shaking speed (Heidolph Unimax 1010 orbital shaker, Germany) in microaerophilic
conditions for approximately 17 h, in order to reach the exponential phase.
Cultivations were performed in 1000-mL Erlenmeyer flasks with the same medium
as described for the inoculum at 37 °C under 130 rpm of shaking speed, under
microaerophilic conditions (6.5% O2, 10% CO2, 83.5% N2). The initial cell concentration was
adjusted to an optical density at 600 nm (OD600) of 0.1 (corresponding to approximately 107
CFU/mL). The experiment was carried out in triplicate during 72 hours. More details can
be found on previously published work22 in which the culture conditions were optimized by
experimental design.
4.3.2. Growth assessment
In order to assess growth, for each experiment performed, samples were collected
at defined time points (until 72 hours), and the optical density (OD) at 600 nm was read
using a microplate reader (TECAN Sunrise, Switzerland) after performing the
Exometabolome analysis in H. pylori for the elucidation of nutritional requirements and preferences
127
disaggregation procedure described in the previous chapter. Cell dry weight (CDW) was
determined by using a calibration curve (as described in Chapter 6). A conversion factor of
0.82 was achieved to convert OD (600nm) to CDW (g/L). Based on the growth curve, the
specific growth rate (µ) was calculated. To ensure that all samples collected had not been
contaminated, aliquots were plated both on Tryptic Soy Agar (TSA) and CBA plates, at
each time point for all experiments.
4.3.3. Extracellular metabolite analysis
The extracellular metabolite analysis was performed according to the method
described by Smart et al. (2010)23, with minor modifications.
4.3.3.1. Chemicals
Amino and organic acids standards stock solutions were prepared at a
concentration of 500 mM in ultra-pure water, with the exception of lactic acid and isocitric
acid which were prepared at a concentration of 250 mM and 2-oxoadipic acid which was
prepared at 100 mM. In working standard solutions, prepared at 10 mM, the pH was set
to values above 12 with sodium hydroxide (1 M). A range of standard solutions between
0.0005 and 10 mM was prepared and a total of three replicates per standard
concentration were analyzed. The standard solutions were treated the same way as the
samples. All solutions were stored at -20 ºC while not in use. Information about standard
compounds used in this study is detailed in supplementary material 2.
4.3.3.2. Sample preparation
At each time point (0, 4, 8, 12, 24, 48 and 72 hours) samples were collected for
exometabolome analysis by Gas Chromatography coupled with Mass Spectrometry (GC-
MS). 1-mL samples at each time point (in triplicate) were filtered through a syringe
cellulose acetate filter (0.2-µm pore size, 25 mm), to remove bacterial cells, and 20 µL of
d4- alanine (2,3,3,3-d4-alanine) (internal standard) at 10 mM were added to each sample.
1-mL samples (3 in total) of noninoculated culture medium were prepared in the same
Chapter 4
128
way, and were used as controls (blank samples). The samples were frozen at -80 °C and
then lyophilized during 24 hours.
4.3.3.3. Sample derivatization
The samples for extracellular metabolites analysis were derivatized using the
methyl chloroformate (MCF) method described by Smart et al. (2010)23. All solutions and
standards used were prepared according to the same protocol. Together with the samples,
one blank of derivatization (all derivatization reagents without sample) was prepared. After
derivatization, the samples were analyzed in 24 hours, to avoid sample degradation.
4.3.3.4. GC-MS analysis
GC-MS analysis was performed with a Varian 4000 GC-MS (Varian, USA) with a
gas chromatograph (Varian CP-3800) equipped with an autosampler (CP-8410), coupled
to a mass spectrometer with an Ion Trap analyzer (Varian 4000), operating in electron
impact (EI) ionization mode (70eV). The chromatographic column used was a ZB1701 –
GC capillary column (30 m x 0.25 mm ID x 0.15 µm film thickness) with a 5-m guard
column (Phenomenex, USA).
The 1-µL sample was injected using a splitless mode, and after 1 minute of
injection the split ratio was 1:20. The GC oven temperature was initially held at 45 ºC for 2
min. Thereafter the temperature was raised at 9ºC/min until 180ºC and held for 5 min.
Then, the temperature was raised at 40ºC/min until 220ºC, and held for 5 min. After that
the temperature was again raised at 40ºC/min until 240ºC and held for 11.5 min. Then,
the temperature was raised at 40ºC/min until 280ºC and held for 2 min, totalizing 43 min
of analysis time. Helium was used as the carrier gas, at a constant flow rate of 1.0
mL/min.
The injector temperature was set to 290 ºC, and the interface temperature to 250
ºC, while the trap temperature was set to 190 ºC. The MS was operated in the full-scan
acquisition mode (38-650 m/z – mass to charge ratios), after 5 minutes at 1.64 scan/s.
Exometabolome analysis in H. pylori for the elucidation of nutritional requirements and preferences
129
The GC-MS software used to control the system was the Varian MS Workstation System
Control – version 6.6.
4.3.3.5. Data analysis
A standard library with retention times and mass spectra of derivatized standards
was created. Retention times, molecular ions, and major fragment ions identified for all
analyzed compounds are detailed in supplementary material 3. The metabolite
identification was based on the matching of retention times and mass spectra against the
created library. The peak intensity of MCF derivatives of standards (amino and nonamino
organic acids) was used to quantify the metabolites in samples. The data normalization
was achieved by the normalization of the peak intensities by the intensity of the internal
standard (d4 –alanine) in each sample.
Data processing and statistical analysis were performed with Excel and Multi
Experiment Viewer (MeV)24.
In order to evaluate if there were significant differences between the mean values
of each compound identified in MS spectra of the biological replicates (three), an analysis
of variance (ANOVA) was performed. An ANOVA analysis was also applied to examine if the
consumption of each compound along time was significant.
To further examine the relation between the amino acids profile and to evaluate
which amino acids had a similar profile along time, a hierarchical clustering (HCL) and K-
Means analysis were applied on the GC-MS data acquired until 72 hours of culture. Thus,
percentage values of biological replicates were averaged and the MeV24 software was used
to perform clustering analysis. Hierarchical clustering, based on Kendall’s Tau metrics,
was used to have a global view of the possible clusters. Additionally, in order to categorize
the amino acids into clusters, a K-Means clustering analysis was performed using the
same metrics as described for HCL, with the following parameters: number of clusters –
3; maximum iterations – 50.
Chapter 4
130
4.3.3.6. Acetate and glucose analysis
For glucose and acetate analysis, 1-mL samples at each time point were filtered
by a 0.2-µm syringe filter, to remove bacterial cells, and were immediately frozen at -20
°C until analysis. The analysis of acetate and glucose were performed using an acetic acid
UV-method (Cat. No. 10 148 261 035, Boehringer Mannheim/R-Biopharm, Roche,
Germany) and a D-glucose UV-method (Cat. No. 10 716 251 035, Boehringer
Mannheim/R-Biopharm, Roche, Germany) kits, respectively. In order to stop enzymatic
reactions, according to the kit’s instructions, prior to analysis samples were heated in a
water-bath at 80ºC during 15 min, and then were centrifuged at 5000 rpm for 5 min.
Afterwards, the experimental procedure was performed according to the manufacturer’s
instructions.
4.3.3.7. Metabolic model simulations
In order to compare the experimental data with the simulated data supplied by the
existing genome-scale metabolic model, simulations using Flux Balance Analysis (FBA)
were performed. The model used to predict the behavior of H. pylori under the conditions
used in vivo was the iIT341 GSM/GPR, published by Thiele et al. (2005)20. Optflux18, an
open source software, was the platform used to perform the simulations using the
Systems Biology Markup Language (SBML) file of the aforementioned model. In the
simulated environmental conditions the uptake rates for the metabolites present in the
culture medium were set to 10 mmol/h/g (dry weight). Additionally, the uptake rates for
sodium, sulphate, iron, ammonia, phosphate and protons were not constrained. The
mentioned uptake rates were set based on the information contained in the model for the
minimal medium20.
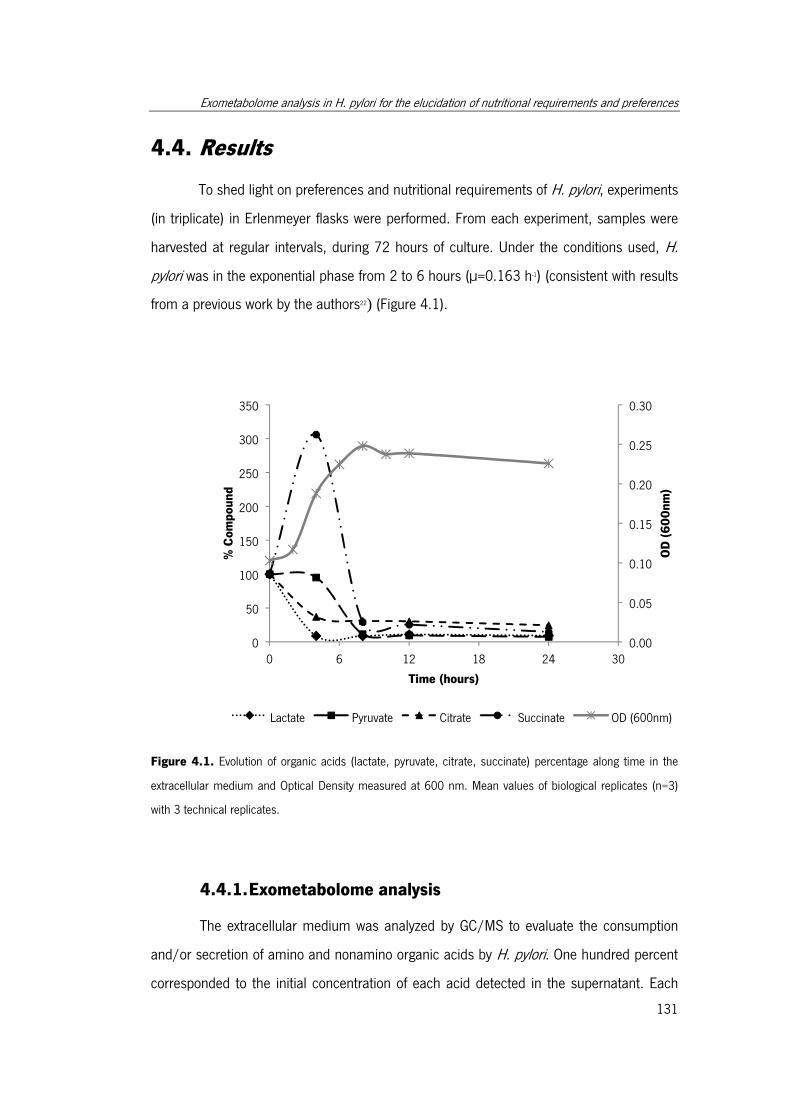
Exometabolome analysis in H. pylori for the elucidation of nutritional requirements and preferences
131
4.4. Results
To shed light on preferences and nutritional requirements of H. pylori, experiments
(in triplicate) in Erlenmeyer flasks were performed. From each experiment, samples were
harvested at regular intervals, during 72 hours of culture. Under the conditions used, H.
pylori was in the exponential phase from 2 to 6 hours (µ=0.163 h-1) (consistent with results
from a previous work by the authors22) (Figure 4.1).
Figure 4.1. Evolution of organic acids (lactate, pyruvate, citrate, succinate) percentage along time in the
extracellular medium and Optical Density measured at 600 nm. Mean values of biological replicates (n=3)
with 3 technical replicates.
4.4.1. Exometabolome analysis
The extracellular medium was analyzed by GC/MS to evaluate the consumption
and/or secretion of amino and nonamino organic acids by H. pylori. One hundred percent
corresponded to the initial concentration of each acid detected in the supernatant. Each
0.00
0.05
0.10
0.15
0.20
0.25
0.30
0
50
100
150
200
250
300
350
0 6 12 18 24 30O
D (
60
0n
m)
% C
om
po
un
d
Time (hours)
Lactate Pyruvate Citrate Succinate OD (600nm)
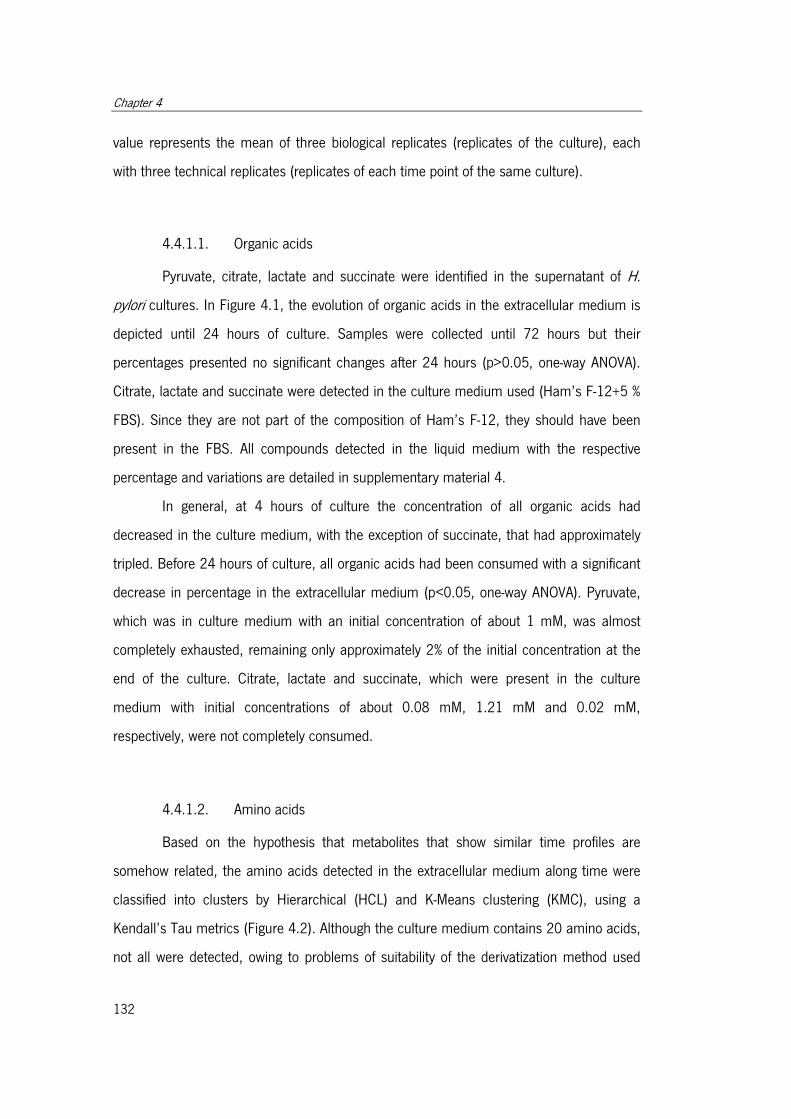
Chapter 4
132
value represents the mean of three biological replicates (replicates of the culture), each
with three technical replicates (replicates of each time point of the same culture).
4.4.1.1. Organic acids
Pyruvate, citrate, lactate and succinate were identified in the supernatant of H.
pylori cultures. In Figure 4.1, the evolution of organic acids in the extracellular medium is
depicted until 24 hours of culture. Samples were collected until 72 hours but their
percentages presented no significant changes after 24 hours (p>0.05, one-way ANOVA).
Citrate, lactate and succinate were detected in the culture medium used (Ham’s F-12+5 %
FBS). Since they are not part of the composition of Ham’s F-12, they should have been
present in the FBS. All compounds detected in the liquid medium with the respective
percentage and variations are detailed in supplementary material 4.
In general, at 4 hours of culture the concentration of all organic acids had
decreased in the culture medium, with the exception of succinate, that had approximately
tripled. Before 24 hours of culture, all organic acids had been consumed with a significant
decrease in percentage in the extracellular medium (p<0.05, one-way ANOVA). Pyruvate,
which was in culture medium with an initial concentration of about 1 mM, was almost
completely exhausted, remaining only approximately 2% of the initial concentration at the
end of the culture. Citrate, lactate and succinate, which were present in the culture
medium with initial concentrations of about 0.08 mM, 1.21 mM and 0.02 mM,
respectively, were not completely consumed.
4.4.1.2. Amino acids
Based on the hypothesis that metabolites that show similar time profiles are
somehow related, the amino acids detected in the extracellular medium along time were
classified into clusters by Hierarchical (HCL) and K-Means clustering (KMC), using a
Kendall’s Tau metrics (Figure 4.2). Although the culture medium contains 20 amino acids,
not all were detected, owing to problems of suitability of the derivatization method used
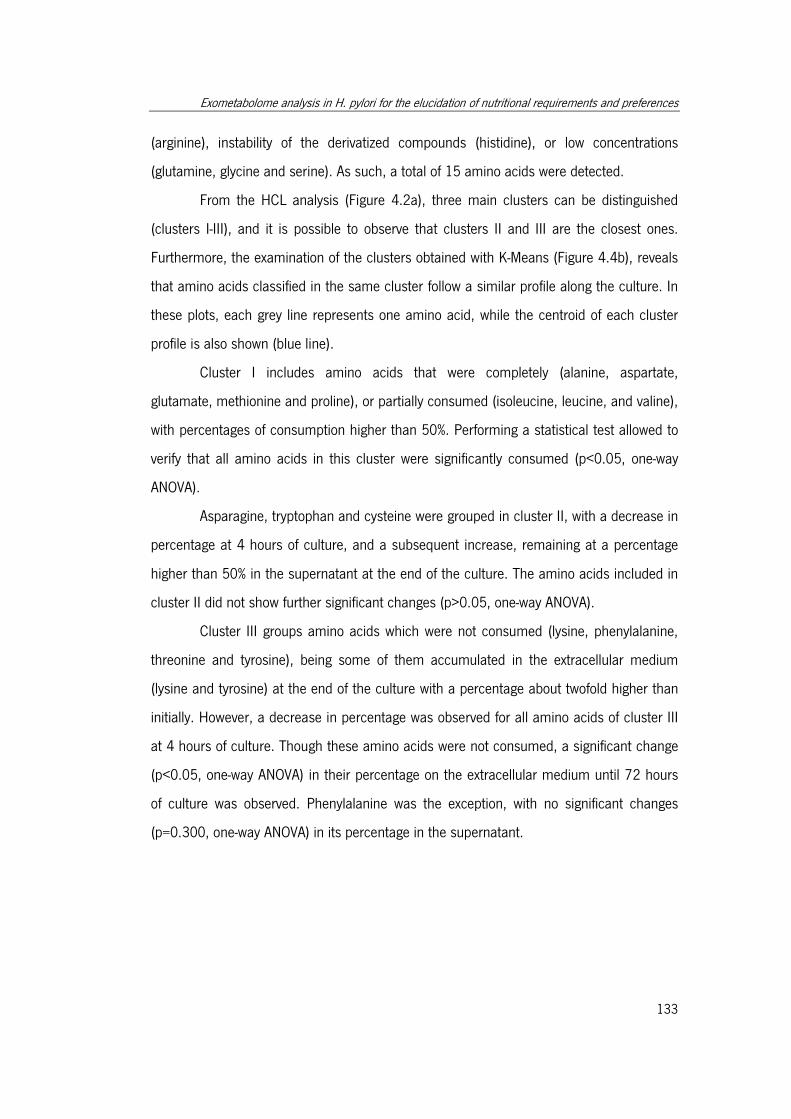
Exometabolome analysis in H. pylori for the elucidation of nutritional requirements and preferences
133
(arginine), instability of the derivatized compounds (histidine), or low concentrations
(glutamine, glycine and serine). As such, a total of 15 amino acids were detected.
From the HCL analysis (Figure 4.2a), three main clusters can be distinguished
(clusters I-III), and it is possible to observe that clusters II and III are the closest ones.
Furthermore, the examination of the clusters obtained with K-Means (Figure 4.4b), reveals
that amino acids classified in the same cluster follow a similar profile along the culture. In
these plots, each grey line represents one amino acid, while the centroid of each cluster
profile is also shown (blue line).
Cluster I includes amino acids that were completely (alanine, aspartate,
glutamate, methionine and proline), or partially consumed (isoleucine, leucine, and valine),
with percentages of consumption higher than 50%. Performing a statistical test allowed to
verify that all amino acids in this cluster were significantly consumed (p<0.05, one-way
ANOVA).
Asparagine, tryptophan and cysteine were grouped in cluster II, with a decrease in
percentage at 4 hours of culture, and a subsequent increase, remaining at a percentage
higher than 50% in the supernatant at the end of the culture. The amino acids included in
cluster II did not show further significant changes (p>0.05, one-way ANOVA).
Cluster III groups amino acids which were not consumed (lysine, phenylalanine,
threonine and tyrosine), being some of them accumulated in the extracellular medium
(lysine and tyrosine) at the end of the culture with a percentage about twofold higher than
initially. However, a decrease in percentage was observed for all amino acids of cluster III
at 4 hours of culture. Though these amino acids were not consumed, a significant change
(p<0.05, one-way ANOVA) in their percentage on the extracellular medium until 72 hours
of culture was observed. Phenylalanine was the exception, with no significant changes
(p=0.300, one-way ANOVA) in its percentage in the supernatant.
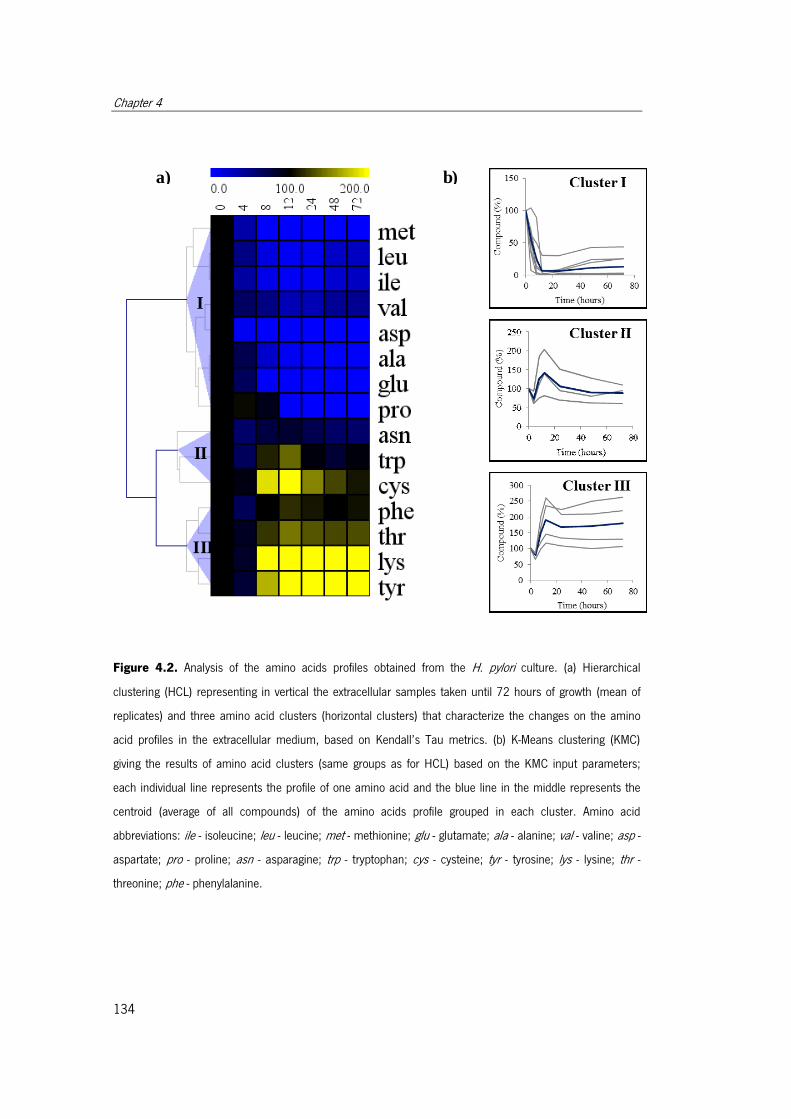
Chapter 4
134
I
II
III
a) b)
Figure 4.2. Analysis of the amino acids profiles obtained from the H. pylori culture. (a) Hierarchical
clustering (HCL) representing in vertical the extracellular samples taken until 72 hours of growth (mean of
replicates) and three amino acid clusters (horizontal clusters) that characterize the changes on the amino
acid profiles in the extracellular medium, based on Kendall’s Tau metrics. (b) K-Means clustering (KMC)
giving the results of amino acid clusters (same groups as for HCL) based on the KMC input parameters;
each individual line represents the profile of one amino acid and the blue line in the middle represents the
centroid (average of all compounds) of the amino acids profile grouped in each cluster. Amino acid
abbreviations: ile - isoleucine; leu - leucine; met - methionine; glu - glutamate; ala - alanine; val - valine; asp -
aspartate; pro - proline; asn - asparagine; trp - tryptophan; cys - cysteine; tyr - tyrosine; lys - lysine; thr -
threonine; phe - phenylalanine.
Exometabolome analysis in H. pylori for the elucidation of nutritional requirements and preferences
135
4.4.1.3. Results reproducibility
In order to evaluate the precision of the obtained results, the relative standard
deviation expressed as a percentage (%RSD) was calculated for technical (n=3) and
biological replicates (n=9) for each compound at each time point analyzed. This calculation
was made after normalization of compound intensity by the internal standard intensity in
each analysis.
The %RSDs observed for the detected compounds for technical replicates were in
general lower than 40%. The low concentration levels for the metabolites detected can
contribute for the high level of variation between technical replicates. In general, the
%RSDs observed for the metabolites detected between biological replicates were in the
order of 50%, with some exceptions. Taking together the %RSDs obtained for technical and
biological replicates, there seems to be evidence that the variations observed in the
amount of the metabolites analyzed were due to the method used rather than biological
variability.
4.4.1.4. Glucose consumption and acetate formation
Glucose and acetate along time in the culture medium were analyzed using UV-
kits. A significant consumption of glucose was observed during the experiments’ time
series (p < 0.05; one-way ANOVA). However, glucose was not completely consumed,
remaining at almost 50% in the end culture (Figure 4.3). Formation of acetate was
observed with a pronounced increase in the concentration, mainly after 12 hours of culture
(Figure 4.3).
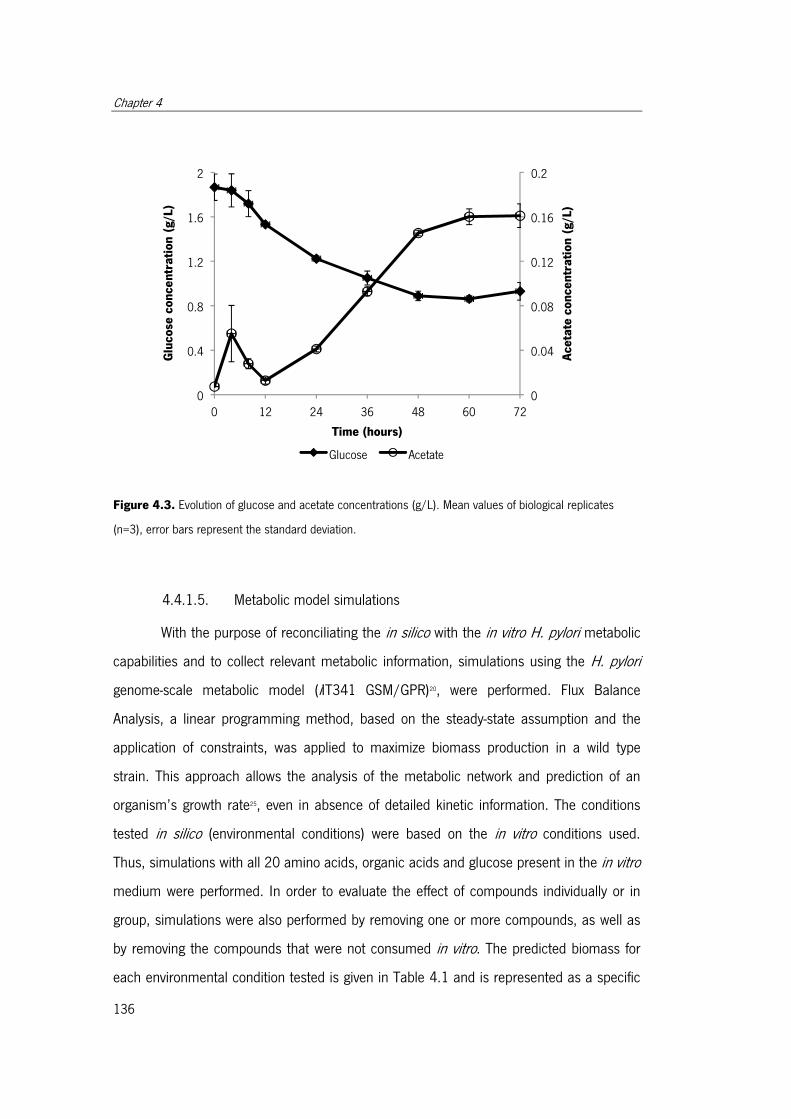
Chapter 4
136
Figure 4.3. Evolution of glucose and acetate concentrations (g/L). Mean values of biological replicates
(n=3), error bars represent the standard deviation.
4.4.1.5. Metabolic model simulations
With the purpose of reconciliating the in silico with the in vitro H. pylori metabolic
capabilities and to collect relevant metabolic information, simulations using the H. pylori
genome-scale metabolic model (iIT341 GSM/GPR)20, were performed. Flux Balance
Analysis, a linear programming method, based on the steady-state assumption and the
application of constraints, was applied to maximize biomass production in a wild type
strain. This approach allows the analysis of the metabolic network and prediction of an
organism’s growth rate25, even in absence of detailed kinetic information. The conditions
tested in silico (environmental conditions) were based on the in vitro conditions used.
Thus, simulations with all 20 amino acids, organic acids and glucose present in the in vitro
medium were performed. In order to evaluate the effect of compounds individually or in
group, simulations were also performed by removing one or more compounds, as well as
by removing the compounds that were not consumed in vitro. The predicted biomass for
each environmental condition tested is given in Table 4.1 and is represented as a specific
0
0.04
0.08
0.12
0.16
0.2
0
0.4
0.8
1.2
1.6
2
0 12 24 36 48 60 72
Ace
tate
co
nce
ntr
ati
on
(g
/L)
Glu
co
se c
on
ce
ntr
ati
on
(g
/L)
Time (hours)
Glucose Acetate
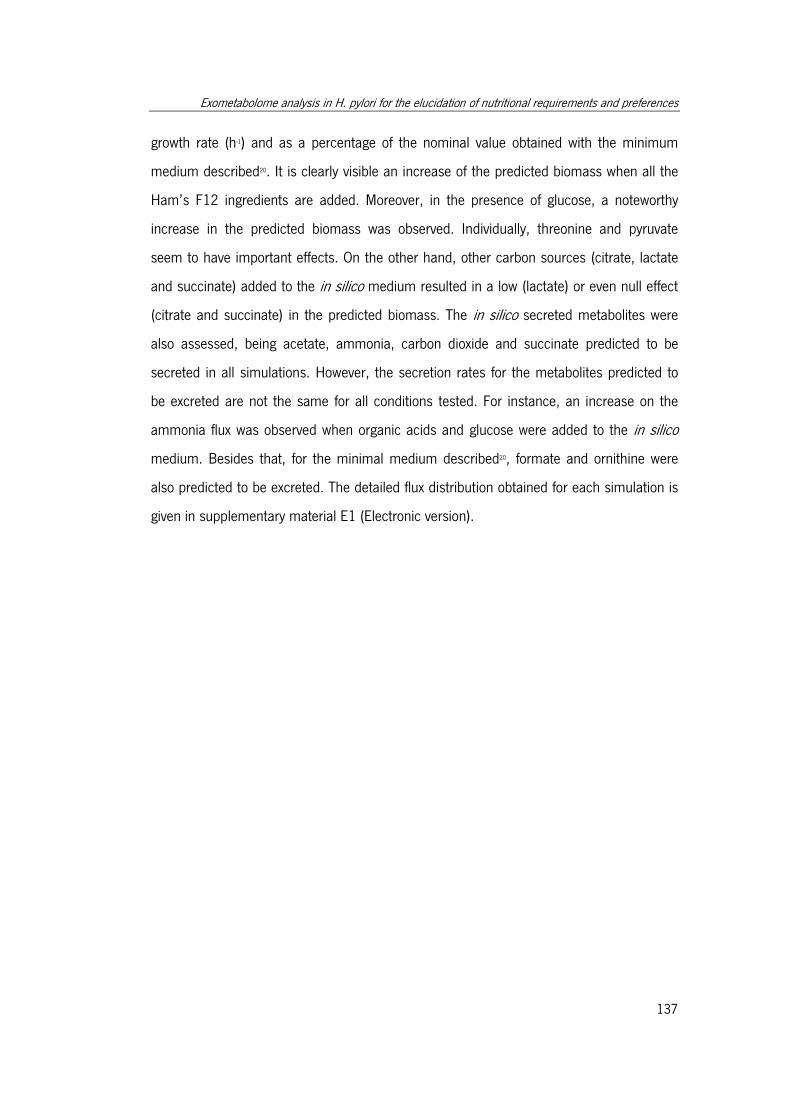
Exometabolome analysis in H. pylori for the elucidation of nutritional requirements and preferences
137
growth rate (h-1) and as a percentage of the nominal value obtained with the minimum
medium described20. It is clearly visible an increase of the predicted biomass when all the
Ham’s F12 ingredients are added. Moreover, in the presence of glucose, a noteworthy
increase in the predicted biomass was observed. Individually, threonine and pyruvate
seem to have important effects. On the other hand, other carbon sources (citrate, lactate
and succinate) added to the in silico medium resulted in a low (lactate) or even null effect
(citrate and succinate) in the predicted biomass. The in silico secreted metabolites were
also assessed, being acetate, ammonia, carbon dioxide and succinate predicted to be
secreted in all simulations. However, the secretion rates for the metabolites predicted to
be excreted are not the same for all conditions tested. For instance, an increase on the
ammonia flux was observed when organic acids and glucose were added to the in silico
medium. Besides that, for the minimal medium described20, formate and ornithine were
also predicted to be excreted. The detailed flux distribution obtained for each simulation is
given in supplementary material E1 (Electronic version).
Chapter 4
138
Table 4.1. Results of the simulations performed with the iIT 341 GSM/GPR model, using Flux Balance Analysis in Optflux, showing the environmental conditions tested
and the biomass predicted for each simulation. Abbreviations: cit – citrate; D-ala – D-alanine; glc – D-glucose; lac – lactate; L-ala – L-alanine; L-arg – L-arginine; L-cys – L-cysteine; L-
his – L-histidine; L-ile – L-isoleucine; L-lys – L-lysine; L-met – L-methionine; L-phe – L-phenylalanine; L-thr – L-threonine; L-trp – L-tryptophan; L-tyr – L-tyrosine; L-val – L-valine; pyr -
pyruvate; succ – succinate.
in silico Components Predicted biomass
Environmental conditions Amino acids Other carbon sources (h-1) %
1* L-ala, D-ala, L-arg, L-his, L-ile, L-met, L-val - 0.693 100
2 all 20 glc, pyr 1.568 226
3 all 20 glc, pyr, cit, lac, succ 1.593 230
4 all 20 glc, pyr, lac, succ 1.593 230
5 all 20 glc, pyr, cit, succ 1.568 226
6 all 20 glc, pyr, cit, lac 1.593 230
7 all 20 glc, cit, lac, succ 1.493 216
8 all 20 pyr, cit, lac, succ 1.299 187
9 all, except L-cys glc, pyr, cit, lac, succ 1.593 230
10 all, except L-trp glc, pyr, cit, lac, succ 1.588 229
11 all, except L-tyr glc, pyr, cit, lac, succ 1.586 229
12 all, except L-phe glc, pyr, cit, lac, succ 1.586 229
13 all, except L-thr glc, pyr, cit, lac, succ 1.286 186
14 all, except L-lys glc, pyr, cit, lac, succ 1.581 228
15 all, except L-cys, L-lys, L-thr, L-trp, L-tyr, L-phe glc, pyr, cit, lac, succ 1.261 182
16 all, except L-cys, L-lys, L-thr, L-trp, L-tyr, L-phe pyr, cit, lac, succ 0.963 139
* Simulation performed with the minimal medium described by Thiele et al. (2005)20.
Exometabolome analysis in H. pylori for the elucidation of nutritional requirements and preferences
139
4.5. Discussion
4.5.1. Exometabolome analysis
The characterization of microbial phenotypes is of major importance in
understanding cell’s metabolism, and the analysis of the extracellular metabolome can
help in that characterization, since the level and the variety of the secreted metabolites are
associated with the metabolic state of the cell26. The metabolites detected in the
extracellular medium can represent metabolites secreted/excreted by the cells or
metabolites present in the culture medium that were not completely depleted. The
detection and quantification of the compounds present in the extracellular medium can
thus aid in the identification of nutritional requirements and contribute to rationally adjust
the components of the culture medium.
4.5.1.1. Organic acids analysis
Some organic acids (citrate, lactate and succinate) that were detected in blank
samples (without cells), had not been described as part of the composition of the defined
culture medium used (Ham’s F-12). Pyruvate was also detected, but it is present in Ham’s
F-12 medium. Since the culture medium was supplemented with Fetal Bovine Serum
(FBS), the aforementioned acids might have been present in FBS. FBS is considered an
undefined component and is almost uncharacterized, although some components have
been identified, such as protein components, hormones, growth factors and cytokines,
fatty acids and lipids, vitamins and trace elements, carbohydrates and non-protein
nitrogens27,28. The presence of some organic acids, such as malate, fumarate and succinate
in fetal bovine serum was also reported29.
The evolution of pyruvate, citrate, lactate and succinate (Figure 4.1) shows that all
organic acids were totally or partly consumed. After the end of the exponential phase (8h),
pyruvate and lactate had been almost fully depleted, whilst the consumption of citrate and
succinate was slower and only partial. A 3-fold increase in the succinate concentration at
Chapter 4
140
4h of culture was observed (Figure 4.1) and it can be interpreted as this compound might
be a metabolic by-product of amino acids and pyruvate catabolism30,31. The consumption of
pyruvate, D-lactate and succinate by H. pylori, had also been reported; nevertheless, these
compounds were reported as not being the preferred carbon sources30, which could not be
confirmed in the present study, at least for lactate and pyruvate. However, another
experiment was performed with an increased concentration of organic acids in the culture
medium, but that did not lead to a pronounced increase in growth (data not shown).
Regarding the consumption of pyruvate, published studies have reported that
acetate is the main product when pyruvate is metabolized by H. pylori under aerobic
conditions, whereas acetate, lactate and ethanol were detected when H. pylori cells where
submitted to anaerobic conditions with labeled pyruvate7,31. Under microaerophilic
conditions, Mendz et al. (1994) observed the formation of lactate, acetate, formate,
succinate and alanine from pyruvate32 Ethanol and formate were not detected in the
present study (ethanol analyzed by liquid chromatography, data not shown).
4.5.1.2. Glucose consumption and acetate formation
In the present study, glucose was partially consumed, as previously reported by
other authors6 (Figure 4.3). Some studies stated that glucose can be utilized by H. pylori,
since the penthose phosphate and the Entner-Doudoroff pathways have been identified33,34.
In addition, a glucose transporter was identified in H. pylori35,36 and further confirmed by the
genomic sequence37. In the present study, glucose consumption occurs until 48 hours of
growth, but with a more pronounced consumption after 12 hours of culture, matching with
the depletion of some amino acids, such as alanine, proline, aspartate and glutamate. This
result suggests that glucose is not the preferred carbon and energy source and is in
agreement with the conclusions taken by other authors, that also reported that in the
presence of amino acids, glucose was not consumed until the amino acids were
exhausted6,31 and therefore could be removed from the culture medium9. It is also worth
mentioning that most of the glucose consumed (50%) did not contribute significantly for
growth, as cells stopped growing at around 8 hours of cultivation, when glucose
Exometabolome analysis in H. pylori for the elucidation of nutritional requirements and preferences
141
consumption had only just started. The presence of acetate in the extracellular medium
was observed, specially between 12 and 48 hours of growth, in agreement with the
decrease of glucose in the culture medium, indicating that glucose might be contributing
to acetate production, as described by other authors7, although the amounts of acetate
accumulated are quite low compared with the levels of glucose consumed.
4.5.1.3. Amino acids analysis
Amino acids have been described as potential sources of carbon, nitrogen and
energy in H. pylori31. There are several studies describing the in vitro amino acid
requirements for H. pylori. Some of published studies are based on essentiality analysis by
the evaluation of growth when a given amino acid is present or not in the culture medium1–
3. Other studies are based on consumption4,9,38, measuring the concentration of a given
amino acid by analytical methods. In addition, the in silico amino acids requirements were
also described19,20. It is important to highlight that environmental cultivation conditions,
culture media and the strains used in published studies are not standardized, and the
essentiality of a compound could be related to the mentioned factors, hampering results
comparison, and making difficult to conclude about the amino acid requirements for H.
pylori growth. There is an extra difficulty in the evaluation and comparison of the results
obtained in different studies, since the analytical procedures are not uniform and
sometimes the results presented are not sufficiently clear to conclude about a specific
compound consumption and/or essentiality. Table 4.2 summarizes the results obtained in
the aforementioned studies, together with the results obtained in the present study. In
order to facilitate the comparison and interpretation, an attempt of standardization was
made. The term “essential” was used to refer amino acids that are required for H. pylori
growth, with no growth in the absence of that specific compound. Additionally, the term
“preferential” is applied when a given amino acid is not absolutely required for growth but,
when present, it is preferable and firstly consumed. In studies where it was not possible to
conclude about the essentiality or preferences, the amino acids were classified as
“consumed”, “not consumed” or “accumulated”. The term “no consensus” was applied
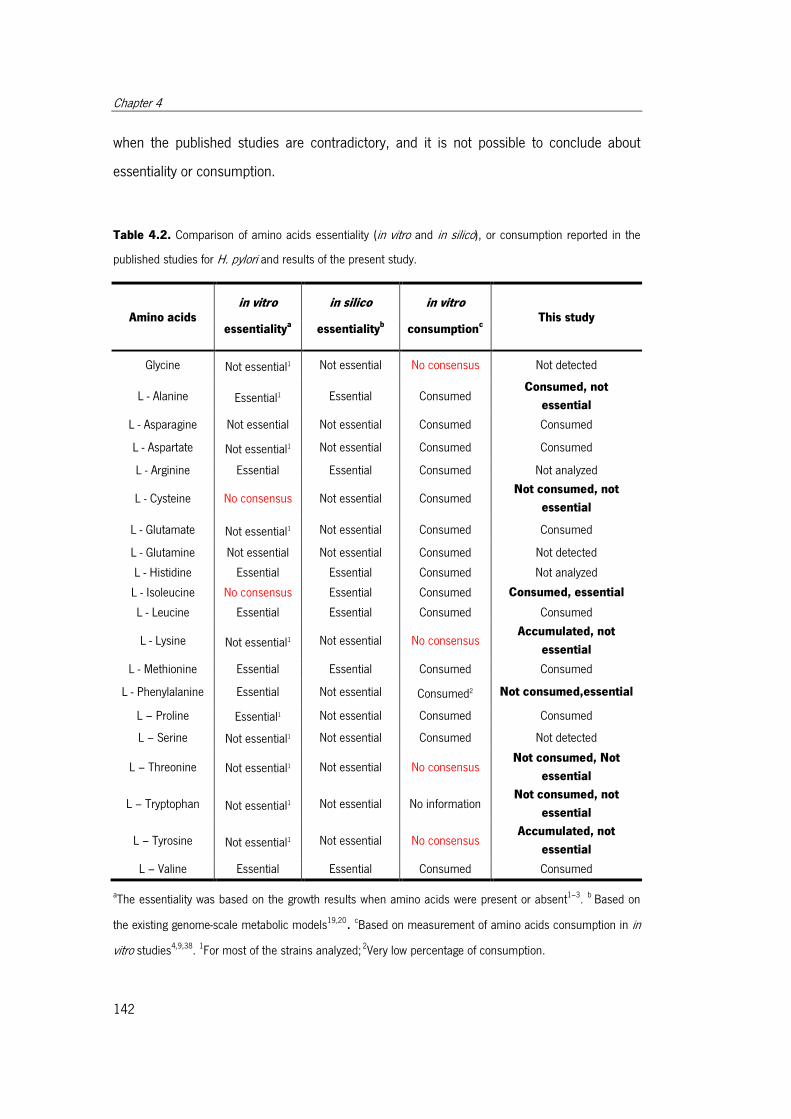
Chapter 4
142
when the published studies are contradictory, and it is not possible to conclude about
essentiality or consumption.
Table 4.2. Comparison of amino acids essentiality (in vitro and in silico), or consumption reported in the
published studies for H. pylori and results of the present study.
Amino acids in vitro
essentialitya
in silico
essentialityb
in vitro
consumptionc
This study
Glycine Not essential1 Not essential No consensus Not detected
L - Alanine Essential1 Essential Consumed Consumed, not
essential
L - Asparagine Not essential Not essential Consumed Consumed
L - Aspartate Not essential1 Not essential Consumed Consumed
L - Arginine Essential Essential Consumed Not analyzed
L - Cysteine No consensus Not essential Consumed Not consumed, not
essential
L - Glutamate Not essential1 Not essential Consumed Consumed
L - Glutamine Not essential Not essential Consumed Not detected
L - Histidine Essential Essential Consumed Not analyzed
L - Isoleucine No consensus Essential Consumed Consumed, essential
L - Leucine Essential Essential Consumed Consumed
L - Lysine Not essential1 Not essential No consensus Accumulated, not
essential
L - Methionine Essential Essential Consumed Consumed
L - Phenylalanine Essential Not essential Consumed2 Not consumed,essential
L – Proline Essential1 Not essential Consumed Consumed
L – Serine Not essential1 Not essential Consumed Not detected
L – Threonine Not essential1 Not essential No consensus Not consumed, Not
essential
L – Tryptophan Not essential1 Not essential No information Not consumed, not
essential
L – Tyrosine Not essential1 Not essential No consensus Accumulated, not
essential
L – Valine Essential Essential Consumed Consumed
aThe essentiality was based on the growth results when amino acids were present or absent
1–3.
b Based on
the existing genome-scale metabolic models19,20. c
Based on measurement of amino acids consumption in in
vitro studies4,9,38
. 1For most of the strains analyzed;
2Very low percentage of consumption.
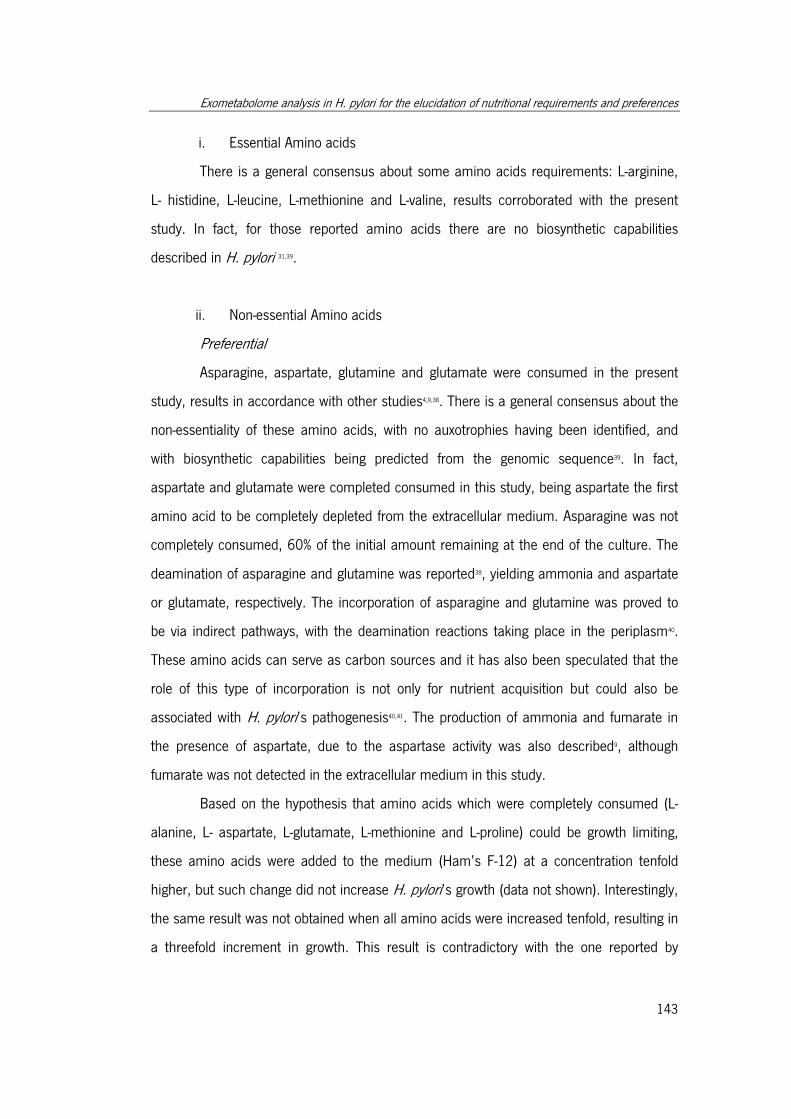
Exometabolome analysis in H. pylori for the elucidation of nutritional requirements and preferences
143
i. Essential Amino acids
There is a general consensus about some amino acids requirements: L-arginine,
L- histidine, L-leucine, L-methionine and L-valine, results corroborated with the present
study. In fact, for those reported amino acids there are no biosynthetic capabilities
described in H. pylori 31,39.
ii. Non-essential Amino acids
Preferential
Asparagine, aspartate, glutamine and glutamate were consumed in the present
study, results in accordance with other studies4,9,38. There is a general consensus about the
non-essentiality of these amino acids, with no auxotrophies having been identified, and
with biosynthetic capabilities being predicted from the genomic sequence39. In fact,
aspartate and glutamate were completed consumed in this study, being aspartate the first
amino acid to be completely depleted from the extracellular medium. Asparagine was not
completely consumed, 60% of the initial amount remaining at the end of the culture. The
deamination of asparagine and glutamine was reported38, yielding ammonia and aspartate
or glutamate, respectively. The incorporation of asparagine and glutamine was proved to
be via indirect pathways, with the deamination reactions taking place in the periplasm40.
These amino acids can serve as carbon sources and it has also been speculated that the
role of this type of incorporation is not only for nutrient acquisition but could also be
associated with H. pylori’s pathogenesis40,41. The production of ammonia and fumarate in
the presence of aspartate, due to the aspartase activity was also described9, although
fumarate was not detected in the extracellular medium in this study.
Based on the hypothesis that amino acids which were completely consumed (L-
alanine, L- aspartate, L-glutamate, L-methionine and L-proline) could be growth limiting,
these amino acids were added to the medium (Ham’s F-12) at a concentration tenfold
higher, but such change did not increase H. pylori’s growth (data not shown). Interestingly,
the same result was not obtained when all amino acids were increased tenfold, resulting in
a threefold increment in growth. This result is contradictory with the one reported by
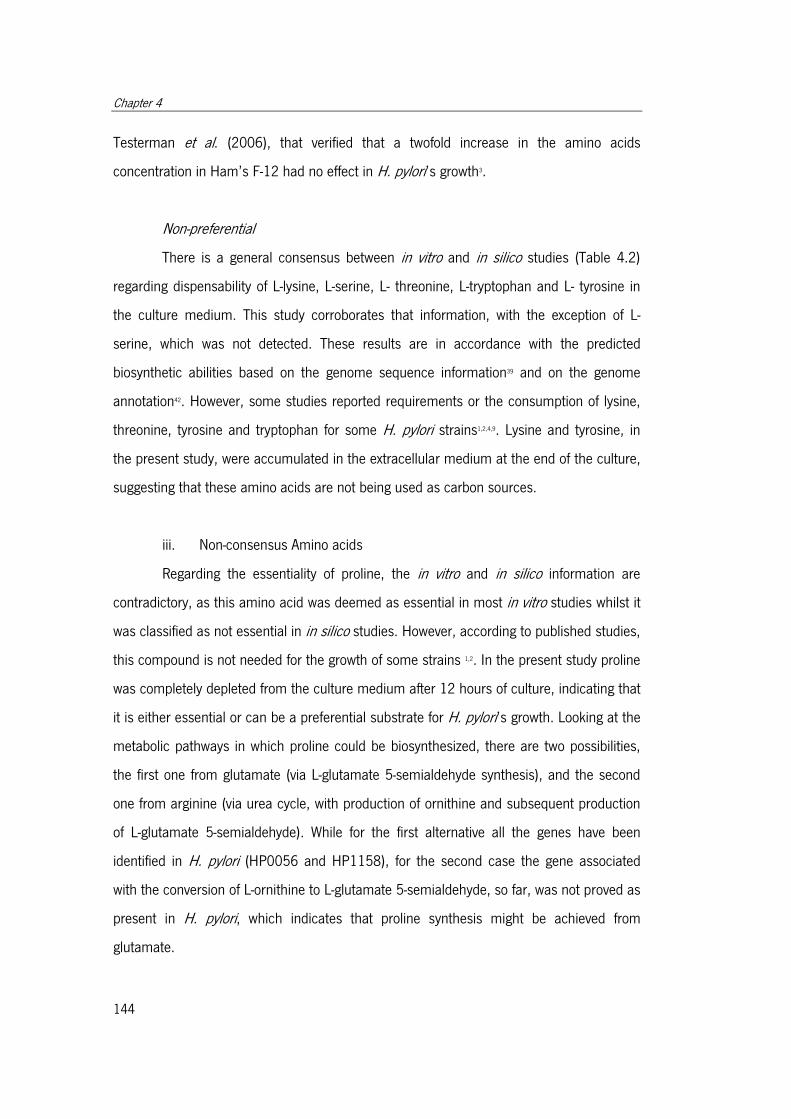
Chapter 4
144
Testerman et al. (2006), that verified that a twofold increase in the amino acids
concentration in Ham’s F-12 had no effect in H. pylori’s growth3.
Non-preferential
There is a general consensus between in vitro and in silico studies (Table 4.2)
regarding dispensability of L-lysine, L-serine, L- threonine, L-tryptophan and L- tyrosine in
the culture medium. This study corroborates that information, with the exception of L-
serine, which was not detected. These results are in accordance with the predicted
biosynthetic abilities based on the genome sequence information39 and on the genome
annotation42. However, some studies reported requirements or the consumption of lysine,
threonine, tyrosine and tryptophan for some H. pylori strains1,2,4,9. Lysine and tyrosine, in
the present study, were accumulated in the extracellular medium at the end of the culture,
suggesting that these amino acids are not being used as carbon sources.
iii. Non-consensus Amino acids
Regarding the essentiality of proline, the in vitro and in silico information are
contradictory, as this amino acid was deemed as essential in most in vitro studies whilst it
was classified as not essential in in silico studies. However, according to published studies,
this compound is not needed for the growth of some strains 1,2. In the present study proline
was completely depleted from the culture medium after 12 hours of culture, indicating that
it is either essential or can be a preferential substrate for H. pylori’s growth. Looking at the
metabolic pathways in which proline could be biosynthesized, there are two possibilities,
the first one from glutamate (via L-glutamate 5-semialdehyde synthesis), and the second
one from arginine (via urea cycle, with production of ornithine and subsequent production
of L-glutamate 5-semialdehyde). While for the first alternative all the genes have been
identified in H. pylori (HP0056 and HP1158), for the second case the gene associated
with the conversion of L-ornithine to L-glutamate 5-semialdehyde, so far, was not proved as
present in H. pylori, which indicates that proline synthesis might be achieved from
glutamate.
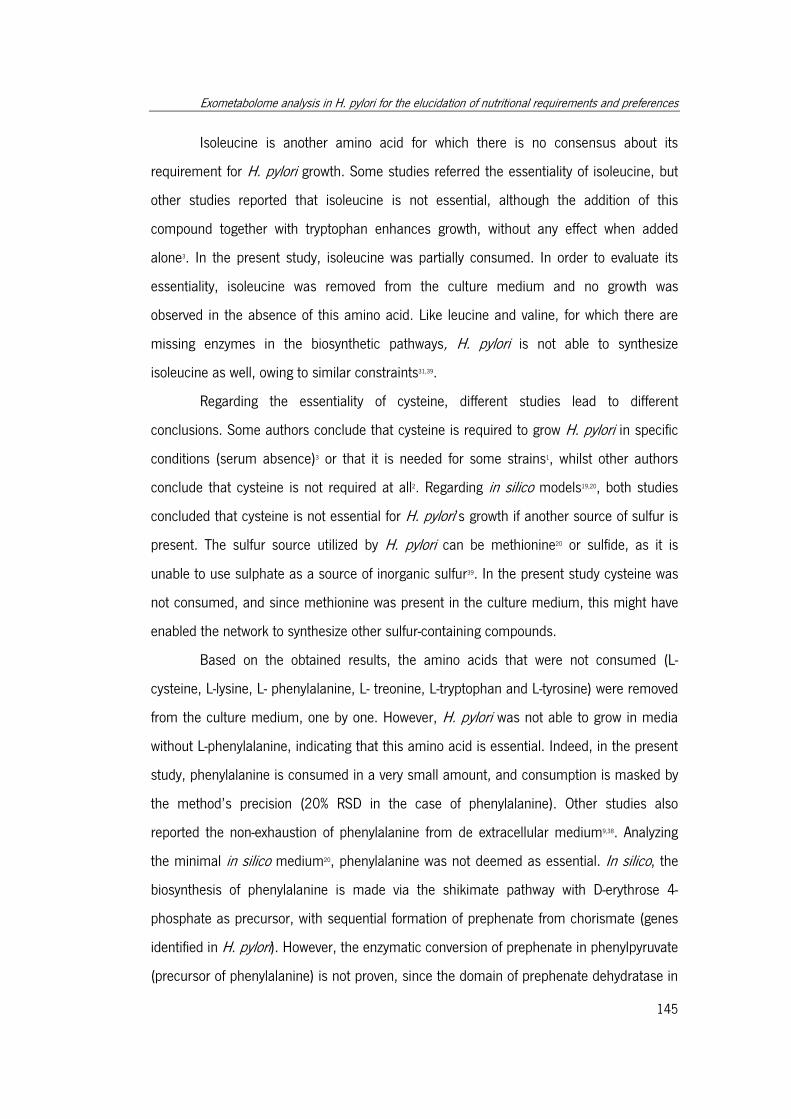
Exometabolome analysis in H. pylori for the elucidation of nutritional requirements and preferences
145
Isoleucine is another amino acid for which there is no consensus about its
requirement for H. pylori growth. Some studies referred the essentiality of isoleucine, but
other studies reported that isoleucine is not essential, although the addition of this
compound together with tryptophan enhances growth, without any effect when added
alone3. In the present study, isoleucine was partially consumed. In order to evaluate its
essentiality, isoleucine was removed from the culture medium and no growth was
observed in the absence of this amino acid. Like leucine and valine, for which there are
missing enzymes in the biosynthetic pathways, H. pylori is not able to synthesize
isoleucine as well, owing to similar constraints31,39.
Regarding the essentiality of cysteine, different studies lead to different
conclusions. Some authors conclude that cysteine is required to grow H. pylori in specific
conditions (serum absence)3 or that it is needed for some strains1, whilst other authors
conclude that cysteine is not required at all2. Regarding in silico models19,20, both studies
concluded that cysteine is not essential for H. pylori’s growth if another source of sulfur is
present. The sulfur source utilized by H. pylori can be methionine20 or sulfide, as it is
unable to use sulphate as a source of inorganic sulfur39. In the present study cysteine was
not consumed, and since methionine was present in the culture medium, this might have
enabled the network to synthesize other sulfur-containing compounds.
Based on the obtained results, the amino acids that were not consumed (L-
cysteine, L-lysine, L- phenylalanine, L- treonine, L-tryptophan and L-tyrosine) were removed
from the culture medium, one by one. However, H. pylori was not able to grow in media
without L-phenylalanine, indicating that this amino acid is essential. Indeed, in the present
study, phenylalanine is consumed in a very small amount, and consumption is masked by
the method’s precision (20% RSD in the case of phenylalanine). Other studies also
reported the non-exhaustion of phenylalanine from de extracellular medium9,38. Analyzing
the minimal in silico medium20, phenylalanine was not deemed as essential. In silico, the
biosynthesis of phenylalanine is made via the shikimate pathway with D-erythrose 4-
phosphate as precursor, with sequential formation of prephenate from chorismate (genes
identified in H. pylori). However, the enzymatic conversion of prephenate in phenylpyruvate
(precursor of phenylalanine) is not proven, since the domain of prephenate dehydratase in
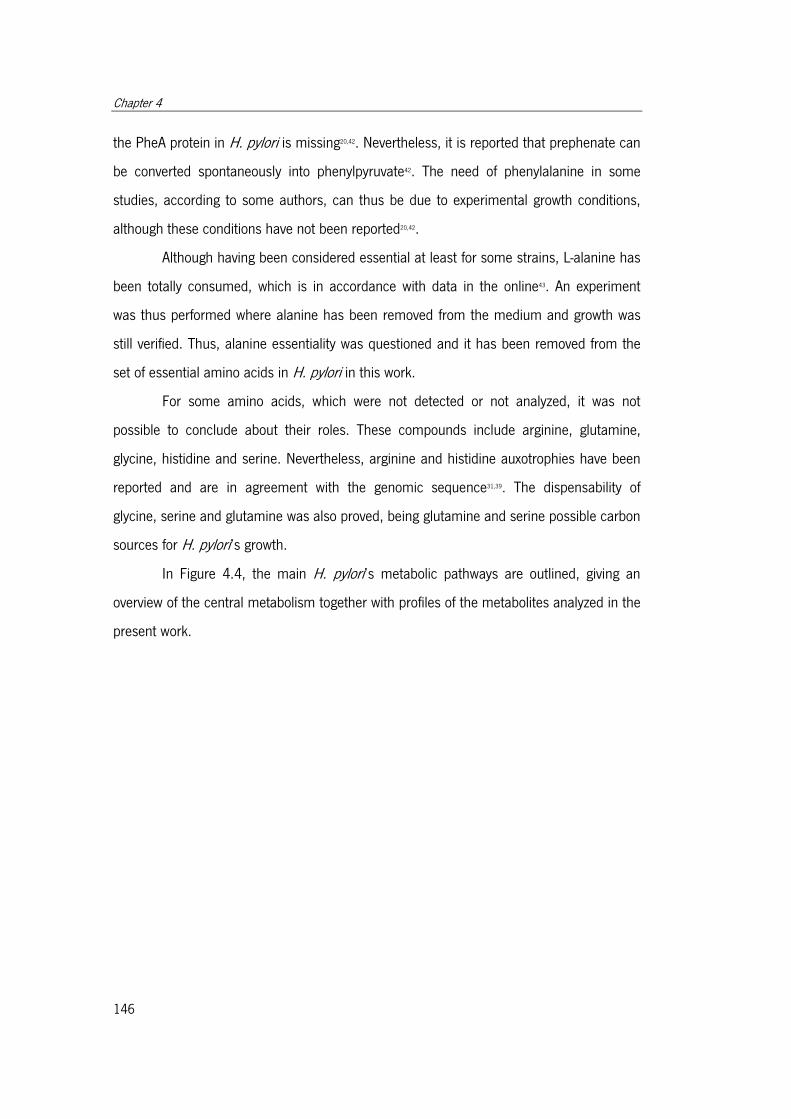
Chapter 4
146
the PheA protein in H. pylori is missing20,42. Nevertheless, it is reported that prephenate can
be converted spontaneously into phenylpyruvate42. The need of phenylalanine in some
studies, according to some authors, can thus be due to experimental growth conditions,
although these conditions have not been reported20,42.
Although having been considered essential at least for some strains, L-alanine has
been totally consumed, which is in accordance with data in the online43. An experiment
was thus performed where alanine has been removed from the medium and growth was
still verified. Thus, alanine essentiality was questioned and it has been removed from the
set of essential amino acids in H. pylori in this work.
For some amino acids, which were not detected or not analyzed, it was not
possible to conclude about their roles. These compounds include arginine, glutamine,
glycine, histidine and serine. Nevertheless, arginine and histidine auxotrophies have been
reported and are in agreement with the genomic sequence31,39. The dispensability of
glycine, serine and glutamine was also proved, being glutamine and serine possible carbon
sources for H. pylori’s growth.
In Figure 4.4, the main H. pylori’s metabolic pathways are outlined, giving an
overview of the central metabolism together with profiles of the metabolites analyzed in the
present work.

Exometabolome analysis in H. pylori for the elucidation of nutritional requirements and preferences
147
dhap g3p
ac
pep
accoa
pyr
0
50
100
150
0 10 20 30
Pyruvate
Pentose PhosphatePathway
Entner - DoudoroffPathway
etohcis-acon
icit
succ-coa
mal
fum
oaa
akg
lac
asp
glx
asn
glu gln
cys
ala
gly
tyr
thr
pro
ser
phe
cit
succ
arg
orn
trp
050
100150200250300350
0 10 20 30
Succinate
0
50
100
0 10 20 30
Lactate
0
50
100
0 10 20 30
Citrate
0
50
100
0 20 40 60 80
Alanine
0
50
100
150
0 20 40 60 80
Asparagine
chor
0
50
100
150
200
0 10 20 30 40 50
Tryptophan
0
50
100
150
0 10 20 30 40 50
Phenylalanine
0
50
100
150
200
250
300
0 10 20 30 40 50
Tyrosine
0
50
100
150
200
0 10 20 30 40 50
Threonine
0
50
100
150
0 10 20 30 40 50
Proline
0
50
100
0 10 20 30 40 50
Aspartate
0
50
100
150
200
250
0 10 20 30 40 50
Cysteine
0
50
100
0 10 20 30 40 50
Isoleucine
0
50
100
0 10 20 30 40 50
Leucine
0
50
100
0 10 20 30 40 50
Methionine
0
50
100
0 10 20 30 40 50
Valine
0
50
100
150
200
250
300
0 10 20 30 40 50
Lysine 0
50
100
0 10 20 30 40 50
Glutamate
lys
Glucose
g6p
f6p
f16bp
0
50
100
150
0 10 20 30 40 50
Glucose
0
500
1000
1500
2000
0 10 20 30 40 50
Acetate
e4p
for
3pg
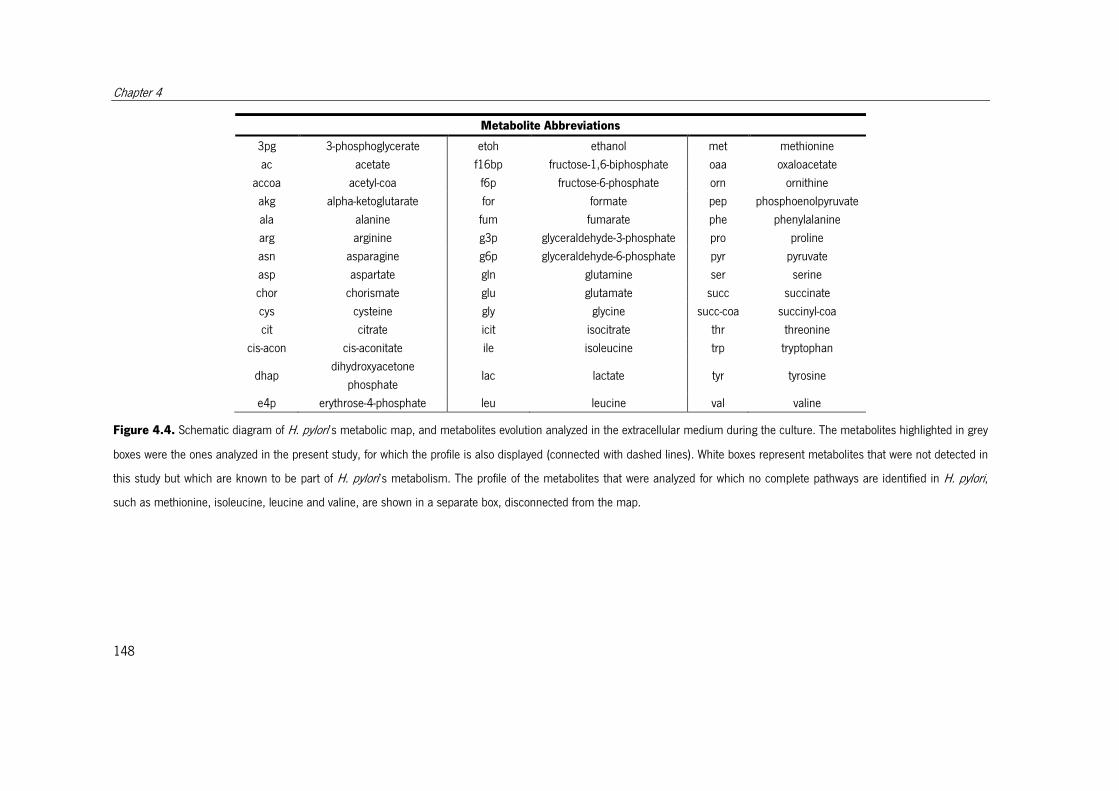
Chapter 4
148
Metabolite Abbreviations
3pg 3-phosphoglycerate etoh ethanol met methionine
ac acetate f16bp fructose-1,6-biphosphate oaa oxaloacetate
accoa acetyl-coa f6p fructose-6-phosphate orn ornithine
akg alpha-ketoglutarate for formate pep phosphoenolpyruvate
ala alanine fum fumarate phe phenylalanine
arg arginine g3p glyceraldehyde-3-phosphate pro proline
asn asparagine g6p glyceraldehyde-6-phosphate pyr pyruvate
asp aspartate gln glutamine ser serine
chor chorismate glu glutamate succ succinate
cys cysteine gly glycine succ-coa succinyl-coa
cit citrate icit isocitrate thr threonine
cis-acon cis-aconitate ile isoleucine trp tryptophan
dhap dihydroxyacetone
phosphate lac lactate tyr tyrosine
e4p erythrose-4-phosphate leu leucine val valine
Figure 4.4. Schematic diagram of H. pylori’s metabolic map, and metabolites evolution analyzed in the extracellular medium during the culture. The metabolites highlighted in grey
boxes were the ones analyzed in the present study, for which the profile is also displayed (connected with dashed lines). White boxes represent metabolites that were not detected in
this study but which are known to be part of H. pylori’s metabolism. The profile of the metabolites that were analyzed for which no complete pathways are identified in H. pylori,
such as methionine, isoleucine, leucine and valine, are shown in a separate box, disconnected from the map.
Exometabolome analysis in H. pylori for the elucidation of nutritional requirements and preferences
149
4.5.2. Metabolic model simulations
The simulations performed using the most updated genome scale metabolic
model20 were based on the environmental conditions used in vitro. The output of each
simulation performed was the predicted biomass (h-1) and the secreted metabolites (Table
4.1 and suplementary material E1 (electronic version)).Concerning the performed
simulations, a twofold increment in the predicted biomass was observed when the Ham’s
F-12 medium used was simulated, comparing with the conditions provided by the model
(in silico minimal medium) (Table 4.1 simulation 2). Even though the addition of some
organic acids (citrate, lactate and succinate) (simulations 3-6) to the in silico simulations
did not lead to an increase in the predicted biomass, the effect of organic acids was
observed in the in silico excreted metabolites, increasing the excretion of acetate. When
pyruvate was removed from the in silico environmental conditions, a slight decrease in
biomass was observed (simulation 7), showing that pyruvate has an effect on in silico H.
pylori’s growth and is being used as a carbon and energy source, as opposed to the other
organic acids tested. The existence of a mixed-acid fermentation pathway in H. pylori was
proved in vitro, with accumulation of acetate and formate as metabolic products from
pyruvate32. The succinate formation from pyruvate was also reported in vitro, suggesting
the incorporation of the carbon derived from pyruvate into the Krebs cycle32. An increase in
acetate and succinate production was also predicted when pyruvate is present on in silico
medium (simulation 7 compared with simulation 3).
Additionally, when glucose was removed from the in silico environmental
conditions (simulation 8) a decrease in the biomass was observed. In fact, as previously
discussed, glucose is not preferred or required for H. pylori’s growth, but in the metabolic
model glucose is being used when present in culture medium. An increase of in silico
acetate excretion was also observed in the presence of glucose. Additionally, lactate and
glucose are contributing to the in silico succinate formation.
When the amino acids that were not in vitro consumed (cysteine, tryptophan,
tyrosine, phenylalanine, threonine and lysine) were individually removed from
environmental conditions (simulations 8-14), no difference in the predicted biomass was
Chapter 4
150
observed, with the exception of threonine. When the aforementioned amino acids were
removed from the in vitro medium, no effect on the growth was observed as well, with the
exception of phenylalanine, which showed to be essential for H. pylori under the in vitro
used conditions, as already discussed. Furthermore, when those amino acids were
removed together from the environmental conditions (simulation 15), a remarkable
decrease on the predicted biomass was observed, becoming more pronounced when
glucose is also removed (simulation 16) from the in silico medium.
As outlined by other authors, amino acids are important sources of carbon and
nitrogen for H. pylori. The main metabolic products reported from amino acids
consumption are acetate, formate, succinate and lactate31, although in the performed in
silico simulations lactate was not secreted into the culture medium, and formate was only
secreted with the minimal medium suggested by Thiele et al. (2006)20. In present study,
formate was not detected in the extracellular medium, while lactate, although being
detected, it is not possible to conclude if was or not secreted, since it was present in the
culture medium. Acetate and succinate were detected, with a 3-fold increase of succinate
in the extracellular medium observed at 4 hours of culture, which can be related to amino
acids and pyruvate consumption and the incorporation of carbon into the Krebs cycle.
Taking together the in vitro and in silico results it can be inferred that amino acids
are being used as the preferred carbon sources, while organic acids are being consumed
but are not preferential.
In addition, when the in silico prediction for biomass maximization using Ham’s F-
12 medium (simulation 2) is compared with in vitro obtained results, the predicted
biomass (µ=1.593 h-1) is far from the biomass achieved in vitro (µ=0.163 h-1). Thereby, an
adjustment of the existing genomic scale metabolic model is needed to minimize the
differences between the in silico predictions and in vitro results.
Exometabolome analysis in H. pylori for the elucidation of nutritional requirements and preferences
151
4.6. Conclusions
In the present study, the suggestion made by other authors concerning the non-
preference of glucose as a carbon source by H. pylori was corroborated. According to the
obtained results and previous studies, some aminoacids are absolutely required, namely,
L-arginine, L- histidine, L-isoleucine, L-leucine, L-methionine L-phenylalanine and L-valine.
Some aminoacids for which there was no consensus between in vitro or in silico data,
such as phenylalanine and isoleucine, were proved to be essential for H. pylori 26695
growing under the conditions used. Regarding preferences and possible carbon sources,
aspartate, glutamate, proline and alanine are potentially preferred by H. pylori, since they
were completely consumed in the mentioned order. Organic acids were not the preferred
carbon sources, and, among the identified compounds, pyruvate seems to be the
preferred one.
The present work provides a review on the existing experimental data about amino
acids requirements and makes a comparison with in silico data, revealing discrepancies
between in vitro and in silico predicted metabolic capabilities. At the same time, as far as
we know, this is the first metabolomics approach applied to H. pylori growing in vitro under
optimized environmental culture conditions and with metabolite analysis along time,
revealing the metabolic behavior along the different growth phases. It is also important to
highlight that the present in vitro results were obtained without strain adaptation to the
culture medium, with fetal bovine serum. Moreover, some of the identified discrepancies
among in vitro results could be related with the strains used, culture conditions or even the
experimental procedures used. The data presented here will be very useful to adjust and
rationalize the culture medium in order to obtain a more defined medium, that could be
used to validate a genome-scale metabolic model reconstruction.

Chapter 4
152
4.7. References
1. Nedenskov, P. Nutritional requirements for growth of Helicobacter pylori. Appl. Environ.
Microbiol. 60, 3450–3453 (1994).
2. Reynolds, D. J. & Penn, C. W. Characteristics of Helicobacter pylori growth in a defined
medium and determination of its amino acid requirements. Microbiology 140, 2649–
2956 (1994).
3. Testerman, T. L., Conn, P. B., Mobley, H. L. T. & McGee, D. J. Nutritional requirements
and antibiotic resistance patterns of Helicobacter species in chemically defined media. J.
Clin. Microbiol. 44, 1650–1658 (2006).
4. Vartanova, N. O., Arzumanyan, V. G., Serdyuk, O. A. & Temper, R. M. Creation of a New
Synthetic Medium for Culturing Helicobacter Pylori. Bull. Exp. Biol. Med. 139, 580–584
(2005).
5. Douraghi, M. et al. Comparative evaluation of three supplements for Helicobacter pylori
growth in liquid culture. Curr. Microbiol. 60, 254–262 (2010).
6. Mendz, G. L., Hazell, S. L. & Burns, B. P. Glucose utilization and lactate production by
Helicobacter pylori. J. Gen. Microbiol. 139, 3023–3028 (1993).
7. Chalk, P. A., Roberts, A. D. & Blows, W. M. Metabolism of pyruvate and glucose by intact
cells of Helicobacter pylori studied by 13C NMR spectroscopy. Microbiology 140, 2085–
2092 (1994).
8. Kelly, D. J. The physiology and metabolism of Campylobacter jejuni and Helicobacter
pylori. J. Appl. Microbiol. Symp. Suppl. 90, 16S–24S (2001).
9. Mendz, G. L. & Hazell, S. L. Aminoacid Utilization by Helicobacter pylori. Int. J. Biochem.
Cell Biol. 27, 1085–1093 (1995).
10. Nielsen, J. in Metabolome Anal. - An Introd. (Villas-Bôas, S. G., Roessner, U., Hansen, M.
A. E., Smedsgaard, J. & Nielsen, J.) 310 (John Wiley & Sons, Inc, 2007).
11. Oliver, S. G., Winson, M. K., Kell, D. B. & Baganz, F. Systematic functional analysis of the
yeast genome. Trends Biotechnol. 16, 373–378 (1998).
12. Nielsen, J. & Oliver, S. The next wave in metabolome analysis. Trends Biotechnol. 23,
544–6 (2005).
Exometabolome analysis in H. pylori for the elucidation of nutritional requirements and preferences
153
13. Carneiro, S., Villas-bôas, S. G., Rocha, I. & Ferreira, E. C. Applying a metabolic footprinting
approach to characterize the impact of the recombinant protein production in Escherichia
coli. Adv. Bioinformatics AISC 74, 193–200 (2010).
14. Mo, M. L., Palsson, B. O. & Herrgård, M. J. Connecting extracellular metabolomic
measurements to intracellular flux states in yeast. BMC Syst. Biol. 3, 1–17 (2009).
15. Kell, D. B. et al. Metabolic footprinting and Systems Biology: The medium is the message.
Nat. Rev. Microbiol. 1–9 (2005). doi:10.1038/nrmicro1177
16. Rocha, I., Förster, J. & Nielsen, J. in Methods Mol. Biol. vol. 416 Gene Essentiality (Gerdes,
S. Y. & Osterman, A. L.) 416, 409–433 (Humana Press Inc., 2007).
17. Durot, M., Bourguignon, P.-Y. & Schachter, V. Genome-scale models of bacterial
metabolism: reconstruction and applications. FEMS Microbiol. Rev. 33, 164–190 (2009).
18. Rocha, I. et al. OptFlux : an open-source software platform for in silico metabolic
engineering. BMC Syst. Biol. 4, 1–12 (2010).
19. Schilling, C. H. et al. Genome-scale metabolic model of Helicobacter pylori 26695. J.
Bacteriol. 184, 4582–4593 (2002).
20. Thiele, I., Vo, T. D., Price, N. D. & Palsson, B. Ø. Expanded Metabolic Reconstruction of
Helicobacter pylori ( iIT341 GSM / GPR ): an In Silico Genome-Scale Characterization of
Single- and Double-Deletion Mutants. J. Bacteriol. 187, 5818–5830 (2005).
21. Testerman, T. L., Gee, D. J. M. C. & Mobley, H. L. T. Helicobacter pylori growth and urease
detection in the chemically defined medium Ham ’ s F-12 nutrient mixture. J. Clin.
Microbiol. 39, 3842–3850 (2001).
22. Bessa, L. J., Correia, D. M., Cellini, L., Azevedo, N. F. & Rocha, I. Optimization of culture
conditions to improve Helicobacter pylori growth in Ham’s F-12 medium by response
surface methodology. Int. J. Immunopathol. Pharmacol. 25, 901–909 (2012).
23. Smart, K. F., Aggio, R. B. M., Van Houtte, J. R. & Villas-Bôas, S. G. Analytical platform for
metabolome analysis of microbial cells using methyl chloroformate derivatization followed
by gas chromatography-mass spectrometry. Nat. Protoc. 5, 1709–1729 (2010).
24. Saeed, A. I. et al. TM4: a free, open-source system for microarray data management and
analysis. Biotechniques 34, 374–378 (2003).
25. Orth, J. D., Thiele, I. & Palsson, B. Ø. What is flux balance analysis? Nat. Biotechnol. 28,
245–248 (2011).

Chapter 4
154
26. Carneiro, S., Villas-Bôas, S. G., Ferreira, E. C. & Rocha, I. Metabolic footprint analysis of
recombinant Escherichia coli strains during fed-batch fermentations. Mol. Biosyst. 7, 899–
910 (2011).
27. Baker, H., De Angelis, B. & Frank, O. Vitamins and other metabolites in various sera
commonly used for cell culturing. Experientia 44, 1007–1010 (1988).
28. Brunner, D. et al. Serum-free cell culture: the serum-free media interactive online
database. ALTEX 27, 53–62 (2010).
29. Koek, M. M. et al. Metabolic profiling of ultrasmall sample volumes with GC/MS: from
microliter to nanoliter samples. Anal. Chem. 82, 156–162 (2010).
30. Chang, H. T. et al. Kinetics of substrate oxidation by whole cells and cell membranes of
Helicobacter pylori. FEMS Microbiol. Lett. 129, 33–38 (1995).
31. Marais, A., Mendz, G. L., Hazell, S. L. & Mégraud, F. Metabolism and genetics of
Helicobacter pylori: the genome era. Microbiol. Mol. Biol. Rev. 63, 642–674 (1999).
32. Mendz, G. L., Hazell, S. L. & van Gorkom, L. Pyruvate metabolism in Helicobacter pylori.
Arch. Microbiol. 162, 187–192 (1994).
33. Mendz, G. L. & Hazell, S. L. Evidence for a pentose phosphate pathway in Helicobacter
pylori. FEMS Microbiol. Lett. 84, 331–336 (1991).
34. Mendz, G. L., Hazell, S. L. & Burns, B. P. The Entner-Doudoroff pathway in Helicobacter
pylori. Arch. Biochem. Biophys. 312, 349–356 (1994).
35. Mendz, G. L., Burns, B. P. & Hazell, S. L. Characterisation of glucose transport in
Helicobacter pylori. Biochim. Biophys. Acta 1244, 269–276 (1995).
36. Psakis, G. et al. The sodium-dependent D-glucose transport protein of Helicobacter pylori.
Mol. Microbiol. 71, 391–403 (2009).
37. Tomb, J.-F. et al. The complete genome sequence of the gastric pathogen Helicobacter
pylori. Nature 388, 539–547 (1997).
38. Stark, R. M., Suleiman, M. S., Hassan, I. J., Greenman, J. & Millar, M. R. Amino acid
utilisation and deamination of glutamine and asparagine by Helicobacter pylori. J. Med.
Microbiol. 46, 793–800 (1997).
39. Doig, P. et al. Helicobacter pylori physiology predicted from genomic comparison of two
strains. Microbiol. Mol. Biol. Rev. 63, 675–707 (1999).
40. Leduc, D., Gallaud, J., Stingl, K. & Reuse, H. De. Coupled amino acid deamidase-transport
systems essential for Helicobacter pylori colonization. Infect. Imunity 78, 2782–2792
(2010).

Exometabolome analysis in H. pylori for the elucidation of nutritional requirements and preferences
155
41. Shibayama, K. et al. Metabolism of glutamine and glutathione via g-glutamyltranspeptidase
and glutamate transport in Helicobacter pylori: possible significance in the pathophysiology
of the organism. Mol. Microbiol. 64, 396–406 (2007).
42. Boneca, I. G. A revised annotation and comparative analysis of Helicobacter pylori
genomes. Nucleic Acids Res. 31, 1704–1714 (2003).
43. Caspi, R. et al. The MetaCyc database of metabolic pathways and enzymes and the BioCyc
collection of pathway/genome databases. Nucleic Acids Res. 40, D742–D753 (2012).
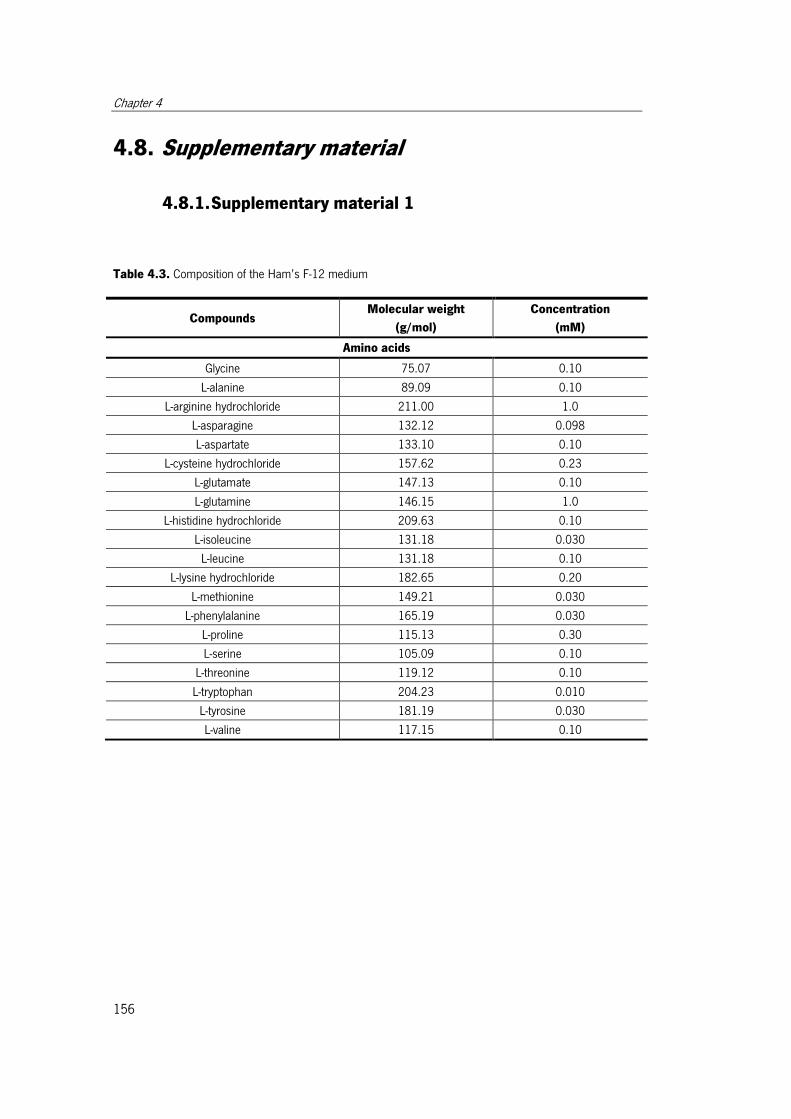
Chapter 4
156
4.8. Supplementary material
4.8.1. Supplementary material 1
Table 4.3. Composition of the Ham’s F-12 medium
Compounds Molecular weight
(g/mol)
Concentration
(mM)
Amino acids
Glycine 75.07 0.10
L-alanine 89.09 0.10
L-arginine hydrochloride 211.00 1.0
L-asparagine 132.12 0.098
L-aspartate 133.10 0.10
L-cysteine hydrochloride 157.62 0.23
L-glutamate 147.13 0.10
L-glutamine 146.15 1.0
L-histidine hydrochloride 209.63 0.10
L-isoleucine 131.18 0.030
L-leucine 131.18 0.10
L-lysine hydrochloride 182.65 0.20
L-methionine 149.21 0.030
L-phenylalanine 165.19 0.030
L-proline 115.13 0.30
L-serine 105.09 0.10
L-threonine 119.12 0.10
L-tryptophan 204.23 0.010
L-tyrosine 181.19 0.030
L-valine 117.15 0.10
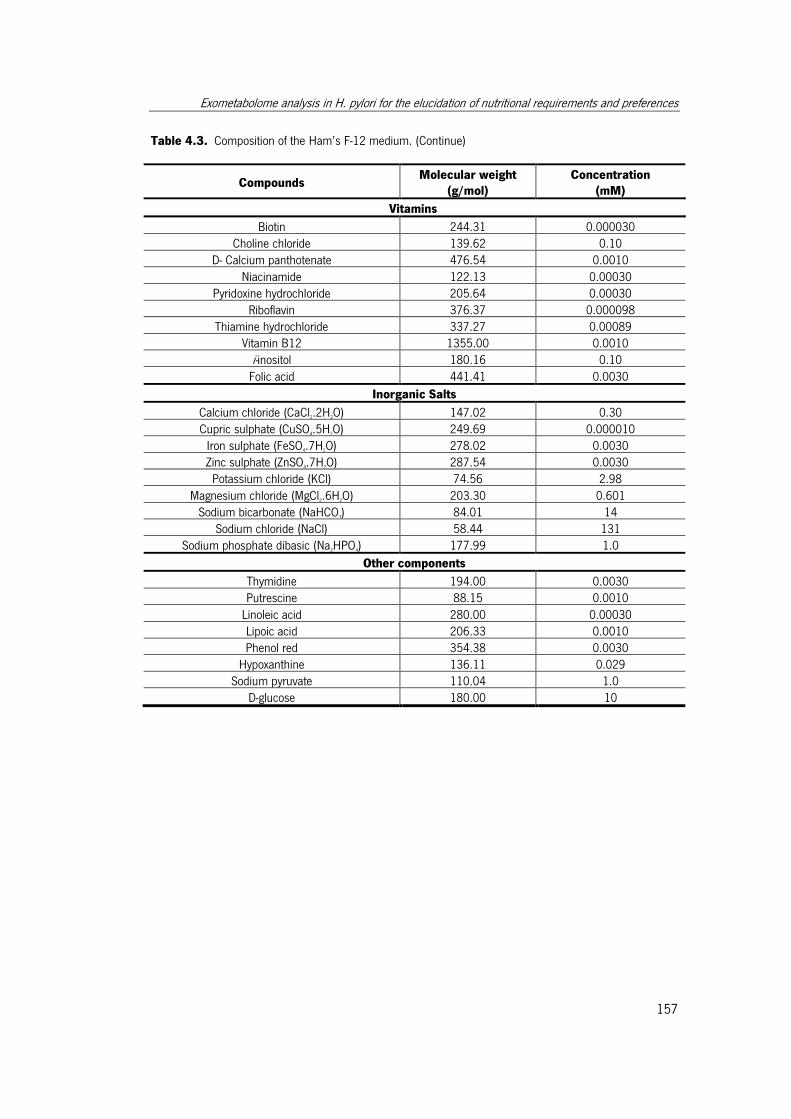
Exometabolome analysis in H. pylori for the elucidation of nutritional requirements and preferences
157
Table 4.3. Composition of the Ham’s F-12 medium. (Continue)
Compounds Molecular weight
(g/mol)
Concentration
(mM)
Vitamins
Biotin 244.31 0.000030
Choline chloride 139.62 0.10
D- Calcium panthotenate 476.54 0.0010
Niacinamide 122.13 0.00030
Pyridoxine hydrochloride 205.64 0.00030
Riboflavin 376.37 0.000098
Thiamine hydrochloride 337.27 0.00089
Vitamin B12 1355.00 0.0010
i-inositol 180.16 0.10
Folic acid 441.41 0.0030
Inorganic Salts
Calcium chloride (CaCl2.2H2O) 147.02 0.30
Cupric sulphate (CuSO4.5H2O) 249.69 0.000010
Iron sulphate (FeSO4.7H2O) 278.02 0.0030
Zinc sulphate (ZnSO4.7H2O) 287.54 0.0030
Potassium chloride (KCl) 74.56 2.98
Magnesium chloride (MgCl2.6H2O) 203.30 0.601
Sodium bicarbonate (NaHCO3) 84.01 14
Sodium chloride (NaCl) 58.44 131
Sodium phosphate dibasic (Na2HPO4) 177.99 1.0
Other components
Thymidine 194.00 0.0030
Putrescine 88.15 0.0010
Linoleic acid 280.00 0.00030
Lipoic acid 206.33 0.0010
Phenol red 354.38 0.0030
Hypoxanthine 136.11 0.029
Sodium pyruvate 110.04 1.0
D-glucose 180.00 10
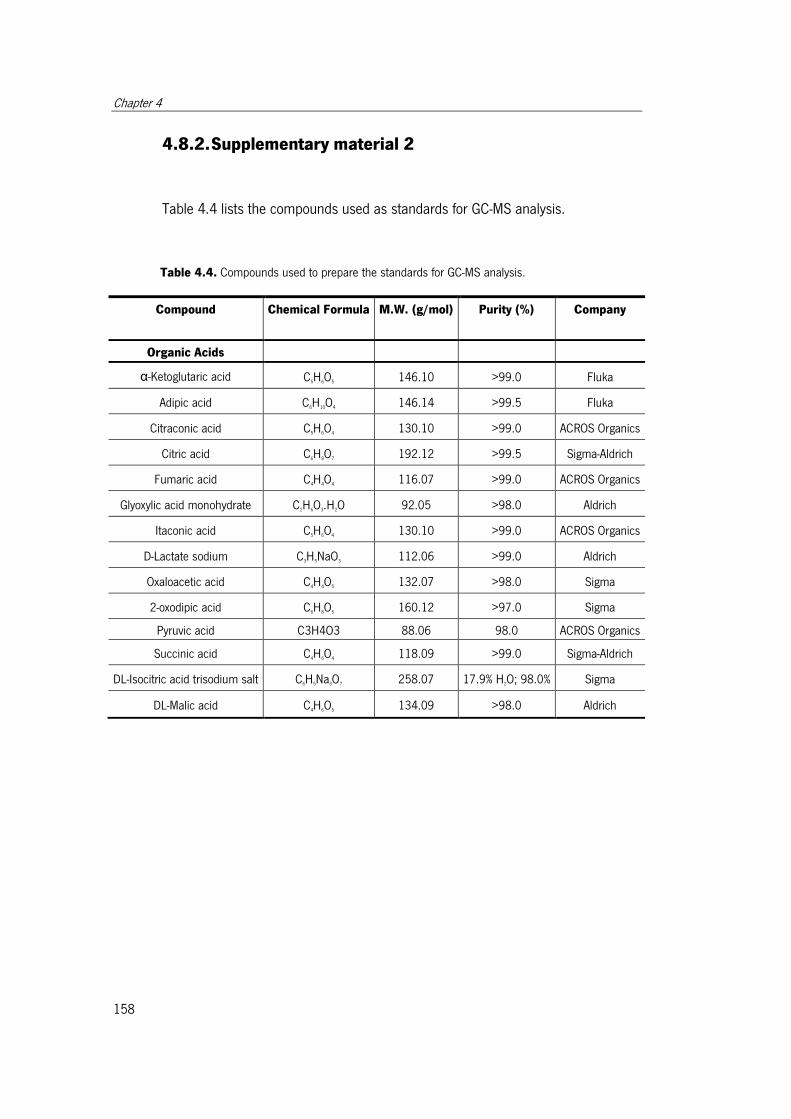
Chapter 4
158
4.8.2. Supplementary material 2
Table 4.4 lists the compounds used as standards for GC-MS analysis.
Table 4.4. Compounds used to prepare the standards for GC-MS analysis.
Compound Chemical Formula M.W. (g/mol) Purity (%) Company
Organic Acids
α-Ketoglutaric acid C5H6O5 146.10 >99.0 Fluka
Adipic acid C6H10O4 146.14 >99.5 Fluka
Citraconic acid C5H6O4 130.10 >99.0 ACROS Organics
Citric acid C6H8O7 192.12 >99.5 Sigma-Aldrich
Fumaric acid C4H4O4 116.07 >99.0 ACROS Organics
Glyoxylic acid monohydrate C2H6O3.H2O 92.05 >98.0 Aldrich
Itaconic acid C5H6O4 130.10 >99.0 ACROS Organics
D-Lactate sodium C3H5NaO3 112.06 >99.0 Aldrich
Oxaloacetic acid C4H4O5 132.07 >98.0 Sigma
2-oxodipic acid C6H8O5 160.12 >97.0 Sigma
Pyruvic acid C3H4O3 88.06 98.0 ACROS Organics
Succinic acid C4H6O4 118.09 >99.0 Sigma-Aldrich
DL-Isocitric acid trisodium salt C6H5Na3O7 258.07 17.9% H2O; 98.0% Sigma
DL-Malic acid C4H6O5 134.09 >98.0 Aldrich

Exometabolome analysis in H. pylori for the elucidation of nutritional requirements and preferences
159
Table 4.4. Compounds used to prepare the standards for GC-MS analysis. (Continue)
Compound Chemical Formula M.W. (g/mol) Purity (%) Company
Amino Acids
Glycine C2H
5NO
2 75.07 >99.0% Biochemika. Fluka
L-Aspartic acid C4H
7NO
4 133.10 >99.0% Sigma-Ultra. Sigma
L-Glutamic acid C5H
9NO
4 147.13 >99.0% Sigma
L-Alanine C3H
7NO
2 89.09 >99.5% BioUltra. Fluka
L-Arginine C6H
14N
4O
2 174.20 >99.5% Biochemika. Fluka
L-Asparagine anhydrous C4H
8N
2O
3 132.12 >99.5% BioUltra. Sigma
L-Cysteine hydrochloride anhydrous C3H
7NO
2.S.HCl 157.62 >99.0% Fluka Analytical
L-Phenylalanine C9H
14NO
2 165.19 >99.0% Biochemika. Fluka
L-Glutamine C5H
10N
2O
3 146.15 >99.0% Sigma
L-Histidine C6H
9N
3O
2 155.16 >99.5% Biochemika. Fluka
L-Isoleucine C6H
13NO
2 131.18 >99.5% Biochemika. Fluka
L-Leucine C6H
13NO
2 131.18 >99.0% Aldrich
L-Lysine Monohydrochloride C6H
14N
2O
2 182.65 No information Sigma
L-Methinonine C5H
11NO
2S 149.21 >99.5% BioUltra. Sigma
L-Proline C5H
9NO
2 115.15 >99.0% Aldrich
L-Serine C3H
7NO
3 105.09 >99.5% Biochemika. Fluka
L-Tyrosine C9H
11NO
3 181.19 >99.0% Sigma-Ultra. Sigma
L-Threonine C4H
9NO
3 119.12 >99.5% Biochemika. Fluka
L-Tryptophan C11H
12N
2O
2 204.23 >98.0% Sigma-Aldrich
L-Valine C5H
11NO
2S 117.15 >99.5% Biochemika. Fluka
L-Alanine- 2,3,3,3-D4 C3H
3D
4NO
2 93.13 98 atom % D ISOTEC
4.8.3. Supplementary material 3
Table 4.5 depicts the mass to charge ratio (m/z) of the molecular ions and major
fragments detected for each compound derivatized with methylchloroformate and analyzed
by GC/MS.

Chapter 4
160
Table 4.5. Mass to charge ratios for the molecular ions and major fragments and retention times for each
compound in the in-house library.
Compound RT Molecular ion Major fragments ions
(min.) (m/z) (m/z)
Organic Acids
2-oxoadipic acid 14.664 188 101,129,59
α-Ketoglutaric acid/2-oxoglutaric acid 13.213 174 115,55,87
Adipic acid 12.557 175 175,114,143
Citraconic acid 10.416 158 127,99
Citric acid 16.495 235 235,143,236
D-Lactate sodium 9.361 104 59,163,177
DL-Isocitric acid trisodium salt 21.361 234 129,157
DL-Malic acid 9.330 162 113,115,85
Fumaric acid 9.354 144 113,85
Glyoxylic acid monohydrate 11.328 106 75,106,62
Itaconic acid 10.329 159 127,126,69,99,159
Oxaloacetic acid 10.848 160 101,69
Pyruvic acid 7.507 102 89,117,57
Succinic acid 9.228 166 115,87,147
Amino Acids
Glycine 11.628 148 148,44,88
L-Alanine 11.275 162 162,102,58
L-arginine Not derivatized
L-Asparagine 16.735 262 187,56,127
L-Aspartic acid 16.521 220 220,128, 160
L-Cysteine 21.145 192 117,192,176
L-Glutamic acid 18.431 234 234,114,174
L-Glutamine 25.200 276 84,219,114
L-Histidine 26.888 285 210,140,85
L-Isoleucine 14.349 204 204,144,205
L-Leucine 14.245 204 204,144,205,58
L-Lysine 26.817 277 142,277
L-Methionine 18.655 222 222,190,162
L-Phenylalanine 20.670 238 238,162,161
L-Proline 15.211 188 128,188,84
L-Serine 15.900 178 178,115,74,118
L-Threonine 15.814 192 192,115,174
L-Tryptophan 34.812 277 130,131
L-Tyrosine 29.410 253 121,236,161,192
L-Valine 13.045 190 190,130,191
L-Alanine – 2, 3, 3, 3 – D4 (Internal standard) 11.181 174 106,166,62
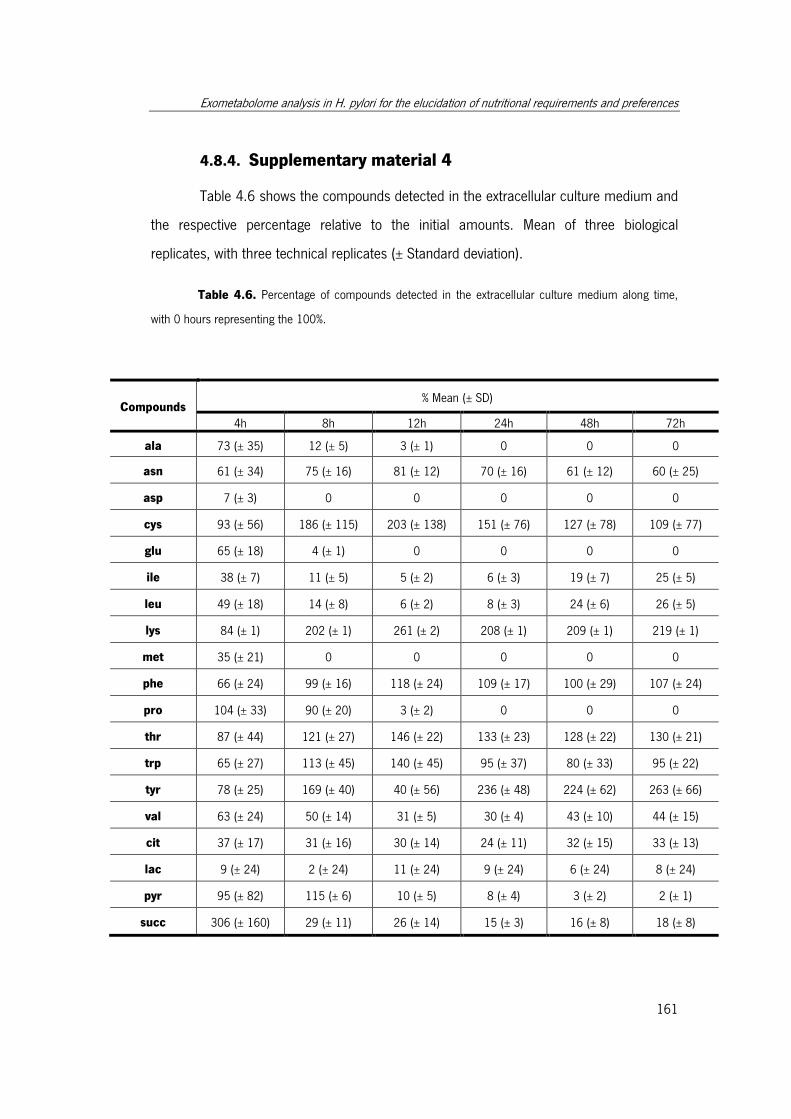
Exometabolome analysis in H. pylori for the elucidation of nutritional requirements and preferences
161
4.8.4. Supplementary material 4
Table 4.6 shows the compounds detected in the extracellular culture medium and
the respective percentage relative to the initial amounts. Mean of three biological
replicates, with three technical replicates (± Standard deviation).
Table 4.6. Percentage of compounds detected in the extracellular culture medium along time,
with 0 hours representing the 100%.
Compounds % Mean (± SD)
4h 8h 12h 24h 48h 72h
ala 73 (± 35) 12 (± 5) 3 (± 1) 0 0 0
asn 61 (± 34) 75 (± 16) 81 (± 12) 70 (± 16) 61 (± 12) 60 (± 25)
asp 7 (± 3) 0 0 0 0 0
cys 93 (± 56) 186 (± 115) 203 (± 138) 151 (± 76) 127 (± 78) 109 (± 77)
glu 65 (± 18) 4 (± 1) 0 0 0 0
ile 38 (± 7) 11 (± 5) 5 (± 2) 6 (± 3) 19 (± 7) 25 (± 5)
leu 49 (± 18) 14 (± 8) 6 (± 2) 8 (± 3) 24 (± 6) 26 (± 5)
lys 84 (± 1) 202 (± 1) 261 (± 2) 208 (± 1) 209 (± 1) 219 (± 1)
met 35 (± 21) 0 0 0 0 0
phe 66 (± 24) 99 (± 16) 118 (± 24) 109 (± 17) 100 (± 29) 107 (± 24)
pro 104 (± 33) 90 (± 20) 3 (± 2) 0 0 0
thr 87 (± 44) 121 (± 27) 146 (± 22) 133 (± 23) 128 (± 22) 130 (± 21)
trp 65 (± 27) 113 (± 45) 140 (± 45) 95 (± 37) 80 (± 33) 95 (± 22)
tyr 78 (± 25) 169 (± 40) 40 (± 56) 236 (± 48) 224 (± 62) 263 (± 66)
val 63 (± 24) 50 (± 14) 31 (± 5) 30 (± 4) 43 (± 10) 44 (± 15)
cit 37 (± 17) 31 (± 16) 30 (± 14) 24 (± 11) 32 (± 15) 33 (± 13)
lac 9 (± 24) 2 (± 24) 11 (± 24) 9 (± 24) 6 (± 24) 8 (± 24)
pyr 95 (± 82) 115 (± 6) 10 (± 5) 8 (± 4) 3 (± 2) 2 (± 1)
succ 306 (± 160) 29 (± 11) 26 (± 14) 15 (± 3) 16 (± 8) 18 (± 8)

Chapter 4
162
4.9. Supplementary material (Electronic version)
Supplementary material E1 - Simulation_iIT341.xlsx
Chapter 5
5. Evaluation of different carbon sources for the
growth of H. pylori 26695 in liquid medium
Daniela M. Correia, Ana Guimarães, Maria João Vieira, Nuno F. Azevedo and Isabel Rocha.
Evaluation of different carbon sources for the growth of H. pylori 26695 in liquid medium.
(To be submitted).


Evaluation of different carbon sources for the growth of H. pylori 26695 in liquid medium
165
5.1. Abstract
Helicobacter pylori is considered to be a fastidious pathogenic organism that
colonizes the human stomach. Like other pathogenic organisms, H. pylori developed
mechanisms and evolved to survive and inhabit in its host, specifically in the human
gastric mucosa.
The gastric environment is a rich medium for H. pylori, with a large variety of
carbon sources available, including amino acids. However, no previous experiments were
conducted to identify the preferred carbon sources for H. pylori growth that could then be
used for designing a minimal medium.
In the present study, H. pylori 26695 was grown using several amino and organic
acids as the main substrates in order to determine which are the preferential carbon
sources. A metabolic footprinting approach was also applied to conclude about substrate
consumption and identify secreted metabolites. Under the conditions used, L-glutamine
was identified as the preferred carbon source for H. pylori 26695 growth, evaluated by the
highest biomass concentration achieved using this substrate and the highest growth rate
obtained. However, L-glutamate allowed to achieve also high growth rates and biomass
concentrations and presented a greater efficiency in terms of the biomass produced per
substrate consumed. In addition, it is now clear that L-glutamine is a substrate for the
production of L- glutamate in H. pylori in the periplasm, being L-glutamate then
transported and catabolized. Therefore, we suggest L-glutamate as the most suitable
carbon source for H. pylori in vitro growth.
Keywords: Helicobacter pylori, carbon sources, nutritional requirements.
Chapter 5
166
5.2. Introduction
Animal tissues contain a variety of nutrients (sugars, amino acids and other
nitrogen-containing compounds), being outstanding sources of nutrients for bacteria1.
Additionally, in the human body, the nutrients needed for bacterial growth are replenished
over time2.
The compounds found in the host environment are used by pathogenic bacteria to
extract the energy, carbon and nitrogen needed to grow and replicate1. Thus, pathogens
have evolved specific mechanisms to access host nutrients and use them by various
specific pathways and uptake systems1,3.
Unfortunately, in host-pathogen interactions, the in vivo metabolism of bacterial
pathogens is not well understood3. In fact, the preferred in vivo carbon sources of a variety
of pathogens persist unidentified and the growth conditions in numerous sites of infections
are poorly defined, hampering the nutritional modeling of infections2.
H. pylori is a pathogenic organism that dwell in the mucous layer of the human
stomach, causing gastric diseases4. H. pylori is known to be adhered to gastric epithelial
cells, next to tight junctions5,6. That particular location gives some advantages to H. pylori,
namely, wash-out prevention from the stomach, favorable pH near the gastric epithelium,
and access to nutrients released by gastric epithelial cells6. The gastric environment is a
rich medium, providing the nutritional requirements for H. pylori growth, with several
possible carbon and nitrogen sources. It is known that H. pylori utilizes amino acids and
uses them as preferred carbon sources7,8. Also, a chemotactic motility in response to
amino acids was reported, with some acting as attractants9,10; however, if this mechanism
contributes to virulence and transmission, beside nutritional acquisition, is still an open
question11.
Gastric juice, which results from the secretion of many gastric glands into the
stomach12, contains amino acids at relative high concentrations. Segawa and coworkers
(1985) were able to identify 15 amino acids in human gastric juice of healthy subjects and
in patients with gastric diseases (gastric ulcer, duodenal ulcer, gastroduodenal ulcers and
gastric cancer)13. D and L-amino acids were also detected in gastric juices of subjects
Evaluation of different carbon sources for the growth of H. pylori 26695 in liquid medium
167
infected with H. pylori, as well as in the gastric juice of uninfected subjects. Among the
detected amino acids, proline, alanine, serine, aspartate and glutamate were detected at
higher concentrations4,12. In addition, increased levels of aromatic amino acids
(phenylalanine, tryptophan and tyrosine) were detected in the gastric juice of patients with
malign gastric lesions when compared to benign gastric lesions14,15. The concentration of
amino acids in the gastric mucous layer is unclear but it is likely that it is approximately
the same as in the gastric juice16. The amino acids present in the gastric juice are derived
in part from the blood plasma amino acid pool and by secretion from the cells of the
gastric mucosa17. Proteolysis, to which proteins are subjected in the stomach by the action
of pepsins, also contribute to the presence of amino acids in the gastric juice 15-17. Some
organic acids were also detected in the gastric juice, such as lactate18, pyruvate, or
citrate19.
Several strategies to grow H. pylori in vitro have been delineated, being the use of
complex media supplemented with growth factors the most common one. Recently, some
liquid media for H. pylori growth were compared, being the defined medium Ham’s F-12
nutrient mixture supplemented with 5% of horse serum the best option, since it gives the
most consistent growth even using a small inoculum size20. Several other chemically
defined or semi-defined media were developed for H. pylori growth with focus on the
determination of amino acids requirements8,21–24. However, in none of these studies the
carbon sources were clearly identified, being various amino acids co-metabolized
simultaneously, together with glucose or pyruvate. Furthermore, there is a lack of
knowledge about the preferential substrate used by H. pylori, with some authors pointing
alanine, arginine, aspartate, asparagine, glutamate, glutamine, proline and serine as the
potential carbon sources7,8. The identification of the preferential in vivo carbon sources and
their use as substrates for H. pylori growth in vitro would result in more reliable growth,
leading to a significant breakthrough in its study by contributing to understand how this
organism lives in the host and delineate new strategies to eradicate it. On the other hand,
it would extend the knowledge about bacterial pathogenesis.
The main goal of the present work was thus to study H. pylori’s potential carbon
sources in order to determine the preferential ones and use the obtained information to
Chapter 5
168
design a culture medium containing only one carbon source that could be used to grow H.
pylori under more defined conditions and thus contribute to understand better the
physiology and metabolism of that pathogenic organism. Also, a metabolic footprinting
strategy was applied in order to determine the consumption and secretion of metabolites
into the culture medium.
5.3. Methods
5.3.1. Culture conditions
Helicobacter pylori 26695 (strain NCTC 12455) was cultivated in Columbia Base
Agar (CBA) (Liofilchem, Italy) supplemented with 5% (v/v) defibrinated horse blood
(Probiologica, Portugal) at 37 °C under microaerophilic conditions (5% O2, 10% CO2, 85%
N2) in a Cell Culture Incubator (Incubator HERAcell 150, Kendro Laboratory, Germany) for
3 days.
An inoculum was prepared in Ham’s F-12 nutrient mixture with glutamine (catalog
no 21765-037, Invitrogen-Gibco, Spain) previously supplemented with 5% of fetal bovine
serum (FBS) (vol/vol) (catalog no 10500-064, origin: South America, Invitrogen-Gibco,
Spain), incubated at 37 °C under 130 rpm of shaking speed (Heidolph Unimax 1010
orbital shaker, Germany) in microaerophilic conditions for approximately 16 h, in order to
reach the exponential phase. Afterwards, cells were harvested by centrifugation (5000 x g,
10 min.), washed twice in phosphate buffer saline solution (PBS) and ressuspended in
culture medium. The initial Optical Density of the culture at 600 nm (OD600) was adjusted
to 0.03-0.06. Each experiment was performed in 100 mL Erlenmeyer flasks with 15 mL of
media with different carbon sources. A single inoculum was used to inoculate all
Erlenmeyer flasks. The initial pH was adjusted to 7.0. The culture was incubated at 37 °C
under 130 rpm of shaking speed under microaerophilic conditions. The experiment was
carried out during 48 hours.
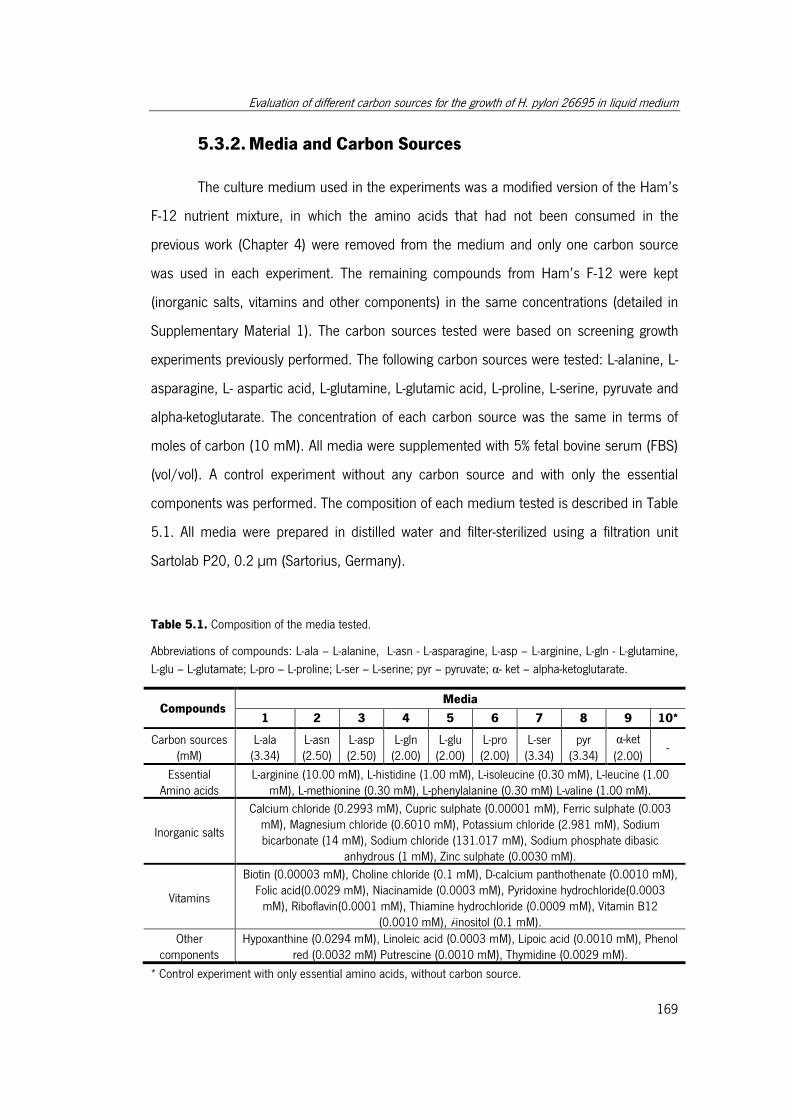
Evaluation of different carbon sources for the growth of H. pylori 26695 in liquid medium
169
5.3.2. Media and Carbon Sources
The culture medium used in the experiments was a modified version of the Ham’s
F-12 nutrient mixture, in which the amino acids that had not been consumed in the
previous work (Chapter 4) were removed from the medium and only one carbon source
was used in each experiment. The remaining compounds from Ham’s F-12 were kept
(inorganic salts, vitamins and other components) in the same concentrations (detailed in
Supplementary Material 1). The carbon sources tested were based on screening growth
experiments previously performed. The following carbon sources were tested: L-alanine, L-
asparagine, L- aspartic acid, L-glutamine, L-glutamic acid, L-proline, L-serine, pyruvate and
alpha-ketoglutarate. The concentration of each carbon source was the same in terms of
moles of carbon (10 mM). All media were supplemented with 5% fetal bovine serum (FBS)
(vol/vol). A control experiment without any carbon source and with only the essential
components was performed. The composition of each medium tested is described in Table
5.1. All media were prepared in distilled water and filter-sterilized using a filtration unit
Sartolab P20, 0.2 µm (Sartorius, Germany).
Table 5.1. Composition of the media tested.
Abbreviations of compounds: L-ala – L-alanine, L-asn - L-asparagine, L-asp – L-arginine, L-gln - L-glutamine,
L-glu – L-glutamate; L-pro – L-proline; L-ser – L-serine; pyr – pyruvate; α- ket – alpha-ketoglutarate.
Compounds Media
1 2 3 4 5 6 7 8 9 10*
Carbon sources (mM)
L-ala (3.34)
L-asn (2.50)
L-asp (2.50)
L-gln (2.00)
L-glu (2.00)
L-pro (2.00)
L-ser (3.34)
pyr (3.34)
α-ket
(2.00) -
Essential Amino acids
L-arginine (10.00 mM), L-histidine (1.00 mM), L-isoleucine (0.30 mM), L-leucine (1.00 mM), L-methionine (0.30 mM), L-phenylalanine (0.30 mM) L-valine (1.00 mM).
Inorganic salts
Calcium chloride (0.2993 mM), Cupric sulphate (0.00001 mM), Ferric sulphate (0.003 mM), Magnesium chloride (0.6010 mM), Potassium chloride (2.981 mM), Sodium bicarbonate (14 mM), Sodium chloride (131.017 mM), Sodium phosphate dibasic
anhydrous (1 mM), Zinc sulphate (0.0030 mM).
Vitamins
Biotin (0.00003 mM), Choline chloride (0.1 mM), D-calcium panthothenate (0.0010 mM), Folic acid(0.0029 mM), Niacinamide (0.0003 mM), Pyridoxine hydrochloride(0.0003
mM), Riboflavin(0.0001 mM), Thiamine hydrochloride (0.0009 mM), Vitamin B12 (0.0010 mM), i-inositol (0.1 mM).
Other components
Hypoxanthine (0.0294 mM), Linoleic acid (0.0003 mM), Lipoic acid (0.0010 mM), Phenol red (0.0032 mM) Putrescine (0.0010 mM), Thymidine (0.0029 mM).
* Control experiment with only essential amino acids, without carbon source.
Chapter 5
170
5.3.3. Growth assessment and carbon source consumption
During the cultures, samples were collected at different time points (0, 4, 6, 8, 10,
12, 24, 36 and 48 hours) to evaluate the Optical Density at 600 nm by using a microplate
reader (TECAN Sunrise, Switzerland). To verify culture purity at each time point a sample
of the bacterial culture was plated in Columbia base agar (CBA) (Liofilchem, Italy)
supplemented with 5% (v/v) defibrinated horse blood and Tryptic Soy Agar (Liofilchem,
Italy) media and then incubated at 37°C in microaerophilic and aerobic conditions,
respectively, during 5-7 days.
At 0 and 48 hours of each experiment, samples of the supernatant were collected
to analyze amino and non-amino organic acids by GC-MS in order to measure the
consumption of the carbon source and other amino acids and detect possible by-products
secreted by H. pylori (method detailed in Chapter 3).
Acetate and formate production were assayed by an enzymatic kit (Acetic acid UV-
method - Cat. No. 10 148 261 035, Boehringer Mannheim/R-Biopharm, Roche, Germany
and Formic acid UV method - Cat. No. 10 979 732 035, Boehringer Mannheim/R-
Biopharm, Roche, Germany) (Experimental procedure according to kits’ instructions).
The specific growth rates (h-1) were determined by plotting the logarithm of the
absorbance of the culture at 600 nm along time.
5.4. Results and discussion
5.4.1. H. pylori growth with different carbon sources
It has been described that amino acids can be used by H. pylori as carbon and
energy sources. In our previous experiments, H. pylori 26695 was grown in the Ham’s F-
12 medium, which contains all 20 amino acids in concentrations between 0.03 and 1 mM
(medium composition detailed in supplementary material 1). Additionally, some organic
acids (citrate, lactate and succinate) were detected in the culture medium when
supplemented with fetal bovine serum (FBS).
Evaluation of different carbon sources for the growth of H. pylori 26695 in liquid medium
171
Two experiments using 10-fold higher concentrations of amino acids and organic
acids (citrate, lactate, succinate, and pyruvate) were also performed. The obtained results
showed that an increase in amino acids concentrations originated and increase in H.
pylori’s growth, while the same increase was not observed for the experiment with higher
concentration of organic acids. These results suggest that either essential amino acids are
found in limiting conditions in the original medium formulation or that the remaining amino
acids are the preferential carbon sources.
In addition, the analysis of extracellular metabolites, previously performed,
enabled us to determine which amino and organic acids were consumed by H. pylori
growing in Ham’s F-12 (Chapter 3). Based on these results, some L-amino acids (alanine,
asparagine, aspartate, glutamate, glutamine, proline and serine) and one organic acid
(pyruvate) were chosen to be tested as possible carbon sources for H. pylori 26695 in
liquid medium.
Additionally, alpha-ketoglutarate was also tested, since glutamine and glutamate
are assimilated via alpha-ketoglutarate in the TCA cycle25. Although the transporter for that
organic acid was identified in H. pylori 26695’s genome26,27, in our experiments, when
using alpha-ketoglutarate as the sole carbon source, we observed no growth, indicating
that possibly this transporter is not active under the conditions used. As such, the results
of that experiment are not presented next.
It should be emphasized that, although an effort was made such that in each
experiment only one compound was serving as the carbon source, this was not completely
achieved given the presence of additional carbon sources in FBS (used in 5% v/v), such as
organic acids. In fact, it was not possible to remove FBS from the culture medium, which
suggests that some nutrients are still missing in the defined medium, or that FBS has
another unknown function that is not supported by the medium without this complex
supplement. FBS was also analyzed by GC-MS (results detailed in supplementary material
2) and it is clear that, although several of the carbon sources were found, those are in low
concentrations in the final medium, and it is possible to separate their influence (as also
shown in supplementary material 2).
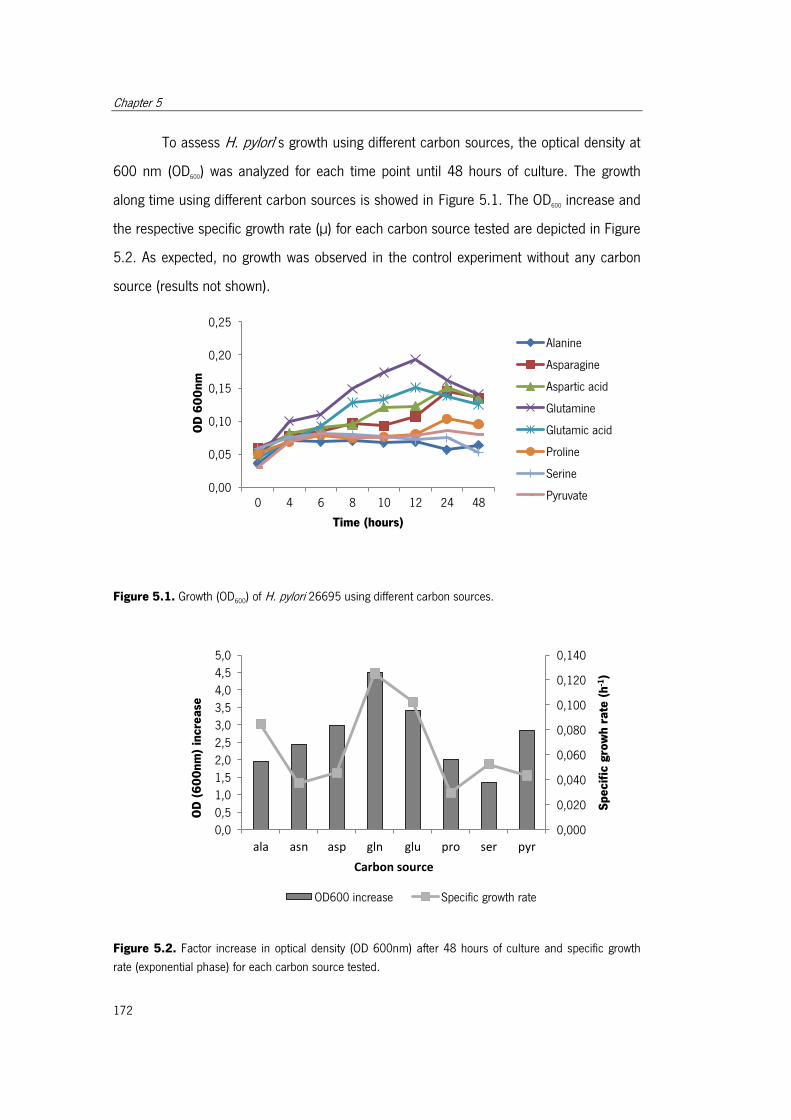
Chapter 5
172
To assess H. pylori’s growth using different carbon sources, the optical density at
600 nm (OD600) was analyzed for each time point until 48 hours of culture. The growth
along time using different carbon sources is showed in Figure 5.1. The OD600 increase and
the respective specific growth rate (µ) for each carbon source tested are depicted in Figure
5.2. As expected, no growth was observed in the control experiment without any carbon
source (results not shown).
Figure 5.1. Growth (OD600) of H. pylori 26695 using different carbon sources.
Figure 5.2. Factor increase in optical density (OD 600nm) after 48 hours of culture and specific growth
rate (exponential phase) for each carbon source tested.
0,00
0,05
0,10
0,15
0,20
0,25
0 4 6 8 10 12 24 48
OD
60
0n
m
Time (hours)
Alanine
Asparagine
Aspartic acid
Glutamine
Glutamic acid
Proline
Serine
Pyruvate
0,000
0,020
0,040
0,060
0,080
0,100
0,120
0,140
0,0
0,5
1,0
1,5
2,0
2,5
3,0
3,5
4,0
4,5
5,0
ala asn asp gln glu pro ser pyr
Sp
eci
fic
gro
wh
ra
te (
h-1
)
OD
(6
00
nm
) in
cre
ase
Carbon source
OD600 increase Specific growth rate
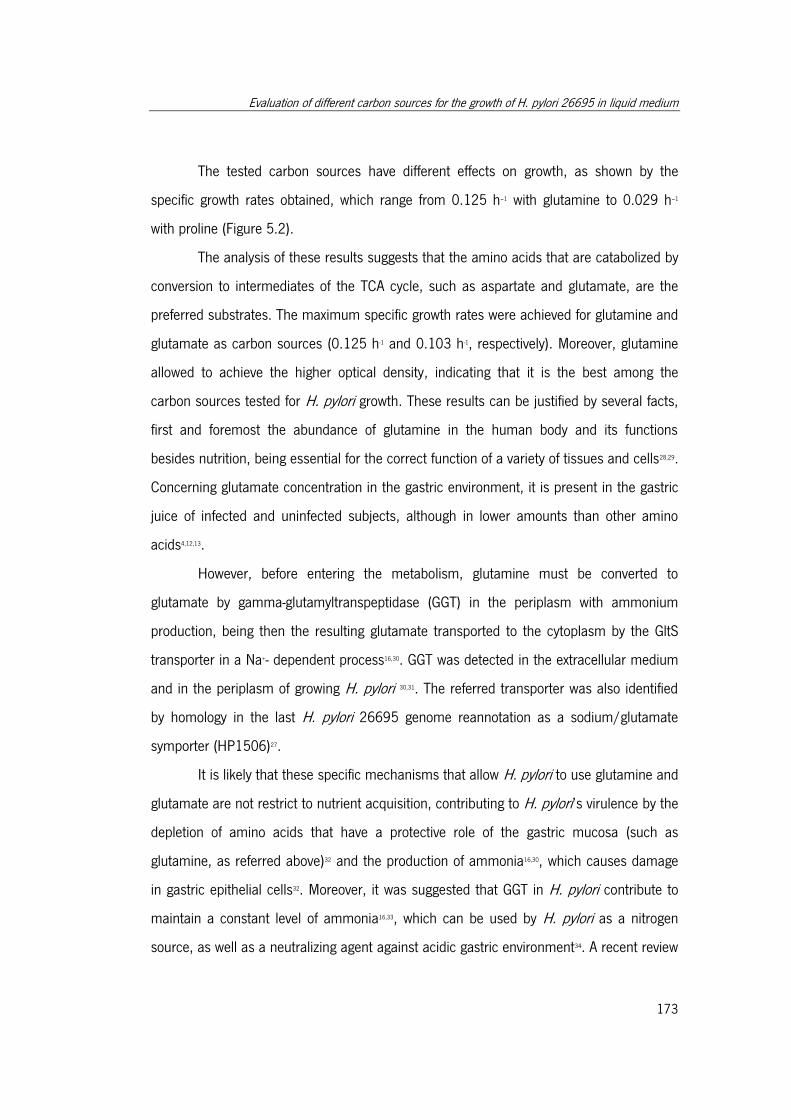
Evaluation of different carbon sources for the growth of H. pylori 26695 in liquid medium
173
The tested carbon sources have different effects on growth, as shown by the
specific growth rates obtained, which range from 0.125 h–1 with glutamine to 0.029 h–1
with proline (Figure 5.2).
The analysis of these results suggests that the amino acids that are catabolized by
conversion to intermediates of the TCA cycle, such as aspartate and glutamate, are the
preferred substrates. The maximum specific growth rates were achieved for glutamine and
glutamate as carbon sources (0.125 h-1 and 0.103 h-1, respectively). Moreover, glutamine
allowed to achieve the higher optical density, indicating that it is the best among the
carbon sources tested for H. pylori growth. These results can be justified by several facts,
first and foremost the abundance of glutamine in the human body and its functions
besides nutrition, being essential for the correct function of a variety of tissues and cells28,29.
Concerning glutamate concentration in the gastric environment, it is present in the gastric
juice of infected and uninfected subjects, although in lower amounts than other amino
acids4,12,13.
However, before entering the metabolism, glutamine must be converted to
glutamate by gamma-glutamyltranspeptidase (GGT) in the periplasm with ammonium
production, being then the resulting glutamate transported to the cytoplasm by the GltS
transporter in a Na+- dependent process16,30. GGT was detected in the extracellular medium
and in the periplasm of growing H. pylori 30,31. The referred transporter was also identified
by homology in the last H. pylori 26695 genome reannotation as a sodium/glutamate
symporter (HP1506)27.
It is likely that these specific mechanisms that allow H. pylori to use glutamine and
glutamate are not restrict to nutrient acquisition, contributing to H. pylori’s virulence by the
depletion of amino acids that have a protective role of the gastric mucosa (such as
glutamine, as referred above)32 and the production of ammonia16,30, which causes damage
in gastric epithelial cells32. Moreover, it was suggested that GGT in H. pylori contribute to
maintain a constant level of ammonia16,33, which can be used by H. pylori as a nitrogen
source, as well as a neutralizing agent against acidic gastric environment34. A recent review
Chapter 5
174
about the role of GGT in H. pylori’s pathogenesis stresses the importance of ammonia
production in gastric damage during H. pylori infection34.
Thus, H. pylori does not possess a direct glutamine transporter, using glutamine
as a source of glutamate16, which in turn is converted to alpha-ketoglutarate by glutamate
dehydrogenase (GdhA) and incorporated into the TCA cycle16,25,35. Moreover, the
spontaneous hydrolysis of glutamine in aqueous buffer solutions at 37ºC and pH of 7.4
has been described8,36, thus limiting its use in in vitro liquid culture medium.
The use of aspartate and asparagine as sole carbon sources to grow H. pylori
resulted in low specific growth rates, with the maximum biomass achieved at 24 hours of
culture (Figure 5.1 and Figure 5.2). Like for glutamate and glutamine, a specific aspartate
transporter (DcuA) was described30 and predicted27, and asparagine catabolism starts with
its deamination in the periplasm by L-asparaginase (AnsB), resulting in ammonia and
aspartate, which is assimilated via fumarate in the TCA cycle30. It is presumed that the
fumarate used in the TCA cycle is formed preferentially from aspartate than from malate,
in contrast with C. jejuni37. L-aspartate was detected in the gastric juice of patients with
cancer and without cancer, but a controversy exists regarding its correlation with the
existence of cancer 12,134. Concerning virulence, the transport of aspartate was proved to be
essential in the colonization of the gastric mucosa in mice30.
When proline was used as the sole carbon source, the specific growth rate
(µ=0.029 h–1) was the lowest obtained, being the maximum optical density obtained at 24
hours of growth (Figure 5.1 and Figure 5.2). This result suggests that proline was not
being efficiently used by H. pylori. L-proline can also be transported by a Na+--dependent
transporter (PutP)27,38. The use of L-proline as a carbon source was also reported by other
authors7,8 as well as its high concentration in the human gastric juice4,12. An evidence on the
usage of proline in the catabolism comes from the identification of the gene (putA),
encoding for proline dehydrogenase, in H. pylori’s 26695 genome26,27, which is also
associated with the respiratory chain4.
It is thought that proline is not an essential amino acid for H. pylori growth, but the
specific precursor for its formation is unknown, as mentioned in the previous chapter: L-
glutamate39 or L-arginine6 are two possible precursors for proline biosynthesis.
Evaluation of different carbon sources for the growth of H. pylori 26695 in liquid medium
175
Alanine and serine as carbon sources resulted in a low OD increase when
compared with glutamine or glutamate, with the maximum biomass achieved at 8 and 6
hours of culture, respectively, but with low specific growth rates (Figure 5.1 and Figure
5.2). L-alanine and L-serine have been described to be essential amino acids for some
strains21, but results from this work presented in the previous chapter indicated that under
the conditions used, alanine and serine are not essential for H. pylori. Regarding the
composition of the gastric juice, alanine and serine are both present at high amounts4,12. L-
serine uptake is accomplished by the SdaC transporter, a specific serine transporter27,37,
while, although a transporter for D-alanine was predicted on H. pylori’s 26695 genome
(dagA, HP0942)27,39,40, a specific L-alanine transporter has not been identified. For
promoting L-alanine transport only a non-specific amino acid ABC (ATP binding cassette)
transporter was predicted27,40,41. Regarding the catabolic pathways, L-serine and L-alanine
can be both incorporated into the metabolism via pyruvate by a one-step conversion to
pyruvate and ammonia, by serine deaminase (sdaA)6,26,39 and alanine dehydrogenase
(ald)26,39, respectively. However, OD600 achieves higher values when pyruvate is used as the
carbon source in comparison with L-alanine and L-serine, showing that these carbon
sources have different effects, being pyruvate more efficiently used.
Pyruvate metabolism in H. pylori was studied by several authors42,43. Pyruvate can
be used as a sole carbon source and is catabolized by the conversion to Acetyl-CoA and
subsequent incorporation into the TCA cycle. Evidence of the reductive part of TCA cycle
was obtained by Mendz et al. (1994) by detecting succinate when cells were incubated
with pyruvate42. Mendz et al. (1994) also detected the formation of alanine and lactate, in
addition to acetate and formate as by-products when pyruvate was used as carbon source,
proving the existence of the mixed-acid fermentation pathway in H. pylori42. In contrast,
Chalk et al. (1994) only detected acetate as a by-product of pyruvate under aerobic
conditions43.
In summary, the observed discrepancies in consumption of different compounds
used as carbon sources confirm their differential use and different effectiveness, and
suggest that some amino acids also have other functions related with host colonization
and virulence. A connection between carbon source availability and bacterial virulence
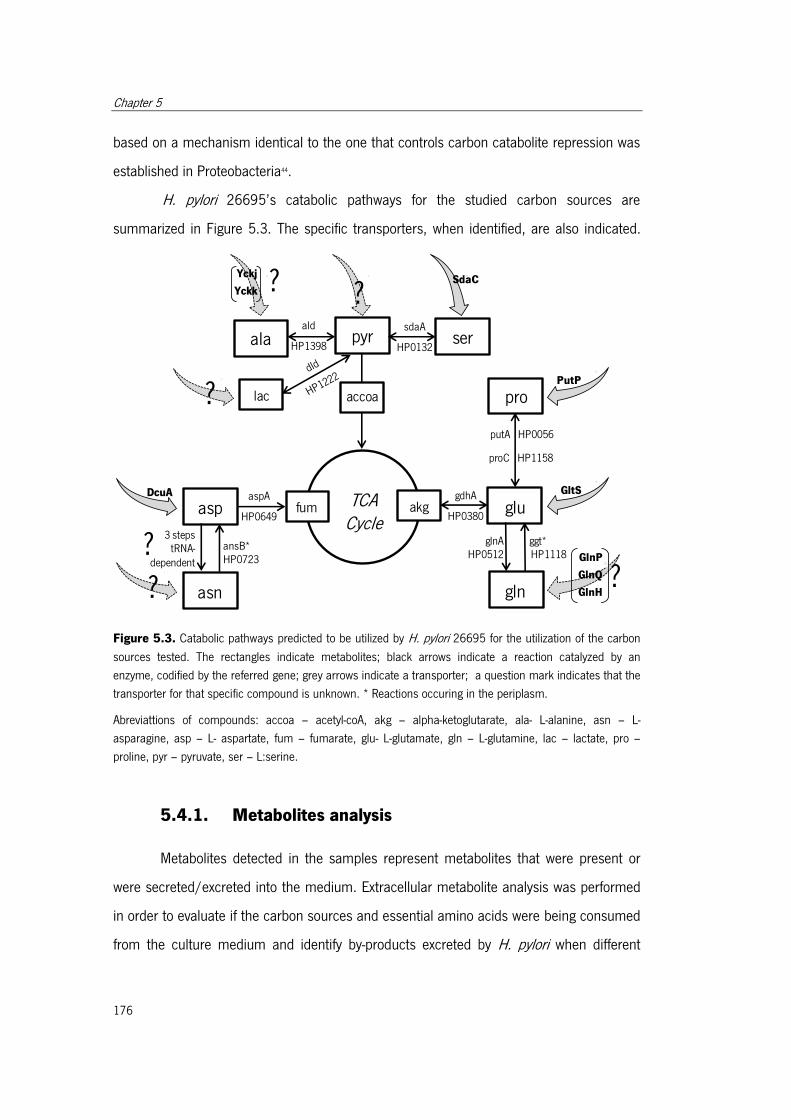
Chapter 5
176
based on a mechanism identical to the one that controls carbon catabolite repression was
established in Proteobacteria44.
H. pylori 26695’s catabolic pathways for the studied carbon sources are
summarized in Figure 5.3. The specific transporters, when identified, are also indicated.
Figure 5.3. Catabolic pathways predicted to be utilized by H. pylori 26695 for the utilization of the carbon
sources tested. The rectangles indicate metabolites; black arrows indicate a reaction catalyzed by an
enzyme, codified by the referred gene; grey arrows indicate a transporter; a question mark indicates that the
transporter for that specific compound is unknown. * Reactions occuring in the periplasm.
Abreviattions of compounds: accoa – acetyl-coA, akg – alpha-ketoglutarate, ala- L-alanine, asn – L-
asparagine, asp – L- aspartate, fum – fumarate, glu- L-glutamate, gln – L-glutamine, lac – lactate, pro –
proline, pyr – pyruvate, ser – L:serine.
5.4.1. Metabolites analysis
Metabolites detected in the samples represent metabolites that were present or
were secreted/excreted into the medium. Extracellular metabolite analysis was performed
in order to evaluate if the carbon sources and essential amino acids were being consumed
from the culture medium and identify by-products excreted by H. pylori when different
TCA Cycle
pyrala ser
akgfum glu
gln
asp
asn
pro
ald
HP1398
sdaA
HP0132
ansB*HP0723
aspA
HP0649
gdhA
HP0380
ggt*HP1118
putA HP0056
DcuA
Yckj
Yckk
GltS
PutP
GlnP
GlnQ
GlnH
SdaC
?
?
?
lac accoa
?
?
glnAHP0512
proC HP1158
3 steps tRNA-
dependent?
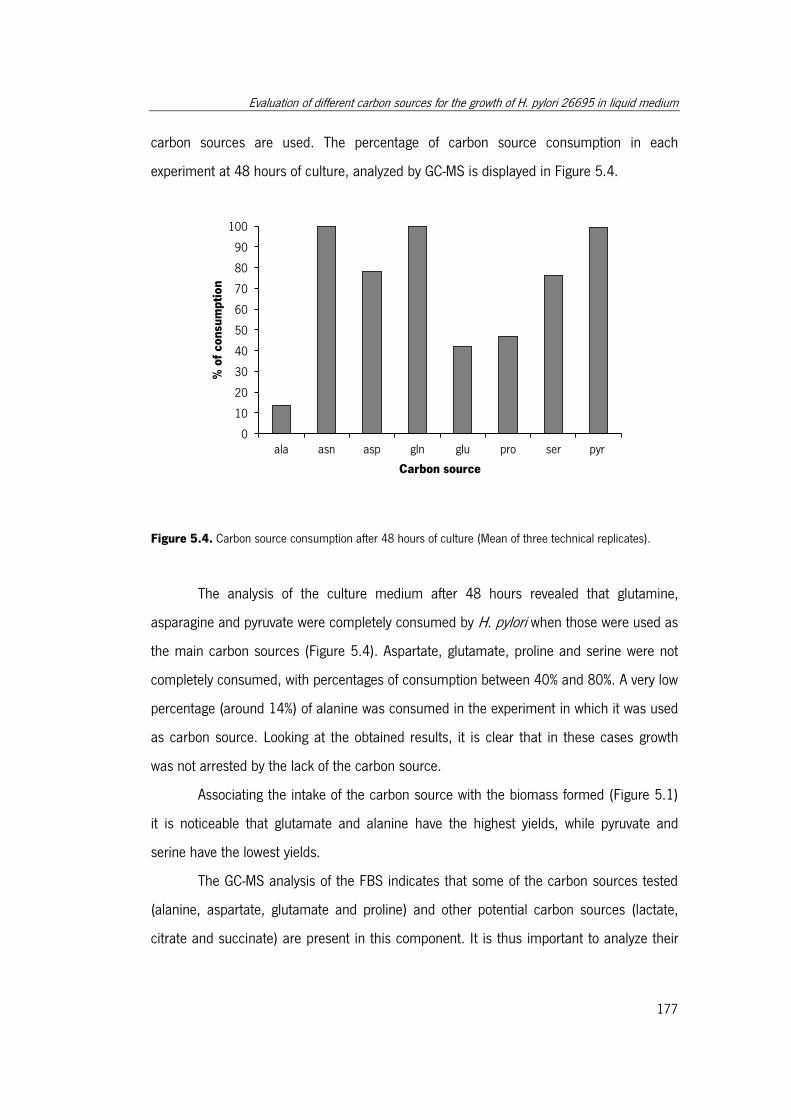
Evaluation of different carbon sources for the growth of H. pylori 26695 in liquid medium
177
carbon sources are used. The percentage of carbon source consumption in each
experiment at 48 hours of culture, analyzed by GC-MS is displayed in Figure 5.4.
Figure 5.4. Carbon source consumption after 48 hours of culture (Mean of three technical replicates).
The analysis of the culture medium after 48 hours revealed that glutamine,
asparagine and pyruvate were completely consumed by H. pylori when those were used as
the main carbon sources (Figure 5.4). Aspartate, glutamate, proline and serine were not
completely consumed, with percentages of consumption between 40% and 80%. A very low
percentage (around 14%) of alanine was consumed in the experiment in which it was used
as carbon source. Looking at the obtained results, it is clear that in these cases growth
was not arrested by the lack of the carbon source.
Associating the intake of the carbon source with the biomass formed (Figure 5.1)
it is noticeable that glutamate and alanine have the highest yields, while pyruvate and
serine have the lowest yields.
The GC-MS analysis of the FBS indicates that some of the carbon sources tested
(alanine, aspartate, glutamate and proline) and other potential carbon sources (lactate,
citrate and succinate) are present in this component. It is thus important to analyze their
0
10
20
30
40
50
60
70
80
90
100
ala asn asp gln glu pro ser pyr
% o
f co
nsu
mp
tio
n
Carbon source
Chapter 5
178
evolution in each experiment in order to inspect if they were also being used by the
organism.
As such, the exometabolome analysis performed allowed to detect the compounds
consumed from the culture medium, besides the main compounds used as carbon
sources (results detailed in supplementary materials 3). Analyzing the results, it can be
seen that alanine, aspartate, glutamate, proline, citrate, lactate and succinate were
identified in all experiments initially (0 h) in the culture medium. At 48 hours of culture,
alanine and lactate were completely consumed. Lactate transport, by lactate permeases,
was predicted from the genome (lctp1, HP0140; lctp2, HP01421)26,27. A D-lactate
dehydrogenase was also identified by homology in the genome (dld, Hp1222) which is
responsible for the conversion of D-lactate into pyruvate 26,27. Furthermore, Takahashi et al.
(2007) proved that the L-lactic acid secreted by gastric mucosal cells has a stimulatory
effect on H. pylori growth in microaerobic conditions, and since L-lactate dehydrogenase is
not predicted from genome analysis, another unknown metabolic pathway might be
present in H. pylori for L-lactate degradation18. The concentration of lactate detected in the
culture media supplemented with FBS is about 0.8 mM, which is consistent with the
concentration found in the human gastric juice (0.3-1 mM)18, although we were not able to
identify which isoform is present in FBS.
Aspartate and proline were almost 100% consumed in all experiments, coherent
with the results in experiments where these compounds were used as carbon sources
(where some consumption was verified when the initial concentrations were much higher).
Glutamate, citrate and succinate were detected in the culture medium in all
experiments at 0 h of culture, originating from FBS. These compounds were differently
utilized by H. pylori, being consumed in some experiments and produced in others
(supplementary material 3, Table 5.5) When it was not the main carbon source, glutamate
was completely consumed in the experiments where glutamine and serine were the main
carbon source. Since glutamine was completely consumed, it can be hypothesized that
glutamate was used in this experiment as an “extra” carbon source. The same did not
happen in the serine experiment, as serine was not completely consumed, suggesting a
preference for glutamate. In experiments where asparagine, proline and pyruvate were the
Evaluation of different carbon sources for the growth of H. pylori 26695 in liquid medium
179
main carbon source, glutamate was not consumed. As explained previously, the arrest in
growth in those experiments was not associated with the carbon source, and can be
associated with the production of some toxic compounds or other unknown factors and
thus the presence of glutamate did not avoid growth arrest.
The percentage of citrate in the culture medium at 48 hours increased in
experiments using glutamine and aspartate. In experiments using alanine, asparagine,
proline and pyruvate as main carbon sources, citrate was consumed by H. pylori
(supplementary material 3, Table 5.5) The influence of citrate in H. pylori growth and
viability was studied by Albertson et al. (1998) concluding that citrate did not enhance H.
pylori’s growth, but increase its viability45.
Succinate, which can be used by H. pylori as a carbon source, was not consumed
in experiments using asparagine, proline, serine and pyruvate, whilst it was consumed in
experiments using alanine, aspartate, glutamine and glutamate. Studies on by products
formed by the catabolism of amino acids detected succinate as a by-product of alanine,
aspartate, glutamate, fumarate and pyruvate7. Besides an increase in viability, Albertson et
al. (1998) did not detect any growth improvement in H. pylori when succinate was added
to culture medium45. In the published in silico metabolic models, succinate is pointed out
as a possible carbon source25,46, although, in our previous experiments, succinate was not
able to improve growth as discussed above in the case of citrate.
Tyrosine was only detected in two experiments (with glutamine or glutamate as
carbon sources), with a 2-fold increase of its percentage at 48 hours of culture. However,
the concentrations detected are very low, indicating that it could be present in all
experiments at concentrations below the limit of detection of the method used.
The accumulation of L-tyrosine in the culture medium was also observed when the
complete culture medium (with 20 amino acids) was used, as discussed in the previous
chapter.
Regarding essential amino acids, which were also analysed by GC/MS, the
obtained results are detailed in supplementary material 3 (Table 5.5). Overall, the
consumption of essential amino acids was not clearly noticeable in some cases. This fact
can be explained by the relatively high concentrations of some amino acids (leucine,
Chapter 5
180
phenylalanine and valine) in the medium, making the measurements of their consumption
inaccurate since the utilization by H. pylori cells is small compared to the total content.
Histidine was only detected in the experiments using glutamine and glutamate as
the main carbon sources due to problems with the derivatization method for that specific
compound, making its detection very difficult and unreliable.
The formation of the by-products acetate and formate were also inspected by an
enzymatic kit at 48 hours of culture. Acetate was detected in samples of the experiments
using pyruvate and serine as carbon sources, with an increment of 0.029 g/L and 0.018
g/L, respectively, comparatively to 0 hours of culture. Acetate formation when pyruvate is
metabolized is in agreement with the results obtained by other authors. The same
happens with L-serine42 since, as discussed, L-serine is metabolized by direct conversion
into pyruvate. However, although L-alanine is also directly transformed into pyruvate, and
acetate production has been reported7, that compound was not detected in the L-alanine
experiment. Acetate was also reported to be a by-product of aspartate, asparagine,
glutamate and glutamine metabolism in H. pylori7, but this was not verified in the present
work.
Formate was not detected in any sample. It was expected to be produced in
experiments using pyruvate or using amino acids that are metabolized via pyruvate, since
the mixed-acid fermentation was proved by Mendz et al.7,42.
5.5. Conclusions
In the present work, a comparison of H. pylori growing using different carbon
sources was carried out. Even though other studies also reported experiments using amino
acids as carbon sources, to our knowledge, this is the first work where different amino
acids were tested as the main carbon sources using the same concentration (in terms of
moles of carbon) and where growth parameters were compared using a semi-defined
medium. Moreover, the measurement of the exometabolome is another novelty, allowing
the comparison of H. pylori’s behaviour under several nutritional conditions.
Evaluation of different carbon sources for the growth of H. pylori 26695 in liquid medium
181
Under the conditions used, glutamine was identified as the carbon source that
yielded a higher growth. However, glutamine easily suffers degradation in aqueous
medium. Moreover, it is converted to glutamate and ammonium by an enzymatic reaction
in H. pylori’s periplasm. In addition, the use of glutamate as the main carbon source had a
higher yield in biomass regarding substrate consumption. As such, we suggest glutamate
as the carbon source of choice for H. pylori’s growth.
In line with other authors, the obtained results also proved that H. pylori is not
constrained to a unique carbon source and can switch to different substrates when the
preferential carbon source is not available, although with lower growth rates. Nevertheless,
the utilization of amino acids that are reported to be present in the gastric environment
might be not only related with acquiring nutrients, and it can be speculated that by
depleting the compounds that are important for gastric health, H. pylori has another
advantage, contributing to injury and virulence, as occurs with glutamine.
Notwithstanding, it should be emphasized that in our experiments FBS was used
to supplement the defined medium used, having some impact in the results. Nevertheless,
the FBS characterization performed in this work is also of interest and allowed the
identification of some important components (amino and organic acids) and to estimate
their impact in growth. Our attempts to grow H. pylori without FBS and without strain
adaptation failed, indicating that some components are missing in the culture medium
used or that FBS has another unknown function. Thus, further investigation is needed in
this direction.
Chapter 5
182
5.6. References
1. Rohmer, L., Hocquet, D. & Miller, S. I. Are pathogenic bacteria just looking for food?
Metabolism and microbial pathogenesis. Trends Microbiol. 19, 341–348 (2011).
2. Brown, S. A., Palmer, K. L. & Whiteley, M. Revisiting the host as a growth medium. Nat.
Rev. Microbiol. 6, 657–666 (2008).
3. Eisenreich, W., Dandekar, T., Heesemann, J. & Goebel, W. Carbon metabolism of
intracellular bacterial pathogens and possible links to virulence. Nat. Rev. Microbiol. 8,
401–12 (2010).
4. Nagata, K. et al. L-serine, D- and L -proline and alanine as respiratory substrates of
Helicobacter pylori: correlation between in vitro and in vivo amino acid levels. Microbiology
149, 2023–2030 (2003).
5. Noach, L. A., Rolf, T. M. & Tytgat, G. N. J. Electron microscopic study of association
between Helicobacter pylori and gastric and duodenal mucosa. J. Clin. Pathol. 47, 699–
704 (1994).
6. Van Amsterdam, K. & van der Ende, A. Nutrients released by gastric epithelial cells
enhance Helicobacter pylori growth. Helicobacter 9, 614–621 (2004).
7. Mendz, G. L. & Hazell, S. L. Aminoacid Utilization by Helicobacter pylori. Int. J. Biochem.
Cell Biol. 27, 1085–1093 (1995).
8. Stark, R. M., Suleiman, M. S., Hassan, I. J., Greenman, J. & Millar, M. R. Amino acid
utilisation and deamination of glutamine and asparagine by Helicobacter pylori. J. Med.
Microbiol. 46, 793–800 (1997).
9. Cerda, O., Rivas, A. & Toledo, H. Helicobacter pylori strain ATCC700392 encodes a
methyl-accepting chemotaxis receptor protein (MCP) for arginine and sodium bicarbonate.
FEMS Microbiol. Lett. 224, 175–181 (2003).
Evaluation of different carbon sources for the growth of H. pylori 26695 in liquid medium
183
10. Abdollahi, H. & Tadjrobehkar, O. The role of different sugars, amino acids and few other
substances in chemotaxis directed motility of helicobacter pylori. Iran. J. Basic Med. Sci.
15, 787–794 (2012).
11. Lertsethtakarn, P., Ottemann, K. M. & Hendrixson, D. R. Motility and chemotaxis in
Campylobacter and Helicobacter. Annu. Rev. Microbiol. 65, 389–410 (2011).
12. Nagata, Y. et al. High concentrations of D-amino acids in human gastric juice. Amino Acids
32, 137–40 (2007).
13. Segawa, K. et al. Amino acid patterns in human gastric juice in health and gastric disease.
Japanose J. Med. 24, 244–249 (1985).
14. Deng, K. et al. Three amino acids in gastric juice as potential biomarkers for gastric
malignancies. Anal. Chim. Acta 694, 100–107 (2011).
15. Deng, K. et al. High levels of aromatic amino acids in gastric juice during the early stages
of gastric cancer progression. PLoS One 7, 1–10 (2012).
16. Shibayama, K. et al. Metabolism of glutamine and glutathione via g-glutamyltranspeptidase
and glutamate transport in Helicobacter pylori: possible significance in the pathophysiology
of the organism. Mol. Microbiol. 64, 396–406 (2007).
17. Komorowska, M., Szafran, H., Popiela, T. & Szafran, Z. Free amino acids of human gastric
juice . Acta Physiol. Polish 32, 7336988 (1981).
18. Takahashi, T. et al. L-lactic acid secreted from gastric mucosal cells enhances growth of
Helicobacter pylori. Helicobacter 12, 532–540 (2007).
19. Piper, D., Fenton, B. & Goodman, L. Lactic, pyruvic, citric, and uric acid content of gastric
juice. Gastroenterology 53, 42–48 (1967).
20. Sainsus, N., Cattori, V., Lepadatu, C. & Hofmann-Lehmann, R. Liquid culture medium for
the rapid cultivation of Helicobacter pylori from biopsy specimens. Eur. J. Clin. Microbiol.
Infect. Dis. 27, 1209–1217 (2008).
Chapter 5
184
21. Nedenskov, P. Nutritional requirements for growth of Helicobacter pylori. Appl. Environ.
Microbiol. 60, 3450–3453 (1994).
22. Reynolds, D. J. & Penn, C. W. Characteristics of Helicobacter pylori growth in a defined
medium and determination of its amino acid requirements. Microbiology 140, 2649–
2956 (1994).
23. Testerman, T. L., Gee, D. J. M. C. & Mobley, H. L. T. Helicobacter pylori growth and urease
detection in the chemically defined medium Ham ’ s F-12 nutrient mixture. J. Clin.
Microbiol. 39, 3842–3850 (2001).
24. Testerman, T. L., Conn, P. B., Mobley, H. L. T. & McGee, D. J. Nutritional requirements
and antibiotic resistance patterns of Helicobacter species in chemically defined media. J.
Clin. Microbiol. 44, 1650–1658 (2006).
25. Schilling, C. H. et al. Genome-scale metabolic model of Helicobacter pylori 26695. J.
Bacteriol. 184, 4582–4593 (2002).
26. Tomb, J.-F. et al. The complete genome sequence of the gastric pathogen Helicobacter
pylori. Nature 388, 539–547 (1997).
27. Resende, T., Correia, D. M., Rocha, M. & Rocha, I. Re-annotation of the genome sequence
of Helicobacter pylori 26695. J. Integr. Bioinform. 10(3), 1–13 (2013).
28. Newsholme, P., Procopio, J., Lima, M. M. R., Pithon-Curi, T. C. & Curi, R. Glutamine and
glutamate--their central role in cell metabolism and function. Cell Biochem. Funct. 21, 1–9
(2003).
29. Roth, E. Nonnutritive effects of glutamine. J. Nutr. 138, 2025S–2031S (2008).
30. Leduc, D., Gallaud, J., Stingl, K. & Reuse, H. De. Coupled amino acid deamidase-transport
systems essential for Helicobacter pylori colonization. Infect. Imunity 78, 2782–2792
(2010).
31. Bumann, D. et al. Proteome analysis of secreted proteins of the gastric pathogen
Helicobacter pylori. Infect. Immun. 70, 3396–3403 (2002).

Evaluation of different carbon sources for the growth of H. pylori 26695 in liquid medium
185
32. Nakamura, E. & Hagen, S. J. Role of glutamine and arginase in protection against
ammonia-induced cell death in gastric epithelial cells. Am. J. Physiol. Gastrointest. Liver
Physiol. 283, G1264–75 (2002).
33. Ki, M. R., Yun, N. R. & Hwang, S. Y. Glutamine-induced production and secretion of
Helicobacter pylori gamma-glutamyltranspeptidase at low pH and its putative role in
glutathione transport. J. Microbiol. Biotechnol. 23, 467–472 (2013).
34. Ricci, V., Giannouli, M., Romano, M. & Zarrilli, R. Helicobacter pylori gamma-glutamyl
transpeptidase and its pathogenic role. World J. Gastroenterol. 20, 630–638 (2014).
35. Marais, A., Mendz, G. L., Hazell, S. L. & Mégraud, F. Metabolism and genetics of
Helicobacter pylori: the genome era. Microbiol. Mol. Biol. Rev. 63, 642–674 (1999).
36. Bray, H. G., James, S. P., Raffan, I. M. & Thorpe, W. V. The enzymic hydrolysis of
glutamine and its spontaneous decomposition in buffer solutions. Biochem. J. 44, 625–7
(1949).
37. Doig, P. et al. Helicobacter pylori physiology predicted from genomic comparison of two
strains. Microbiol. Mol. Biol. Rev. 63, 675–707 (1999).
38. Rivera-Ordaz, A. et al. The sodium/proline transporter putP of Helicobacter pylori. PLoS
One 8, e83576 (2013).
39. Caspi, R. et al. The MetaCyc database of metabolic pathways and enzymes and the BioCyc
collection of pathway/genome databases. Nucleic Acids Res. 40, D742–D753 (2012).
40. Reuse, H. De & Skouloubris, S. in Helicobacter pylori Physiol. Genet. (HLT, M., GL, M. &
SL, H.) (ASM Press, 2001).
41. Tomii, K. & Kanehisa, M. A Comparative Analysis of ABC Transporters in Complete
Microbial Genomes. Genome Res. 1048–1059 (1998). doi:10.1101/gr.8.10.1048
42. Mendz, G. L., Hazell, S. L. & van Gorkom, L. Pyruvate metabolism in Helicobacter pylori.
Arch. Microbiol. 162, 187–192 (1994).
Chapter 5
186
43. Chalk, P. A., Roberts, A. D. & Blows, W. M. Metabolism of pyruvate and glucose by intact
cells of Helicobacter pylori studied by 13C NMR spectroscopy. Microbiology 140, 2085–
2092 (1994).
44. Poncet, S. et al. in Bact. Sens. Signal. (Collin, M. & Schuch, R.) 16, 1–15 (Karger, 2009).
45. Albertson, N., Wenngren, I. & Sjöström, J. E. Growth and Survival of Helicobacter pylori in
Defined Medium and Susceptibility to Brij 78. J. Clin. Microbiol. 36, 1232–1235 (1998).
46. Thiele, I., Vo, T. D., Price, N. D. & Palsson, B. Ø. Expanded Metabolic Reconstruction of
Helicobacter pylori ( iIT341 GSM / GPR ): an In Silico Genome-Scale Characterization of
Single- and Double-Deletion Mutants. J. Bacteriol. 187, 5818–5830 (2005).
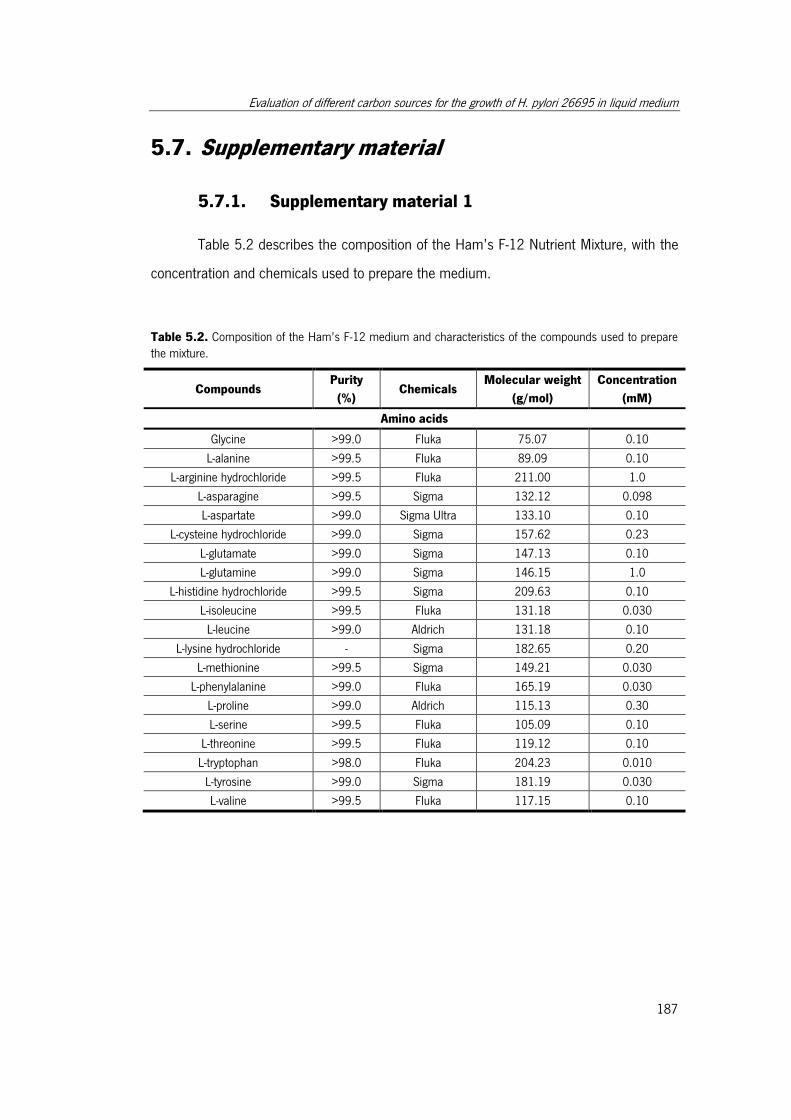
Evaluation of different carbon sources for the growth of H. pylori 26695 in liquid medium
187
5.7. Supplementary material
5.7.1. Supplementary material 1
Table 5.2 describes the composition of the Ham’s F-12 Nutrient Mixture, with the
concentration and chemicals used to prepare the medium.
Table 5.2. Composition of the Ham’s F-12 medium and characteristics of the compounds used to prepare the mixture.
Compounds Purity
(%) Chemicals
Molecular weight
(g/mol)
Concentration
(mM)
Amino acids
Glycine >99.0 Fluka 75.07 0.10
L-alanine >99.5 Fluka 89.09 0.10
L-arginine hydrochloride >99.5 Fluka 211.00 1.0
L-asparagine >99.5 Sigma 132.12 0.098
L-aspartate >99.0 Sigma Ultra 133.10 0.10
L-cysteine hydrochloride >99.0 Sigma 157.62 0.23
L-glutamate >99.0 Sigma 147.13 0.10
L-glutamine >99.0 Sigma 146.15 1.0
L-histidine hydrochloride >99.5 Sigma 209.63 0.10
L-isoleucine >99.5 Fluka 131.18 0.030
L-leucine >99.0 Aldrich 131.18 0.10
L-lysine hydrochloride - Sigma 182.65 0.20
L-methionine >99.5 Sigma 149.21 0.030
L-phenylalanine >99.0 Fluka 165.19 0.030
L-proline >99.0 Aldrich 115.13 0.30
L-serine >99.5 Fluka 105.09 0.10
L-threonine >99.5 Fluka 119.12 0.10
L-tryptophan >98.0 Fluka 204.23 0.010
L-tyrosine >99.0 Sigma 181.19 0.030
L-valine >99.5 Fluka 117.15 0.10
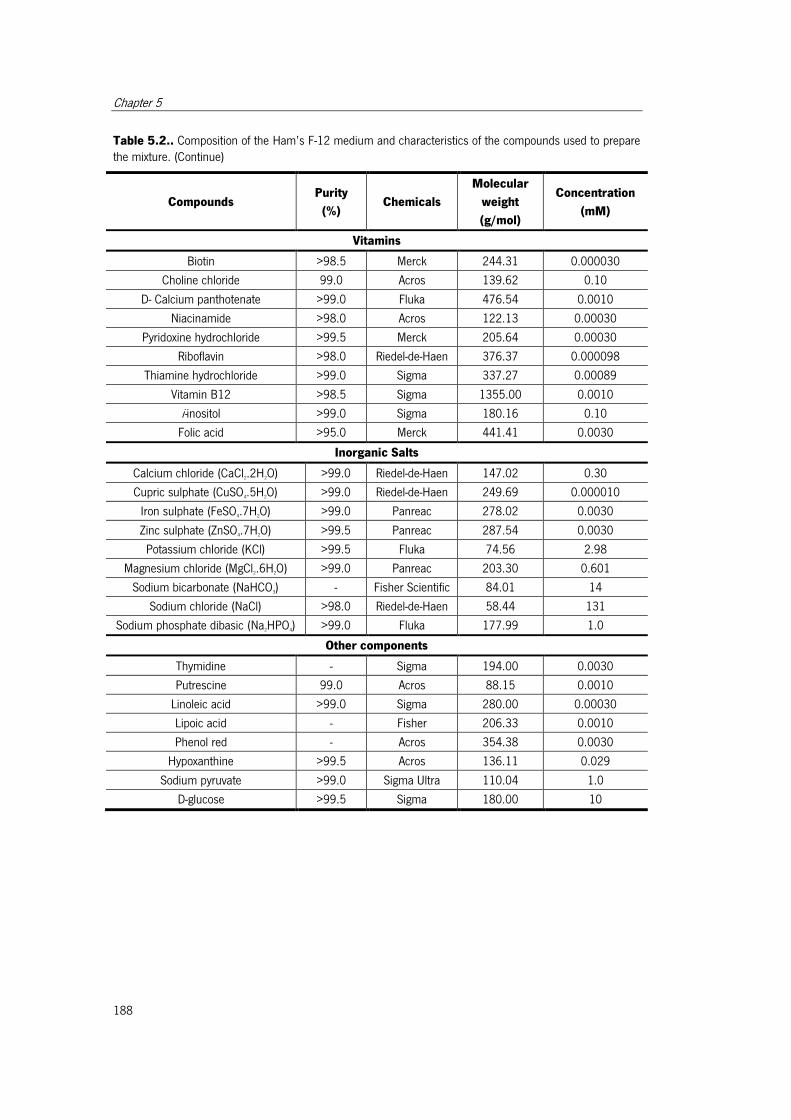
Chapter 5
188
Table 5.2.. Composition of the Ham’s F-12 medium and characteristics of the compounds used to prepare the mixture. (Continue)
Compounds Purity
(%) Chemicals
Molecular
weight
(g/mol)
Concentration
(mM)
Vitamins
Biotin >98.5 Merck 244.31 0.000030
Choline chloride 99.0 Acros 139.62 0.10
D- Calcium panthotenate >99.0 Fluka 476.54 0.0010
Niacinamide >98.0 Acros 122.13 0.00030
Pyridoxine hydrochloride >99.5 Merck 205.64 0.00030
Riboflavin >98.0 Riedel-de-Haen 376.37 0.000098
Thiamine hydrochloride >99.0 Sigma 337.27 0.00089
Vitamin B12 >98.5 Sigma 1355.00 0.0010
i-inositol >99.0 Sigma 180.16 0.10
Folic acid >95.0 Merck 441.41 0.0030
Inorganic Salts
Calcium chloride (CaCl2.2H2O) >99.0 Riedel-de-Haen 147.02 0.30
Cupric sulphate (CuSO4.5H2O) >99.0 Riedel-de-Haen 249.69 0.000010
Iron sulphate (FeSO4.7H2O) >99.0 Panreac 278.02 0.0030
Zinc sulphate (ZnSO4.7H2O) >99.5 Panreac 287.54 0.0030
Potassium chloride (KCl) >99.5 Fluka 74.56 2.98
Magnesium chloride (MgCl2.6H2O) >99.0 Panreac 203.30 0.601
Sodium bicarbonate (NaHCO3) - Fisher Scientific 84.01 14
Sodium chloride (NaCl) >98.0 Riedel-de-Haen 58.44 131
Sodium phosphate dibasic (Na2HPO4) >99.0 Fluka 177.99 1.0
Other components
Thymidine - Sigma 194.00 0.0030
Putrescine 99.0 Acros 88.15 0.0010
Linoleic acid >99.0 Sigma 280.00 0.00030
Lipoic acid - Fisher 206.33 0.0010
Phenol red - Acros 354.38 0.0030
Hypoxanthine >99.5 Acros 136.11 0.029
Sodium pyruvate >99.0 Sigma Ultra 110.04 1.0
D-glucose >99.5 Sigma 180.00 10
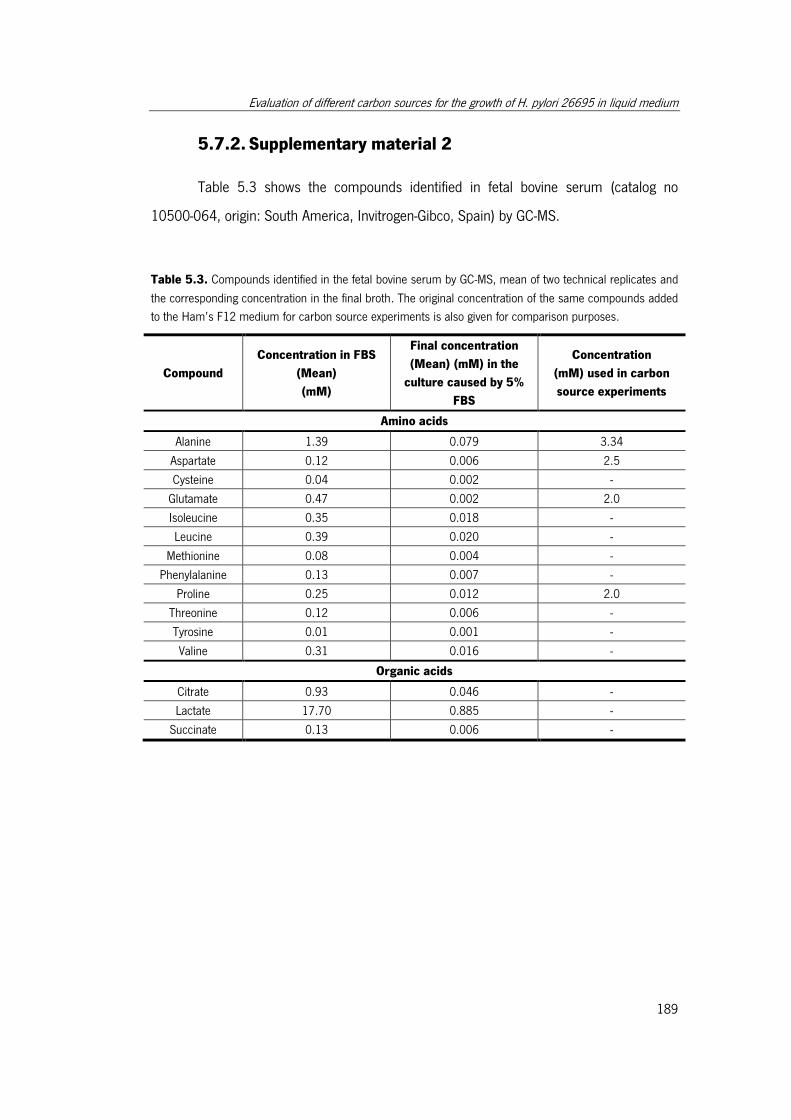
Evaluation of different carbon sources for the growth of H. pylori 26695 in liquid medium
189
5.7.2. Supplementary material 2
Table 5.3 shows the compounds identified in fetal bovine serum (catalog no
10500-064, origin: South America, Invitrogen-Gibco, Spain) by GC-MS.
Table 5.3. Compounds identified in the fetal bovine serum by GC-MS, mean of two technical replicates and
the corresponding concentration in the final broth. The original concentration of the same compounds added
to the Ham’s F12 medium for carbon source experiments is also given for comparison purposes.
Compound
Concentration in FBS
(Mean)
(mM)
Final concentration
(Mean) (mM) in the
culture caused by 5%
FBS
Concentration
(mM) used in carbon
source experiments
Amino acids
Alanine 1.39 0.079 3.34
Aspartate 0.12 0.006 2.5
Cysteine 0.04 0.002 -
Glutamate 0.47 0.002 2.0
Isoleucine 0.35 0.018 -
Leucine 0.39 0.020 -
Methionine 0.08 0.004 -
Phenylalanine 0.13 0.007 -
Proline 0.25 0.012 2.0
Threonine 0.12 0.006 -
Tyrosine 0.01 0.001 -
Valine 0.31 0.016 -
Organic acids
Citrate 0.93 0.046 -
Lactate 17.70 0.885 -
Succinate 0.13 0.006 -
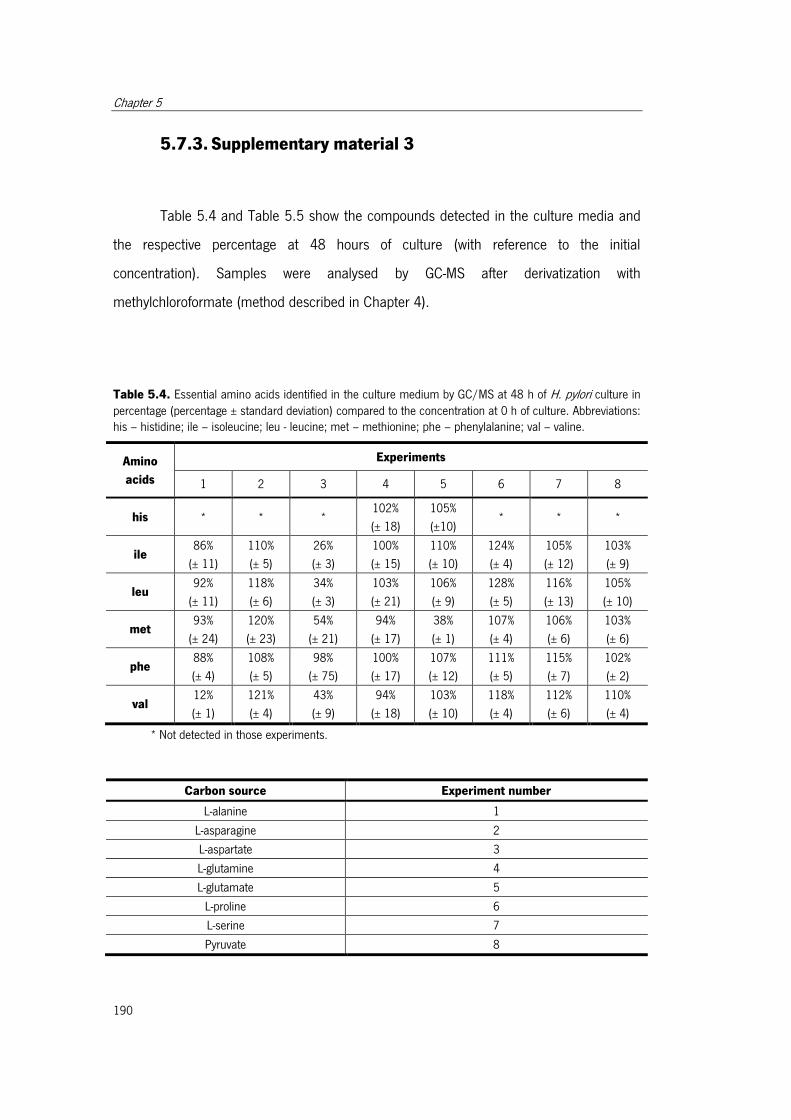
Chapter 5
190
5.7.3. Supplementary material 3
Table 5.4 and Table 5.5 show the compounds detected in the culture media and
the respective percentage at 48 hours of culture (with reference to the initial
concentration). Samples were analysed by GC-MS after derivatization with
methylchloroformate (method described in Chapter 4).
Table 5.4. Essential amino acids identified in the culture medium by GC/MS at 48 h of H. pylori culture in percentage (percentage ± standard deviation) compared to the concentration at 0 h of culture. Abbreviations: his – histidine; ile – isoleucine; leu - leucine; met – methionine; phe – phenylalanine; val – valine.
Amino
acids
Experiments
1 2 3 4 5 6 7 8
his * * * 102%
(± 18)
105%
(±10) * * *
ile 86%
(± 11)
110%
(± 5)
26%
(± 3)
100%
(± 15)
110%
(± 10)
124%
(± 4)
105%
(± 12)
103%
(± 9)
leu 92%
(± 11)
118%
(± 6)
34%
(± 3)
103%
(± 21)
106%
(± 9)
128%
(± 5)
116%
(± 13)
105%
(± 10)
met 93%
(± 24)
120%
(± 23)
54%
(± 21)
94%
(± 17)
38%
(± 1)
107%
(± 4)
106%
(± 6)
103%
(± 6)
phe 88%
(± 4)
108%
(± 5)
98%
(± 75)
100%
(± 17)
107%
(± 12)
111%
(± 5)
115%
(± 7)
102%
(± 2)
val 12%
(± 1)
121%
(± 4)
43%
(± 9)
94%
(± 18)
103%
(± 10)
118%
(± 4)
112%
(± 6)
110%
(± 4)
* Not detected in those experiments.
Carbon source Experiment number
L-alanine 1
L-asparagine 2
L-aspartate 3
L-glutamine 4
L-glutamate 5
L-proline 6
L-serine 7
Pyruvate 8
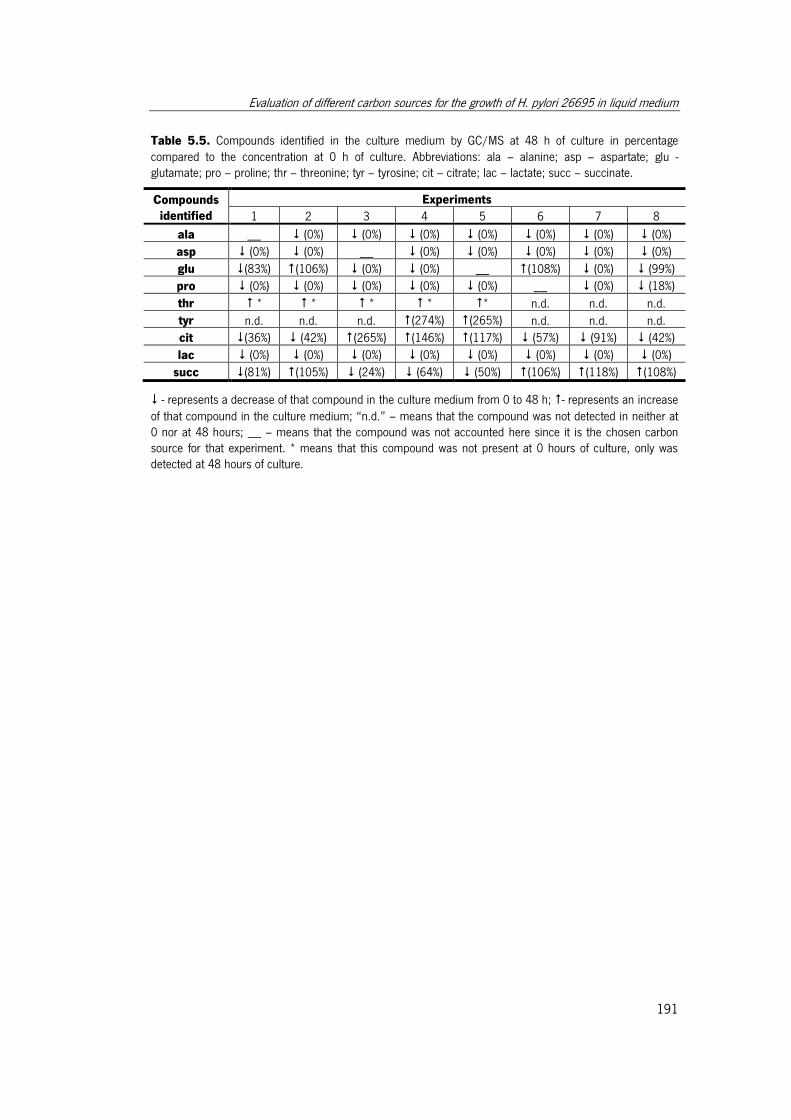
Evaluation of different carbon sources for the growth of H. pylori 26695 in liquid medium
191
Table 5.5. Compounds identified in the culture medium by GC/MS at 48 h of culture in percentage compared to the concentration at 0 h of culture. Abbreviations: ala – alanine; asp – aspartate; glu - glutamate; pro – proline; thr – threonine; tyr – tyrosine; cit – citrate; lac – lactate; succ – succinate.
Compounds identified
Experiments
1 2 3 4 5 6 7 8
ala __ (0%) (0%) (0%) (0%) (0%) (0%) (0%)
asp (0%) (0%) __ (0%) (0%) (0%) (0%) (0%)
glu (83%) (106%) (0%) (0%) __ (108%) (0%) (99%)
pro (0%) (0%) (0%) (0%) (0%) __ (0%) (18%)
thr * * * * * n.d. n.d. n.d.
tyr n.d. n.d. n.d. (274%) (265%) n.d. n.d. n.d.
cit (36%) (42%) (265%) (146%) (117%) (57%) (91%) (42%)
lac (0%) (0%) (0%) (0%) (0%) (0%) (0%) (0%)
succ (81%) (105%) (24%) (64%) (50%) (106%) (118%) (108%)
- represents a decrease of that compound in the culture medium from 0 to 48 h; - represents an increase
of that compound in the culture medium; “n.d.” – means that the compound was not detected in neither at 0 nor at 48 hours; __ – means that the compound was not accounted here since it is the chosen carbon source for that experiment. * means that this compound was not present at 0 hours of culture, only was detected at 48 hours of culture.


Chapter 6 6. Characterization of the growth of H. pylori
using glutamate as the main carbon
source
Daniela Matilde Correia, Rafael Carreira, Maria João Vieira, Nuno Filipe Azevedo and Isabel Rocha.
Characterization of the growth of H. pylori using glutamate as the main carbon source.
(To be submitted)

Characterization of the growth of H. pylori using glutamate as the main carbon source
195
6.1. Abstract
The determination of nutritional requirements of pathogenic organisms is of great
significance for understanding host-pathogen interactions. For H. pylori, some nutritional
requirements have been disclosed; however, relevant information is still missing. Although
amino acids have been identified as possible carbon sources for H. pylori, in the few
described defined or semi-defined media several potential carbon sources are made
available and the consumed ones are not clearly identified. Thus, the present work was
conducted with the goal of uncovering the metabolic capacities of H. pylori, its nutritional
requirements and the most commonly used metabolic pathways.
As such, the growth of H. pylori 26695 in liquid medium using L-glutamate as the
main carbon source was studied. Additionally, 13C L-glutamate was used to clarify some
metabolic features. The obtained results confirmed L-glutamate as a potential sole and
effective carbon source for H. pylori, also corroborating the essentiality of the amino acids
isoleucine, histidine, leucine, methionine, phenylalanine and valine. We were also able to
demonstrate that, under the conditions used, H. pylori makes full usage of the complete
TCA cycle. Additionally, we hypothesized that L-proline is produced from L-arginine, while
L-alanine is probably produced from pyruvate by alanine dehydrogenase.
Keywords: Helicobacter pylori, metabolomics, 13C labeling.
Chapter 6
196
6.2. Introduction
Despite the knowledge obtained so far concerning amino acid requirements in H.
pylori, it is still unclear which are the metabolic pathways used for biosynthesis and
catabolism. Thus, information on the carbon flow in this organism is required. Glutamate
is a very important metabolite in bacterial metabolism that can be used as a carbon and
nitrogen source. As described by other authors1,2 and shown in our previous studies,
glutamate and glutamine can be used by H. pylori as sole carbon sources, with succinate,
acetate and formate having been identified as metabolic by-products of glutamate
consumption in H. pylori2. Glutamate plays yet another relevant role, as D-glutamate is an
essential metabolite for the biosynthesis of peptidoglycan for the cell wall. Strategies of
glutamate racemase inhibition have been investigated in the last years3, since this enzyme
converts L-glutamate to D-glutamate.
13C flux analysis has been largely applied to characterize phenotypes4 by
quantifying in vivo the carbon fluxes. One of the most important applications of this
approach is the identification of active pathways in less-studied organisms5. In 13C labeling
experiments, an isotopic labeled substrate is used, and after an isotopic steady-state is
achieved, free metabolites can be analyzed or proteinogenic amino acids can be measured
after biomass hydrolysis. The analysis of the amino acids present in protein biomass is
often preferred, since it provides broad labeling information and is less affected by errors,
allowing to infer about active metabolic pathways and the carbon flow6.
In order to characterize the growth of H. pylori using glutamate as substrate, this
bacterium was grown under semi-defined conditions using a medium with L-glutamate as
the main carbon source. A metabolic footprinting, together with a metabolite profiling
approach was applied to identify the consumption and secretion of metabolites into the
culture medium. This experiment was performed with different objectives: first, the results
from the screening described in the previous chapter for the use of glutamate as the main
carbon source needed to be validated with more replicates and it was also important to
characterize in more detail the consumption of this compound. Furthermore, this
characterization was important for the design of 13C labeling experiments with 13C-glutamate
Characterization of the growth of H. pylori using glutamate as the main carbon source
197
that aimed at clarifying the metabolic pathways used by H. pylori under defined conditions
by analyzing the labeled amino acids in biomass hydrolysates.
6.3. Methods
6.3.1. Culture conditions
Helicobacter pylori 26695 (strain NCTC 12455) was cultivated in Columbia Base
Agar (CBA) (Liofilchem, Italy) supplemented with 5% (v/v) defibrinated horse blood
(Probiologica, Portugal) at 37 °C under microaerophilic conditions (5% O2, 10% CO2, 85%
N2) in a Cell Culture Incubator (Incubator HERAcell 150, Kendro Laboratory, Germany) for
3 days.
An inoculum was prepared in Ham’s F-12 nutrient mixture with glutamine
(Medium composition detailed in Chapter 5) previously supplemented with 5% of fetal
bovine serum (FBS) (vol/vol) (catalog no 10500-064, origin: South America, Invitrogen-
Gibco, Spain), incubated at 37 °C under 130 rpm of shaking speed (Heidolph Unimax
1010 orbital shaker, Germany) in microaerophilic conditions (5% O2, 10% CO2, 85% N2) for
approximately 16 h, in order to reach the exponential phase. Afterwards, cells were
harvested by centrifugation (5000 x g, 10 min.), washed twice in phosphate buffer saline
(PBS) and ressuspended in culture medium. The initial Optical Density at 600 nm was
adjusted to 0.06 - 0.07. Each experiment was performed in 1000-mL Erlenmeyer flasks
with 150 mL of the medium described in Table 6.1. Independent inocula were used to
inoculate three Erlenmeyer flasks (biological replicates). The pH was adjusted to 7.0. The
culture was incubated at 37 °C under 130 rpm of shaking speed under microaerophilic
conditions (5% O2, 10% CO2, 85% N2). The experiment was carried out during 48 hours.
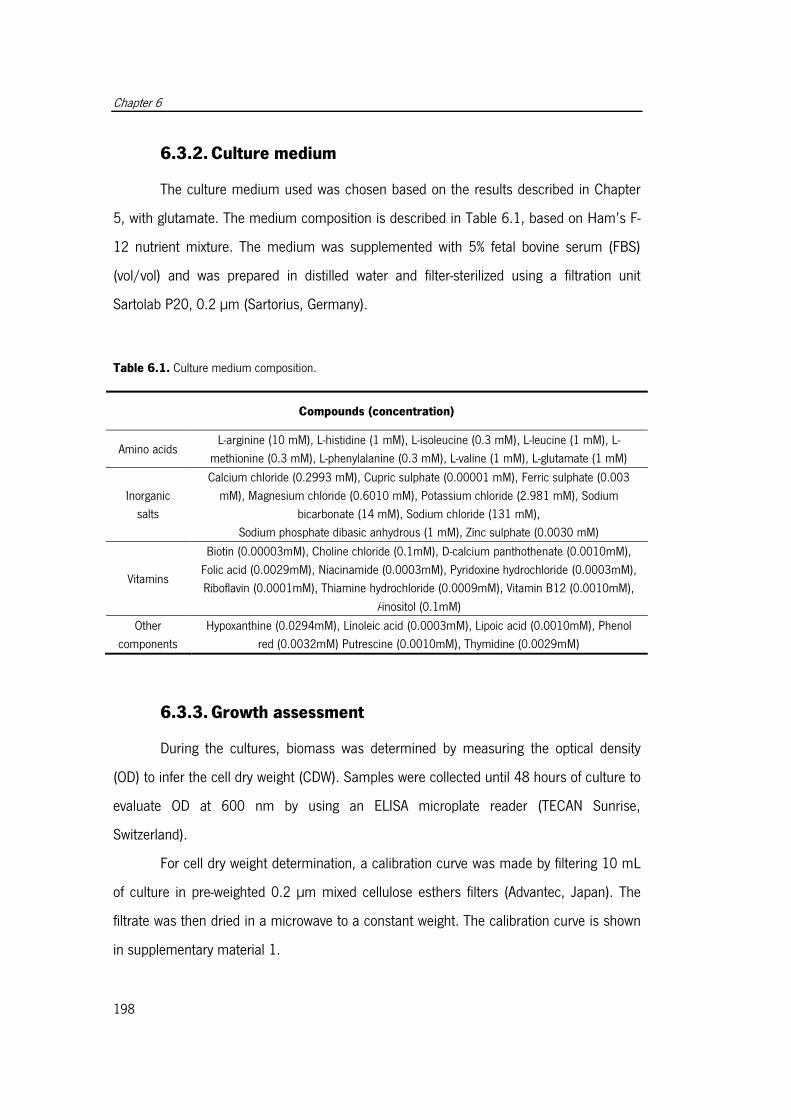
Chapter 6
198
6.3.2. Culture medium
The culture medium used was chosen based on the results described in Chapter
5, with glutamate. The medium composition is described in Table 6.1, based on Ham’s F-
12 nutrient mixture. The medium was supplemented with 5% fetal bovine serum (FBS)
(vol/vol) and was prepared in distilled water and filter-sterilized using a filtration unit
Sartolab P20, 0.2 µm (Sartorius, Germany).
Table 6.1. Culture medium composition.
Compounds (concentration)
Amino acids L-arginine (10 mM), L-histidine (1 mM), L-isoleucine (0.3 mM), L-leucine (1 mM), L-
methionine (0.3 mM), L-phenylalanine (0.3 mM), L-valine (1 mM), L-glutamate (1 mM)
Inorganic
salts
Calcium chloride (0.2993 mM), Cupric sulphate (0.00001 mM), Ferric sulphate (0.003
mM), Magnesium chloride (0.6010 mM), Potassium chloride (2.981 mM), Sodium
bicarbonate (14 mM), Sodium chloride (131 mM),
Sodium phosphate dibasic anhydrous (1 mM), Zinc sulphate (0.0030 mM)
Vitamins
Biotin (0.00003mM), Choline chloride (0.1mM), D-calcium panthothenate (0.0010mM),
Folic acid (0.0029mM), Niacinamide (0.0003mM), Pyridoxine hydrochloride (0.0003mM),
Riboflavin (0.0001mM), Thiamine hydrochloride (0.0009mM), Vitamin B12 (0.0010mM),
i-inositol (0.1mM)
Other
components
Hypoxanthine (0.0294mM), Linoleic acid (0.0003mM), Lipoic acid (0.0010mM), Phenol
red (0.0032mM) Putrescine (0.0010mM), Thymidine (0.0029mM)
6.3.3. Growth assessment
During the cultures, biomass was determined by measuring the optical density
(OD) to infer the cell dry weight (CDW). Samples were collected until 48 hours of culture to
evaluate OD at 600 nm by using an ELISA microplate reader (TECAN Sunrise,
Switzerland).
For cell dry weight determination, a calibration curve was made by filtering 10 mL
of culture in pre-weighted 0.2 µm mixed cellulose esthers filters (Advantec, Japan). The
filtrate was then dried in a microwave to a constant weight. The calibration curve is shown
in supplementary material 1.
Characterization of the growth of H. pylori using glutamate as the main carbon source
199
To verify culture purity, at each time point the bacterial culture was plated in
Columbia base agar (CBA) (Liofilchem, Italy) supplemented with 5% (v/v) defibrinated
horse blood and Tryptic Soy Agar (Liofilchem, Italy) media and then incubated at 37°C in
microaerophilic and aerobic conditions, respectively, during 5-7 days.
6.3.4. Metabolites analysis
At each time point (0-48 hours) samples of the culture supernatant (1 mL, in
triplicate) were collected to analyze amino and non-amino organic acids by GC-MS in order
to measure the consumption of amino acids and detect possible by-products secreted by
H. pylori (method performed according to Smart et al. (2010)7 and detailed in Chapter 4).
Acetate production was assayed enzymatically by a UV kit (Acetic acid UV-method -
Cat. No. 10 148 261 035, Boehringer Mannheim/R-Biopharm, Roche, Germany).
(Experimental procedure according to kit’s instructions).
6.3.5. 13C labeling experiments
Using the same culture protocols as described above (medium in Table 6.1),
experiments (3 biological replicates) using 100% uniformly labeled 13C-glutamic acid ([U-
13C]-glutamic acid) (99%, Cambridge Isotope, USA) were performed. Biomass hydrolysates
were analyzed to evaluate the incorporation of 13Carbon. Briefly, at the late-exponential
phase (9 hours of culture), cultures were harvested (total volume of the culture) and
pelleted by centrifugation (7000 x g, 10 min.). Cell pellets were hydrolyzed in 6 M HCl
(495 µL) with thioglycolic acid (5 µL) (to preserve some amino acids), at 105 ºC for 24
hours in sealed vials. After hydrolysis, samples were neutralized with 10 M NaOH (100
µL). Then, samples were lyophilized during 24 hours and derivatized prior to GC-MS
analysis, as described in Chapter 4 and summarized in Figure 6.1.
Samples (1 mL, in triplicate) were collected at 0 h and 9 h of culture for analysis
of extracellular metabolites and treated as described in Chapter 4 for extracellular
metabolite analysis.
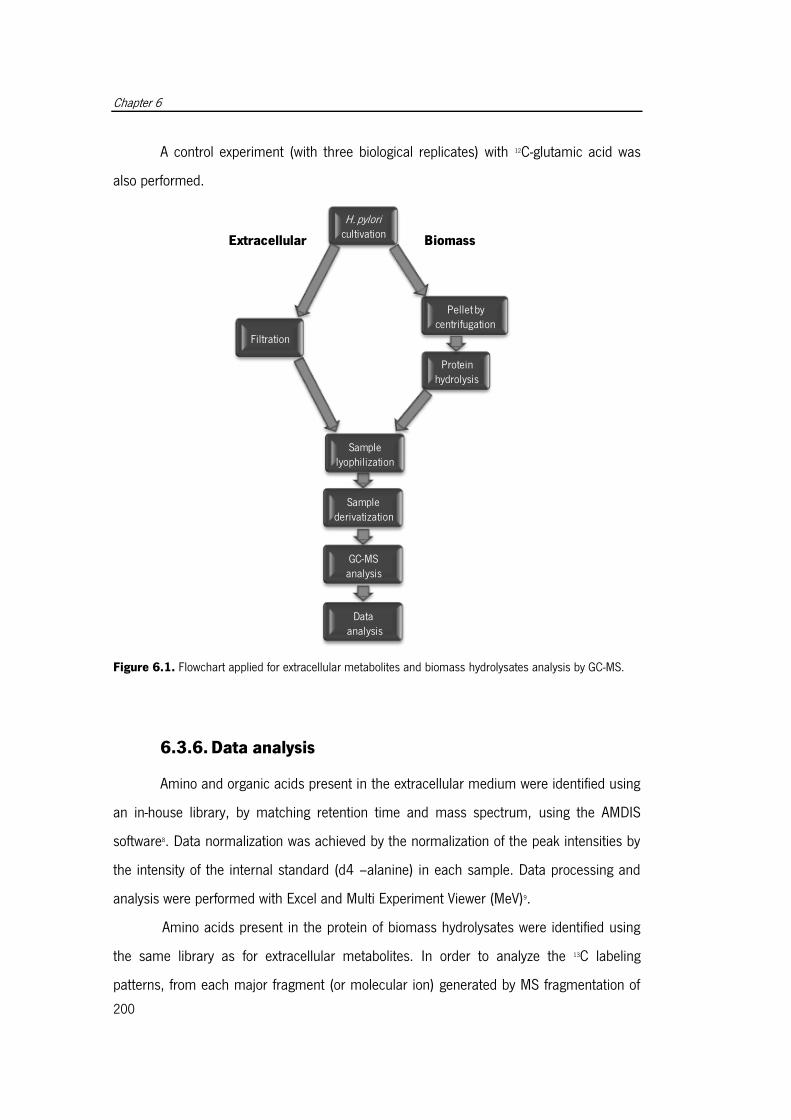
Chapter 6
200
A control experiment (with three biological replicates) with 12C-glutamic acid was
also performed.
Figure 6.1. Flowchart applied for extracellular metabolites and biomass hydrolysates analysis by GC-MS.
6.3.6. Data analysis
Amino and organic acids present in the extracellular medium were identified using
an in-house library, by matching retention time and mass spectrum, using the AMDIS
software8. Data normalization was achieved by the normalization of the peak intensities by
the intensity of the internal standard (d4 –alanine) in each sample. Data processing and
analysis were performed with Excel and Multi Experiment Viewer (MeV)9.
Amino acids present in the protein of biomass hydrolysates were identified using
the same library as for extracellular metabolites. In order to analyze the 13C labeling
patterns, from each major fragment (or molecular ion) generated by MS fragmentation of
H. pylori cultivation
Pellet by centrifugation
Filtration
Proteinhydrolysis
Sample lyophilization
Samplederivatization
GC-MS analysis
Dataanalysis
BiomassExtracellular
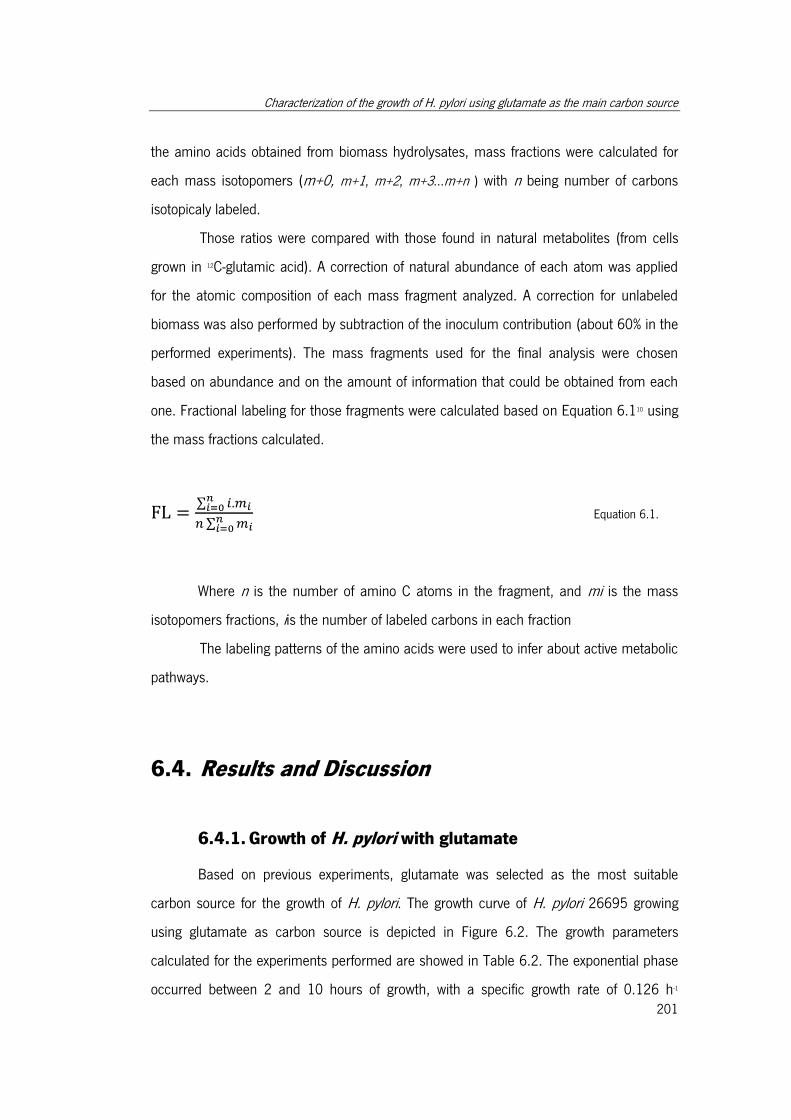
Characterization of the growth of H. pylori using glutamate as the main carbon source
201
the amino acids obtained from biomass hydrolysates, mass fractions were calculated for
each mass isotopomers (m+0, m+1, m+2, m+3...m+n ) with n being number of carbons
isotopicaly labeled.
Those ratios were compared with those found in natural metabolites (from cells
grown in 12C-glutamic acid). A correction of natural abundance of each atom was applied
for the atomic composition of each mass fragment analyzed. A correction for unlabeled
biomass was also performed by subtraction of the inoculum contribution (about 60% in the
performed experiments). The mass fragments used for the final analysis were chosen
based on abundance and on the amount of information that could be obtained from each
one. Fractional labeling for those fragments were calculated based on Equation 6.110 using
the mass fractions calculated.
∑
∑
Equation 6.1.
Where n is the number of amino C atoms in the fragment, and mi is the mass
isotopomers fractions, iis the number of labeled carbons in each fraction
The labeling patterns of the amino acids were used to infer about active metabolic
pathways.
6.4. Results and Discussion
6.4.1. Growth of H. pylori with glutamate
Based on previous experiments, glutamate was selected as the most suitable
carbon source for the growth of H. pylori. The growth curve of H. pylori 26695 growing
using glutamate as carbon source is depicted in Figure 6.2. The growth parameters
calculated for the experiments performed are showed in Table 6.2. The exponential phase
occurred between 2 and 10 hours of growth, with a specific growth rate of 0.126 h-1
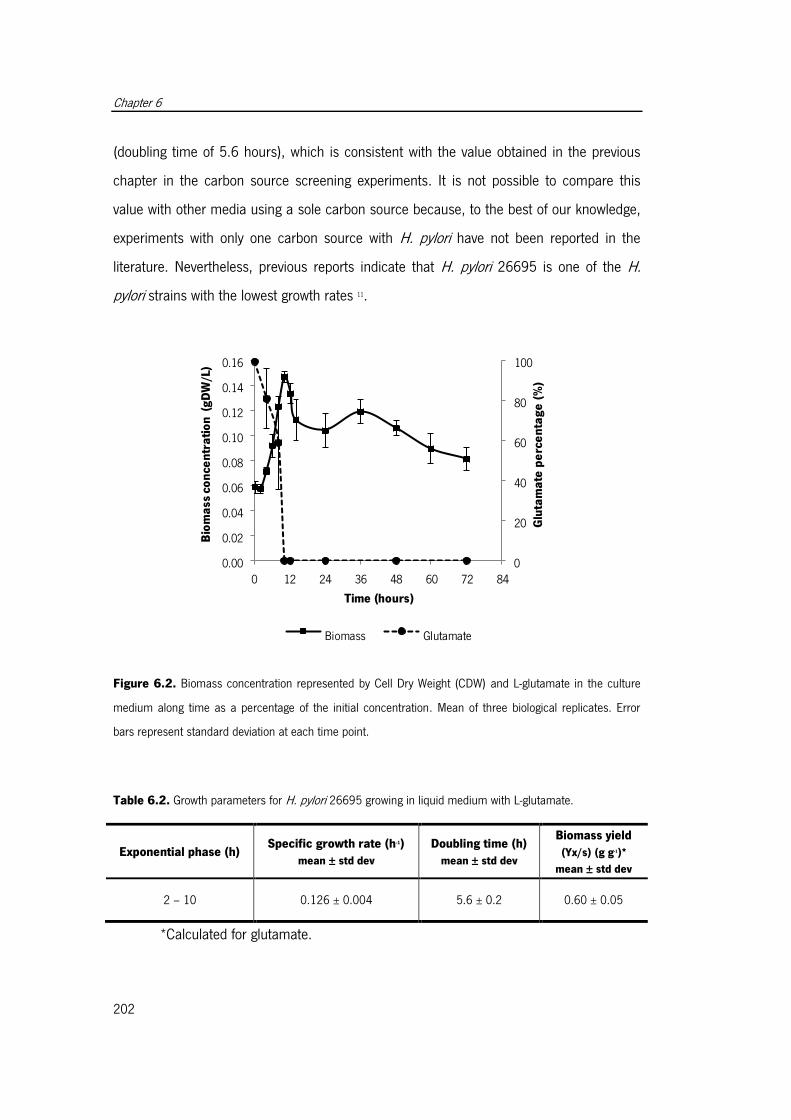
Chapter 6
202
(doubling time of 5.6 hours), which is consistent with the value obtained in the previous
chapter in the carbon source screening experiments. It is not possible to compare this
value with other media using a sole carbon source because, to the best of our knowledge,
experiments with only one carbon source with H. pylori have not been reported in the
literature. Nevertheless, previous reports indicate that H. pylori 26695 is one of the H.
pylori strains with the lowest growth rates 11.
0
20
40
60
80
100
0.00
0.02
0.04
0.06
0.08
0.10
0.12
0.14
0.16
0 12 24 36 48 60 72 84
Glu
tam
ate
pe
rce
nta
ge
(%
)
Bio
ma
ss c
on
cen
tra
tio
n (
gD
W/L
)
Time (hours)
Biomass Glutamate
Figure 6.2. Biomass concentration represented by Cell Dry Weight (CDW) and L-glutamate in the culture
medium along time as a percentage of the initial concentration. Mean of three biological replicates. Error
bars represent standard deviation at each time point.
Table 6.2. Growth parameters for H. pylori 26695 growing in liquid medium with L-glutamate.
Exponential phase (h) Specific growth rate (h-1)
mean ± std dev
Doubling time (h)
mean ± std dev
Biomass yield
(Yx/s) (g g-1)*
mean ± std dev
2 – 10 0.126 ± 0.004 5.6 ± 0.2 0.60 ± 0.05
*Calculated for glutamate.
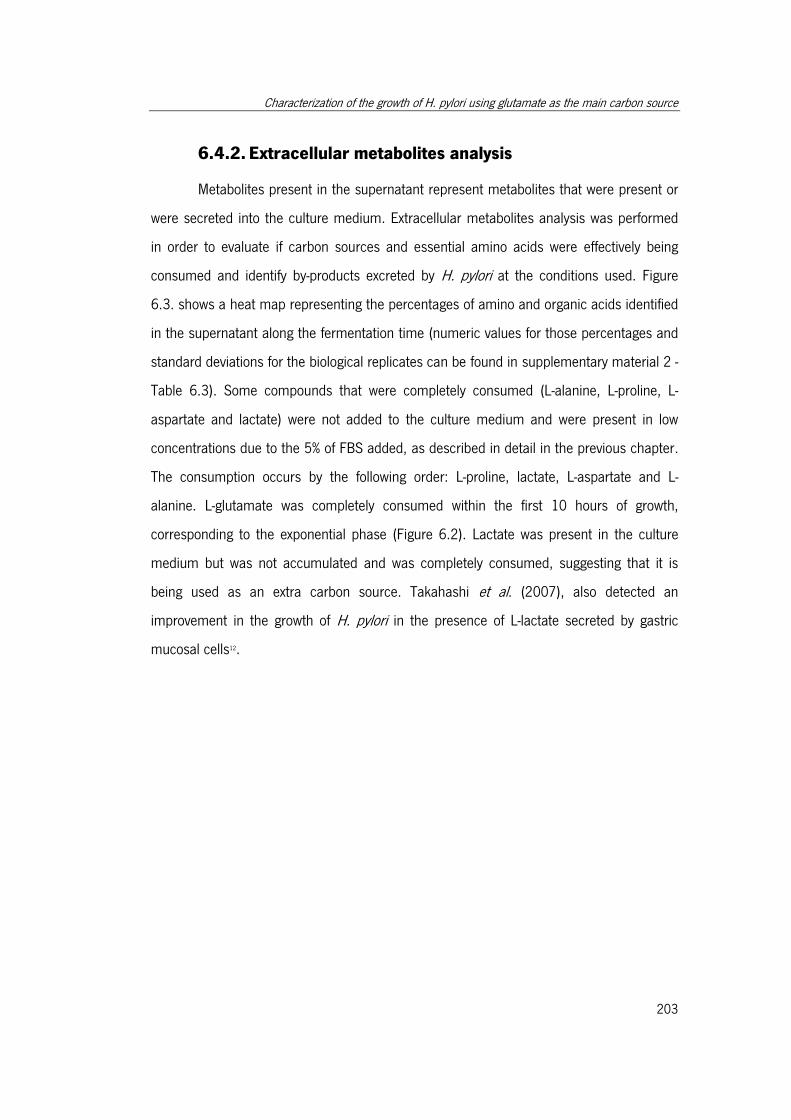
Characterization of the growth of H. pylori using glutamate as the main carbon source
203
6.4.2. Extracellular metabolites analysis
Metabolites present in the supernatant represent metabolites that were present or
were secreted into the culture medium. Extracellular metabolites analysis was performed
in order to evaluate if carbon sources and essential amino acids were effectively being
consumed and identify by-products excreted by H. pylori at the conditions used. Figure
6.3. shows a heat map representing the percentages of amino and organic acids identified
in the supernatant along the fermentation time (numeric values for those percentages and
standard deviations for the biological replicates can be found in supplementary material 2 -
Table 6.3). Some compounds that were completely consumed (L-alanine, L-proline, L-
aspartate and lactate) were not added to the culture medium and were present in low
concentrations due to the 5% of FBS added, as described in detail in the previous chapter.
The consumption occurs by the following order: L-proline, lactate, L-aspartate and L-
alanine. L-glutamate was completely consumed within the first 10 hours of growth,
corresponding to the exponential phase (Figure 6.2). Lactate was present in the culture
medium but was not accumulated and was completely consumed, suggesting that it is
being used as an extra carbon source. Takahashi et al. (2007), also detected an
improvement in the growth of H. pylori in the presence of L-lactate secreted by gastric
mucosal cells12.
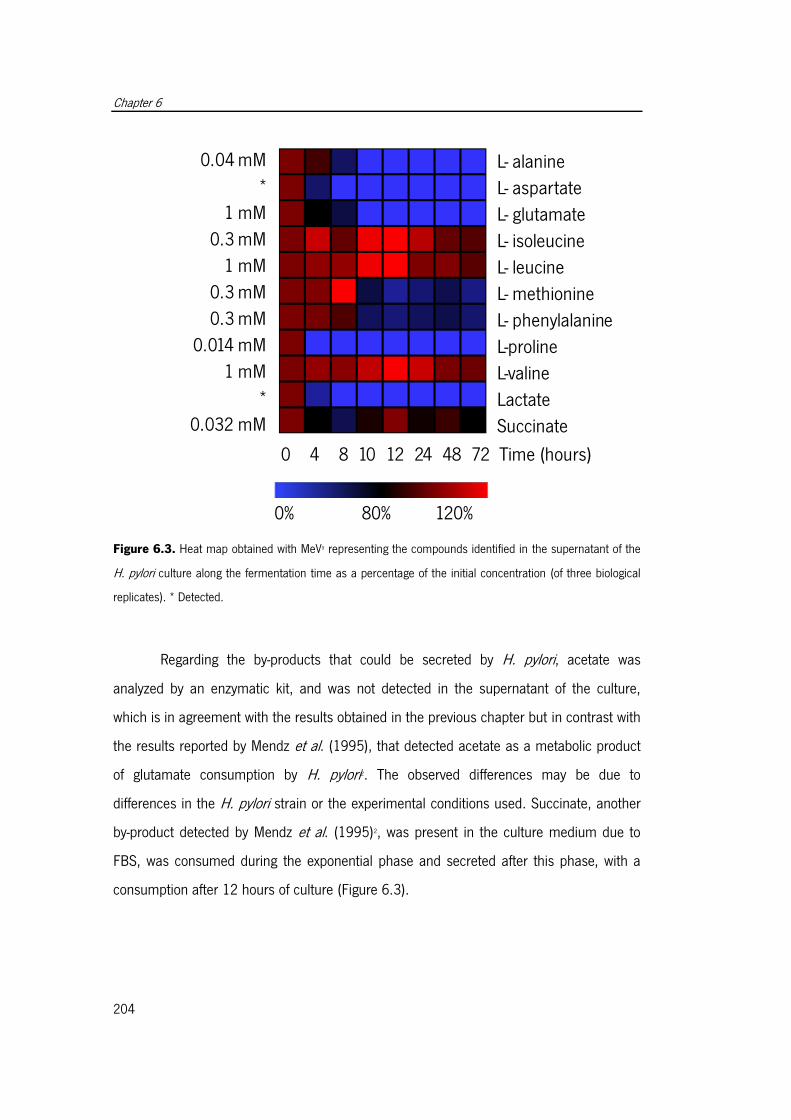
Chapter 6
204
Figure 6.3. Heat map obtained with MeV9 representing the compounds identified in the supernatant of the
H. pylori culture along the fermentation time as a percentage of the initial concentration (of three biological
replicates). * Detected.
Regarding the by-products that could be secreted by H. pylori, acetate was
analyzed by an enzymatic kit, and was not detected in the supernatant of the culture,
which is in agreement with the results obtained in the previous chapter but in contrast with
the results reported by Mendz et al. (1995), that detected acetate as a metabolic product
of glutamate consumption by H. pylori2. The observed differences may be due to
differences in the H. pylori strain or the experimental conditions used. Succinate, another
by-product detected by Mendz et al. (1995)2, was present in the culture medium due to
FBS, was consumed during the exponential phase and secreted after this phase, with a
consumption after 12 hours of culture (Figure 6.3).
L- alanine
L- aspartate
L- glutamate
L- isoleucine
L- leucine
L- methionine
L- phenylalanine
L-proline
L-valine
Lactate
Succinate
0 4 8 10 12 24 48 72 Time (hours)
0% 80% 120%
0.04 mM
*
1 mM
0.3 mM
1 mM
0.3 mM
0.3 mM
0.014 mM
1 mM
*
0.032 mM
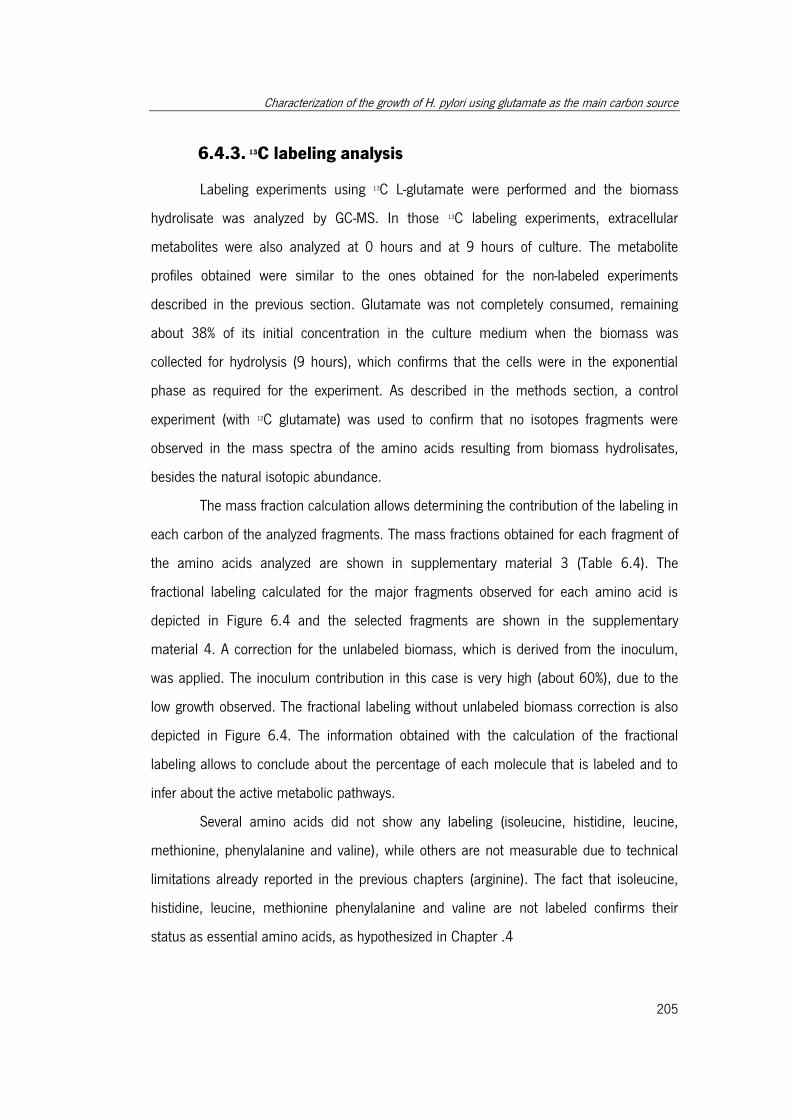
Characterization of the growth of H. pylori using glutamate as the main carbon source
205
6.4.3. 13C labeling analysis
Labeling experiments using 13C L-glutamate were performed and the biomass
hydrolisate was analyzed by GC-MS. In those 13C labeling experiments, extracellular
metabolites were also analyzed at 0 hours and at 9 hours of culture. The metabolite
profiles obtained were similar to the ones obtained for the non-labeled experiments
described in the previous section. Glutamate was not completely consumed, remaining
about 38% of its initial concentration in the culture medium when the biomass was
collected for hydrolysis (9 hours), which confirms that the cells were in the exponential
phase as required for the experiment. As described in the methods section, a control
experiment (with 12C glutamate) was used to confirm that no isotopes fragments were
observed in the mass spectra of the amino acids resulting from biomass hydrolisates,
besides the natural isotopic abundance.
The mass fraction calculation allows determining the contribution of the labeling in
each carbon of the analyzed fragments. The mass fractions obtained for each fragment of
the amino acids analyzed are shown in supplementary material 3 (Table 6.4). The
fractional labeling calculated for the major fragments observed for each amino acid is
depicted in Figure 6.4 and the selected fragments are shown in the supplementary
material 4. A correction for the unlabeled biomass, which is derived from the inoculum,
was applied. The inoculum contribution in this case is very high (about 60%), due to the
low growth observed. The fractional labeling without unlabeled biomass correction is also
depicted in Figure 6.4. The information obtained with the calculation of the fractional
labeling allows to conclude about the percentage of each molecule that is labeled and to
infer about the active metabolic pathways.
Several amino acids did not show any labeling (isoleucine, histidine, leucine,
methionine, phenylalanine and valine), while others are not measurable due to technical
limitations already reported in the previous chapters (arginine). The fact that isoleucine,
histidine, leucine, methionine phenylalanine and valine are not labeled confirms their
status as essential amino acids, as hypothesized in Chapter .4
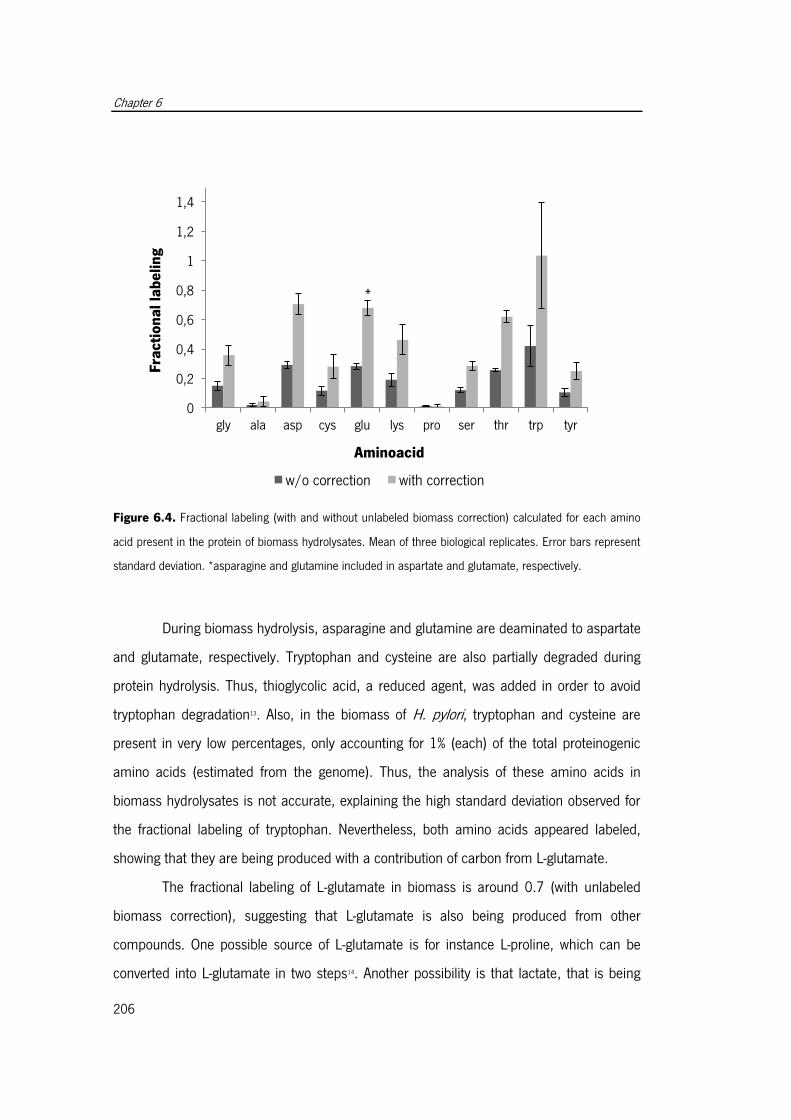
Chapter 6
206
Figure 6.4. Fractional labeling (with and without unlabeled biomass correction) calculated for each amino
acid present in the protein of biomass hydrolysates. Mean of three biological replicates. Error bars represent
standard deviation. *asparagine and glutamine included in aspartate and glutamate, respectively.
During biomass hydrolysis, asparagine and glutamine are deaminated to aspartate
and glutamate, respectively. Tryptophan and cysteine are also partially degraded during
protein hydrolysis. Thus, thioglycolic acid, a reduced agent, was added in order to avoid
tryptophan degradation13. Also, in the biomass of H. pylori, tryptophan and cysteine are
present in very low percentages, only accounting for 1% (each) of the total proteinogenic
amino acids (estimated from the genome). Thus, the analysis of these amino acids in
biomass hydrolysates is not accurate, explaining the high standard deviation observed for
the fractional labeling of tryptophan. Nevertheless, both amino acids appeared labeled,
showing that they are being produced with a contribution of carbon from L-glutamate.
The fractional labeling of L-glutamate in biomass is around 0.7 (with unlabeled
biomass correction), suggesting that L-glutamate is also being produced from other
compounds. One possible source of L-glutamate is for instance L-proline, which can be
converted into L-glutamate in two steps14. Another possibility is that lactate, that is being
0
0,2
0,4
0,6
0,8
1
1,2
1,4
gly ala asp cys glu lys pro ser thr trp tyr
Fra
ctio
na
l la
be
ling
Aminoacid
w/o correction with correction
*
Characterization of the growth of H. pylori using glutamate as the main carbon source
207
consumed, is also contributing with carbon by conversion to pyruvate (by lactate
dehydrogenase), and subsequent incorporation in the tricarboxylic acid (TCA) cycle, thus
contributing probably not only for unlabeled glutamate but also for other unlabeled amino
acids. L-glutamine, determined together with L-glutamate, is directly produced from L-
glutamate by glutamine synthetase (glnA, HP0512), with ATP consumption15, as described
in the previous chapter.
L-proline is the only amino acid that is not labeled, besides the known required
amino acids. L-proline, which is present in FBS, appeared in the extracellular culture
medium at a very low concentration (Figure 6.3). Testerman et al. (2006) determined that
L-proline is essential for H. pylori growth16, although in silico it is not an essential nutrient17,
as mentioned in Chapter 4. It seems that the need of L-proline could be strain specific18,19.
As mentioned in Chapter 4, there are two possible biosynthetic routes of L-proline in H.
pylori, the first one from L-glutamate (via L-glutamate 5-semialdehyde and L-1-pyrroline 5-
carboxylate), with the enzymes involved in that pathway identified by sequence homology20.
The second one is from L-arginine, an absolute requirement for H. pylori growth. In that
case, L-arginine is converted to ornithine, and subsequently to L-glutamate 5-
semialdehyde, which will be converted to L-proline via L-1-proline-carboxylase. However,
the conversion from ornithine to L-glutamate 5-semialdehyde is not proved in H. pylori21. In
our previous studies (Chapter 5), proline was tested as a carbon source and the observed
growth was quite low, although H. pylori seems to have the necessary enzymatic
capabilities to degrade it. Although some uncertainty remains, proline auxotrophy is not
proved in our results, since as shown in Figure 6.2 and Figure 6.3, L-proline is exhausted
from the culture medium at 4 hours of culture while the exponential phase lasts until 10
hours of culture. Given the lack of labeling, it is likely that L-proline is synthesized in H.
pylori from L-arginine rather than from L-glutamate, although further studies need to be
performed to confirm this hypothesis.
Another doubtful topic about the nutritional requirements of H. pylori is the need
of L-alanine. Similarly to L-proline, it has been described that L-alanine is an absolute
nutritional requirement for some strains18,19. In in silico experiments described by Thiele et
al. (2005), L-alanine can be used as a carbon source17, although being essential.
Chapter 6
208
Testerman et al. (2006) also described L-alanine as an essential amino acid16. In the
present results, the fractional labeling of L-alanine is around 0.04, with a high standard
deviation (0.04), explained by the low percentage of labeling. It is also important to
highlight that alanine is present in FBS, and the low percentage of labeling is also due to
that contribution. It seems that, despite the fact that there is a very high contribution of
unlabeled carbon, L-glutamate also can contribute to L-alanine synthesis. The most
plausible source of L-alanine is pyruvate, which could be obtained from L-lactate, as
discussed above. In fact, H. pylori possess alanine dehydrogenase (ald; HP1398), which
converts L-alanine into pyruvate and we have observed (results described in the previous
chapter) that alanine can indeed be used effectively as a carbon source. However, despite
the fact that the mentioned reaction is found to be reversible in several organisms, for
instance in Mycobacterium tuberculosis22, there is no certainty that it is reversible in H.
pylori. Additionally, using eQuilibrator23, a web interface created to estimate
thermodynamic parameters, it is possible to confirm that the most favorable reaction
direction in terms of energy is indeed the production of alanine from pyruvate. Another
possible pathway for L-alanine production from pyruvate, which is used by E. coli, is
through a transaminase such as valine-pyruvate transaminase or pyruvate-glutamate
transaminase21,24, which are not proved as present in H. pylori. Other authors also identified
alanine production from pyruvate and suggested that this conversion is due to the action of
a transaminase25–27.
The fractional labeling of aspartate (with asparagine included) is around 0.7,
showing that the carbon flow is passing through the TCA cycle with conversion of L-
glutamate into alpha-ketoglutarate and further incorporation into the TCA cycle, being L-
aspartate produced from oxaloacetate by a transaminase (aspartate transaminase). The
presence of this transaminase was inferred from homology15,20. Since L-asparagine is not an
absolute requirement for H. pylori growth, it is thought that L-asparagine is synthesized
from L-aspartate, via a tRNA dependent process in three steps21,28. L-lysine and L-threonine,
which have a fractional labeling of 0.5 and 0.61, respectively, can also be derived from L-
aspartate15,29. The biosynthesis of L-lysine is achieved from L-aspartate using the
Characterization of the growth of H. pylori using glutamate as the main carbon source
209
diaminopimelate pathway, involving succinylated intermediates21,30. Threonine, in turn, is
synthesized from L-aspartate via homoserine21.
The biosynthesis of L-tyrosine is known to be achieve with chorismate as
precursor, sharing several steps with L-tryptophan biosynthesis21,31 The fractional labeling of
tyrosine is around 0.25, showing again a high contribution of unlabeled carbon sources,
that could be explained by the low level of pyruvate labeling, as discussed previously.
It is described that L-serine biosynthesis occurs through 3-phospho-D-glycerate, an
intermediary of glycolysis/gluconeogenesis, and that it can be a precursor for the
production of L-cysteine and glycine. However, the fractional labeling of glycine is higher
(0.36) than the one observed for serine (0.28). Given the standard deviations observed,
this difference might not be meaningful. Nevertheless, if validated, this could mean that L-
serine is probably being produced from another pathway. The conversion of L-serine to
glycine is achieved by a single reaction catalyzed by serine hydroxymethyltransferase (glyA,
HP0183)21. There is no certainty about the reversibility of this reaction in H. pylori,
although for E. coli it is described that the conversion of glycine to L-serine can also occur,
meaning that glycine would have another biosynthetic route, such as from threonine by
threonine aldolase with the production of acetaldehyde. In fact, this biosynthetic route has
not been reported for H. pylori but is reported for other organisms such as E. coli21. Serine
can also be converted to pyruvate, as it was reported by Mendz et al. (1994) that serine is
one of the major sources of pyruvate26 in H. pylori. The fractional labeling of cysteine (0.28)
is similar to the one observed for serine (0.28), consistent with the described biosynthesis
of cysteine from serine in two steps through 0-acetyl-L-serine, with production of acetate21.
The metabolic pathways proposed to be active under the conditions used are
represented in Figure 6.5 .
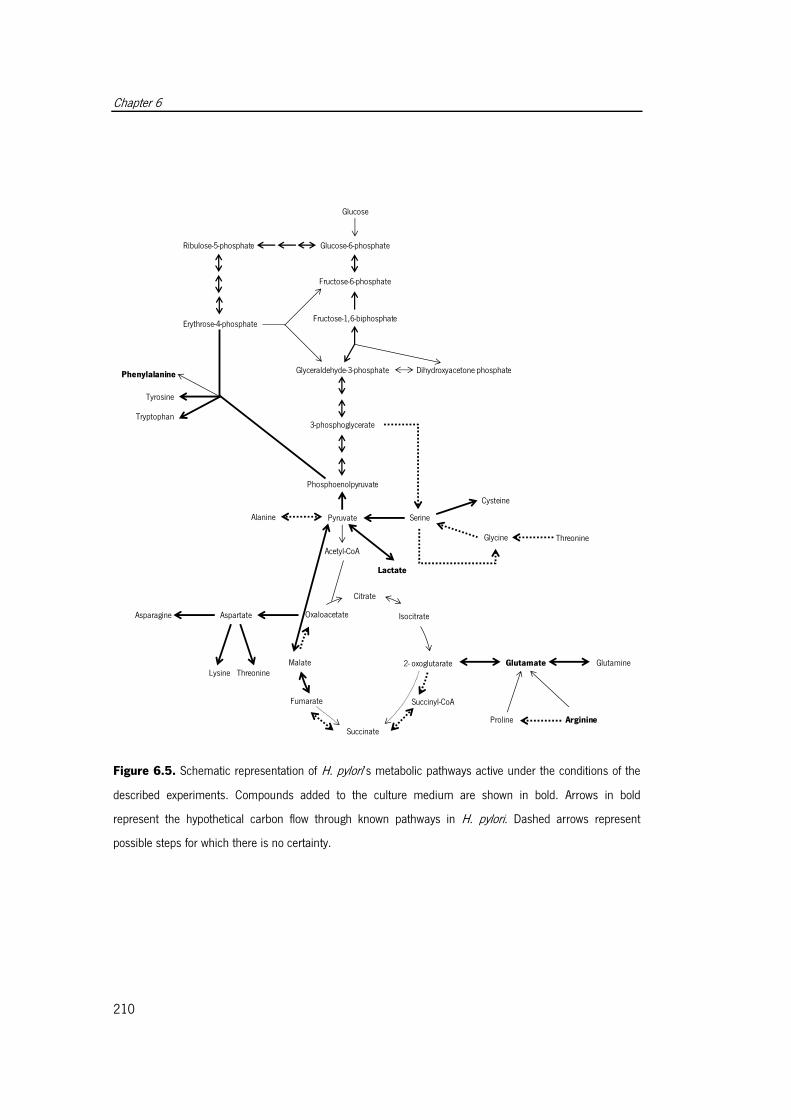
Chapter 6
210
Figure 6.5. Schematic representation of H. pylori’s metabolic pathways active under the conditions of the
described experiments. Compounds added to the culture medium are shown in bold. Arrows in bold
represent the hypothetical carbon flow through known pathways in H. pylori. Dashed arrows represent
possible steps for which there is no certainty.
Citrate
Isocitrate
2- oxoglutarateMalate
Oxaloacetate
Acetyl-CoA
Succinyl-CoA
Succinate
Fumarate
PyruvateAlanine
Glutamate
Serine
Cysteine
Glycine
Glutamine
AspartateAsparagine
Lysine Threonine
Proline Arginine
Phosphoenolpyruvate
3-phosphoglycerate
Glyceraldehyde-3-phosphate Dihydroxyacetone phosphate
Glucose
Glucose-6-phosphate
Fructose-6-phosphate
Fructose-1,6-biphosphate
Ribulose-5-phosphate
Erythrose-4-phosphate
Phenylalanine
Tyrosine
Tryptophan
Lactate
Threonine
Characterization of the growth of H. pylori using glutamate as the main carbon source
211
6.5. Conclusions
The present study attempted to analyze the growth of H. pylori using L-glutamate
as the main carbon source. An exometabolome analysis allowed determining the
consumption pattern of the compounds present in culture medium. Under the conditions
used, no acetate production was detected, showing that no fermentation is occurring.
Additionally, the carbon flow was determined using 13C L-glutamate as the carbon source
and measuring the labeling in proteinogenic amino acids, making this, to the best of our
knowledge, the first study conducted with the goal of determining the carbon flow in H.
pylori. Despite the use of fetal bovine serum, which contributed with lactate and
consequently with unlabeled carbon, it was proved that glutamate is indeed the main
carbon source under the conditions used and that it can be used as the sole carbon
source, as suggested by other authors2.
Overall, all amino acids suggested as non-essential in Chapter 4, except proline,
presented a 13C labeling pattern. Although a definite proof is still needed, our results
indicate that L-proline is not an essential amino acid and indicate that it is probably
produced from L-arginine, which is present in the culture medium as an essential amino
acid. Despite the controversy around the need of L-alanine as an absolute requirement, in
the present study a low percentage of 13C labeling was detected in L-alanine, suggesting it
can be produced by H. pylori, potentially from pyruvate. However, in order to confirm this
result, experiments without FBS are needed. Finally, contributing to clarify the controversy
around the existence of a complete TCA cycle in H. pylori, evidences were obtained with
the presence of labeled aspartate.
Finally, the fact that the amino acids isoleucine, histidine, leucine, methionine,
phenylalanine and valine did not exhibit any labeling corroborates their essentiality.
Chapter 6
212
6.6. References
1. Stark, R. M., Suleiman, M. S., Hassan, I. J., Greenman, J. & Millar, M. R. Amino acid
utilisation and deamination of glutamine and asparagine by Helicobacter pylori. J. Med.
Microbiol. 46, 793–800 (1997).
2. Mendz, G. L. & Hazell, S. L. Aminoacid utilization by Helicobacter pylori. Int. J. Biochem.
Cell Biol. 27, 1085–1093 (1995).
3. Basarab, G. S. et al. Design of inhibitors of Helicobacter pylori glutamate racemase as
selective antibacterial agents: incorporation of imidazoles onto a core
pyrazolopyrimidinedione scaffold to improve bioavailabilty. Bioorg. Med. Chem. Lett. 22,
5600–5607 (2012).
4. Tang, Y. J. et al. Advances in analysis of microbial metabolic fluxes via 13C isotopic
labeling. Mass Spectrom. Rev. 28, 362–375 (2009).
5. Zamboni, N. & Sauer, U. Novel biological insights through metabolomics and 13C-flux
analysis. Curr. Opin. Microbiol. 12, 553–558 (2009).
6. Wittmann, C. Fluxome analysis using GC-MS. Microb. Cell Fact. 6, 1–17 (2007).
7. Smart, K. F., Aggio, R. B. M., Van Houtte, J. R. & Villas-Bôas, S. G. Analytical platform for
metabolome analysis of microbial cells using methyl chloroformate derivatization followed
by gas chromatography-mass spectrometry. Nat. Protoc. 5, 1709–1729 (2010).
8. Davies, A. N. The new automated mass spectrometry deconvolution and identification
system (AMDIS). Spectrosc. Eur. 10, 24–27 (1998).
9. Saeed, A. I. et al. TM4: a free, open-source system for microarray data management and
analysis. Biotechniques 34, 374–378 (2003).
10. Nanchen, A., Fuhrer, T. & Sauer, U. in Methods Mol. Biol. vol. 358 Metabolomics Protoc.
(Weckwerth, W.) 358, 177–197 (Humana Press Inc., 2007).
11. Douraghi, M. et al. Comparative evaluation of three supplements for Helicobacter pylori
growth in liquid culture. Curr. Microbiol. 60, 254–262 (2010).
12. Takahashi, T. et al. L-lactic acid secreted from gastric mucosal cells enhances growth of
Helicobacter pylori. Helicobacter 12, 532–540 (2007).
13. Davidson, I. in Methods Mol. Biol. Vol. 211 Protein Seq. Protoc. (Smith, B. J.) 211, 111–
122 (2003).

Characterization of the growth of H. pylori using glutamate as the main carbon source
213
14. Krishnan, N. & Becker, D. F. Oxygen reactivity of PutA from Helicobacter species and
proline-linked oxidative stress. J. Bacteriol. 188, 1227–1235 (2006).
15. Tomb, J.-F. et al. The complete genome sequence of the gastric pathogen Helicobacter
pylori. Nature 388, 539–547 (1997).
16. Testerman, T. L., Conn, P. B., Mobley, H. L. T. & McGee, D. J. Nutritional requirements
and antibiotic resistance patterns of Helicobacter species in chemically defined media. J.
Clin. Microbiol. 44, 1650–1658 (2006).
17. Thiele, I., Vo, T. D., Price, N. D. & Palsson, B. Ø. Expanded metabolic reconstruction of
Helicobacter pylori (iIT341 GSM/GPR ): an in silico genome-scale characterization of
single- and double-deletion mutants. J. Bacteriol. 187, 5818–5830 (2005).
18. Nedenskov, P. Nutritional requirements for growth of Helicobacter pylori. Appl. Environ.
Microbiol. 60, 3450–3453 (1994).
19. Reynolds, D. J. & Penn, C. W. Characteristics of Helicobacter pylori growth in a defined
medium and determination of its amino acid requirements. Microbiology 140, 2649–
2956 (1994).
20. Magrane, M. & Consortium, U. UniProt Knowledgebase: a hub of integrated protein data.
Database 2011, 1–13 (2011).
21. Caspi, R. et al. The MetaCyc database of metabolic pathways and enzymes and the BioCyc
collection of pathway/genome databases. Nucleic Acids Res. 40, D742–D753 (2012).
22. Hutter, B. & Singh, M. Properties of the 40 kDa antigen of Mycobacterium tuberculosis, a
functional L-alanine dehydrogenase. Biochem. J. 672, 669–672 (1999).
23. Flamholz, A., Noor, E., Bar-Even, A. & Milo, R. eQuilibrator - the biochemical
thermodynamics calculator. Nucleic Acids Res. 40, D770–D775 (2012).
24. Rudman, D. & Meister, A. Transamination in Escherichia coli. J. Biol. Chem. 200, 591–
604 (1953).
25. Chalk, P. A., Roberts, A. D. & Blows, W. M. Metabolism of pyruvate and glucose by intact
cells of Helicobacter pylori studied by 13C NMR spectroscopy. Microbiology 140, 2085–
2092 (1994).
26. Mendz, G. L., Hazell, S. L. & van Gorkom, L. Pyruvate metabolism in Helicobacter pylori.
Arch. Microbiol. 162, 187–192 (1994).
Chapter 6
214
27. Kaihovaara, P., Höök-Nikanne, J., Uusi-Oukari, M., Kosunen, T. U. & Salaspuro, M.
Flavodoxin-dependent pyruvate oxidation, acetate production and metronidazole reduction
by Helicobacter pylori. J. Antimicrob. Chemother. 41, 171–177 (1998).
28. Fischer, F. et al. The asparagine-transamidosome from Helicobacter pylori: a dual-kinetic
mode in non-discriminating aspartyl-tRNA synthetase safeguards the genetic code. Nucleic
Acids Res. 40, 4965–4976 (2012).
29. Doig, P. et al. Helicobacter pylori physiology predicted from genomic comparison of two
strains. Microbiol. Mol. Biol. Rev. 63, 675–707 (1999).
30. Velasco, a M., Leguina, J. I. & Lazcano, A. Molecular evolution of the lysine biosynthetic
pathways. J. Mol. Evol. 55, 445–459 (2002).
31. Marais, A., Mendz, G. L., Hazell, S. L. & Mégraud, F. Metabolism and genetics of
Helicobacter pylori: the genome era. Microbiol. Mol. Biol. Rev. 63, 642–674 (1999).
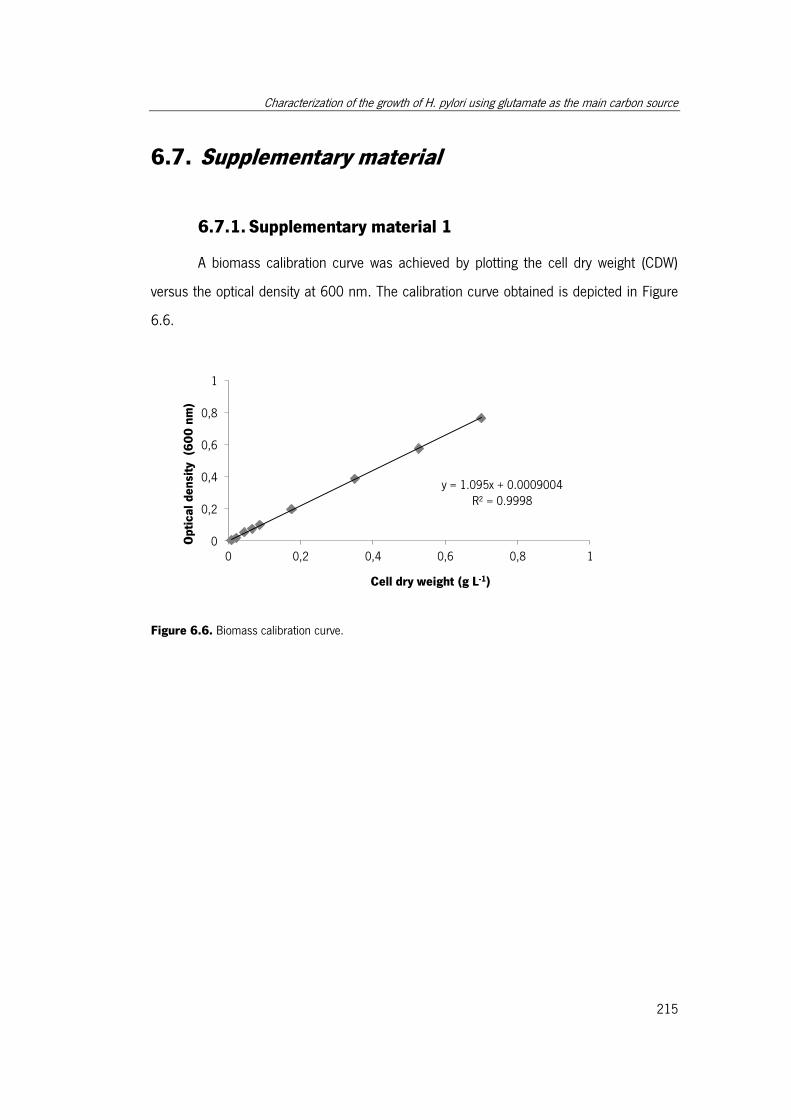
Characterization of the growth of H. pylori using glutamate as the main carbon source
215
6.7. Supplementary material
6.7.1. Supplementary material 1
A biomass calibration curve was achieved by plotting the cell dry weight (CDW)
versus the optical density at 600 nm. The calibration curve obtained is depicted in Figure
6.6.
Figure 6.6. Biomass calibration curve.
y = 1.095x + 0.0009004 R² = 0.9998
0
0,2
0,4
0,6
0,8
1
0 0,2 0,4 0,6 0,8 1
Op
tica
l d
en
sity
(6
00
nm
)
Cell dry weight (g L-1)
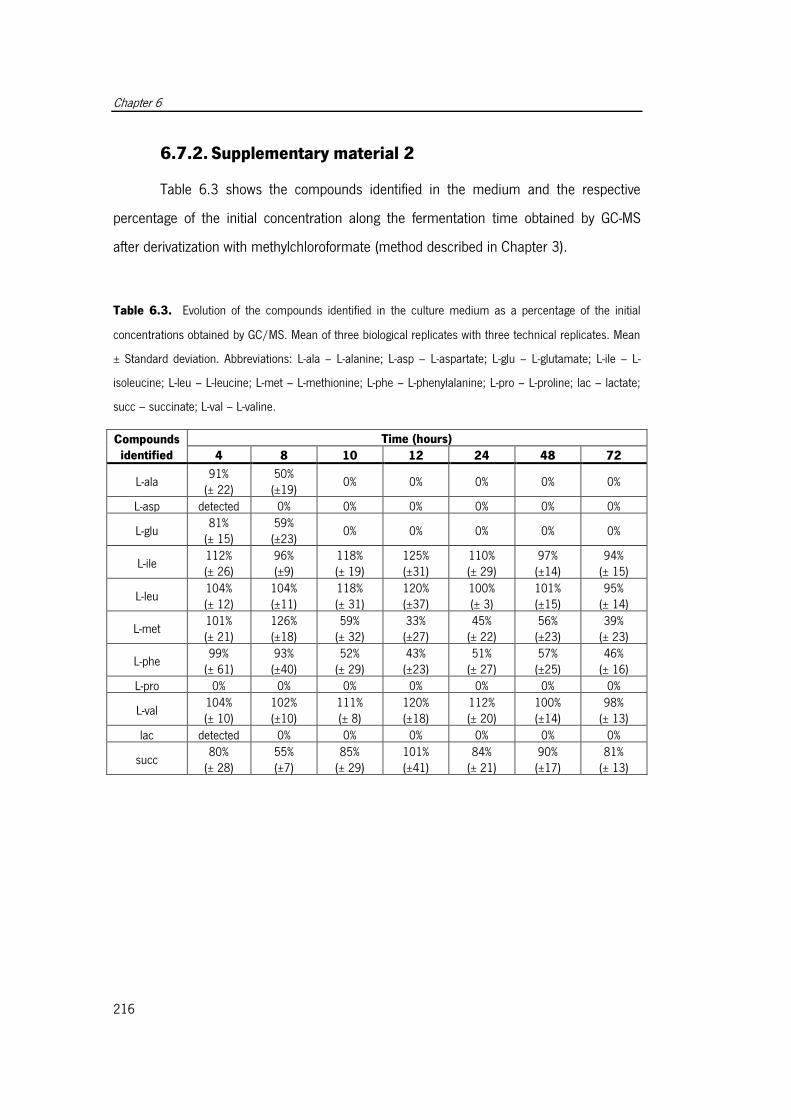
Chapter 6
216
6.7.2. Supplementary material 2
Table 6.3 shows the compounds identified in the medium and the respective
percentage of the initial concentration along the fermentation time obtained by GC-MS
after derivatization with methylchloroformate (method described in Chapter 3).
Table 6.3. Evolution of the compounds identified in the culture medium as a percentage of the initial
concentrations obtained by GC/MS. Mean of three biological replicates with three technical replicates. Mean
± Standard deviation. Abbreviations: L-ala – L-alanine; L-asp – L-aspartate; L-glu – L-glutamate; L-ile – L-
isoleucine; L-leu – L-leucine; L-met – L-methionine; L-phe – L-phenylalanine; L-pro – L-proline; lac – lactate;
succ – succinate; L-val – L-valine.
Compounds identified
Time (hours)
4 8 10 12 24 48 72
L-ala 91%
(± 22) 50%
(±19) 0% 0% 0% 0% 0%
L-asp detected 0% 0% 0% 0% 0% 0%
L-glu 81%
(± 15) 59%
(±23) 0% 0% 0% 0% 0%
L-ile 112% (± 26)
96% (±9)
118% (± 19)
125% (±31)
110% (± 29)
97% (±14)
94% (± 15)
L-leu 104% (± 12)
104% (±11)
118% (± 31)
120% (±37)
100% (± 3)
101% (±15)
95% (± 14)
L-met 101% (± 21)
126% (±18)
59% (± 32)
33% (±27)
45% (± 22)
56% (±23)
39% (± 23)
L-phe 99%
(± 61) 93%
(±40) 52%
(± 29) 43% (±23)
51% (± 27)
57% (±25)
46% (± 16)
L-pro 0% 0% 0% 0% 0% 0% 0%
L-val 104% (± 10)
102% (±10)
111% (± 8)
120% (±18)
112% (± 20)
100% (±14)
98% (± 13)
lac detected 0% 0% 0% 0% 0% 0%
succ 80%
(± 28) 55% (±7)
85% (± 29)
101% (±41)
84% (± 21)
90% (±17)
81% (± 13)
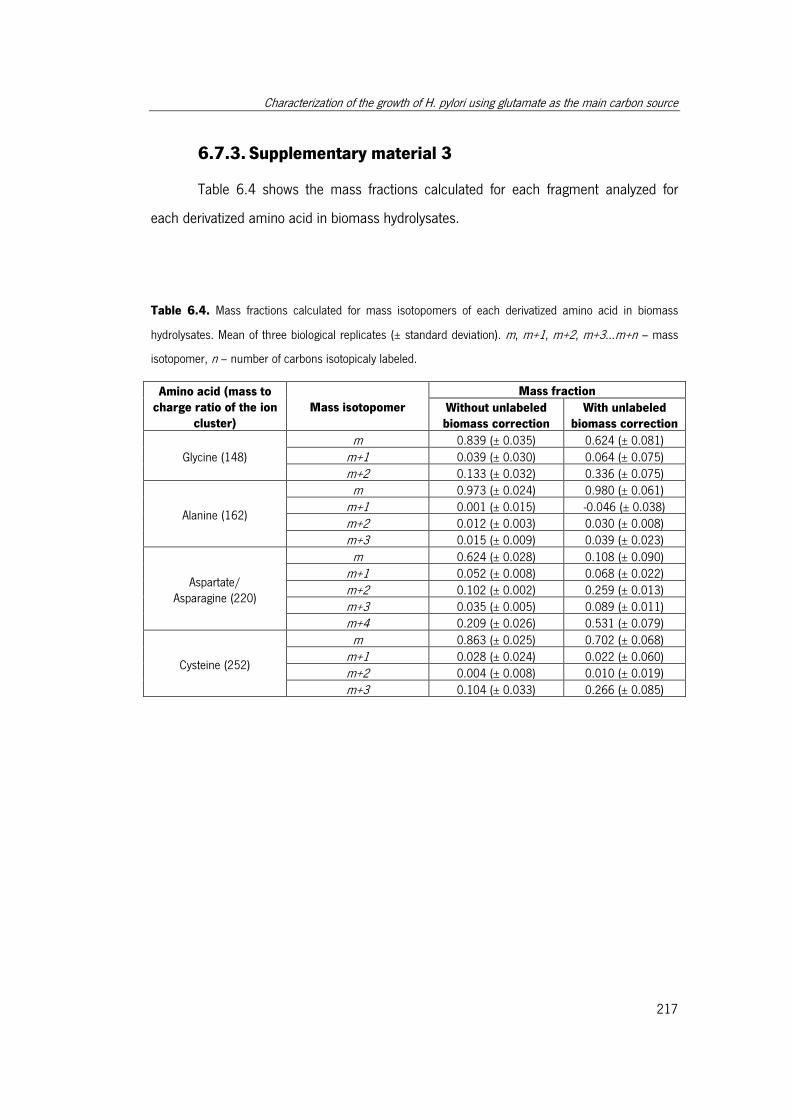
Characterization of the growth of H. pylori using glutamate as the main carbon source
217
6.7.3. Supplementary material 3
Table 6.4 shows the mass fractions calculated for each fragment analyzed for
each derivatized amino acid in biomass hydrolysates.
Table 6.4. Mass fractions calculated for mass isotopomers of each derivatized amino acid in biomass
hydrolysates. Mean of three biological replicates (± standard deviation). m, m+1, m+2, m+3...m+n – mass
isotopomer, n – number of carbons isotopicaly labeled.
Amino acid (mass to charge ratio of the ion
cluster) Mass isotopomer
Mass fraction
Without unlabeled biomass correction
With unlabeled biomass correction
Glycine (148)
m 0.839 (± 0.035) 0.624 (± 0.081)
m+1 0.039 (± 0.030) 0.064 (± 0.075)
m+2 0.133 (± 0.032) 0.336 (± 0.075)
Alanine (162)
m 0.973 (± 0.024) 0.980 (± 0.061)
m+1 0.001 (± 0.015) -0.046 (± 0.038)
m+2 0.012 (± 0.003) 0.030 (± 0.008)
m+3 0.015 (± 0.009) 0.039 (± 0.023)
Aspartate/ Asparagine (220)
m 0.624 (± 0.028) 0.108 (± 0.090)
m+1 0.052 (± 0.008) 0.068 (± 0.022)
m+2 0.102 (± 0.002) 0.259 (± 0.013)
m+3 0.035 (± 0.005) 0.089 (± 0.011)
m+4 0.209 (± 0.026) 0.531 (± 0.079)
Cysteine (252)
m 0.863 (± 0.025) 0.702 (± 0.068)
m+1 0.028 (± 0.024) 0.022 (± 0.060)
m+2 0.004 (± 0.008) 0.010 (± 0.019)
m+3 0.104 (± 0.033) 0.266 (± 0.085)

Chapter 6
218
Table 6.4.Mass fractions calculated for mass isotopomers of each derivatized amino acid in biomass
hydrolysates. Mean of three biological replicates (± standard deviation). m, m+1, m+2, m+3...m+n – mass
isotopomer, n – number of carbons isotopicaly labeled. (Continue)
Amino acid (mass to charge ratio of the ion
cluster) Mass isotopomer
Mass fraction
Without unlabeled biomass correction
With unlabeled biomass correction
Glutamate/ Glutamine (234)
m 0.669 (± 0.027) 0.240 (± 0.071)
m+1 0.018 (± 0.011) -0.034 (± 0.027)
m+2 0.034 (± 0.004) 0.085 (± 0.011)
m+3 0.061 (± 0.007) 0.155 (± 0.015)
m+4 0.029 (± 0.007) 0.073 (± 0.017)
m+5 0.213 (± 0.018) 0.542 (± 0.053)
Lysine (277)
m 0.647 (± 0.093) 0.202 (± 0.222)
m+1 0.055 (± 0.026) 0.045 (± 0.069)
m+2 0.055 (± 0.028) 0.136 (± 0.070)
m+3 0.107 (± 0.022) 0.270 (± 0.052)
m+4 0.089 (± 0.029) 0.218 (± 0.072)
m+5 0.017 (± 0.007) 0.042 (± 0.018)
m+6 0.040 (± 0.017) 0.101 (± 0.042)
Proline (128)
m 0.958 (± 0.010) 0.958 (± 0.025)
m+1 0.042 (± 0.005) 0.043 (± 0.013)
m+2 -0.0006 (± 0.007) -0.002 (± 0.010)
m+3 -0.0003 (± 0.0001) -0.0007 (± 0.0004)
m+4 0.0008 (± 0.001) 0.002 (± 0.003)
Serine (178)
m 0.846 (± 0.016) 0.658 (± 0.034)
m+1 0.040 (± 0.006) 0.053 (± 0.014)
m+2 0.039 (± 0.002) 0.099 (± 0.003)
m+3 0.082 (± 0.015) 0.207 (± 0.033)
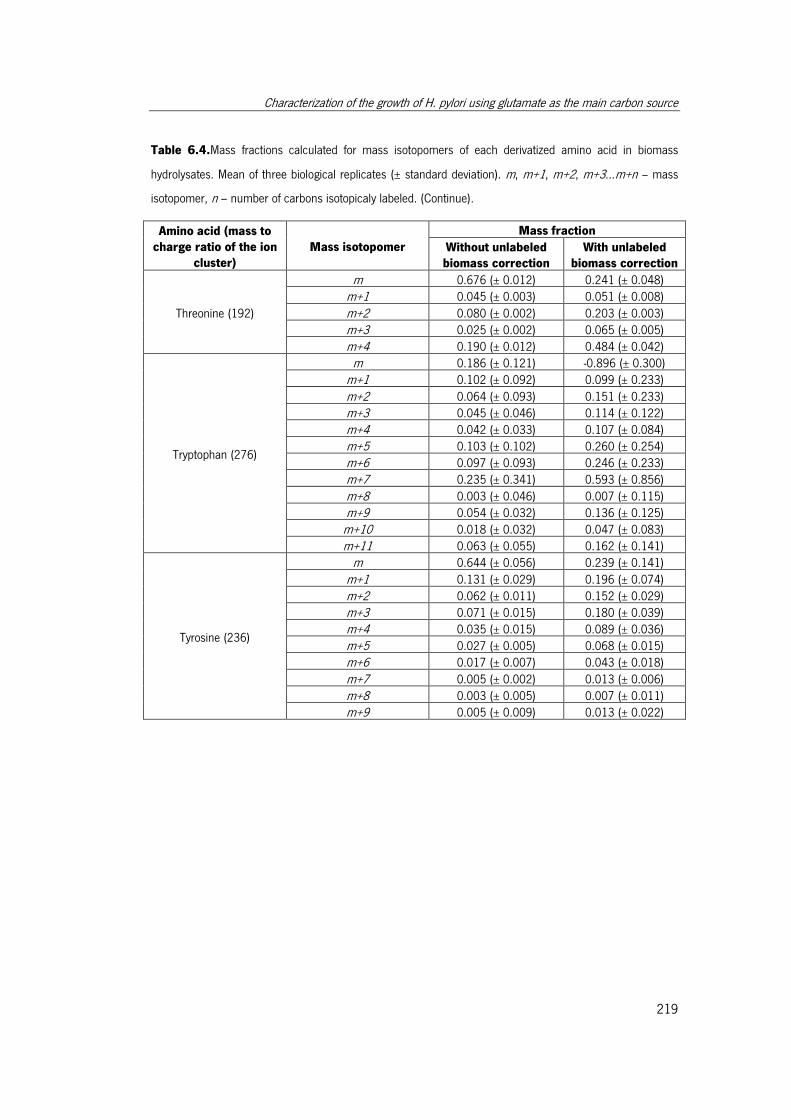
Characterization of the growth of H. pylori using glutamate as the main carbon source
219
Table 6.4.Mass fractions calculated for mass isotopomers of each derivatized amino acid in biomass
hydrolysates. Mean of three biological replicates (± standard deviation). m, m+1, m+2, m+3...m+n – mass
isotopomer, n – number of carbons isotopicaly labeled. (Continue).
Amino acid (mass to charge ratio of the ion
cluster) Mass isotopomer
Mass fraction
Without unlabeled biomass correction
With unlabeled biomass correction
Threonine (192)
m 0.676 (± 0.012) 0.241 (± 0.048)
m+1 0.045 (± 0.003) 0.051 (± 0.008)
m+2 0.080 (± 0.002) 0.203 (± 0.003)
m+3 0.025 (± 0.002) 0.065 (± 0.005)
m+4 0.190 (± 0.012) 0.484 (± 0.042)
Tryptophan (276)
m 0.186 (± 0.121) -0.896 (± 0.300)
m+1 0.102 (± 0.092) 0.099 (± 0.233)
m+2 0.064 (± 0.093) 0.151 (± 0.233)
m+3 0.045 (± 0.046) 0.114 (± 0.122)
m+4 0.042 (± 0.033) 0.107 (± 0.084)
m+5 0.103 (± 0.102) 0.260 (± 0.254)
m+6 0.097 (± 0.093) 0.246 (± 0.233)
m+7 0.235 (± 0.341) 0.593 (± 0.856)
m+8 0.003 (± 0.046) 0.007 (± 0.115)
m+9 0.054 (± 0.032) 0.136 (± 0.125)
m+10 0.018 (± 0.032) 0.047 (± 0.083)
m+11 0.063 (± 0.055) 0.162 (± 0.141)
Tyrosine (236)
m 0.644 (± 0.056) 0.239 (± 0.141)
m+1 0.131 (± 0.029) 0.196 (± 0.074)
m+2 0.062 (± 0.011) 0.152 (± 0.029)
m+3 0.071 (± 0.015) 0.180 (± 0.039)
m+4 0.035 (± 0.015) 0.089 (± 0.036)
m+5 0.027 (± 0.005) 0.068 (± 0.015)
m+6 0.017 (± 0.007) 0.043 (± 0.018)
m+7 0.005 (± 0.002) 0.013 (± 0.006)
m+8 0.003 (± 0.005) 0.007 (± 0.011)
m+9 0.005 (± 0.009) 0.013 (± 0.022)
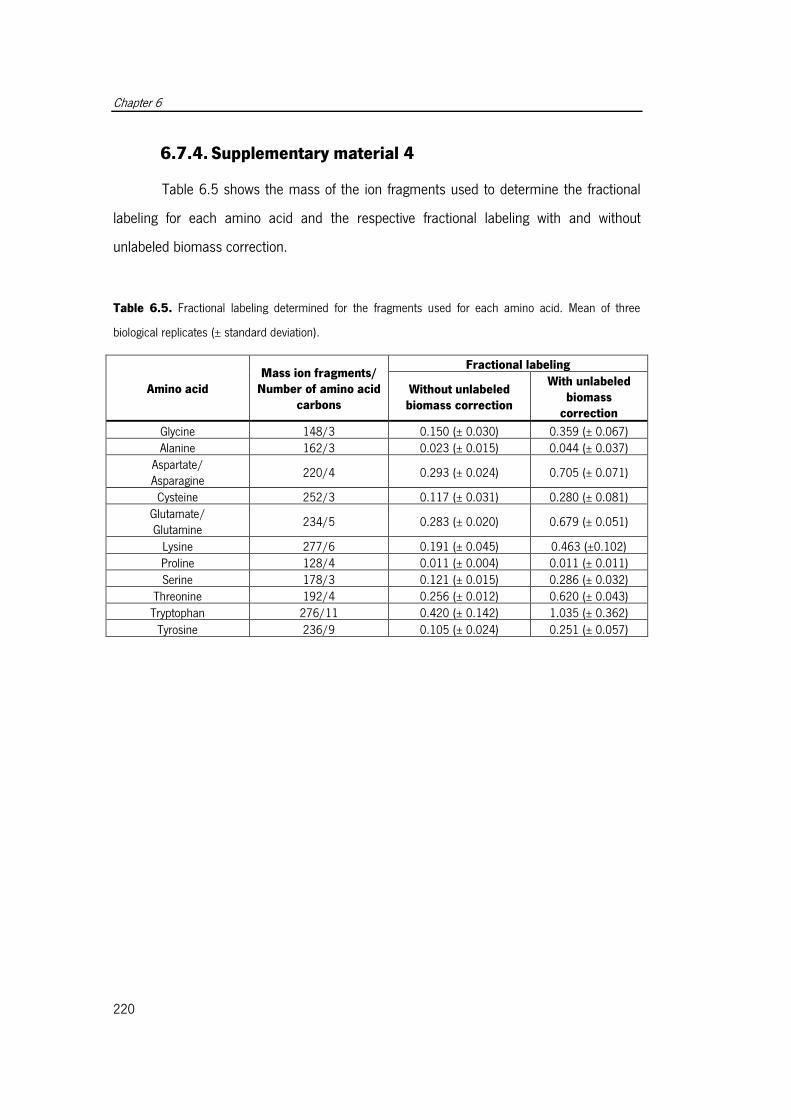
Chapter 6
220
6.7.4. Supplementary material 4
Table 6.5 shows the mass of the ion fragments used to determine the fractional
labeling for each amino acid and the respective fractional labeling with and without
unlabeled biomass correction.
Table 6.5. Fractional labeling determined for the fragments used for each amino acid. Mean of three
biological replicates (± standard deviation).
Amino acid Mass ion fragments/
Number of amino acid carbons
Fractional labeling
Without unlabeled biomass correction
With unlabeled biomass
correction
Glycine 148/3 0.150 (± 0.030) 0.359 (± 0.067)
Alanine 162/3 0.023 (± 0.015) 0.044 (± 0.037)
Aspartate/ Asparagine
220/4 0.293 (± 0.024) 0.705 (± 0.071)
Cysteine 252/3 0.117 (± 0.031) 0.280 (± 0.081)
Glutamate/ Glutamine
234/5 0.283 (± 0.020) 0.679 (± 0.051)
Lysine 277/6 0.191 (± 0.045) 0.463 (±0.102)
Proline 128/4 0.011 (± 0.004) 0.011 (± 0.011)
Serine 178/3 0.121 (± 0.015) 0.286 (± 0.032)
Threonine 192/4 0.256 (± 0.012) 0.620 (± 0.043)
Tryptophan 276/11 0.420 (± 0.142) 1.035 (± 0.362)
Tyrosine 236/9 0.105 (± 0.024) 0.251 (± 0.057)

Chapter 7 7 Reconstruction and validation of a genome--scale
metabolic model for Helicobacter pylori 26695
Tiago Resende, Daniela Matilde Correia, Sophia Santos, and Isabel Rocha
Reconstruction and validation of a genome-scale metabolic model for Helicobacter pylori 26695
(To be submitted)

Reconstruction and validation of a genome-scale metabolic model for H. pylori 26695
223
7.1 Abstract
Helicobacter pylori is a pathogenic bacterium that colonizes the human gastric epithelia,
causing duodenal and gastric ulcers, and gastric cancer. The genome of H. pylori 26695 has
been previously sequenced and annotated. In addition, two genome-scale metabolic models have
been developed. In order to maintain accurate and relevant the information on this bacterium
and to generate new information and new approaches for its analysis, the assignment of new
functions to H. pylori 26695’s genes was performed and a new genome-scale metabolic model
was reconstructed.
Model reconstruction originated the iTR370 metabolic model, a compartmentalized
model containing 370 genes and composed by 666 different reactions and 432 metabolites.
Gene essentiality analysis was performed to assess the predictive capabilities of the model, and
growth simulations were performed using experimental data to adjust the nutrients uptake rates.
Finally, the flux distributions predicted by the model using L-glutamate as the sole carbon source
were analyzed.
It is shown that the iTR370 metabolic model is useful for predicting H. pylori’s
phenotypic responses to gene deletions, and allows a very good agreement with experimental
results obtained for cultivation experiments using a minimal medium. This model provides
relevant biological information for the scientific community dealing with this organism by allowing
the elucidation of new features in H. pylori’s metabolism, assisting in the identification of new
drug targets and the development of new approaches for enhanced treatments.
Keywords: Helicobacter pylori. Genome-scale metabolic model. Genome re-annotation.
Chapter 7
224
7.2 Introduction
The introduction of whole-genome high-throughput sequencing techniques and the
development of several bioinformatics tools have been generating a vast amount of new
information, changing completely our understanding on hundreds of species1. However, in this
post-genomic era, assigning functions to genes in a sequenced genome is still a complex and
difficult task, involving several steps2.
H. pylori 26695, which presents a small size genome of around 1.67 Mbp with an
average C+G content of 39%, was the first H. pylori strain to have its genome sequenced in
19973. The last re-annotation of this organism was published in 2003 and generated a specific
on-line database for H. pylori (PyloriGene)4. It also reduced the percentage of hypothetical
proteins from approximately 40% to 33%, allowing the reassignment of functions to 108 CDS
(coding sequences)4
The reconstruction of metabolic networks allows the development of a genome-scale
metabolic model based on the well-known stoichiometry of biochemical reactions catalyzed by
the enzymes encoded in the annotated genes of an organism5,6. These models can then be used
for simulating in silico the phenotypic behavior of a microorganism under different environmental
and genetic conditions, thus representing an important tool in metabolic engineering and drug
design5. Numerous drugs used for the treatment of pathogenic bacteria target metabolic
enzymes, and therefore genome-scale modeling of bacterial metabolism provides a powerful tool
to identify and analyze pathways required for infection7.
Two genome-scale metabolic models have been published for H. pylori 266958,9. The first
model was published in 2002 (iCS291) with 291 genes and 388 reactions8 and, in 2005, an
updated version was published, which accounts for 341 genes and 476 reactions, also including
355 gene-protein-reaction (GPR) associations. These models were constructed with information
mainly taken from the genome, as very scarce biochemical knowledge was available for H. pylori.
However, in the last years, a vast amount of data have been published that can be used to
upgrade and refine the published metabolic models. A new genome re-anotation was also
recently published by the authors of this chapter10. As such, the aim of this work was to
reconstruct a new genome-scale metabolic model using the updated re-annotation. Also, the
physiological data collected in previous chapters was used to validate the model.
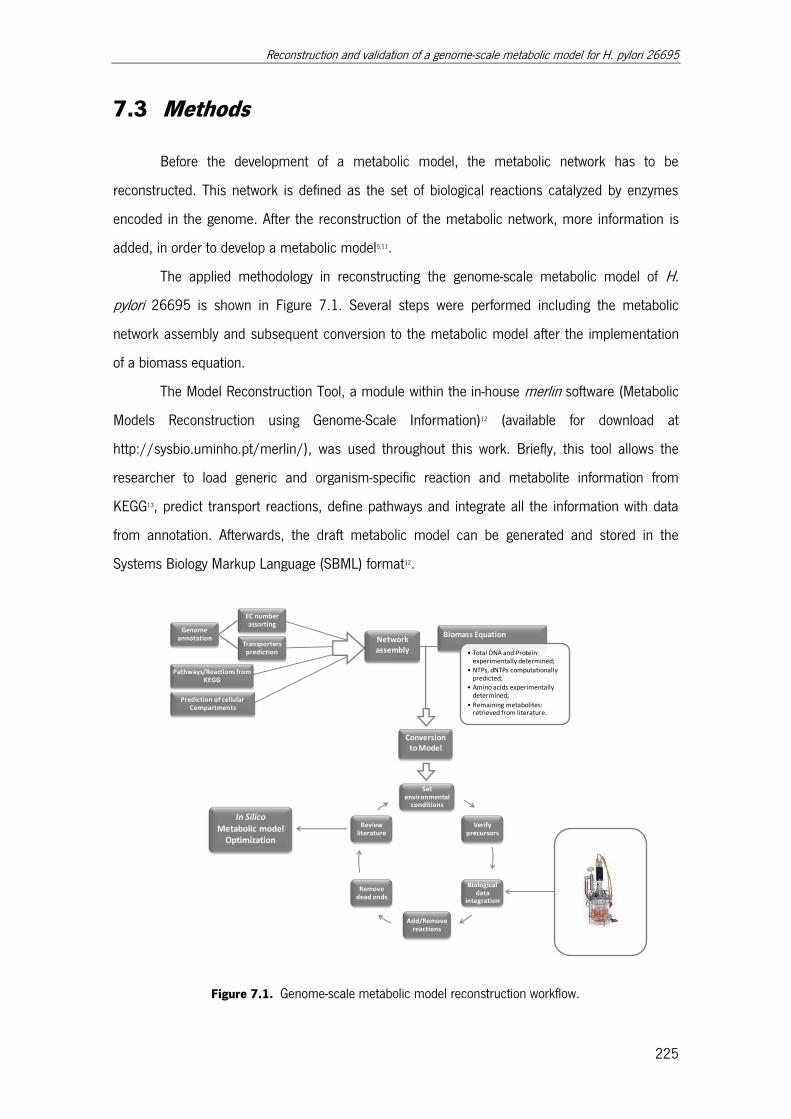
Reconstruction and validation of a genome-scale metabolic model for H. pylori 26695
225
7.3 Methods
Before the development of a metabolic model, the metabolic network has to be
reconstructed. This network is defined as the set of biological reactions catalyzed by enzymes
encoded in the genome. After the reconstruction of the metabolic network, more information is
added, in order to develop a metabolic model5,11.
The applied methodology in reconstructing the genome-scale metabolic model of H.
pylori 26695 is shown in Figure 7.1. Several steps were performed including the metabolic
network assembly and subsequent conversion to the metabolic model after the implementation
of a biomass equation.
The Model Reconstruction Tool, a module within the in-house merlin software (Metabolic
Models Reconstruction using Genome-Scale Information)12 (available for download at
http://sysbio.uminho.pt/merlin/), was used throughout this work. Briefly, this tool allows the
researcher to load generic and organism-specific reaction and metabolite information from
KEGG13, predict transport reactions, define pathways and integrate all the information with data
from annotation. Afterwards, the draft metabolic model can be generated and stored in the
Systems Biology Markup Language (SBML) format12.
Figure 7.1. Genome-scale metabolic model reconstruction workflow.
Set environmental
conditions
Verify precursors
Biological data
integration
Add/Remove reactions
Remove dead ends
Review literature
Genome annotation
EC number assorting
Transporters prediction
Pathways/Reactions from KEGG
Prediction of cellular Compartments
Network assembly
Biomass Equation
• Total DNA and Protein: experimentally determined;
• NTPs, dNTPs computationally predicted;
• Amino acids experimentally determined;
• Remaining metabolites: retrieved from literature.
Conversion to Model
In SilicoMetabolic model
Optimization
Chapter 7
226
7.3.1 Metabolic network assembly
Making use of the updated annotation10 the reactions promoted by each complete EC
number identified were retrieved from KEGG by merlin, and their metabolic information was used
to assemble the draft network. In order to prevent an overload of futile reactions, gaps and dead
ends in the network, due to the inclusion of every reaction associated to each EC number, merlin
uses KEGG pathways. Thus, only reactions for which the corresponding EC number is present in
the same pathways were included in the model. From KEGG, reactions classified as spontaneous
were also included.
After the assembly of all enzymatic reactions encoded in the annotated genome and
spontaneous reactions, transport reactions also need to be included, in order to allow the input
and output of metabolites in the model. From the re-annotation10, a list of all the transporter
proteins identified from the genome was made available. From those, the elaboration of the
transport reactions can be made automatically in merlin. However, as the number of metabolites
that can be possibly transported by a transport protein is very large, only those which were
already present in the reactions within the network were assigned with a transport reaction and
included in the model, preventing the introduction of gaps.
7.3.2 Reactions compartmentation
Being H. pylori a prokaryote and despite its cell compartmentation being limited to the
cytosol and the periplasmic space, information on protein location and reaction
compartmentation is very important when reconstructing the metabolic model.
The prediction of the location and consequent assignment to compartments of enzymes
and transport proteins was also performed using merlin. After the prediction of proteins
localization, this information was integrated in the metabolic network.
7.3.3 Assignment of reversibility to reactions
The attribution of the correct reversibility to model reactions is very important. Models
with an excess of reversible reactions are not sufficiently constrained, and futile cycles may
occur, making the model unrealistic and causing problems during optimization11. In the KEGG
database, all reactions are set to be reversible. To overcome this problem, in the reconstruction
Reconstruction and validation of a genome-scale metabolic model for H. pylori 26695
227
of H. pylori’s model, a database developed by Stelzer et al. (2011)14 was used to perform the
initial assignment of reversibility to reactions. This database includes the assignment of
reversibility to KEGG reactions, therefore facilitating its implementation in our work. Additionally,
the estimation of the standard Gibbs free energy of formation (ΔfGo) and of reaction (ΔrGo) was
also utilized to determine reaction reversibility. Those thermodynamic parameters can be used to
determine how much energy is required for a particular biochemical reaction to occur and in
which direction the reaction will flow under given cellular conditions. Standard Gibbs free energy
values can be obtained for most KEGG reactions using eQuilibrator
(http://equilibrator.weizmann.ac.il/), a web interface that enables thermodynamic analysis of
biochemical reactions15. Because it cannot be automatically propagated to every reaction in the
model, this approach was only used when information on reaction reversibility was scarce or
when doubts occurred. Since the assignment of the wrong direction to a reaction has a
significant impact in the model, if no information could be gathered, the reaction was left to be
reversible.
7.3.4 Reactions stoichiometry
The stoichiometry of the metabolic reactions can be determined by balancing the
elements on the substrate and product sides of the reaction. The KEGG database contains the
charged formula for a large amount of metabolites within reactions; however, for some
metabolites included in the model reconstruction, the charged formula lacked, resulting in
unbalanced reactions. Another reason for the detected unbalanced reactions is the lack of
protons and water molecules that many biochemical databases and textbooks omit in order to
simplify the reactions11. Unbalanced reactions might spontaneously produce protons or ATP and
therefore every metabolite must be in the correct amounts and correctly charged to balance both
sides of the reaction. In most cases, unbalanced reactions were balanced by simply adding the
missing proton or water molecule.
7.3.5 Gene-protein-reaction associations
In order to accurately determine gene essentiality and to improve the assignment of
reactions to specific genes, gene-protein-reaction (GPR) associations are required features in a
genome-scale metabolic model. In GPR associations, a single gene can be associated with a
Chapter 7
228
single reaction, multiple reactions, or even be integrated among other genes in a reaction
catalyzed by a protein complex. In these cases, the association of gene(s) to reaction(s) can be
made by applying a Boolean rule, which can be “AND” or “OR, depending on if the presence of
all genes is absolutely required or not for the reaction to occur, respectively.
The KEGG Brite database13 was used within merlin to retrieve information from
orthologues and a hierarchical classification and to create GPR associations in the metabolic
network.
7.3.6 Biomass formation
The biomass equation is the most important reaction in the model. In this equation, all
components considered essential to the overall cellular growth, with the corresponding fractional
contributions are included. This reaction represents the biomass composition and is composed of
several substrates that are originated in metabolic reactions of the model, and that can be
divided in different categories: Protein, Nucleotides (DNA and RNA), Peptidoglycan,
Lipopolysaccharide, Lipids, Cofactors and Energy. The same reaction has, as its products,
besides biomass itself, orthophosphate, diphosphate and hydrogen.
As for the majority of bacteria, information on detailed biomass composition for H. pylori
is not available. In the present work, the relative fractional contribution of biomass components
was estimated either from the genome, experimentally, or retrieved from literature.
The first step was the estimation of the macromolecular composition of the biomass of
H. pylori. Total protein and DNA content were experimentally determined from cultures of H.
pylori in the exponential phase using Ham’s F-12 (supplemented with 5% FBS) as growth
medium (described in Chapter 4) using the Biuret16 and fluorescence with DAPI17 methods,
respectively (detailed in Santos and Rocha (2013)18. Total content of RNA, lipids, peptidoglycan,
lipopolysaccharide (LPS), and cofactors were retrieved from a genome-scale model of E. coli
(iAF1260)19 and their contribution was adjusted taking into account the content of the
macromolecules experimentally determined (protein and DNA).
The RNA and DNA building-blocks, nucleoside triphosphates (NTPs) and deoxynucleoside
triphosphates (dNTPs), respectively, were computationally predicted from the H. pylori’s genome
sequence according to a published protocol11 using a Java Tool (detailed in Santos and Rocha
(2013)18. Monomers of proteins (amino acids) were also determined computationally using the
genome sequence. In addition, amino acids were also confirmed experimentally by HPLC after
Reconstruction and validation of a genome-scale metabolic model for H. pylori 26695
229
protein hydrolysis. The method used was the OPA and FMOC derivatives, with minor
modifications20.
The lipid building-blocks (fatty acids) composition was estimated according to the
protocols described by Thiele and Palsson (2010)11 and Bautista et al., (2013)21 . Data from specific H.
pylori lipid composition were obtained from Hirai et al. (1995)22 and Geis et al. (1991)23.
The composition of cell wall components, peptidoglycan and lipopolysaccharide, was retrieved
from the E. coli model (iAF1260) and from a previous H. pylori model (iIT341), respectively.
The cofactors and their coefficients in the biomass equation were retrieved either from
the list of universal biomass components developed by Henry, et al. (2010)24 from an E. coli
model (iJO1366)25 and from the previous H. pylori model (iIT341)9.
The inclusion of the biomass equation allowed converting the genome-scale metabolic
network into a draft genome-scale metabolic model. The units of the flux through the biomass
reaction are h-1, since its precursor fractions are given in mmol/gDW. Thus, the biomass equation
accounts for the number of moles of each precursor necessary to produce 1 g of dry weight of
cells.
7.3.7 Growth medium requirements
Information on growth-enabling media is of great importance in the development of an
accurate metabolic model. The starting point in H. pylori’s metabolic model growth medium
requirements was the Ham's F12 defined medium26, which has been used to grow H. pylori. The
minimal medium experimentally obtained in previous chapters for H. pylori growth was also used
for simulations and the in silico results were compared with experimental data in order to assess
model accuracy.
7.3.8 Model curation
After the complete assembly of the metabolic network, and posterior addition of GPR
associations, the biomass reaction, and the establishment of growth medium requirements, the
metabolic network was finally converted to a draft model, capable of being simulated and
optimized. However, a manual curation of the model was still required, as, although very useful,
these automatic methods are fallible. The manual curation was performed with a revision of the
literature, and by consulting organism-specific databases, and tried to solve inconsistencies on
Chapter 7
230
protein-reaction identifiers, ambiguous data, duplicated information, and propagated errors from
annotation. After the first curation, a tool within merlin was applied in order to automatically
eliminate reactions with dead-end metabolites from the model, being either biochemical or
transport reactions. If a given metabolite is not consumed nor transported by another reaction,
such reaction was deleted from the model. This was a recursive process because the removed
reactions can sometimes originate dead-ends to other metabolites, and therefore, such process
was performed with great care, in order to prevent the loss of valuable information from the
model. Once curated, the genome-scale metabolic model of H. pylori was ready for simulation
and optimization.
7.3.9 Simulation and model optimization
Metabolic model simulations were performed with parsimonious Flux Balance Analysis
(pFBA)5. For the H. pylori's genome-scale metabolic model, the linear programming problem of
pFBA was solved using OptFlux, an in-house developed and user-friendly software tool, open-
source and compatible with SBML. OptFlux accommodates several tools and algorithms
developed for the manipulation and optimization of metabolic models27.
7.3.10 Model validation
In this step, the genome-scale metabolic model was evaluated and its overall
performance validated. For the validation of the model, the analysis of strategic fluxes was
performed. The evaluation parameters were focused on specific growth rates, by-products
formation and corresponding yields, for different growth conditions. These results were then
compared with the experimental data collected in previous chapters.
Reactions with existing fluxes were analyzed and when inconsistencies between model
and experimental data arose, the model was revised and corrected.
Another evaluation approach consisted in the assessment of essential genes and its
comparison with experimental data, published in the OGEE database28. When the gene
essentiality simulations did not match with experimental data, the genome annotation was
reviewed.
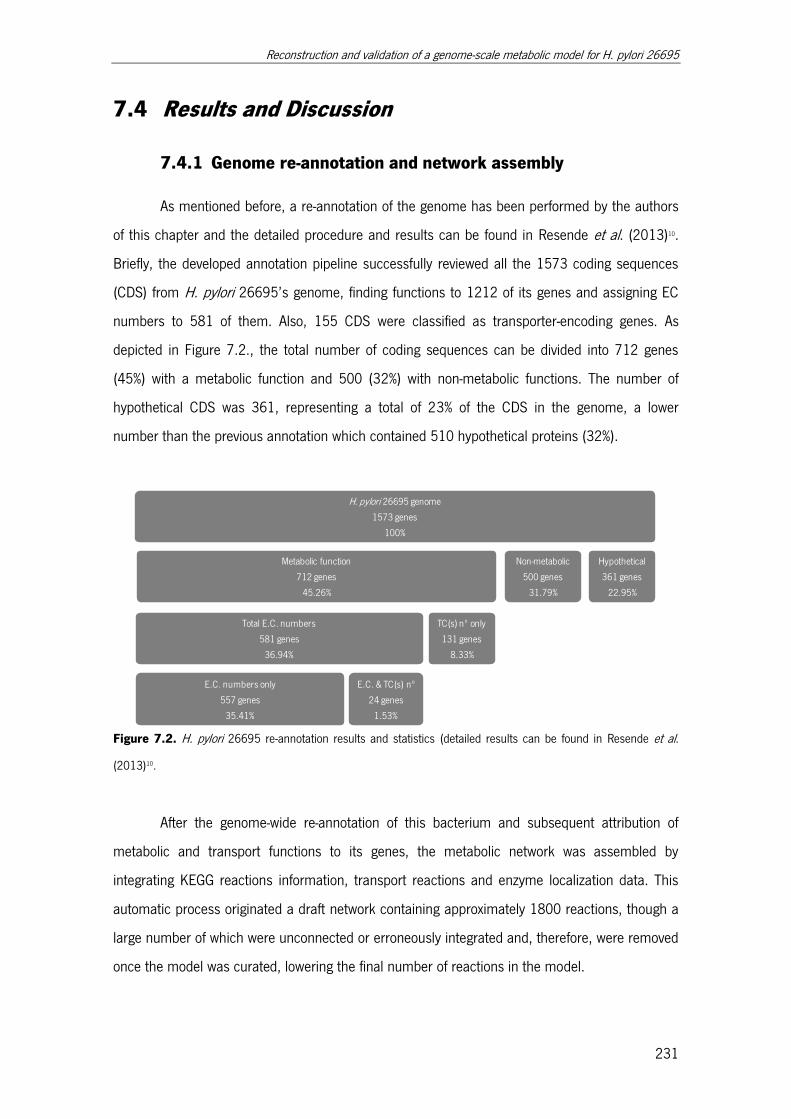
Reconstruction and validation of a genome-scale metabolic model for H. pylori 26695
231
7.4 Results and Discussion
7.4.1 Genome re-annotation and network assembly
As mentioned before, a re-annotation of the genome has been performed by the authors
of this chapter and the detailed procedure and results can be found in Resende et al. (2013)10.
Briefly, the developed annotation pipeline successfully reviewed all the 1573 coding sequences
(CDS) from H. pylori 26695’s genome, finding functions to 1212 of its genes and assigning EC
numbers to 581 of them. Also, 155 CDS were classified as transporter-encoding genes. As
depicted in Figure 7.2., the total number of coding sequences can be divided into 712 genes
(45%) with a metabolic function and 500 (32%) with non-metabolic functions. The number of
hypothetical CDS was 361, representing a total of 23% of the CDS in the genome, a lower
number than the previous annotation which contained 510 hypothetical proteins (32%).
Figure 7.2. H. pylori 26695 re-annotation results and statistics (detailed results can be found in Resende et al.
(2013)10.
After the genome-wide re-annotation of this bacterium and subsequent attribution of
metabolic and transport functions to its genes, the metabolic network was assembled by
integrating KEGG reactions information, transport reactions and enzyme localization data. This
automatic process originated a draft network containing approximately 1800 reactions, though a
large number of which were unconnected or erroneously integrated and, therefore, were removed
once the model was curated, lowering the final number of reactions in the model.
H. pylori 26695 genome
1573 genes
100%
Metabolic function
712 genes
45.26%
Total E.C. numbers
581 genes
36.94%
E.C. numbers only
557 genes
35.41%
E.C. & TC(s) nº
24 genes
1.53%
TC(s) nº only
131 genes
8.33%
Non-metabolic
500 genes
31.79%
Hypothetical
361 genes
22.95%
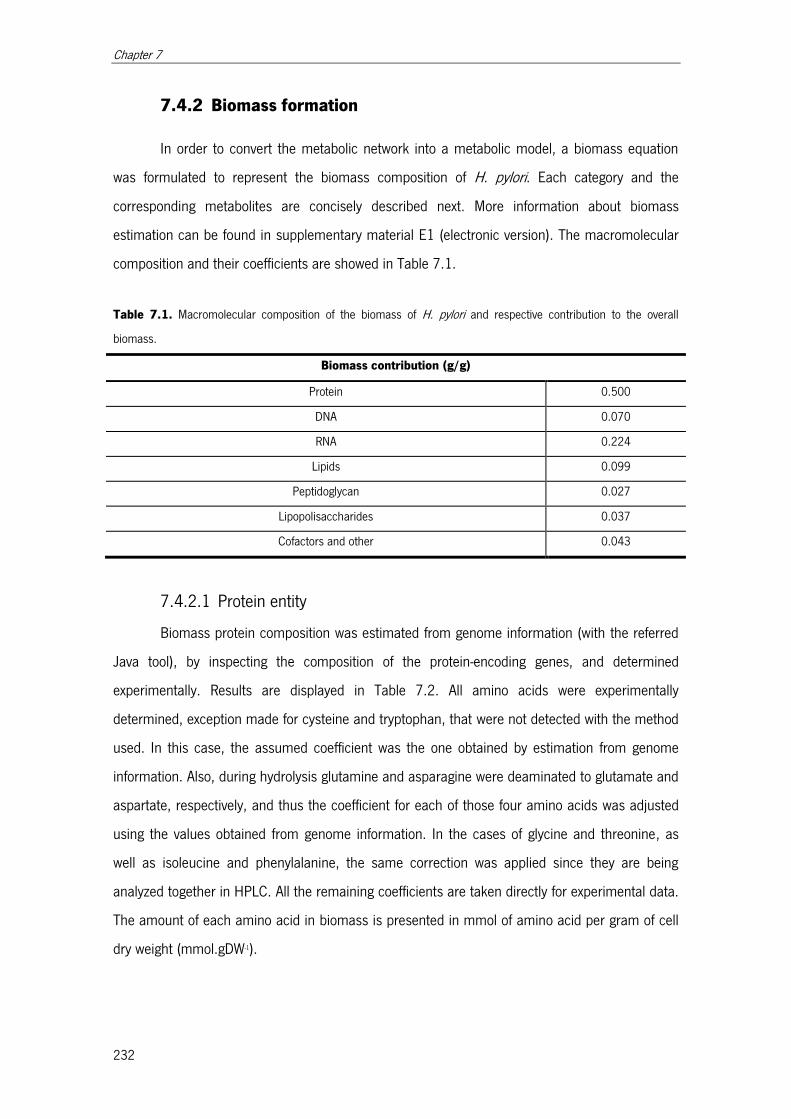
Chapter 7
232
7.4.2 Biomass formation
In order to convert the metabolic network into a metabolic model, a biomass equation
was formulated to represent the biomass composition of H. pylori. Each category and the
corresponding metabolites are concisely described next. More information about biomass
estimation can be found in supplementary material E1 (electronic version). The macromolecular
composition and their coefficients are showed in Table 7.1.
Table 7.1. Macromolecular composition of the biomass of H. pylori and respective contribution to the overall
biomass.
Biomass contribution (g/g)
Protein 0.500
DNA 0.070
RNA 0.224
Lipids 0.099
Peptidoglycan 0.027
Lipopolisaccharides 0.037
Cofactors and other 0.043
7.4.2.1 Protein entity
Biomass protein composition was estimated from genome information (with the referred
Java tool), by inspecting the composition of the protein-encoding genes, and determined
experimentally. Results are displayed in Table 7.2. All amino acids were experimentally
determined, exception made for cysteine and tryptophan, that were not detected with the method
used. In this case, the assumed coefficient was the one obtained by estimation from genome
information. Also, during hydrolysis glutamine and asparagine were deaminated to glutamate and
aspartate, respectively, and thus the coefficient for each of those four amino acids was adjusted
using the values obtained from genome information. In the cases of glycine and threonine, as
well as isoleucine and phenylalanine, the same correction was applied since they are being
analyzed together in HPLC. All the remaining coefficients are taken directly for experimental data.
The amount of each amino acid in biomass is presented in mmol of amino acid per gram of cell
dry weight (mmol.gDW-1).
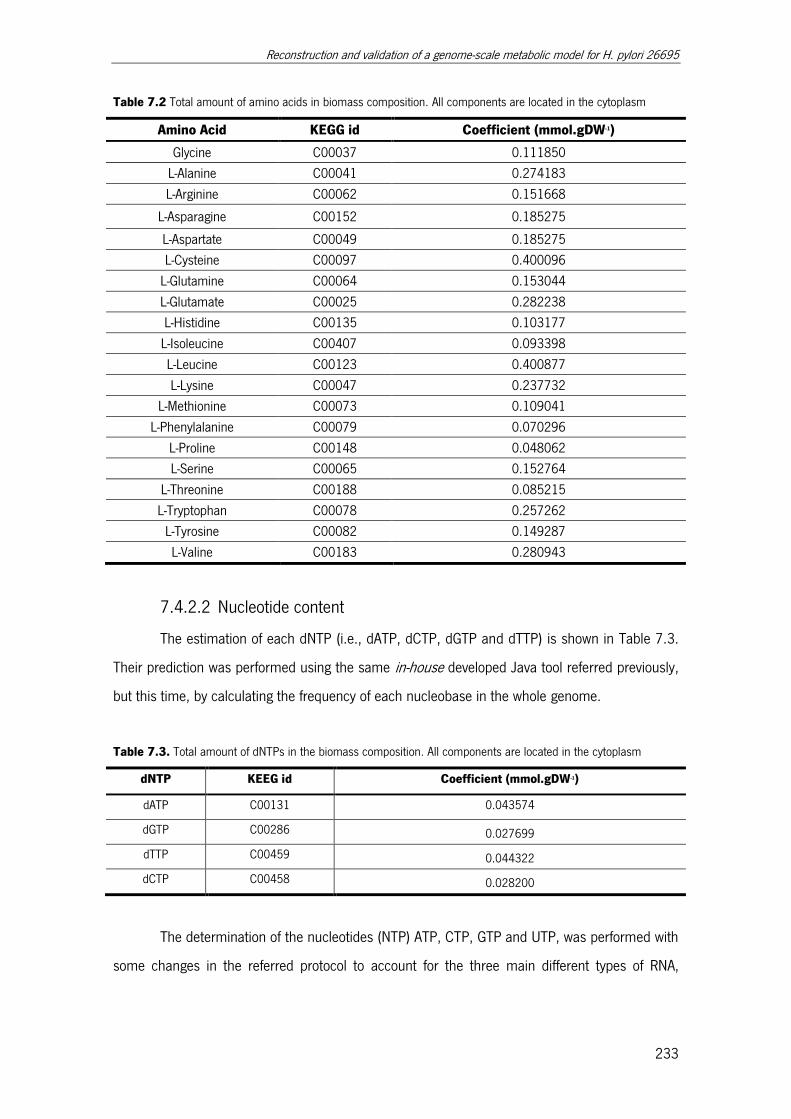
Reconstruction and validation of a genome-scale metabolic model for H. pylori 26695
233
Table 7.2 Total amount of amino acids in biomass composition. All components are located in the cytoplasm
Amino Acid KEGG id Coefficient (mmol.gDW-1)
Glycine C00037 0.111850
L-Alanine C00041 0.274183
L-Arginine C00062 0.151668
L-Asparagine C00152 0.185275
L-Aspartate C00049 0.185275
L-Cysteine C00097 0.400096
L-Glutamine C00064 0.153044
L-Glutamate C00025 0.282238
L-Histidine C00135 0.103177
L-Isoleucine C00407 0.093398
L-Leucine C00123 0.400877
L-Lysine C00047 0.237732
L-Methionine C00073 0.109041
L-Phenylalanine C00079 0.070296
L-Proline C00148 0.048062
L-Serine C00065 0.152764
L-Threonine C00188 0.085215
L-Tryptophan C00078 0.257262
L-Tyrosine C00082 0.149287
L-Valine C00183 0.280943
7.4.2.2 Nucleotide content
The estimation of each dNTP (i.e., dATP, dCTP, dGTP and dTTP) is shown in Table 7.3.
Their prediction was performed using the same in-house developed Java tool referred previously,
but this time, by calculating the frequency of each nucleobase in the whole genome.
Table 7.3. Total amount of dNTPs in the biomass composition. All components are located in the cytoplasm
dNTP KEEG id Coefficient (mmol.gDW-1)
dATP C00131 0.043574
dGTP C00286 0.027699
dTTP C00459 0.044322
dCTP C00458 0.028200
The determination of the nucleotides (NTP) ATP, CTP, GTP and UTP, was performed with
some changes in the referred protocol to account for the three main different types of RNA,
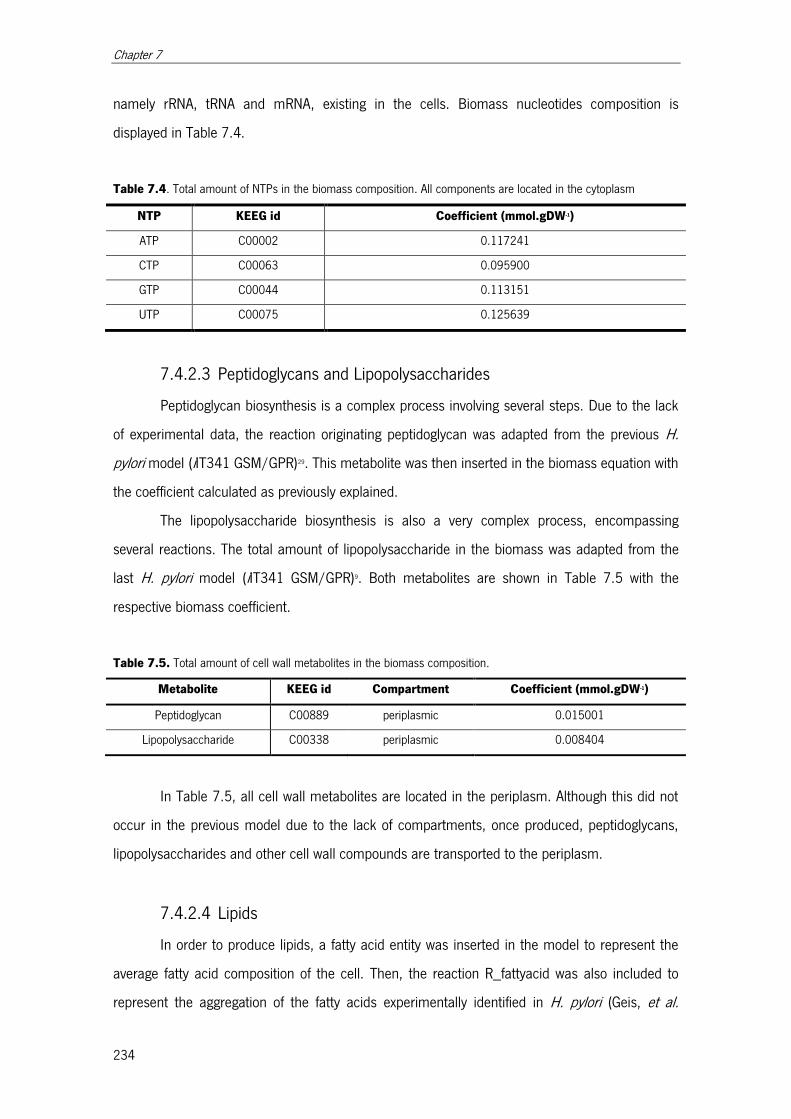
Chapter 7
234
namely rRNA, tRNA and mRNA, existing in the cells. Biomass nucleotides composition is
displayed in Table 7.4.
Table 7.4. Total amount of NTPs in the biomass composition. All components are located in the cytoplasm
NTP KEEG id Coefficient (mmol.gDW-1)
ATP C00002 0.117241
CTP C00063 0.095900
GTP C00044 0.113151
UTP C00075 0.125639
7.4.2.3 Peptidoglycans and Lipopolysaccharides
Peptidoglycan biosynthesis is a complex process involving several steps. Due to the lack
of experimental data, the reaction originating peptidoglycan was adapted from the previous H.
pylori model (iIT341 GSM/GPR)29. This metabolite was then inserted in the biomass equation with
the coefficient calculated as previously explained.
The lipopolysaccharide biosynthesis is also a very complex process, encompassing
several reactions. The total amount of lipopolysaccharide in the biomass was adapted from the
last H. pylori model (iIT341 GSM/GPR)9. Both metabolites are shown in Table 7.5 with the
respective biomass coefficient.
Table 7.5. Total amount of cell wall metabolites in the biomass composition.
Metabolite KEEG id Compartment Coefficient (mmol.gDW-1)
Peptidoglycan C00889 periplasmic 0.015001
Lipopolysaccharide C00338 periplasmic 0.008404
In Table 7.5, all cell wall metabolites are located in the periplasm. Although this did not
occur in the previous model due to the lack of compartments, once produced, peptidoglycans,
lipopolysaccharides and other cell wall compounds are transported to the periplasm.
7.4.2.4 Lipids
In order to produce lipids, a fatty acid entity was inserted in the model to represent the
average fatty acid composition of the cell. Then, the reaction R_fattyacid was also included to
represent the aggregation of the fatty acids experimentally identified in H. pylori (Geis, et al.
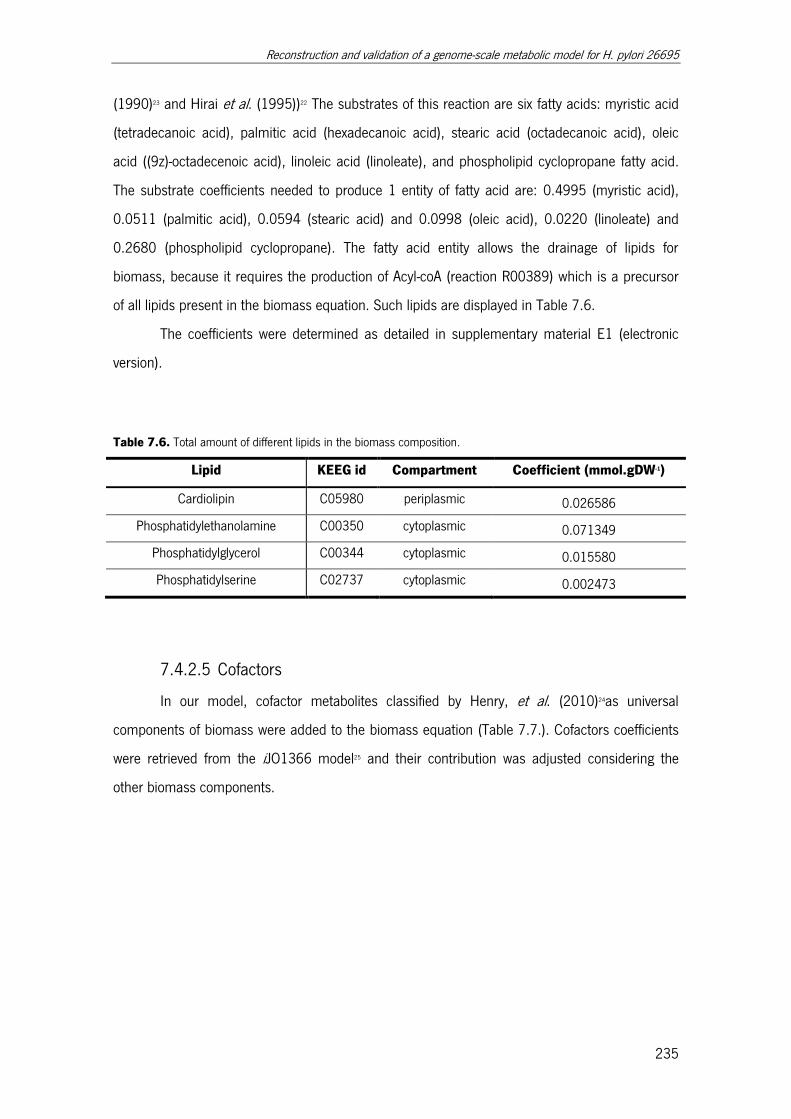
Reconstruction and validation of a genome-scale metabolic model for H. pylori 26695
235
(1990)23 and Hirai et al. (1995))22 The substrates of this reaction are six fatty acids: myristic acid
(tetradecanoic acid), palmitic acid (hexadecanoic acid), stearic acid (octadecanoic acid), oleic
acid ((9z)-octadecenoic acid), linoleic acid (linoleate), and phospholipid cyclopropane fatty acid.
The substrate coefficients needed to produce 1 entity of fatty acid are: 0.4995 (myristic acid),
0.0511 (palmitic acid), 0.0594 (stearic acid) and 0.0998 (oleic acid), 0.0220 (linoleate) and
0.2680 (phospholipid cyclopropane). The fatty acid entity allows the drainage of lipids for
biomass, because it requires the production of Acyl-coA (reaction R00389) which is a precursor
of all lipids present in the biomass equation. Such lipids are displayed in Table 7.6.
The coefficients were determined as detailed in supplementary material E1 (electronic
version).
Table 7.6. Total amount of different lipids in the biomass composition.
Lipid KEEG id Compartment Coefficient (mmol.gDW-1)
Cardiolipin C05980 periplasmic 0.026586
Phosphatidylethanolamine C00350 cytoplasmic 0.071349
Phosphatidylglycerol C00344 cytoplasmic 0.015580
Phosphatidylserine C02737 cytoplasmic 0.002473
7.4.2.5 Cofactors
In our model, cofactor metabolites classified by Henry, et al. (2010)24as universal
components of biomass were added to the biomass equation (Table 7.7.). Cofactors coefficients
were retrieved from the iJO1366 model25 and their contribution was adjusted considering the
other biomass components.
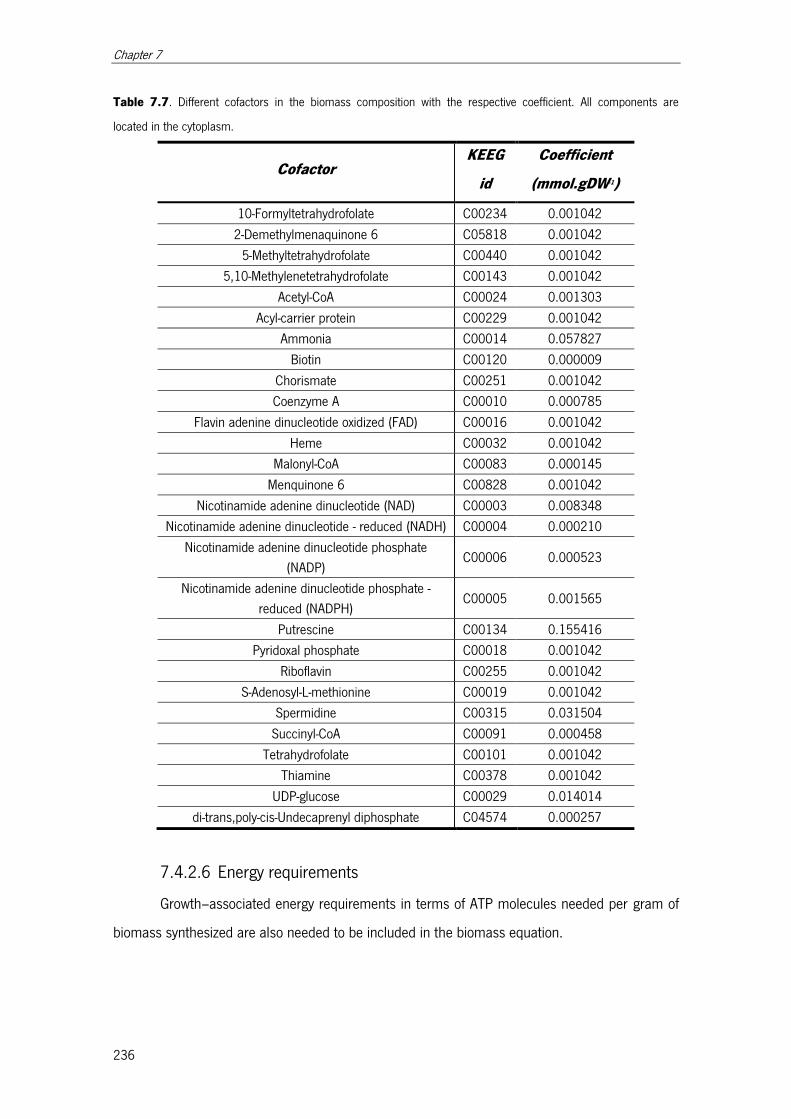
Chapter 7
236
Table 7.7. Different cofactors in the biomass composition with the respective coefficient. All components are
located in the cytoplasm.
Cofactor KEEG
id
Coefficient
(mmol.gDW-1)
10-Formyltetrahydrofolate C00234 0.001042
2-Demethylmenaquinone 6 C05818 0.001042
5-Methyltetrahydrofolate C00440 0.001042
5,10-Methylenetetrahydrofolate C00143 0.001042
Acetyl-CoA C00024 0.001303
Acyl-carrier protein C00229 0.001042
Ammonia C00014 0.057827
Biotin C00120 0.000009
Chorismate C00251 0.001042
Coenzyme A C00010 0.000785
Flavin adenine dinucleotide oxidized (FAD) C00016 0.001042
Heme C00032 0.001042
Malonyl-CoA C00083 0.000145
Menquinone 6 C00828 0.001042
Nicotinamide adenine dinucleotide (NAD) C00003 0.008348
Nicotinamide adenine dinucleotide - reduced (NADH) C00004 0.000210
Nicotinamide adenine dinucleotide phosphate
(NADP) C00006 0.000523
Nicotinamide adenine dinucleotide phosphate -
reduced (NADPH) C00005 0.001565
Putrescine C00134 0.155416
Pyridoxal phosphate C00018 0.001042
Riboflavin C00255 0.001042
S-Adenosyl-L-methionine C00019 0.001042
Spermidine C00315 0.031504
Succinyl-CoA C00091 0.000458
Tetrahydrofolate C00101 0.001042
Thiamine C00378 0.001042
UDP-glucose C00029 0.014014
di-trans,poly-cis-Undecaprenyl diphosphate C04574 0.000257
7.4.2.6 Energy requirements
Growth–associated energy requirements in terms of ATP molecules needed per gram of
biomass synthesized are also needed to be included in the biomass equation.
Reconstruction and validation of a genome-scale metabolic model for H. pylori 26695
237
The growth ATP requirements adopted in this model were retrieved from the E. coli
(iJO1366) metabolic model25.The coefficient representing ATP consumption requirements for cell
growth was set to 53.95 mmol.gDW-1.
The depletion of ATP by processes other than growth was represented in the model by an
equation that forces ATP consumption throughout a specific flux. The boundaries of this flux were
also retrieved and adapted from the E. coli model iJO136625.
7.4.3 Model curation
The first step in model curation was to look for reactions with wrong compartmentation
information. After the first curation step, the size of the model was decreased by automatically
removing reactions, either biochemical or transport, with dead end metabolites from the model.
This process reduced the total number of reactions from about 1800 to approximately 700
reactions. As it is a recursive method, some reactions of the model were erroneously removed,
disabling the model's simulating capability. After this process, the origin of each biomass
precursor was verified to identify unconnected reactions. For that purpose the model was
exported into the SBML format, and imported into OptFlux27, so that simulations could be
performed. Initially, the boundaries of all uptake drains of the model were unrestricted to
determine whether the model was able to produce, or not, biomass.
Having, finally, a model capable of simulating the production of biomass (although with
all entries unconstrained), the model was checked for unbalanced reactions.
Once the metabolic model was properly curated, it was ready for evaluation and
characterization.
7.4.4 Model Evaluation
The outcome of the previous tasks allowed obtaining a genome-scale metabolic model of
H. pylori 26695 based in its most recent genome re-annotation. The metabolic model is
available, in the SBML format, in the supplementary material E2 (electronic version).
7.4.4.1 Model characterization
When reconstructing the metabolic model, 370 metabolic genes from the performed
annotation were used. Though still available for the continuous improvement of the metabolic
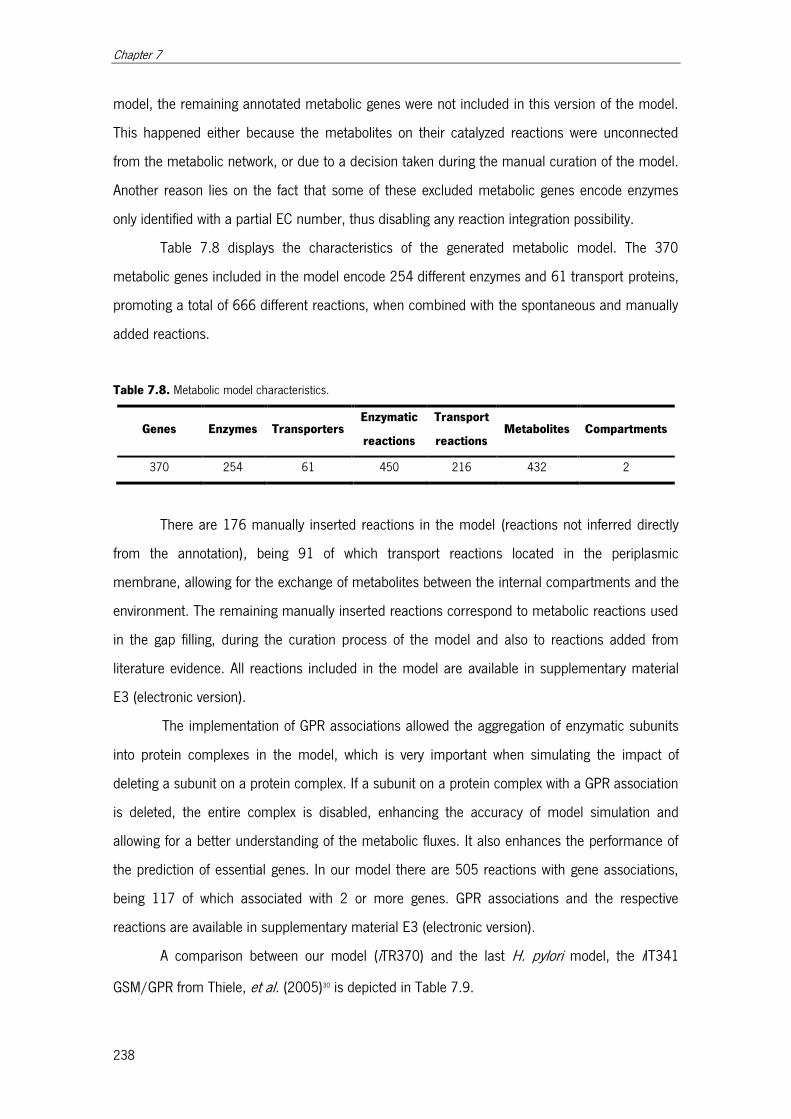
Chapter 7
238
model, the remaining annotated metabolic genes were not included in this version of the model.
This happened either because the metabolites on their catalyzed reactions were unconnected
from the metabolic network, or due to a decision taken during the manual curation of the model.
Another reason lies on the fact that some of these excluded metabolic genes encode enzymes
only identified with a partial EC number, thus disabling any reaction integration possibility.
Table 7.8 displays the characteristics of the generated metabolic model. The 370
metabolic genes included in the model encode 254 different enzymes and 61 transport proteins,
promoting a total of 666 different reactions, when combined with the spontaneous and manually
added reactions.
Table 7.8. Metabolic model characteristics.
Genes Enzymes Transporters Enzymatic
reactions
Transport
reactions Metabolites Compartments
370 254 61 450 216 432 2
There are 176 manually inserted reactions in the model (reactions not inferred directly
from the annotation), being 91 of which transport reactions located in the periplasmic
membrane, allowing for the exchange of metabolites between the internal compartments and the
environment. The remaining manually inserted reactions correspond to metabolic reactions used
in the gap filling, during the curation process of the model and also to reactions added from
literature evidence. All reactions included in the model are available in supplementary material
E3 (electronic version).
The implementation of GPR associations allowed the aggregation of enzymatic subunits
into protein complexes in the model, which is very important when simulating the impact of
deleting a subunit on a protein complex. If a subunit on a protein complex with a GPR association
is deleted, the entire complex is disabled, enhancing the accuracy of model simulation and
allowing for a better understanding of the metabolic fluxes. It also enhances the performance of
the prediction of essential genes. In our model there are 505 reactions with gene associations,
being 117 of which associated with 2 or more genes. GPR associations and the respective
reactions are available in supplementary material E3 (electronic version).
A comparison between our model (iTR370) and the last H. pylori model, the iIT341
GSM/GPR from Thiele, et al. (2005)30 is depicted in Table 7.9.
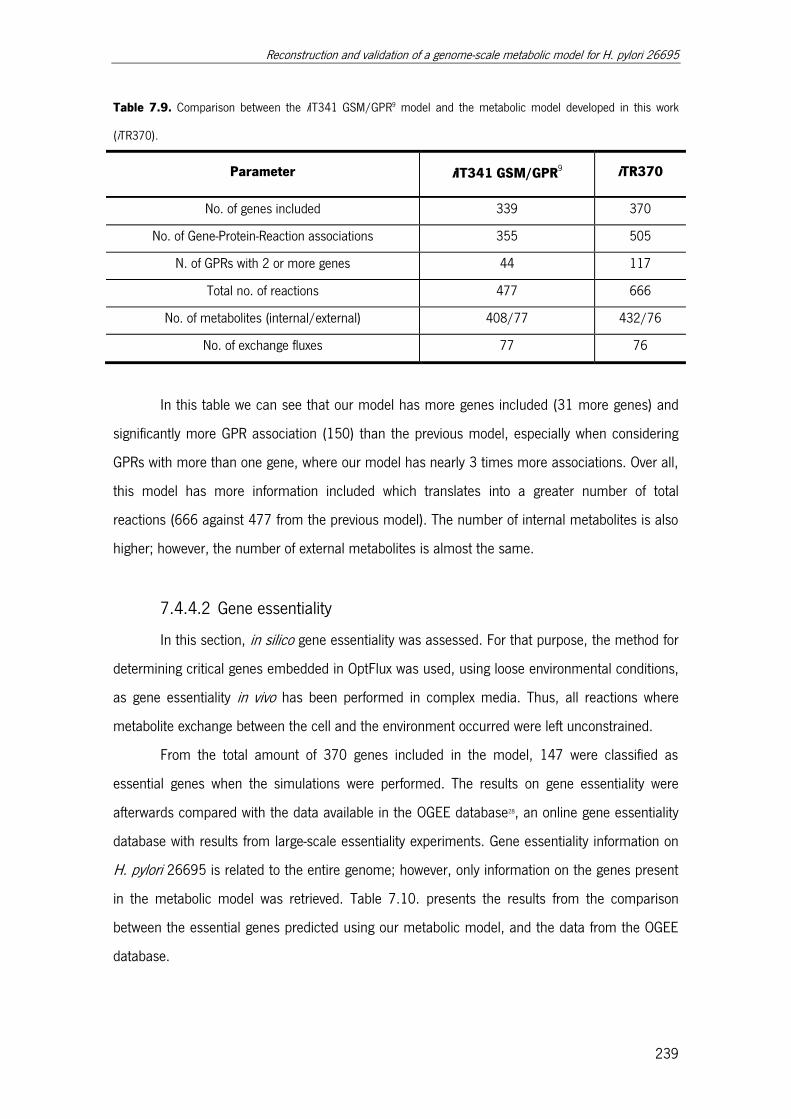
Reconstruction and validation of a genome-scale metabolic model for H. pylori 26695
239
Table 7.9. Comparison between the iIT341 GSM/GPR9 model and the metabolic model developed in this work
(iTR370).
Parameter iIT341 GSM/GPR9 iTR370
No. of genes included 339 370
No. of Gene-Protein-Reaction associations 355 505
N. of GPRs with 2 or more genes 44 117
Total no. of reactions 477 666
No. of metabolites (internal/external) 408/77 432/76
No. of exchange fluxes 77 76
In this table we can see that our model has more genes included (31 more genes) and
significantly more GPR association (150) than the previous model, especially when considering
GPRs with more than one gene, where our model has nearly 3 times more associations. Over all,
this model has more information included which translates into a greater number of total
reactions (666 against 477 from the previous model). The number of internal metabolites is also
higher; however, the number of external metabolites is almost the same.
7.4.4.2 Gene essentiality
In this section, in silico gene essentiality was assessed. For that purpose, the method for
determining critical genes embedded in OptFlux was used, using loose environmental conditions,
as gene essentiality in vivo has been performed in complex media. Thus, all reactions where
metabolite exchange between the cell and the environment occurred were left unconstrained.
From the total amount of 370 genes included in the model, 147 were classified as
essential genes when the simulations were performed. The results on gene essentiality were
afterwards compared with the data available in the OGEE database28, an online gene essentiality
database with results from large-scale essentiality experiments. Gene essentiality information on
H. pylori 26695 is related to the entire genome; however, only information on the genes present
in the metabolic model was retrieved. Table 7.10. presents the results from the comparison
between the essential genes predicted using our metabolic model, and the data from the OGEE
database.

Chapter 7
240
Table 7.10. Comparison between essential genes verified experimentally and retrieved from the OGEE database
and model predictions.
Ogee database28
Essential Non-essential
Our model Essential 51 96
Non-essential 53 170
By observing the information in the table we can see that the results obtained in the
comparison between models predictions and the OGEE database have a percentage of
agreement of 59.7%, being the genes considered non-essential in a larger number than the
essential ones. A few reasons for the mismatch in some of the genes might be related with the
fact that the metabolic model is not able to simulate and incorporate all the components of the
complex medium used in the OGEE experiments, mainly because some of these components are
not fully characterized in the literature, such as serum and protein extracts. Gene essentiality
results and a detailed comparison are depicted in the supplementary material E3 (electronic
version).
7.4.4.3 Prediction of physiological data
In this section the results of growth simulations performed with the metabolic model are
shown and analyzed. The environmental conditions used in the simulations are based on the
results achieved in the previous chapters in defining the essential amino acids for H. pylori and
also on identifying a suitable carbon source. The final minimal medium used to perform the
simulations had in its composition 20 metabolites: 7 essential amino acids (L-Arginine, L-
Histidine, L-Isoleucine, L-Leucine, L-Methionine, L-Phenylalanine and L-Valine), L-Glutamate as
carbon source, 4 measured FBS compounds (L-Alanine, L-Proline, Lactate and Succinate), 2
vitamins (Biotin and Thiamine), hypoxanthine, water, oxygen, iron and inorganic compounds,
such as, phosphate and sulfate.
For the simulations, the Optflux wild type simulation method was used (pFBA). After
selecting the model and the reaction to maximize (biomass reaction, in this case) the
environmental conditions were chosen and the model simulated.
Results of the simulations are depicted in Table 7.11, where the set of environmental
conditions used, the specific growth rate, the consumed metabolites and the products originated

Reconstruction and validation of a genome-scale metabolic model for H. pylori 26695
241
can be observed. The coefficients defined in the environmental conditions represent, in the
model, the maximum uptake rate allowed for each compound, and correspond to values
obtained experimentally for the amino-acids and FBS components during the exponential phase.
All the remaining metabolites were set at a maximum uptake rate of 10, except for oxygen, that
was limited to 5 mmol.gDW-1h-1. Due to the lack of experimental data, the reaction representing
the ATP depletion by processes other than growth (ATPMaint) was also varied and served as a
degree of freedom for model fitting.
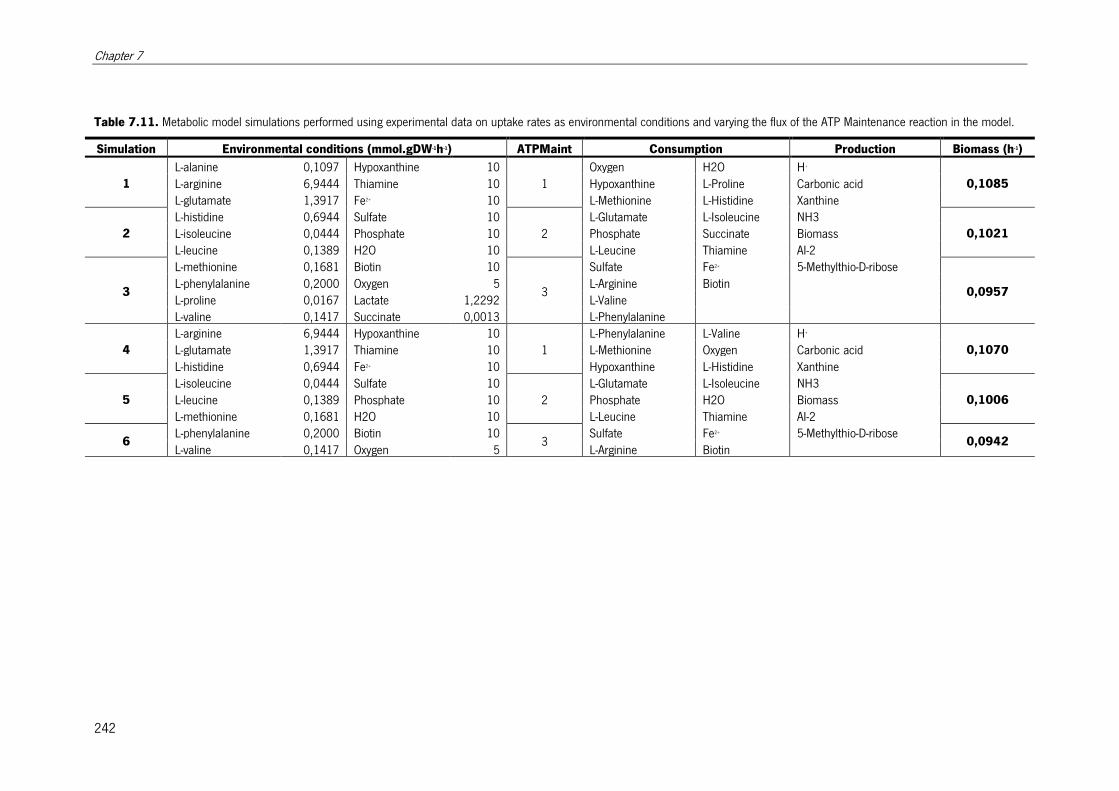
Chapter 7
242
Table 7.11. Metabolic model simulations performed using experimental data on uptake rates as environmental conditions and varying the flux of the ATP Maintenance reaction in the model.
Simulation Environmental conditions (mmol.gDW-1h-1) ATPMaint Consumption Production Biomass (h-1)
1 L-alanine 0,1097 Hypoxanthine 10
1
Oxygen H2O H+ 0,1085 L-arginine 6,9444 Thiamine 10 Hypoxanthine L-Proline Carbonic acid
L-glutamate 1,3917 Fe2+ 10 L-Methionine L-Histidine Xanthine
2 L-histidine 0,6944 Sulfate 10
2
L-Glutamate L-Isoleucine NH3 0,1021 L-isoleucine 0,0444 Phosphate 10 Phosphate Succinate Biomass
L-leucine 0,1389 H2O 10 L-Leucine Thiamine AI-2
3
L-methionine 0,1681 Biotin 10
3
Sulfate Fe2+ 5-Methylthio-D-ribose
0,0957 L-phenylalanine 0,2000 Oxygen 5 L-Arginine Biotin
L-proline 0,0167 Lactate 1,2292 L-Valine
L-valine 0,1417 Succinate 0,0013 L-Phenylalanine
4 L-arginine 6,9444 Hypoxanthine 10
1
L-Phenylalanine L-Valine H+ 0,1070 L-glutamate 1,3917 Thiamine 10 L-Methionine Oxygen Carbonic acid
L-histidine 0,6944 Fe2+ 10 Hypoxanthine L-Histidine Xanthine
5 L-isoleucine 0,0444 Sulfate 10
2
L-Glutamate L-Isoleucine NH3 0,1006 L-leucine 0,1389 Phosphate 10 Phosphate H2O Biomass
L-methionine 0,1681 H2O 10 L-Leucine Thiamine AI-2
6 L-phenylalanine 0,2000 Biotin 10
3 Sulfate Fe2+ 5-Methylthio-D-ribose
0,0942 L-valine 0,1417 Oxygen 5 L-Arginine Biotin
Reconstruction and validation of a genome-scale metabolic model for H. pylori 26695
243
Table 7.11 displays the results of 6 simulations of the metabolic model under
different environmental conditions. The simulations were divided into 2 groups, where
each group shared the same environmental conditions, varying only the flux of the ATP
maintenance reaction between 1, 2 and 3 mmol.gDW-1h-1 (chosen based on the described
range of ATP-maintenance consumption for E. coli 31. In the first group (simulations 1, 2
and 3), the set of environmental conditions correspond to the uptake rates measured for
all the compounds consumed, whereas in the second group (simulations 4, 5 and 6) the
compounds corresponding to the FBS were removed in order to analyze their possible role
in biomass growth. A detailed description of the simulation results is displayed in the
supplemental material 4 (electronic version).
In simulations 1, 2 and 3 it is possible to observe that all metabolites had some
consumption, with the exception of L-Alanine and Lactate. Our results also show that the
limiting factor for the in silico growth of H. pylori is the amino acid L-glutamate, once this
metabolite is the only compound that achieved the maximum uptake rate when the model
was simulated (shown in supplementary material 4). These occurred in all simulations.
The variation of the maintenance ATP flux changed the biomass growth rate, as
expected, being the growth rate inversely proportional to the flux of the maintenance ATP
reaction.
Simulation 1, with an ATPMaint of 1 and the consumption of the FBS compounds
L-proline and succinate, originated the growth rate most similar to the experimental data,
with an in silico specific growth rate of 0.1085 h-1, compared with the in vivo specific
growth rate of 0.126 h-1.
In simulations 4, 5 and 6, where the FBS compounds where excluded, the
simulated growth rate was slightly lower than in the previous simulations. These results
show that succinate and L-proline contribute to biomass production, although they are not
essential. Also, their overall influence is small, due to the fact that FBS concentration in
the minimal medium in also low.
It should be emphasized that previous models of H. pylori have failed in making
quantitative predictions due to, on one hand, the usage of a non-specific biomass equation
and, on the other, to the lack of experimental data available. Thus, the fact that there is a

Chapter 7
244
remarkable match between in silico and in vivo physiological data indicates that the model
here presented can, in the future, be used to make quantitative predictions for H. pylori.
In the metabolite production column we can observe that there are 5 metabolites
that are always produced independently of the environmental conditions, when simulating
in silico the growth of H. pylori. The proton H+ is the metabolite excreted from the model
with the higher fluxes in all conditions. As expected, Ammonium is produced as a
byproduct of the decomposition of urea. Carbonic acid, generated in a reaction involving
water and carbon dioxide is excreted from the model instead of carbon dioxide. Among the
remaining metabolites produced, 5-Methylthio-D-Ribose and Autoinducer-2 are possibly the
most peculiar in Table 7.11. 5-Methylthio-D-Ribose is part of the cysteine and methionine
metabolism, but it originates in another pathway, the arginine and proline metabolism. In
order to produce spermidine from putrescine, the reaction R01920 encoded by SpeE
(HP0832) also produces 5'-methylthioadenosine that by its turn is catalyzed in reaction
R01401 by HP0089, resulting in the formation of 5-methylthio-D-ribose. At this point, the
only destination for this metabolite would be to continue ahead through a cascade of un-
annotated reactions until the formation of L-methionine. As this solution is not viable, once
it is well established that H. pylori is auxotrophic for L-methionine, the only solution was to
excrete in silico the metabolite for the environment. If this excretion has any association
with in vivo reality remains to be checked.
The Autoinducer-2 is regarded as a quorum sensing signaling molecule. Studies
from32 show that this molecule is formed in the cysteine methionime pathway, through a
cascade of reactions that starts on S-adenosyl-l-methionine, a product of L-methionine
metabolism, and ends on S-Ribosyl-L-homocysteine33.also showed this cascade as a way to
producing L-homocysteine. As it is a known quorum sensing molecule, reactions were
added to the model in order to excrete this signaling molecule.
Besides these metabolites, Xanthine is also excreted, probably due to an overflow
in the purine metabolism. Overall, no fermentation by-products were observed in silico,
again matching the in vivo data from the previous chapter.
Reconstruction and validation of a genome-scale metabolic model for H. pylori 26695
245
7.4.5 Flux distribution analysis
In this section, the analysis of the flux distribution predicted by the model is
performed. The main pathways of the central carbon metabolism, important precursors
and their fluxes were analyzed. Flux distribution and metabolite conversions were retrieved
from simulation 4, where consumption of FBS components is not considered, for
simplification purposes. Figure 7.3. depicts the most important metabolite conversions,
and the respective reaction fluxes on 3 important pathways: Glycolysis/Gluconeogenesis,
Pentose phosphate pathway, and the Citrate cycle (TCA cycle). Reactions occurring in
alanine, aspartate, glutamate and proline metabolism are also presented.
When analyzing flux distributions, it is possible to observe that H. pylori is capable
of performing Gluconeogenesis when not supplemented with carbohydrates.
Phosphoenolpyruvate is originated from Pyruvate and flows through a reaction cascade in
order to produce Glycerone phosphate (Glycerone-P). Glycerone phosphate is routed to the
lipids biosynthesis where some biomass precursors are formed.
Fructose-6-phosphate (β-D-fructose-6P), also originated from Glycerone phosphate
through a cascade of reactions in other pathways, is converted into glucose-6-phosphate
(α-D-glucose-6P) which, in its turn, flows exclusively to the production of
Lipopolysaccharides.
In the Pentose Phosphate pathway, fructose 6-phosphate and D-Erythrose 4-
phosphate (D-Erythrose-4P) are converted in Sedoheptulose 7-phosphate (D-
Sedoheptulose-7P) and D-Glyceraldehyde 3-phosphate (D-Glyceraldehyde-3P), which are
directed into reactions generating 5-Phospho-alpha-D-ribose 1-diphosphate (PRPP). This
metabolite is then part of the metabolism of Purines and Pyrimidines.
The TCA cycle is only partially completed. It begins with the conversion of 2-
Oxoglutarate into Succinyl-CoA, followed by Succinate. After being converted from
Succinate, Fumarate originates (S)-malate, which in its turn is converted to Oxaloacetate.
(S)-malate also originates Pyruvate, at a rate of 2.287 mmol.gDW -1h-1. All reactions in the
TCA cycle have high flux rates, going from 1.310 to 1.360 mmol.gDW -1h-1. This is due to
the use of L-glutamate as the sole carbon source.
Chapter 7
246
Pyruvate produces Acetyl-coA, a precursor of many essential reactions. In fact, the
biosynthesis of peptidoglycan, fatty acids, phospholipids and cofactors is derived from
Acetyl-CoA34 which enhances the importance of this metabolite.
When analyzing the amino acids metabolism we can see that L-Alanine is derived
from Pyruvate. Despite some controversy around this amino acid, with some authors
claiming that it is an essential nutrient for H. pylori 9 experimental data generated in our
group suggest otherwise. Reaction directionality analysis performed in eQuilibrator15 for
reaction R00396 (L-Alanine + NAD+ + H2O = Pyruvate + NH3 + NADH + H+) also supports
this theory.
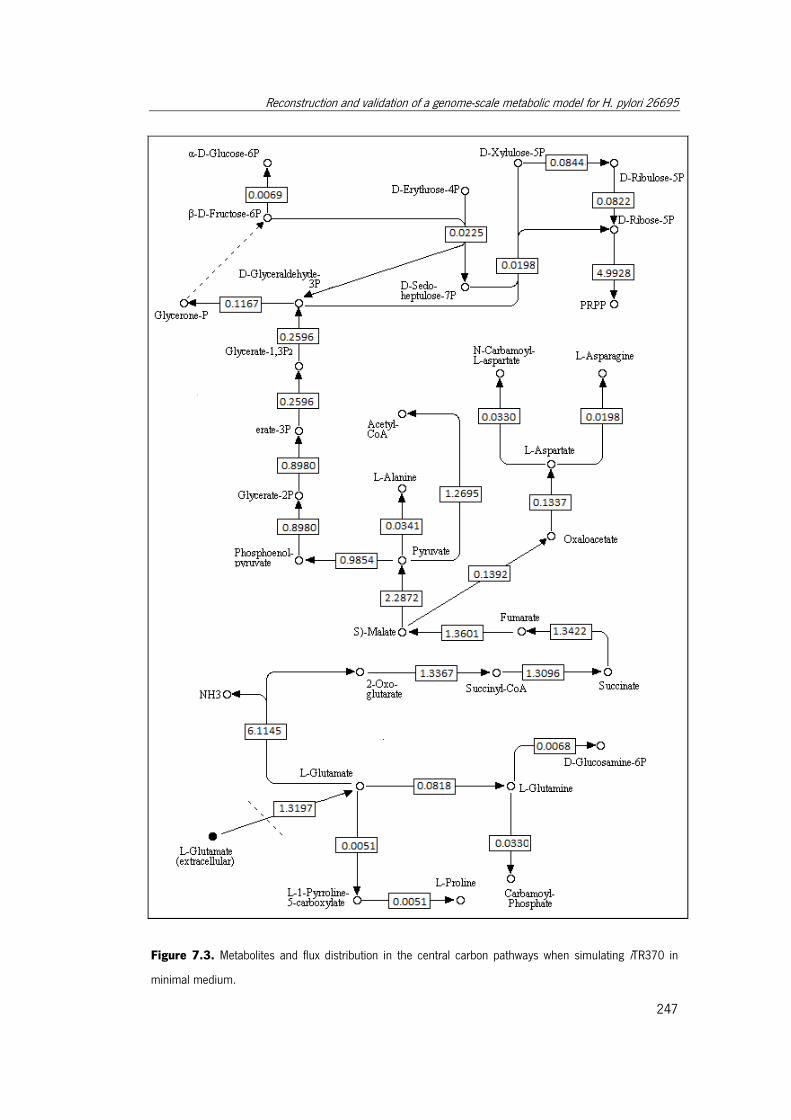
Reconstruction and validation of a genome-scale metabolic model for H. pylori 26695
247
Figure 7.3. Metabolites and flux distribution in the central carbon pathways when simulating iTR370 in
minimal medium.
Chapter 7
248
The metabolism of L-glutamate, the limiting carbon source of the model when
simulating with minimal medium, is also depicted. By following the fluxes in the model we
can see that L-Glutamate is in the origin of several products, including several amino
acids.
L-glutamate is directly converted to L-glutamine, which in its turn is converted in D-
glucosamine 6-phosphate (D-glucosamine-6P) and directed to the aminosugars
metabolism and to Carbamoyl phosphate which is routed to the pyrimidine metabolism.
From its conversion to (S)-1-Pyrroline-5-carboxylate (L-1-Pyrroline-5-carboxylate), L-
glutamate also originates L-proline, although our results with 13C labeled glutamic acid did
not prove this conversion. With the set of environmental conditions of this simulation, L-
proline is not being directed to any other metabolite, apart from the biomass, and the fact
that in silico it is being excreted to the environment in not yet totally clear. L-Aspartate,
originated from Oxaloacetate, can also be traced back to L-glutamate, passing through the
TCA cycle. After its conversion, L-Aspartate originates L-Asparagine. L-glutamate can also
be converted to L-tyrosine (data not shown) and enters the peptidoglycan biosynthesis.
These results allow a glimpse of the routes taken by L-glutamate in the model in
order to produce other metabolites. They also allow us to verify how reactions flow in some
of the major pathways, as in the case of the TCA cycle, which is only partially used. The
results obtained with the model largely agreed with the obtained experimental ones.
7.5 Conclusions
In this work, the reconstruction of a genome-scale metabolic model of H. pylori
26695 is presented.
After genome annotation, the metabolic conversions and transport systems
identified were retrieved and assembled in a metabolic network. The resulting network was
complemented with protein subcellular localization and reaction reversibility information. A
Biomass equation representing the cellular composition of H. pylori was formulated and
the entities included were Protein, Nucleotides, Peptidoglycans, Lipopolysaccharides,
Reconstruction and validation of a genome-scale metabolic model for H. pylori 26695
249
Lipids, Cofactors and Energy requirements. After the complete assembly of the metabolic
network and the formulation of the biomass reaction, the metabolic network was converted
into a draft metabolic model that was then manually curated.
The metabolic model contains 370 annotated genes, encoding 254 different
enzymes and 61 transport proteins, promoting a total of 666 different reactions, being
450 enzymatic and 216 of transport. The model comprises 2 compartments, cytoplasm
and periplasm, and contains 432 metabolites.
Simulations of biomass growth were performed using the model and the
experimentally developed minimal medium, containing the essential amino-acids, L-
glutamate as a carbon source, FBS components and other essential elements to the
metabolic model, such as water, oxygen, phosphate, sulfate and hypoxanthine. Gene
essentiality analysis was performed with this model, which was found to have 147
essential and 223 non-essential genes when simulated with all external metabolites
unconstrained, which corresponds with an agreement of 60% comparing with experimental
data available.
Growth simulations were performed using the uptake rates for the amino acids
obtained experimentally. From the 6 simulations performed, the simulation with the most
complete medium (including FBS components) and with the lower flux in the ATP
maintenance reaction showed to be the best when predicting the in vivo specific growth
rate of H. pylori (0.1085 h-1 in silico and 0.126 h-1 in vivo). These results show that, as
opposed to previous models, the model here presented allows to perform quantitative
predictions, besides having a significantly higher coverage of genes and GPR associations.
An analysis of the flux distributions obtained was performed for the central carbon
metabolism, showing important metabolite conversions and the correspondent fluxes and
allowing a better understanding of model predictions.
The presented results bring new and more comprehensive information on H. pylori
26695’s genome and metabolism, increasing and improving the existing knowledge on
this human pathogen. It is shown that the new metabolic model is able to predict the
phenotypic behavior of H. pylori, therefore becoming a useful tool in assisting the research

Chapter 7
250
work being perform on unveiling metabolic routes, identifying new drug targets and
enhancing treatment efficiency.
Reconstruction and validation of a genome-scale metabolic model for H. pylori 26695
251
7.6 References
1. Médigue, C. & Moszer, I. Annotation, comparison and databases for hundreds of
bacterial genomes. Res. Microbiol. 158, 724–736 (2007).
2. Simpson, J. T. & Durbin, R. Efficient de novo assembly of large genomes using
compressed data structures. Genome Res. 22, 549–556 (2012).
3. Tomb, J.-F. et al. The complete genome sequence of the gastric pathogen
Helicobacter pylori. Nature 388, 539–547 (1997).
4. Boneca, I. G. A revised annotation and comparative analysis of Helicobacter pylori
genomes. Nucleic Acids Res. 31, 1704–1714 (2003).
5. Rocha, I., Förster, J. & Nielsen, J. in Methods Mol. Biol. vol. 416 Gene Essentiality
(Gerdes, S. Y. & Osterman, A. L.) 416, 409–433 (Humana Press Inc., 2007).
6. Durot, M., Bourguignon, P.-Y. & Schachter, V. Genome-scale models of bacterial
metabolism: reconstruction and applications. FEMS Microbiol. Rev. 33, 164–190
(2009).
7. Raghunathan, A., Reed, J., Shin, S., Palsson, B. & Daefler, S. Constraint-based
analysis of metabolic capacity of Salmonella typhimurium during host-pathogen
interaction. BMC Syst. Biol. 3, 38 (2009).
8. Schilling, C. H. et al. Genome-scale metabolic model of Helicobacter pylori 26695.
J. Bacteriol. 184, 4582–4593 (2002).
9. Thiele, I., Vo, T. D., Price, N. D. & Palsson, B. Ø. Expanded metabolic
reconstruction of Helicobacter pylori ( iIT341 GSM/GPR): an in silico genome-scale
characterization of single- and double-deletion mutants. J. Bacteriol. 187, 5818–
5830 (2005).
10. Resende, T., Correia, D. M., Rocha, M. & Rocha, I. Re-annotation of the genome
sequence of Helicobacter pylori 26695. J. Integr. Bioinform. 10(3), 1–13 (2013).
11. Thiele, I. & Palsson, B. Ø. A Protocol for generating a high-quality genome-scale
metabolic reconstruction. Nat. Protoc. 5, 93–121 (2010).
Chapter 7
252
12. Dias, O., Rocha, M., Ferreira, E. C. & Rocha, I. Merlin: metabolic models
reconstruction using genome-scale information. in Proc. 11th Int. Symp. Comput.
Appl. Biotechnol. (CAB 2010) (Banga, J. R., Bagaerts, P., Impe, J. Van, Dochain, D.
& Smets, I.) 120–125 (2010).
13. Kanehisa, M. & Goto, S. KEGG: Kyoto Encyclopedia of Genes and Genomes.
Nucleic Acids Res. 28, 27–30 (2000).
14. Stelzer, M., Sun, J., Kamphans, T., Fekete, S. P. & Zeng, A.-P. An extended
bioreaction database that significantly improves reconstruction and analysis of
genome-scale metabolic networks. Integr. Biol. (Camb). 3, 1071–1086 (2011).
15. Flamholz, A., Noor, E., Bar-Even, A. & Milo, R. eQuilibrator - the biochemical
thermodynamics calculator. Nucleic Acids Res. 40, D770–D775 (2012).
16. Verduyn, C., Postma, E., Scheffers, W. a & van Dijken, J. P. Physiology of
Saccharomyces cerevisiae in anaerobic glucose-limited chemostat cultures. J. Gen.
Microbiol. 136, 395–403 (1990).
17. De Mey, M. et al. Comparison of DNA and RNA quantification methods suitable for
parameter estimation in metabolic modeling of microorganisms. Anal. Biochem.
353, 198–203 (2006).
18. Santos, S. & Rocha, I. Development of computational methods for determination of
biomass composition and evaluation of its impact in genome-scale models
prediction. (2013).
19. Feist, A. M. et al. A genome-scale metabolic reconstruction for Escherichia coli K-
12 MG1655 that accounts for 1260 ORFs and thermodynamic information. Mol.
Syst. Biol. 3, 1–18 (2007).
20. Cliff, W. & John, W. H. J. High-Speed Amino Acid Analysis ( AAA ) on 1.8 µm
Reversed-Phase ( RP ) Columns Application. 1–14 (2007).
21. Bautista, E. J. et al. Semi-automated curation of metabolic models via flux balance
analysis: a case study with Mycoplasma gallisepticum. PLoS Comput. Biol. 9,
e1003208 (2013).
22. Hirai, Y. et al. Unique cholesteryl glucosides in Helicobacter pylori: composition and
structural analysis . J. Bacte 177, 5327–5333 (1995).
Reconstruction and validation of a genome-scale metabolic model for H. pylori 26695
253
23. Geis, G., Leying, H., Suerbaum, S. & Opferkuch, W. Unusual fatty acid substitution
in lipids and lipopolysaccharides of Helicobacter pylori. J. Clin. Microbiol. 28, 930–
932 (1990).
24. Henry, C. S. et al. High-throughput generation, optimization and analysis of
genome-scale metabolic models. Nat. Biotechnol. 28, 977–982 (2010).
25. Orth, J. D. et al. A comprehensive genome-scale reconstruction of Escherichia coli
metabolism--2011. Mol. Syst. Biol. 7, 1–9 (2011).
26. Ham, B. Y. R. G. & King, D. Clonal growth of mammalian cells in a chemically
defined medium , synthetic medium. Microbiology 288–293 (1964).
27. Rocha, I. et al. OptFlux : an open-source software platform for in silico metabolic
engineering. BMC Syst. Biol. 4, 1–12 (2010).
28. Chen, W.-H., Minguez, P., Lercher, M. J. & Bork, P. OGEE: an online gene
essentiality database. Nucleic Acids Res. 40, D901–D906 (2012).
29. Thiele, I., Price, N. D., Vo, T. D. & Palsson, B. Ø. Metabolic capabilities in silico of
the human pathogen Helicobacter pylori. 92093
30. Thiele, I., Vo, T. D., Price, N. D. & Palsson, B. Ø. Expanded metabolic
reconstruction of Helicobacter pylori (iIT341 GSM/GPR ): an in silico genome-scale
characterization of single- and double-deletion mutants. J. Bacteriol. 187, 5818–
5830 (2005).
31. Feist, A. M., Herrgård, M. J., Thiele, I., Reed, J. L. & Palsson, B. Ø. Reconstruction
of biochemical networks in microorganisms. Nat. Rev. Microbiol. 7, 129–143
(2009).
32. Schauder, S., Shokat, K., Surette, M. G. & Bassler, B. L. The LuxS family of
bacterial autoinducers: biosynthesis of a novel quorum-sensing signal molecule.
Mol. Microbiol. 41, 463–476 (2001).
33. Doherty, N. C. et al. In Helicobacter pylori, LuxS is a key enzyme in cysteine
provision through a reverse transsulfuration pathway. J. Bacteriol. 192, 1184–
1192 (2010).
34. Tomb, J. F. et al. The complete genome sequence of the gastric pathogen
Helicobacter pylori. Nature 388, 539–547 (1997).
Chapter 7
254
7.7 Supplementary material (Electronic version
list)
Supplementary material E1 - Biomass. xls.
Supplementary material E2 – Hpylori_metabolic_model.xml.
Supplementary material E3 – Model_features.xls.
Supplementary material E4 – Model_simulation_results.xls.

Chapter 8 8. Concluding Remarks

Concluding Remarks
257
Helicobacter pylori is associated with gastric diseases, such as gastritis, peptic and
duodenal ulcers, mucosa associated lymphoid tissue lymphoma and gastric
adenocarcinomas. Despite more than half of the global population being infected with this
bacterium, not all individuals will develop clinical symptoms. Nevertheless, its association
with gastric cancer, the high infection rate, as well as the failures on eradication efforts
and vaccine development lead to an important health concern. In order to better
understand the mechanisms leading to disease and also to develop effective ways to fight
H. pylori infection, it is important to understand its physiological and metabolic behavior.
H. pylori is a microaerophilic, gram negative, fastidious organism, for which no
effective defined medium has been developed. Furthermore, current cultivation procedures
use media that, even when semi-defined, have a variety of nutrients that can be used as
carbon and energy sources. Under those conditions, the metabolic and physiological
characterization of H. pylori is very difficult.
The aim of this work was thus to study the physiology and metabolism of H. pylori
to allow a better understanding of the behavior and pathogenicity of this organism. For that
aim, a systems biology approach was used where metabolomics data were used to
characterize the nutritional requirements, and the potential and preferred carbon sources.
These data, collected from experiments performed with semi-defined media, together with
genomics and other information available, were used to build the first genome-scale
metabolic model of H. pylori that is able to make quantitative predictions. This model can
be used, in the future, to investigate novel drug targets and elucidate the metabolic basis
of infection. Furthermore, a comparative study was performed that analyzed different
methods for assessing growth, viability, culturability and morphology, as these are
important physiological parameters.
During this work, important conclusions were taken that can be summarized as
follows:
- For assessing H. pylori growth, different methods can be used that originate
different results that often need to be interpreted with care. From the methods
Chapter 8
258
evaluated, DAPI yielded the highest number of total cell counts when
compared with the PNA FISH probe applied. Optical density measurements
can also be used to assess growth with reliability. Nevertheless, before the
application of any of those methods, it is important to perform disaggregation
procedures, especially in samples taken after the exponential growth phase. In
fact, cell-to-cell aggregation was visible and had a great impact in all
measurements.
- Culturable cell counts were in general less than total cell counts performed
with DAPI, especially after the exponential phase, showing the presence of
nonculturable cells. The viable but non-culturable state was mostly observed at
the end of the culture, after 60 hours.
- The evaluation of cell viability using Syto9/propidium iodide was not effective
in analyzing cells during morphological changes, giving exaggerated numbers
of nonviable cells, which is explained by the entrance of propidium iodide
through the permeable cytoplasmatic membrane. Under the referred
conditions, another method to estimate cell viability must be used, such as the
measurement of membrane potential.
- The culturable cell counts in some samples were higher compared with the
spiral cells observed at these time points, thus indicating the potential
presence of culturable coccoid cells, previously reported by other authors, but
still under controversy.
- At the end of the culture, mainly coccoid cells were observed. Taking into
account that coccoid forms represent a cell adaptation to less favorable
conditions, the present results suggest that some stressing factors are present
that cause morphological changes, probably the unavailability of an essential
nutrient. The presence of an increasing number and size of cell clusters also
supports this hypothesis.
- The first report on the measurement of the exometabolome of H. pylori
indicated that, as suggested by other authors, this organism has not a
Concluding Remarks
259
preference for glucose as a carbon source in the presence of amino acids in
the culture medium.
- In agreement with in silico and in vitro published data, some amino acids were
confirmed to be essential under the conditions used: L-arginine, L-histidine, L-
leucine, L-methionine and L-valine. Additionally, L-isoleucine and L-
phenylalanine, for which there was no consensus, were identified to be
essential for the growth of H. pylori 26695, under the conditions used in this
study.
- Nevertheless, some doubts persisted for the essentiality of L-proline and L-
alanine, as they have been detected in the fetal bovine serum added to the
culture. Our attempts to grow H. pylori without FBS and without strain
adaptation failed, indicating that some components are missing in the culture
medium used or that FBS has another unknown function. Thus, further
investigation is needed in this direction.
- Some essential amino acids were found to be completely consumed from the
culture medium, such as L-methionine, emphasizing the need of adjusting the
amino acids concentration.
- Regarding preferences and possible carbon sources, our exometabolome
experiments have indicated that aspartate, glutamate, proline and alanine
could be potentially preferred by H. pylori, since they were completely
consumed in the mentioned order. Compared with amino acids, organic acids
were not the preferred carbon sources, and, among the identified compounds,
pyruvate seems to be the preferred one.
- When the potential carbon sources identified were used individually for
growing H. pylori, glutamine was identified as the carbon source that yielded a
higher growth. However, glutamine easily suffers degradation in aqueous
medium and is converted to glutamate and ammonium by an enzymatic
reaction in H. pylori’s periplasm. In addition, the use of glutamate as the main
carbon source had a higher yield in biomass regarding substrate consumption
Chapter 8
260
and also allowed to achieve a high specific growth rate. As such, we suggest
glutamate as the carbon source of choice for H. pylori’s growth.
- When controlled experiments were performed with glutamate as the main
carbon source, the specific growth rate was determined to be 0.126 h-1 and a
biomass yield of 0.6 g/g was obtained.
- A strategy of 13C labeling was applied to determine the carbon flow, using [U-
13C]-glutamic acid as the main carbon source. The determination of 13C labeling
patterns of proteinogenic amino acids in biomass hydrolysates provided
important clues about carbon flow, allowing to confirm the set of essential
amino acids.
- Proline is probably not essential and could be synthesized from L-arginine,
rather than the described possible biosynthesis from L-glutamate, as it was not
labeled during labeling experiments, although its exhaustion from the medium
did not arrest growth.
- L-alanine is probably also not essential and could be obtained from pyruvate
by alanine dehydrogenase, which would be reversible in H. pylori. This
conclusion is based on the fact that a low percentage of 13C labeling was
detected in L-alanine, although with a high error associated.
- Another controversial point about the metabolism of H. pylori is the presence
of a complete TCA cycle. In the present work, evidences of an almost
complete TCA cycle were provided by the presence of labeled aspartate in 13C-
glutamate labeling experiments.
- A metabolic model was developed that represents 370 annotated genes,
encoding 254 different enzymes and 61 transport proteins, that promote a
total of 666 different reactions, being 450 enzymatic and 216 of transport.
The model comprises 2 compartments, cytoplasm and periplasm, and
contains 432 metabolites.
- Gene essentiality analysis was performed with this model, which was found to
have 147 essential and 223 non-essential genes when simulated with all

Concluding Remarks
261
external metabolites unconstrained, which corresponds with an agreement of
60% comparing with the experimental data available.
- A very good agreement of predictions with experimental data was obtained
when the uptake rates for the amino acids obtained experimentally were used
in the simulations (0.109 h-1 in silico and 0.126 h-1 in vivo). The estimated ATP
maintenance consumption was set to 1 mmol.gDW.h-1. Moreover, the flux
distributions obtained are consistent with the know carbon flow.