
Crushing Principles of Mechanical Crushing · Crusher Operation • Relation between Feed size and...
45
Crushing Principles of Mechanical Crushing
Transcript of Crushing Principles of Mechanical Crushing · Crusher Operation • Relation between Feed size and...

Crushing Principles of Mechanical Crushing

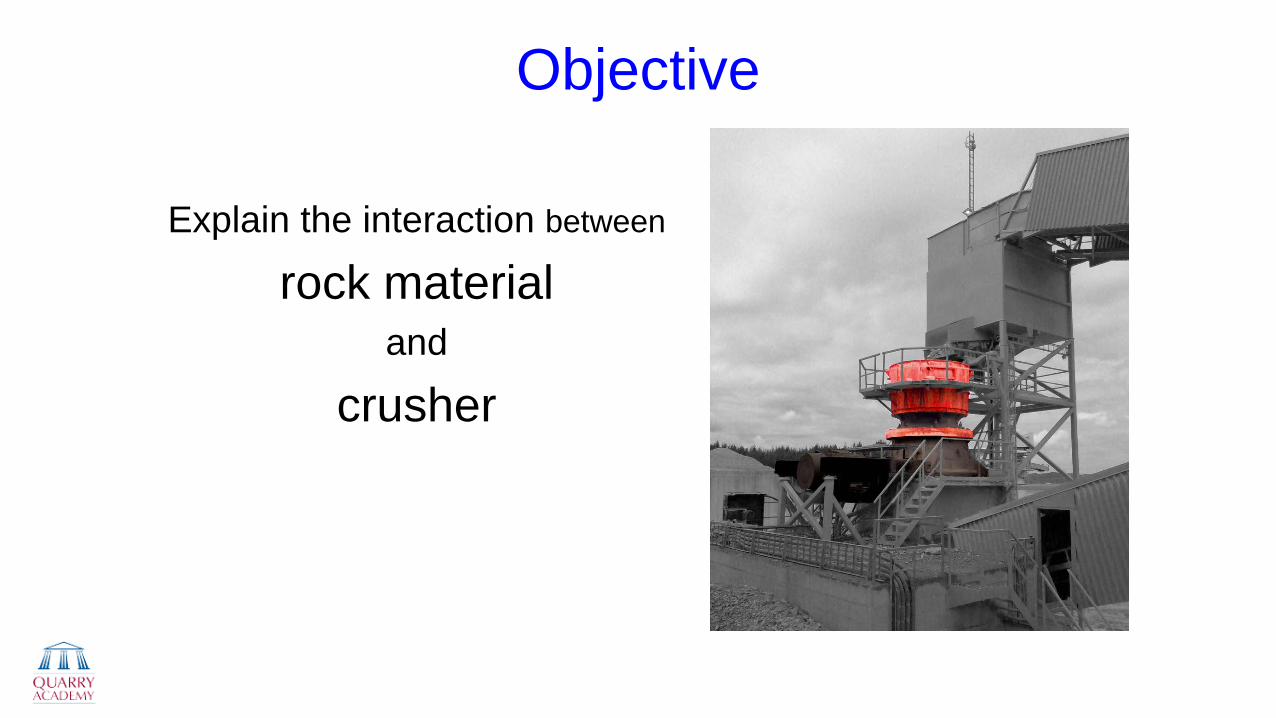
Objective
Explain the interaction between
rock material and
crusher

Take home messages
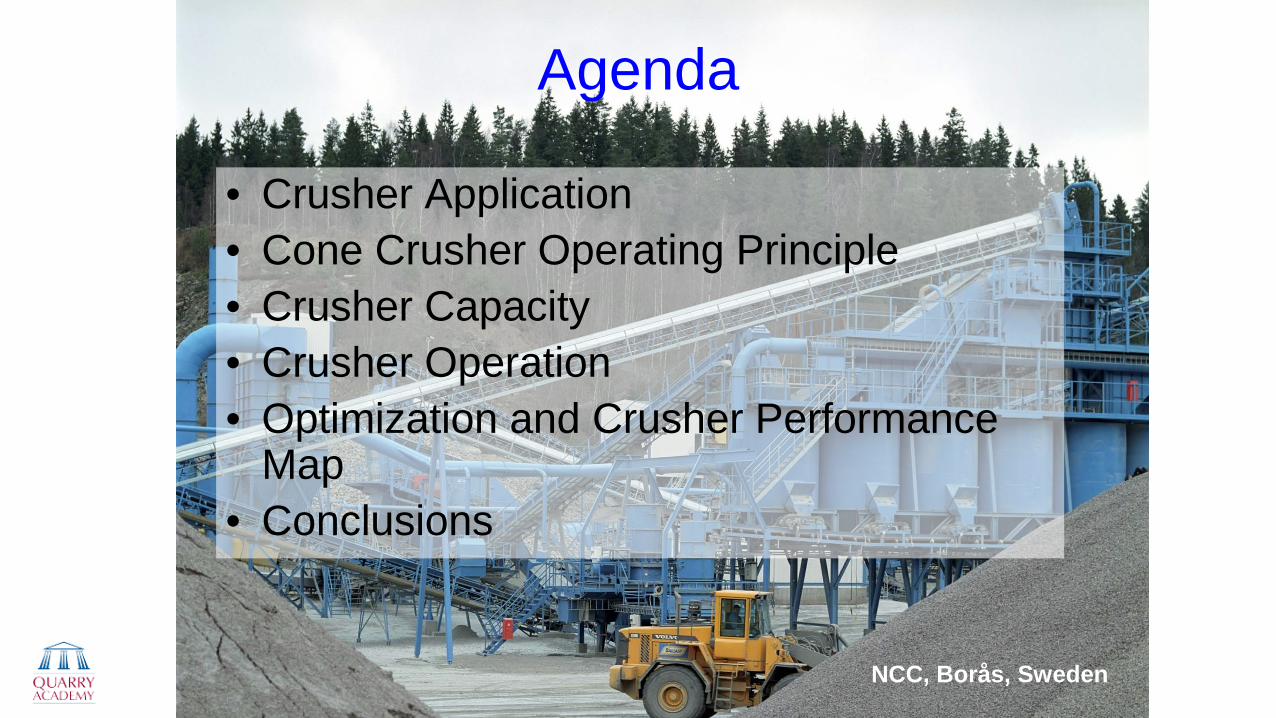
Agenda
• Crusher Application • Cone Crusher Operating Principle • Crusher Capacity • Crusher Operation • Optimization and Crusher Performance
Map • Conclusions
NCC, Borås, Sweden
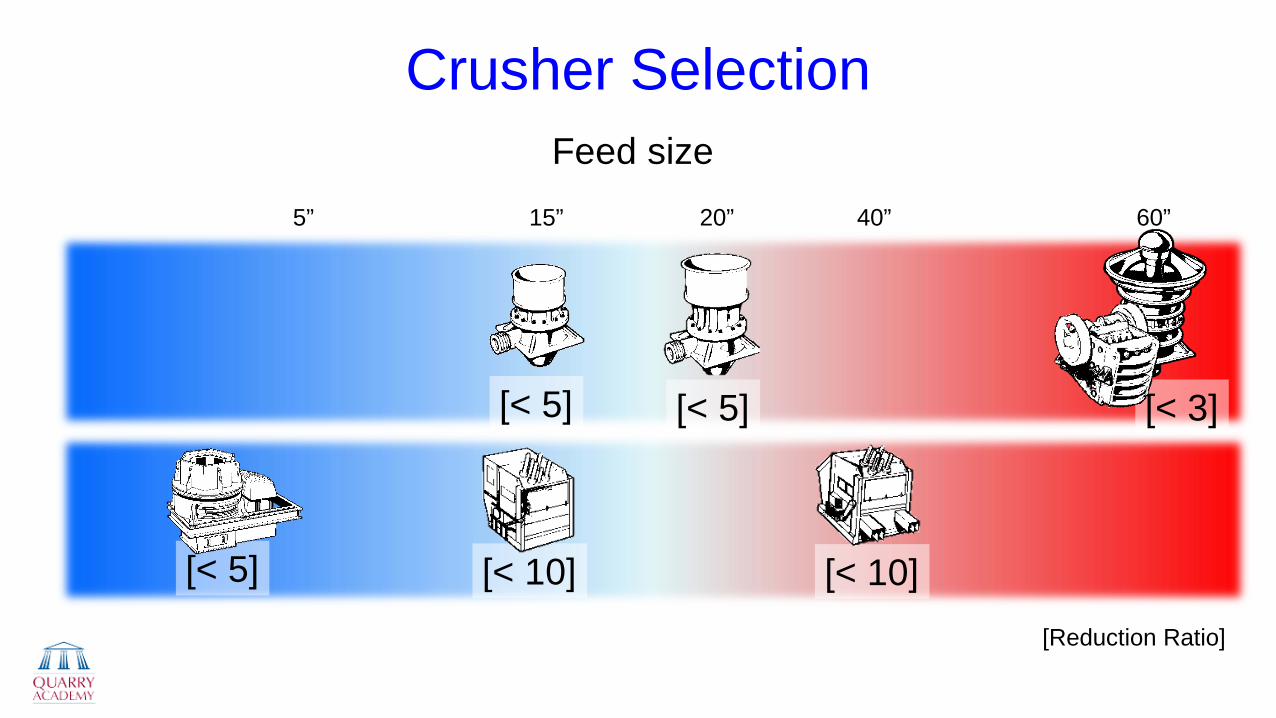
Crusher Selection Feed size
60” 40” 20” 15” 5”
[Reduction Ratio]
[< 3] [< 5] [< 5]
[< 5] [< 10] [< 10]
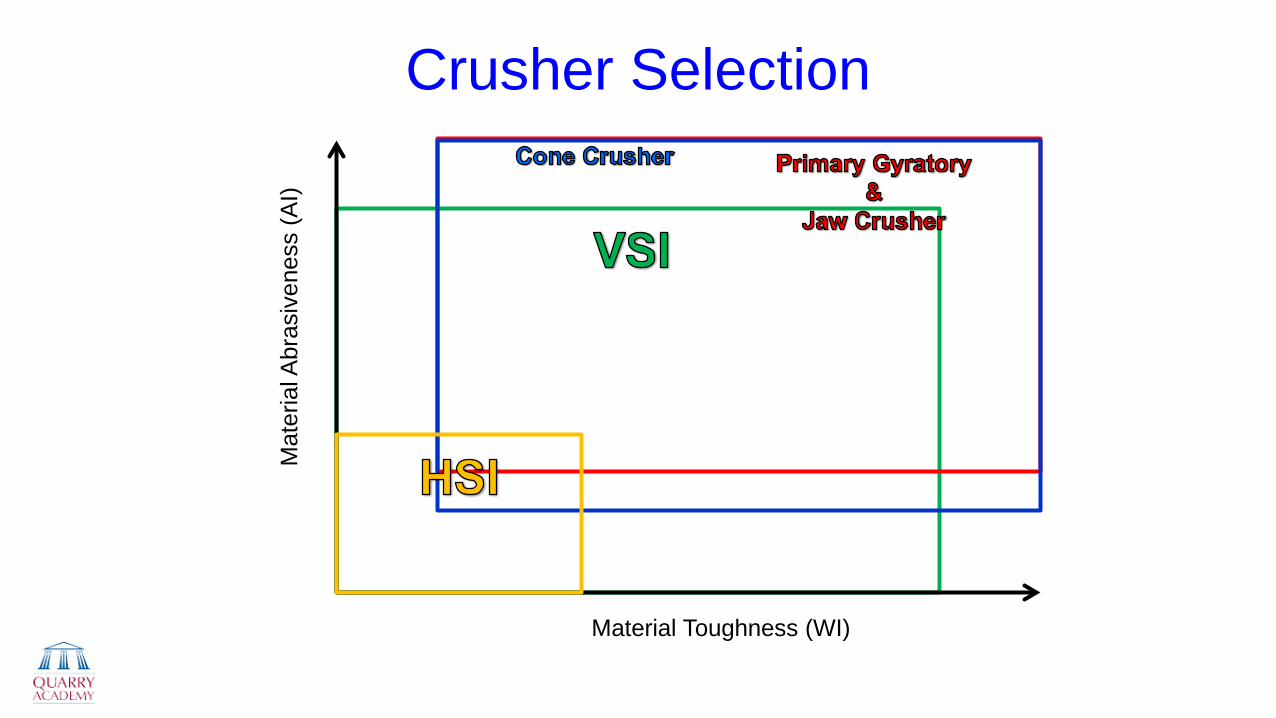
Crusher Selection
Material Toughness (WI)
Mat
eria
l Abr
asiv
enes
s (A
I)
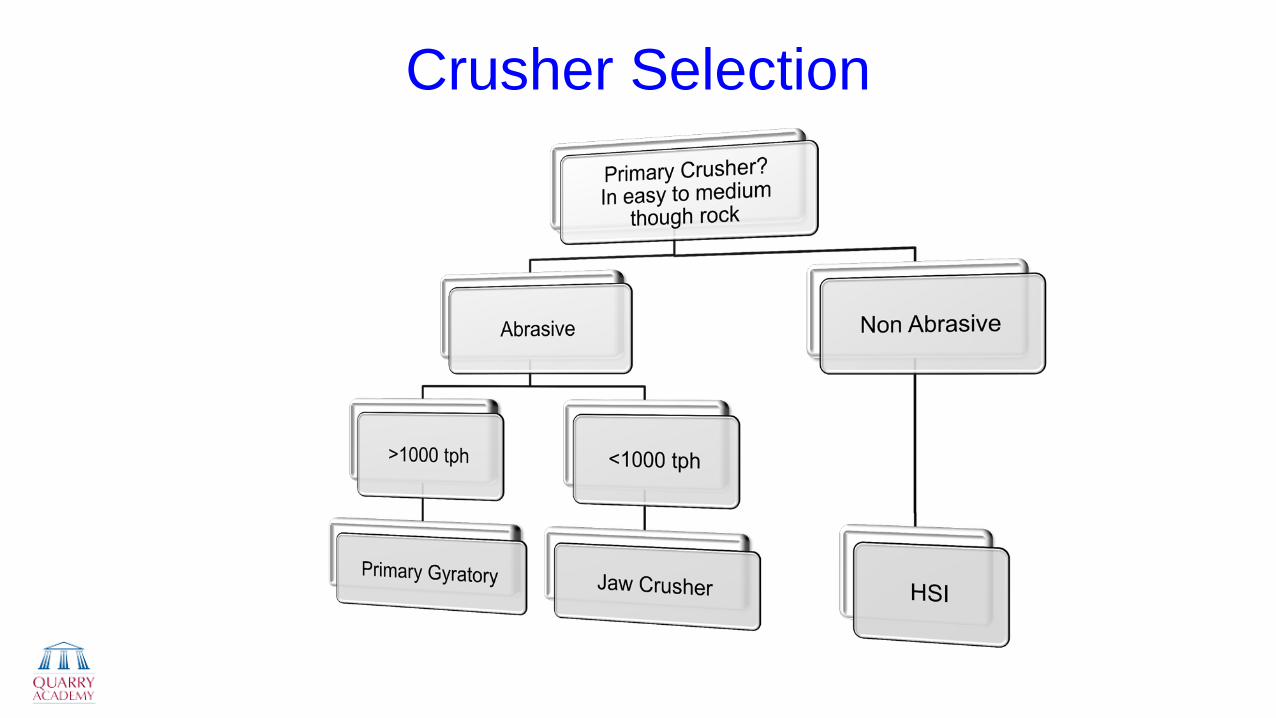
Crusher Selection
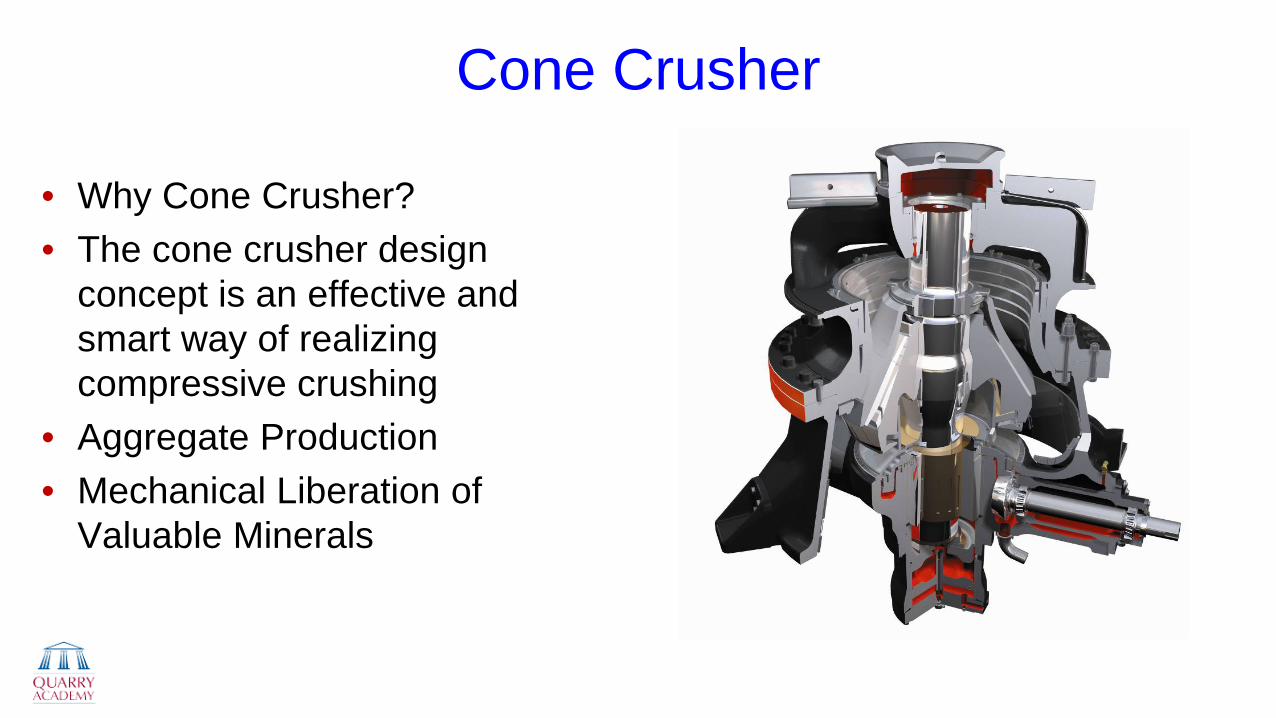
Cone Crusher
• Why Cone Crusher? • The cone crusher design
concept is an effective and smart way of realizing compressive crushing
• Aggregate Production • Mechanical Liberation of
Valuable Minerals
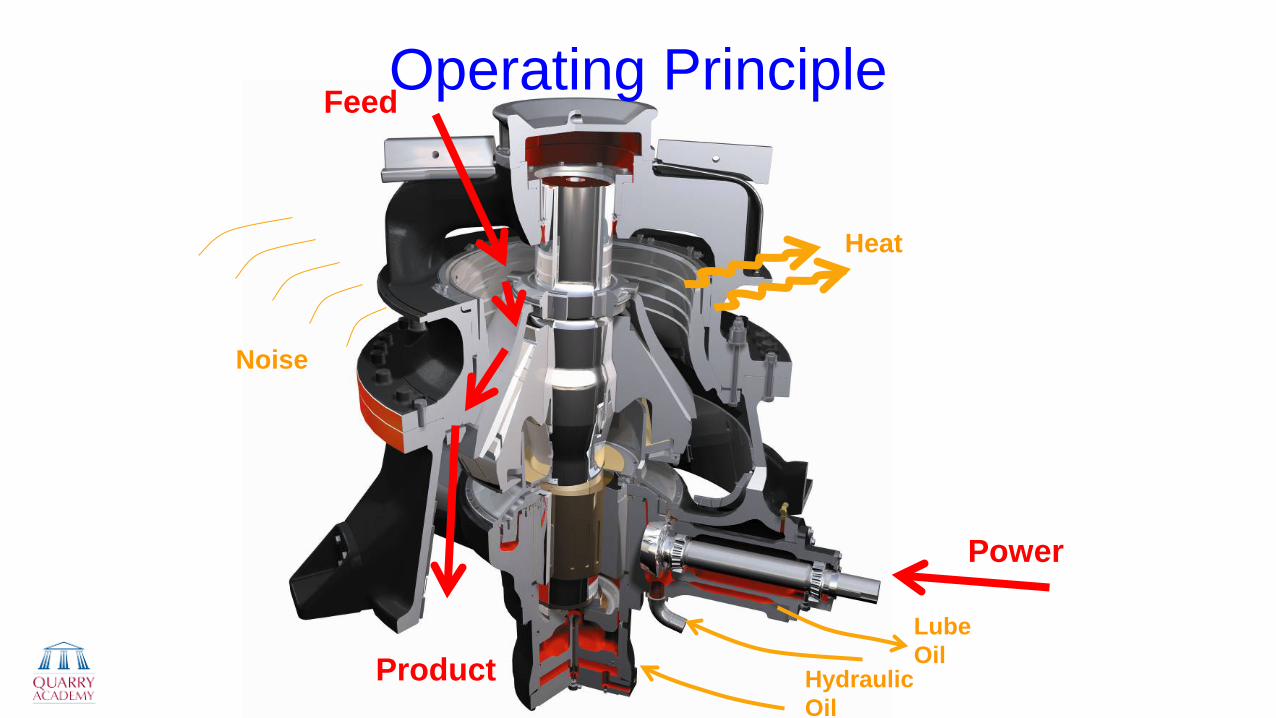
Product
Feed
Power
Operating Principle
Heat
Noise
Lube Oil
Hydraulic Oil
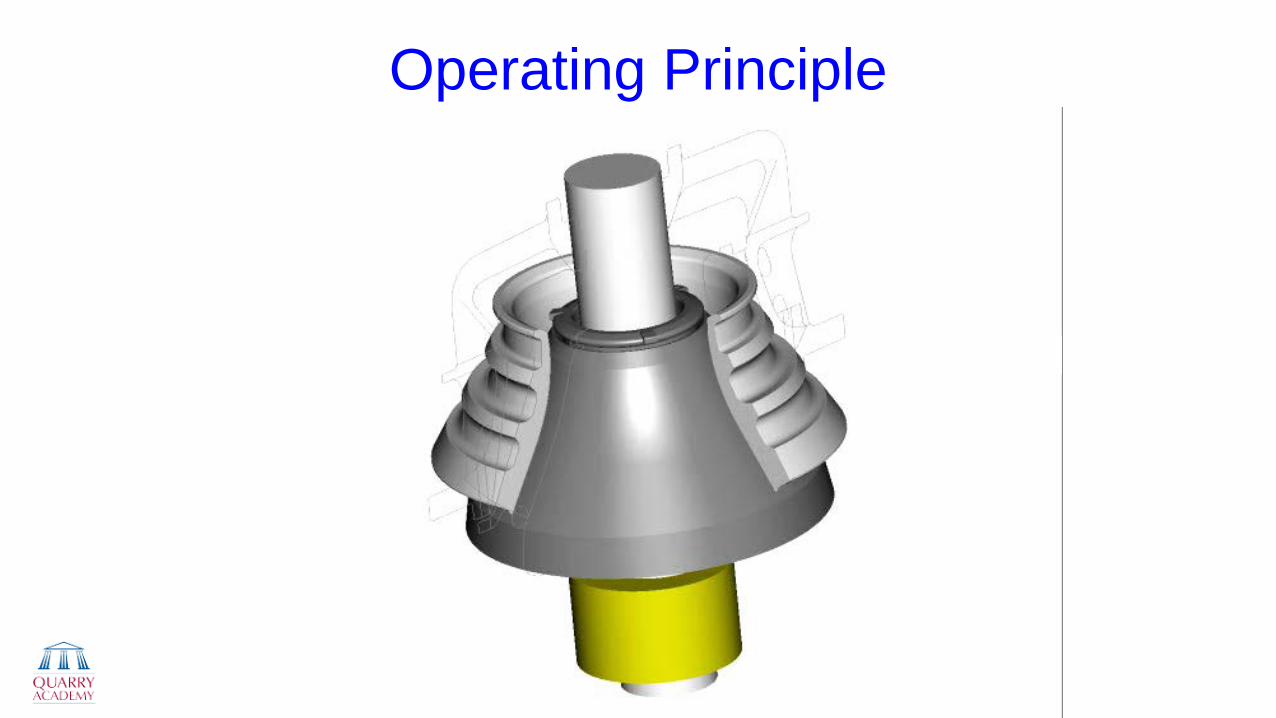
Operating Principle
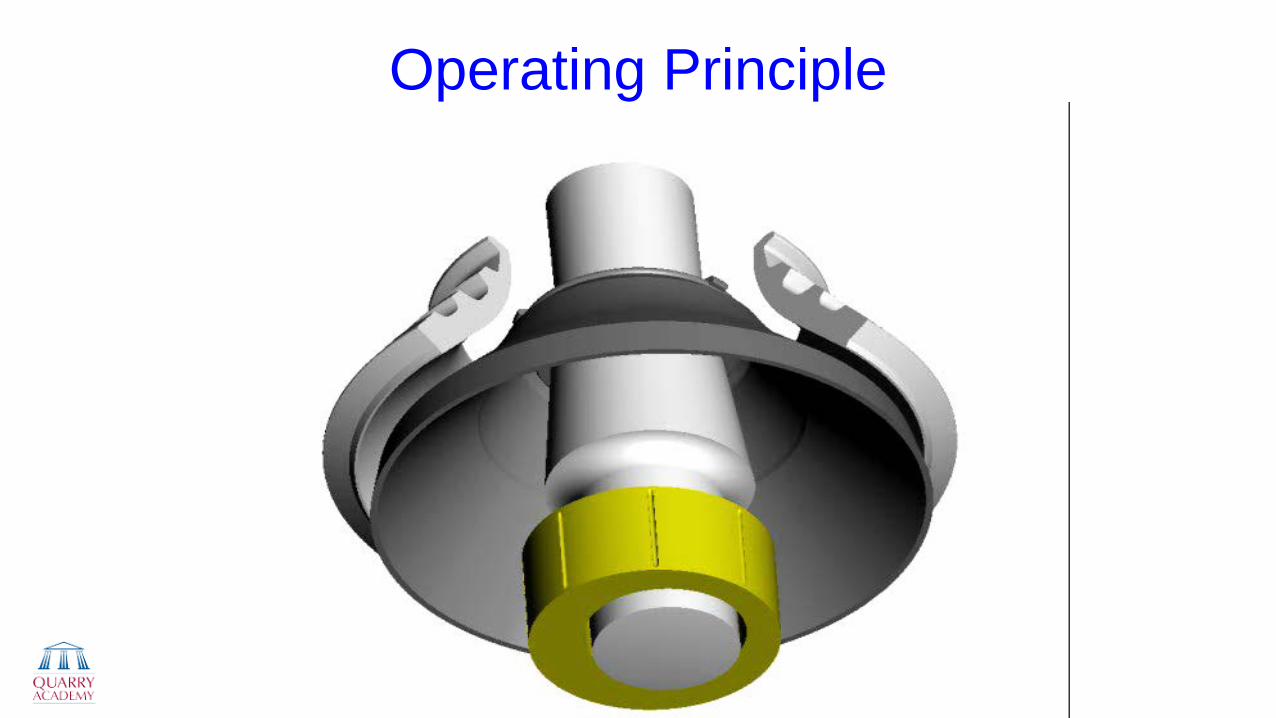
Operating Principle
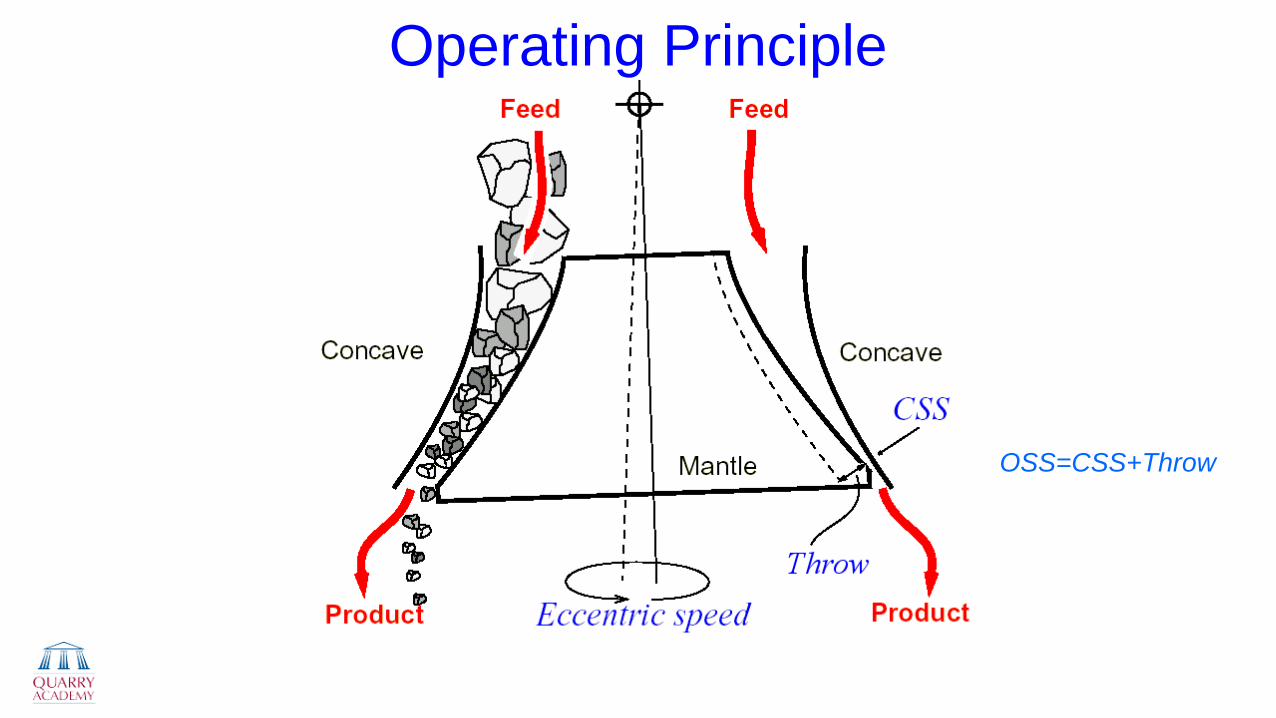
Operating Principle
OSS=CSS+Throw
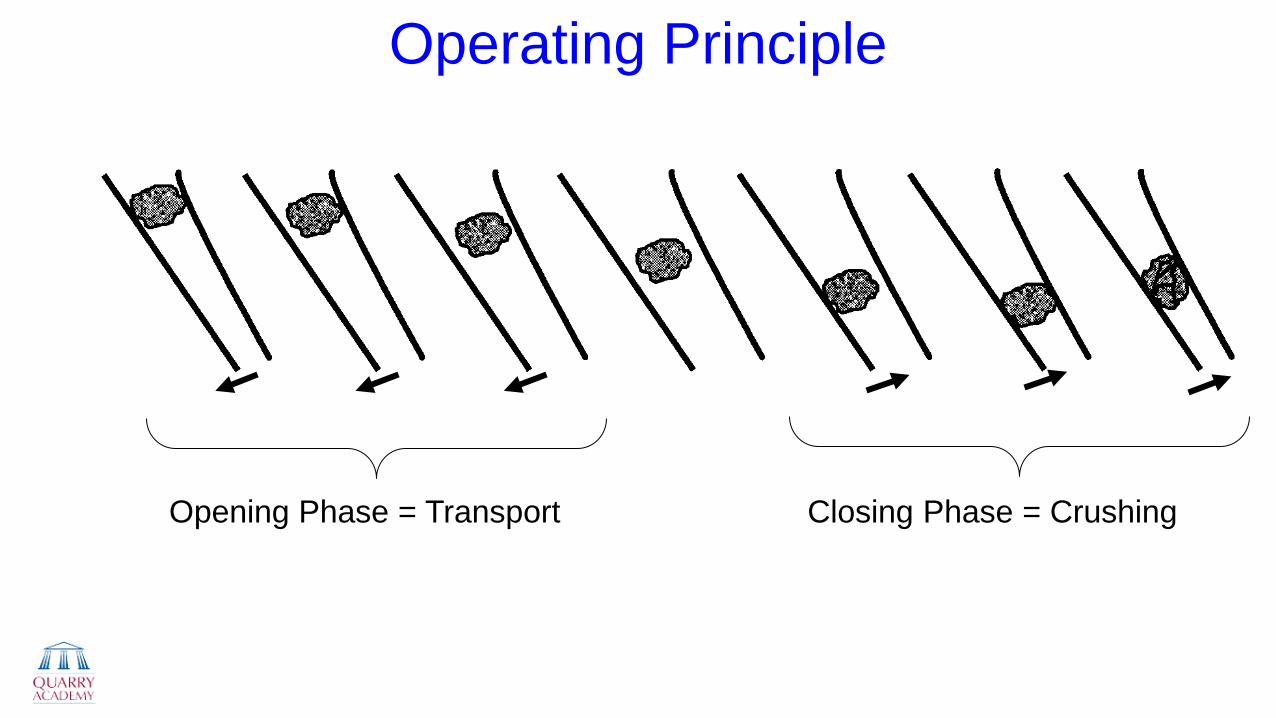
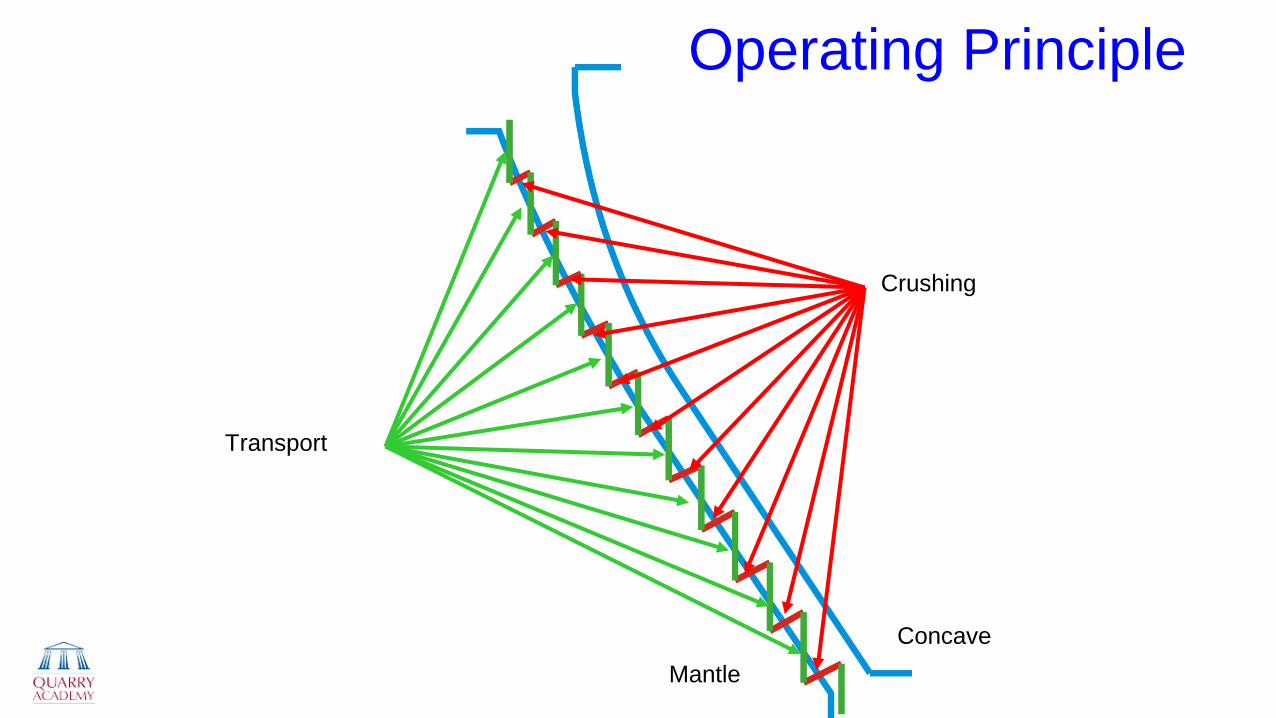
Operating Principle
Opening Phase = Transport Closing Phase = Crushing
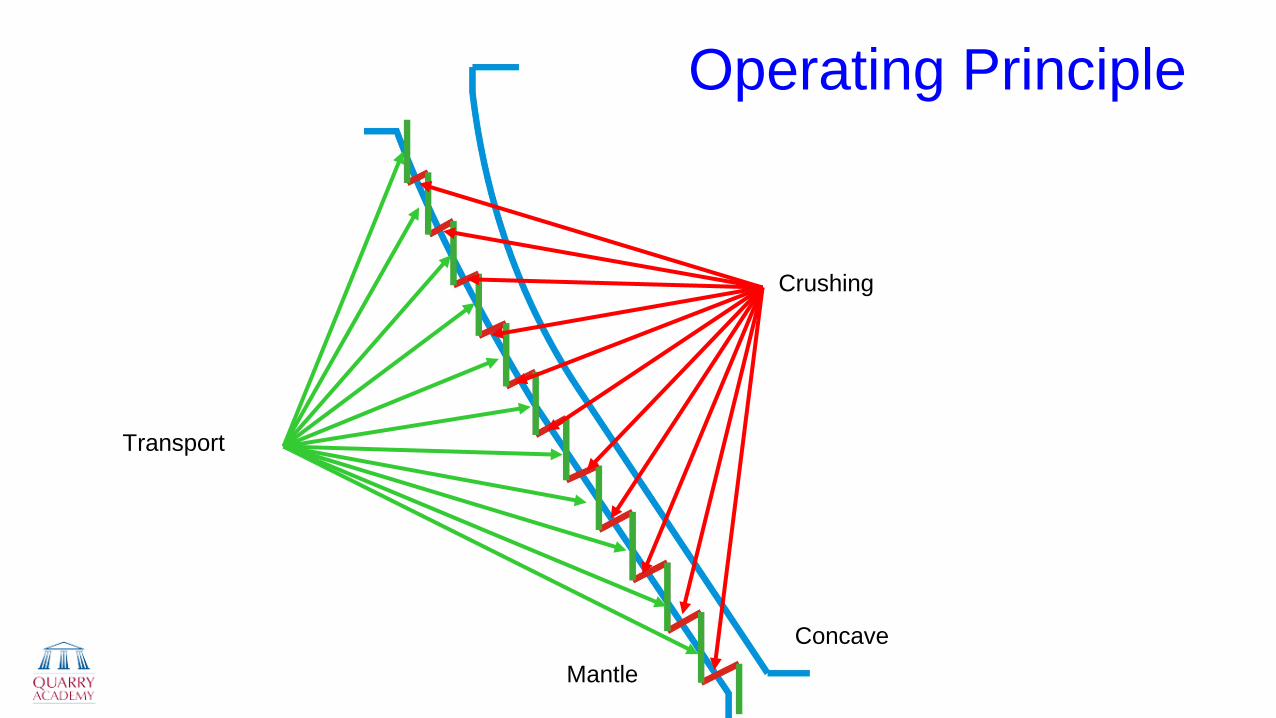
Crushing
Mantle Concave
Transport
Operating Principle
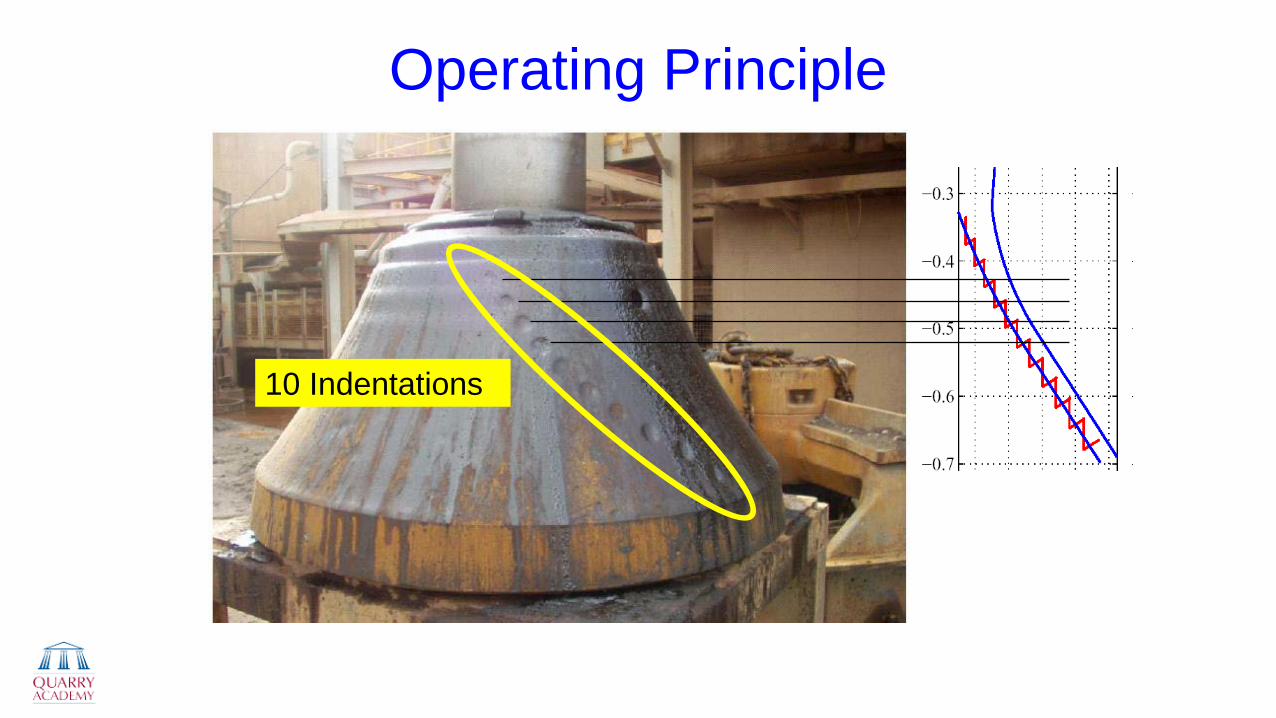
10 Indentations
Operating Principle
Crushing
Mantle Concave
Transport
Operating Principle
Mantle Concave
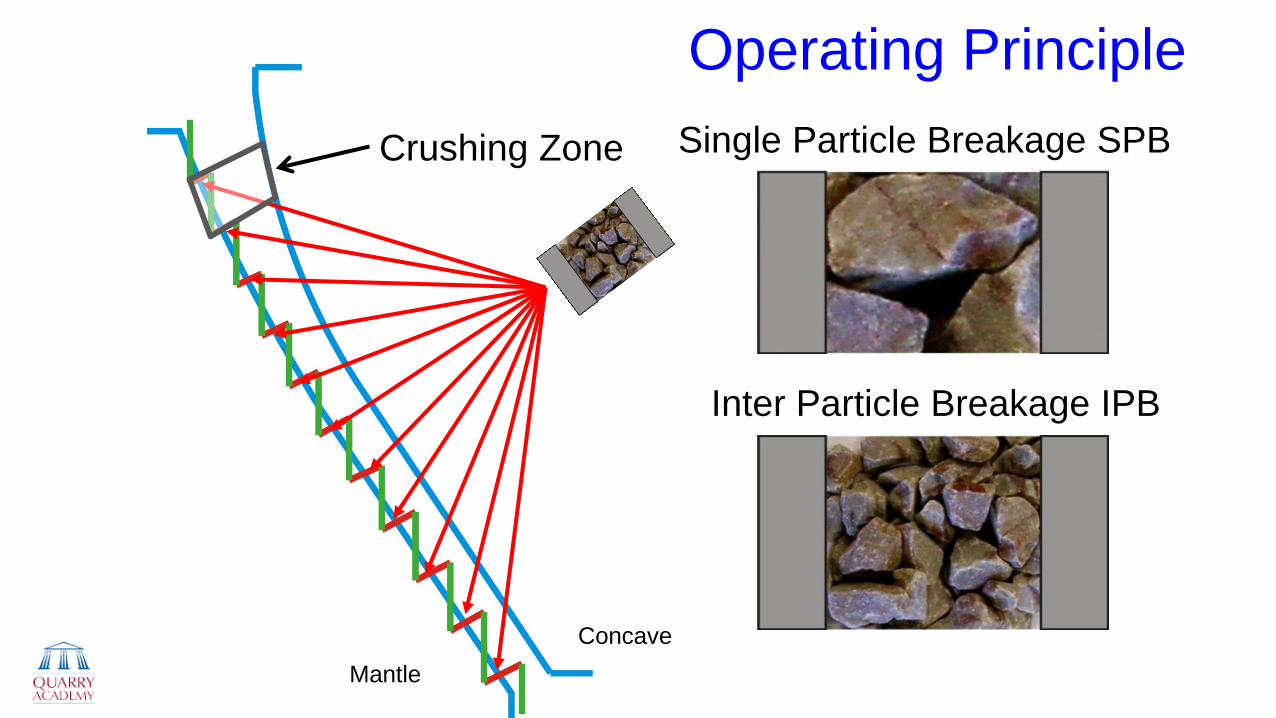
Crushing
Crushing Zone
Operating Principle Single Particle Breakage SPB
Inter Particle Breakage IPB
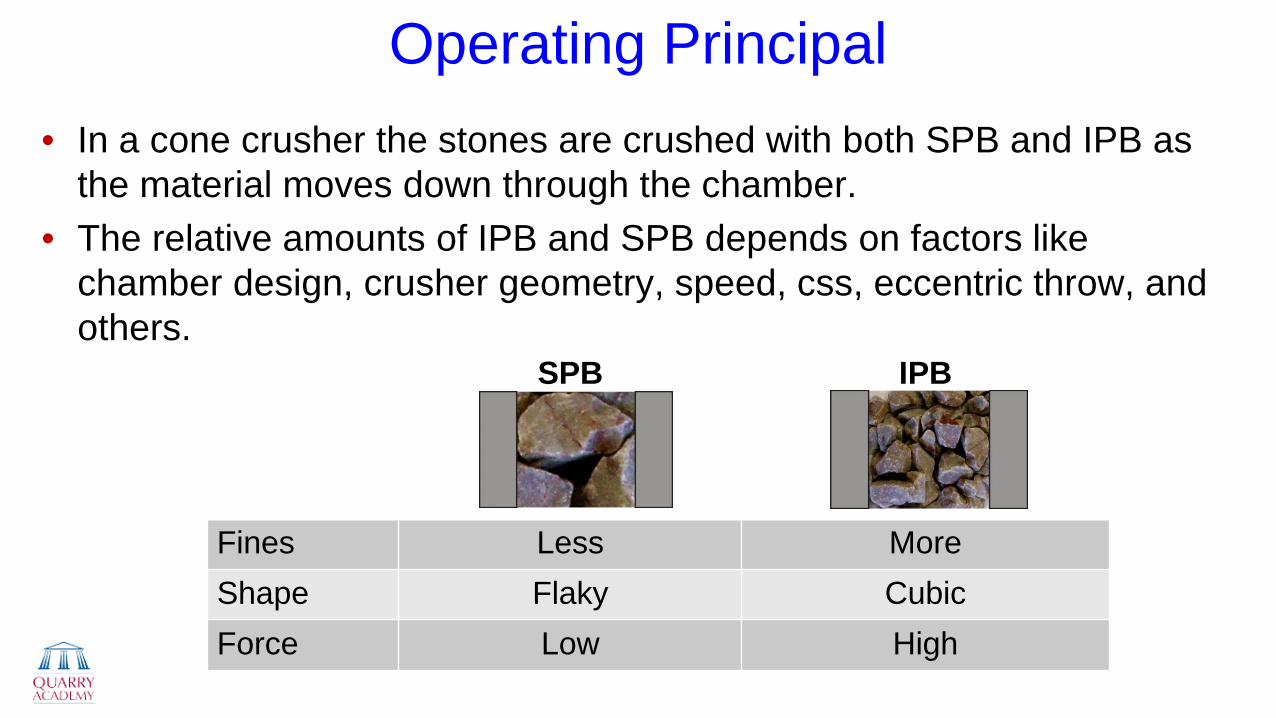
Operating Principal • In a cone crusher the stones are crushed with both SPB and IPB as
the material moves down through the chamber. • The relative amounts of IPB and SPB depends on factors like
chamber design, crusher geometry, speed, css, eccentric throw, and others. SPB IPB
Fines Less More Shape Flaky Cubic Force Low High
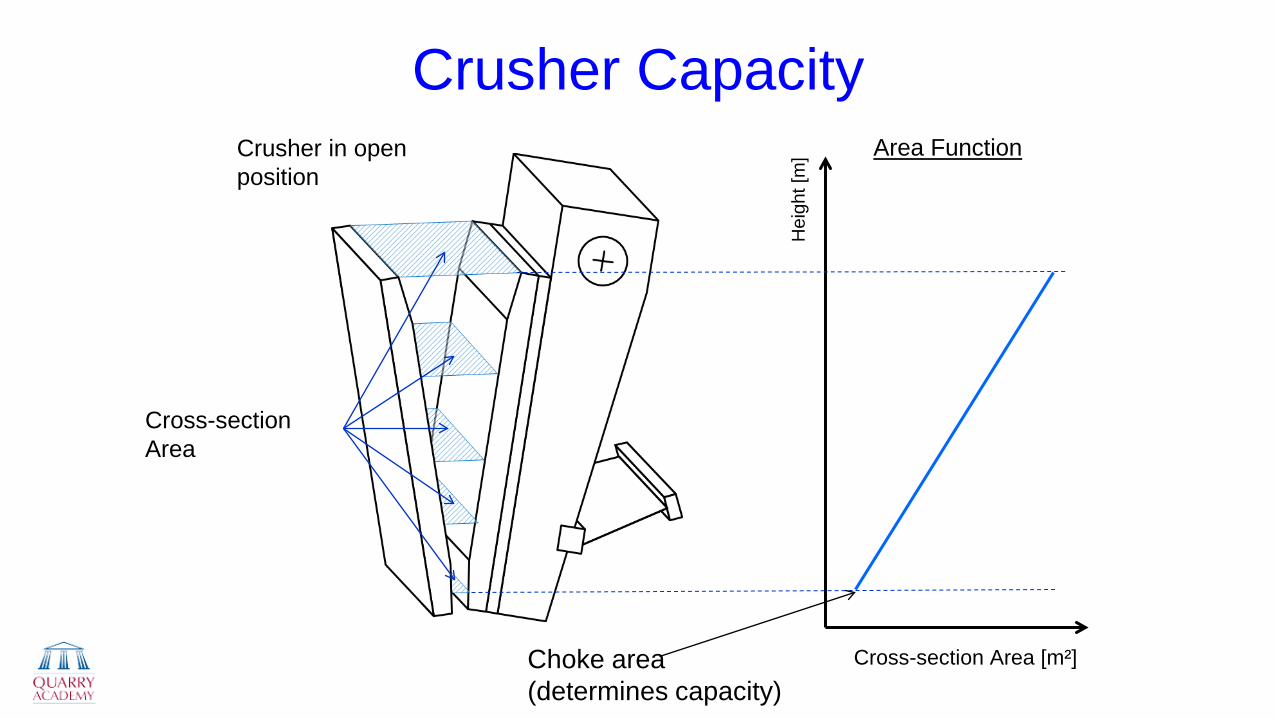
Crusher Capacity
Cross-section Area [m²]
Hei
ght [
m] Area Function
Choke area (determines capacity)
Cross-section Area
Crusher in open position
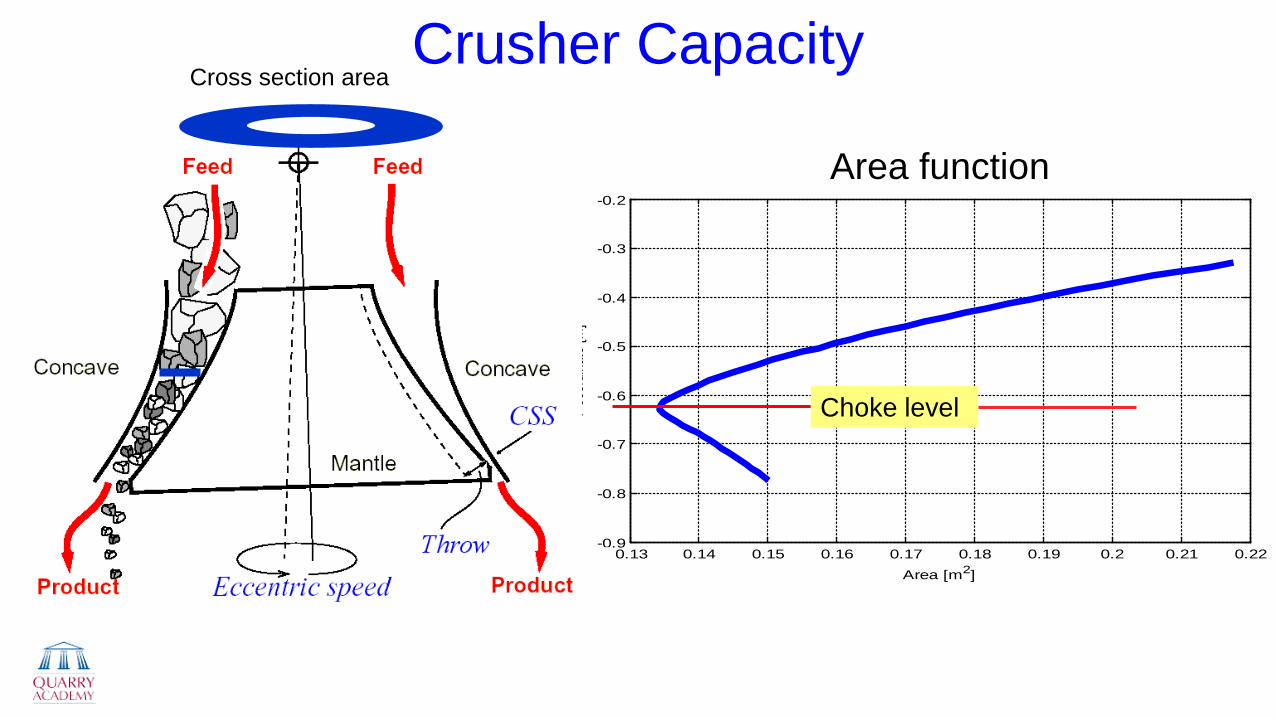
Crusher Capacity Cross section area
0.13 0.14 0.15 0.16 0.17 0.18 0.19 0.2 0.21 0.22-0.9
-0.8
-0.7
-0.6
-0.5
-0.4
-0.3
-0.2
Yco
ordina
te [m
]Area [m2]
Area function
Choke level
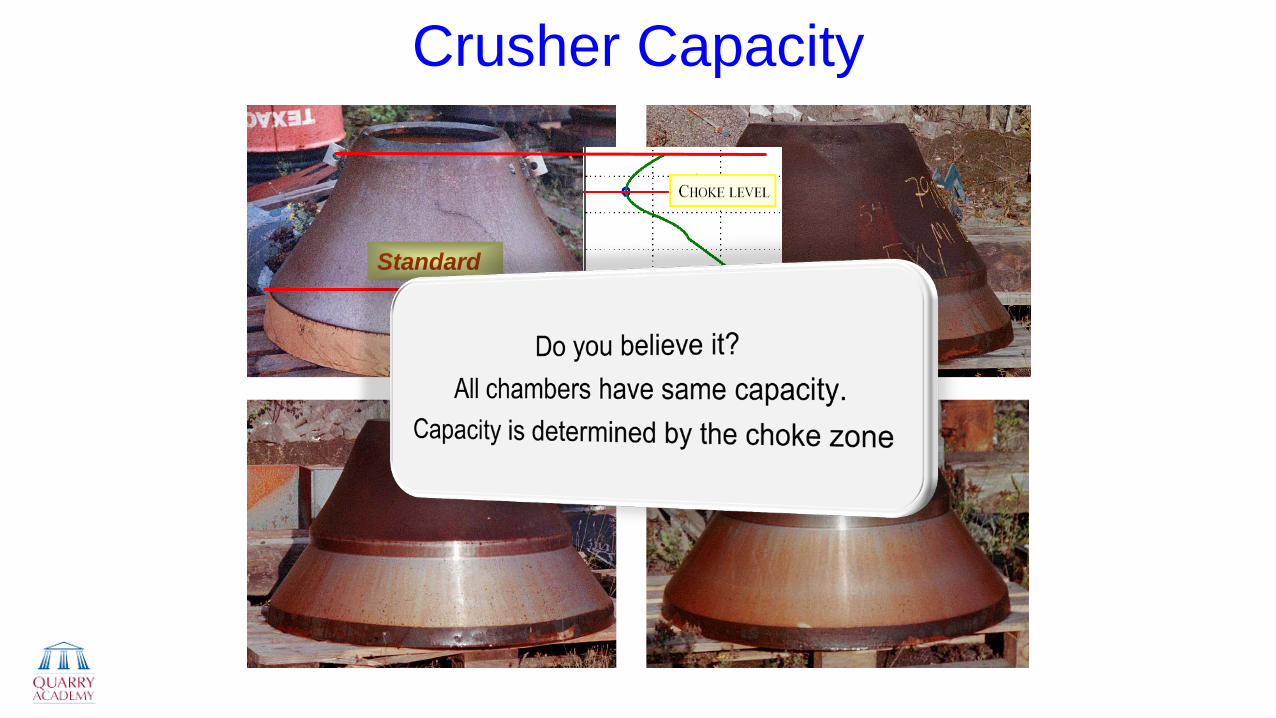
Crusher Capacity
Standard
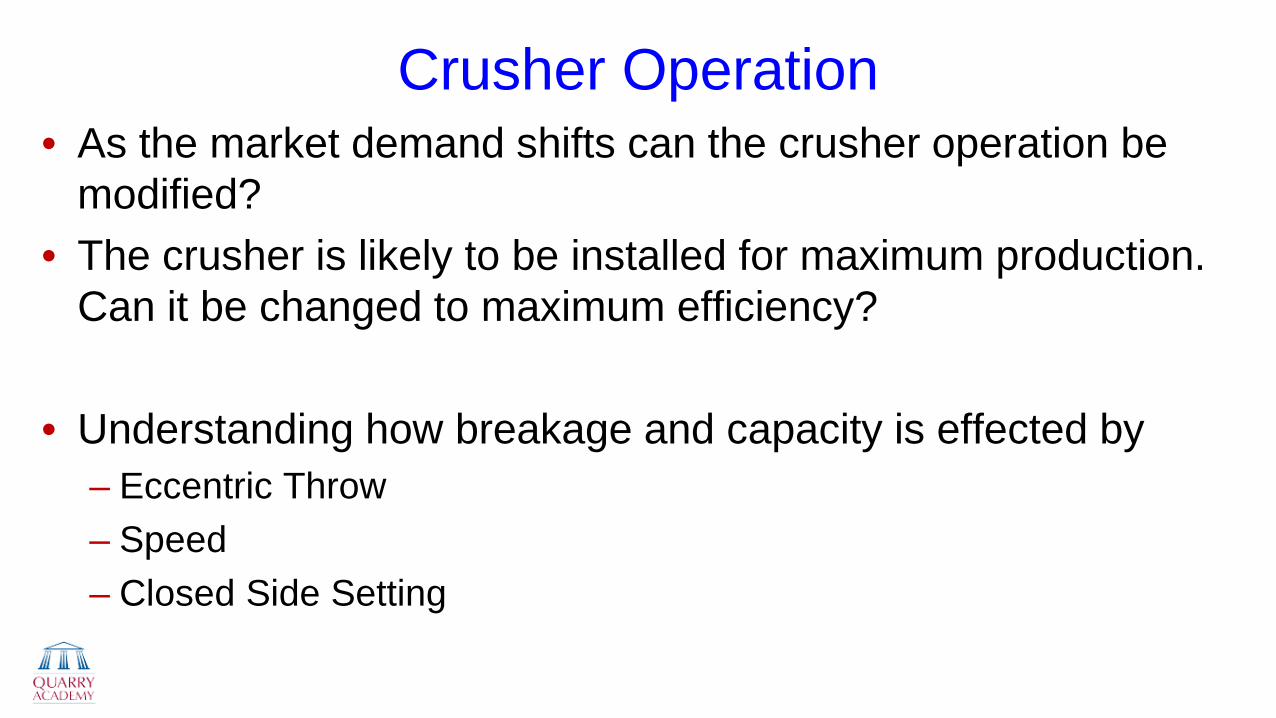
Crusher Operation • As the market demand shifts can the crusher operation be
modified? • The crusher is likely to be installed for maximum production.
Can it be changed to maximum efficiency?
• Understanding how breakage and capacity is effected by – Eccentric Throw – Speed – Closed Side Setting
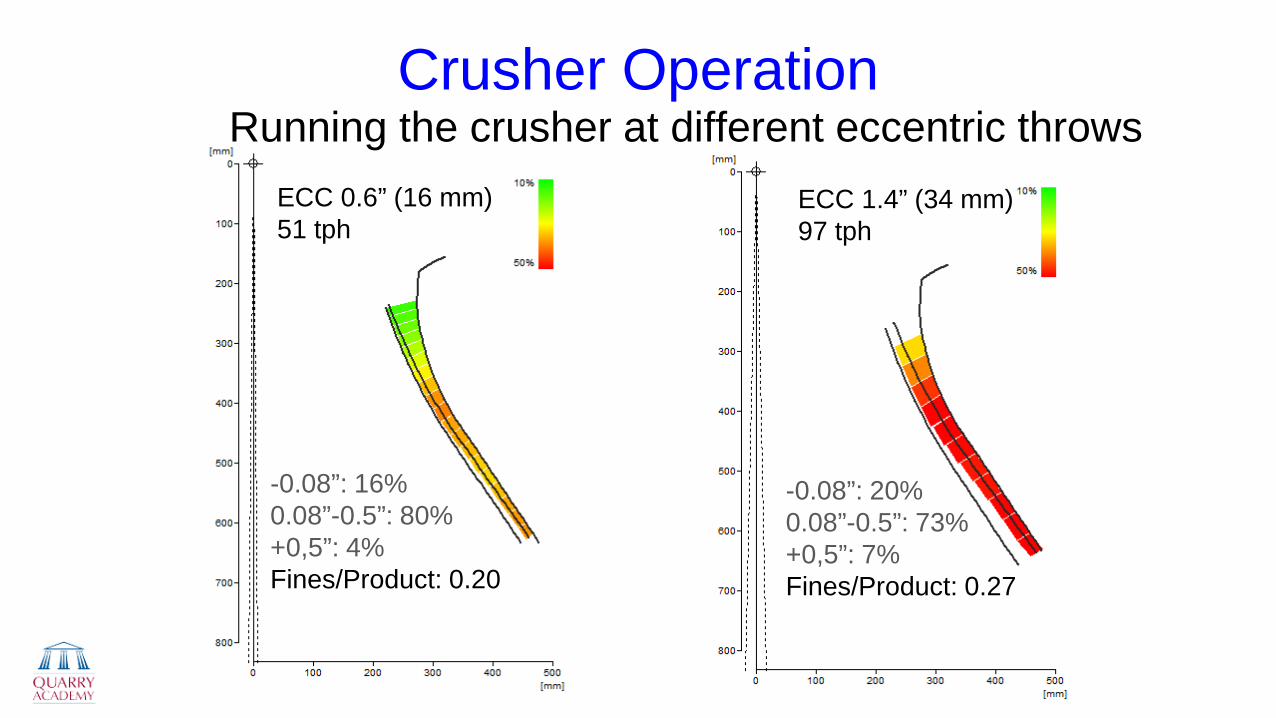
Crusher Operation Running the crusher at different eccentric throws
ECC 0.6” (16 mm) 51 tph
ECC 1.4” (34 mm) 97 tph
-0.08”: 16% 0.08”-0.5”: 80% +0,5”: 4% Fines/Product: 0.20
-0.08”: 20% 0.08”-0.5”: 73% +0,5”: 7% Fines/Product: 0.27
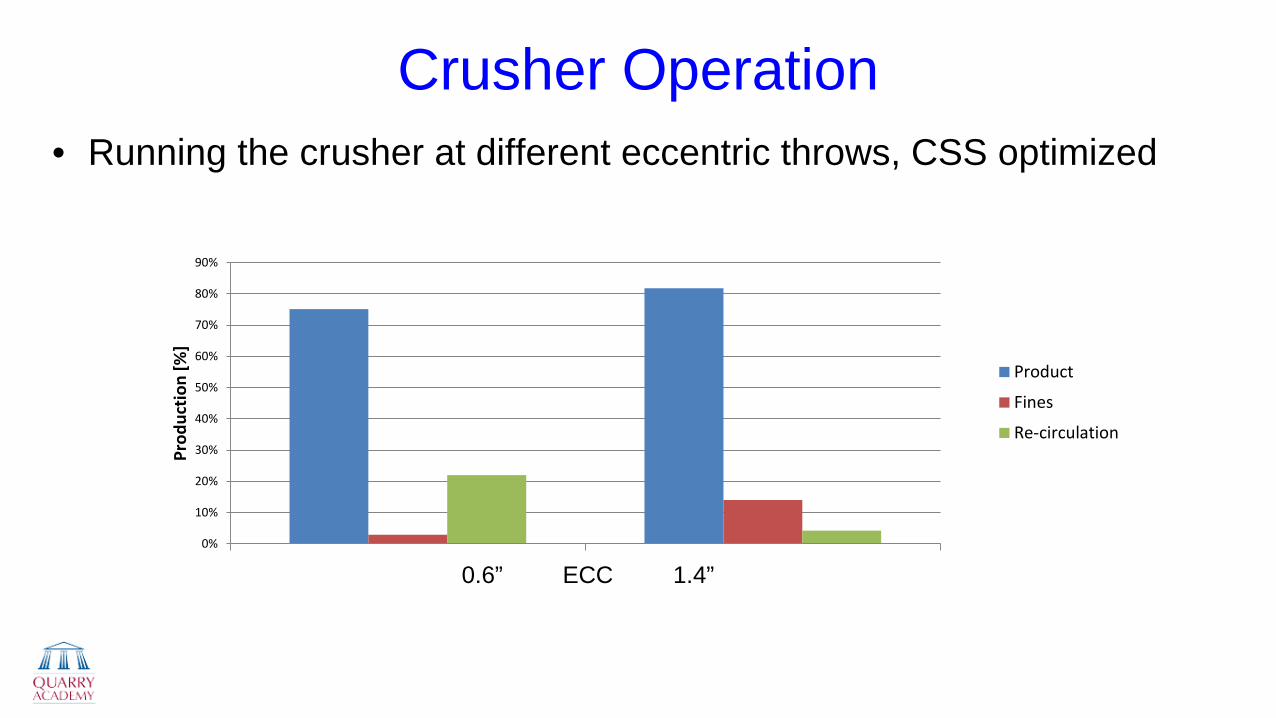
Crusher Operation • Running the crusher at different eccentric throws, CSS optimized
0%
10%
20%
30%
40%
50%
60%
70%
80%
90%
16 36
Prod
uctio
n [%
]
ECC [mm]
Product
Fines
Re-circulation
0.6” ECC 1.4”
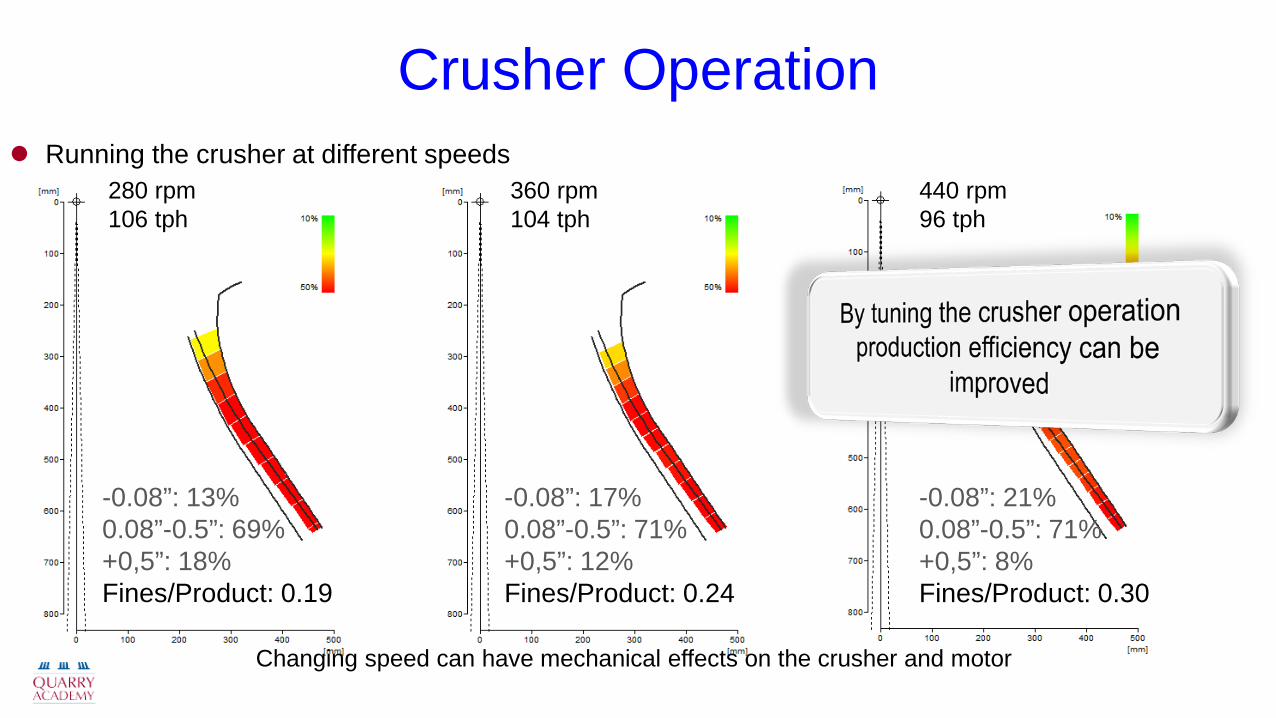
Crusher Operation Running the crusher at different speeds
280 rpm 106 tph
360 rpm 104 tph
440 rpm 96 tph
-0.08”: 13% 0.08”-0.5”: 69% +0,5”: 18% Fines/Product: 0.19
-0.08”: 17% 0.08”-0.5”: 71% +0,5”: 12% Fines/Product: 0.24
-0.08”: 21% 0.08”-0.5”: 71% +0,5”: 8% Fines/Product: 0.30
Changing speed can have mechanical effects on the crusher and motor
Crusher Operation
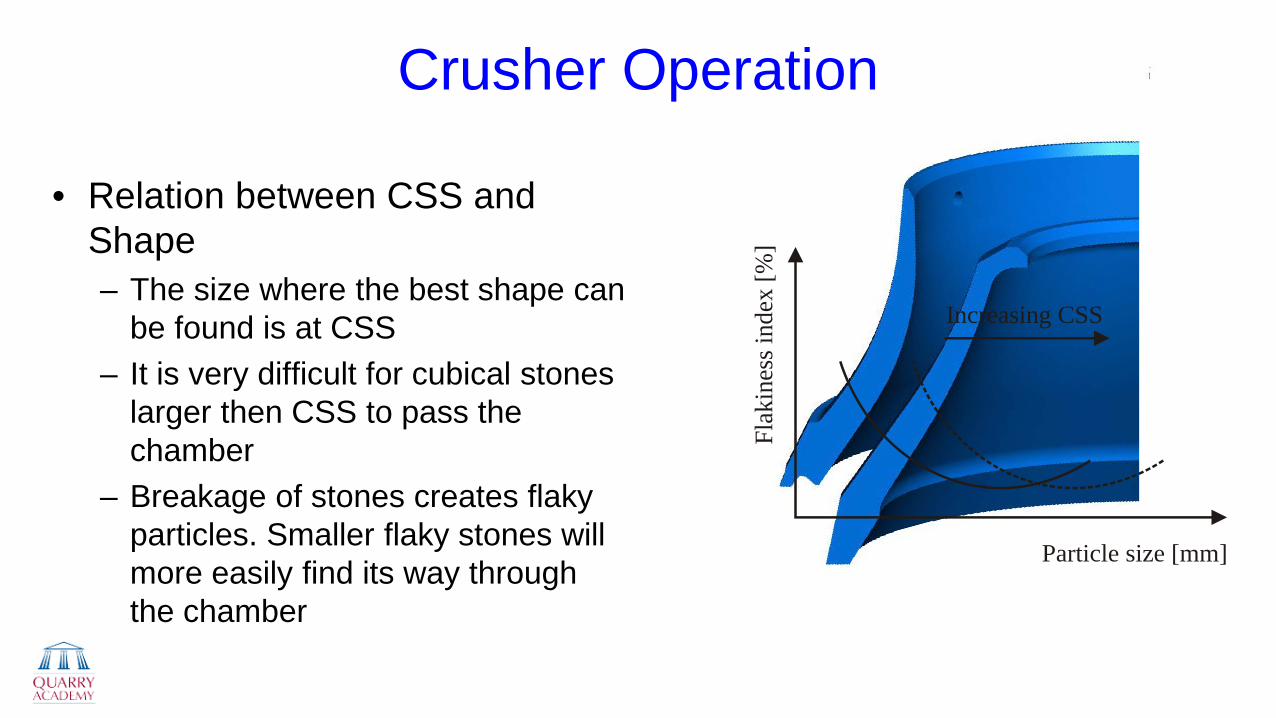
• Relation between CSS and Shape – The size where the best shape can
be found is at CSS – It is very difficult for cubical stones
larger then CSS to pass the chamber
– Breakage of stones creates flaky particles. Smaller flaky stones will more easily find its way through the chamber
Flak
ines
s ind
ex [%
]
Particle size [mm]
Increasing CSS
Crusher Operation
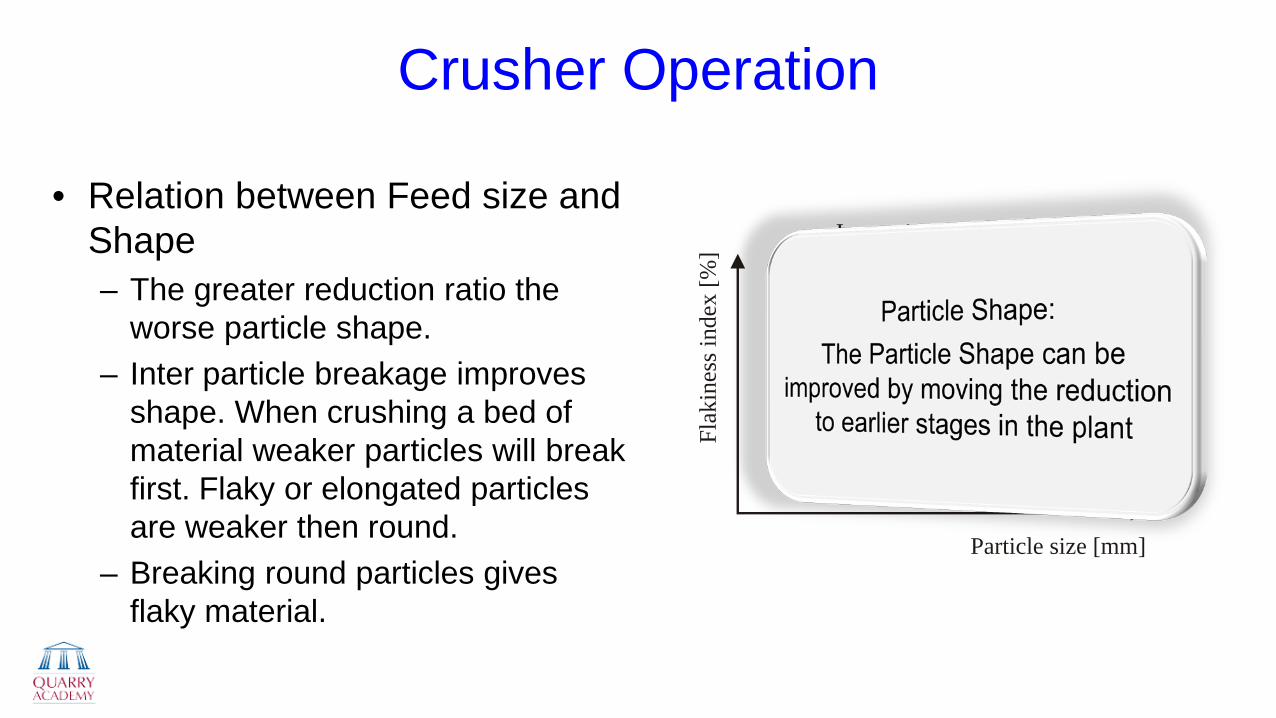
• Relation between Feed size and Shape – The greater reduction ratio the
worse particle shape. – Inter particle breakage improves
shape. When crushing a bed of material weaker particles will break first. Flaky or elongated particles are weaker then round.
– Breaking round particles gives flaky material.
Flak
ines
s ind
ex [%
]
Particle size [mm]
Increasing average feed size x
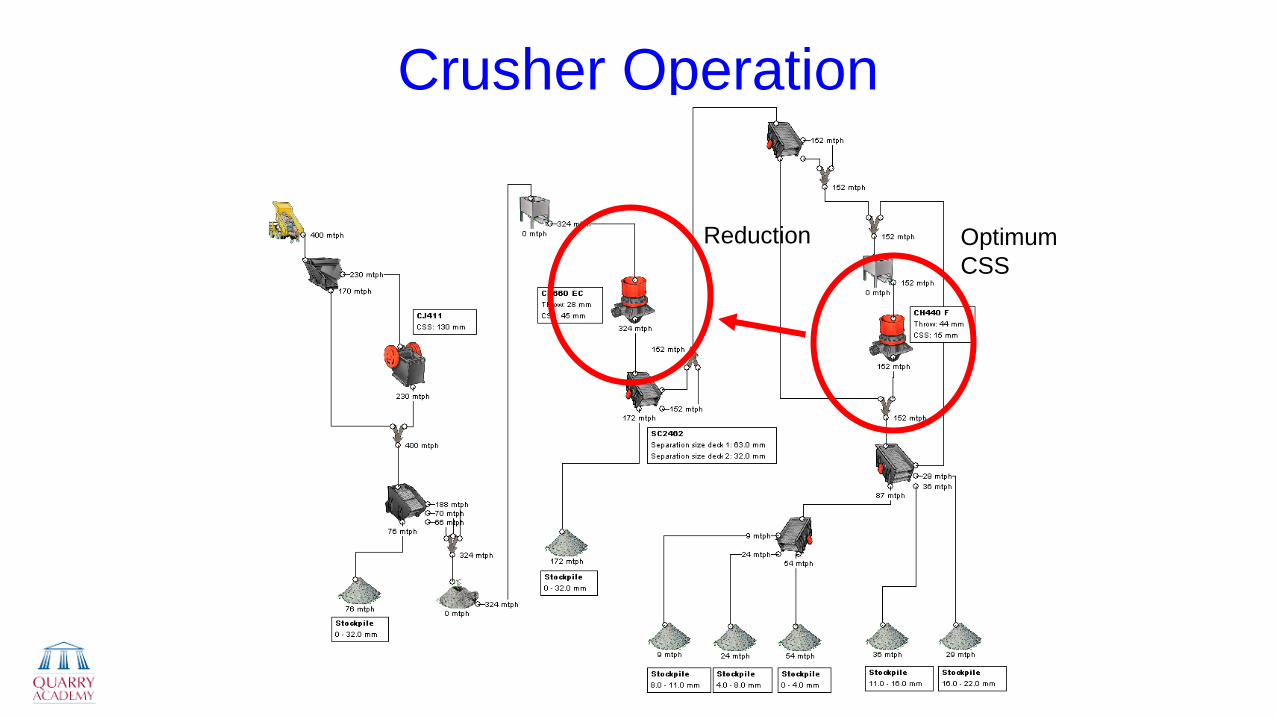
Crusher Operation
Optimum CSS
Reduction
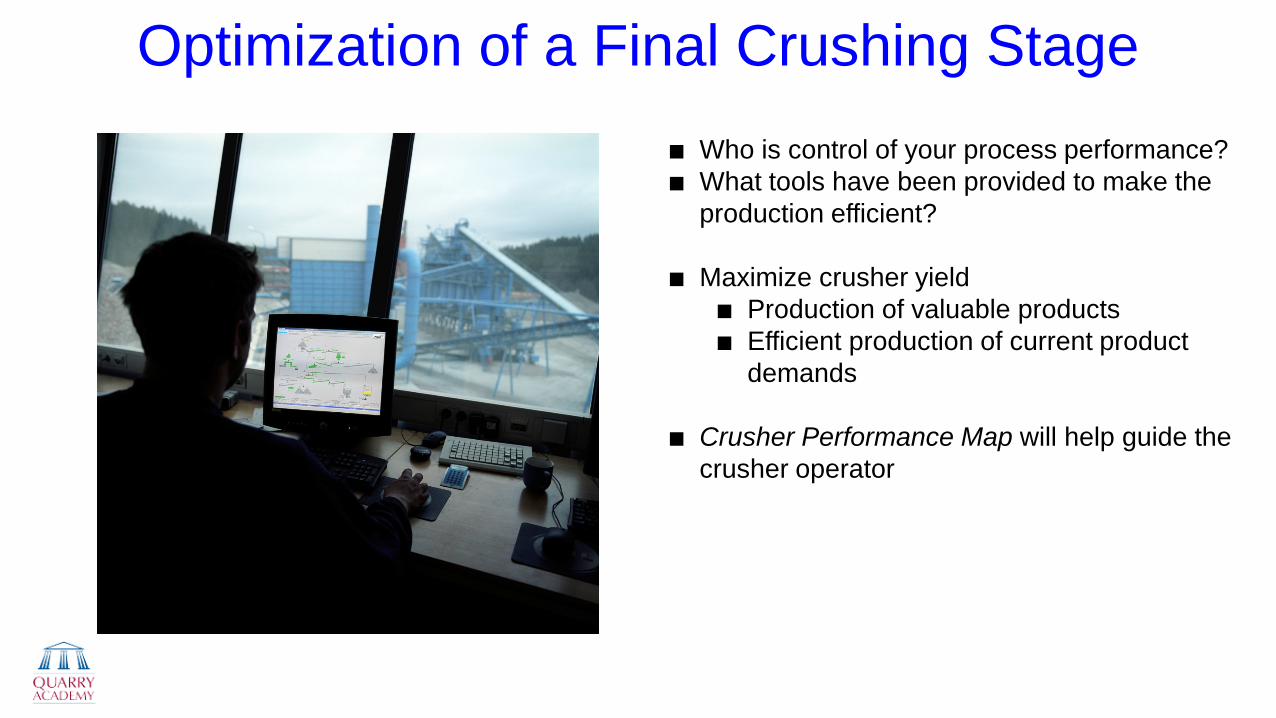
Optimization of a Final Crushing Stage
Who is control of your process performance? What tools have been provided to make the
production efficient?
Maximize crusher yield Production of valuable products Efficient production of current product
demands
Crusher Performance Map will help guide the crusher operator
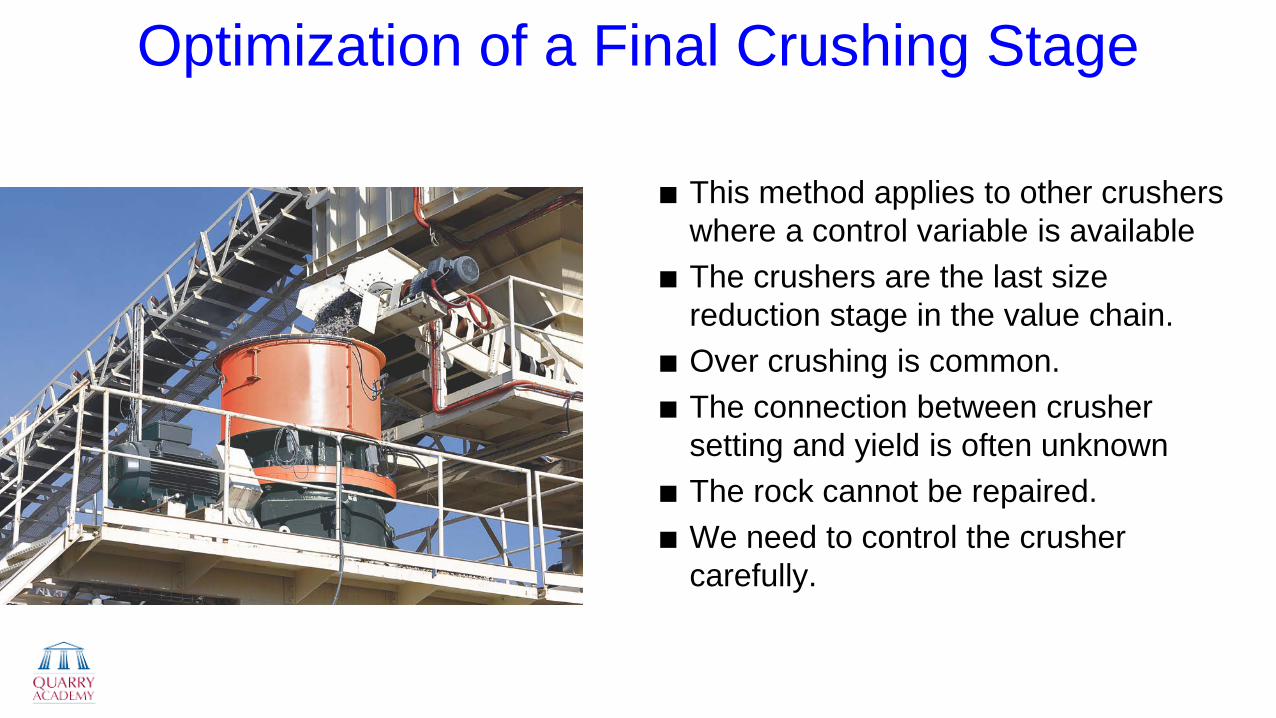
Optimization of a Final Crushing Stage
This method applies to other crushers where a control variable is available
The crushers are the last size reduction stage in the value chain.
Over crushing is common. The connection between crusher
setting and yield is often unknown The rock cannot be repaired. We need to control the crusher
carefully.
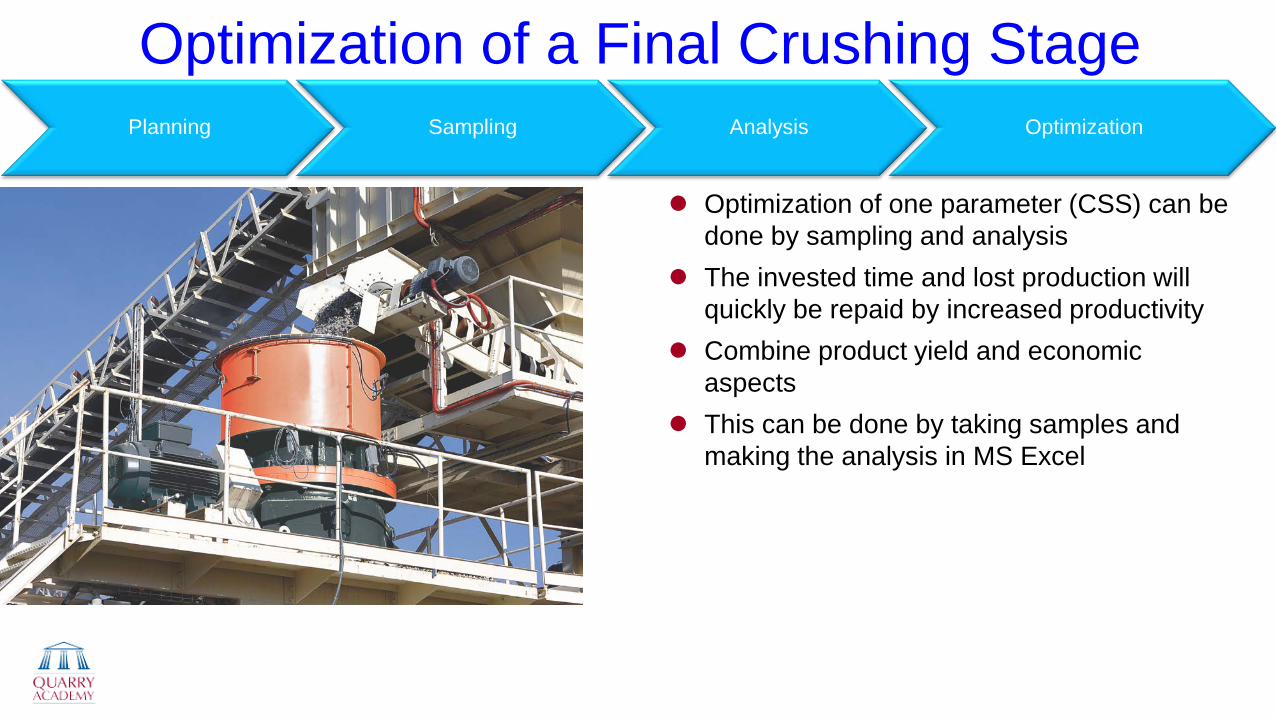
Optimization of a Final Crushing Stage
Optimization of one parameter (CSS) can be done by sampling and analysis
The invested time and lost production will quickly be repaid by increased productivity
Combine product yield and economic aspects
This can be done by taking samples and making the analysis in MS Excel
Planning Sampling Analysis Optimization
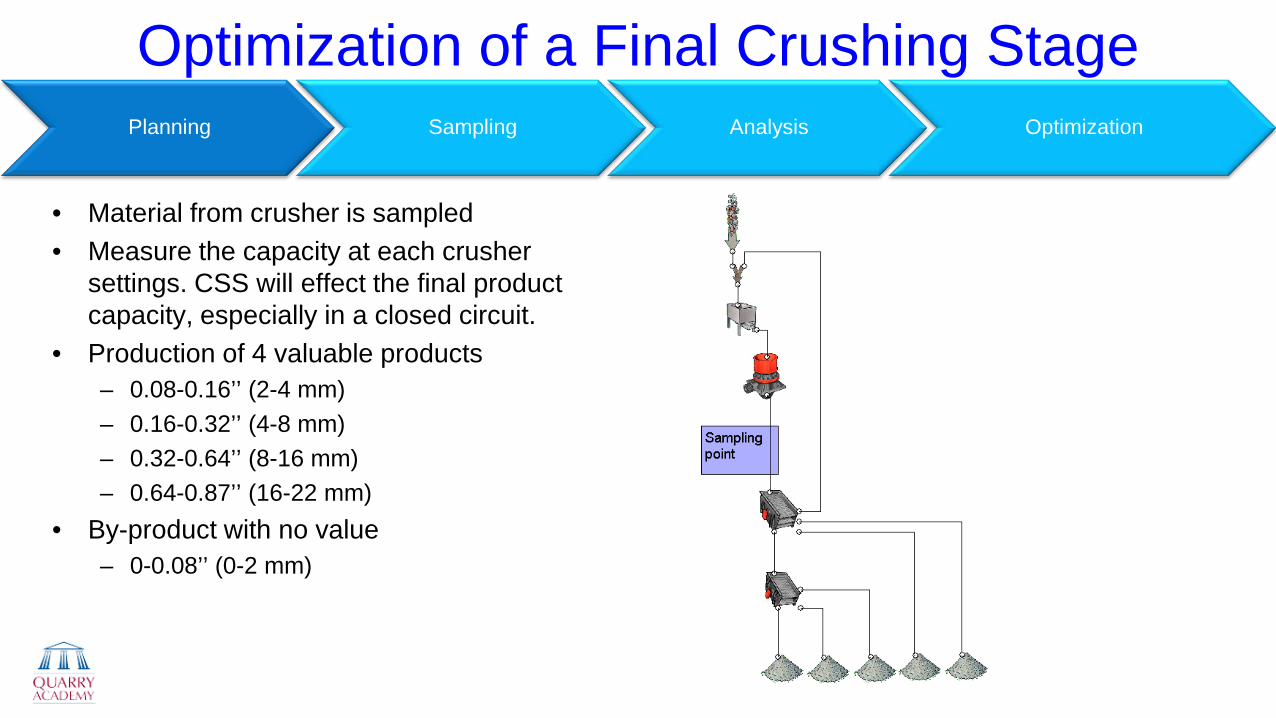
Optimization of a Final Crushing Stage
• Material from crusher is sampled • Measure the capacity at each crusher
settings. CSS will effect the final product capacity, especially in a closed circuit.
• Production of 4 valuable products – 0.08-0.16’’ (2-4 mm) – 0.16-0.32’’ (4-8 mm) – 0.32-0.64’’ (8-16 mm) – 0.64-0.87’’ (16-22 mm)
• By-product with no value – 0-0.08’’ (0-2 mm)
Planning Sampling Analysis Optimization
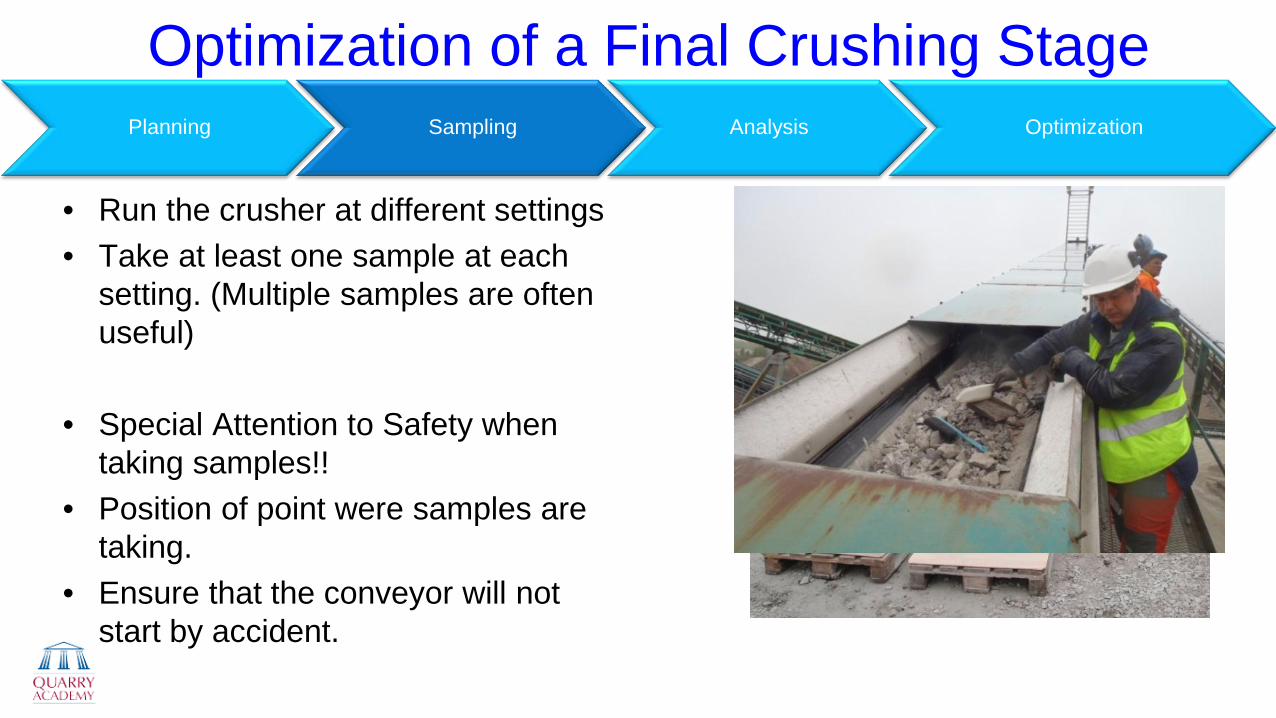
Optimization of a Final Crushing Stage
• Run the crusher at different settings • Take at least one sample at each
setting. (Multiple samples are often useful)
• Special Attention to Safety when taking samples!!
• Position of point were samples are taking.
• Ensure that the conveyor will not start by accident.
Planning Sampling Analysis Optimization
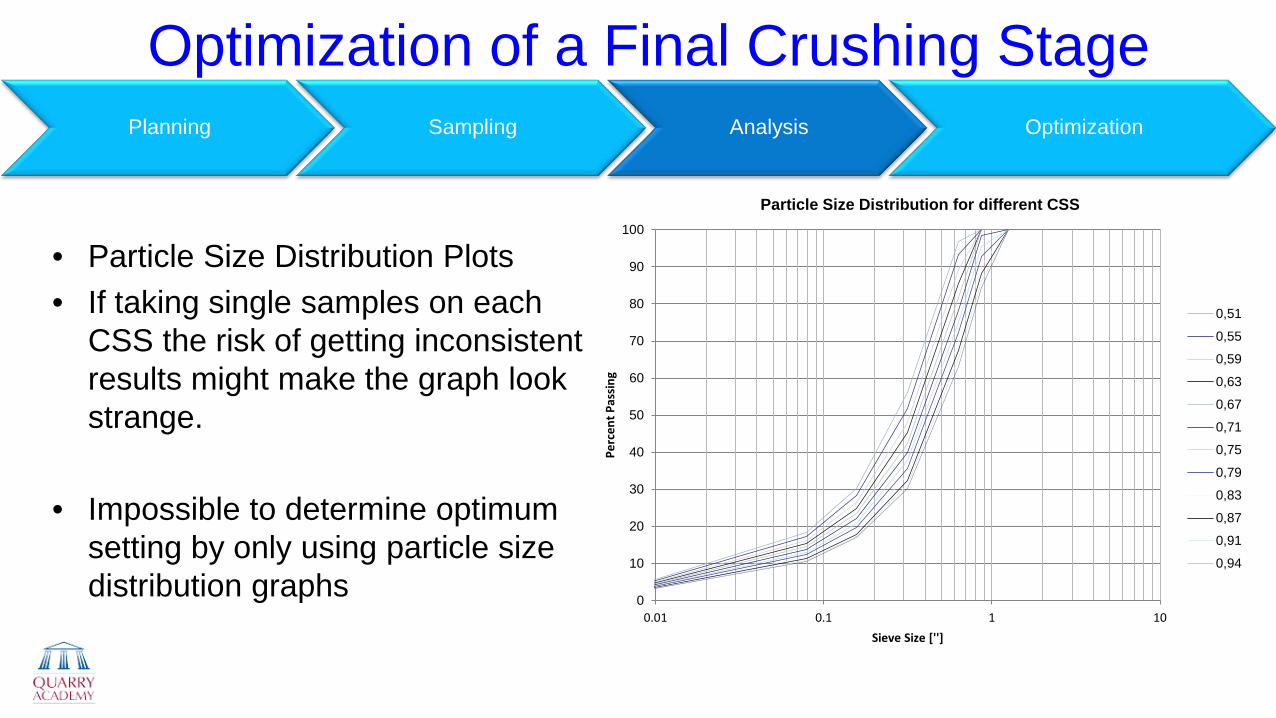
Optimization of a Final Crushing Stage
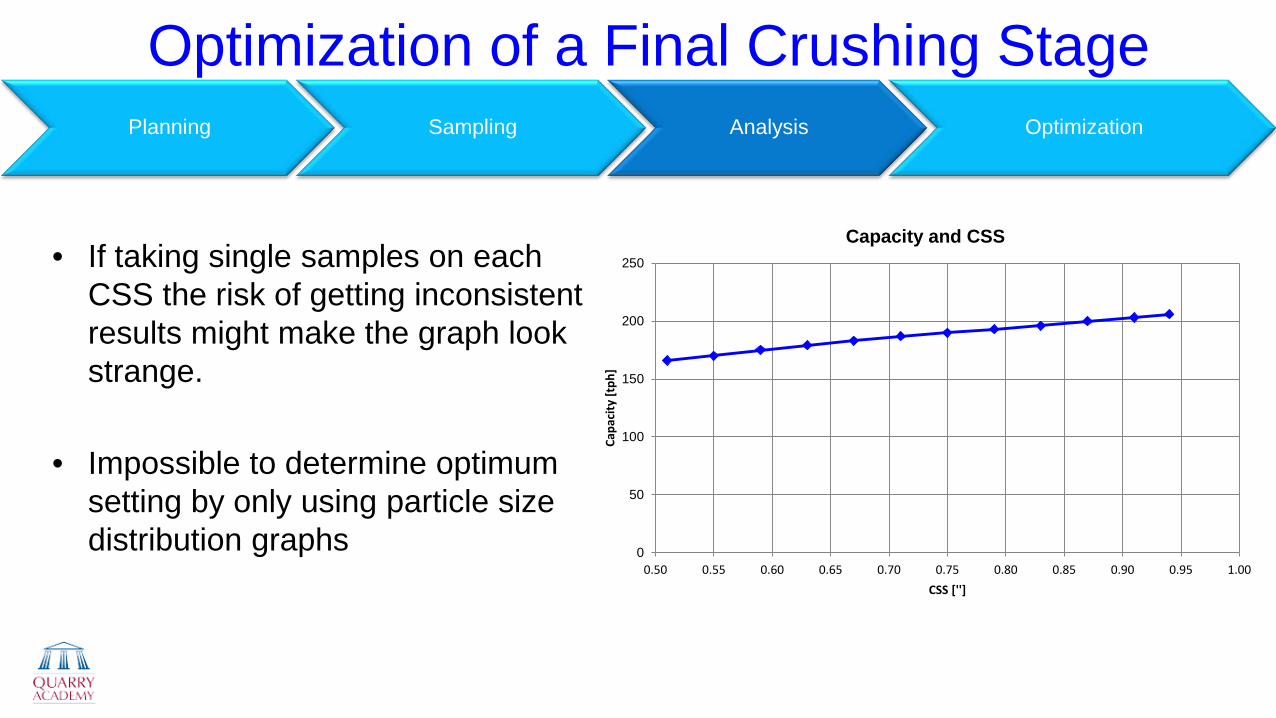
• Particle Size Distribution Plots • If taking single samples on each
CSS the risk of getting inconsistent results might make the graph look strange.
• Impossible to determine optimum setting by only using particle size distribution graphs
Planning Sampling Analysis Optimization
0
10
20
30
40
50
60
70
80
90
100
0.01 0.1 1 10Pe
rcen
t Pas
sing
Sieve Size ['']
Particle Size Distribution for different CSS
0,51
0,55
0,59
0,63
0,67
0,71
0,75
0,79
0,83
0,87
0,91
0,94
Optimization of a Final Crushing Stage
• If taking single samples on each CSS the risk of getting inconsistent results might make the graph look strange.
• Impossible to determine optimum setting by only using particle size distribution graphs
Planning Sampling Analysis Optimization
0
50
100
150
200
250
0.50 0.55 0.60 0.65 0.70 0.75 0.80 0.85 0.90 0.95 1.00
Capa
city
[tph
] CSS ['']
Capacity and CSS
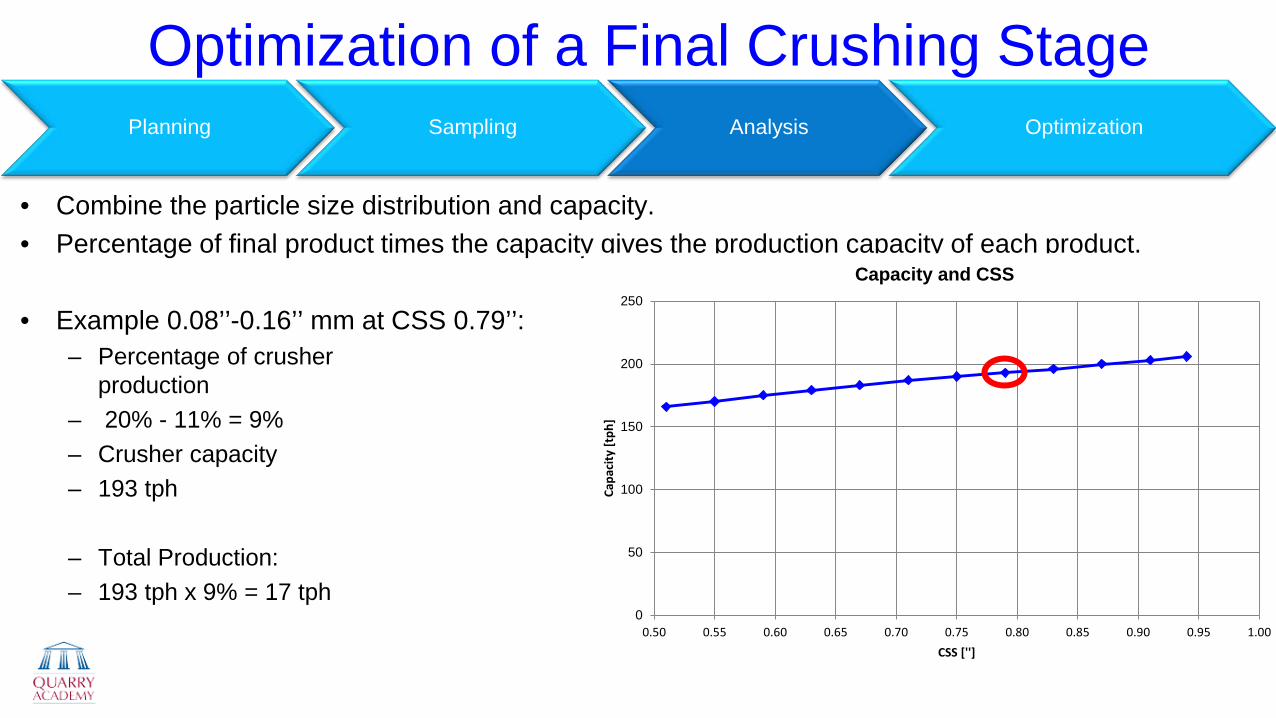
• Combine the particle size distribution and capacity. • Percentage of final product times the capacity gives the production capacity of each product.
• Example 0.08’’-0.16’’ mm at CSS 0.79’’:
– Percentage of crusher production
– 20% - 11% = 9% – Crusher capacity – 193 tph
– Total Production: – 193 tph x 9% = 17 tph 0
10
20
30
40
50
60
70
80
90
100
0.001 0.01 0.1 1 10pe
rcen
t pas
sing
sieve size ['']
Particle Size Distribution at CSS 0.79''
0,79
Optimization of a Final Crushing Stage
0
50
100
150
200
250
0.50 0.55 0.60 0.65 0.70 0.75 0.80 0.85 0.90 0.95 1.00
Capa
city
[tph
]
CSS ['']
Capacity and CSS
Planning Sampling Analysis Optimization
Optimization of a Final Crushing Stage
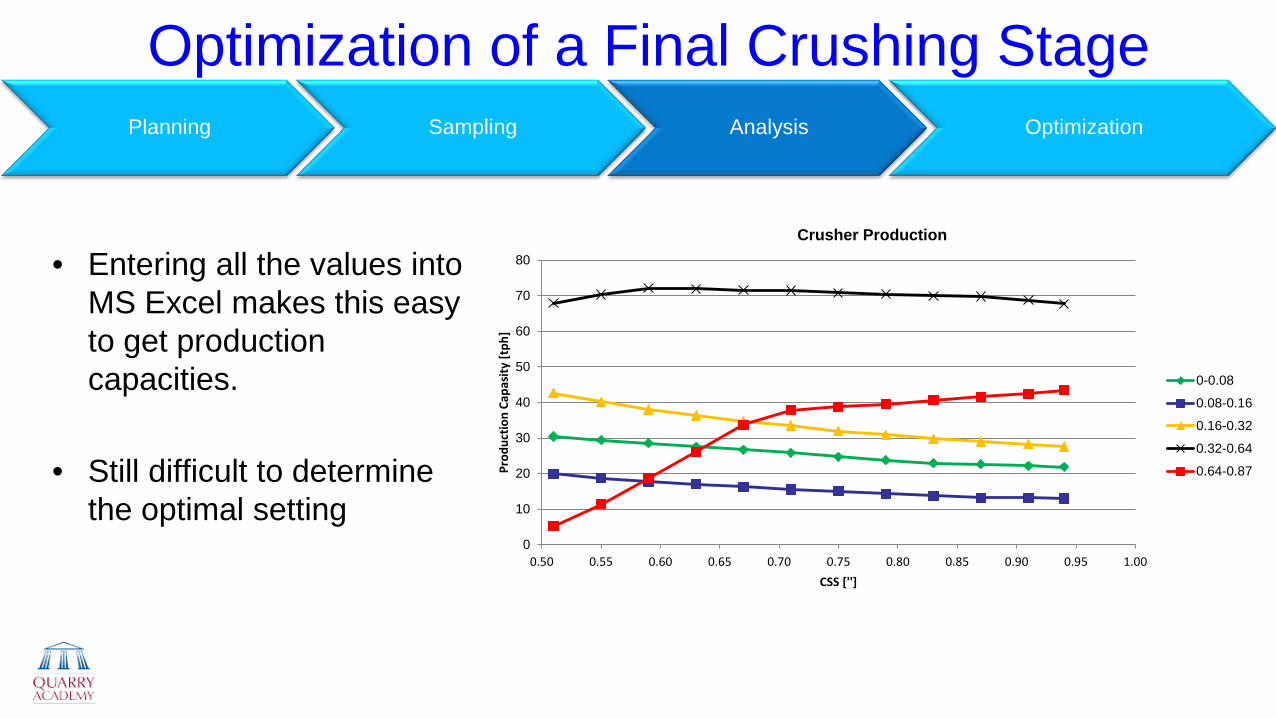
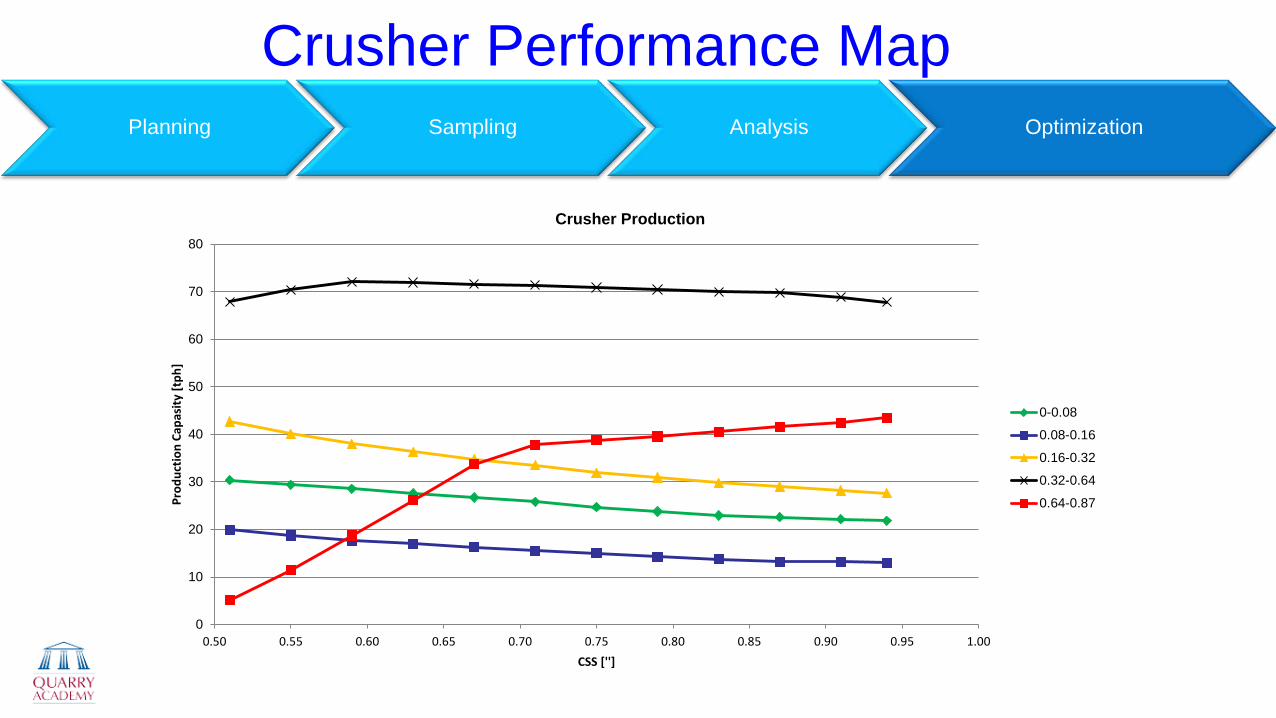
• Entering all the values into MS Excel makes this easy to get production capacities.
• Still difficult to determine the optimal setting
Planning Sampling Analysis Optimization
0
10
20
30
40
50
60
70
80
0.50 0.55 0.60 0.65 0.70 0.75 0.80 0.85 0.90 0.95 1.00
Prod
uctio
n Ca
pasi
ty [t
ph]
CSS ['']
Crusher Production
0-0.08
0.08-0.16
0.16-0.32
0.32-0.64
0.64-0.87
0
500
1000
1500
2000
2500
0.50 0.55 0.60 0.65 0.70 0.75 0.80 0.85 0.90 0.95 1.00
Inco
me
[$]
CSS ['']
Crusher Yield
0-0.08
0.08-0.16
0.16-0.32
0.32-0.64
0.64-0.87
Income
Optimization of a Final Crushing Stage
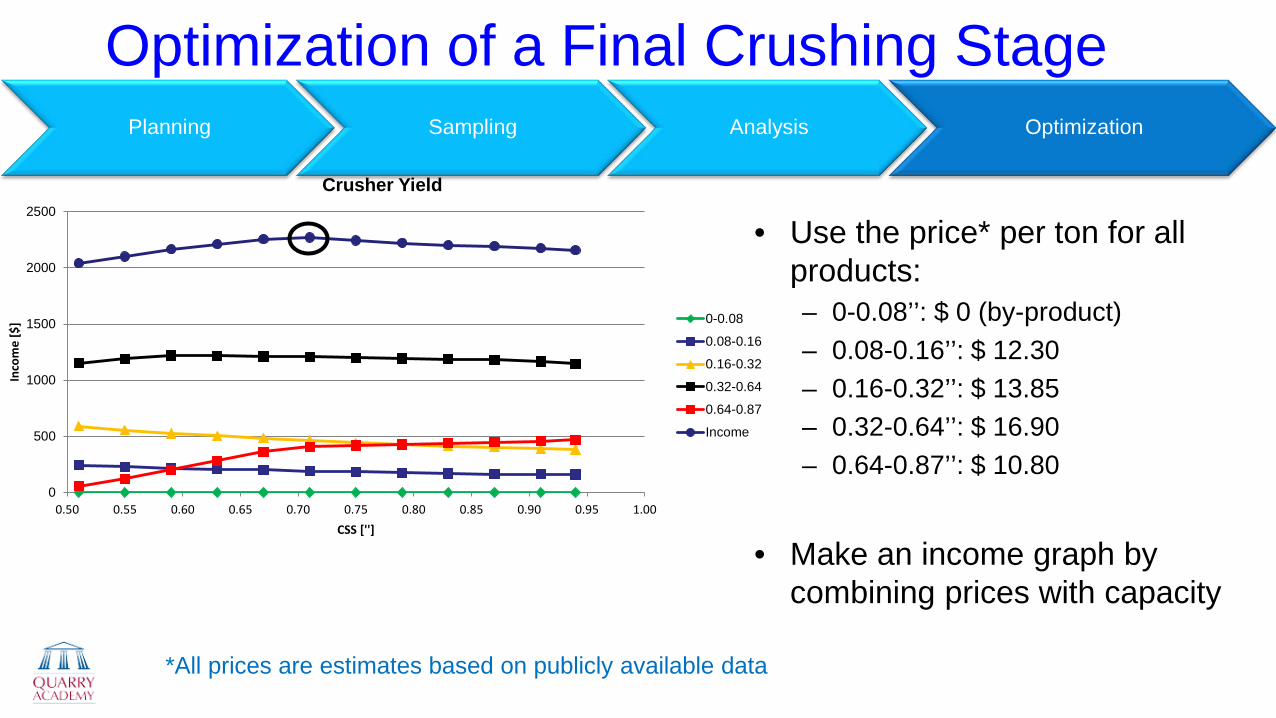
• Use the price* per ton for all products: – 0-0.08’’: $ 0 (by-product) – 0.08-0.16’’: $ 12.30 – 0.16-0.32’’: $ 13.85 – 0.32-0.64’’: $ 16.90 – 0.64-0.87’’: $ 10.80
• Make an income graph by
combining prices with capacity
Planning Sampling Analysis Optimization
*All prices are estimates based on publicly available data
2000
2050
2100
2150
2200
2250
2300
0.50 0.55 0.60 0.65 0.70 0.75 0.80 0.85 0.90 0.95 1.00
Inco
me
[$]
CSS ['']
Crusher Yield
Inco
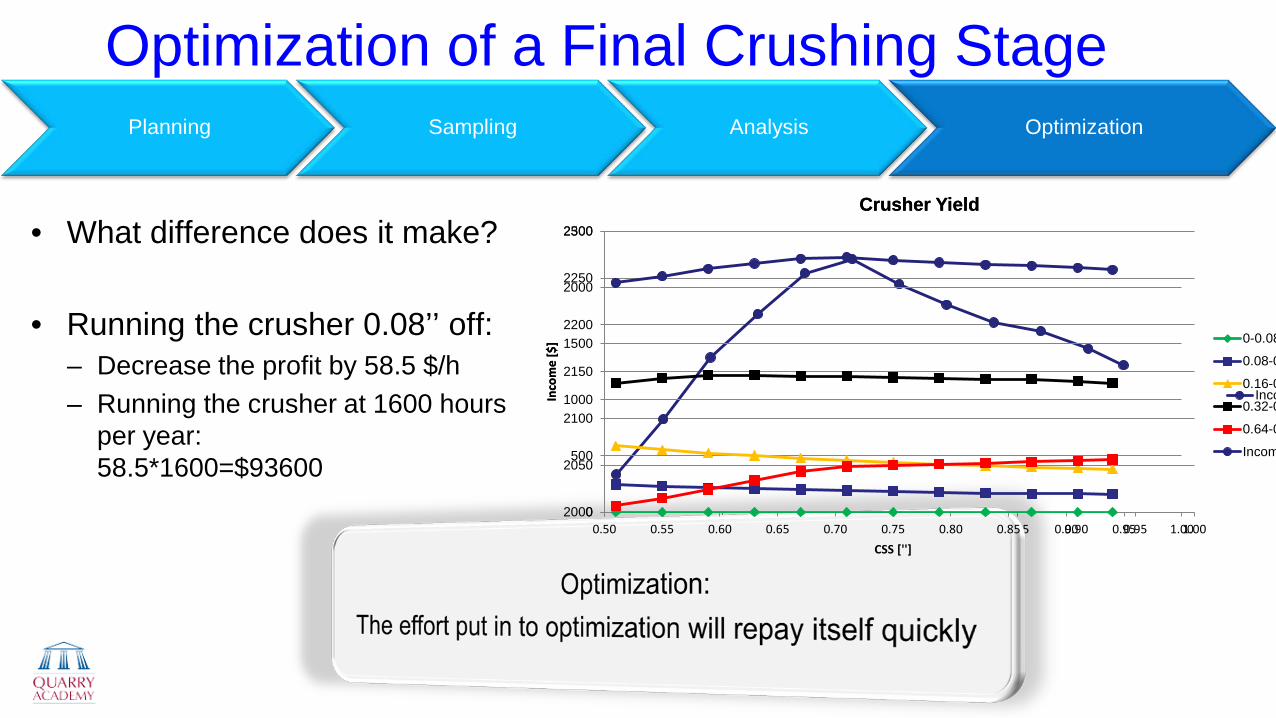
Optimization of a Final Crushing Stage
• What difference does it make?
• Running the crusher 0.08’’ off: – Decrease the profit by 58.5 $/h – Running the crusher at 1600 hours
per year: 58.5*1600=$93600
Planning Sampling Analysis Optimization
0
500
1000
1500
2000
2500
0.50 0.55 0.60 0.65 0.70 0.75 0.80 0.85 0.90 0.95 1.00
Inco
me
[$]
CSS ['']
Crusher Yield
0-0.08
0.08-0
0.16-0
0.32-0
0.64-0
Incom
Crusher Performance Map Planning Sampling Analysis Optimization
0
10
20
30
40
50
60
70
80
0.50 0.55 0.60 0.65 0.70 0.75 0.80 0.85 0.90 0.95 1.00
Prod
uctio
n Ca
pasi
ty [t
ph]
CSS ['']
Crusher Production
0-0.08
0.08-0.16
0.16-0.32
0.32-0.64
0.64-0.87
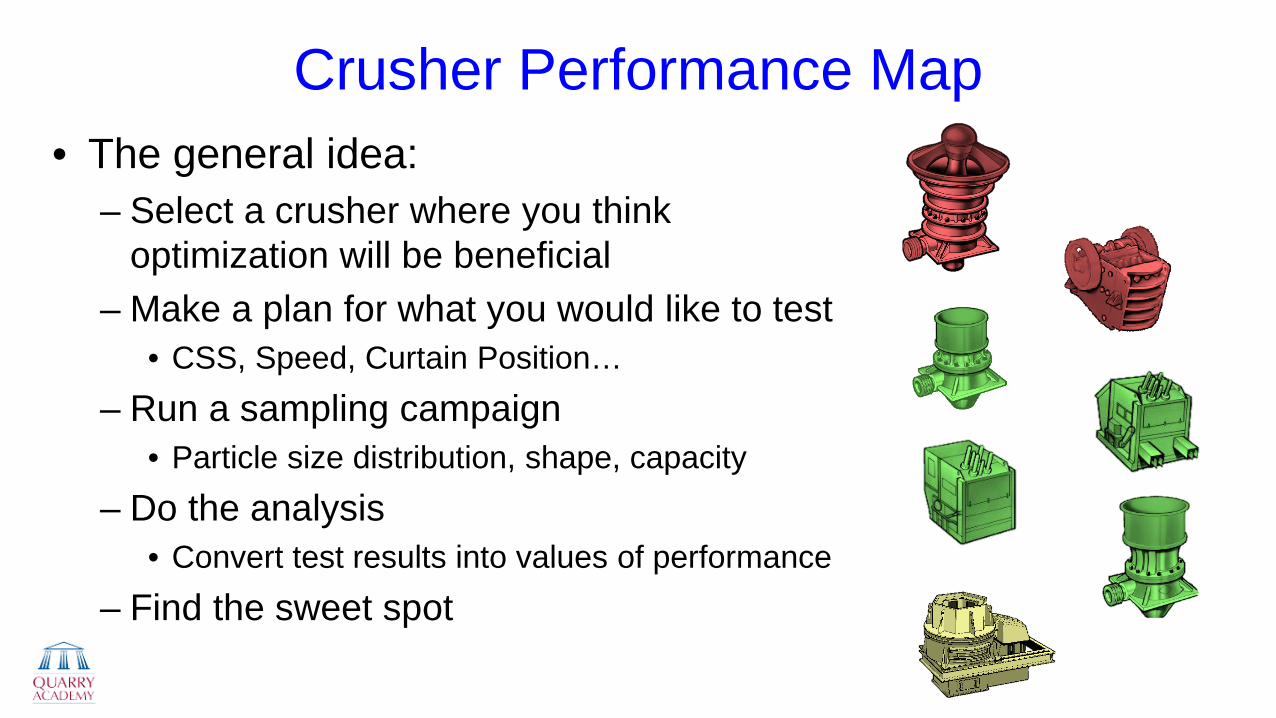
Crusher Performance Map • The general idea:
– Select a crusher where you think optimization will be beneficial
– Make a plan for what you would like to test • CSS, Speed, Curtain Position…
– Run a sampling campaign • Particle size distribution, shape, capacity
– Do the analysis • Convert test results into values of performance
– Find the sweet spot
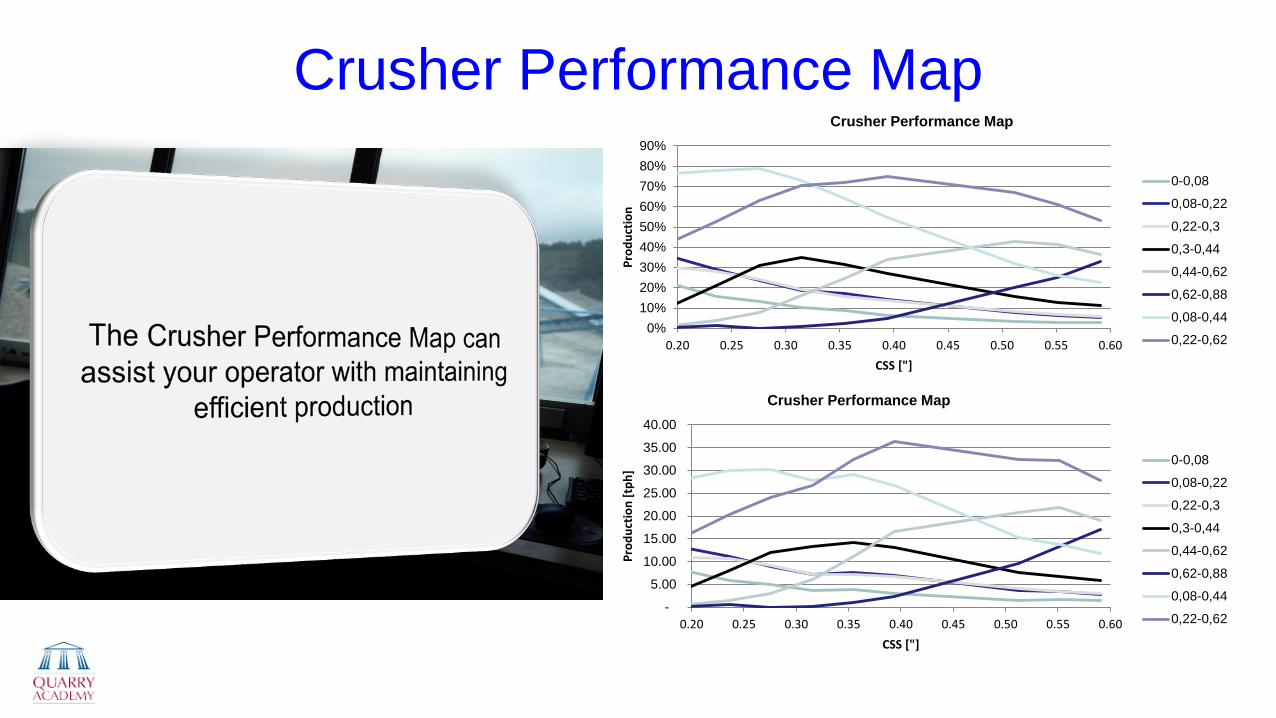
Crusher Performance Map
-
5.00
10.00
15.00
20.00
25.00
30.00
35.00
40.00
0.20 0.25 0.30 0.35 0.40 0.45 0.50 0.55 0.60Pr
oduc
tion
[tph
] CSS ["]
Crusher Performance Map
0-0,08
0,08-0,22
0,22-0,3
0,3-0,44
0,44-0,62
0,62-0,88
0,08-0,44
0,22-0,62
0%10%20%30%40%50%60%70%80%90%
0.20 0.25 0.30 0.35 0.40 0.45 0.50 0.55 0.60
Prod
uctio
n
CSS ["]
Crusher Performance Map
0-0,08
0,08-0,22
0,22-0,3
0,3-0,44
0,44-0,62
0,62-0,88
0,08-0,44
0,22-0,62
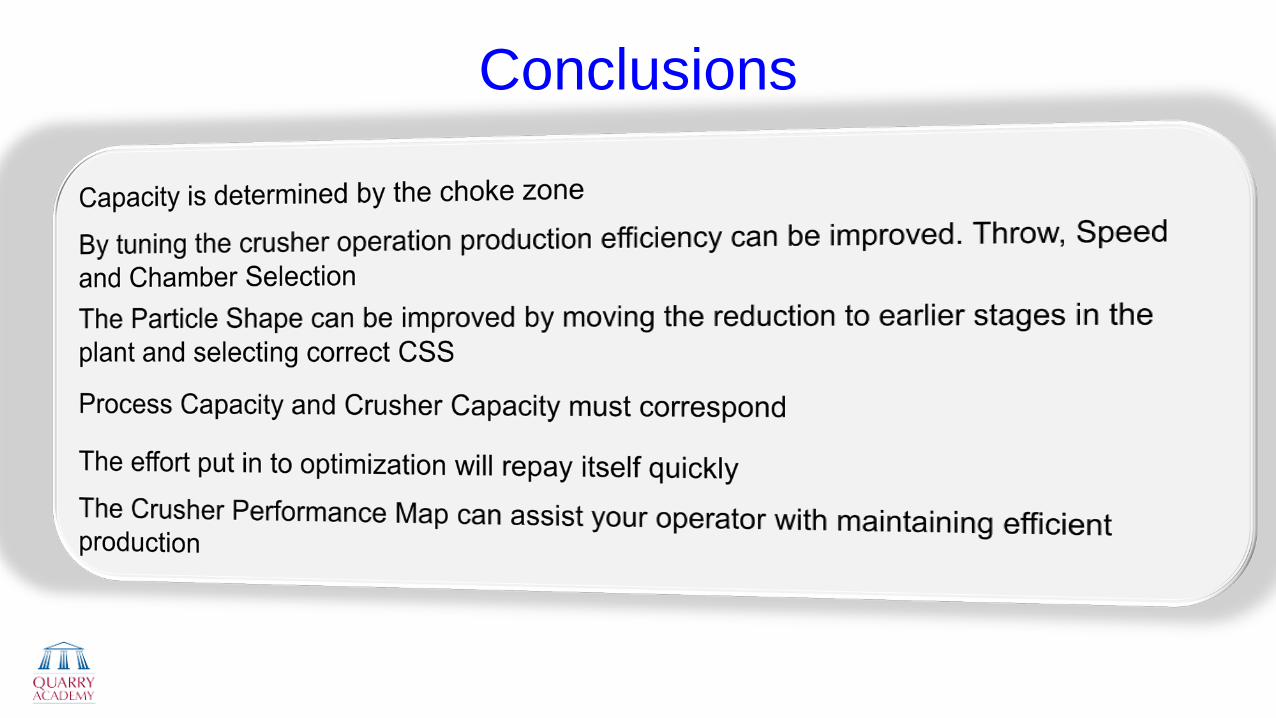
Conclusions

www.quarryacademy.com