CPM BarChart
39
Case Study Predec- Succ- First Second Third Fou cessors essors Method Method Method Meth ID Description P1 P2 P3 S1 S2 S3 $1 x 1000 D1 $2 x 1000 D2 $3 x 1000 D3 $4 x 1000 1 A 5 6 2.4 14 2.15 15 1.9 16 1.5 2 B 10 3 15 2.4 18 1.8 20 1.5 3 C 13 4.5 15 4 22 3.2 33 3.2 4 D 14 45 12 35 16 30 20 30 5 E 1 7 12 20 22 17.5 24 15 28 10 6 F 1 8 9 10 40 14 32 18 18 24 18 7 G 5 11 30 9 24 15 22 18 22 8 H 6 11 0.22 14 0.215 15 0.2 16 0.208 9 I 6 12 0.3 15 0.24 18 0.18 20 0.15 10 J 2 6 12 14 0.45 15 0.4 22 0.32 33 0.32 11 K 7 8 17 0.45 12 0.35 16 0.3 20 0.3 12 L 5 9 10 15 2 22 1.75 24 1.5 28 1 13 M 3 16 4 14 3.2 18 1.8 24 1.8 14 N 4 10 16 17 3 9 2.4 15 2.2 18 2.2 15 O 12 17 4.5 12 3.5 16 3.5 16 3.5 16 P 13 14 18 3 20 2 22 1.75 24 1.5 17 Q 11 14 15 18 4 14 3.2 18 1.8 24 1.8 18 R 16 17 3 9 2.4 15 2.2 18 2.2 Notes: User Input Calculation Penalty $ / d: 20000 Incentive $ / d: 10000 Indirect $ / d: 1000 Deadline 115 Total Penaltiy: 140000 Total Incentive: Total Indirects: 122000 Page 1
-
Upload
william-bonney -
Category
Documents
-
view
23 -
download
0
description
CPM BarChart
Transcript of CPM BarChart
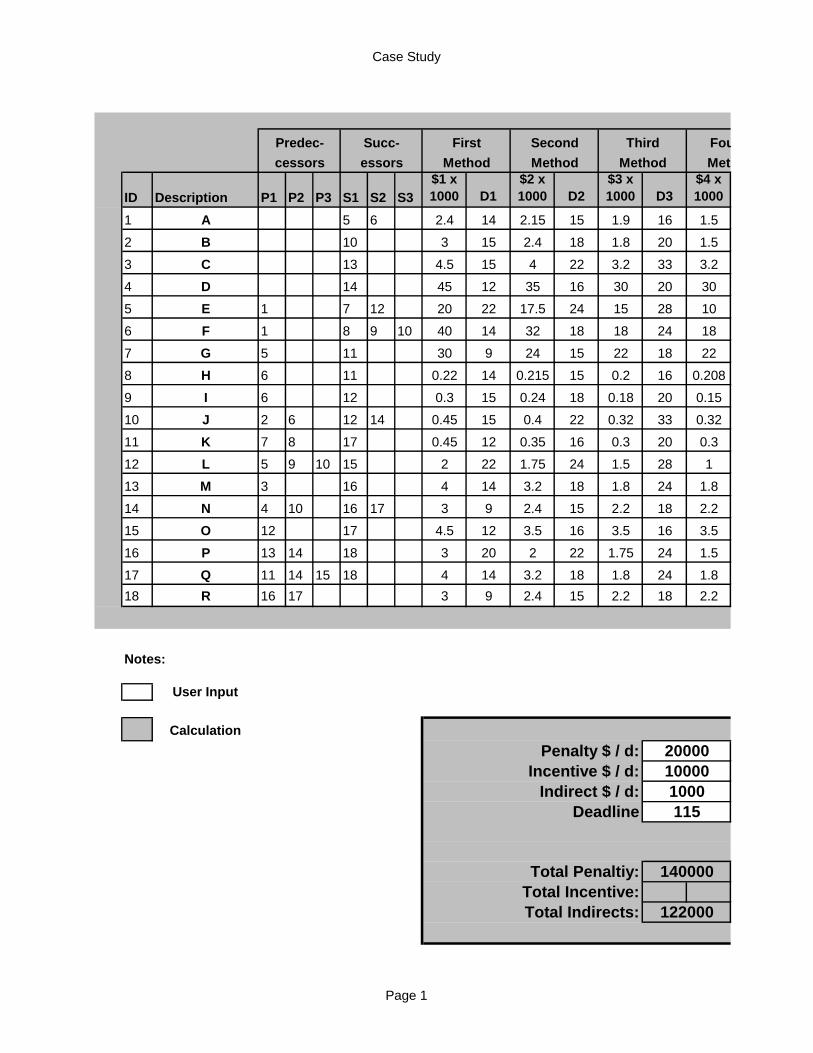
Case Study
Predec- Succ- First Second Third Fourth
cessors essors Method Method Method Method
ID Description P1 P2 P3 S1 S2 S3
$1 x
1000 D1
$2 x
1000 D2
$3 x
1000 D3
$4 x
1000
1 A 5 6 2.4 14 2.15 15 1.9 16 1.5
2 B 10 3 15 2.4 18 1.8 20 1.5
3 C 13 4.5 15 4 22 3.2 33 3.2
4 D 14 45 12 35 16 30 20 30
5 E 1 7 12 20 22 17.5 24 15 28 10
6 F 1 8 9 10 40 14 32 18 18 24 18
7 G 5 11 30 9 24 15 22 18 22
8 H 6 11 0.22 14 0.215 15 0.2 16 0.208
9 I 6 12 0.3 15 0.24 18 0.18 20 0.15
10 J 2 6 12 14 0.45 15 0.4 22 0.32 33 0.32
11 K 7 8 17 0.45 12 0.35 16 0.3 20 0.3
12 L 5 9 10 15 2 22 1.75 24 1.5 28 1
13 M 3 16 4 14 3.2 18 1.8 24 1.8
14 N 4 10 16 17 3 9 2.4 15 2.2 18 2.2
15 O 12 17 4.5 12 3.5 16 3.5 16 3.5
16 P 13 14 18 3 20 2 22 1.75 24 1.5
17 Q 11 14 15 18 4 14 3.2 18 1.8 24 1.8
18 R 16 17 3 9 2.4 15 2.2 18 2.2
Notes:
User Input
Calculation
Penalty $ / d: 20000
Incentive $ / d: 10000
Indirect $ / d: 1000
Deadline 115
Total Penaltiy: 140000
Total Incentive:
Total Indirects: 122000
Page 1
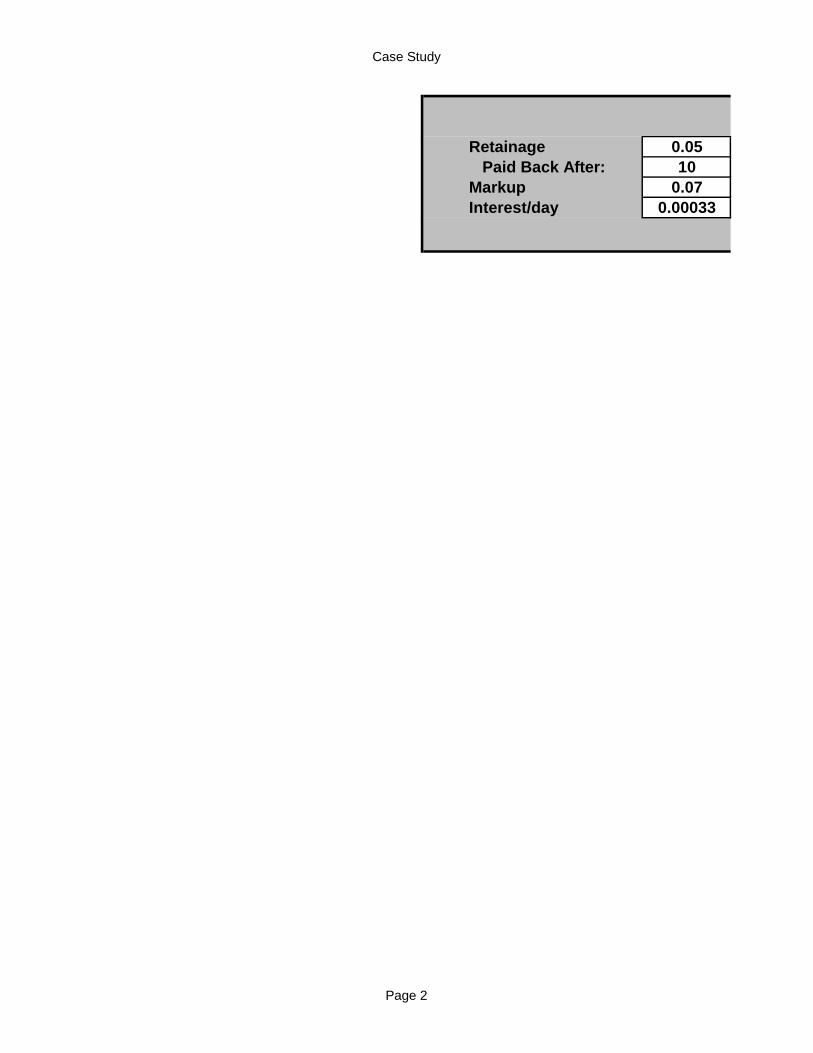
Case Study
Retainage
Paid Back After:
Markup
Interest/day
0.05
10
0.07
0.00033
Page 2
Case Study
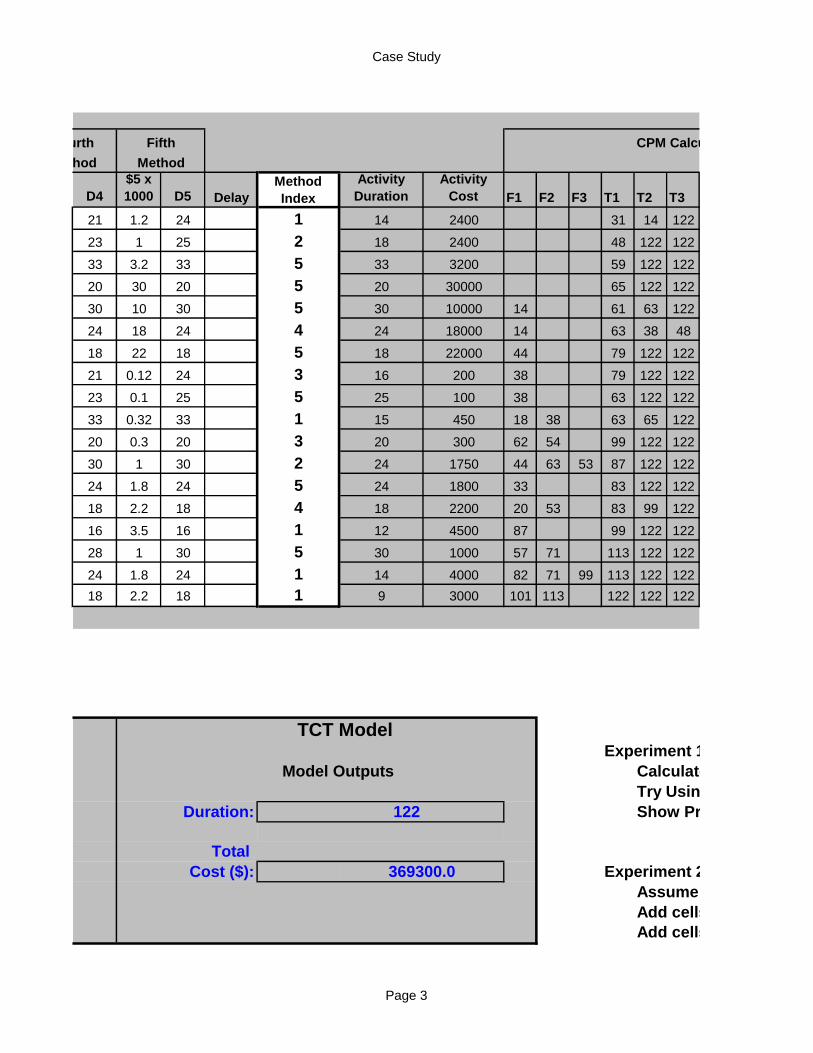
Fourth Fifth CPM Calculations
Method Method
D4
$5 x
1000 D5 Delay
Method
Index
Activity
Duration
Activity
Cost F1 F2 F3 T1 T2 T3
21 1.2 24 1 14 2400 31 14 122
23 1 25 2 18 2400 48 122 122
33 3.2 33 5 33 3200 59 122 122
20 30 20 5 20 30000 65 122 122
30 10 30 5 30 10000 14 61 63 122
24 18 24 4 24 18000 14 63 38 48
18 22 18 5 18 22000 44 79 122 122
21 0.12 24 3 16 200 38 79 122 122
23 0.1 25 5 25 100 38 63 122 122
33 0.32 33 1 15 450 18 38 63 65 122
20 0.3 20 3 20 300 62 54 99 122 122
30 1 30 2 24 1750 44 63 53 87 122 122
24 1.8 24 5 24 1800 33 83 122 122
18 2.2 18 4 18 2200 20 53 83 99 122
16 3.5 16 1 12 4500 87 99 122 122
28 1 30 5 30 1000 57 71 113 122 122
24 1.8 24 1 14 4000 82 71 99 113 122 122
18 2.2 18 1 9 3000 101 113 122 122 122
TCT ModelExperiment 1:
Model Outputs Calculate financing cost and add it to total cost
Try Using Solver to provide the least project cost with a 115 days deadline
Duration: 122 Show Project financing Curves
Total
Cost ($): 369300.0 Experiment 2:
Assume the quantities for each task = 1
Add cells tp allow you distribute all indirect costs among the tasks to come up with bid prices
Add cells to estimate your total bid price
Page 3
Case Study
Add cells for min and max desirable unit prices
Try optimizing the final bid prices so as financing cost is minimum
days
Page 4
Case Study
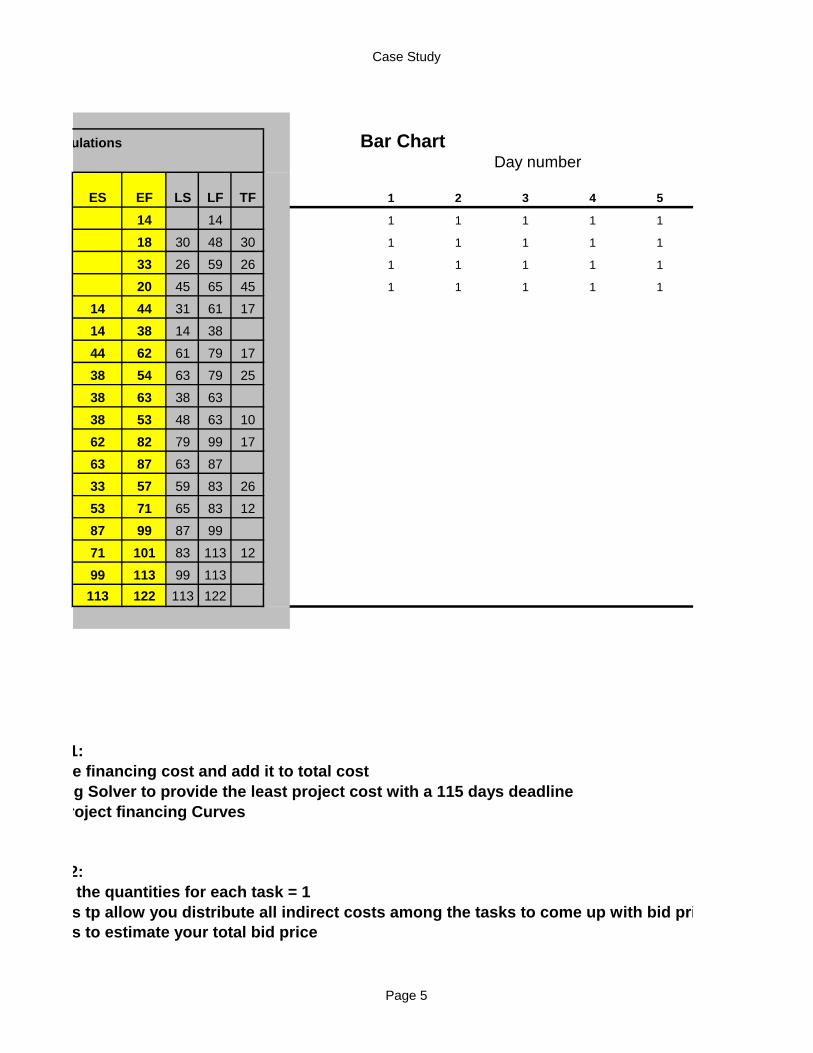
CPM Calculations Bar ChartDay number
ES EF LS LF TF 1 2 3 4 5
14 14 1 1 1 1 1
18 30 48 30 1 1 1 1 1
33 26 59 26 1 1 1 1 1
20 45 65 45 1 1 1 1 1
14 44 31 61 17
14 38 14 38
44 62 61 79 17
38 54 63 79 25
38 63 38 63
38 53 48 63 10
62 82 79 99 17
63 87 63 87
33 57 59 83 26
53 71 65 83 12
87 99 87 99
71 101 83 113 12
99 113 99 113
113 122 113 122
Experiment 1:
Calculate financing cost and add it to total cost
Try Using Solver to provide the least project cost with a 115 days deadline
Show Project financing Curves
Experiment 2:
Assume the quantities for each task = 1
Add cells tp allow you distribute all indirect costs among the tasks to come up with bid prices
Add cells to estimate your total bid price
Page 5

Case Study
Add cells for min and max desirable unit prices
Try optimizing the final bid prices so as financing cost is minimum
Page 6
Case Study
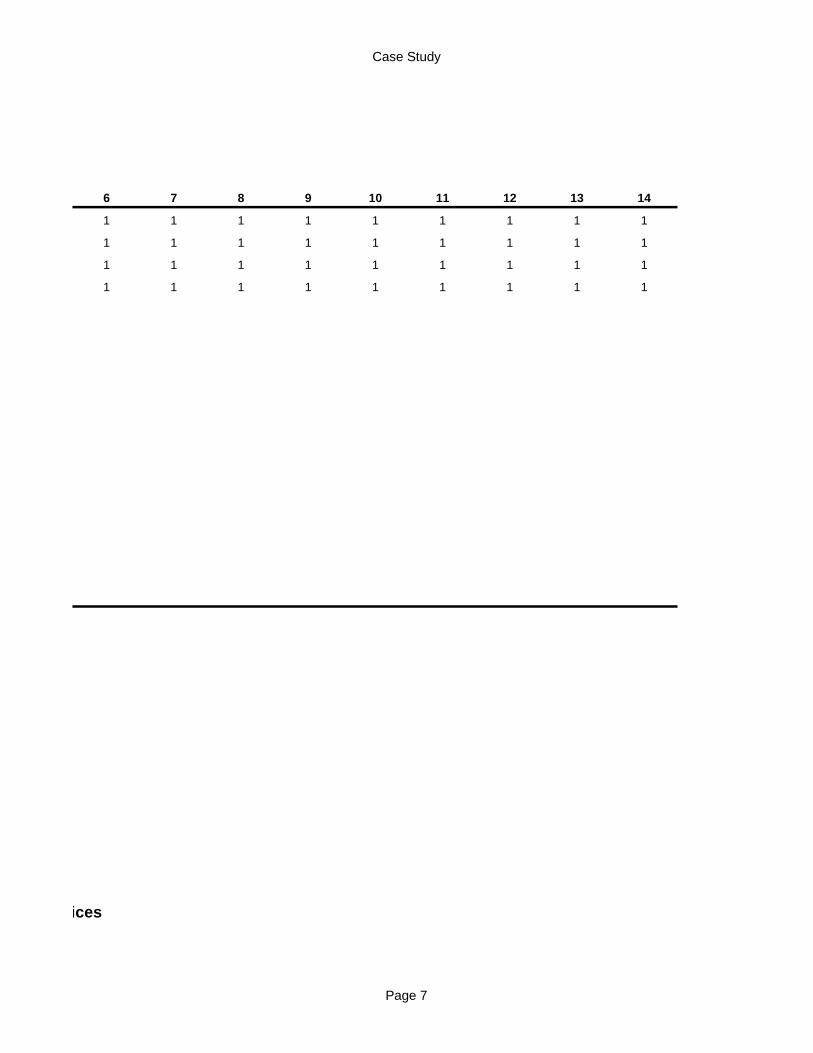
6 7 8 9 10 11 12 13 14
1 1 1 1 1 1 1 1 1
1 1 1 1 1 1 1 1 1
1 1 1 1 1 1 1 1 1
1 1 1 1 1 1 1 1 1
Add cells tp allow you distribute all indirect costs among the tasks to come up with bid prices
Page 7

Case Study
Page 8
Case Study
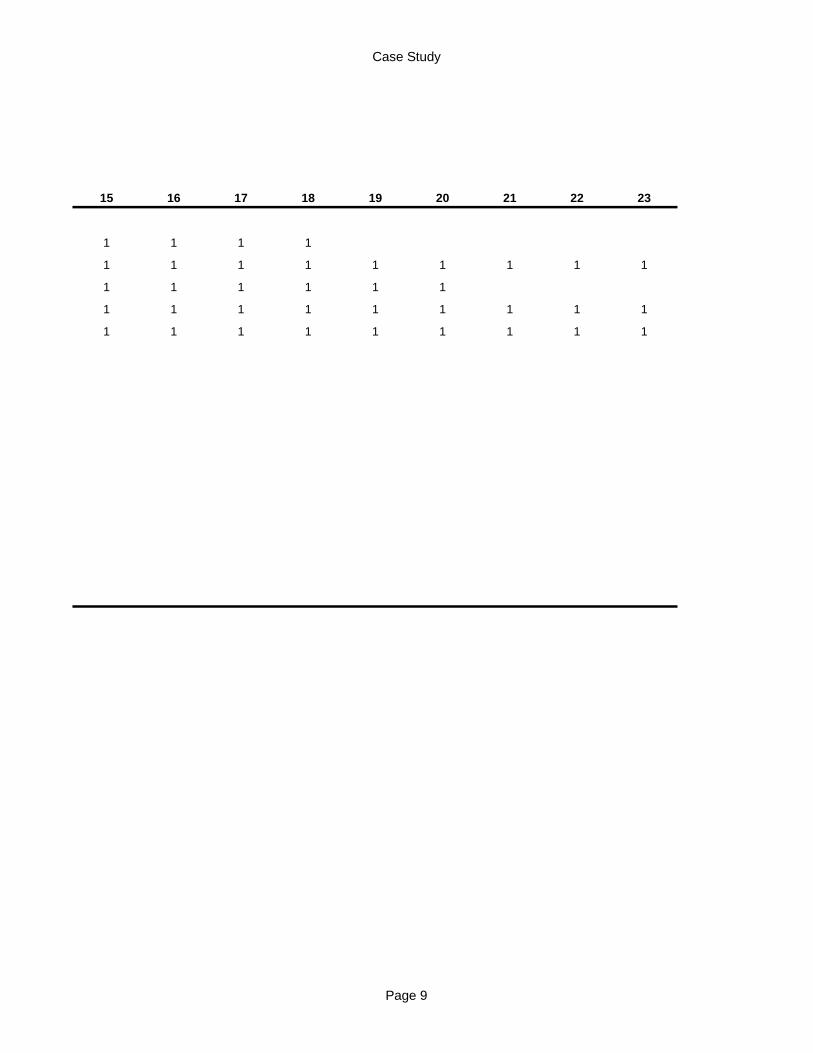
15 16 17 18 19 20 21 22 23
1 1 1 1
1 1 1 1 1 1 1 1 1
1 1 1 1 1 1
1 1 1 1 1 1 1 1 1
1 1 1 1 1 1 1 1 1
Page 9

Case Study
Page 10
Case Study
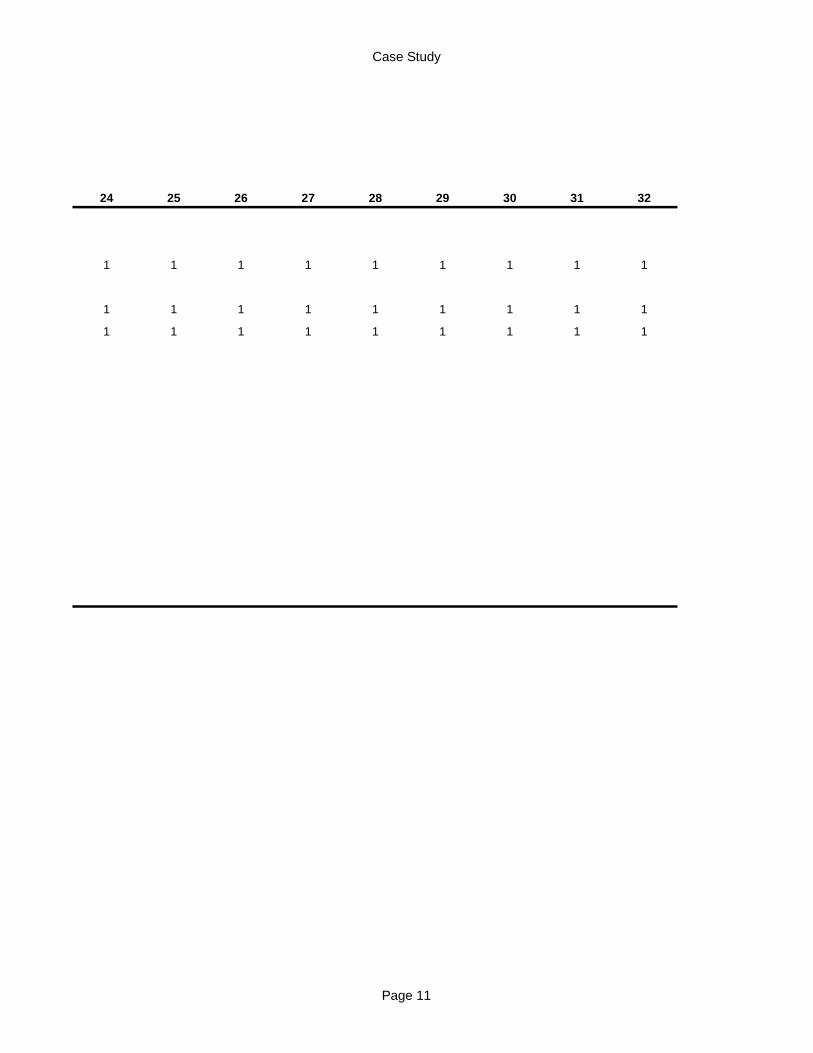
24 25 26 27 28 29 30 31 32
1 1 1 1 1 1 1 1 1
1 1 1 1 1 1 1 1 1
1 1 1 1 1 1 1 1 1
Page 11

Case Study
Page 12
Case Study
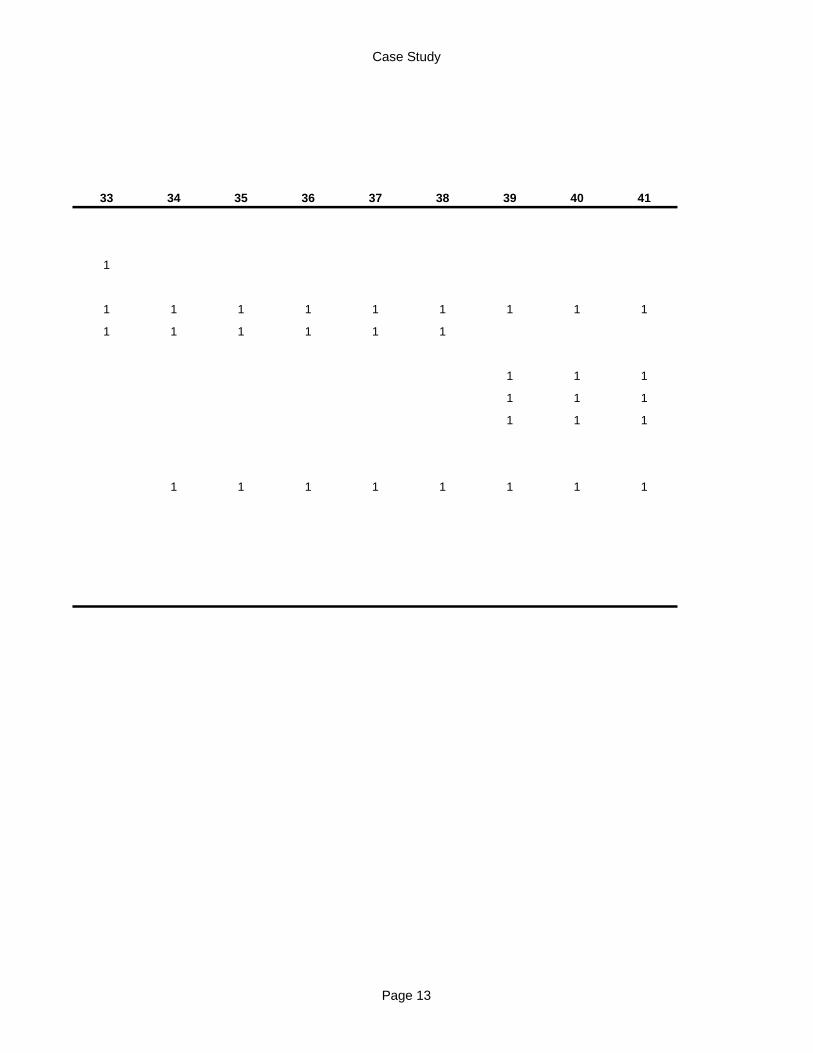
33 34 35 36 37 38 39 40 41
1
1 1 1 1 1 1 1 1 1
1 1 1 1 1 1
1 1 1
1 1 1
1 1 1
1 1 1 1 1 1 1 1
Page 13

Case Study
Page 14
Case Study
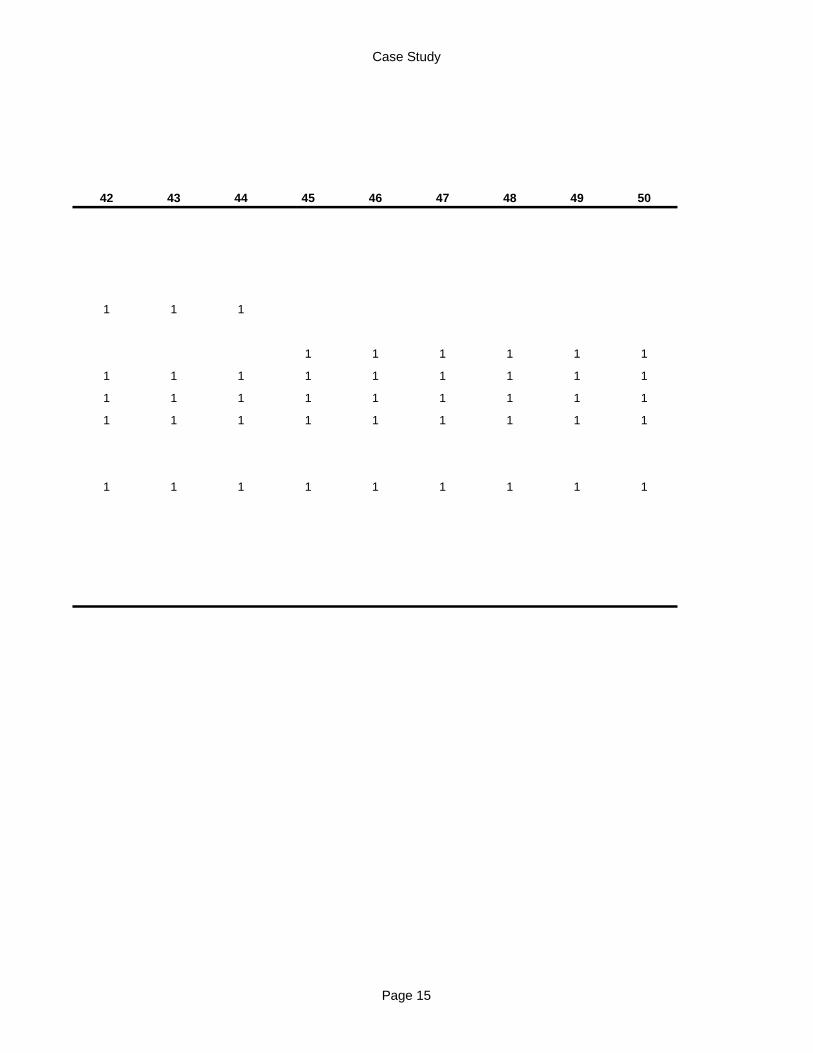
42 43 44 45 46 47 48 49 50
1 1 1
1 1 1 1 1 1
1 1 1 1 1 1 1 1 1
1 1 1 1 1 1 1 1 1
1 1 1 1 1 1 1 1 1
1 1 1 1 1 1 1 1 1
Page 15

Case Study
Page 16
Case Study
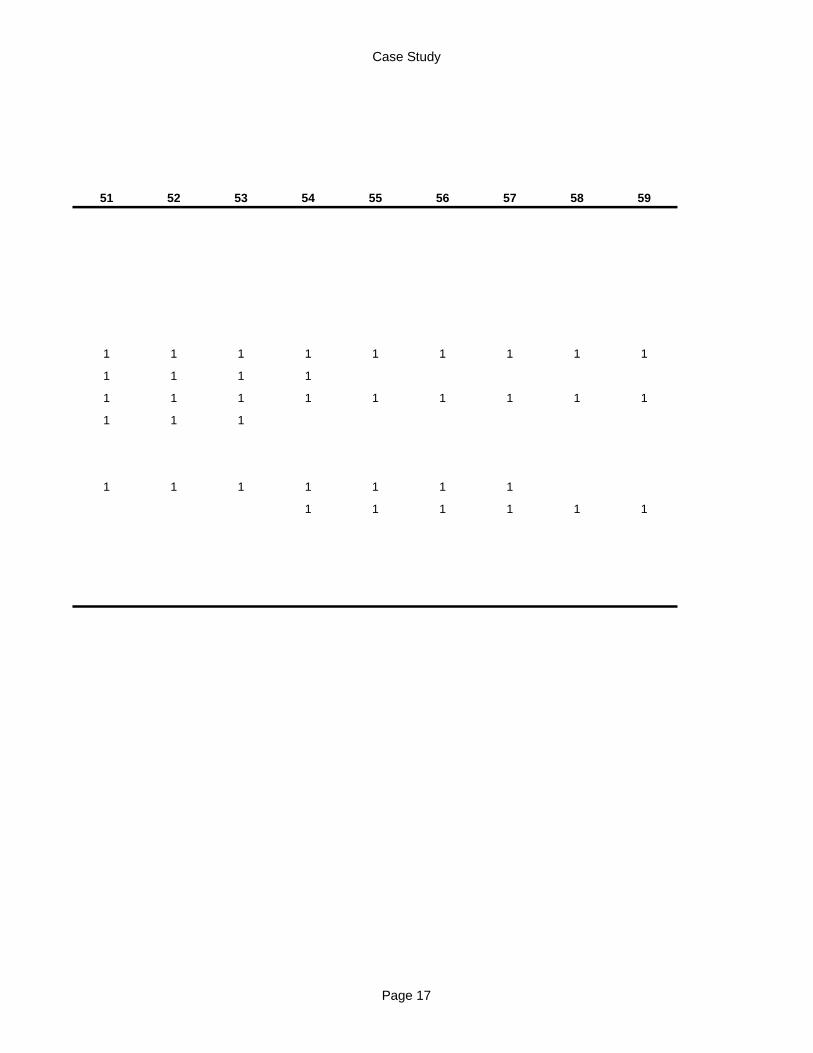
51 52 53 54 55 56 57 58 59
1 1 1 1 1 1 1 1 1
1 1 1 1
1 1 1 1 1 1 1 1 1
1 1 1
1 1 1 1 1 1 1
1 1 1 1 1 1
Page 17

Case Study
Page 18
Case Study
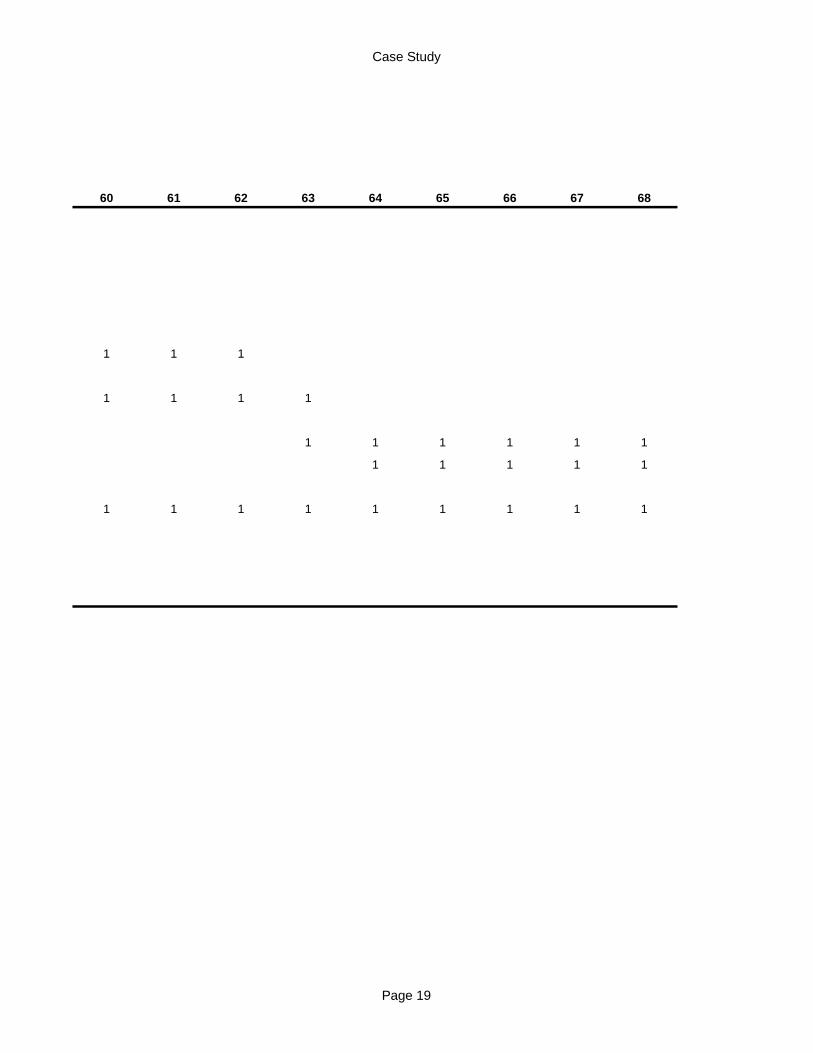
60 61 62 63 64 65 66 67 68
1 1 1
1 1 1 1
1 1 1 1 1 1
1 1 1 1 1
1 1 1 1 1 1 1 1 1
Page 19

Case Study
Page 20
Case Study
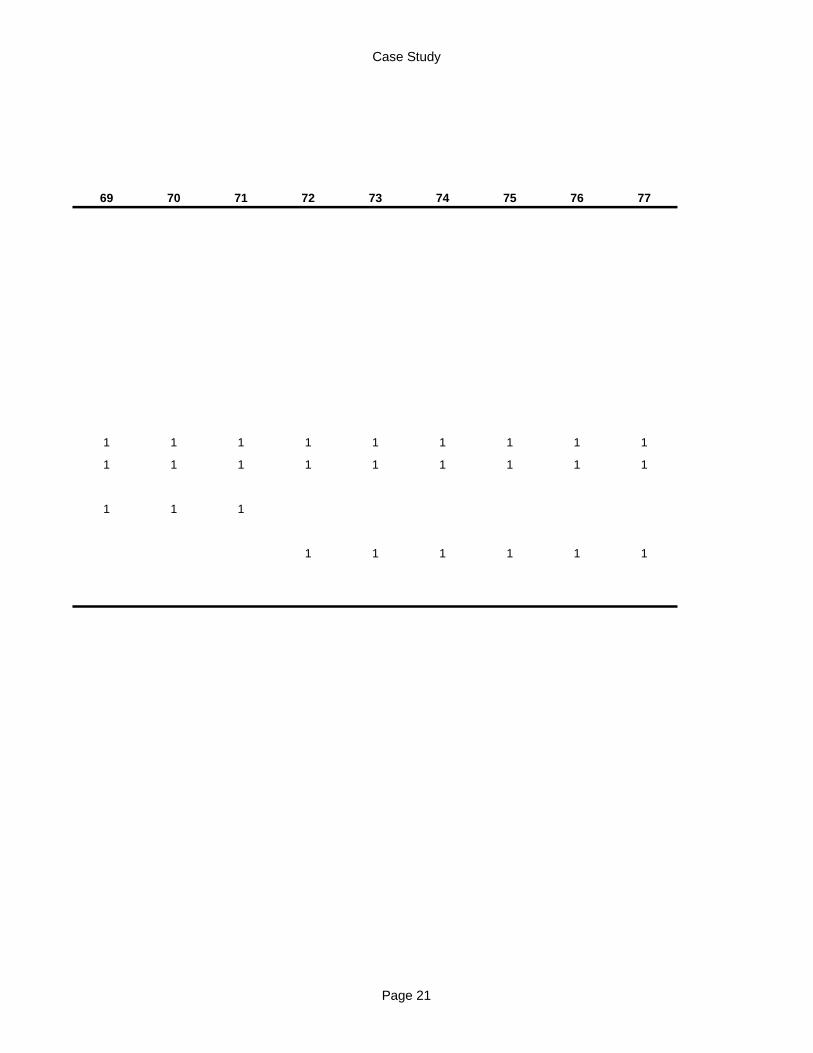
69 70 71 72 73 74 75 76 77
1 1 1 1 1 1 1 1 1
1 1 1 1 1 1 1 1 1
1 1 1
1 1 1 1 1 1
Page 21

Case Study
Page 22
Case Study
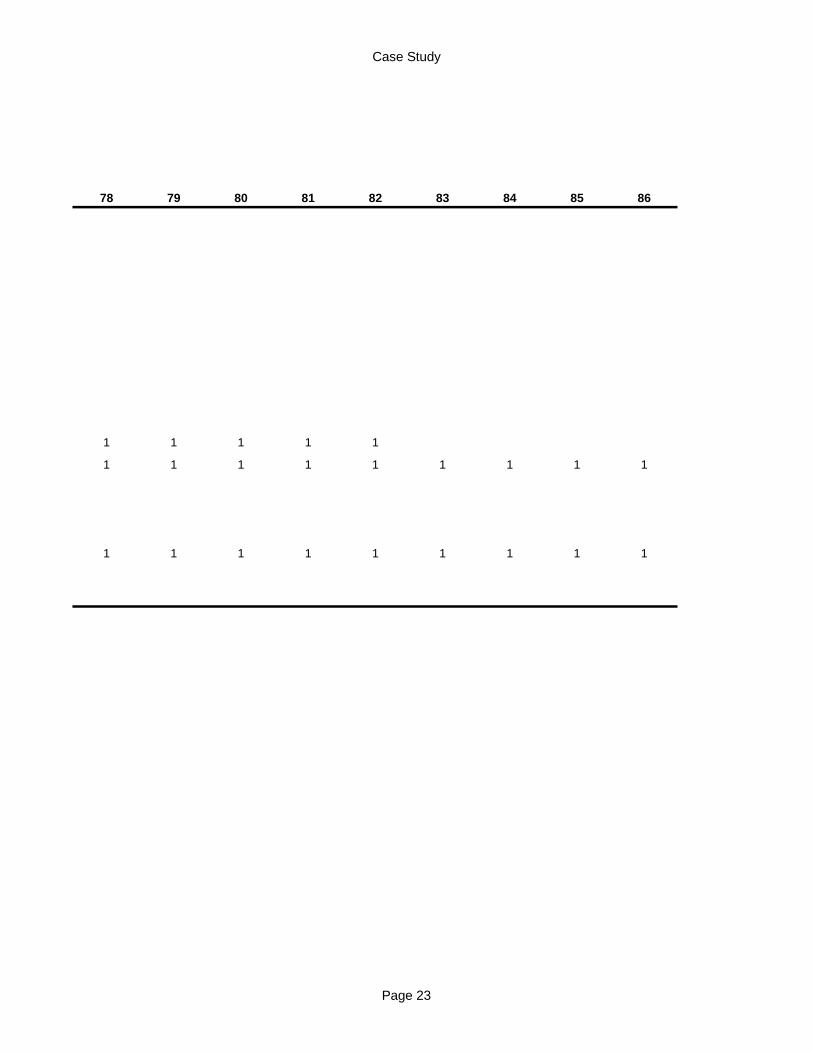
78 79 80 81 82 83 84 85 86
1 1 1 1 1
1 1 1 1 1 1 1 1 1
1 1 1 1 1 1 1 1 1
Page 23

Case Study
Page 24
Case Study
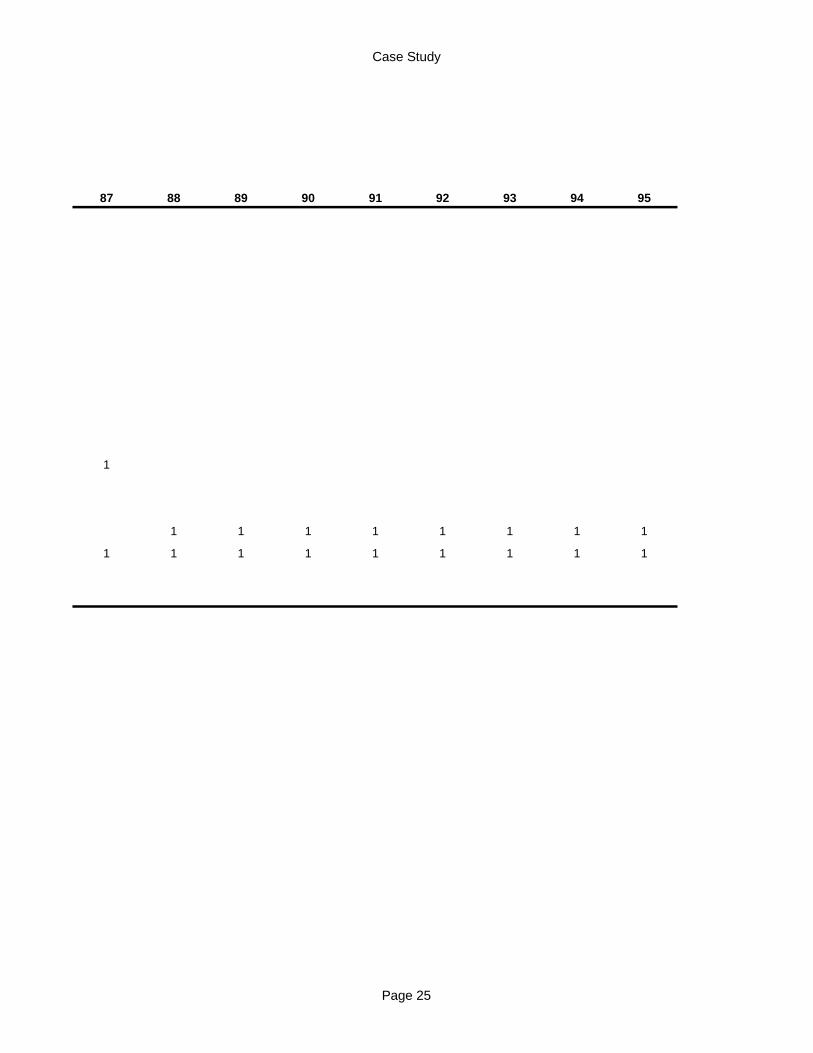
87 88 89 90 91 92 93 94 95
1
1 1 1 1 1 1 1 1
1 1 1 1 1 1 1 1 1
Page 25

Case Study
Page 26
Case Study
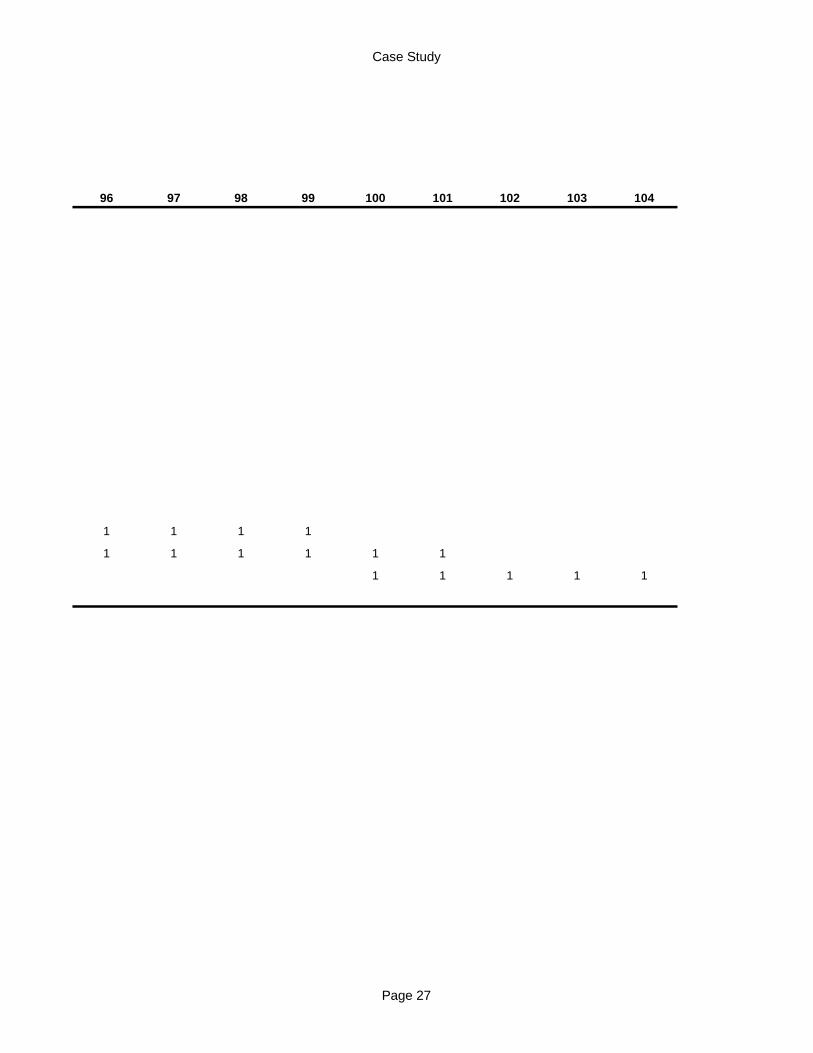
96 97 98 99 100 101 102 103 104
1 1 1 1
1 1 1 1 1 1
1 1 1 1 1
Page 27

Case Study
Page 28
Case Study
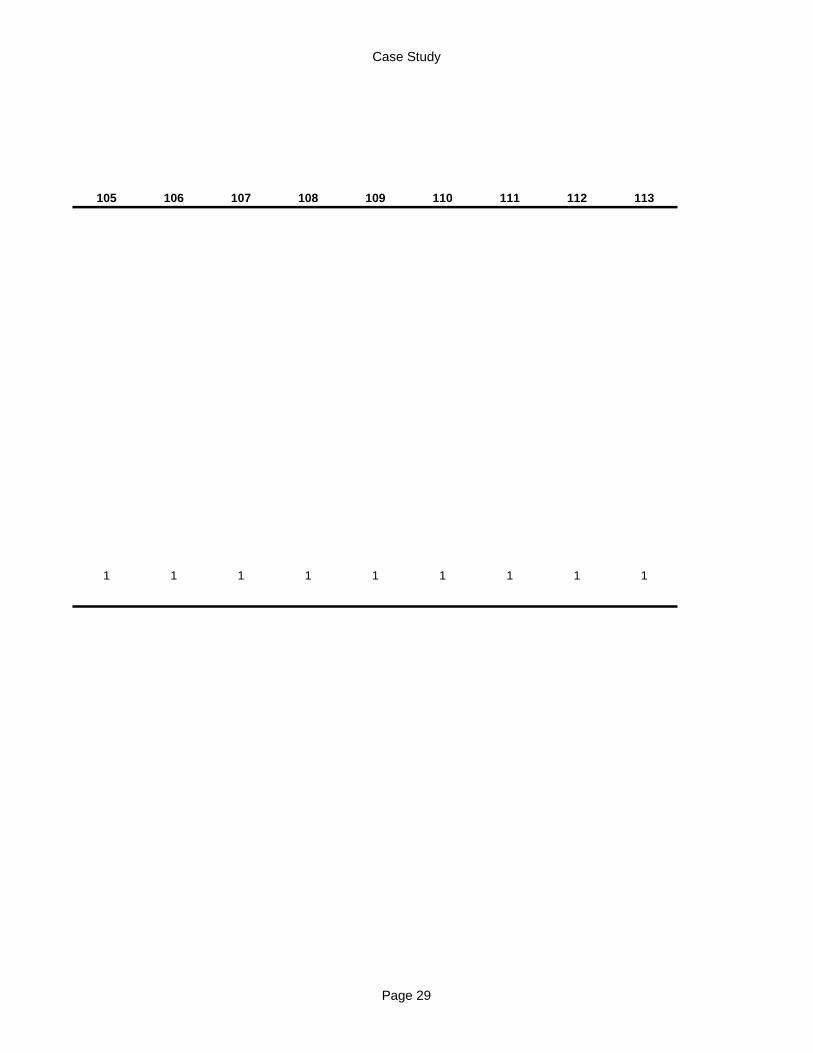
105 106 107 108 109 110 111 112 113
1 1 1 1 1 1 1 1 1
Page 29

Case Study
Page 30
Case Study
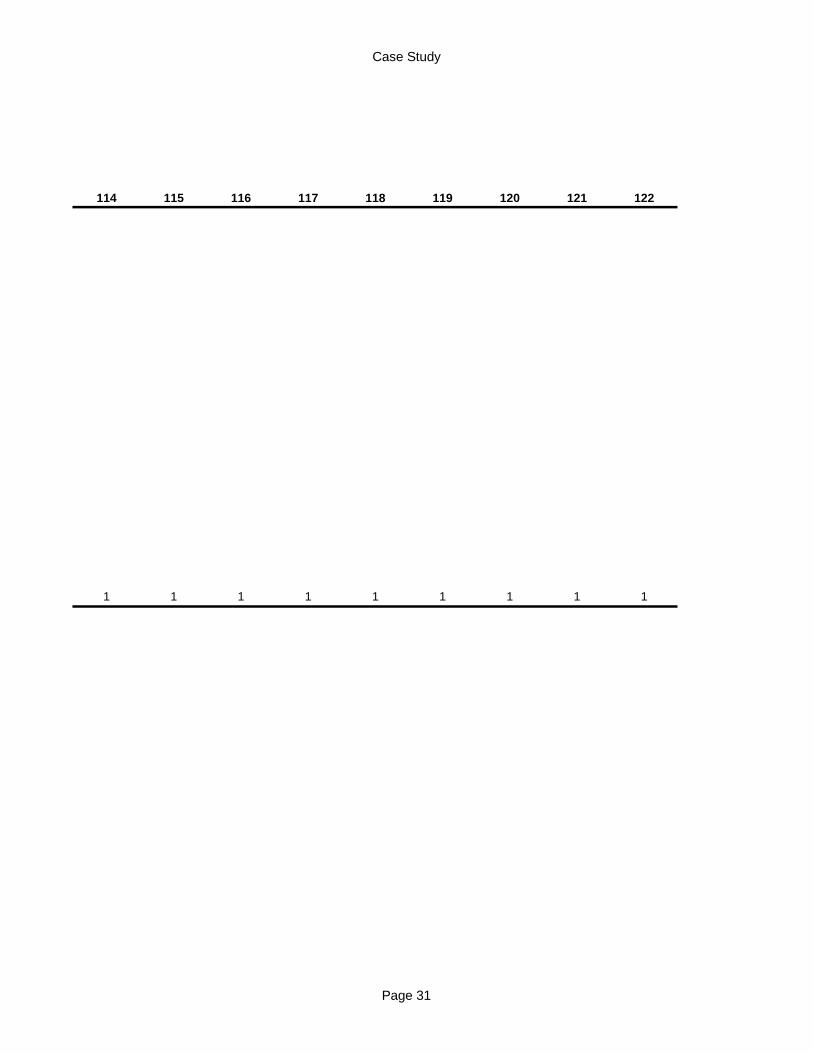
114 115 116 117 118 119 120 121 122
1 1 1 1 1 1 1 1 1
Page 31

Case Study
Page 32
Case Study
123 124 125 126 127 128 129 130
Page 33

Case Study
Page 34

Case Study
Page 35

Case Study
Page 36

Case Study
Page 37

Case Study
Page 38

Case Study
Page 39