
Cover dsdrig ns ebCyrevneT ˜˚˛˝˙˜ˆ˛ˇ˘ˆ˚ˇ ˇ ˚ˇ˙˛˝ˆ ˙ ˆ˛ˇ˘ˆ ... Solar... ·...
32
SOLAR ENERGY IN AUSTRALIA: HEALTH AND ENVIRONMENTAL COSTS AND BENEFITS JEREMY MOSS ALICIA CORAM GRANT BLASHKI DECEMBER 2014
Transcript of Cover dsdrig ns ebCyrevneT ˜˚˛˝˙˜ˆ˛ˇ˘ˆ˚ˇ ˇ ˚ˇ˙˛˝ˆ ˙ ˆ˛ˇ˘ˆ ... Solar... ·...
Cover design by Taloula Press
SOLAR ENERGY IN AUSTRALIA: HEALTH AND ENVIRONMENTAL COSTS AND BENEFITSJEREMY MOSS ALICIA CORAMGRANT BLASHKI
DECEMBER 2014
FOLD LINE
FOLD LINE
20141005 TAI Solar 1.indd 1 07/12/2014 22:27

Technical Brief
Solar energy in Australia: Health and environmental
costs and benefits
December 2014 ISSN 1836-9014
Jeremy Moss, Alicia Coram and Grant Blashki
About TAI
The Australia Institute is an independent public policy think tank based in Canberra. It is funded by donations from philanthropic trusts and individuals and commissioned research. Since its launch in 1994, the Institute has carried out highly influential research on a broad range of economic, social and environmental issues.
Our philosophy
As we begin the 21st century, new dilemmas confront our society and our planet. Unprecedented levels of consumption co-exist with extreme poverty. Through new technology we are more connected than we have ever been, yet civic engagement is declining. Environmental neglect continues despite heightened ecological awareness. A better balance is urgently needed.
The Australia Institute’s directors, staff and supporters represent a broad range of views and priorities. What unites us is a belief that through a combination of research and creativity we can promote new solutions and ways of thinking.
Our purpose—‘Research that matters’
The Institute aims to foster informed debate about our culture, our economy and our environment and bring greater accountability to the democratic process. Our goal is to gather, interpret and communicate evidence in order to both diagnose the problems we face and propose new solutions to tackle them.
The Institute is wholly independent and not affiliated with any other organisation. As an Approved Research Institute, donations to its Research Fund are tax deductible for the donor. Anyone wishing to donate can do so via the website at www.tai.org.au or by calling the Institute on 02 6130 0530. Our secure and user-friendly website allows donors to make either one-off or regular monthly donations and we encourage everyone who can to donate in this way as it assists our research in the most significant manner.
Level 5, 131 City Walk Canberra City ACT 2601 Tel: (02) 6130 0530 Email: [email protected] Website: www.tai.org.au

3
Solar energy in Australia
Acknowledgements
The authors would like to acknowledge the support of several organisations. Kindness House provided a generous grant, The Social Justice Initiative at the University of Melbourne provided matching funding and the Melbourne Sustainable Society Institute also provided support. The report was also funded via an Australian Research Council grant to Jeremy Moss on ‘Climate Justice’. The Melbourne Energy Institute also provided valuable support. We gratefully acknowledge the support of all these organisations.
4
Summary
Australia has some of the best conditions in the world for producing solar energy, and new
research suggests it is also the nation’s preferred future energy option.
This paper considers various advantages and disadvantages of harnessing energy from the
sun. It finds the health and environmental impacts of solar to be minimal in comparison to
fossil fuels, and argues that, as the cost of gas begins to rise, solar will become an
increasingly competitive and valuable energy source.
It is estimated that solar thermal energy could produce up to 60 per cent of Australia’s on-
grid electricity, which would dramatically reduce our greenhouse gas emissions and reliance
on fossil fuels.
Public polling by The Australia Institute1 shows solar is the most popular energy choice of the
future, with 63 per cent of people ranking it as their number one preferred energy choice, and
90 per cent of people ranking it within their top three preferences.
This stands in strong contrast to coal and coal seam gas (CSG), which were listed among
the top three energy sources by a mere 35 and 38 per cent of Australians respectively.
Fossil fuel derived energy sources such as coal and CSG have been widely criticised for
their environmental and health impacts. Six out of 10 Australians consider coal and CSG to
have a detrimental effect on the landscape, while only a fraction of that – 13 per cent – share
the same concern in relation to solar energy.
Despite the favourable conditions and strong public support, solar’s share of electricity output
in Australia is half the OECD average. With the high potential for solar expansion in
Australia, it is important to determine the costs and benefits of this energy source.
Overall, the health risks for workers in the solar sector are considerably less than for those in
the fossil fuel industries. While the paper discusses some health risks associated with the
manufacturing of solar photovoltaic material, these are likely to lessen over time as further
improvements are made in the technology used.
There are only minimal environmental impacts in harnessing solar energy. Despite the need
for large land surface areas, there is little evidence that solar resources conflict with other
land uses such as farming. Additionally, community benefits can accrue from both large and
small scale solar projects, such as jobs in remote areas.
Overall, solar energy is found to have minimal health and environmental impacts, particularly
when compared with fossil fuels. The public desire for harnessing Australia’s solar resources
is strong, with 90 per cent of people wanting more solar energy, and it is predicted to become
an increasingly cost-effective energy source as the technology improves.
1 Results are drawn from an online poll taken by the Australia Institute in August 2014 (n=1410).

5
Solar energy in Australia
Contents
Acknowledgements 3
Summary 4
Contents 5
Executive summary 6
Key findings 7
1. Introduction 8
2. Overview 9
2.1 Solar energy 9
2.2 Solar in Australia 10
2.3 Impacts of solar energy 11
3. Health 13
3.1 Photovoltaics 13
3.2 Solar thermal 20
4. Social and environmental impacts 20
4.1 Social impacts 20
4.2 Environmental impacts 20
4.3 Greenhouse gas emissions 21
5. Comparisons with coal and gas 23
5.1 Direct health impacts 23
5.2 Indirect health impacts 25
5.3 Comparative profile 26
6. Conclusion 27
References 28

6
Executive summary
High levels of solar radiation and suitable land make Australia one of the best countries in the world for solar energy. However, solar’s share of electricity output in Australia is half the OECD average.11
Apart from issues of cost and infrastructure, there are health and environmental considerations that need to be taken into account. The impact profile of solar depends on the kind of system—photovoltaic (PV) or concentrated solar thermal (CST); large or small scale—along with factors affecting the production of materials. The most serious health implications are borne by countries that produce materials for PV systems that use toxic materials, which are similar to those in the microelectronic industry more generally.2,3 As an importer of these materials, Australia has a greater moral responsibility for the mitigation of such risks than is currently acknowledged.
The environmental impact of solar is minimal in many ways, but there are some concerns about the long-term impact of disposal in the case of PVs and of water-use in CST systems.4 In general, the overall GHG intensity of solar is higher than other forms of renewable energy, but significantly less than fossil fuels.5 Solar generally enjoys high levels of community support and there are employment opportunities with the expansion of the sector.6 In particular, small-scale, community based systems—such as the ‘Bushlight’ initiative in remote Indigenous communities—can provide a range of benefits for local communities.7
Although there are some serious health risks associated with the manufacture of PV materials, these risks are considerably lower with CST techologies, and the overall risk profile of all types of solar energy is far lower than that of fossil fuels.8,9 Other impacts of concern include the relatively high cost of solar compared to other energy sources and water-use in large-scale CST systems. However the steady improvement in solar technologies will likely reduce these impacts considerably, and the rising costs of gas that will attend Australia’s expanding export industry will likely mean that solar becomes relatively competitive.10
7
Solar energy in Australia
Key findings
The health and environmental profile of solar energy depends heavily on the type of system used.
The manufacturing of solar photovoltaic materials (PVs) has the greatest associated health risks, similar to those found in the microelectronic industry. These risks mostly affect workers that manufacture PVs, however long-term environmental pollution from PV disposal is also of concern.
As Australia imports all of its raw silicon wafer/cell material, the majority of these health risks are outsourced to countries such as China, Japan and the USA.
Concentrated solar thermal (CST) systems have a lower health risk profile and are also more efficient, however many CST technologies use considerable quantities of water.
Although requiring large quantities of land, there is little evidence of resource conflict from large-scale solar projects in Australia and there are benefits that can accrue to communities from both large and small scale solar including jobs in remote areas.
GHG emissions from solar are higher than other renewables but substantially less than fossil fuels, and becoming lower with new technologies.
Overall, solar represents a low-impact option, especially compared to fossil fuels, and advances in technology are likely to reduce these impacts further. While the health impacts of PVs and environmental impacts of some CST systems are non-negligible, improvements in technology and correct decommissioning and recycling of materials can substantially reduce these impacts.
8
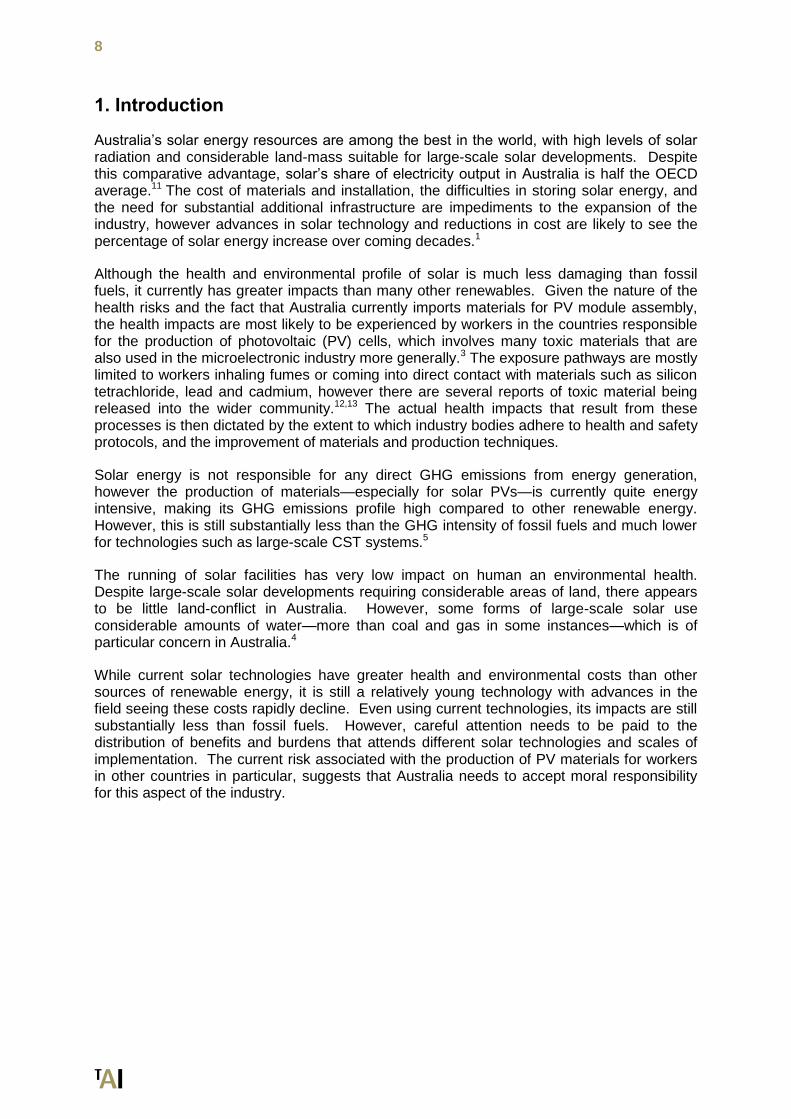
1. Introduction
Australia’s solar energy resources are among the best in the world, with high levels of solar radiation and considerable land-mass suitable for large-scale solar developments. Despite this comparative advantage, solar’s share of electricity output in Australia is half the OECD average.11 The cost of materials and installation, the difficulties in storing solar energy, and the need for substantial additional infrastructure are impediments to the expansion of the industry, however advances in solar technology and reductions in cost are likely to see the percentage of solar energy increase over coming decades.1
Although the health and environmental profile of solar is much less damaging than fossil fuels, it currently has greater impacts than many other renewables. Given the nature of the health risks and the fact that Australia currently imports materials for PV module assembly, the health impacts are most likely to be experienced by workers in the countries responsible for the production of photovoltaic (PV) cells, which involves many toxic materials that are also used in the microelectronic industry more generally.3 The exposure pathways are mostly limited to workers inhaling fumes or coming into direct contact with materials such as silicon tetrachloride, lead and cadmium, however there are several reports of toxic material being released into the wider community.12,13 The actual health impacts that result from these processes is then dictated by the extent to which industry bodies adhere to health and safety protocols, and the improvement of materials and production techniques.
Solar energy is not responsible for any direct GHG emissions from energy generation, however the production of materials—especially for solar PVs—is currently quite energy intensive, making its GHG emissions profile high compared to other renewable energy. However, this is still substantially less than the GHG intensity of fossil fuels and much lower for technologies such as large-scale CST systems.5
The running of solar facilities has very low impact on human an environmental health. Despite large-scale solar developments requiring considerable areas of land, there appears to be little land-conflict in Australia. However, some forms of large-scale solar use considerable amounts of water—more than coal and gas in some instances—which is of particular concern in Australia.4
While current solar technologies have greater health and environmental costs than other sources of renewable energy, it is still a relatively young technology with advances in the field seeing these costs rapidly decline. Even using current technologies, its impacts are still substantially less than fossil fuels. However, careful attention needs to be paid to the distribution of benefits and burdens that attends different solar technologies and scales of implementation. The current risk associated with the production of PV materials for workers in other countries in particular, suggests that Australia needs to accept moral responsibility for this aspect of the industry.
9
Solar energy in Australia
2. Overview
2.1 Solar energy
The amount of solar energy which strikes the Earth is far greater than the world’s energy demand.11 However, only a small amount of the world’s solar energy is converted to electricity due to the established energy infrastructure, as well as technical obstacles concerning variability, storage and transport that mean that solar energy is currently a more expensive energy option than fossil fuels.1 However, technical advances and other drivers are likely to see overall use of solar energy increase, and it has been estimated that it would be possible (given certain policy and technological changes) for solar to provide up to a third of the world’s energy by 2060.14
There are two main types of solar energy—photovoltaic (PV), which converts photons directly into electricity, and solar thermal (ST), which converts solar radiation into thermal energy. There are several different systems that capture solar energy, all of which have different health and environmental profiles.
2.1.1 PV systems
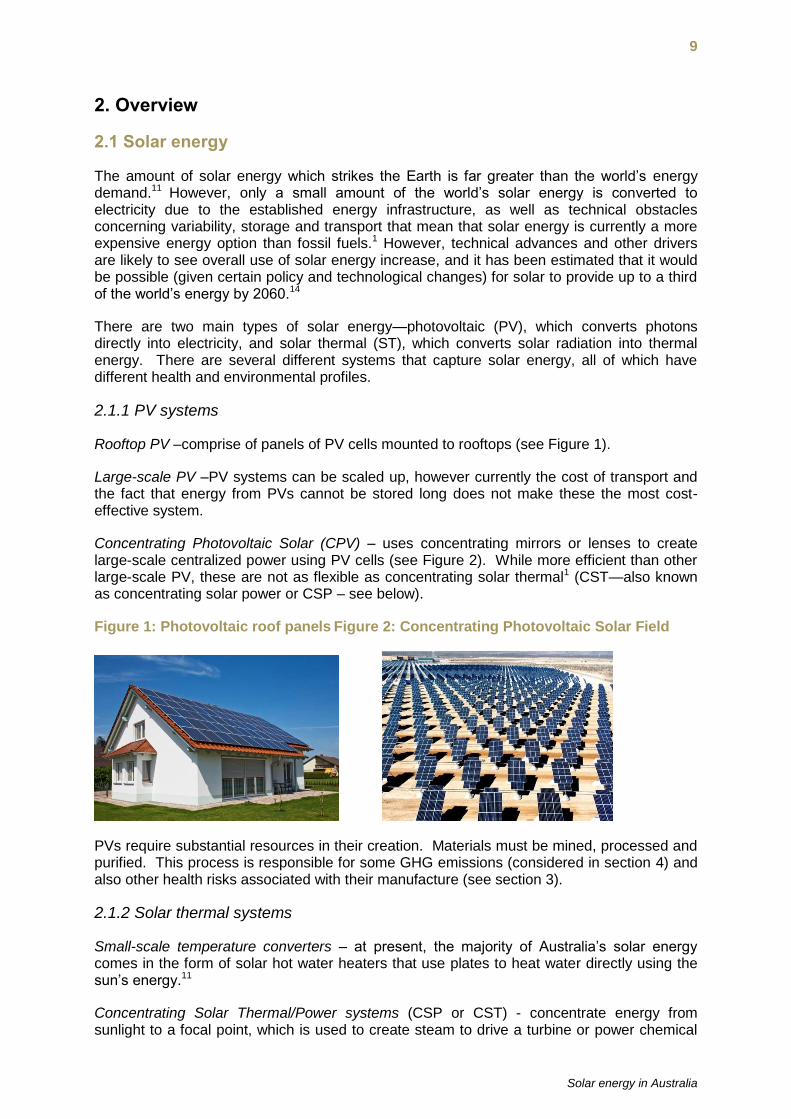
Rooftop PV –comprise of panels of PV cells mounted to rooftops (see Figure 1).
Large-scale PV –PV systems can be scaled up, however currently the cost of transport and the fact that energy from PVs cannot be stored long does not make these the most cost-effective system.
Concentrating Photovoltaic Solar (CPV) – uses concentrating mirrors or lenses to create large-scale centralized power using PV cells (see Figure 2). While more efficient than other large-scale PV, these are not as flexible as concentrating solar thermal1 (CST—also known as concentrating solar power or CSP – see below).
Figure 1: Photovoltaic roof panels Figure 2: Concentrating Photovoltaic Solar Field
PVs require substantial resources in their creation. Materials must be mined, processed and purified. This process is responsible for some GHG emissions (considered in section 4) and also other health risks associated with their manufacture (see section 3).
2.1.2 Solar thermal systems
Small-scale temperature converters – at present, the majority of Australia’s solar energy comes in the form of solar hot water heaters that use plates to heat water directly using the sun’s energy.11
Concentrating Solar Thermal/Power systems (CSP or CST) - concentrate energy from sunlight to a focal point, which is used to create steam to drive a turbine or power chemical
10
processes. Heat that is excess to requirement is stored in a material (‘working fluid’) such as salt, water or oil, which is then used to generate more steam. The ability to store and release energy makes them more flexible and potentially more efficient than CPV systems.1
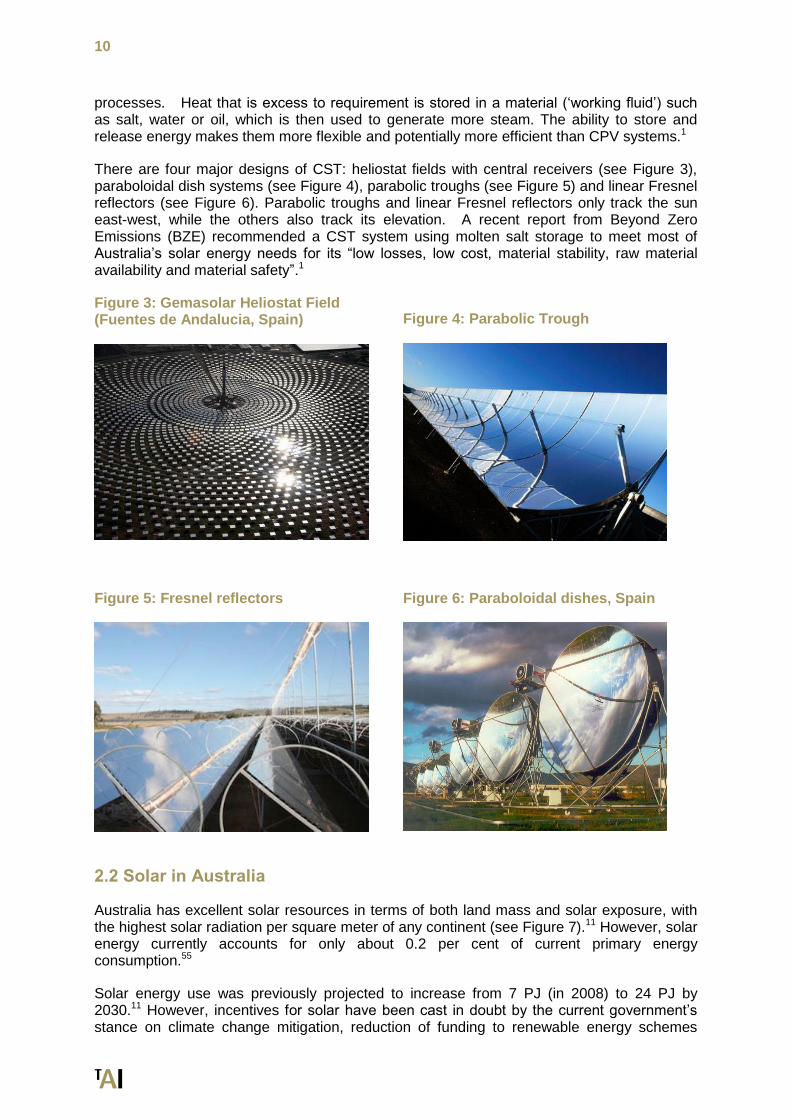
There are four major designs of CST: heliostat fields with central receivers (see Figure 3), paraboloidal dish systems (see Figure 4), parabolic troughs (see Figure 5) and linear Fresnel reflectors (see Figure 6). Parabolic troughs and linear Fresnel reflectors only track the sun east-west, while the others also track its elevation. A recent report from Beyond Zero Emissions (BZE) recommended a CST system using molten salt storage to meet most of Australia’s solar energy needs for its “low losses, low cost, material stability, raw material availability and material safety”.1
Figure 3: Gemasolar Heliostat Field (Fuentes de Andalucia, Spain)
Figure 4: Parabolic Trough
Figure 5: Fresnel reflectors
Figure 6: Paraboloidal dishes, Spain
2.2 Solar in Australia
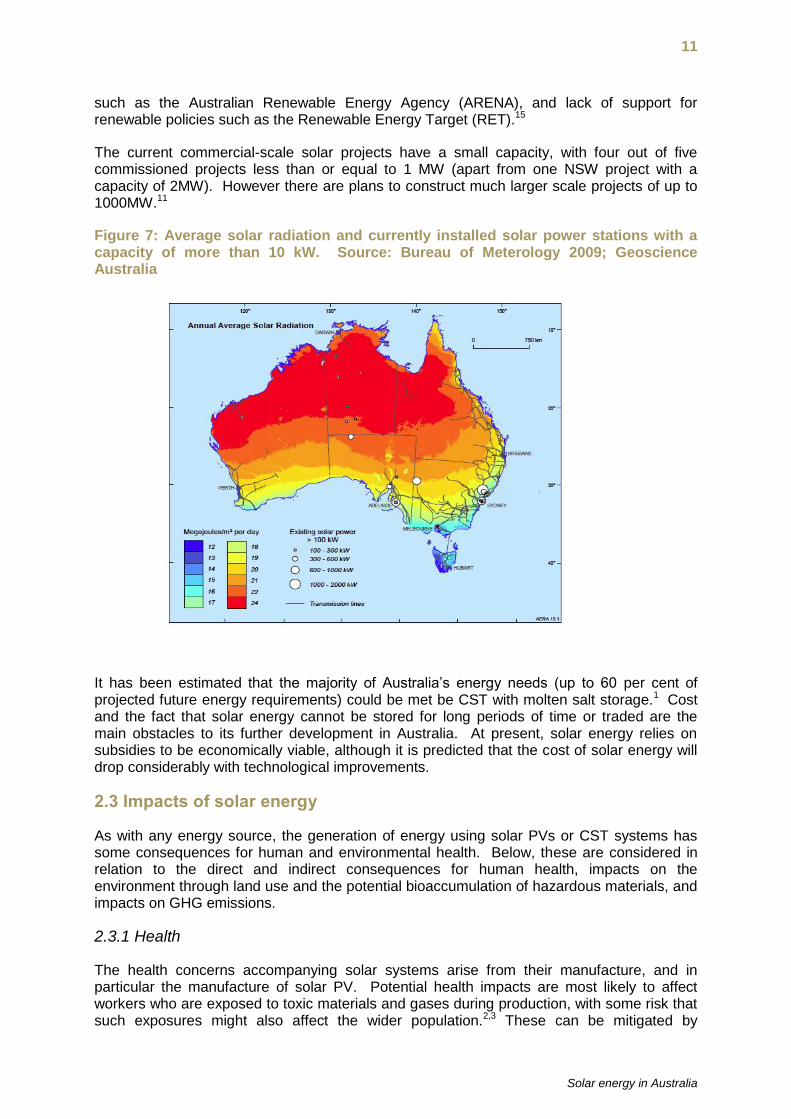
Australia has excellent solar resources in terms of both land mass and solar exposure, with the highest solar radiation per square meter of any continent (see Figure 7).11 However, solar energy currently accounts for only about 0.2 per cent of current primary energy consumption.55
Solar energy use was previously projected to increase from 7 PJ (in 2008) to 24 PJ by 2030.11 However, incentives for solar have been cast in doubt by the current government’s stance on climate change mitigation, reduction of funding to renewable energy schemes
11
Solar energy in Australia
such as the Australian Renewable Energy Agency (ARENA), and lack of support for renewable policies such as the Renewable Energy Target (RET).15
The current commercial-scale solar projects have a small capacity, with four out of five commissioned projects less than or equal to 1 MW (apart from one NSW project with a capacity of 2MW). However there are plans to construct much larger scale projects of up to 1000MW.11
Figure 7: Average solar radiation and currently installed solar power stations with a capacity of more than 10 kW. Source: Bureau of Meterology 2009; Geoscience Australia
It has been estimated that the majority of Australia’s energy needs (up to 60 per cent of projected future energy requirements) could be met be CST with molten salt storage.1 Cost and the fact that solar energy cannot be stored for long periods of time or traded are the main obstacles to its further development in Australia. At present, solar energy relies on subsidies to be economically viable, although it is predicted that the cost of solar energy will drop considerably with technological improvements.
2.3 Impacts of solar energy
As with any energy source, the generation of energy using solar PVs or CST systems has some consequences for human and environmental health. Below, these are considered in relation to the direct and indirect consequences for human health, impacts on the environment through land use and the potential bioaccumulation of hazardous materials, and impacts on GHG emissions.
2.3.1 Health
The health concerns accompanying solar systems arise from their manufacture, and in particular the manufacture of solar PV. Potential health impacts are most likely to affect workers who are exposed to toxic materials and gases during production, with some risk that such exposures might also affect the wider population.2,3 These can be mitigated by

12
adherence to health and safety protocols, however as production of materials for PV cells takes place off-shore, this is not under the control of the Australian government. The increasing interest in new nanotechnologies potentially introduces further hazards, although the nature of these is at present uncertain.16
Although beyond the scope of this report to give full consideration, there are also some concerns raised over the potential cost of solar energy and its effect on vulnerable groups.
2.3.2 Environment
Australia has a large amount of space suitable for the installation of large-scale solar systems that would not directly compete with other interests, however when the establishment of infrastructure and the environmental consequences of manufacturing, disposal and decommission—especially of PVs—is also taken into consideration the environmental impact becomes more substantial. Some varieties of CST technology also require considerable water use, with some systems estimated to use more than fossil fuels.4
2.3.3 Greenhouse Gas Emissions
Energy produced from solar power is not directly responsible for any GHG emissions, however the construction of solar systems can be energy intensive, depending on the nature of the system. The level of emissions differs considerably depending on the technology used, and comes from the energy sources (such as coal, oil and nuclear) that are used in the production and transport of material. These emissions remain significantly less than fossil fuels, which means that switching to solar from coal or gas would see a sizeable overall decrease in greenhouse gases.5
2.3.4 Benefits
Increasing the amount of solar energy used in Australia would confer substantial benefits, especially concerning the reduction of GHG emissions. There are other benefits that accompany particular types of solar systems—for example, distributed systems, where solar energy is created by households or communities and used on site would see a reduction in power being transported, and hence reduced electromagnetic radiation.17 PV panels integrated onto building surfaces would see a reduction of land use17, and the establishment of community-based solar systems can also have social benefits, especially in remote communities.7
However there are some health impacts that need to be taken into account, particularly concerning the manufacture of PV components that takes place off-shore. This provides some reason for favouring large-scale CST systems, and also suggests that there is a moral responsibility for Australia to help mitigate these risks.
Even taking into consideration these impacts, the benefits from replacing currently employed coal and gas technologies with large scale solar would be substantial, as discussed in Section 5.
13
Solar energy in Australia
3. Health
Most of the health concerns with solar energy relate to the production of the semiconductors used in PVs, which involves several potentially hazardous materials. Nearly all of these health risks affect overseas workers rather than the general population, except in cases where materials are incorrectly disposed of.
The materials used and the hazards faced are often the same as those found in the microelectronics industry more generally. This means that there is considerable information regarding the health implications of PV manufacture. However, the interest in new materials and processes—particularly nanoparticles and technologies—has introduced some uncertainties.16
Despite remaining concerns, technological advances have been steadily improving the health impacts of solar. This is demonstrated in the difference between an earlier study estimating that producing solar power had “30 per cent higher health impacts than natural gas”, while follow-on studies showed health impacts reduced to “about 0.1-0.2 cents per kWh [$1 - $2 per MWh], primarily caused by GHG, lead, and particulate matter emissions”.18 Solar in Australia has elsewhere been estimated to have health impacts of approximately $5 per MWh, compared to gas at $19 per MWh.19
3.1 Photovoltaics
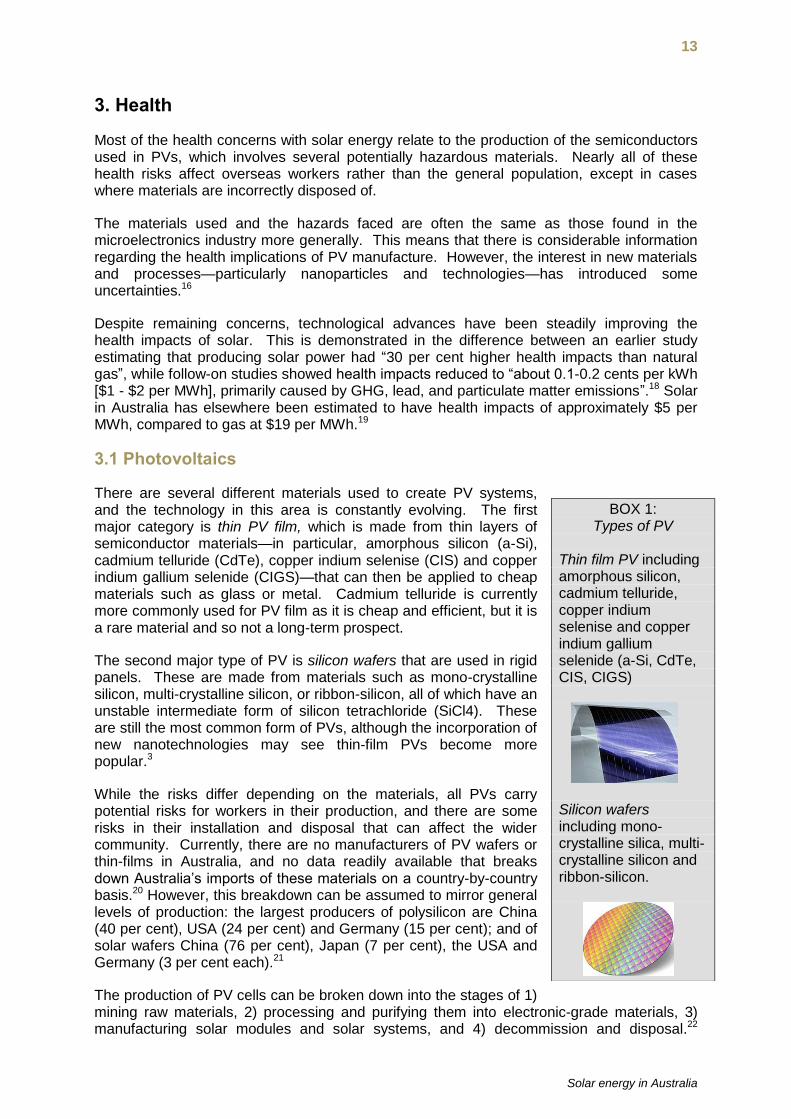
There are several different materials used to create PV systems, and the technology in this area is constantly evolving. The first major category is thin PV film, which is made from thin layers of semiconductor materials—in particular, amorphous silicon (a-Si), cadmium telluride (CdTe), copper indium selenise (CIS) and copper indium gallium selenide (CIGS)—that can then be applied to cheap materials such as glass or metal. Cadmium telluride is currently more commonly used for PV film as it is cheap and efficient, but it is a rare material and so not a long-term prospect.
The second major type of PV is silicon wafers that are used in rigid panels. These are made from materials such as mono-crystalline silicon, multi-crystalline silicon, or ribbon-silicon, all of which have an unstable intermediate form of silicon tetrachloride (SiCl4). These are still the most common form of PVs, although the incorporation of new nanotechnologies may see thin-film PVs become more popular.3
While the risks differ depending on the materials, all PVs carry potential risks for workers in their production, and there are some risks in their installation and disposal that can affect the wider community. Currently, there are no manufacturers of PV wafers or thin-films in Australia, and no data readily available that breaks down Australia’s imports of these materials on a country-by-country basis.20 However, this breakdown can be assumed to mirror general levels of production: the largest producers of polysilicon are China (40 per cent), USA (24 per cent) and Germany (15 per cent); and of solar wafers China (76 per cent), Japan (7 per cent), the USA and Germany (3 per cent each).21
The production of PV cells can be broken down into the stages of 1) mining raw materials, 2) processing and purifying them into electronic-grade materials, 3) manufacturing solar modules and solar systems, and 4) decommission and disposal.22
BOX 1: Types of PV
Thin film PV including amorphous silicon, cadmium telluride, copper indium selenise and copper indium gallium selenide (a-Si, CdTe, CIS, CIGS)
Silicon wafers including mono-crystalline silica, multi-crystalline silicon and ribbon-silicon.
14
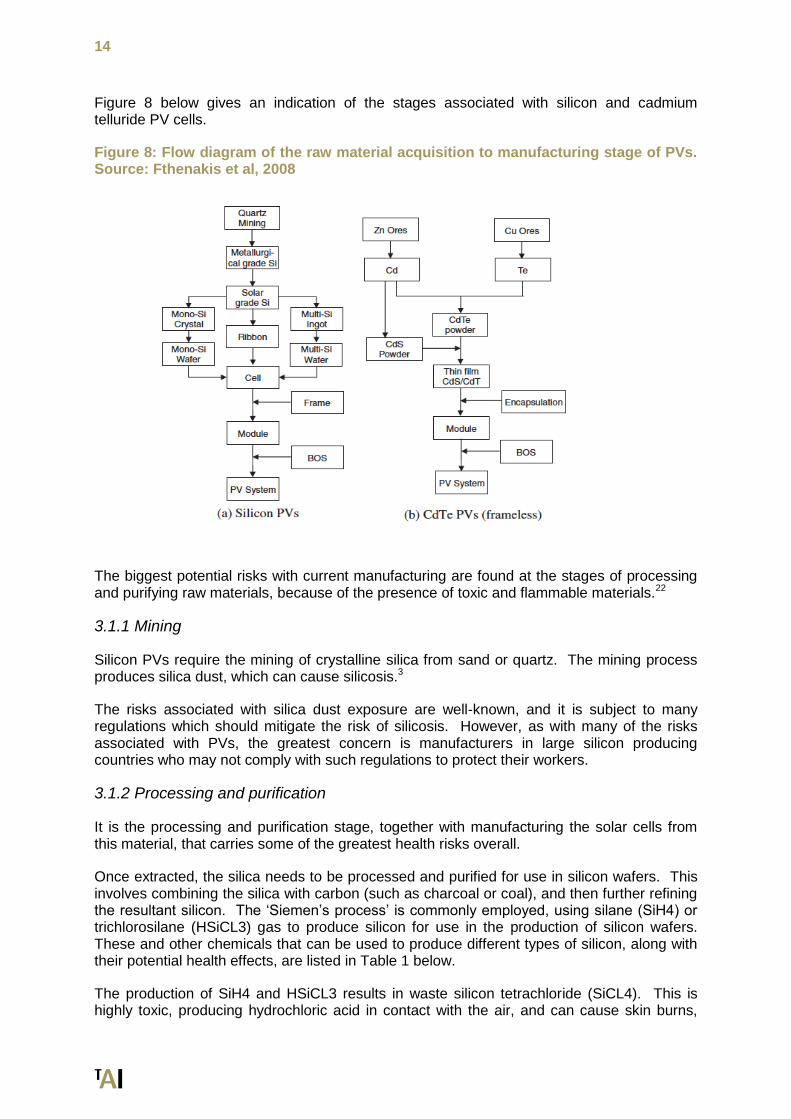
Figure 8 below gives an indication of the stages associated with silicon and cadmium telluride PV cells.
Figure 8: Flow diagram of the raw material acquisition to manufacturing stage of PVs. Source: Fthenakis et al, 2008
The biggest potential risks with current manufacturing are found at the stages of processing and purifying raw materials, because of the presence of toxic and flammable materials.22
3.1.1 Mining
Silicon PVs require the mining of crystalline silica from sand or quartz. The mining process produces silica dust, which can cause silicosis.3
The risks associated with silica dust exposure are well-known, and it is subject to many regulations which should mitigate the risk of silicosis. However, as with many of the risks associated with PVs, the greatest concern is manufacturers in large silicon producing countries who may not comply with such regulations to protect their workers.
3.1.2 Processing and purification
It is the processing and purification stage, together with manufacturing the solar cells from this material, that carries some of the greatest health risks overall.
Once extracted, the silica needs to be processed and purified for use in silicon wafers. This involves combining the silica with carbon (such as charcoal or coal), and then further refining the resultant silicon. The ‘Siemen’s process’ is commonly employed, using silane (SiH4) or trichlorosilane (HSiCL3) gas to produce silicon for use in the production of silicon wafers. These and other chemicals that can be used to produce different types of silicon, along with their potential health effects, are listed in Table 1 below.
The production of SiH4 and HSiCL3 results in waste silicon tetrachloride (SiCL4). This is highly toxic, producing hydrochloric acid in contact with the air, and can cause skin burns,
15
Solar energy in Australia
irritate eyes, skin and the respiratory system.3,12 In addition, sulfur hexafluoride (SF6)—which has a GWP 25,000 greater than CO2—is used in the process.
The dangers inherent in processing and purification and the need for enforcing proper regulation were highlighted in a 2008 incident in China. Waste SiCl4 was dumped into fields near the production facility, resulting in nearby villagers experiencing eye and nose irritations, and crops wilting.13 Such incidents raise concerns where the manufacture of PV materials is largely outsourced to countries that may not enforce strict environmental, health and safety regulations.
However, although there are distinct risks if proper health and environmental measures are not taken, other production facilities use a ‘closed loop’ process, capturing byproducts for reuse, and waste gases that are not recycled are treated before release. In these facilities, environmental releases of damaging materials are very low.12
The creation of thin-film a-Si PVs involves the steps noted above up until the use of the Siemen’s process. Overall, thin-film PV manufacture has lower energy requirements than silicon wafers, requiring less silicon and producing lower emissions overall. However, the gases used are considered extremely hazardous, highly toxic, or pyrophoric (ignite spontaneously in air), posing occupational dangers.23 Potentially hazardous chemicals used in the production of a-Si are summarized in Table 1.
Cadmium telluride (CdTe) cells use different processes. Cadmium—a by-product of zinc mining—is a known carcinogen, with the “potential to cause kidney, liver, bone, and blood damage from ingestion and lung cancer from inhalation”, and workers are potentially exposed to cadmium compounds.12 Because of health concerns, most products containing cadmium have been banned from sale by the European Economic Community (EEC), although CdTe is of lower toxicity than pure cadmium.24 The creation of CdTe cells can also use potentially harmful materials such as molybdenum, nickel, sulfur, tellurium, and tin.12
Other PV technologies are being developed. While there is currently not much information about the health hazards associated with these alternatives, they involve toxic materials such as hydrogen selenide, which is dangerous at very low concentrations, and sometimes cadmium sulfide (CdS). However, the rest of the materials are generally non-toxic or only mildly toxic.12
There is increased interest in the use of nanoparticles to create ‘quantum dots’ to increase the efficiency of PVs. Such materials are likely to have greater health hazards because their scale may increase toxicity, mobility and bioaccumulation.12,16 Though there were no studies identified looking specifically at the risks from nanoparticles in PVs, there is some evidence that nanoparticles can enter the body through lungs and ingestion, with the possibility they may penetrate through the skin.25
The health risks accompanying the use of these materials are for the most part borne by workers, with potential hazard pathways including the inhalation of materials in the form of dust and fumes, and contact after spills. Some of the risk pathways associated with the materials that have been considered here are also a risk for surrounding communities, who may be exposed to hazardous gases. There are a number of occupational and environmental regulations as well as best practice that is adhered to by many facilities, with “no known catastrophic releases of toxic gases from photovoltaic manufacturing facilities in the United States”3, however this is not necessarily the case for other countries that Australia imports material from.
16
3.1.3 Manufacture of silicon wafers
Silicon wafers are produced by sawing ingots of monocrystalline or multicrystalline silicon into thin wafers. This process produces silicon dust known as ‘kerf dust’ and can generate silicon particulate matter (PM). An anti-reflexive coating is applied, and electrical conductors are printed onto them.3
This manufacturing process involves several potentially hazardous chemicals. Aside from exposure to kerf dust, workers can also be exposed to solvents such as nitric acid, sodium hydroxide and hydrofluoric acid through inhalation or through accidental spills, with many of these solvents posing a risk of chemical burns.3 The silane gas used in depositing the coating to the wafers is extremely flammable, with the “semiconductor industry report[ing] several silane incidents every year”.12
The next stage in the assembly of a silicon wafer PV system is joining together individual cells to form a module. Some module production takes place in Australia, although many modules are imported already assembled. These are usually wired together (usually without toxic materials, although some manufacturers have been known to use solders containing lead or other hazardous materials) and enclosed in a protective material before being mounted, covered and put in a frame.3 Module assembly is not considered to be a particularly risky pathway for human exposure as much of the assembly is automated.
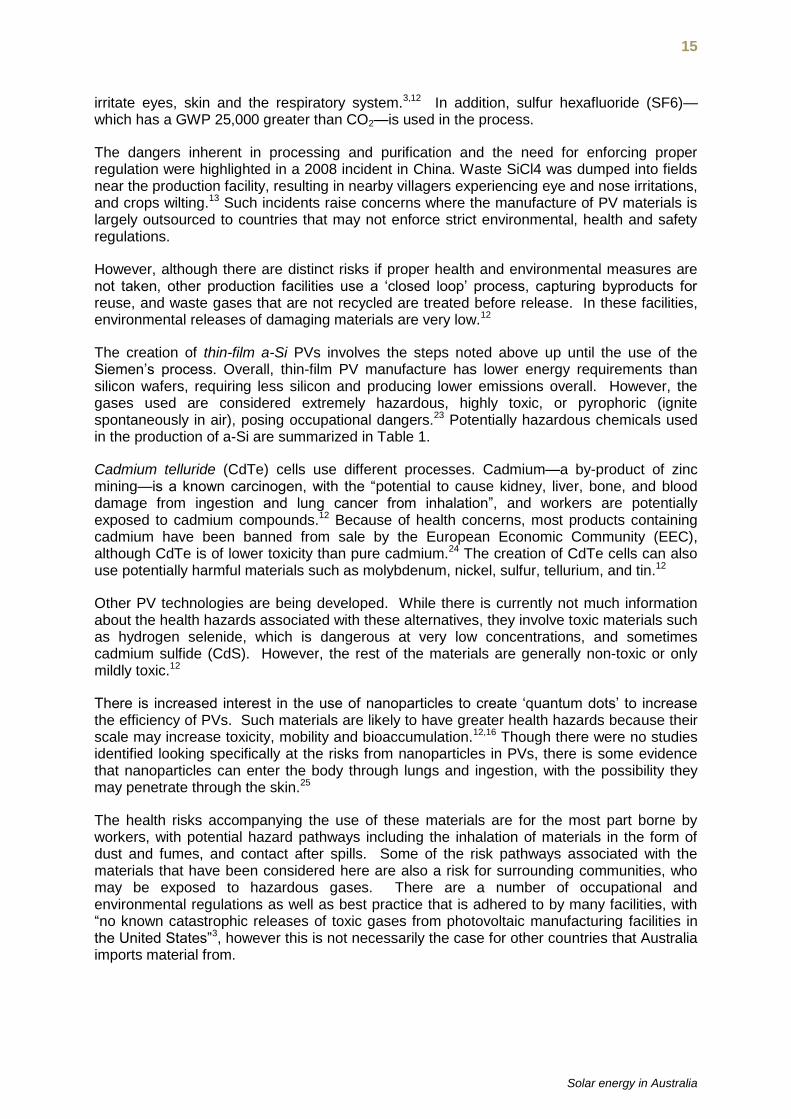
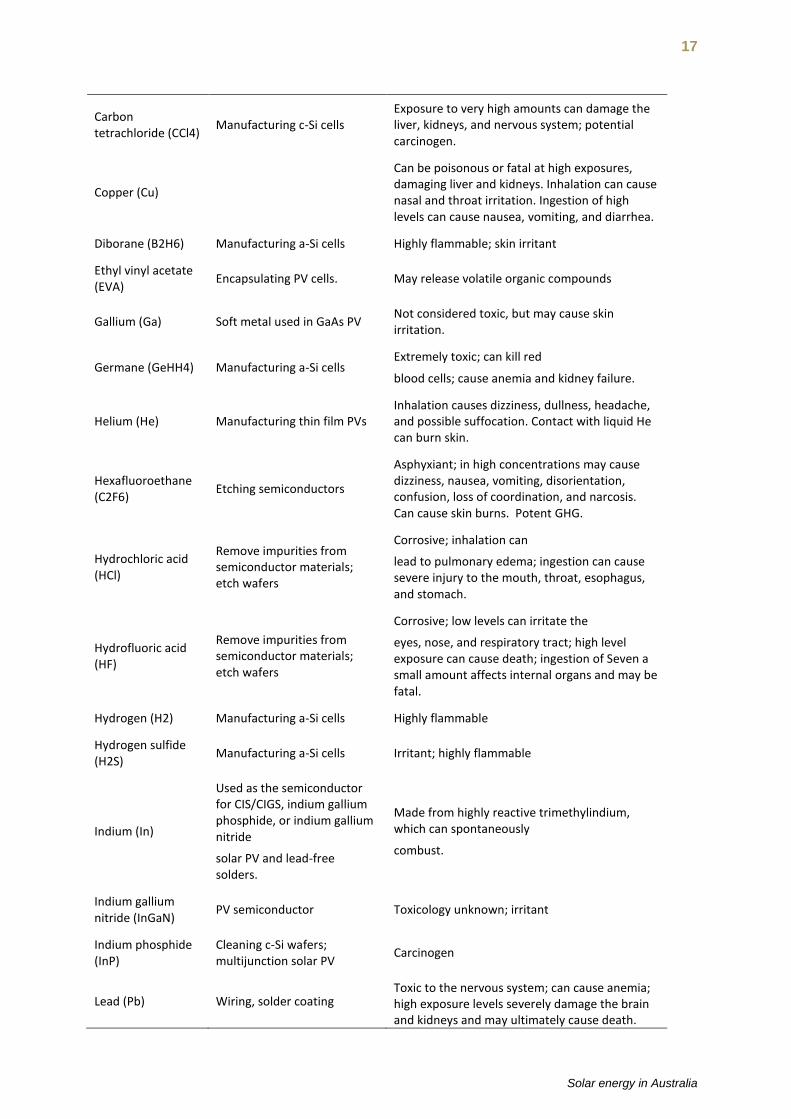
Table 1: Health impacts from materials used in production of solar PVs. Source: Mulvaney 2009 and Oregon Govt. 2013
Material Use Health hazards
Acetone Released in fugitive air emissions; manufacturing a-Si
Ammonia (NH3) Released in fugitive air emissions
Skin, eye, throat, and lung irritant; lung damage, blindness and death can result from exposure to very high concentrations.
Argon (Ar) Non-toxic; asphyxiant in confined spaces.
Arsenic (As) Poison; can affect throat, lungs, blood cells, heart and blood vessels; high levels increase cancer risk; skin problems.
Arsine (AsH3) Doping semiconductor materials
Highly toxic gas; damages red blood cells, and can affect kidneys; carcinogenic.
Boron trifluoride (BF3)
Doping silicon semiconductors
Exposure to large amounts over short periods can affect the stomach, intestines, liver, kidney and brain and eventually lead to death
Brominated Flame Retardants (BFRs)
Cadmium (Cd) (also (CdCl2); (CdSO4); (CdS))
Manufacturing CdTe cells Carcinogenic; potential to cause kidney, liver, bone and blood damage from ingestion; lung cancer from inhalation.
Cadmium telluride (CdTe)
Manufacturing CdTe cells Less toxic than other cadmium compounds. CdTe quantum dots could trigger cell damage.
Carbon nanotubes (CNTs)
Inhalation hazards similar to
asbestos.
17
Solar energy in Australia
Carbon tetrachloride (CCl4)
Manufacturing c-Si cells Exposure to very high amounts can damage the liver, kidneys, and nervous system; potential carcinogen.
Copper (Cu)
Can be poisonous or fatal at high exposures, damaging liver and kidneys. Inhalation can cause nasal and throat irritation. Ingestion of high levels can cause nausea, vomiting, and diarrhea.
Diborane (B2H6) Manufacturing a-Si cells Highly flammable; skin irritant
Ethyl vinyl acetate (EVA)
Encapsulating PV cells. May release volatile organic compounds
Gallium (Ga) Soft metal used in GaAs PV Not considered toxic, but may cause skin irritation.
Germane (GeHH4) Manufacturing a-Si cells Extremely toxic; can kill red
blood cells; cause anemia and kidney failure.
Helium (He) Manufacturing thin film PVs Inhalation causes dizziness, dullness, headache, and possible suffocation. Contact with liquid He can burn skin.
Hexafluoroethane (C2F6)
Etching semiconductors
Asphyxiant; in high concentrations may cause dizziness, nausea, vomiting, disorientation, confusion, loss of coordination, and narcosis. Can cause skin burns. Potent GHG.
Hydrochloric acid (HCl)
Remove impurities from semiconductor materials; etch wafers
Corrosive; inhalation can
lead to pulmonary edema; ingestion can cause severe injury to the mouth, throat, esophagus, and stomach.
Hydrofluoric acid (HF)
Remove impurities from semiconductor materials; etch wafers
Corrosive; low levels can irritate the
eyes, nose, and respiratory tract; high level exposure can cause death; ingestion of Seven a small amount affects internal organs and may be fatal.
Hydrogen (H2) Manufacturing a-Si cells Highly flammable
Hydrogen sulfide (H2S)
Manufacturing a-Si cells Irritant; highly flammable
Indium (In)
Used as the semiconductor for CIS/CIGS, indium gallium phosphide, or indium gallium nitride
solar PV and lead-free solders.
Made from highly reactive trimethylindium, which can spontaneously
combust.
Indium gallium nitride (InGaN)
PV semiconductor Toxicology unknown; irritant
Indium phosphide (InP)
Cleaning c-Si wafers; multijunction solar PV
Carcinogen
Lead (Pb) Wiring, solder coating Toxic to the nervous system; can cause anemia; high exposure levels severely damage the brain and kidneys and may ultimately cause death.

18
Probable carcinogen.
Molybdenum Hexaflouride
Toxic and corrosive gas
Nitric acid (HNO3) Cleaning wafers, removing dopants, and cleaning reactors
Occupational chemical burn hazard.
Nitrogen (N2) Used to manufacture c-Si cells; used to dope semiconductors
Workplace asphyxiation hazard
Nitrogen trifluoride (NF3)
Cleaning reactors and etching polysilicon semiconductors
Can cause asphyxiation. Potent GHG.
Phosphine (PH3) Doping semiconductor materials; manufacturing a-Si cells
Highly toxic; explosive risk
Polybrominated diphenyl ethers (PBDEs)
Added to plastics and foam products
Little known about human health effects. Toxicity to the liver, thyroid, and
neurodevelopment reported in animals.
Selenium (Se) found in CIS/CIGS
Poison; respiratory tract irritation, bronchitis, difficulty breathing, and stomach pains; short-term exposure to high concentrations may cause nausea, vomiting, and diarrhea. Chronic exposure can cause selenosis (including hair loss and neurological abnormalities)
Selenium dioxide (SeO2); Selenium hydride (H2Se)
CIS/CIGS manufacturing
Highly toxic when inhaled; may cause skin burns and eye irritation. Chronic
exposure may cause selenium-related diseases. H2Se is extremely flammable.
Silane (SiH4) Applying silicon thin films and make silicon crystal semiconductors
Explosive risk; respiratory tract, skin, and eye irritation. Silane gas is extremely explosive. At room temperature, is pyrophoric (spontaneously combusts in air without external ignition).
Silicon (Si) The most widely used solar PV semiconductor
Crystalline silica (silicon dioxide, SiO2) is a potent respiratory hazard. Lung cancer is associated with occupational exposures to crystalline silica
Silicon tetrachloride (SiCl4)
Waste from production of silane and trichlorosilane; by-product and intermediary in silicon-based PV cell production
Extremely toxic; reacts with water; causes skin burns; respiratory, eye and skin irritant
Silicon tetraflouride Manufacturing a-Si cells Can emit toxic fumes
Silver (Ag) Making electrical contacts
Exposure to high levels over long time periods may cause discoloration of the skin and other body tissues. Exposure to high levels can result in breathing problems, lung and throat irritation, and stomach pains.
Sodium hydroxide (NaOH)
Cleaning and etching semiconductors
Harmful to eyes, lungs and skin at even low levels. High-level exposure can cause severe burns to the eyes, skin, and gastrointestinal
19
Solar energy in Australia
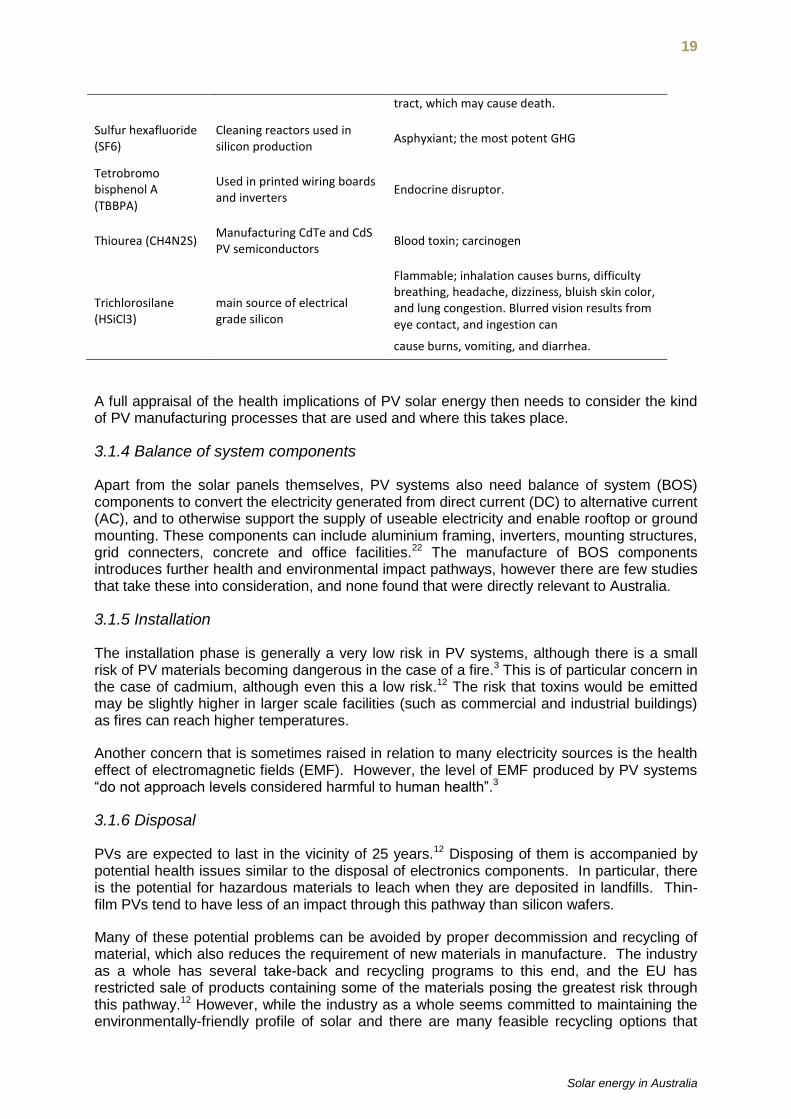
tract, which may cause death.
Sulfur hexafluoride (SF6)
Cleaning reactors used in silicon production
Asphyxiant; the most potent GHG
Tetrobromo bisphenol A (TBBPA)
Used in printed wiring boards and inverters
Endocrine disruptor.
Thiourea (CH4N2S) Manufacturing CdTe and CdS PV semiconductors
Blood toxin; carcinogen
Trichlorosilane (HSiCl3)
main source of electrical grade silicon
Flammable; inhalation causes burns, difficulty breathing, headache, dizziness, bluish skin color, and lung congestion. Blurred vision results from eye contact, and ingestion can
cause burns, vomiting, and diarrhea.
A full appraisal of the health implications of PV solar energy then needs to consider the kind of PV manufacturing processes that are used and where this takes place.
3.1.4 Balance of system components
Apart from the solar panels themselves, PV systems also need balance of system (BOS) components to convert the electricity generated from direct current (DC) to alternative current (AC), and to otherwise support the supply of useable electricity and enable rooftop or ground mounting. These components can include aluminium framing, inverters, mounting structures, grid connecters, concrete and office facilities.22 The manufacture of BOS components introduces further health and environmental impact pathways, however there are few studies that take these into consideration, and none found that were directly relevant to Australia.
3.1.5 Installation
The installation phase is generally a very low risk in PV systems, although there is a small risk of PV materials becoming dangerous in the case of a fire.3 This is of particular concern in the case of cadmium, although even this a low risk.12 The risk that toxins would be emitted may be slightly higher in larger scale facilities (such as commercial and industrial buildings) as fires can reach higher temperatures.
Another concern that is sometimes raised in relation to many electricity sources is the health effect of electromagnetic fields (EMF). However, the level of EMF produced by PV systems “do not approach levels considered harmful to human health”.3
3.1.6 Disposal
PVs are expected to last in the vicinity of 25 years.12 Disposing of them is accompanied by potential health issues similar to the disposal of electronics components. In particular, there is the potential for hazardous materials to leach when they are deposited in landfills. Thin-film PVs tend to have less of an impact through this pathway than silicon wafers.
Many of these potential problems can be avoided by proper decommission and recycling of material, which also reduces the requirement of new materials in manufacture. The industry as a whole has several take-back and recycling programs to this end, and the EU has restricted sale of products containing some of the materials posing the greatest risk through this pathway.12 However, while the industry as a whole seems committed to maintaining the environmentally-friendly profile of solar and there are many feasible recycling options that
20
would substantially reduce waste26, current levels of regulation, especially in non-EU countries, is not enough to mitigate the environmental issues accompanying disposal.
Some studies performed life-cycle analysis of different systems, including one that considered four scenarios for large-scale, ground mounted PV systems. This calculated impacts on human health of between 3.24 – 4.65E-08 disability adjusted life year/kilowatt (DALY/kWh). As noted above, it was manufacturing that generated the biggest health burden.27 Reports containing direct comparisons with other energy sources reveal the significantly lower externalities compared to fossil fuels.19 Furthermore, although emissions of heavy metals such as arsenic, cadmium and lead are of concern in PV manufacturing, one study found that such emissions still remain below those emitted in relation to fossil fuels.26 The comparative impact of solar in relation to coal and gas is considered in further detail in Section 5.
3.2 Solar thermal
There were no identified studies that looked specifically at the health implications of CST, however these are generally predicted to be less than those accompanying PVs as there is less need for intensive manufacturing processes and they do not involve components containing requiring the use of toxic materials. Overall, these considerations suggest that the health impacts of CST will be much less than PV systems. However, some kinds of CST systems have significant water-use impacts, discussed in section 4.
4. Social and environmental impacts
4.1 Social impacts
Unlike many other energy sources, there is little opposition to solar projects in Australia. Social impacts tend to be related to economic benefits from jobs and benefits that may accrue to remote communities, and are mostly positive. While it is beyond the scope of this report to give a detailed analysis of the economic costs and benefits of solar energy, some comparisons that have been made to other energy sources will be considered.
4.1.1 Jobs
There are many jobs related to the production of solar materials, although currently many of these exist in countries that supply the raw materials for Australia’s PV industry.
However, there are also jobs in operations and maintenance, with one Californian study finding that each 100MW of capacity from a CST system was responsible for “94 permanent operations and maintenance jobs, compared with 56 for combined cycle gas and 13 for simple cycle gas turbine plants”29, with a similar figure of 120 jobs per 100MW given by Greenpeace.30 Another benefit arising from these jobs in Australia is that many would be located in remote communities. This could potentially be a source of employment in remote Aboriginal communities that did not involve leaving the community, with some initiatives such as ‘Bushlight’ demonstrating this potential.7
4.2 Environmental impacts
4.2.1 Land use
The land-use required for small-scale solar systems is negligible, although the potential environmental hazards of PV manufacture need to be taken into account when calculating overall environmental impact.

21
Solar energy in Australia
Land requirements for large-scale PVs and CST systems are far more substantial; however they seldom result in resource conflict in Australia. Land use for large-scale PVs and CST systems varies considerably depending on the layout of the solar array, the types of structures they are mounted on and other variables. While one study estimated that approximately 200km2—about 0.5 per cent of the area of the continent—would be able to provide all of Australia’s ‘gross energy use’ from solar power ‘at the conservative figure of 4.5 W/m2’31 , this is much lower than several other estimates that take into account the intermittent nature of solar energy. A report from the Australian Academy of Technological Sciences and Engineering based on a range of estimates estimating that “with current technology a large scale solar thermal farm takes up at least 0.05 km2 for each MW of generating capacity”.19
4.2.2 Water use
Depending on the type of system, large-scale solar can use considerable amounts of water. These requirements can be similar or even higher than conventional fossil fuel plants for some CSP systems32, with some needing to withdraw “as much as 3,500 liters per Megawatt hour (MWh) generated [compared to] 2,000 liters/MWh for new coal-fired power plants and 1,000 liters/MWh for more efficient natural gas combined cycle power plants”.4 However, it has also been suggested that new technologies may cut water use by up to 90 per cent.4
No dedicated reports on the impact this would have on water resources in Australia were identified.
4.3 Greenhouse gas emissions
Although energy generated from solar power does not produce GHG emissions, the production of PV cells and solar thermal facilities does produce emissions, mainly from electricity and fuel use. These will vary according to the energy technologies that are used (such as coal, gas, oil or nuclear), and levels will depend on where materials are produced as well as the degree to which they are recycled. However, there are some studies that provide a useful estimation of the total emissions from production.
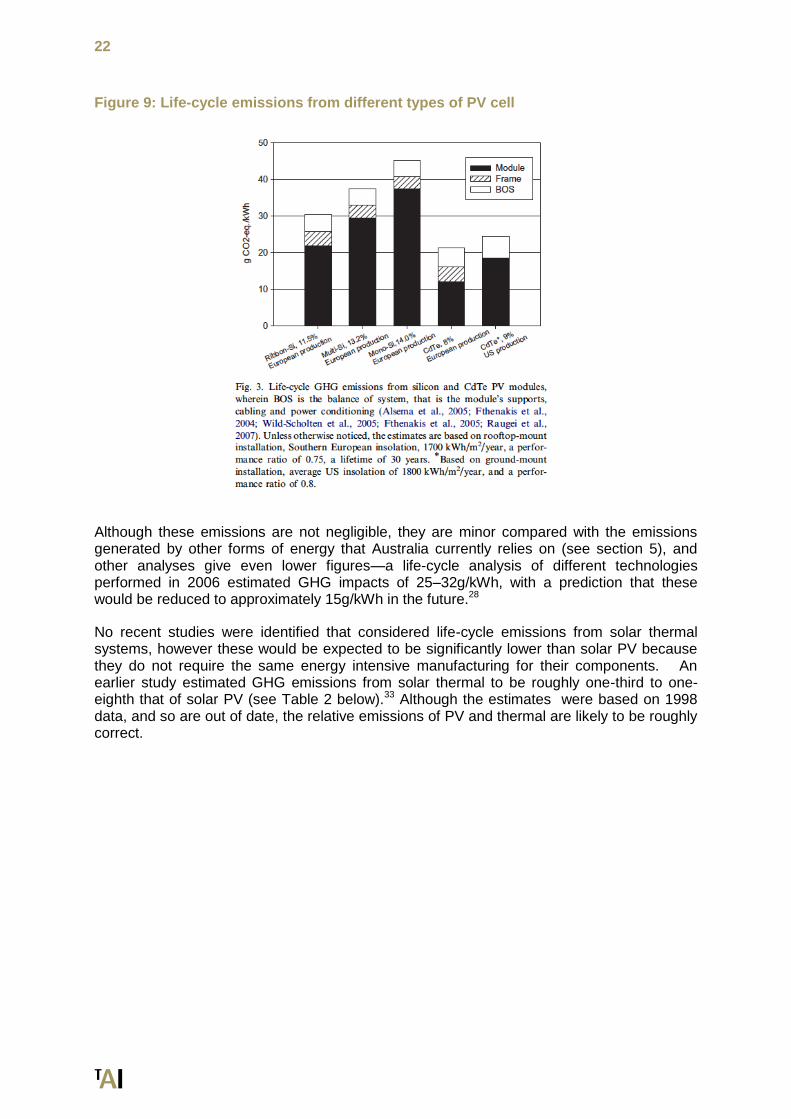
One comprehensive study calculated figures for different types of rooftop mounted PV cells in the US and Europe (Figure 9). These are likely to decrease with improvements in the recycling of materials, and reduction in material and energy use.
22
Figure 9: Life-cycle emissions from different types of PV cell
Although these emissions are not negligible, they are minor compared with the emissions generated by other forms of energy that Australia currently relies on (see section 5), and other analyses give even lower figures—a life-cycle analysis of different technologies performed in 2006 estimated GHG impacts of 25–32g/kWh, with a prediction that these would be reduced to approximately 15g/kWh in the future.28
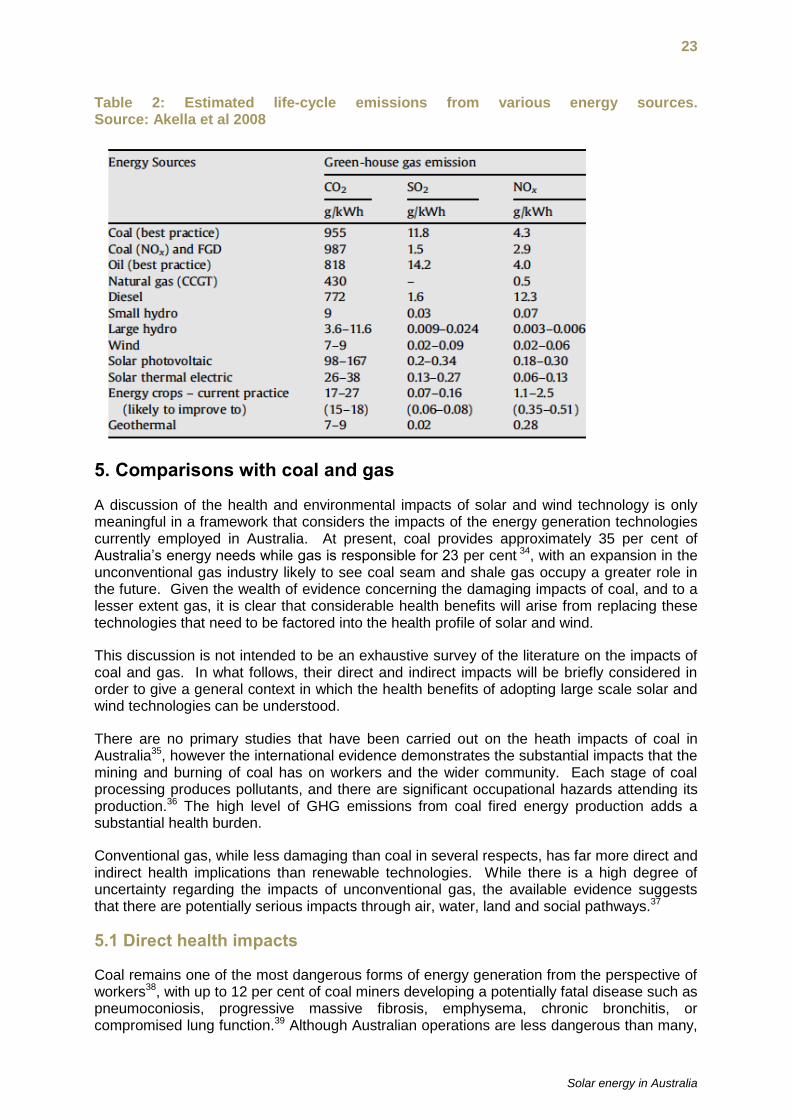
No recent studies were identified that considered life-cycle emissions from solar thermal systems, however these would be expected to be significantly lower than solar PV because they do not require the same energy intensive manufacturing for their components. An earlier study estimated GHG emissions from solar thermal to be roughly one-third to one-eighth that of solar PV (see Table 2 below).33 Although the estimates were based on 1998 data, and so are out of date, the relative emissions of PV and thermal are likely to be roughly correct.
23
Solar energy in Australia
Table 2: Estimated life-cycle emissions from various energy sources. Source: Akella et al 2008
5. Comparisons with coal and gas
A discussion of the health and environmental impacts of solar and wind technology is only meaningful in a framework that considers the impacts of the energy generation technologies currently employed in Australia. At present, coal provides approximately 35 per cent of Australia’s energy needs while gas is responsible for 23 per cent 34, with an expansion in the unconventional gas industry likely to see coal seam and shale gas occupy a greater role in the future. Given the wealth of evidence concerning the damaging impacts of coal, and to a lesser extent gas, it is clear that considerable health benefits will arise from replacing these technologies that need to be factored into the health profile of solar and wind.
This discussion is not intended to be an exhaustive survey of the literature on the impacts of coal and gas. In what follows, their direct and indirect impacts will be briefly considered in order to give a general context in which the health benefits of adopting large scale solar and wind technologies can be understood.
There are no primary studies that have been carried out on the heath impacts of coal in Australia35, however the international evidence demonstrates the substantial impacts that the mining and burning of coal has on workers and the wider community. Each stage of coal processing produces pollutants, and there are significant occupational hazards attending its production.36 The high level of GHG emissions from coal fired energy production adds a substantial health burden.
Conventional gas, while less damaging than coal in several respects, has far more direct and indirect health implications than renewable technologies. While there is a high degree of uncertainty regarding the impacts of unconventional gas, the available evidence suggests that there are potentially serious impacts through air, water, land and social pathways.37
5.1 Direct health impacts
Coal remains one of the most dangerous forms of energy generation from the perspective of workers38, with up to 12 per cent of coal miners developing a potentially fatal disease such as pneumoconiosis, progressive massive fibrosis, emphysema, chronic bronchitis, or compromised lung function.39 Although Australian operations are less dangerous than many,
24
mine collapse, asphyxiation, explosion and diseases from coal dust still represent risks for workers.36
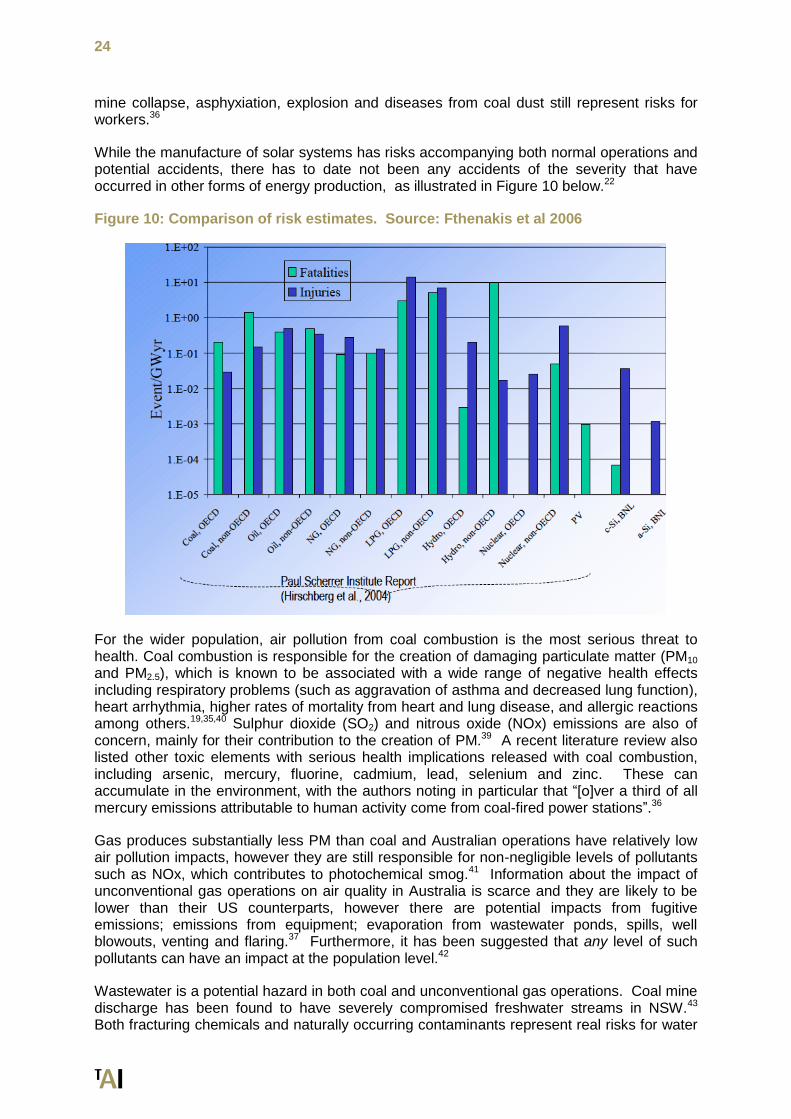
While the manufacture of solar systems has risks accompanying both normal operations and potential accidents, there has to date not been any accidents of the severity that have occurred in other forms of energy production, as illustrated in Figure 10 below.22
Figure 10: Comparison of risk estimates. Source: Fthenakis et al 2006
For the wider population, air pollution from coal combustion is the most serious threat to health. Coal combustion is responsible for the creation of damaging particulate matter (PM10 and PM2.5), which is known to be associated with a wide range of negative health effects including respiratory problems (such as aggravation of asthma and decreased lung function), heart arrhythmia, higher rates of mortality from heart and lung disease, and allergic reactions among others.19,35,40 Sulphur dioxide (SO2) and nitrous oxide (NOx) emissions are also of concern, mainly for their contribution to the creation of PM.39 A recent literature review also listed other toxic elements with serious health implications released with coal combustion, including arsenic, mercury, fluorine, cadmium, lead, selenium and zinc. These can accumulate in the environment, with the authors noting in particular that “[o]ver a third of all mercury emissions attributable to human activity come from coal-fired power stations”.36
Gas produces substantially less PM than coal and Australian operations have relatively low air pollution impacts, however they are still responsible for non-negligible levels of pollutants such as NOx, which contributes to photochemical smog.41 Information about the impact of unconventional gas operations on air quality in Australia is scarce and they are likely to be lower than their US counterparts, however there are potential impacts from fugitive emissions; emissions from equipment; evaporation from wastewater ponds, spills, well blowouts, venting and flaring.37 Furthermore, it has been suggested that any level of such pollutants can have an impact at the population level.42
Wastewater is a potential hazard in both coal and unconventional gas operations. Coal mine discharge has been found to have severely compromised freshwater streams in NSW.43 Both fracturing chemicals and naturally occurring contaminants represent real risks for water
25
Solar energy in Australia
quality in unconventional gas operations37, as illustrated by the recent contamination of an aquifer by naturally occurring uranium.44
The cumulative effect of pollutants from coal fired power generation is notable, with increases in mortality from lung cancer, heart, respiratory and kidney diseases in affected communities. One review of evidence found “[t]he risk of premature death for people living within 30 miles of coal-burning power plants…[has been] quoted to be three to four times that of people living at a distance”.36 In addition, adults living in coal mining communities have been found to be at greater risk of cardiopulmonary disease, chronic obstructive pulmonary disease, hypertension, and lower self-rated health and reduced quality of life generally.35 There are also higher rates of birth defects and low birth weight in children and infants in coal mining communities.35 Considering the combined costs to health from pollutants such as PM, SO2 and NOx, a report on the externalities of energy generation in Australia found the total health damage costs of three of Australia’s coal-fired power stations to be “equivalent to an aggregated national health burden of around $A2.6 billion per annum.”19
The cumulative health effects of unconventional gas extraction are uncertain, however data from several sources demonstrates that such gas developments are responsible for emissions of a complex mixture of pollutants, surpassing those from vehicle traffic in some US regions.45 One measurement of the health risks directly associated with air pollution due to unconventional gas developments in the US estimated cumulative cancer risks at “6 in a million for residents >1/2 from wells and 10 in a million for residents ≤1/2 mile from wells”46, while another indicated adverse effects on infant health, identifying several potential health pathways.47
In addition to health effects from air and water pollution, coal operations are also connected to increased road traffic accidents and have been associated with increases in criminal and other anti-social behaviours.35 Evidence indicates similar issues arising in gas operations, and in particular there are concerns over the use of fly-in/fly-out workers.48
5.2 Indirect health impacts
One of the most serious health impacts from fossil fuels is the release of greenhouse gases. Coal fired power plants produce around 1000 kg of CO2e per megawatt hour39,41,49—the highest level of GHG emissions per unit energy of any form of energy generation. A WHO study estimated that “global warming that has occurred since the 1970s caused over 140 000 excess deaths annually by the year 2004” 50, primarily through the impact of malnutrition, diarrhoea, malaria, floods, and cardiovascular disease in developing countries. While it is impossible to precisely calculate the causal effect of coal power on health through its influence on climate change, it is clear that Australia’s reliance on coal for use domestically and for export burdens us with a considerable moral responsibility.
While conventional gas fares somewhat better in respect to GHG release, with many reports estimating its combustion is responsible for approximately half (or less) the CO2e emissions of coal51, this remains a substantial amount in absolute terms. Furthermore, debate over the GHG impact of fugitive methane emissions renders such figures uncertain at best for unconventional gas, with some estimates suggesting it offers no GHG advantages over coal.52,53 The GHG emissions from solar and wind technologies are by comparison negligible, and mostly arise from the non-renewable energy technologies used in their production.19
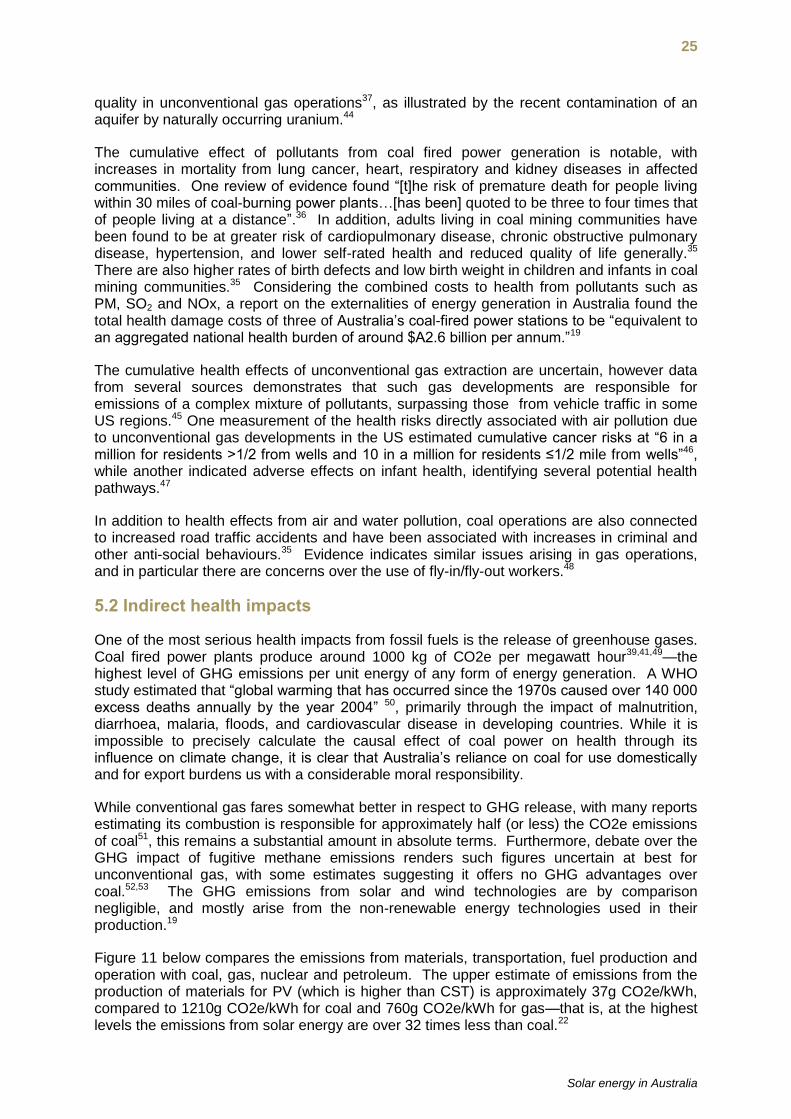
Figure 11 below compares the emissions from materials, transportation, fuel production and operation with coal, gas, nuclear and petroleum. The upper estimate of emissions from the production of materials for PV (which is higher than CST) is approximately 37g CO2e/kWh, compared to 1210g CO2e/kWh for coal and 760g CO2e/kWh for gas—that is, at the highest levels the emissions from solar energy are over 32 times less than coal.22
26
Figure 11: Comparison of emissions from PV and conventional power plants
Coal and gas production is also responsible for considerable environmental damage through water, air and land pathways. For coal, this includes damage through acidification affecting land and water (especially from sulphurous black coal), eutrophication (responses by the water system to additional substances, such as algal blooms or reduced oxygen content) and waste such as ash.41 The production of coal fired energy also requires substantial water use, with the five coal plants in the Latrobe Valley using 125 billion litres annually—approximately 13-17GL a year per 1000 MW plant, or the equivalent of about one third of Melbourne’s water supply.54 This creates resource competition that is likely to be further exacerbated by climate change.
The environmental impact of unconventional gas in Australia is uncertain, however some degradation of land and water is likely, and a potential for serious negative impacts on biodiversity and ecosystem health.37
5.3 Comparative profile
It is obvious that the technologies currently providing the majority of Australia’s energy needs place a considerable burden on human health. A review of the international evidence for coal’s effects found that there “are clear indications …that there are serious health and social harms associated with coal mining and coal-fired power stations for people living in surrounding communities”.35 While conventional gas is somewhat less impactful, the negative effects are also substantially higher than any renewable energy alternative. The impacts of extracting coal seam and shale gas using fracturing is beset with uncertainty, however there are several serious concerns.
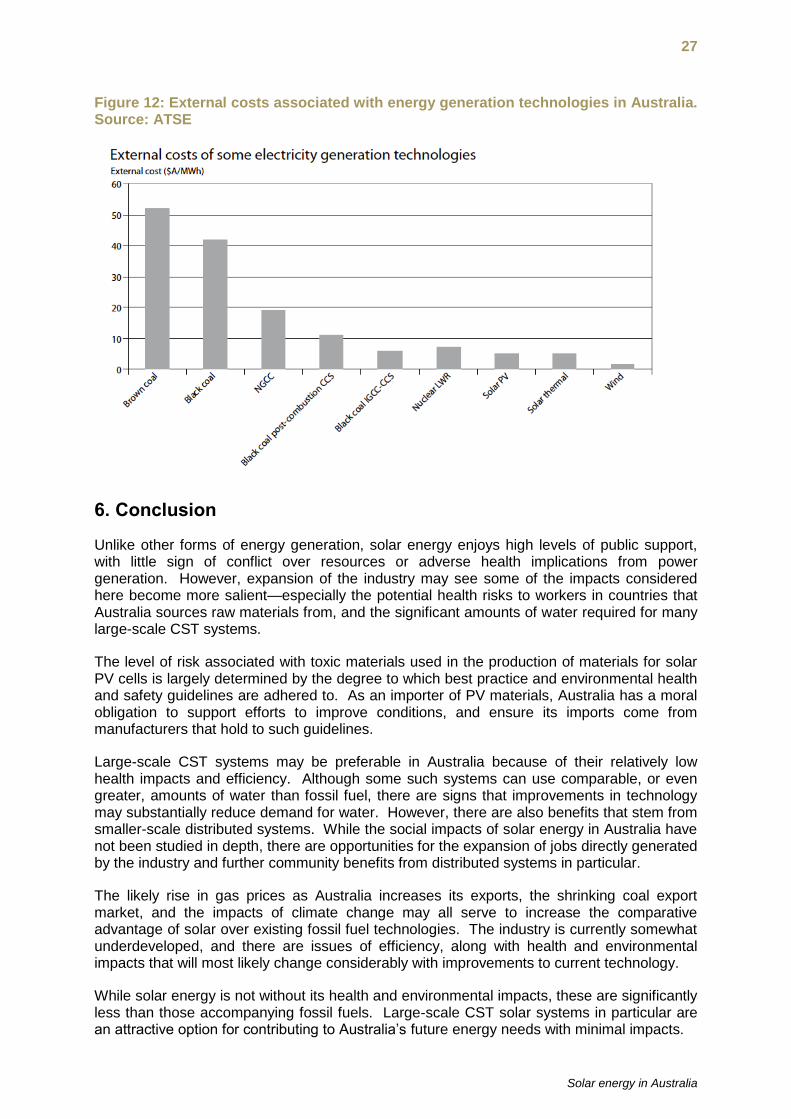
Comparing the externalities generated by coal, gas and renewable energy, the Australian Academy of Technological Sciences and Engineering estimated costs of “$A19/MWh for natural gas, $A42/MWh for black coal and $A52/MWh for brown coal” compared to “$A5/MWh for solar photovoltaic electricity and $A1.50/MWh for wind power” (Figure 12 below).19 These figures are likely to underestimate the health impacts of solar that occur in the manufacturing stage, and do not include a consideration of the potential impacts of land and water use. However, even if a true reflection of the externalities of solar requires a substantial increase in these figures, it is highly unlikely they would approach externalities of fossil fuels, which are estimated at four to ten times as high. These figures are indicative of the substantial health benefits that would attend the replacement of coal and gas with the adoption of large-scale solar and wind technologies.
27
Solar energy in Australia
Figure 12: External costs associated with energy generation technologies in Australia. Source: ATSE
6. Conclusion
Unlike other forms of energy generation, solar energy enjoys high levels of public support, with little sign of conflict over resources or adverse health implications from power generation. However, expansion of the industry may see some of the impacts considered here become more salient—especially the potential health risks to workers in countries that Australia sources raw materials from, and the significant amounts of water required for many large-scale CST systems.
The level of risk associated with toxic materials used in the production of materials for solar PV cells is largely determined by the degree to which best practice and environmental health and safety guidelines are adhered to. As an importer of PV materials, Australia has a moral obligation to support efforts to improve conditions, and ensure its imports come from manufacturers that hold to such guidelines.
Large-scale CST systems may be preferable in Australia because of their relatively low health impacts and efficiency. Although some such systems can use comparable, or even greater, amounts of water than fossil fuel, there are signs that improvements in technology may substantially reduce demand for water. However, there are also benefits that stem from smaller-scale distributed systems. While the social impacts of solar energy in Australia have not been studied in depth, there are opportunities for the expansion of jobs directly generated by the industry and further community benefits from distributed systems in particular.
The likely rise in gas prices as Australia increases its exports, the shrinking coal export market, and the impacts of climate change may all serve to increase the comparative advantage of solar over existing fossil fuel technologies. The industry is currently somewhat underdeveloped, and there are issues of efficiency, along with health and environmental impacts that will most likely change considerably with improvements to current technology.
While solar energy is not without its health and environmental impacts, these are significantly less than those accompanying fossil fuels. Large-scale CST solar systems in particular are an attractive option for contributing to Australia’s future energy needs with minimal impacts.
28
References
1. Wright, Matthew, and Patrick Heaps (2013). "Australian Sustainable Energy: Zero Carbon Australia Stationary Energy Plan." Beyond Zero Emissions.
2. Fthenakis, Vasilis M., Hyung Chul Kim, and Erik Alsema. (2008). "Emissions from Photovoltaic Life Cycles." Environmental Science & Technology 42 (6): 2168-74.
3. "Health and Safety Concerns of Photovoltaic Solar Panels." Oregon Government, 2013.
4. Bucknall, Julia. "Cutting Water Consumption in Concentrated Solar Power Plants." In The Water Blog, 2013. Available at: http://blogs.worldbank.org/water/cutting-water-consumption-concentrated-solar-power-plants-0
5. Fthenakis, V. M., and H. C. Kim. (2011). "Photovoltaics: Life-Cycle Analyses." Solar Energy 85(8): 1609-28.
6. Kammen, D. M., K. Kapadia, et al. (2004). Putting Renewables to Work: How many jobs can the clean energy industry generate? RAEL Report, University of California, Berkeley
7. Pittock, B. (2011). "Co-benefits of large-scale renewables in remote Australia: energy futures and climate change." Rangeland Journal 33(4): 315-325
8. Rabl, A. and M. Dreicer (2002). "Health and environmental impacts of energy systems." International Journal of Global Energy Issues 18(2-4): 113-150
9. Markandya, A. and P. Wilkinson (2007). "Energy and Health 2: Electricity generation and health." The Lancet 370(9591): 979-990
10. Grudnoff, M. (2013). “Cooking up a price rise: will CSG exports push up the price of gas?”, The Australia Institute.
11. Geoscience Australia and ABARE (2010). “Australian Energy Resource Assessment” Canberra: Geoscience Australia.
12. Mulvaney, D., V. Bolam, et al. (2009). “Toward a Just and Sustainable Solar Energy Industry”, Silicon Valley Toxics Coalition.
13. Cha, A. E. (2008) "Solar Energy Firms Leave Waste Behind." The Washington Post. Sunday March 9. Available at: http://www.washingtonpost.com/wp-dyn/content/article/2008/03/08/AR2008030802595.html
14. International Energy Agency (2010). “Solar Energy Perspectives”. Available at: http://www.iea.org/publications/freepublications/publication/Solar_Energy_Perspectives2011.pdf
15. Morris, N. (2014) "Abbott's systematic destruction of solar support in Australia continues." Renew Economy. Available at: http://reneweconomy.com.au/2014/abbotts-systematic-destruction-solar-support-australia-continues-76819
16. Fthenakis, V., H. C. Kim, et al. (2009). “Nanomaterials in PV manufacture: some life cycle environmental and health considerations”. 34th IEEE Photovoltaic Specialists Conference, Vols 1-3: 1068-1073.
17. Akorede, M. F., H. Hizam, et al. (2010). "Distributed energy resources and benefits to the environment." Renewable & Sustainable Energy Reviews 14(2): 724-734.
29
Solar energy in Australia
18. National Research Council of the National Academies (2009). Hidden Costs of Energy: Unpriced Consequences of Energy Production and Use. Washington, D.C, The National Academies Press.
19. Biegler, T. and D. Zhang (2009). The Hidden Costs of Electricity: Externalities of Power Generation in Australia. Parkville, Victoria, The Australian Academy of Technological Sciences and Engineering.
20. Australian PV Association (2014) personal communication. 11 March 2014.
21. Solarbuzz (2013). Polysilicon and Wafer Supply Chain Quarterly. Available at: http://www.solarbuzz.com/reports/polysilicon-and-wafer-supply-chain-quarterly
22. V.M, F., K. H.C, et al. (2006). Evaluation of Risks in the Life Cycle of Photovoltaics in a Comparative Context. 21st European Photovoltaic Solar Energy Conference. Dresden, Germany.
23. Taylor, D. A. (2010). "On the job with solar PV." Environmental Health Perspectives 118(1).
24. Sinha, P., R. Balas, et al. (2012). "Fate and transport evaluation of potential leaching risks from cadmium telluride photovoltaics." Environmental Toxicology and Chemistry 31(7): 1670-1675.
25. Brayner, R. (2008). "The toxicological impact of nanoparticles." Nano Today 3(1-2): 48-55.
26. Fthenakis, V. M. (2000). "End-of-life management and recycling of PV modules." Energy Policy 28(14): 1051-1058.
27. Beylot, A., J. Payet, et al. (2011). Environmental impacts of large-scale grid-connected ground-mounted PV installations. World Renewable Energy Congress. Sweden.
28. Alsema, E. A., M. J. d. Wilde-Scholten, et al. (2006). Environmental impacts of PV electricity generation - a critical comparison of energy supply options. 21st European photovoltaic solar energy conference. Dresden, Germany.
29. Stoddard, L., J. Abiecunas, et al. (2006). Economic, energy and environmental benefits of concentrating power in California. National Renewable Energy Laboratory.
30. Jay Rutovitz, A. Atherton, et al. (2009). Working for the climate: renewable energy and the green job revolution. Greenpeace, European Renewable Energy Council.
31. Seligman, P. (2010). Australian sustainable energy - by the numbers. Melbourne Energy Institute.
32. Macknick, J., R. Newmark, et al. (2012). "Operational water consumption and withdrawal factors for electricity generating technologies: a review of existing literature." Environmental Research Letters 7.
33. Akella, A. K., R. P. Saini, et al. (2009). "Social, economical and environmental impacts of renewable energy systems." Renewable Energy 34(2): 390-396.
34. Nhu Che, A. Feng, et al. (2013). 2013 Australian Energy Update. Bureau of Resources and Energy Economics. Available at: http://www.bree.gov.au/sites/default/files/files//publications/aes/2013-australian-energy-statistics.pdf
30
35. Colagiuri, R., J. Cochrane, et al. (2012). Health Harms and Social Harms of Coal Mining in Local Communities: a review Beyond Zero Emissions, Health and Sustainability Unit, and the Boden Institute for Obesity, Nutrition and Exercise, Sydney University.
36. Castleden, W. M., D. Shearman, et al. (2011). "The mining and burning of coal: effects on health and the environment." Medical Journal of Australia 195: 333-335.
37. Moss, J., A. Coram and G. Blashki (2013). Is fracking good for your health? An analysis of the impacts of unconventional gas on health and climate. Australia Institute. Available at: http://www.tai.org.au/content/fracking-good-your-health
38. Burgherr, P., P. Eckle, et al. (2012). "Comparative assessment of severe accident risks in the coal, oil and natural gas chains." Reliability Engineering & System Safety 105: 97-103.
39. Markandya, A. and P. Wilkinson (2007). "Energy and Health 2: Electricity generation and health." The Lancet 370(9591): 979-990.
40. Kjellstrom TE, Neller A, Simpson RW (2002). “Air pollution and its health impacts: the changing panorama”. Medical Journal of Australia 177: 604-608.
41. May, J. R. and D. J. Brennan (2003). "Life Cycle Assessment of Australian fossil energy options." Process Safety and Environmental Protection 81(B5): 317-330.
42. Rabl A, Spadaro JV (2000). Public health impact of air pollution and implications for the energy system. Annual Review of Energy and the Environment. 25:601-27
43. Ian A. Wright (2011). “Coal mine ‘dewatering’ of saline wastewater into NSW streams and rivers: a growing headache for water pollution regulators”. Proceedings of the 6th Australian Stream Management Conference. Canberra, ACT. Available at: http://www.epa.nsw.gov.au/resources/endeavourcoal/DrIWrightAppendix2.pdf
44. Australian Associated Press (2014) “Santos fined after coal seam gas project contaminates aquifer ‘with uranium’”. The Guardian 8 March. Available at: http://www.theguardian.com/world/2014/mar/08/santos-fined-coal-seam-gas-contaminates-aquifer-uranium.
45. Armendariz, A. (2009) Emissions from Natural Gas Production in the Barnett Shale Area and Opportunities for Cost-Effective Improvements. Southern Methodist University.
46. McKenzie LM, Witter RZ, Newman LS, et al. (2012) “Human health risk assessment of air emissions from development of unconventional natural gas resources. Science of the Total Environment 424:79-87.
47. Hill, Elaine L. (2012). Natural Gas Operations and Infant Health (Preliminary Draft). Cornell University.
48. House of Representatives Standing Committee on Regional Australia (2013). Cancer of the bush or salvation for our cities? Fly-in, fly-out and drive-in, drive-out workforce practices in Regional Australia. Canberra.
49. Fulton, M., N. Mellquist, et al. (2011). Comparing Life-Cycle Greenhouse Gas Emissions from Natural Gas and Coal. Worldwatch Institute.
50. WHO (2013). “Climate change and health”. Fact sheet 266. Available at: http://www.who.int/mediacentre/factsheets/fs266/en/
http://www.theguardian.com/world/2014/mar/08/santos-fined-coal-seam-gas-contaminates-aquifer-uranium
31
Solar energy in Australia
51. Day, S., Connell, L. et al. (2012). Fugitive Greenhouse Gas Emissions from Coal Seam Gas Production in Australia. CSIRO.
52. Howarth RW, Santoro R, Ingraffea A. (2011). “Methane and the greenhouse-gas footprint of natural gas from shale formations”. Climate Change 106: 679-90.
53. Rella, C. W., E. Crosson, et al. (2013). Quantifying the relative contribution of natural gas fugitive emissions to total methane emissions in Colorado and Utah using mobile d13CH4 analysis. Picarro Inc., University of Colorado and National Oceanic and Atmospheric Administration
54. Environment Victoria. Coal and water use. Available at: http://environmentvictoria.org.au/index.php?q=content/coal-and-water-use#.U7UgScKKDZ4
55. "Energy in Australia." Bureau of Resources and Energy Economics, 2013. Available at: http://www.bree.gov.au/files/files/publications/energy-in-aust/bree-energyinaustralia-2013.pdf