Conceptual understanding - Purdue Universityxuanyaoh/stat350/xyApr18Lec30.pdf · Conceptual...
13
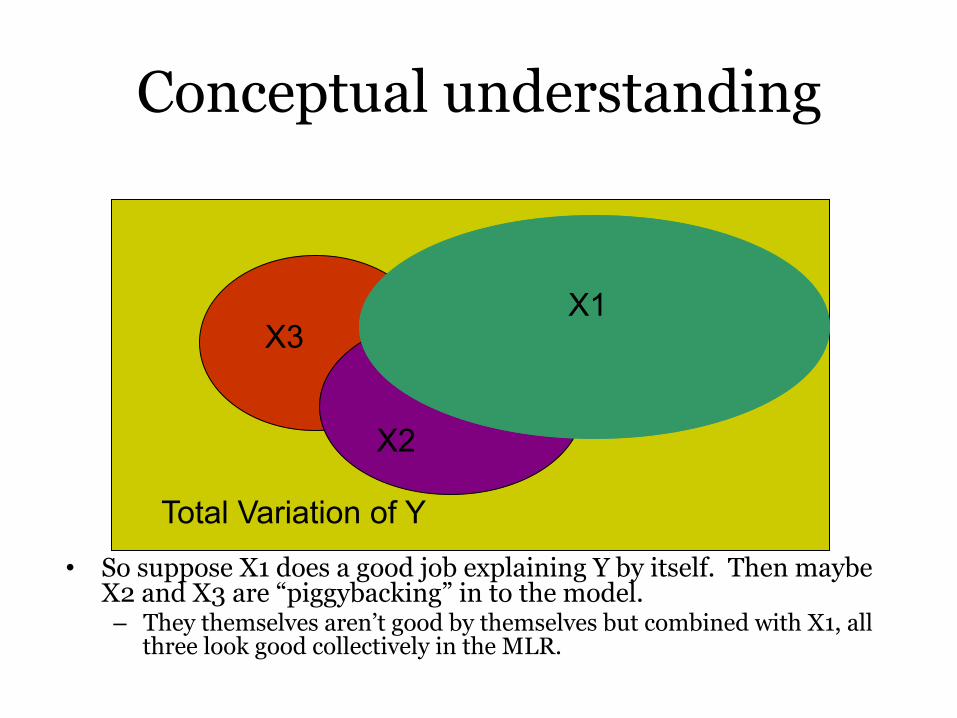
Conceptual understanding • So suppose X1 does a good job explaining Y by itself. Then maybe X2 and X3 are “piggybacking” in to the model. – They themselves aren’t good by themselves but combined with X1, all three look good collectively in the MLR. X1 X2 X3 Total Variation of Y
Transcript of Conceptual understanding - Purdue Universityxuanyaoh/stat350/xyApr18Lec30.pdf · Conceptual...
Conceptual understanding
• So suppose X1 does a good job explaining Y by itself. Then maybe X2 and X3 are “piggybacking” in to the model. – They themselves aren’t good by themselves but combined with X1, all
three look good collectively in the MLR.
X1
X2
X3
Total Variation of Y
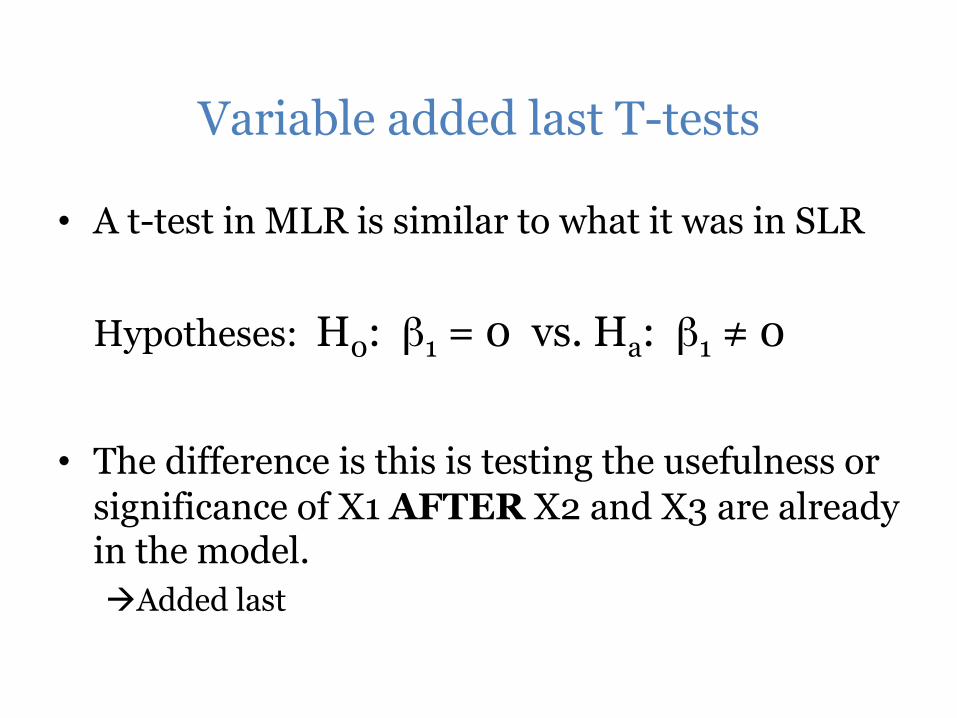
Variable added last T-tests
• A t-test in MLR is similar to what it was in SLR
Hypotheses: H0: β1 = 0 vs. Ha: β1 ≠ 0
• The difference is this is testing the usefulness or significance of X1 AFTER X2 and X3 are already in the model. àAdded last
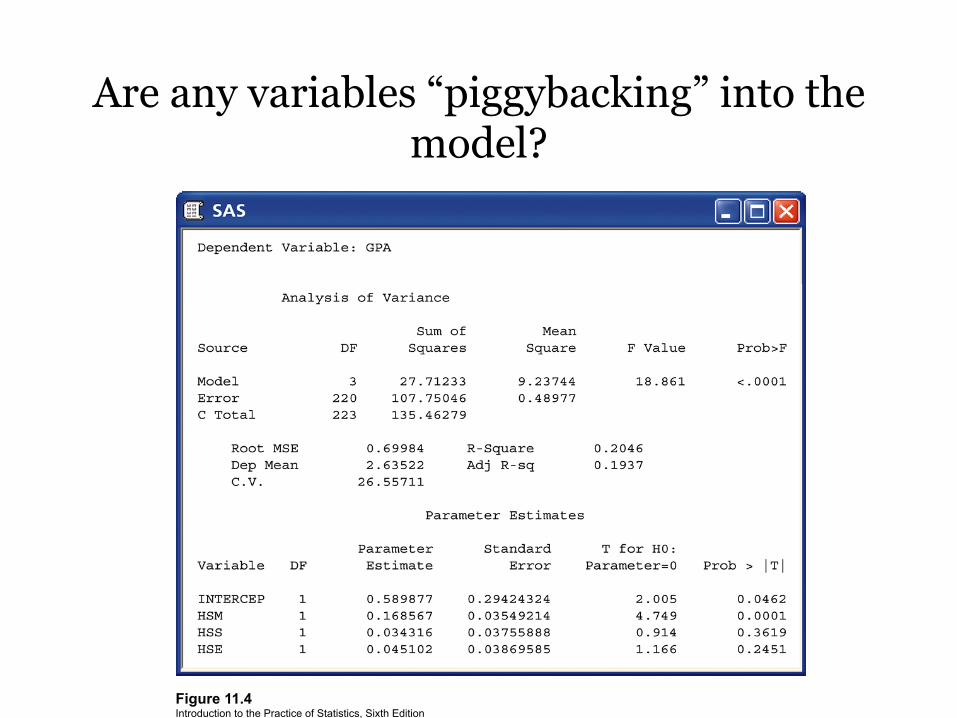
Figure 11.4 Introduction to the Practice of Statistics, Sixth Edition © 2009 W.H. Freeman and Company
Are any variables “piggybacking” into the model?
Variable added last T-tests
• So both X2 and X3 aren’t significant added last – The backward elimination procedure removes ONLY
the single worst predictor, then reruns the MLR with all remaining variables
• NOTE: this changes the entire MLR model • Since X2 is the least significant added last, it is
removed… • What will the new model be without X2?
Nothing! is the same when the model changes
• Changes in MLR if the model changes: – The MLR regression line – Parameter estimates – Predicted values, Residuals – R-square – ANOVA table – F-test, T-tests – Assumptions – EVERYTHING!!!
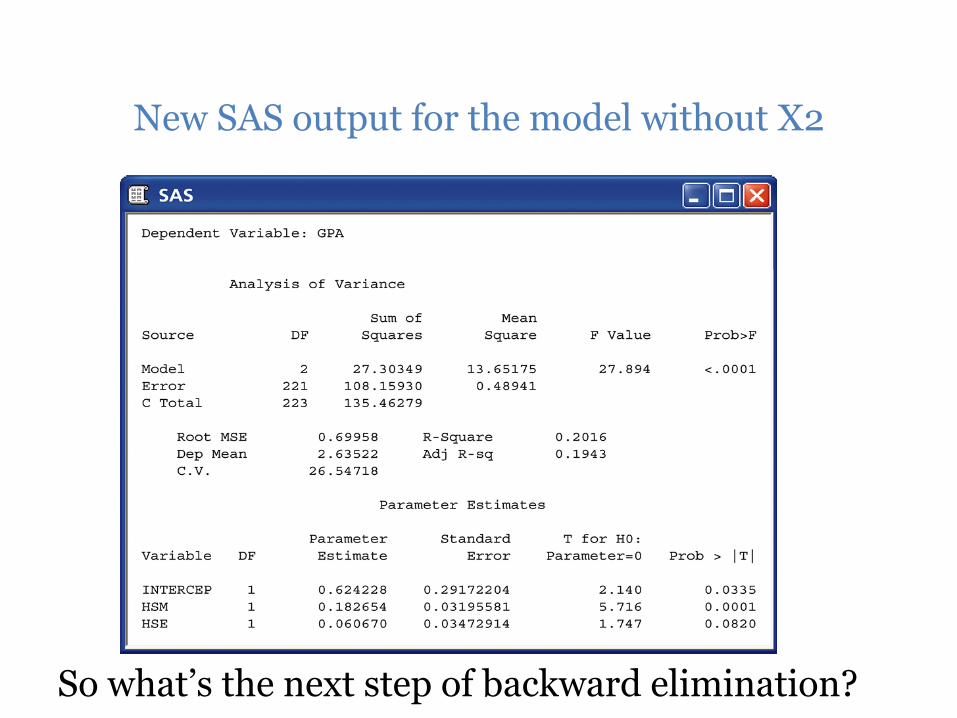
New SAS output for the model without X2
So what’s the next step of backward elimination?
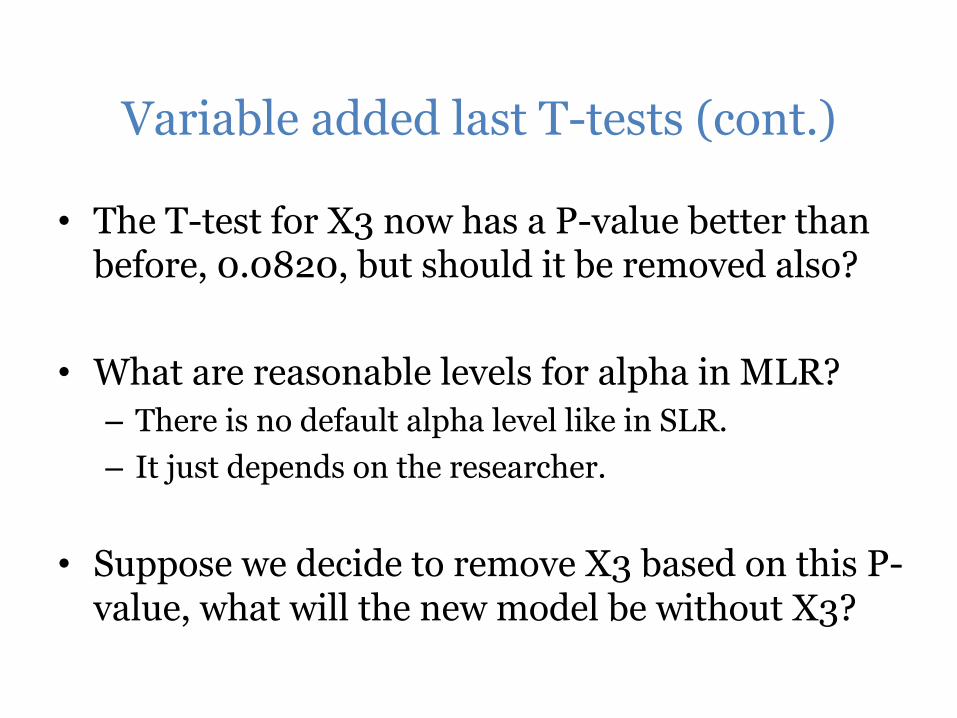
Variable added last T-tests (cont.)
• The T-test for X3 now has a P-value better than before, 0.0820, but should it be removed also?
• What are reasonable levels for alpha in MLR? – There is no default alpha level like in SLR. – It just depends on the researcher.
• Suppose we decide to remove X3 based on this P-value, what will the new model be without X3?
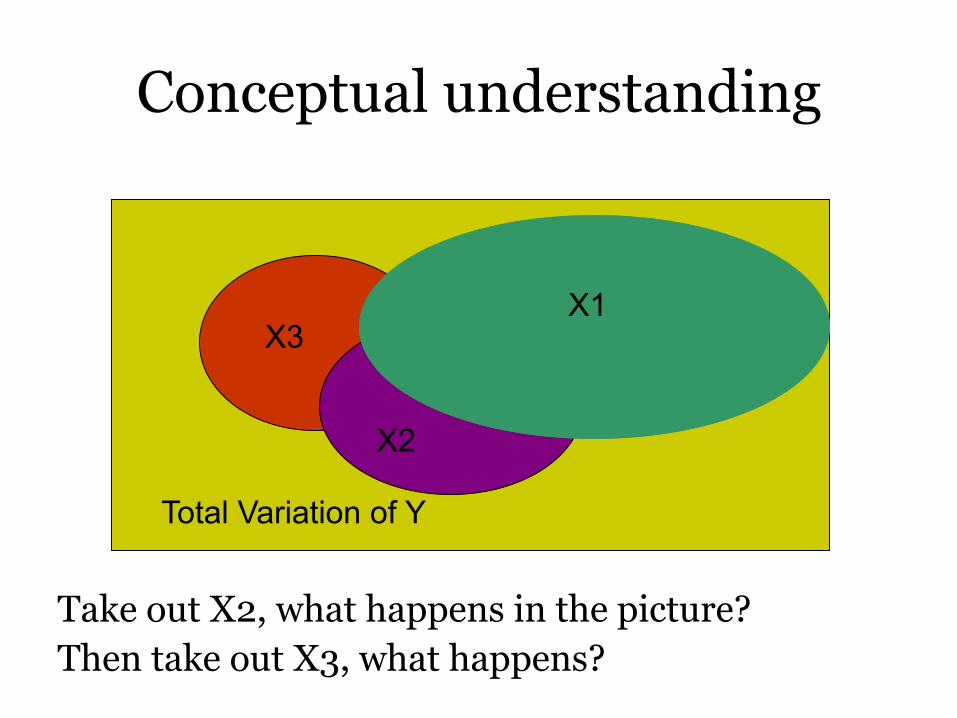
Conceptual understanding
X1
X2
X3
Total Variation of Y
Take out X2, what happens in the picture? Then take out X3, what happens?
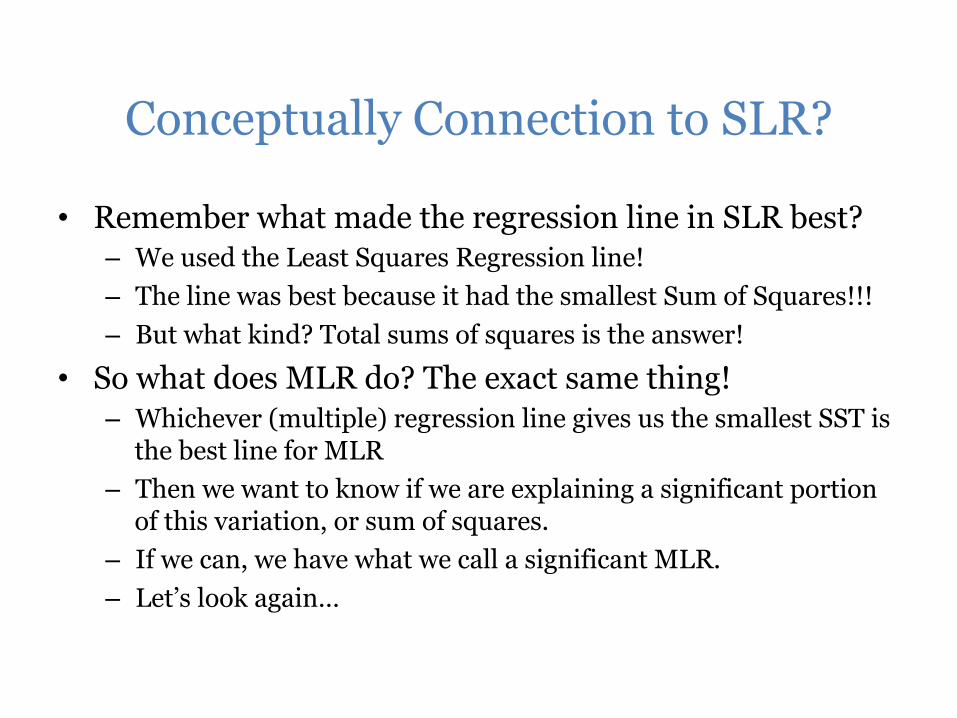
Conceptually Connection to SLR?
• Remember what made the regression line in SLR best? – We used the Least Squares Regression line! – The line was best because it had the smallest Sum of Squares!!! – But what kind? Total sums of squares is the answer!
• So what does MLR do? The exact same thing! – Whichever (multiple) regression line gives us the smallest SST is
the best line for MLR – Then we want to know if we are explaining a significant portion
of this variation, or sum of squares. – If we can, we have what we call a significant MLR. – Let’s look again…
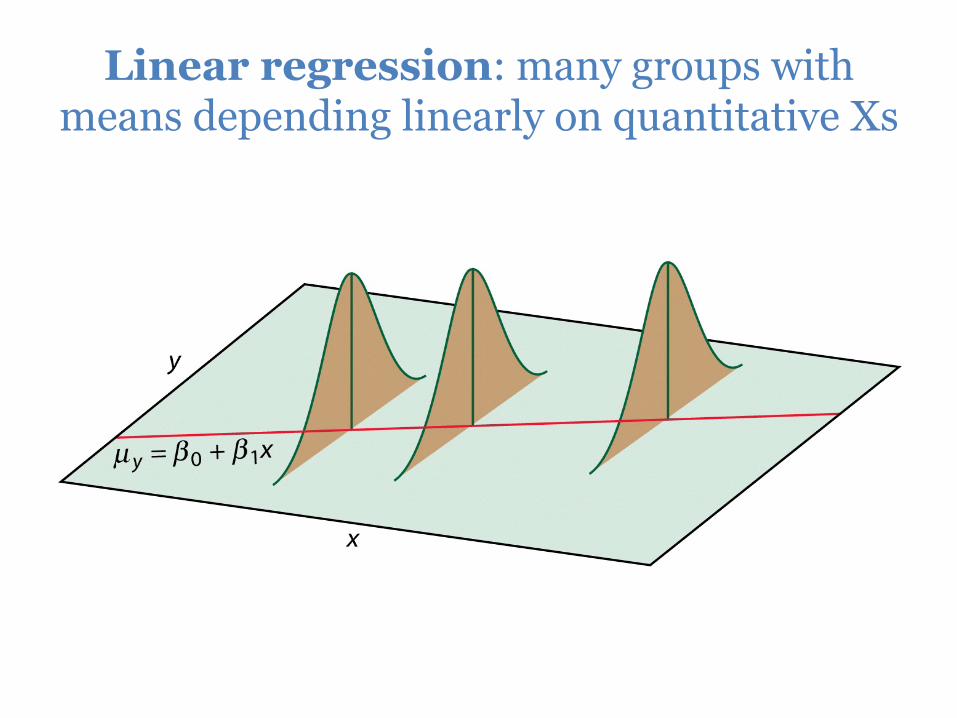
Linear regression: many groups with means depending linearly on quantitative Xs
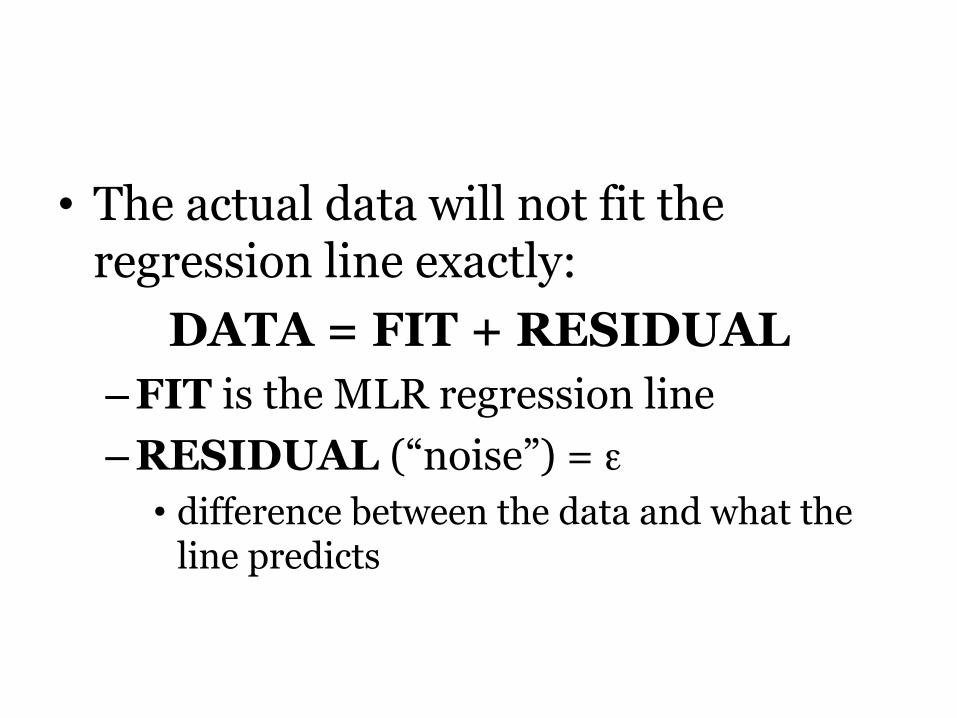
• The actual data will not fit the regression line exactly:
DATA = FIT + RESIDUAL – FIT is the MLR regression line – RESIDUAL (“noise”) = ε
• difference between the data and what the line predicts
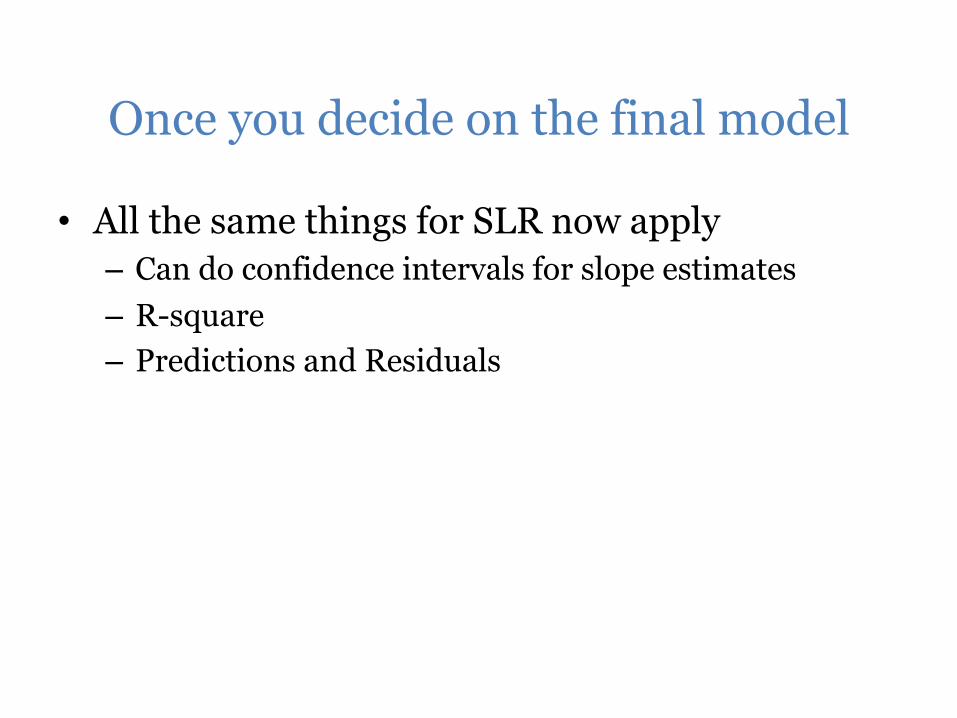
Once you decide on the final model
• All the same things for SLR now apply – Can do confidence intervals for slope estimates – R-square – Predictions and Residuals
Are we done? Well, sorta…
• Did we get all significant predictors? – Yes! According to the original model containing X1,
X2, and X3, we chose the best predictors. – No way! We could have left out predictors to begin
with. • There could be other predictors that do a better job than all 3
of HSM, HSS, and HSE. So what about them? • Book continues the GPA example with a look at adding two
more potential predictors, SATM and SATV, Math and Verbal scores from the SAT exam.
• So are we done?