
Competitiveness Promotion and Clusters In … Porter of Harvard, author of numerous books on...
102
Competitiveness Promotion and Clusters In Colombia and El Salvador FINAL REPORT James W. Fox Louis Berger Group, Inc. November 2003
Transcript of Competitiveness Promotion and Clusters In … Porter of Harvard, author of numerous books on...
Competitiveness Promotion and Clusters
In Colombia and El Salvador
FINAL REPORT
James W. Fox
Louis Berger Group, Inc.
November 2003
Report on Competitiveness Promotion In Colombia & El Salvador Final Report
The Louis Berger Group, Inc. i
Table of Contents
Chapter 1. What is “Competitiveness” All About? .............................................1
1.1 Introduction..............................................................................................1 1.2 Clustering, Value Chains, and Productivity.............................................5 1.3 Empirical Research on Cluster Issues......................................................9 1.4 Designs for Competitiveness Promotion .................................................12
Chapter 2. Colombian Experience with Promotion of Competitiveness ...........16 2.1 The Country Economic Context ..............................................................16 2.1.1 Background............................................................................16 2.1.2 Economic Policies..................................................................16 2.1.3 Trade Policy ...........................................................................17 2.1.4 Trade Institutions ...................................................................17 2.2 Colombian Trade Performance ..........................................................18 2.3 The Colombian Competitiveness Effort ............................................21
2.3.1 Initial Efforts to Promote Competitiveness............................21 2.3.2 Current Programs ...................................................................23
2.3.2.1 Encuentros Nacionales...............................................23 2.3.2.2 Specialized Networks.................................................25 2.3.2.3 Convenios de Competitividad Exportadora ...............25 2.3.2.4 CARCEs and Regional Development Efforts............31
2.4 Indicators of Changes in Colombian Export Competitiveness ..........32
2.4.1 Export Statistics .....................................................................32 2.4.2 Other Indicators of Change....................................................34
2.5 Conclusions ....................................................................................35 2.5.1 The Competitiveness Program...............................................35 2.5.2 The Policy Context ................................................................36 2.5.3 Country Environment.............................................................37
Chapter 3. Promotion of Competitiveness in El Salvador ..................................38 3.1 The Country Economic Context .............................................................38 3.1.1 Background............................................................................38 3.1.2 Economic Policies..................................................................39 3.1.3 Trade Policy ...........................................................................41 3.1.4 Trade Institutions ...................................................................42

Report on Competitiveness Promotion In Colombia & El Salvador Final Report
The Louis Berger Group, Inc. ii
3.2 Salvadoran Trade Performance..........................................................45 3.2.1 Overall Trends .......................................................................45 3.2.2 Trends in Specific Sectors .....................................................46 3.3 The Salvadoran Competitiveness Effort ............................................49
3.3.1 Cluster Promotion ..................................................................50 3.3.2 Results from the Cluster Experiment.....................................52 3.3.3 Conclusions about Clusters………………………………....57
3.3.4 Other Competitiveness Promotion Activities ........................58
3.4 Indicators of Changes in Salvadoran Competitiveness......................58 3.4.1 Export Statistics .....................................................................58 3.4.2 Other Indicators of Progress ..................................................60
3.5 Conclusions… ....................................................................................61
Chapter 4. Measuring National Performance in Competitiveness.....................62
4.1 Introduction ....................................................................................62 4.2 The Global Competitiveness Report (GCR) ............................................62 4.2.1 The Methodology of of the GCR...........................................62
4.2.2 Evaluation of the Methodology ............................................64 4.2.3 Performance of El Salvador and Colombia in the GCR .......65 4.2.4 Using the GCR in Assessing Competitiveness Programs.....67 4.3 The World Bank’s Doing Business Database ..........................................68 4.4 Other Measures of Country Competitiveness ..........................................71 4.5 Comparing the Three Indices...................................................................72
Chapter 5. Summary Comments and Conclusions ...............................................73 5.1 Monitoring and Evaluation………………………………………….. .... 73 5.1.1 Tracking Performance During Implementation………….…. 73 5.1.2 Longer – Term Impact Measurement ……………………....75 5.2 Comparing the Two Cases………….…………………………………....76 5.3 Conclusions: What Can Donors Do? .........................................................77 5.3.1 Competitiveness- Specific Recommendations……………….. .77 5.3.2 Broader Recommendations……………………….…………....79 Appendix 1 Bibliography ....................................................................................80 Appendix 2 Specific Components of the Global Competitiveness Report............85 Appendix 3 Persons Interviewed...........................................................................87 Appendix 4 Sectoral Agreements in Colombia .....................................................89 Appendix 5 Scope of Work ...................................................................................90
Report on Competitiveness Promotion In Colombia & El Salvador Final Report
The Louis Berger Group, Inc. 1
Those who say the future is coming rapidly toward us are wrong. The future is really rushing away from us, and we have to hurry after it, or be left behind.
--Author Unknown
1. What is “Competitiveness” All About?1 1.1 Introduction
The proper meaning of the word competitiveness has been debated in recent years, usually with economists on one side, and others, including business theorists, on the other. To most economists, competitiveness means that suppliers of products or of factors of production are able to meet a market test. That is, others will purchase their good or service at a market price that covers the marginal costs of production. By definition, non-competitive firms will eventually disappear, for their operation is unsustainable since the sales price does not cover expenses.
There is general agreement on the economic interpretation of competitiveness.
The problem comes when the same term is used to refer to countries. Countries are not business units that will disappear if their products cannot find favor abroad. Instead, exchange rates and terms of trade will adjust so that the country finds itself in an economic position consistent with the capabilities of its economic units, its factor endowments of land, labor and capital, and the quality of its economic, political and social institutions. Countries with low capacity to produce goods and services will sell little to others, and consequently be able to buy little, and are likely to be poor. But they are not “uncompetitive,” just unproductive. 2
From the business school approach, competitiveness is related to choices about
technology, management, and markets. This approach is not viewed as fixed in proportion based on natural conditions, but rather as the result of choices made by firms. In its more nuanced form, analysts reviewing a country’s potential competitiveness use the term to encapsulate efforts to promote increased productivity and productive capability in developing countries. The basic concepts draw heavily on the ideas of
1 This report is an analysis of the existing information base on the concept of competitiveness, as a microeconomic tool for promotion of productivity growth. It draws upon the available literature and field visits to Colombia and El Salvador to explore the experience in this emerging area. The fieldwork in each country took place over 2-3 weeks, and included interviews with 35-40 leaders from business, government, and academia. The study was commissioned by the Inter-American Development Bank. The scope of work for the study is at Appendix 5. 2 Paul Krugman has been the most articulate opponent of the idea of competitiveness. He writes “competitiveness is a meaningless word when applied to national economies. And the obsession with competitiveness is both wrong and dangerous” (Krugman, 1994, p. 44). He goes on to argue that advocates of measures to improve national competitiveness are either nationalistic or ideological, and that they misunderstand (or refuse to consider) simple economic theory.

Report on Competitiveness Promotion In Colombia & El Salvador Final Report
The Louis Berger Group, Inc. 2
Michael Porter of Harvard, author of numerous books on competitiveness strategies for business, including the massive study, The Competitive Advantage of Nations (1990). Porter notes that "the only meaningful concept of competitiveness at the national level is national productivity" (Porter, 1990, p. 6). 3
Much of the difference between economists and business theorists thus simply
reflect different definitions of the meaning of the term “competitiveness.” Both agree that it relates to productivity, but economists tend to focus on economy-wide factors that affect productivity, such as inflation, interest and exchange rates, and other economy-wide variables. Business theorists concentrate instead on what might be termed the microeconomics of competitiveness – those factors at the firm, industry, and institutional level that can make differences in productivity with a given set of macro-level indicators. Business theorists do not argue that macroeconomic issues are irrelevant, but only that they are not the part of the ‘productivity puzzle” that they are subjecting to analysis. This study focuses on the conceptual approach used by the business theorists, while recognizing that an appropriate macroeconomic and trade environment is critical to the general capacity of firms to operate successfully in any sector.
In The Competitive Advantage of Nations, Porter develops the concept of a cluster
of firms to explain the greater productivity of world class firms. A cluster is identified as “a geographically proximate group of interconnected companies and associated industries in a particular field, linked by commonalities and complexities.” Porter’s study shows competitive firms are more likely to arise where there are clusters of related or competing firms, and where several additional conditions are present. These conditions, popularized in the “Porter diamond,” include:
• Factor conditions, such as skilled labor and infrastructure; • Demand conditions, particularly in the home market; • Related and support industries, including universities and research
institutions; and • Firm strategy and structure.
In Porter’s model, it is the interaction of these four conditions that determines the competitiveness of a particular industry in any country. Where firms are fiercely competitive and where there is close interaction with the other elements of the diamond, there will be constant pressures for improvements in capabilities. Such improvements in each element of the diamond then feed back synergistically to increase the competitiveness of the entire cluster of firms, support industries and factors of production. An essential feature of the model is that individual firms cannot alone become competitive and stay competitive in world markets. There must be a nexus of competitors and of supporting industries that are also capable of delivering inputs and
3 "Seeking to explain ‘competitiveness’ at the national level, then, is to answer the wrong question. What we must understand instead is the determinants of productivity and the rate of productivity growth. To find answers, we must focus not on the economy as a whole but on specific industries and industry segments” (Porter, 1990, p. 9).

Report on Competitiveness Promotion In Colombia & El Salvador Final Report
The Louis Berger Group, Inc. 3
services to the firm that are also continually upgrading their capabilities. Achieving competitiveness thus involves all parts of the “value chain,” and not just the individual firm. Figure 1 provides the Porter diamond in graphic form. Porter’s theory of the key role of clusters was developed by studying successful firms in developed countries. Clusters have been observed as an outcome in a number of geographical locations, such as Hollywood and Silicon Valley. Nevertheless, the competitiveness theory embodies a number of ideas that have some power for explaining the relative success and failure of different developing countries in gaining markets for their exports. And this power has led researchers to seek ways in which clustering, or other aspects of competitiveness, might be used to promote faster productivity growth.
Figure 1: The Porter Diamond
Source: Michael Porter Two aspects of Porter’s model should be particularly noted in applying it to developing countries. His model assumes – based on his research during the 1980s – that sophisticated domestic demand for the products of an industry are an essential characteristic of competitive clusters. This is essential, he has argued, because only when the producer is very close to the market can innovation move quickly to meet changing consumer preferences. Second, Porter takes for granted that foreign-investment based clusters will not be competitive in his terms. This is because key decisions will be made in the foreign investor’s home country, rather than in the country where the investment is located. Consequently, activities of the firm in the recipient country will be subsidiary, and tend to lag trends in world markets.
Context for Firm
Strategy and Rivalry
Context for Firm
Strategy and Rivalry
Related and Supporting Industries
Related and Supporting Industries
Factor(Input)
Conditions
Factor(Input)
ConditionsDemand
ConditionsDemand
Conditions
• The microeconomic business environment is comprised of the array of skills, knowledge, rules, policies, supporting industries, and institutions surrounding competition
A core of sophisticated and demanding local customer(s)Local customer needs that anticipate those elsewhereUnusual local demand in specialized segments that can be served nationally and globally
Presence of high quality, specialized inputs available to firms
–Human resources–Capital resources–Physical infrastructure–Administrative infrastructure– Information infrastructure–Scientific and technological
infrastructure–Natural resources
Access to capable, locally based suppliers and firms in related fieldsPresence of clusters instead of isolated industries
A local context and rules that encourage investment and sustained upgrading
–e.g., Intellectual property protection
Open and vigorous competition among locally based rivals

Report on Competitiveness Promotion In Colombia & El Salvador Final Report
The Louis Berger Group, Inc. 4
Based partly on Porter’s work, some development theorists believe that these ideas are important in developing countries, and that the development of competitive clusters can be catalyzed by “change agents” – governments or donors – working with the private sector. Among others, the actions change agents might pursue include:
• Fostering, through technical or financial support, the development of “clusters” around which common objectives can be sought by competing firms.
• The development of a national competitiveness strategy that brings together
government, business, labor and other interested organizations and seeks to eliminate obstacles to productivity and exporting.
• Promotion of cooperation of firms in different parts of the “value chain” for
specific products or sectors, with a view to reducing transactions costs between different parts of the chain, and improving the quality of products of one part of the chain that are inputs to other firms in the chain.
• Encouraging firms to “move up the value chain” by moving away from
commodity production for world markets to branding, or quality differentiation (e.g., promoting “Colombian coffee”) that will allow higher profit margins and provide some protection against competition from lower-wage countries.
• Dissemination of competitiveness concept through conferences, seminars, and
written material. As these suggestions indicate, and as subsequent sections of this report will document, the way that competitiveness has been used in El Salvador and Colombia, or more broadly by Michael Porter and the Global Competitiveness Report, has little in common with the view that countries can be competitive. Aided by the Global Competitiveness Report, both countries have used the concept to address characteristics of their national economic environment that limit their capacity to produce at higher levels of productivity. These include such things as poor government policies, poor road and port infrastructure, inadequate telecommunications, and inexistent links between academia and business. To the extent that “competitiveness” has become a term that focuses attention on the internal obstacles to higher productivity, it is neither wrong nor dangerous. Rather, it becomes a tool for a national focus on factors responsible for a country’s poverty and its inability to organize its national potential in a productive way.

Report on Competitiveness Promotion In Colombia & El Salvador Final Report
The Louis Berger Group, Inc. 5
1.2 Clustering, Value Chains, and Productivity Below the very general issues surrounding the term “competitiveness,” there has been considerable theorizing by economists about the real-world issues that Michael Porter and other business theorists have proposed. In particular, there are four or five strands of economic thought that bear importantly on the importance of clustering for economic efficiency and productivity. The general topic for economists is the existence and significance of two terms that are opaque to outsiders: “externalities,” or “external economies.” The two terms are synonymous. They represent the net benefits to the economy, but not to the individual firm, of the combined activities of groups of firms or economic operators. Wall Street, or Hollywood, or Silicon Valley are all places where an industry benefits from an intense network of related firms, providing mutually-supporting benefits to others. Externalities can be negative as well as positive. The “tragedy of the commons,” where the over-fishing or over-grazing by each individual, in search of increased production, causes disastrous losses for all provides a good example of a negative externality. Each fisherman works harder to preserve his income as fish stocks are depleted, but the effort of all to do the same ultimately destroys the resource on which each depended. But while negative externalities end with a collapse in production, positive ones can produce virtuous circles of increasing productivity and prosperity. Alfred Marshall (1892) recognized the importance of geographical clustering of firms for economic efficiency. Marshall noted that firms in the same industry tended to cluster in the same geographic area, and that these industrial districts, or clusters, provided benefits (i.e., economists “externalities”) to the individual firms in comparison to firms located elsewhere. Any individual firm could more easily find a supply of workers with the appropriate skills than elsewhere. Indeed, workers hired from another firm might bring better technologies with them, so that all firms were able to gain in productivity from the circulation of workers among the different firms. Specialized service providers, knowledgeable about technical, design or marketing aspects of the product were likely to be more abundant than elsewhere, and materials relevant to the sector were likely to be cheaper and more easily obtained than elsewhere. Joseph Schumpeter’s conceptualization of entrepreneurship and innovation is a second key strand (Schumpeter, 1942). Schumpeter emphasized innovation as a central feature of the economic growth process, and the entrepreneur as the motive force. Schumpeter believed monopoly was an unimportant problem in the long run in a free-market economy, for innovations by one firm would later be imitated by others, eroding, and eventually eliminating, all monopolies, and therewith the profits of the original monopolist. Thus, economic growth was a treadmill, where constant innovation was the means to guarantee that any existing product or technology would gradually become obsolescent. The dynamic entrepreneurial processes of capitalism would assure this through new ideas, new firms, and new products. 4 4 This is also the theme of a new book by William Baumol, The Free-Market Innovation Machine, where the author argues that large companies have come to see constant innovation as essential to survival.
Report on Competitiveness Promotion In Colombia & El Salvador Final Report
The Louis Berger Group, Inc. 6
Another feature of Schumpeter’s analysis is also important. He recognized that any innovation created negative externalities for others. The innovator’s profits will be larger than the economy’s benefits from his innovation. Henry Ford’s innovation created many jobs in the automobile industry, but also produced unemployment, bankruptcies and other dislocations in the carriage and other horse-related industries, as well as in less-efficient automobile producers. This process of “creative destruction” is beneficial in the longer term in freeing people and capital from low productivity areas, and redirecting their use for higher-productivity ones. China’s new efficiency in shoe production is creating massive employment there, but producing bankruptcies and unemployment in the shoe industry throughout the developing world, particularly for firms that failed to adapt to changing technological possibilities. Ronald Coase (1998) provides another important perspective with implications for competitiveness. He concluded that some types of externalities could be internalized by the firm. In particular, he concluded that the level of vertical integration of the business firm depended upon the level of transactions costs along the value chain from basic raw materials to final consumer. In parts of the chain where transactions costs were high, the firm would integrate backward into raw material production and/or forward into distribution of the product. Thus, a firm in an environment where contract enforcement was difficult, or where the quality or timeliness of raw material inputs was variable or uncertain, would be more vertically integrated than a firm in an environment where reliable relationships with suppliers were the norm. As suggested by Coase, it is not necessary for all firms to buy into the value chain for it to work since downstream firms unsatisfied with their inputs can integrate backward or individual downstream firms can contract with upstream firms to obtain products of the specified quality. Evidence suggests, however, that firms in developing countries confront numerous financial, economic, policy, technology, and even cultural barriers that can impede the adoption of appropriately integrated production chains. This will limit the productivity of the firm and, ultimately, the potential for exports of goods and services. The identification and removal of these barriers is one of the great challenges facing policymakers in the developing world and one that can best be addressed on a sector-by-sector basis. Mancur Olson, in The Logic of Collective Action (1962), provides the final strand of thinking relevant to the topic. Olson analyzed cooperation by business firms for collective purposes outside the confines of the individual enterprise. The logic of the individual enterprise is clear and unambiguous. The owners set the goals, and a hierarchical structure implements them. For collective activities of groups of individual enterprises there is no such clarity. In the absence of a “bottom line,” to identify success or failure, associations among businesses are typically voluntary. Individual members can leave whenever they see the costs of the grouping exceeding the benefits. This limits the capacity of the association to allocate the costs of the collectivity among the members. It also limits the capacity of the association to take positions that conflict with the views of important members. Either difficulty – high costs to individual members, or low (or negative) perceived benefits – tends to make such collective efforts weak. Sectors where there is a single dominant firm will tend to be better supplied with

Report on Competitiveness Promotion In Colombia & El Salvador Final Report
The Louis Berger Group, Inc. 7
collective goods than those where many smaller firms share the market, for the dominant firm will tend to be willing to underwrite a disproportionate share of the joint costs. In most cases, it is the firm at the top of the production chain, the one closest to the final consumer, who provides the needed leadership and absorbs the additional costs of promoting the benefits of collective action among firms. The smaller firms will pay less than their “fair share” of the collective enterprise, free-riding on the dominant firm’s self interest in funding the bulk of the collective effort. Olson draws three conclusions from these characteristics and from his analysis of existing collective efforts.
First, such collective efforts suffer from a severe free-rider problem, especially
when the action is likely to benefit both those who contributed to the effort and those who did not. The net result is an under-investment in these types of efforts. For that reason, a combination of public and private sector support is often needed to encourage the appropriate investments in policy reforms that benefit many actors.
Second, collective groups that succeed do so in part because they have developed
indirect mechanisms, or forms of moral suasion, to address the free rider problem. Third, because of the difficulty of creating and sustaining collective action, the
effective organizations in this area are likely to be those with long traditions and records of effective results. In many contexts, effective lobbying of the government is the most tangible evidence of success. As a result, the effective collective action organizations are likely to be those that represent vested interests of the past, rather than those representing emerging opportunities. Often these are the types of groups that benefit from the existing status quo and are reluctant to promote changes that alter factor prices (trade reform and tax reform) or encourage new entrants that may compete with existing quasi-monopolies (investment promotion). For these reasons, effective change requires not only committed private sector participation from leadership in new emerging sectors, but also an enlightened public sector role. In particular, the political leadership must actively support policy change.
Five general conclusions might be drawn from these strands of analysis: 1. There are definite economic benefits of clustering of firms in similar activities
that cannot be captured by individual firms. Geographical places that make it easy for such clustering to occur are likely to have more economic activity and income than those that do not.
2. Collective action “along the value chain” requires a strong economic
motivation. When transactions costs are high (e.g., quality uncertain, delivery schedules not meeting commitments, or prices too high) firms have an incentive to integrate vertically to overcome such problems. This case is the most common one in developing countries. Alternatively, specialized suppliers who focus on meeting the requirements of onward users have an economic incentive to offer the product in the way that meets the needs of these users.

Report on Competitiveness Promotion In Colombia & El Salvador Final Report
The Louis Berger Group, Inc. 8
3. Developing and maintaining a collective association of firms, in the absence strong private sector leadership is difficult to sustain over a long period of time. Individual members will contribute less than would be optimal for the collectivity, and such efforts will tend to be under-funded. Collective efforts will also be timid, for fear of losing members opposed to assertive actions.
4. The main exception to the previous point is long-existing associations that
have found ways to address the free-rider problem, and that have shown proven capacity to influence government. As a consequence, the past will be over-represented in existing business associations because long-established associations have most effectively overcome collective-action problems. Firms in new sectors will typically be less well organized, and have little capacity to provide services to their members or to lobby government for more favorable policies. Consequently, public policy is likely to be backward-looking.
5. Productivity is the engine of economic progress. Firms must steadily improve
their manner of operation in order to survive, lest entrepreneurs elsewhere put them out of business. Appropriate government policies for infrastructure, market regulation, trade, and investment promotion can encourage an economic environment that supports new entrants and the dynamic innovation needed to boost productivity. In the absence of such measures, the gap between domestic and foreign productivity will only widen until the political and economic schema employed to protect domestic markets eventually collapses, at a high social and economic cost.
These observations suggest a useful role for governments and donor agencies in provisioning of public goods and helping to surmount coordination failures that often inhibit useful collective action. Productivity improvement is the key. Some productivity improvement can be obtained by collective action by firms in each sector. But such collective action is a public good that will be under-funded if left to the actions of the private sector. Government or donors can correct the imbalance between private and social benefit by partial funding of such activities. The outside funding changes the calculus of costs and benefits to the sector’s firms, and donor requirements for substantial contributions to the effort by the firms can help create the moral pressure for contributions by firms. They will also shift the calculus of net benefits toward stronger, more assertive actions, as long as the external funding source demands them as the price of the external assistance. 5 In sum, economic theory offers a clear basis for donor support for cluster development, contingent on substantial contributions to the effort by the firms in the
5 According to Porter "National governments, for their part, must set the appropriate goal, productivity, which underpins economic prosperity. They must strive for its true determinants, such as incentive, effort, and competition, not the tempting but usually counterproductive choices such as subsidy, extensive collaboration, and ‘temporary’ protection that are often proposed. Government's proper role is to push and challenge its industry to advance, not provide ‘help’ so industry can avoid it" (Porter, 1990, p. 30).

Report on Competitiveness Promotion In Colombia & El Salvador Final Report
The Louis Berger Group, Inc. 9
sector, and to the potential for this to yield sustained productivity increases by the firms in these clusters. 1.3 Empirical Research on Cluster Issues The above suggests that productivity growth is the primary goal, and some kinds of support for clusters or clustering, or value chains, may be warranted. The next question for purposes of analysis is, “what is a cluster?” Or more specifically, what kinds of groupings of businesses are desirable objects for government or donor support? Successful clusters of small enterprises in developed countries, with Italy (ceramics and shoes being two frequently-cited cases) the prime example, have excited much attention. Such clusters have conformed closely with the Porter model, building heavily on sophisticated domestic demand for their products, and developing a series of cooperative approaches among small firms, in the midst of intense competition among them. Two features of the Italian model are particularly attractive to development promoters. First, the firms have been able to capture international markets by providing designs that allow them to demand premium prices for their products. Second, this has been achieved in industries with many small firms. These two characteristics offer the best case from a development promoter’s perspective: indigenous-based development that draws its energy from small firms. And some have seen promotion of clustering among small and medium indigenous firms as the way forward in private-sector promotion. A priori reasoning suggests that the substantial fixed costs involved in identifying and developing export markets and continuing costs of innovating to stay abreast of markets are beyond the reach of small, individual firms. For that reason, there has been a strong interest among policymakers and academics to applying the lessons of successful clusters to overcome this barrier. 6 It is evident that in developing countries the base of technology, management skills and policy environment is not equivalent, making a direct application of developed-country experience less straightforward. O’Malley and Van Egeraat (2000) test Porter’s methodology for identifying successful industry clusters by applying it to Ireland. Their analysis identifies two problems in applying Porter’s theory to small, or to developing, countries. First, the predominance of foreign investment in leading export sectors and the relative lack of
6 It should be recognized, however, that once-successful clusters in developed countries can eventually lose their competitive edge. Cooke (2002) analyzes several European cases of successful clusters that failed to maintain their competitive position, and fell into decay. He studies several cases, including automotive parts, ceramics and silk manufacturing. Cooke concludes (p. 184) that “failing clusters have in common a characteristic of stubborn resistance to change, a cavalier collective attitude towards the value of knowledge other than that traditionally available, and a culture promoting the withholding of information of central importance to normal, day-to-day business functions.” In sum, Cooke’s analysis of the European experience emphasizes the need for: 1) business leadership oriented toward the future rather than the past; 2) close links between business and scientific research; and 3) rapid dissemination, rather than hoarding, of knowledge.

Report on Competitiveness Promotion In Colombia & El Salvador Final Report
The Louis Berger Group, Inc. 10
domestic firms is a notable characteristic of such countries. Porter generally excludes foreign investors from a major role in clustering, believing that such firms mainly respond to decisions and priorities in their headquarters country. Consequently, they lack the independent decision-making and creativity that would make them candidates for industrial clustering in the investment-receiving country (Porter, 1990, p. 566-67 and 678-79). Second, they apply a specific Porter observation for identifying successful export sectors – that the sector’s exports as a share of world exports of their production exceed the country’s total share of world exports. In the case of Ireland, overall exports accounted in 1993 for 0.79% of world exports. Sectors where Ireland exports a larger share of world exports than 0.79% would be candidates for high competitiveness. Few indigenous sectors would qualify by this criterion, for foreign investors are the leading exporters from Ireland. If foreign firms are excluded from the export base, Ireland only accounts for about 0.4% of world exports. By this lower standard, a much larger number of sectors would qualify. Nevertheless, even this standard may be too crude. About half of Irish exports by domestic firms come from the meat and dairy sectors, which have little industrial value added from their raw material base, and represent a far lower share of employment and value added per dollar of exports than other export sectors. The successful industries by the Porter standard are then related to the industries where there is rapid growth in exports and employment. The fit is very poor, and the mostly “high-tech” industries that have been the source of growth have heavy foreign investment. Irish export success is compared to the EU, and deemed to be notable in those industries with large foreign investment. Clearly, for Ireland, competitive success has not been driven by strong domestic clusters.
The authors reject the idea, put forward by some Canadian researchers, of a “double diamond” model involving two countries. The United States is the largest foreign investor in Ireland, but Ireland’s markets are mostly in Europe and the UK. Thus, the learning relating to firm strategy is drawn from the USA, but the learning relating to customers comes from the UK and Europe. This kind of multiple diamond does not conform well with the Porter model, and suggests that the model may be less applicable to developing countries than to world leaders. While these critiques may have some merit, Porter’s view may rule over the longer term. Over time, the predominance of foreign investors may erode. The initial key driver to Ireland’s success in the Information, Communications and Technology (ICT) sector was FDI in assembly and manufacturing. Green (2000) documents a shift from electronics (the domain of foreign firms) to software development where small, indigenous firms are major players. 7 Similar effects are being observed in countries like
7 According to Green, “during the 1990s, indigenous firms achieved growth rates of 11 per cent a year for employment, 25 per cent a year for the value of sales and almost 40 per cent a year for the value of exports. While the electronics sector continues to be dominated by large multinational companies, employment in software products and services is more evenly divided between overseas and indigenous companies, mainly SMEs.” (Green, 2000, p. 2)

Report on Competitiveness Promotion In Colombia & El Salvador Final Report
The Louis Berger Group, Inc. 11
Costa Rica, where FDI has provided the impetus for the development of local suppliers in packaging and print and the development of an incipient software sector. Attenburg and Meyer-Stamer (1998) provide a useful perspective on the conditions under which clusters prosper in developing countries, addressing particularly the matter of technology transfer to firms in the cluster. Based on their review of the experience in developing countries, they propose a three-class typology for clusters:
• Clusters of small firms that are “surviving,” • Clusters of large-scale production, that include both small and large producers,
and • Clusters based on transnational corporations.
They provide diagnostics and recommendations for each type. They consider the first group to be hopeless in the longer term. They have little access to technological upgrading, and their sectors of concentration, such as shoes and clothing are daily exposed to greater competition from abroad. Some things can be done with such groups, though only with projects demanding strong actions on the part of the entrepreneurs. Government agencies and organizational forms like cooperatives cannot solve their problems. For many, the best solution is that they leave the sector for another, such as much of the service sector, which is less vulnerable to foreign competition. Attenburg and Meyer-Stamer consider the second group much more promising, due to the potential for technology transfer from large to smaller firms, and the possibility of strengthening linkages within the sector that will increase competitiveness throughout the value chain. They consider this group to be the most promising for development agencies to support. Opportunities for national development can also come from the third group, transnational corporations. This largely involves developing supplier relationships with transnational firms – though this is initially likely to be difficult because of the high quality standards of the multinationals, but public policy can push them to increase the capacity of local suppliers. This analysis by Attenberg and Meyer-Stamer is carried out under the assumption that firms located in the country are the source of technology upgrading. But this ignores the structure of much of today’s world trade. An understanding of the conditions of marketing in developed countries is key to understanding the driving force behind much of what is produced in developing countries. Humphrey and Schmitz (2002) address the capacity of industrial clusters to compete on international markets by examining relationships with global buyers. They argue that buyers are the critical link for moving beyond production of commodities. Commodities can be sold in arms-length transactions, but they offer little opportunity for upgrading quality to produce more sophisticated or more narrowly-tailored products that would command premium prices. While much of the literature in this area focuses on the cluster, the outcomes of cluster operations depend on the capabilities of individual firms in the cluster. Humphrey

Report on Competitiveness Promotion In Colombia & El Salvador Final Report
The Louis Berger Group, Inc. 12
and Schmitz (2002, p. 1024) argue that an emphasis on inter-firm relationships in clusters “crowds out the concern with what goes on inside the firm.” They argue that only individual firms that have strategic intent, and are willing to make substantial investments, will be able to successfully upgrade technologically. The explanation of the success of many East Asian firms, they argue, is that they exhibited these characteristics more clearly than firms in other regions. Sonobe, et al., (2002) offer some corroboration of this perspective, showing that the characteristics of individual entrepreneurs are key to long-term success. They examine the experience over a decade of the process of upgrading of children’s apparel production in firms in a single geographic cluster in China. Their longitudinal analysis came to two interesting conclusions. First, government action in establishing a specific marketplace was “particularly important in stimulating the entry of new enterprises in the early stage of cluster development, when the major products were simple and standard.” This led to an expansion of the number of firms and in employment, but the increased competition drove down earnings. In subsequent years, the enterprise success depended mainly on characteristics of the individual firm. Only those firms that were able to upgrade their product were able to prosper. The most successful in upgrading tended to be better-educated businessmen with marketing experience, and good business skills. For the purposes of this paper, the term “cluster” is defined as the organization and interaction among firms with government, academic institutions, research organizations and others in the formulation of business strategies and policy reform. It describes a strategic approach for organizing firms in order to achieve improvements in business practices as well as reforms in government policies. In this sense, it is more than just a value chain in which firms interact in order to achieve specific business targets. It is also more than just a sector, although the term cluster is sometimes intermixed with sectoral definitions. As will be shown later on, the measurement of impact data at the cluster level is fraught with challenges and sector data are sometimes used as proxies for measuring the impact of cluster initiatives. This is often the case since impact data is typically only available at the sector level or broad export classifications. 1.4 Designs for Competitiveness Promotion Both the term “clusters” (as described above) and the term “competitiveness” can be subject to overuse and overly broad definitions. For example, many would argue that the most effective “competitiveness“ program is to establish a favorable exchange rate policy and a stable macroeconomic environment. Others would complement these initiatives with programs focusing on improved labor supply, infrastructure, export and investment promotion, technology transfer, etc. While all of these initiatives are important, they are not directly addressed in this paper. Rather, they are indirectly presented as they relate to topics presented by the clusters themselves as part of the national dialogue. Specifically, this paper focuses on the design of competitiveness programs as they relate to the interaction between clusters (as defined above) and national dialogues that focus on cluster issues.

Report on Competitiveness Promotion In Colombia & El Salvador Final Report
The Louis Berger Group, Inc. 13
Considerable theoretical and empirical work has been done on competitiveness. Most of this work, as discussed above, looks at clustering and related processes as the natural evolution of business capability in favorable environments. Some theorists have gone further, making recommendations for national programs to promote competitiveness. Michael Porter (2002) recommends the creation of such programs, involving several elements.
• First, industry associations and chambers of commerce focus their effort and attention on promotion of productivity-enhancing actions by their members and by governments, rather than seeking to lobby government for special privileges.
• Second, universities and research institutions establish linkages with the business
community to support research and technology dissemination relevant to productivity growth.
• Third, one or more independent institutions provide leadership in promoting the
national agenda. Several features of the third element need elaboration. Porter argues that such institutions need broad involvement of the private sector, academia and government. Nevertheless, they need to be independent of government, in order to assure that they support long-term efforts, which will be beyond the life-span of any individual administration. Consequently, they need strong cross-party backing with governmental support regardless of the party in power.
There has been no empirical evaluative work that would confirm or reject Porter’s proposed approach. Indeed, the broadness of the concept, the long time horizon and the variety of other factors likely to be at work strongly suggest that evaluation is not a feasible tool. Long time horizons and long chains of connection between actions and outcomes are both factors that tend to reduce evaluation to speculation. As an action program, moreover, Porter’s approach leaves a very limited role for government or for donors. Both are likely to seek results within a limited (3-4 year) time horizon, and to seek to use direct control and action by timetable, rather than the more limited role of encouraging action by others. A somewhat different model has been developed by a number of countries, often in collaboration with donor agencies. This typically involves thee major elements:
• A national competitiveness council, which brings the political leadership together with all other interested parties;
• A secretariat, that supports both the competitiveness council, if it exists, and
cluster groupings; and
• “Clusters” of firms and other institutions along the value chain of a particular product, or of organizations involved in a particular sector.

Report on Competitiveness Promotion In Colombia & El Salvador Final Report
The Louis Berger Group, Inc. 14
The IDB has been active at the cluster level through projects in a number of countries. USAID has been particularly active at the competitiveness council level, setting up programs in Sri Lanka, Mongolia, Croatia, Macedonia, and the Dominican Republic, among other countries. INCAE, the Central American business school, has worked at the regional level in Central America, while the Corporación Andino de Fomento (CAF) has done so for the Andean region. CAF has also promoted academic analysis of competitiveness issues. Australia created a national competitiveness council in 1995, and Ireland did so in 1997, both without donor support. The programs in the other countries are even more recent. Broadly speaking, the institutional design of such programs has tended to involve government directly as the promoter and manager of the effort. The institutional analysis of this approach presents a number of different questions. A National Competitiveness Council (NCC). All governments establish myriad councils and advisory bodies. Many are purely decorative or ceremonial, while others provide forums for important discussions on national priorities, important initiatives and information exchange. In addition to the problem of differentiating a competitiveness council from these other types of advisory body, three questions will immediately arise:
• Is a national competitiveness council needed? • If the answer to the previous question is yes, how can councils established by a
particular government administration to further its policy and political goals become a vehicle for achieving national long-term goals for competitiveness?
• How big should such a council be, and what type of people should be members?
• How frequent should the meetings of the council be, and what types of policy
issues should it address? The first issue – whether to have a national competitiveness council, and, if so, how to structure its operation seems to have no clear answer in the literature. In part, the reason surely lies in the importance of the “software” of personalities and staffing relative to the “hardware” of formal organizational arrangements. A second problem is that a national competitiveness council will not operate in virgin territory. Most countries have already established a variety of councils for national economic purposes (national export councils, national productivity councils, national investment promotion councils, national manufacturing councils, among others) that have functioned well or badly, but whose formal existence continues to include some of the terrain that a national competitiveness council might cover. Or, the failure of so many previous initiatives makes the new proposal for a national competitiveness council likely to be viewed as just another fad, destined to suffer the same fate as previous efforts. Unfortunately, this study cannot shed light on some of these issues. As discussed below in the relevant sections, neither country studied here has a national competitiveness council in operation. Colombia had such a council during a previous

Report on Competitiveness Promotion In Colombia & El Salvador Final Report
The Louis Berger Group, Inc. 15
administration, and the issues relating to its performance are discussed in the context of the Colombian experience. Given the lack of a council, the primary role in promoting competitiveness has fallen in each of the two countries studied on a unit within a governmental ministry – the Ministry of Economy in the case of El Salvador, and the Ministry of Foreign Trade in the Colombian case. The relation between such governmental promotion units and cluster development is an issue for which the experience of both countries offers useful lessons, to be discussed in the appropriate section of the report. The Secretariat. A typical competitiveness project will have a special office to promote the creation of clusters and to support those in existence, and to provide staff support to the national competitiveness council if it exists. Typically, the secretariat is a special office in a government ministry, usually the ministry of economy. In some cases, the location is outside the government, funded by a donor. Experience suggests that cluster secretariats inside the government will have less capacity to interact with the private sector members effectively than a secretariat outside the government. This is because, as shown in previous studies of government export promotion (e.g., McKean and Fox, 1994) that government institutions intended to support the private sector tend to be too mired in internal governmental politics to be able to understand and respond to the real concerns of the private sector. Yet, a location within government assures adequate resources for funding the secretariat, and provides a much stronger connection to the political leadership. This connection may be key to achieving results on policy issues. The Clusters. Several design issues relate to the clusters.
• Where should the leadership of the cluster lie? Should it be with the private-sector firms that are the membership, or should the government representative set the agenda and meeting schedules?
• If donor resources are being provided to the clusters, what mechanisms
need to be in place to assure efficient use of the resources?
• How are clusters to be conceptualized? Are they temporary groups that meet to achieve specific goals and then disband, or are they the beginning of more permanent institutions. If the latter, how are they to be funded in the longer term? In most countries there are already-existing private sector associations and chambers that cluster together the firms in a particular industry. How should the competitiveness clusters relate to such associations?
The chapters on the experiences of Colombia and El Salvador offer answers to some, but not all, of these questions. Leadership by the private sector does seem to be essential for long-run success of clusters. The questions of the best mechanisms for efficiency and the best institutional structure for cluster groupings defy easy answers, though the two country experiences provide some insights into the issues.

Report on Competitiveness Promotion In Colombia & El Salvador Final Report
The Louis Berger Group, Inc. 16
2. Colombian Experience with Promotion of Competitiveness
This chapter discusses the experience of Colombia in the promotion of competitiveness. Section 2.1 provides an overview of the country’s overall economic policy. Section 2.2 reviews Colombia’s competitiveness over time, as evidenced by its exports. Section 2.3 discusses the competitiveness promotion effort of the government and the experience of seven of the clusters promoted or supported by the government. Section 2.4 looks for evidence of changes in Colombian competitiveness during the period (1992-2002) during which these efforts have been underway. Section 2.5 offers some conclusions and observations on the Colombian experience. 2.1 The Country Economic Context
2.1.1 Background
In a broad sense, Colombian concern about competitiveness goes back to the mid-1960s. At that time, concern about declining terms of trade for the country’s major export – coffee – led to a variety of governmental efforts to develop a more diversified export base. In Latin America, Colombia pioneered three tools to promote increased exports of non-traditional products. The first was a crawling-peg exchange rate, intended to assure exporters that they would receive a constant price, in real terms for their exports. At the time, most Latin American countries maintained fixed exchange rates, punctuated by periodic crises, ending in devaluation when the country’s imbalance of payments left no alternative. Second, Colombia implemented the Plan Vallejo, a scheme to rebate import duties on imported raw materials, capital goods or intermediate goods incorporated into exported products. Its intent was to assure that exports were not disadvantaged by the country’s highly protectionist trade regime. Third, the country pioneered export subsidies, called CATS (for Certificados de Abono Tributario), that gave tax exoneration equal to 9-15% of the value of exports, maturing in a few months. These instruments were negotiable, so they functioned as a direct export subsidy. A fourth instrument, the Colombian Institute for Foreign Trade, INCOMEX, provided assistance to exporters. The first three instruments were indeed pioneering ones in Latin America, later copied by other countries. INCOMEX was not an innovation in an institutional sense, as most Latin American countries also had an export promotion agency, but INCOMEX proved more capable than most.
2.1.2 Economic Policies
Colombia’s economic policies in recent decades have maintained a consistency unusual in Latin America. Management of external debt and monetary policy has been conservative, and has helped Colombia avoid severe economic crises. During the 1980s, the country consistently maintained a positive GDP growth rate, and, at 3.5%, grew faster than any other Latin American country for the decade. In only one year (1999) during

Report on Competitiveness Promotion In Colombia & El Salvador Final Report
The Louis Berger Group, Inc. 17
the last four decades, was GDP growth negative. High inflation has been a consistent feature of economic management through the end of the century, but it has been held in a relatively narrow range of 15-25% per year. (Even so, this meant that prices increased more than one thousand-fold between 1963 and 2000.) This consistency was maintained in part by a large governmental role in the economy. Government ownership of infrastructure and of the country’s considerable oil production, along with government controls over foreign exchange and imports – where nearly all imports required official approval – imposed challenges to efficiency and posed a major burden on the private sector. It was due only to the relatively high quality of the government economic management bureaucracy and the relative absence of corruption that the system was able to sustain itself. The strains from the heavy hand of government gradually became evident from the mid-1970s onward, when the country’s linkages to the world economy (at least for legal exports) seemed gradually to diminish in various sectors.
2.1.3 Trade Policy Colombia’s trade policy has fluctuated over the years between protectionist and very protectionist. Export promotion has operated alongside high import tariff barriers and a system of administrative approvals. Administrative approval was finally eliminated in 1990-91, when there was also a major reduction in import tariffs. Concern about exporting has varied over time, as governments alternated between a primary concern about domestic issues and fears of isolation from the world economy. The real exchange rate has been an indicator of these concerns. Where exports were a major preoccupation, government tried to maintain a stable, competitive, real exchange rate. Where domestic concerns took precedence, as in the 1975-85 decade, or in the mid-1990s, the real rate appreciated.
2.1.4 Trade Institutions Colombia has the full range of institutions intended to promote the country’s competitiveness in world markets. Until recently, a separate ministry, the Ministry of Foreign Trade, Mincomex, was responsible for promotion of Colombia’s insertion into the world economy. Recently, that ministry was merged with the Ministry of Development, to form the Ministry of Trade, Industry and Tourism. Three other institutions are related to the ministry. Proexport, the export promotion agency, offers assistance to exporters in the forms of information, and grants for travel to trade fairs and other export development activities. Bancoldex, the export financing institution, offers credit to exporters. And Coinvertir, the mixed public-private investment promotion agency, helps companies find foreign partners.

Report on Competitiveness Promotion In Colombia & El Salvador Final Report
The Louis Berger Group, Inc. 18
2.2 Colombian Trade Performance Between 1960 and 1985, Colombia’s exports gradually, and steadily, declined as a share of total production (see Chart 2.1). This was a time when trade was rising as a share of total production for the world as a whole, and for many developing countries. At a time when world markets offered growing opportunities for producers wanting to export to industrial country markets, Colombia was only a modest participant. Exports fell from 13.2% of GDP in 1960 to a nadir of 9% in 1983 – a figure very low for a country with Colombia’s population. It was a very closed economy. Chart 2.1
Colombian Exports of Goods and ServicesAs a Percentage of GDP
-
5
10
15
20
25
1960
1962
1964
1966
1968
1970
1972
1974
1976
1978
1980
1982
1984
1986
1988
1990
1992
1994
1996
1998
2000
2002
Colombian exports have gradually diversified from the heavy dependence on coffee in the 1950s and 1960s. Chart 2.2 shows the trend in total exports (in current dollars) for four categories of product: coffee, minerals (which include petroleum, coal, ferronickel, emeralds and gold), non-coffee agriculture, and industrial products. Table 2.2 provides greater disaggregated categories. Minerals began to play an important role from 1985 on, and are partly responsible for the rise in Colombia’s export/GDP ratio. In the 1990s, other non-coffee sectors became more important. Non-coffee agriculture includes cut flowers, which have grown steadily and consistently since the 1970s; bananas, which stagnated after 1990, following two decades of rapid growth; and other products, which have shown little trend. Industrial products have had widely varying trends. Textiles and clothing exports have shown several periods of sharply rising exports, followed by periods of steady decline. Exports in 2002 were lower than in 1993. Leather and leather products rose steadily, also until 1993, and

Report on Competitiveness Promotion In Colombia & El Salvador Final Report
The Louis Berger Group, Inc. 19
then fell steadily. Chemicals, and other manufactures (which includes a variety of smaller export categories) have grown more rapidly and consistently. Considering the 1980-2002 period, only two categories from Table 2.1 grew at double-digit rates in current dollars: minerals and chemicals. Both of these sectors use very capital-intensive technologies, and the former is very dependent on natural resources. Neither sector generates very much employment. (Over the 1991-2000 period, employment in mining, chemicals, and petroleum refining rose by 188,000, while the number of people in the 15-60 age group rose by 4.2 million.) Chart 2.2
Of the other non-traditional, non-mineral categories shown in Table 2.1, only flowers have shown a consistent growth performance. Textiles and clothing show cyclical tendencies probably related to changes in the real exchange rate. Leather and leather products show a consistent rise until 1991, when a gradual and steady decline began.
Colombian Exports, 1970-2002
-
2,000
4,000
6,000
8,000
10,000
12,000
14,000
1970 1972 1974 1976 1978 1980 1982 1984 1986 1988 1990 1992 1994 1996 1998 2000 2002Year
Coffee Minerals Other Agriculture Industrial
Million Dollars

Report on Competitiveness Promotion In Colombia & El Salvador Final Report
The Louis Berger Group, Inc. 20
Table 2.1 Colombian Exports, 1970-2002
Million US Dollars
Year Total Coffee Minerals Bananas Flowers
Other Agri-
culture
Textiles and
Clothing Chemicals
Leather and
Leather Products
Other Manu-
factures1970 736 467 93 - - 51 51 8 7 58 1971 690 395 85 - - 57 54 14 9 76 1972 866 430 123 - - 75 91 21 21 105 1973 1,177 597 162 - - 96 115 37 30 141 1974 1,417 622 151 - 16 146 145 76 23 237 1975 1,469 672 121 - 19 233 94 60 21 248 1976 1,745 967 87 - 22 236 129 53 25 225 1977 2,434 1,498 117 - 33 297 126 55 35 275 1978 3,018 1,979 143 - 48 278 144 60 38 328 1979 3,234 2,005 141 - 68 272 208 73 43 424 1980 3,917 2,361 184 94 97 237 236 98 36 573 1981 2,925 1,423 118 122 109 256 205 95 47 551 1982 3,067 1,562 276 151 111 158 197 97 60 456 1983 3,033 1,506 537 148 121 114 111 106 35 354 1984 3,404 1,765 617 198 130 136 100 108 31 320 1985 3,496 1,746 673 156 132 147 108 130 55 350 1986 5,060 2,988 767 200 149 139 150 142 77 448 1987 4,915 1,651 1,784 210 145 164 196 191 98 476 1988 4,965 1,641 1,563 252 190 184 287 214 116 517 1989 5,711 1,524 2,155 260 221 200 425 201 134 590 1990 6,721 1,415 2,774 318 229 271 572 235 171 736 1991 7,114 1,336 2,403 405 280 419 762 345 243 921 1992 6,900 1,259 2,274 407 340 349 633 390 208 1,040 1993 7,116 1,140 2,421 425 379 258 732 441 242 1,077 1994 8,816 1,990 2,776 490 426 323 731 549 224 1,307 1995 10,298 1,832 3,732 429 476 322 845 829 203 1,630 1996 10,672 1,578 4,429 459 510 264 761 895 136 1,640 1997 11,555 2,261 4,023 503 545 260 729 1,093 129 2,013 1998 10,890 1,893 3,546 483 556 310 676 1,117 135 2,174 1999 11,576 1,324 4,998 560 550 269 642 1,196 125 1,912 2000 13,121 1,069 5,980 481 581 288 769 1,360 173 2,419 2001 12,309 764 4,841 408 610 348 825 1,399 181 2,934 2002 11,908 772 4,799 441 673 270 736 1,361 153 2,704
Source: Banco de la Republica
Report on Competitiveness Promotion In Colombia & El Salvador Final Report
The Louis Berger Group, Inc. 21
2.3 The Colombian Competitiveness Effort
2.3.1 Initial Efforts to Promote Competitiveness As stated earlier, Colombia had long had a set of government institutions aimed at promoting competitiveness in a broad sense, as export promotion and industrial development policy. The effort to promote clusters, or competitiveness in the Michael Porter sense, is more recent, beginning in about 1992. A competitiveness consulting firm, The Monitor Company8, was hired by the Colombian government’s industry-promotion agency, the Instituto de Fomento Industrial (IFI), to study Colombia’s competitive situation, and its major problems, and to make recommendations for government action. The initial Monitor findings were discussed at a well-attended conference in 1993. The Monitor work identified a number of specific ideas, based on the Porter diamond, to increase Colombian competitiveness, such as gaining greater knowledge of the needs of buyers, and seeking to move into more profitable market niches. The work also identified cultural attitudes – “mental models,” in Monitor’s terms – that were seen as limiting the ability of Colombian firms to become more productive. According to Monitor, some firms viewed the different actors in the production chain for their product as competitors in a zero-sum game rather than collaborators. Thus, leather tanners and leather manufacturers, or sugar cane growers and processors, would see themselves at war with the other party over prices, each trying to use any economic or political resources at its disposal to shift bargaining power to its side.9 Following the initial work, Monitor was hired by the petrochemical and plastics association, Acoplasticos, to do an analysis of the competitive situation of the firms in that association. Subsequently, Monitor assisted several other industry associations, including leather, and textiles and apparel to form cluster groupings. The Monitor work with sector clusters generated interest by municipal governments in several cities on applying these concepts, and Monitor subsequently helped the governments of the five major cities (or their departmental governments) to formulate strategies for regional competitiveness. This work was co-financed by the local or regional governments and the Corporación Andino de Fomento (CAF). At the national level, interest in clusters continued after a change in government in 1994. The government also implemented Monitor’s recommendation that the government establish a national competitiveness council to oversee the process of increasing the country’s competitiveness. The council, the Consejo Nacional de Competitividad, established in 1995, was chaired by the president, and included nineteen other people appointed by the president: six government representatives (mostly ministers
8 This is a Cambridge, Massachusetts firm associated with Michael Porter, and headed by Michael Fairbanks. 9 The Monitor experience in Colombia provided much of the material for the 1997 book, Plowing the Sea, by Fairbanks and Lindsay.

Report on Competitiveness Promotion In Colombia & El Salvador Final Report
The Louis Berger Group, Inc. 22
responsible for economic sectors), seven representatives from the business sector, and three each from labor unions and academic institutions. The government’s national planning department provided secretariat functions, though apparently without additional budgetary resources to fulfill this mandate. The council was mandated to oversee five programs (Martínez, 1997, p. 135): the national policy for science and technology, the strategic exporting plan, the policy for modernization of agriculture and the rural sector, the policy for modernization of industry, and the strategy for infrastructure for competitiveness. As these mandates indicate, the council was a vehicle for implementing the programs of one administration, rather than a non-political forum for trying to address national problems of inefficiency and low productivity. It died with the arrival of a new government, and promotion of competitiveness was transferred to the ministry of foreign trade. Three sectoral competitiveness agreements were signed between the government and the private sector (and with labor unions in two cases), during the 1994-1998 period. These were for textiles and clothing, metalworking and capital goods and pulp-paper-printing. The signers of the agreements for the business sector were business associations, not individual firms. The national competitiveness council seems to have viewed its function in promoting competitiveness more in line with traditional ideas from Latin America – sectoral planning, subsidies and bailouts – than in the Porterite view that competitiveness should depend on firm-level productivity, and not on government subsidies. For example, a 1998 assessment of the sectoral competitiveness agreement on textiles and clothing calls for joint planning by Colciencias, the government’s scientific institution, the national planning office and business firms to jointly coordinate plans to upgrade the technology of the sector (DNP 1988). The government investment promotion organization, IFI, was expected to provide financing to reduce the liabilities of firms in the sector, and the social security institute is directed to adjust the pension contributions of firms in the sector to their capacity to pay (see DNP 1987). In general, the approach was to back away from the “sudden and indiscriminate” economic liberalization of the previous administration, and undertake a “gradual and selective” move in the same direction (Martínez, 1997, p. 116). Thus, it was a partial return to the more traditional Latin American view that government policy as arbiter of the fortunes of individual economic sectors. This approach produced few concrete results in competitiveness, and, as discussed earlier, the appreciation of the exchange rate during the early 1990s reduced the profitability of exporting. The Samper government did, however, establish a network of centers for productivity and technology at the sectoral level. These centers have continued to work to support dissemination of new technologies. Overall, however, the national competitiveness council lacked consistent interest from the highest levels of government or strong support from the private sector, and had no lasting impact. In 1998, another change in government brought an increased attention to external competitiveness, and greater focus on clusters as a tool for productivity increases. As noted above, the functions of the national competitiveness council were transferred to the

Report on Competitiveness Promotion In Colombia & El Salvador Final Report
The Louis Berger Group, Inc. 23
Ministry of Foreign Trade (Mincomex), with created structures to promote export growth, cluster development, and regional export strategies.
2.3.2 Current Programs The overall competitiveness effort is managed by the Ministry of Commerce, Industry and Tourism. This ministry is a recent amalgamation of Mincomex, which previously managed the competitiveness effort, and the Ministry of Economic Development, which was concerned with domestic economic promotion. The competitiveness unit in the Ministry has a professional staff of 17 people to manage the various elements of the competitiveness strategy. The head of the competitiveness unit continued in the same position through a change in government, clearly signaling that the competitiveness effort transcended programs of individual administrations.
The program is called the Red Colombia Compite, or Colombian Competitiveness Network, and is organized into four main elements: national conferences, competitiveness agreements, regional competitiveness committees, and specialized networks. Each is described below.
2.3.2.1 Encuentros Nacionales de Productividad y Competitividad These national conferences on productivity and competitiveness have been held semi-annually for the past four years, and bring together the President, ministers and a large number of leaders from the private sector. About 1,000 people typically participate in the meetings. The structure and activities of the most recent meeting, in May 2003, are described in Box 1. In effect, the Encuentros have replaced a national competitiveness council as the principal forum for interaction between the government and the business sector. The broad-based character of the meetings and the fact that they have continued from one governmental administration to another suggest real value. Indeed, it could be viewed an important “democratization” of the effort from a council where all of the members are appointed by the president. Both government and private-sector leaders give considerable credit to the Encuentros as a tool for achieving better understanding between government and the private sector. Both regard the Encuentros as very important for promoting action on competitiveness. Many in the private sector see them as the most important vehicle for demonstrating government commitment to exports and competitiveness. There is no formal or unambiguous set of commitments against which progress can be measured

Report on Competitiveness Promotion In Colombia & El Salvador Final Report
The Louis Berger Group, Inc. 24
Box 1 – The May 2003 Encuentro Nacional de Productividad y Competitividad Encuentros Nacionales have been held semi-annually for the last four years. At the May 2003 Encuentro in Bucaramanga, President Uribe, five ministers and the head of the national planning office all made presentations to some 1,300 participants from private firms, associations and government agencies. The president also engaged in an extensive question-and-answer exchange with the participants. Altogether, the government provided a convincing picture of serious commitment and willingness to listen to and act on legitimate concerns of the private sector with respect to exports and competitiveness. Nevertheless, the president and several other presenters emphasized that Colombia’s capacity to compete in world markets and its ability to attract foreign investment depended more on the government's ability to address the internal security and drug-trafficking issues than on any new initiatives directed at competitiveness. This seemed to be generally understood, and the participants were clearly in strong support of the government’s efforts in this area. This meeting, the eighth in the series of semi-annual conferences on competitiveness and productivity included a series of presentations by academics, government officials, investors and others on topics related to competitiveness. The main theme of the conference was participation in trade agreements. Both government and academic spokesmen made a strong case for pursuing free trade agreements with other countries, and most notably with the United States. The arguments by Colombian government officials and academics were buttressed by a presentation by the Mexican foreign minister (a former economics minister) on the results of ten years of NAFTA on Mexico. One academic reviewed the performance of Colombia over the last few years as measured by the Global Competitiveness Report (GCR). This made use of an independent assessment of the country’s relative position in the world and in the Latin American region. He emphasized the low ranking of the country by various measures of competitiveness. By one measure, cost of security, Colombia’s position is above that of only one other country – Israel – in the survey. By other measures, Colombia ranks higher than most Latin American countries, though far behind Chile, and many developing countries in Asia. Several other speakers used particular indicators from the WCR to note problems or to highlight progress. The question of the impact of trade liberalization on agriculture was addressed by an academic and a government official, both arguing the case for substantial reduction in import duties on agricultural products as an important step toward greater efficiency. On the other hand, the minister of agriculture unveiled the government’s program for requiring motor vehicles to use a fuel including at least 10% ethanol from bio-mass production. This is expected to substantially increase the production of sugar cane in the country. This piece of industrial policy stood in sharp contrast to the general emphasis by other speakers on limiting the direct role of government, on economic efficiency, and on improving the government’s fiscal performance. Most of the papers presented at the Encuentro were available shortly after the conference on the internet, at the government’s competitiveness website.

Report on Competitiveness Promotion In Colombia & El Salvador Final Report
The Louis Berger Group, Inc. 25
from one meeting to the next. Nevertheless, each Encuentro produces information-gathering by both government ministries and private-sector associations in the weeks prior to the meeting, in gathering information on actions taken since the last one. The current government announced early on that the meetings would change to an annual schedule because of the large effort involved. Private-sector resistance to such a change has apparently caused the government to reverse that decision. Clearly, the private sector has seen these meetings as valuable. In responding to several queries at the May 2003 Encuentro, the president stated that ministers would report back in six months at the next meeting.
2.3.2.2 Specialized Networks This is described as a virtual network that is organized around the World Competitiveness Survey, and has ten working groups that address the cross-cutting issues that affect the overall competitiveness of the country. These are internationalization, transport, labor, human resources, information technology and communications, science and technology, energy, finance, management and government. Each of these thematic networks is responsible for monitoring performance of the sub-indicators used in the Global Competitiveness Report (GCR), and to work to improve Colombia’s relative position in the rankings. Some of these networks have periodic meetings, but most appear to be loose arrangements with little activity. For about half of the specialized networks, the relevant web page includes indicator data from the 2002 GCR. For the other half, the data set goes only to the 2001 report.
2.3.2.3 Convenios de Competitividad Exportadora These convenios, or Agreements on Export Competitiveness, are agreements between the government and the private sector (including a mixture of business associations and individual firms). Most of the currently-active convenios were signed by President Pastrana and his ministers in 2000 or 2001. More than 40 such convenios have been signed. About ten are regional ones focused on one geographic area, and the others are national. Appendix 4 provides a listing of the agreements in operation. The agreements are typically general, accompanied by matrices that spell out actions to be taken by the government and private sector participants in the convenio. The content of some of the agreements is discussed below. For the most part, the agreements do point in the direction of productivity, rather than subsidies or special privileges for the particular sector. In this sense, they represent a demonstration of the value of the competitiveness concept in the right direction. Nevertheless, the matrices are a very mixed bag. They vary widely from very general commitments, where it is not possible to determine whether they have been fulfilled or not, to specific ones. There is a wide variation in both the quality of the convenios and the extent to which they provide a basis on which actions are being taken. A few seem to be successful, but many have been largely formal exercises.

Report on Competitiveness Promotion In Colombia & El Salvador Final Report
The Louis Berger Group, Inc. 26
The matrices used in the convenios have generally not been updated since 2001. In some cases, private sector members have sought a process for updating them, but there has been no mechanism until recently to do so. The government’s announcement in May 2003 that it would update the matrices and use them to track progress in meeting sectoral goals is an important step forward.
Given below are summaries of the activities of a selection of the sectors covered by convenios. 1. Plastics. The activities of the plastics and petrochemical grouping go back several decades. The industry association, originally of producers of plastic articles, was established more than 40 years ago. In the 1970s, the association began to work with suppliers of petrochemical inputs, and in the early 1980s agreed to work together on key problems, notably technology and environmental issues. An early effort to obtain assistance from UNIDO was thwarted when the association lost its counterpart funds in a bank failure. The association then began an effort to obtain a plastics engineering curriculum at some Colombian university. After a long effort, first through the Ministry of Education, and later, after educational decentralization, with universities, the association was able to help establish, about a decade ago, a training and research institute connected to a university in Medellín. The program is now the only production engineering program in Colombia, and has expanded to provide Master’s degree training. In the early 1990s, Acoplasticos invited the Monitor Group to study its competitiveness and to make recommendations for the sector. This was the first study undertaken by Monitor. In 2003, Acoplasticos was identified by Michael Porter’s institute as a case study in effective cluster development. 2. Cut Flowers. Cut flower exports are the greatest success in recent decades in developing a new export sector. The industry was begun in the late 1960s by a foreign investor intent on serving the U.S. market. The firm’s success led to numerous imitators, and flower exports went from zero in 1967 to more than $670 million in 2002. It is the only sector that experienced increased exports every year for the past decade. The industry association, Ascoflores, participated in the convenio on the sector, signed in 2001. The matrix for this sector is more detailed than most, with 17 pages of commitments. Nevertheless, where some in the industry believe that the convenio has been of much significance, they consider that the government has done little on its side. Probably the most concrete result is the development by Ascoflores and Colciencias, the Colombian government-funded research institute, of a research program for the flower sector. This appears to be an important step toward a more competitive industry by providing a closer link between research and production.
Experts in the industry have argued that its needs from the government are three: an appropriate exchange rate, adequate air transport infrastructure, and commercial policy that provides access to foreign markets. In sum, the industry wants a policy environment and infrastructure that enable it to compete on equal terms in world markets.
The industry was originally based on roses, but has gradually diversified into
other products. It has also developed links with buyers and distributors in the United

Report on Competitiveness Promotion In Colombia & El Salvador Final Report
The Louis Berger Group, Inc. 27
States and Europe. In the United States, the industry sees little potential for increasing its already dominant market share, and has instead begun to work with U.S. distributors to promote expansion of demand for flowers – which is low compared to Europe.
This sector is anomalous in terms of the Porter model, for the domestic demand
for cut flowers is small (perhaps 2% of production) and unsophisticated. It may be that improved communications in recent years has reduced the importance of domestic market sophistication as a driver of competitiveness. Certainly, the leading flower producers have constantly focused their attention on market conditions in the principal market, the United States. 3. Leather. This sector was one of the original ones studied by the Monitor group. The leather sector, including shoes and other leather products, traditionally included a few large producers and thousands of small ones, usually clustered in a single geographic area of each major city. The original Monitor report on the sector contained an extensive analysis of quality issues in the sector, with each stage in the value chain blaming earlier parts for quality problems. Ultimately, it came to “blaming the cow” (Fairbanks and Lindsay, 1997, p. 77). The Monitor study led to extensive discussions among producers of leather products, and to greater interaction between leather processors, tanners, and slaughterhouses. The leaders of the sector have signed several convenios, the most recent in 2001. Despite the long period of debate within the sector and the efforts to identify and address problems along the value chain, the competitiveness of the Colombian leather products sector as a whole has declined dramatically over the past decade. Exports of shoes fell from $107 million in 1991 to $27 million in 2002. Those of leather manufactures fell from $134 million to $47 million over the same period. Some specialized sub-sectors, notably high-quality leather products, appear to have been more successful. These successes seem to be mainly those of individual enterprises changing methods and finding niches abroad, rather than to reductions in transactions costs along the value chain. Broadly speaking, the problems of the sector appear to be due less to any decline in productivity in the sector in Colombia, but to increases in productivity abroad. Competition from highly-efficient producers in Asia and Brazil first reduced Colombian exports and then reduced sales in the domestic Colombian market. 4. Coffee. The formal operation of a coffee cluster dates to 1927, when the Colombian Coffee Federation (FNC) was established. (This description draws heavily on Thorp, 2000.) Soon after being founded, the FNC was allowed to finance itself from a tax on coffee exports, guaranteeing a permanent flow of resources to the institution. The Federation benefited from strong leadership in the early years, and developed a reputation for austerity, probity and disciplined support for the development of the sector – and particularly for the small producers who dominated the sector. Later, it was able to gain control over domestic prices of coffee, and great influence over exports, though private firms exported the majority of Colombian coffee
Report on Competitiveness Promotion In Colombia & El Salvador Final Report
The Louis Berger Group, Inc. 28
in most years. The FNC was able to earn more than $1 billion in inflows between 1986 and 1994 (Thorp, 2000, p. 14) from the margin between its stabilized domestic prices and world prices. Most of this was plowed into local infrastructure and projects in coffee areas, but the FNC also invested heavily in diversification activities, with generally poor results. Coffee has been the traditional mainstay of Colombian export earnings, accounting for half of all export earnings as recently as 1985 (see Table 2.2). By 2002, this share had shrunk to 6% due to both the growth of other exports and the precipitous decline in world coffee prices. Despite this decline in the relative importance of coffee to Colombian exports, FNC is alone among sectoral interests in being represented on the board of the Colombian National Political and Economic Council (CONPES). It also has a representative on the board of the central bank. With the political power of the sector, Colombian producers have been able to obtain substantial government support for refinancing of coffee debt and for subsidies to domestic prices – the result of declining world prices, due importantly to Vietnam replacing Colombia as the second-largest coffee exporter on world markets. Thorp (2000, p. 15) concludes that the influence of the coffee sector on national politics remained high even though its contribution to the national economy continued to shrink. The Federation’s control of large financial resources and a substantial voting bloc makes it continue to be important. The convenio of the coffee sector, while extensive at 18 pages, contains no quantitative targets and few concrete goals. In many cases, the private-sector commitment is for Fedecafé to present some proposal to the government, and the public sector commitment is to review the proposal. Overall, this passive approach suggests a sector that is committed to a more traditional model of favorable treatment by government, rather than internationally-competitive behavior, as the most promising way forward. 5. Apparel and Textiles. The textile and apparel industries have a long history in Colombia, with the textile industry around Medellín a major manufacturing center. The country began to export substantial amounts of both products during the 1960s and early 1970s, but exports began to stagnate afterwards. Morawetz (1981) identifies a number of factors in the disappointing export performance. On the government side, they included appreciation of the exchange rate after 1973 that made exporting less profitable, and the government procedural problems, such as long delays in movement of imported materials through customs. Morawetz also found that Colombian firms had poor quality control, and had gained a reputation abroad for products of low quality. The case of Pierre Cardin suits, where a Colombian firm was unable to meet the quality standards for a U.S. distributor, was a well-publicized disaster. Though apparently following in the footsteps of the Asian tigers in its early evolution, the Colombian industry was never able to live up to this early promise of becoming a center for textile and apparel production, and later of design. In terms of exports to the United States market, the world’s largest for apparel, Colombia ranked 22nd in 2002 – behind all of the Central American countries except Nicaragua.
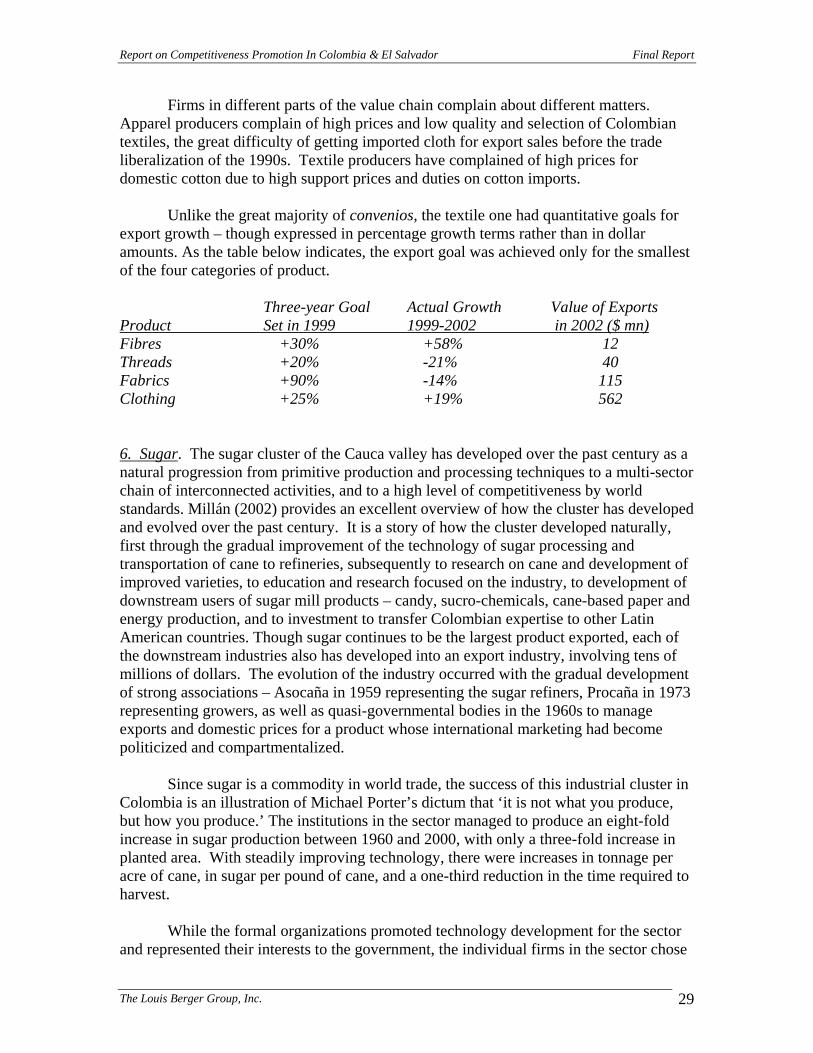
Report on Competitiveness Promotion In Colombia & El Salvador Final Report
The Louis Berger Group, Inc. 29
Firms in different parts of the value chain complain about different matters. Apparel producers complain of high prices and low quality and selection of Colombian textiles, the great difficulty of getting imported cloth for export sales before the trade liberalization of the 1990s. Textile producers have complained of high prices for domestic cotton due to high support prices and duties on cotton imports. Unlike the great majority of convenios, the textile one had quantitative goals for export growth – though expressed in percentage growth terms rather than in dollar amounts. As the table below indicates, the export goal was achieved only for the smallest of the four categories of product. Three-year Goal Actual Growth Value of Exports Product Set in 1999 1999-2002 in 2002 ($ mn) Fibres +30% +58% 12 Threads +20% -21% 40 Fabrics +90% -14% 115 Clothing +25% +19% 562 6. Sugar. The sugar cluster of the Cauca valley has developed over the past century as a natural progression from primitive production and processing techniques to a multi-sector chain of interconnected activities, and to a high level of competitiveness by world standards. Millán (2002) provides an excellent overview of how the cluster has developed and evolved over the past century. It is a story of how the cluster developed naturally, first through the gradual improvement of the technology of sugar processing and transportation of cane to refineries, subsequently to research on cane and development of improved varieties, to education and research focused on the industry, to development of downstream users of sugar mill products – candy, sucro-chemicals, cane-based paper and energy production, and to investment to transfer Colombian expertise to other Latin American countries. Though sugar continues to be the largest product exported, each of the downstream industries also has developed into an export industry, involving tens of millions of dollars. The evolution of the industry occurred with the gradual development of strong associations – Asocaña in 1959 representing the sugar refiners, Procaña in 1973 representing growers, as well as quasi-governmental bodies in the 1960s to manage exports and domestic prices for a product whose international marketing had become politicized and compartmentalized.
Since sugar is a commodity in world trade, the success of this industrial cluster in Colombia is an illustration of Michael Porter’s dictum that ‘it is not what you produce, but how you produce.’ The institutions in the sector managed to produce an eight-fold increase in sugar production between 1960 and 2000, with only a three-fold increase in planted area. With steadily improving technology, there were increases in tonnage per acre of cane, in sugar per pound of cane, and a one-third reduction in the time required to harvest. While the formal organizations promoted technology development for the sector and represented their interests to the government, the individual firms in the sector chose
Report on Competitiveness Promotion In Colombia & El Salvador Final Report
The Louis Berger Group, Inc. 30
their own strategies, with varying results. The most successful refineries over time tended to diversify. Those moving into related industries, such as downstream uses, tended to be successful, while those who sought to diversify their risk by investing in unrelated sectors encountered problems. The matrix developed in 1999 with the signing of the convenio for this cluster contains specific commitments vitiated by language that makes them of questionable meaning. For example, it includes a commitment by the private sector to make $102 million in new investments in technology and productivity over the 1999-2002 period, “contingent on the necessary conditions being in place,” and a commitment to increase exports of sweets and chocolates by 35%, “if the necessary conditions are provided.” There being neither baseline statistics nor any tracking of progress toward the goals, the sector actors had no way to judge the extent to which the goals were being met. In the case of exports of sweets and chocolates, one measure shows an increase of 33%, from $80 million to $106 million, between 2000 and 2002. The convenio makes no mention of use of cane in motor fuel, but the sugar sector achieved a significant result in 2002, when it was able to obtain legislation that established a requirement that motor vehicle fuel in the five largest cities of Colombia contain no less than 10% ethanol from biomass production. Sugar cane is the likely source of raw material to meet this requirement, so a substantial boost in production may be expected. General Assessment of Convenios. In early 2003, the CAF financed a major evaluation of the convenios, carried out by a Colombian management and consulting firm, Corporacion Calidad. The evaluation concluded that many convenios were more form than substance. While recognizing that some agreements had been quite successful, the study identified several common weaknesses. The main criticisms of the convenios were the following:
• There were few real commitments by either the private sector or the government;
• Public sector representatives at cluster meetings changed frequently, and could not speak for the government with any authority;
• There were great uncertainties about where the leadership of the convenio should lie, whether with the government or the private sector members; and
• There was no effective tracking mechanism to measure progress (or lack of it) by the individual groups.
The assessment led the government to announce in May 2003 that it was revising the system for managing and promoting the convenios. Three revisions in the system have been announced:
• Establishment of tracking systems to measure performance of the convenios;

Report on Competitiveness Promotion In Colombia & El Salvador Final Report
The Louis Berger Group, Inc. 31
• A statement that the private sector was responsible for leading each convenio; and
• Regular updating of matrices to reflect progress in implementation.
As a step toward implementation, the government has assembled the 1,000 or so elements of the matrices in order to provide the basis for tracking performance, and has announced its intention to provide a regular monitoring of progress. It should be recognized that success of Colombian clusters is a different thing than the effectiveness of the convenios. Some sectors, most notably cut flowers, sugar, and plastics, have been quite successful. Enterprises have evolved over time into world-class competitors, an array of service providers has developed, and academic and training institutions have grown up to serve the sector. Yet these processes have occurred over decades. The progress over periods as short as two or three years – the period during which most of the convenios have been operating – would usually be seen as modest. In none of the cases could any concrete immediate results of significant magnitude be identified from the creation of a formal vehicle for sectoral collaboration. As will be seen below, this conclusion also applies in the case of El Salvador.
2.3.2.4 CARCEs and Regional Development Efforts Each Department has an Advisory Committee on Export Competitiveness (Comité Asesor Regional de Competitividad Exportadora—CARCE) that is supposed to be the vehicle for promoting competitiveness at the regional level. This committee typically includes all of the major interests in the region, and meets every month or two. It receives no funds from the national government, and may have one employee, who is paid by local contributions. In the major cities, the CARCE seems to be only a very broad steering committee, with the extensive activities for cluster development, technology cooperation, and linkages between academia and the enterprise sector, being undertaken through the local chamber of commerce. The regional efforts of four cities – Bogotá, Cali, Medellín, and Bucaramanga – were examined in this regard. In each of these major cities, the programs appear to be large, active, and represent substantial commitment of human resources by local businesses and government. The commitment by civic leaders, chambers of commerce, local academic institutions, and leading businessmen was impressive, and suggestive that significant results in improvements in cooperation were being achieved. The close interaction between academic institutions and the rest of the regional effort was particularly notable. Studies by academics and student theses on cluster issues, new degree programs on international business, and efforts by universities and other research institutions to support productivity improvements in business firms all suggest an impressive, and surprising, degree of cooperation between the academy and business. Reportedly, CARCEs in some of the smaller Departments have been less active and less effective, but no evidence was gathered on this point.

Report on Competitiveness Promotion In Colombia & El Salvador Final Report
The Louis Berger Group, Inc. 32
2.4 Indicators of Changes in Colombian Export Competitiveness
2.4.1 Export Statistics
Total Colombian exports grew by 8% between 1998 and 2002. The disaggregated trade statistics were examined for evidence of the impact of the government’s competitiveness program. Table 2.3 shows the change over the period for the main sectors in exports to countries outside the Andean Pact. Exports to Andean Pact members were excluded because of the protectionist nature of some of the regional trade, with automotive trade being the most extreme example. Over the period, automotive exports to Andean Pact partners rose by $188 million, or 125%, while falling by $5 million, or 27%, to all other markets. These figures suggest that growth in Andean trade may be detracting from Colombian competitiveness by diverting entrepreneurial energy from world markets to a protected regional one.
The sectoral trends in Table 2.3 are rather encouraging, particularly in
manufactured goods. There was substantial growth across a wide range of industrial products. Machinery exports, basic metals, plastic products and paper all showed increases of more than 50%. Particularly rapid growth of 110% occurred in “other light industry,” suggesting a diversification of export capacity into different products. The two notable declines among industrial products were in textiles and leather products. Within the latter category both shoes and other leather products showed declines. Within the agricultural sector, the decline in coffee exports was due to the sharp world price decline. Flowers and sugar showed significant growth, but other segments of agriculture and agro-industry stagnated.
What relation do the export trends have to the Colombian competitiveness promotion programs? Quantitatively, there is no way of knowing. With the exception of apparel and textiles mentioned above, none of the clusters established quantitative targets for export growth. The 40 sectors for which clusters were established covers almost the entire range of export sectors except for minerals (petroleum, coal, ferro-nickel, and emeralds.) Mineral exports grew faster than non-mineral exports over the period. So many other factors were at work that it would make little sense to compare export success of sectors with clusters to sectors without. In principle, it might be possible to compare exports by active cluster participants to those of other firms. No data for this exists, and other factors (e.g., clusters might include the more dynamic entrepreneurs, who would have had faster growth than others even without any formal grouping) might make the comparison meaningless. The devaluation of the Colombian Peso in 1999, restoring it to the same real rate as in the early 1990s might also have been an important factor in the export outcomes.
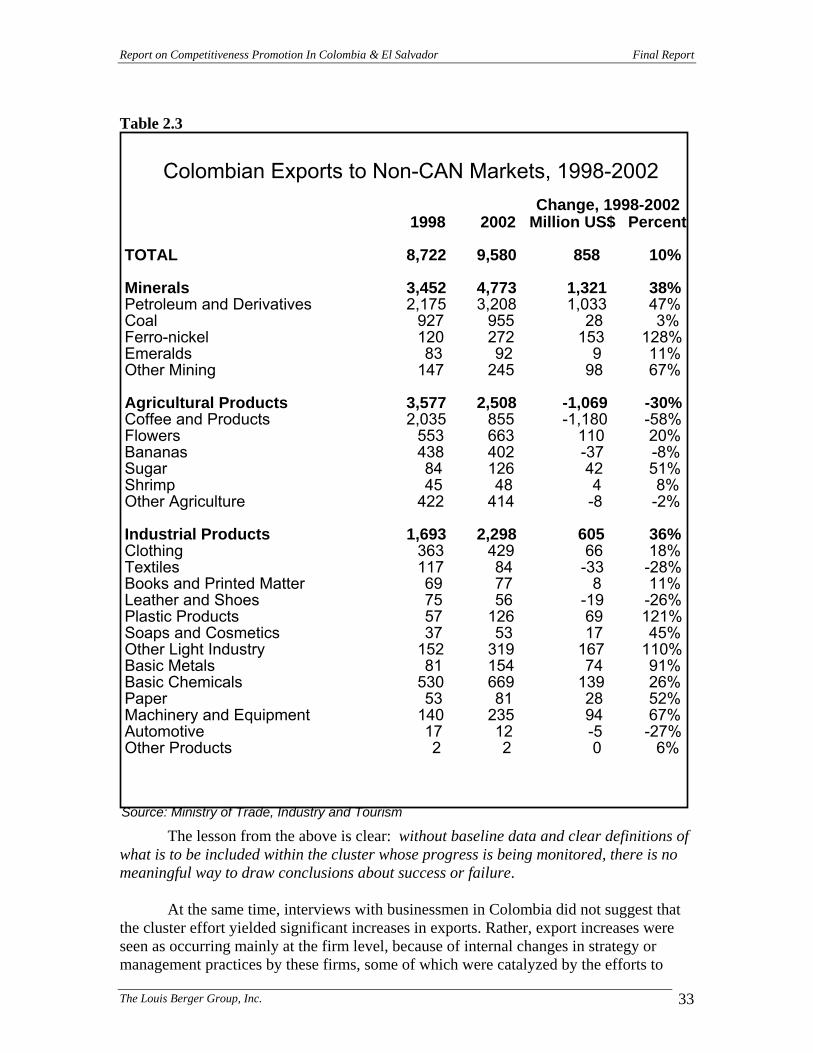
Report on Competitiveness Promotion In Colombia & El Salvador Final Report
The Louis Berger Group, Inc. 33
Table 2.3
The lesson from the above is clear: without baseline data and clear definitions of what is to be included within the cluster whose progress is being monitored, there is no meaningful way to draw conclusions about success or failure.
At the same time, interviews with businessmen in Colombia did not suggest that
the cluster effort yielded significant increases in exports. Rather, export increases were seen as occurring mainly at the firm level, because of internal changes in strategy or management practices by these firms, some of which were catalyzed by the efforts to
Colombian Exports to Non-CAN Markets, 1998-2002
Change, 1998-20021998 2002 Million US$ Percent
TOTAL 8,722 9,580 858 10%
Minerals 3,452 4,773 1,321 38%Petroleum and Derivatives 2,175 3,208 1,033 47%Coal 927 955 28 3%Ferro-nickel 120 272 153 128%Emeralds 83 92 9 11%Other Mining 147 245 98 67%
Agricultural Products 3,577 2,508 -1,069 -30%Coffee and Products 2,035 855 -1,180 -58%Flowers 553 663 110 20%Bananas 438 402 -37 -8%Sugar 84 126 42 51%Shrimp 45 48 4 8%Other Agriculture 422 414 -8 -2%
Industrial Products 1,693 2,298 605 36%Clothing 363 429 66 18%Textiles 117 84 -33 -28%Books and Printed Matter 69 77 8 11%Leather and Shoes 75 56 -19 -26%Plastic Products 57 126 69 121%Soaps and Cosmetics 37 53 17 45%Other Light Industry 152 319 167 110%Basic Metals 81 154 74 91%Basic Chemicals 530 669 139 26%Paper 53 81 28 52%Machinery and Equipment 140 235 94 67%Automotive 17 12 -5 -27%Other Products 2 2 0 6%
Source: Ministry of Trade, Industry and Tourism

Report on Competitiveness Promotion In Colombia & El Salvador Final Report
The Louis Berger Group, Inc. 34
promote clusters. Thus, the early years of implementation of competitiveness programs appear not to produce significant export results that flow from economies due to increased cooperation, or clustering, among firms. The early results come instead from individual firms reorienting their strategy and operations.
2.4.2 Other Indicators of Progress
Beyond exports, the only other available sets of quantitative indicators of progress
on competitiveness are those prepared by several international groups that attempt to compare competitiveness across countries and over time. The most-widely reported such measure which offers data spanning the relevant period is the Global Competitiveness Report (GCR). Colombia’s position on competitiveness has improved notably in the most recent GCR. Because of the various technical issues in evaluating the GCR results, both the methodology of the report and the performance of Colombia by its standards are discussed in Chapter 4, along with a discussion of other measurement systems that have been developed to compare the performance of different countries.
Other non-quantitative measures of trends in competitiveness come from
interviews in Colombia for this report. There was something close to a consensus on the part of the business, association, and regional leaders interviewed that promotion of Colombian competitiveness in world markets had become an important priority; that the competitiveness concept had emerged over the past few years as a useful tool for organizing effective responses to globalization; and that there was in 2003 a much broader and deeper understanding of the steps that Colombian business and government needed to take to generate higher productivity and higher quality of life for its citizens.
The interviews conducted for this study suggest that promotion of competitiveness has indeed influenced the mental models of many entrepreneurs. Numerous respondents spoke of a sharp contrast between business attitudes today and those of the early or mid-1990s. They see a far greater understanding of the need for close links to buyers abroad, for continuous improvements in productivity, and for steady upgrading of technology. Since there are many other sources of information that might lead entrepreneurs in this direction, it is not possible to establish causality between changed attitudes and the competitiveness programs. Nevertheless, the Colombian competitiveness programs have clearly been “pushing in the right direction.” The business sector’s success in pressing the government for continuation of the national Encuentros, and the continued participation of 1,000 or more people at these meetings both suggest that they are playing an important role.
For government bureaucracies, competitiveness appears to have been a useful
concept for organizing government support for business in a coherent way. Albert Hirschman argued long ago (1964) that the scarcest resource in government was decision-making. If this is true – and many other analysts have endorsed the Hirschman insight – then competitiveness offers an effective way to improve government decision-making. It simplifies the issues surrounding the variety of actions for which government

Report on Competitiveness Promotion In Colombia & El Salvador Final Report
The Louis Berger Group, Inc. 35
decisions are sought, so that decisions become easier and more routine. It provides a frame of reference into which the plethora of specific issues can be assessed. At lower levels of bureaucracy, competitiveness as an organizing principle can be empowering.10 In some sense, possibly quite important, the competitiveness focus seems to have made government support for appropriate and consistent policies more likely. It provides a means for re-centering government thinking regarding the private sector into a concept much more likely to produce effective developmental results: that the productivity of business enterprises is the key to higher incomes and better material well-being for Colombia’s citizens. The subjective evidence of this value garnered from interviews was quite strong. Nevertheless, as with the previous point, no hard evidence on this point could be developed.
2.5 Conclusions
2.5.1 The Competitiveness Program The Colombian system for promoting the country’s competitiveness is a useful and effective one. Overall, it has several major characteristics of a successful program: 1. The Colombia competitiveness program is well-conceived, and well managed, with
capable people managing the process. 2. It has evolved over time, toward greater complexity and focus, and has maintained
the same general character through a change in government. It has come to be recognized as a national program aimed at a national problem, and not the program of an individual government.
3. It has used evaluation effectively to improve the quality of the program. The CAF-
funded evaluation of the convenios de competitividad was an important demonstration of the seriousness of the Colombian effort. The evaluation, which was of high quality, identified serious shortcomings in the convenio program. The Ministry of Trade, Industry and Tourism took the findings seriously, and began program adjustments to respond to these problems.
4. The regional promotion efforts, through CARCEs and chambers of commerce have
generated very promising cooperation among business, government and academia at the regional level.
5. At the same time, there is still much receptivity – both within the government and
among some private business leaders – that government should play a dominant role
10 The adoption of the competitiveness approach may be a means of addressing the problem identified by Weaver (1984, p. 142-3) in Guatemala, where he found senior government executives to be: “…seated behind mounds of petitions, memos, and requests for rulings; besieged by clients, friends and subordinates begging for assistance or opinions; and occasionally and hastily scanning a report that is probably largely fictitious and almost inevitably devoid of critical analysis.”

Report on Competitiveness Promotion In Colombia & El Salvador Final Report
The Louis Berger Group, Inc. 36
in the business sector, using subsidies and preferential access to credit to help firms in favored industries. Actions of this sort are inconsistent with an effective and sustainable competitiveness strategy. Effectiveness requires recognition of the subsidiary role of government, and the primary role for structure and strategy by private firms in leading the movement to increased productivity. Sustainability requires that the activities undertaken not require subsidies or protection in order to make them competitive in global markets.
6. The Colombian case does not provide evidence that any agglomeration economies
resulting from cluster efforts will lead to significant short- or medium-term export increases at the sector level. Significant results may indeed happen in this time frame, but they will be at the firm level, as individual firms change their strategy and operations to conform to newer ideas about competitive advantage. Cluster-level results are likely to take longer, as links between industry and research and training institutions are strengthened, and as more individual firms emulate the internal practices of their more successful competitors
2.5.2 The Policy Context
While the quality of the competitiveness program has been high in Colombia, it is
important to recognize that its effectiveness depends on the quality of the country’s overall policy framework. In the case of Colombia, overall policy has improved in recent years, as recognized by the Global Competitiveness Report. The trade liberalization of 1990 was an important watershed. The depreciation of the currency in 1999 was critical for restoring competitiveness to many export products. And recent steps to address the chronic fiscal deficits have been encouraging.
Three outstanding problem areas limit the potential for moving forward on the
competitiveness of the country in world markets: 1. Tariffs. Import protection for some sub-sectors, both in agriculture and
industry, create distortions in the economy, or (as with some Andean Pact preferences) give incentives to inefficient production. A lowering of the highest tariff rates would be beneficial. Negotiation of a free trade agreement with the United States would be a useful step in this regard.
2. Industrial Policy. While the government gives great emphasis to promotion of
the country’s international competitiveness, government actions are not uniformly supportive of this goal. Two cases in point are coffee and sugar. In the case of coffee, efforts to offset the impact of world price trends are less likely to improve the country’s future competitive position, and the incomes of Colombians, than more forward-looking investments. In the case of sugar, the anticipated investment in alcohol for motor fuel from sugar cane seems a potentially expensive speculation – and possibly a diversion of resources from more promising areas.
Report on Competitiveness Promotion In Colombia & El Salvador Final Report
The Louis Berger Group, Inc. 37
3. Policy Inconsistency. A commitment to a proper environment for competitiveness in the long term requires that government provide stable signals to the private sector about policy. The wide variations in the real exchange rate over time, and the periodic backsliding on import tariffs do not provide the policy stability that would assure entrepreneurs about the business they will face if they are to undertake new investments. Along with the country environment issue mentioned below, this is surely a factor in the currently low investment rate in Colombia, at 14% of GDP.
2.5.3 Country Environment
The principal country environment issue facing Colombia is that of security, due to the high level of violence related to both guerrilla insurgency and production of illegal drugs. (The Global Competitiveness Report 2002-03, ranks Colombia next-to-last in it’s country rankings for security, ahead only of Israel.) The concern by foreigners about personal security in Colombia has reduced interest by potential foreign investors, foreign buyers, and potential foreign partners in strategic alliances. As discussed in Chapter 1, all three are critical to the transmission of technology, design information and investment that are essential to rapid productivity growth. Until the flow of foreign business partners into Colombia is substantially increased, domestic promotion of competitiveness is likely to have only limited results.

Report on Competitiveness Promotion In Colombia & El Salvador Final Report
The Louis Berger Group, Inc. 38
3. Promotion of Competitiveness in El Salvador This chapter offers a discussion of the experience of El Salvador in the promotion of competitiveness along the lines proposed by theorists of firm- and sector-based models. Section 3.1 provides an overview of the country’s overall economic policy. Section 3.2 reviews El Salvador’s competitiveness over time, as evidenced by its exports. Section 3.3 discusses the competitiveness promotion effort of the government and the experience of seven of the clusters promoted or supported by the government. Section 3.4 looks for evidence of changes in Salvadoran competitiveness during the period (1998-2002) during which these efforts have been underway. Section 3.5 offers some conclusions and observations on the Salvadoran experience. 3.1 The Country Economic Context
3.1.1 Background
The relevant background for El Salvador’s efforts to promote national competitiveness goes back to the establishment of the Central American Common Market (CACM) in 1961. At that time El Salvador was a very poor, agriculturally-based country. The country was the most technically-advanced coffee producer in Central America, but this was based on production by large estates. These estates were the historical legacy of the Spanish conquest. Population growth over time had produced the most densely-populated country in Latin America, many working as agricultural laborers on the large estates. Government social programs were limited, and a large fraction of the rural population was illiterate. The country’s infant mortality rate, about 130 per thousand births, was one of the highest in Latin America. Coffee was the primary export crop, accounting for about 70% of all merchandise exports.
The creation of the CACM in 1961 was thought at the time to provide an opportunity for the country to outgrow its historical dependence on agriculture. Establishment of a high tariff wall around the five Central American members did produce substantial investment in industry during the 1960s, of which El Salvador was one of the principal beneficiaries. Its export base diversified substantially, and exports of manufactures – almost entirely to Central America – became important.
Under the prevailing theory, championed by the Economic Commission for Latin America of the United Nations, it was believed that an initial period of import-substitution behind high tariff walls could be followed by exports of manufactures. The tariff walls would be gradually reduced to spur competitiveness of the manufacturing sector, which would gradually emerge from its “infant-industry” status. The tariff reductions sought by regional economic theorists in the late 1960s did not materialize, however, for two reasons. First, the leaders of the newly-emerged manufacturing sector, now politically influential, saw them as threatening to the continued existence, or the profitability, of local manufacturing. Second, a brief war between El Salvador and Honduras in 1969 effectively ended the shift toward closer regional integration among the CACM members.
Report on Competitiveness Promotion In Colombia & El Salvador Final Report
The Louis Berger Group, Inc. 39
Slow economic growth during the 1970s, with a narrowing of opportunities for political expression under successive military governments, produced societal polarization. This broke out into civil war in 1979. A reformist coup later that year led Jose Napoleon Duarte, one of the earlier reformers, to power, first as a member of a ruling junta, later as sole leader, and subsequently in 1984 as elected president. Duarte undertook a land reform program that seized and redistributed the largest estates in the country, nationalized banks, and established government agencies to control exports of coffee and cotton. He also instituted a variety of measures to broaden popular participation in government and to promote democracy. But Duarte’s policies did not end the polarization, and the civil war continued past the end of his term of office.
A reformist conservative government, led by Alfredo Cristiani, was elected in 1989. The Cristiani government quickly reversed most of the economic policy changes instituted by Duarte. The banking system was re-privatized, the multiple exchange-rate system was abandoned for a market-based rate free of capital controls, and foreign trade institutions were returned to the private sector. The Duarte land reform program and many of the Duarte initiatives in health and education were maintained.
Like his predecessor, Cristiani sought to negotiate an end to the civil war. Though the ideological gulf with the left was far wider for Cristiani than for Duarte, a final peace agreement between the Cristiani government and the FMLN leadership was signed in Mexico in January 1992. The former guerrillas began to participate in the political process, which has continued to be democratic. Subsequent victories in presidential elections in 1994 and 1999 consolidated the conservative control over national economic policies, though the left became a major force in the congress after the legislative elections of 1996. It has been the largest party in the legislature for the past several years – though short of a majority – and it increased its plurality in the March 2003 elections.
3.1.2 Economic Policies Economic policies provide the context for efforts to promote productivity. Without a favorable economic policy environment, the incentives facing business firms will not lead to competitive firms.
Historically, El Salvador followed economic policies that were largely laissez-faire. The government was small, providing only limited government services to rural areas. The country’s central bank was private until 1961, and maintained a passive monetary policy that kept inflation at the level of the country’s major trading partner, the United States.
Although subsequent governments during the 1960s and 1970s began to take a more activist stance, the Duarte period was still a sharp departure from the past. As mentioned above, the government took a central role in the economy, nationalizing banks and foreign trade in the main commodities. Government spending rose sharply, pushed by both higher defense spending due to the insurgency and by expanded government programs in health, education and other social sectors. Monetary policy became active,
Report on Competitiveness Promotion In Colombia & El Salvador Final Report
The Louis Berger Group, Inc. 40
supporting government spending, and controls were imposed on foreign exchange transactions to prevent depreciation of the currency.
The Cristiani government that took power in 1989 moved to restore the basic free-market orientation of productive activity. Commercial banks were privatised, foreign trade transactions were returned to private hands, and the exchange rate was allowed to depreciate to a market level. The government’s social policies, however, continued the orientation of the previous government, seeking to expand access to education and health, maintain the agrarian reform, and generally to promote broad-based development. The World Bank is effusive in its praise of these efforts (World Bank 1996, p.1):
Since 1989, El Salvador’s policymakers have accomplished three remarkable achievements: end the civil war; implement a coherent economic strategy leading to the stabilization of the economy and the reactivation of growth; and initiate a systematic attack on poverty…The country’s economic performance during the last six years is a remarkable success story. During the 1990s, El Salvador has registered among the highest growth rates in the hemisphere and this has occurred despite the migration of the best of its labor force to the United States.
The more recent UNDP Human Development Report for 2001 for El Salvador (UNDP 2001) offers data that paints an even more glowing picture of rapid economic growth and steady reduction in poverty. According to the Report (p. 263), the Index of Human Development rose faster in El Salvador during the 1990s than in any other Central American country. The percentage of the population in extreme poverty (p. 46) fell sharply between 1991-92 and 1999, from 28.2% of the population to 17%11.
The principal goals for macroeconomic policy had been achieved by the mid-1990s, and the government gave increasing attention to some sectoral problems. Government enterprises in electricity and telephones were privatized. The privatization of telephone service in particular had dramatic results. The number of cellular telephones has far outstripped the number of land lines, and telephone rates have fallen dramatically, with calls to the U.S. now below 20 cents per minute. The country’s overall economic growth rate fell in 1996, and averaged only 2.8% during the 1996-2002 period, compared to 6% during 1991-95. Inflation was brought under control during the first half of the 1990s, and inflation since 1997 has averaged only 2.0% per year.
Exchange rate policy. The Salvadoran colon was informally pegged at 8.75 Colones per dollar from 1993 onwards. Inflation averaged 10% per year during 1993-96, so the real exchange rate appreciated considerably vis-à-vis the U.S. dollar. Since then, inflation has approximated the U.S. rate. In 2001, the Salvadoran government adopted the U.S. dollar as a second legal currency, and undertook various actions to spur the use of dollars. By 2003, the dollar had become the currency for the great majority of financial transactions in the country, with the Colón circulating only in some rural areas. In effect, the country has undertaken a monetary integration with the United States. El Salvador is
11 Though the UNDP report provides impressive statistics on improvement in social indicators and reductions in poverty, the general tenor of the report is quite gloomy, focusing instead on the variation in well-being indicators in different parts of the country, on assertions of political polarization, and on damages from the 2001 earthquakes.

Report on Competitiveness Promotion In Colombia & El Salvador Final Report
The Louis Berger Group, Inc. 41
a highly suitable candidate for such integration. A substantial majority of Salvadoran trade is with the United States, and remittances from Salvadorans living in the United States represent about $2 billion in annual financial inflows.
Overall, Salvadoran economic policy is very favorable for economic growth and for trade development. There are no obvious policy gaps. There are obstacles to faster economic growth in the country, but these are less due to policy than to environmental conditions. The two most obvious ones are poor infrastructure and lack of education of the labor force.
The road infrastructure, particularly in rural areas, suffered during the civil war, both from lack of maintenance and the failure to make the new investments that would have occurred in peacetime. Ports are inadequate. The low average level of education of the labor force limits the opportunities for skills development and the upgrading required by higher-skill export industries. These problems are only susceptible to long-term solution through appropriate investments.
3.1.3 Trade Policy Since 1990, successive Salvadoran governments have striven to establish and maintain a very open and transparent trade policy, viewing liberal trade as important for the long-term economic growth of a small country like El Salvador. A related feature is a very liberal policy towards inward foreign investment, particularly investment intended for export. There seems to be very broad support for these views in the country. The main features of policy relevant to trade are given below.
Tariff structure. El Salvador undertook a major reform of its import tariff system in the early 1990s, sharply reducing maximum tariffs. The government had proposed moving to a uniform tariff of 6% on all imports in order to eliminate distortions that would result from variation in effective rates of protection for different commodities. Faced with resistance from industrialists and from other members of the Central American Common Market (CACM), a new tariff structure with rates ranging from zero to 15% was approved and went into effect in 2000. There is tariff escalation, with capital goods and raw materials not produced in Central America with zero or low rates, and consumer goods at the 15% rate. Nevertheless, this is a dramatic reduction from the very protectionist common tariff of the CACM, under which consumer goods were subject to 40-80% tariffs.
Foreign investment. El Salvador enacted a liberal foreign investment law in 1990, and has actively sought foreign investment as a major part of its export promotion program. Although some domestic firms operate in the country’s Export Processing Zones (EPZs), most firms there are foreign. The policymakers believe that foreign firms bring important technology and marketing advantages that can increase export dynamism. The country has been able to attract substantial amounts of investment in the last several years for both exports and domestic infrastructure. Both the national power system and the telephone company were sold to foreign firms, leading to a net foreign investment inflow of more than $1 billion in 1998. Direct foreign investment has been

Report on Competitiveness Promotion In Colombia & El Salvador Final Report
The Louis Berger Group, Inc. 42
rising in recent years, reaching a respectable $317 million in 2002, according to CEPAL. Nevertheless, any potential foreign investor visiting the country is sure to note the presence of armed guards in front of most businesses. The high level of crime and personal insecurity is likely to be an important obstacle to foreign investment.
Position on trade negotiations. Many developing countries see multilateral trade negotiations (MTN) as arcane and beyond their capacity for influence. This has not been the case with El Salvador or the other Central American countries. All have participated actively in MTN. Both Salvadoran officials and private-sector leaders were unambiguous in their support for closer ties with the world economy – and particularly with the major export partner, the United States. El Salvador and Costa Rica have been the two most active promoters of a free-trade treaty between the five Central American countries and the United States. Negotiations on this treaty began in early 2003, and a target date for completing negotiations of the end of 2003 has been established. El Salvador appears to be moving to meet most of its commitments to the WTO. Its investment regulations appear to provide for national treatment of foreign investment, including insurance and management of the new Salvadoran pension funds. The country has modernized customs procedures, permitting electronic filing of customs forms and self-declaration of duties.
Like the overall policy environment, trade policy is generally favorable for trade development. The Salvadoran government has a clear sense of policy direction, and has worked to put it into practice.
3.1.4 Trade Institutions El Salvador has a developed set of institutions – public, private, and non-profit – providing information and other services to promote competitiveness in world markets. A few organizations have long histories of support for technology development and export promotion for particular products (e.g., coffee, cotton, and sugar). For non-traditional products, however, most of the institutions that support exports have been established during the last fifteen years.
Ministry of Economy. The Ministry of Economy has primary responsibility within the government both for trade negotiations and for export and investment promotion. The Ministry re-acquired this responsibility after the abolition of a separate Ministry of Foreign Trade during the 1990s. One vice-minister is responsible for trade negotiations and Central American regional integration and another is responsible for export and foreign investment promotion. This appears to provide greater coherence in trade policy than when responsibility was divided between two ministries.
The competitiveness function is embedded in the office of the vice minister responsible for export and investment promotion. It is a small office with less than a half-dozen professionals, and is mainly responsible for promoting clusters.
Non-Governmental Organizations. Over the past fifteen years, El Salvador has developed a set of useful institutions supporting trade development. They provide a

Report on Competitiveness Promotion In Colombia & El Salvador Final Report
The Louis Berger Group, Inc. 43
means for the views of various actors in the export sector to communicate and interact. Private sector groups can identify obstacles to exporting and have greater capacity to gain the attention of government than individual firms. The main private groups have shown a capacity for sustainability, and a hard-headed focus on delivering services at minimum cost.
ASI. The Asociacion Salvadoreña de Industrias, or Chamber of Industry, has been a major lobbying organization for the industrial sector of the country. It continues in that role, but has gradually begun to play also the role of supporting productivity increases among its member firms, providing training programs on international standards relevant to its members.
Coexport. This institution, the Corporación de Exportadores de El Salvador, was originally set up during the early 1980s as a Committee of the Association of Salvadoran Industrialists (ASI). During the mid-1980s, Coexport established itself as a separate entity to give an institutional voice for non-traditional exporters. It provides a range of services for exporters and for foreign buyers, including a web page, a directory of exporters and a variety of specialized services. It receives funding for basic operations from its more than 300 member firms, and uses donor funding for a variety of projects to promote exports. It has received funding from USAID, the IDB, and the European Union, among others.
FUSADES. The Fundación Salvadoreña de Desarrollo Económica y Social is a non-governmental organization that operates mainly as an economic and social research institution, but has also promoted exports, foreign investment, and agricultural research. (The core members of the most successful Salvadoran cluster, ornamental plants, began as researchers on such products for a FUSADES subsidiary.) Like Coexport, it has received funding from USAID, the IDB, and the European Union, among others. Box 2 describes the recent experience of ABANSA, another business association in El Salvador, as it evolved, not linearly, away from the traditional model of lobbyist for special favors from government toward provision of services to members.
Report on Competitiveness Promotion In Colombia & El Salvador Final Report
The Louis Berger Group, Inc. 44
Box 2 - Evolution of the Banker’s Association (Abansa) For 1996 and earlier years, the annual report of the Asociación Bancaria Salvadoreña, Abansa, is a typical association report, focusing on lobbying activities, committee operations and the execution of the association budget in a document of about 15 pages. In 1997, the report grew to 54 pages. It stated that Abansa had changed its legal character, and redefined the role of the association. The report included more information about the association’s activities. It described the work of seven committees, and mentions four seminars, five technical training programs and six conferences organized by the association. It mentioned one study by the association, of interest rates and intermediation costs. The annual report also gave broad coverage to financial trends during year, including tables comparing El Salvador’s interest rates and intermediation costs with those of other Latin American countries. The report also mentioned that ten of the 20 largest banks in Central America are in El Salvador By 1998, the annual report had grown to 108 pages, and included tables on operations of banks for the first time, including two years of data for the member banks. Tables on national financial and economic trends were also added. In 1999, the report grew to 131 pages, and included six years of financial data on member banks. It also discussed El Salvador’s relative position in the world according to recent reports by the Fraser Institute and the Heritage Foundation, as well as the country ratings by ratings agencies. It announced the creation of five new committees: compliance, human resources, credit strategy, construction, and electronic clearing. It also reported that the association had been active in promoting an anti-money laundering law, and had pushed for a sub-regional seat for INTERPOL in El Salvador. The report said that the association had worked with a local business school (ESEN) to create a diploma course in banking and finance, and that it had developed a diploma program in risk management. The association also described work in promoting electronic clearance of checks, and published four studies, including one calling for dollarization of the economy. In 2000, the size of the annual report had shrunk slightly to 127 pages, but it added additional material. Financial statements for member banks were provided for seven years, and ten pages of national financial and economic statistics were included. The report announced that the Diploma in Banking and Finance began operations with 37 students. The association also said it had begun a program with INSAFORP, the Salvadoran apprenticeship training organization, to develop a program in banking specialization, which it hoped would begin in 2001. The association also sponsored a set of workshops on international accounting standards, began a web page, and hosted the annual meeting of Latin American Bankers, FELABAN. In 2001, the report grew slightly to 140 pages, including the same level of banking and economic information as in the previous report. The report identified some new initiatives, but the report on the association’s finances showed a 29% reduction in the organization’s expenditures. The association webpage indicates that the association newsletter suspended publication in 2001. The 2002 report was not available on the association website as of May 25, 2003. The Abansa experience shows the evolution of an association towards greater technical capacity and a higher level of services to its members. At the same time, the sharp decline in funding and activity in the association highlights the fragility and vulnerability of such organizations.
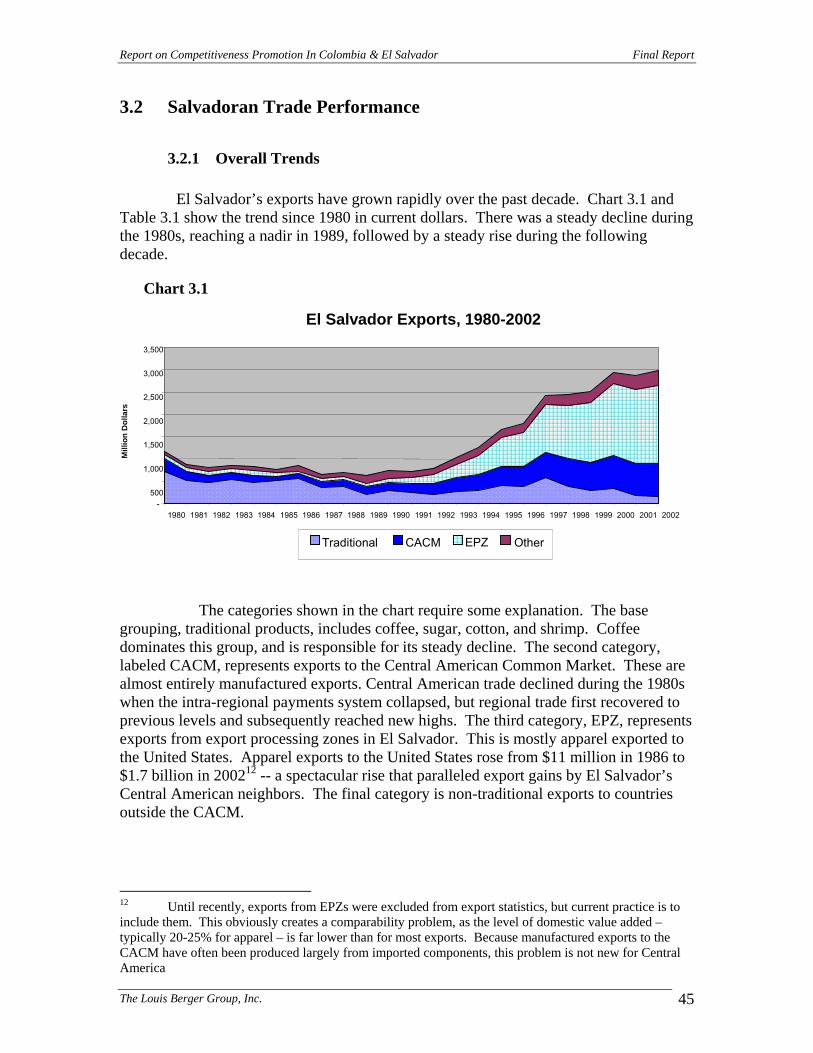
Report on Competitiveness Promotion In Colombia & El Salvador Final Report
The Louis Berger Group, Inc. 45
3.2 Salvadoran Trade Performance
3.2.1 Overall Trends El Salvador’s exports have grown rapidly over the past decade. Chart 3.1 and Table 3.1 show the trend since 1980 in current dollars. There was a steady decline during the 1980s, reaching a nadir in 1989, followed by a steady rise during the following decade.
Chart 3.1
El Salvador Exports, 1980-2002
- 1980 1981 1982 1983 1984 1985 1986 1987 1988 1989 1990 1991 1992 1993 1994 1995 1996 1997 1998 1999 2000 2001 2002
Mill
ion
Dol
lars
Traditional CACM EPZ Other
3,500 3,000 2,500 2,000 1,500 1,000 500
The categories shown in the chart require some explanation. The base grouping, traditional products, includes coffee, sugar, cotton, and shrimp. Coffee dominates this group, and is responsible for its steady decline. The second category, labeled CACM, represents exports to the Central American Common Market. These are almost entirely manufactured exports. Central American trade declined during the 1980s when the intra-regional payments system collapsed, but regional trade first recovered to previous levels and subsequently reached new highs. The third category, EPZ, represents exports from export processing zones in El Salvador. This is mostly apparel exported to the United States. Apparel exports to the United States rose from $11 million in 1986 to $1.7 billion in 200212 -- a spectacular rise that paralleled export gains by El Salvador’s Central American neighbors. The final category is non-traditional exports to countries outside the CACM.
12 Until recently, exports from EPZs were excluded from export statistics, but current practice is to include them. This obviously creates a comparability problem, as the level of domestic value added – typically 20-25% for apparel – is far lower than for most exports. Because manufactured exports to the CACM have often been produced largely from imported components, this problem is not new for Central America

Report on Competitiveness Promotion In Colombia & El Salvador Final Report
The Louis Berger Group, Inc. 46
Table 3.1
3.2.2 Trends in Specific Sectors Coffee. Throughout the 1960s and 1970s, El Salvador was the largest coffee exporter in Central America, and Salvadoran coffee typically sold at the highest prices in the region. This changed during the 1980s. Coffee production in El Salvador first stabilized and then gradually fell. In contrast, Guatemala, Costa Rica, and Honduras all
El Salvador Exports, 1980-2002
(Million Dollars)
Year Total Traditional CACM EPZ Other 1980 1,170 713 296 95 66 1981 878 521 206 80 71 1982 785 464 174 85 77 1983 848 538 165 90 67 1984 836 479 156 110 91 1985 764 510 96 85 72 1986 817 569 109 52 122 1987 660 366 120 70 104 1988 686 392 140 75 79 1989 637 214 163 80 180 1990 739 290 175 95 179 1991 720 253 195 132 140 1992 796 198 258 198 142 1993 1,032 270 310 290 162 1994 1,249 305 343 430 171 1995 1,652 407 427 647 171 1996 1,789 378 456 765 190 1997 2,416 576 579 1,057 204 1998 2,452 389 618 1,185 260 1999 2,510 290 639 1,333 248 2000 2,941 341 737 1,609 254 2001 2,864 185 722 1,650 307 2002 2,992 151 740 1,758 343
Source: Adapted from Banco Central de Reserva and IMF Traditional Exports are Coffee, Cotton and SugarCACM exports are those, nearly entirely manufactured goods, exported
to the (protected) Central American Common Market.

Report on Competitiveness Promotion In Colombia & El Salvador Final Report
The Louis Berger Group, Inc. 47
increased their production. El Salvador gradually lost its lead in coffee technology, as yields in other countries rose while they fell in El Salvador.
During the 1980s and 1990s, other countries were replanting with higher-yielding varieties while little such investment was taking place in El Salvador. Both the agrarian reform and the civil war, which was primarily fought in rural areas, likely contributed to the loss of Salvadoran competitiveness. This loss of competitiveness continued through the 1990s, even though the civil war had ended, the land tenure situation stabilized, and government policies made exporting more profitable. The sharp decline in world coffee prices in 2001 and 2002 further eroded coffee’s contribution to the Salvadoran economy.
Other traditional products. Besides coffee, three other products – cotton, shrimp and sugar – are classified as “traditional” exports. Cotton exports are of little consequence, having virtually disappeared during the 1980s from the combined effects of low world prices, land reform, and civil war. Sugar is an export industry only because of El Salvador’s preferential access to the protected U.S. market, and exports are determined by the level of U.S. quotas.
Central American Common Market (CACM). El Salvador exports a wide range of manufactured goods to Central America, with food products, textiles, and light consumer goods the main articles exported. Exports to Central America have been a dynamic element of Salvadoran trade. Policymakers argue that the expansion of trade within Central America during the 1990s differs importantly from the growth during the 1960s. Because all of the Central American countries have adopted maximum external tariffs of 15% or less, they argue, there is far less likelihood of trade diversion and of production using highly inefficient methods. There has also been a shift in El Salvador’s regional exports away from final consumer goods towards intermediate goods. The Salvadoran private sector notes another major difference between the 1960s and the 1990s in Central America – the presence of substantial Central American foreign investment. During the 1960s, most of the foreign investment in Central America came from outside, mostly the United States. These foreign companies were the major actors at the regional level. In recent years, in contrast, Central American-owned firms have begun to operate beyond their home country. This is particularly the case with retailing, supermarkets, and banking. Salvadoran entrepreneurs are particularly active. The Salvadoran airline, TACA, has also swallowed most of the national airlines from the other countries, and substantially improved regional travel schedules, using San Salvador as a hub.
Export processing zone products. The El Salvador EPZ exports are nearly entirely of apparel. Of all manufactured imports by the United States (the primary market for EPZ exports), 95% consists of apparel and other textile products. This has continued to be the case since the first private free zones were established around 1990. The growth in these exports has been spectacular, resulting from a combination of several factors: improved access to the U.S. market due to the Caribbean Basin Initiative; Salvadoran government policy changes that eliminated obstacles to the development of EPZs; and a change in competitive strategies by U.S. firms, leading them to compete with

Report on Competitiveness Promotion In Colombia & El Salvador Final Report
The Louis Berger Group, Inc. 48
apparel imports from Asia by shifting labor-intensive operations from the United States to Central America.
Other countries that made EPZs a major part of their export strategy, such as Costa Rica and the Dominican Republic, have been able gradually to diversify production in their EPZs. This typically involved movement from apparel into a variety of other assembly sectors, including electrical appliances, medical supplies, and other products. In the case of Costa Rica, it eventually led to the construction of a computer chip manufacturing facility by Intel. This diversification has brought several advantages. First, a more diversified production structure reduces vulnerability to demand trends in a particular sector. Second, these new assembly sectors typically require a more skilled labor force. They thus provide a mechanism for upward mobility for workers who acquire basic skills in apparel. In El Salvador, this mechanism cannot operate, because firms in other sectors have not come to El Salvador. At the same time, El Salvador’s EPZs appear to be using steadily more domestic value-added. The ratio of imports of the EPZ sector to exports has gradually fallen, from 81% in 1991 to 72% in 1999-2002.
The reasons for El Salvador’s inability so far to attract foreign investors in other assembly sectors are unclear. NAFTA may be a factor, leading companies to look no farther than Mexico. Costa Rica and the Dominican Republic had started to shift away from apparel when El Salvador was still being viewed as a risky investment target. If this is correct, it is another cost of the prolonged civil war: it made El Salvador unattractive when the opportunities for attracting foreign investment were most propitious.
Other non-traditional products. Donors and the Salvadoran government have promoted a number of other potential export sectors, including winter fruits and vegetables for the U.S. market, artisan products, and ethnic foods for Salvadorans living abroad. None of these sectors has yet shown substantial results. In the case of winter fruits and vegetables, El Salvador had some initial success with melons, sesame and okra. After several years of growing exports, however, exports of individual products have begun to fall off or disappear entirely. Since exports of these products from its Central American neighbors have continued to grow rapidly, El Salvador appears to be at a competitive disadvantage. Its lack of a Caribbean port for exporting to the U.S. east coast may be a contributing factor.
Services. Quantitative data on Salvadoran exports of services is skimpy, but the country has sought to establish itself as a leader in this area. The country is promoting tourism, though it lags behind most of its neighbors in this sector. Moreover, the high incidence of crime and the level of insecurity limit the country’s tourist appeal in the near term. El Salvador has the most robust banking sector in Central America, and Salvadoran banks have established affiliates throughout the region, as well as to serve the emigrant population in the United States. The Salvadoran airline is now dominant in the region, and San Salvador has become a regional hub. Salvadoran investment promotion efforts are now being aimed at establishing the country as a “call center” for services by telephone. Several companies have begun operating in the country in this sector.
The largest “service” export of the country in recent years has been labor services. More than 1 million Salvadoran emigrants live in the United States.
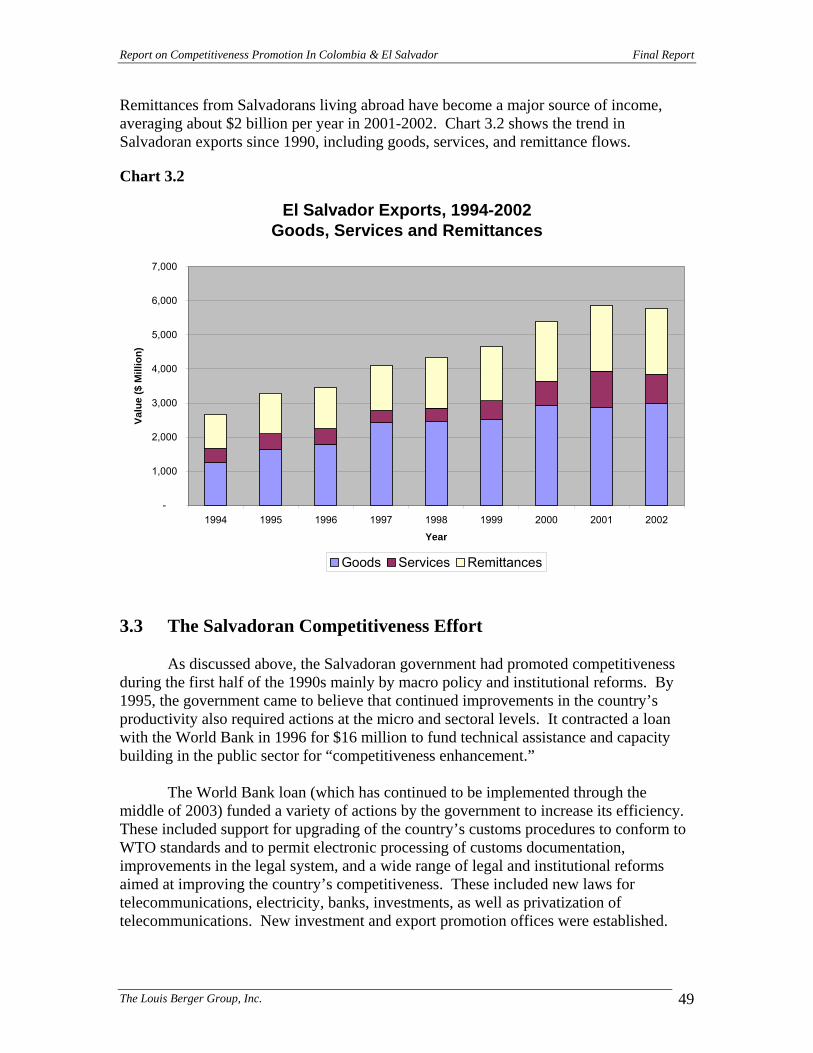
Report on Competitiveness Promotion In Colombia & El Salvador Final Report
The Louis Berger Group, Inc. 49
Remittances from Salvadorans living abroad have become a major source of income, averaging about $2 billion per year in 2001-2002. Chart 3.2 shows the trend in Salvadoran exports since 1990, including goods, services, and remittance flows.
Chart 3.2
El Salvador Exports, 1994-2002Goods, Services and Remittances
-
1,000
2,000
3,000
4,000
5,000
6,000
7,000
1994 1995 1996 1997 1998 1999 2000 2001 2002
Year
Valu
e ($
Mill
ion)
Goods Services Remittances
3.3 The Salvadoran Competitiveness Effort As discussed above, the Salvadoran government had promoted competitiveness during the first half of the 1990s mainly by macro policy and institutional reforms. By 1995, the government came to believe that continued improvements in the country’s productivity also required actions at the micro and sectoral levels. It contracted a loan with the World Bank in 1996 for $16 million to fund technical assistance and capacity building in the public sector for “competitiveness enhancement.” The World Bank loan (which has continued to be implemented through the middle of 2003) funded a variety of actions by the government to increase its efficiency. These included support for upgrading of the country’s customs procedures to conform to WTO standards and to permit electronic processing of customs documentation, improvements in the legal system, and a wide range of legal and institutional reforms aimed at improving the country’s competitiveness. These included new laws for telecommunications, electricity, banks, investments, as well as privatization of telecommunications. New investment and export promotion offices were established.

Report on Competitiveness Promotion In Colombia & El Salvador Final Report
The Louis Berger Group, Inc. 50
Most of the activities were aimed at increasing the efficiency of the public sector in support of competitiveness, or in improving the legal environment for business. These activities supported improved competitiveness at the macro or institutional level. One aspect, however, sought to promote competitiveness at the microeconomic, or Porter level, by stimulating the development of clusters.
3.3.1 Cluster Promotion The first government-promoted clusters were established in about 1997, with technical assistance from the Monitor Company and the Ministry of Economy. The effort to promote clusters was preceded by a series of conferences and workshops where Monitor staff presented analyses of the competitive problems of El Salvador, putting them into the framework of the Porter diamond. (Altogether, the Monitor staff estimate that they gave presentations, either of the overall diagnosis or of cluster ideas, to 10,000 people in El Salvador.) The Monitor analyses concluded that El Salvador had a very severe competitiveness problem. The country was over-dependent on basic commodity production – notably coffee and apparel – for which prices had a long-term negative trend. Concentration on this sector of production would consequently mean falling wages and a declining standard of living. The country’s infrastructure – in areas like roads, ports, and education – was inadequate to the competitiveness challenge. They put forward a six-point program for the private sector to improve its competitiveness, based on a better understanding by entrepreneurs of El Salvador’s relative position:
• Avoidance of overdependence on natural resources or cheap labor • Increased knowledge and understanding of foreign clients • Forward integration into higher value-added activities • Better cooperation among firms • Improved communication by avoiding defensive attitudes • Fighting paternalism.
The Monitor message was thus one that combined prescriptions for improving productivity by repositioning firms, upgrading employee skills, and understanding the needs of buyers, with cultural prescriptions, intended to change “mind-sets” of Salvadoran entrepreneurs. Drawing on the Monitor diagnosis, the government chose to develop cluster programs for leading sectors. Initially, four sectors were chosen: coffee, apparel, handicrafts, and the emigrant community. The Ministry of Economy selected the membership of these clusters, based on judgments about the individuals who would be broadly representative of the sector. An extensive diagnosis was undertaken of the competitive situation of each cluster, using the “Porter diamond” as the basic structure for the analysis. These studies were quite elaborate and detailed. They included analysis of the world market situation for the products of the sector; interviews abroad to determine the competitive position of

Report on Competitiveness Promotion In Colombia & El Salvador Final Report
The Louis Berger Group, Inc. 51
the Salvadoran producers; an analysis of cost, quality, and pricing positions of the Salvadoran producers in comparison to firms elsewhere; and analysis of weaknesses in the value chain for the sector. These results were then presented to cluster members in the form of PowerPoint slides, and used as a basis for a dialogue on sector problems and appropriate responses. The analyses were of generally very high quality, drawing upon extensive market research, surveys, and analysis of world market conditions and trends. This initial work with the four clusters proved less successful than had been expected. In some cases – most notably, coffee – there was sharp conflict between the Monitor diagnosis and the views of leading members of the cluster. Moreover, the work of the clusters was not producing the kind of pro-active sector action plans that had been expected. Monitor and Ministry of Economy officials concluded from this experience that the approach of selecting members of clusters was an error. While it may have been representative of the sector in question, the cluster membership was often status-quo oriented, and did not see a need for action. (In the case of coffee, subsequent developments on world markets made believers of some growers who had been status-quo oriented in 1997.) Moreover, this approach failed to generate sufficient private-sector leadership in deepening the work of the cluster. Four more clusters were subsequently established. The clusters selected were based on proposals by groups of entrepreneurs, who also made commitments for partial funding of the effort. This process of self-selected groups was much more successful. The four clusters assisted during this phase – beekeeping, ornamental plants, machine tools, and tourism – fared much better than the original four clusters. Subsequent to the two-year effort supported by Monitor, the Ministry of Economy contracted an expert from the Instituto Tecnológico de Estudios Superiores de Monterrey, Mexico. The Institute had worked on cluster development in the State of Chihuahua in Mexico. The new effort sought to “indigenize” cluster promotion by using staff and local consultants of the Ministry of Economy to promote cooperation. Under this revised approach, several additional clusters were established, including fisheries, information technology, and agribusiness. The Ministry strengthened its own capacity to promote clustering, using two professional staff members and several consultants to work with clusters. The Ministry also moved away from the use of the word “cluster,” preferring to use asociatividad in its place, for some thought that cluster had become tainted with big theories, rather than practical improvements in firm operations. Asociatividad also became linked to promotion of small and medium enterprises (SMEs), and promotion of cooperation among small business to improve technology. The Ministry of Economy now sponsors an annual conference on asociatividad, which draws more than one thousand small entrepreneurs.

Report on Competitiveness Promotion In Colombia & El Salvador Final Report
The Louis Berger Group, Inc. 52
3.3.2 Results of the Cluster Experiment
Interviews were carried out with members of seven of the Salvadoran clusters during the first quarter of 2003. Given below are summaries of their experiences. The seven include all that were identified in preliminary interviews as being successful. 1. Coffee Coffee was one of the first clusters established, in 1997, with the assistance of Monitor. The Ministry of Economy selected the initial membership to reflect the major interests in the coffee sector, including growers, processors, exporters and marketers. Monitor’s diagnosis of the sector emphasized that – according to their studies – Salvadoran coffee had a poor reputation in external markets. Monitor recommended major efforts to upgrade quality and to move away from commodity sales, making substantial new investments. They proposed using branding, market niche development and other tools to increase the average price at which Salvadoran coffee could command on world markets, and recommended that producers should give greater emphasis to the U.S. market and less to the traditional European one. The sector leadership clashed strongly with Monitor and generally rejected their diagnosis. The Salvadoran coffee Council recommended dissolution of the cluster in November 1998. In March 1999, the Ministry of Economy attempted to re-form the cluster to include only producers, but this also did not prosper. Cluster members were generally unwilling or unable to make new investments in the sector. At the end of 2000, the Ministry of Economy saw little further it could do to promote the cluster, and terminated its involvement. This was about the time that world coffee prices collapsed. Since that time, some firms have found market niches, as others had prior to the end of effective operation of the cluster. Overall, the message carried by Monitor was prophetic for the sector, as only those producers that have moved away from commodity production of coffee to some niche (branded coffee, organic coffee, “fair trade” coffee, or some other specialization) have managed to limit declines in prices. 2. Ornamental Plants This is regarded as the most successful cluster, both in terms of export growth achieved, and in cooperation among the members. The ornamental plant export sector is made up of 11 firms, 10 of which belong to the cluster. Most of the firms are small, exporting in the range of $250,000 per year, with one medium and one large firm. Exports in 1992 were about $10 million. The cluster predates the work of the Monitor group by about six years. The original technical work to establish ornamental plants as a potential export industry was done in the late 1980s by Divagro, an affiliate of FUSADES, a Salvadoran NGO that has worked in economic research, export and investment promotion and agricultural technology. FUSADES had received substantial donor funding in the 1980s to do

Report on Competitiveness Promotion In Colombia & El Salvador Final Report
The Louis Berger Group, Inc. 53
agricultural research (for which it maintains an experimental farm) and to provide technical assistance to the agricultural sector. Divagro identified potential markets, obtained cuttings and developed a set of cultivation practices. A number of the cluster members worked for Divagro before entering into production themselves. Several of them traveled together to Holland in 1991/92, and concluded that the industry had potential, and that cooperation among the producers was important to success. They formed a group, Exportplant, as a committee of the private-sector export promotion organization, COEXPORT. Since that time, they have been exporting together. This involves combining their individually-small shipments into a single larger one, and using the same broker abroad to receive the shipments. Each shipper’s goods are boxed separately, and sold separately in the foreign market. The cluster members agreed on a single box size, allowing for economies in purchasing, and they were able to reach agreement with the Ministry of Agriculture on imports of specialized pesticides and other products. They have been permitted to import for their own use any product that is on the U.S. EPA’s approved list, even though its use is not otherwise approved in El Salvador. They are prohibited from transferring such products to other firms. They have cooperated to pay for technical assistance, usually annually from an expert from a U.S. laboratory specializing in tropical plant inspections. They also claim that their cooperation has made El Salvador a more attractive source for foreign buyers. The openness of the firms appears to stem in part from their common experience at Divagro, but it also flows from a belief that more production of such plants in El Salvador would produce economies for the industry. They view the foreign market as so large that their shared interest in larger production far outweighs problems from competition among themselves. Monitor worked with them intensively during 1997-98. Meetings lasting 2-3 hours were held twice a week. They learned much from the exercise, one important lesson being the wide variety of different kinds of buyers in the United States. This knowledge enabled them to tailor their products better to the right market niches. While the Monitor assistance was useful, it was also considered to have been too intensive, and contained too much theorizing. The cluster recently hired a secretary, paid jointly by the cluster members. This has not proved to be as useful as originally expected. They now intend to hire a technically-capable manager for the cluster as a better alternative. The new Salvadoran government’s export promotion fund (Foex) has approved a grant to cover half of the cost during an initial period. Some cluster members hope that the cluster will evolve into a marketing firm to serve the industry, though others are not convinced. Proponents see this as a development that would produce economies by reducing the number of selling trips to foreign markets by individual producers, and by providing additional research into foreign market trends and new product possibilities.
Report on Competitiveness Promotion In Colombia & El Salvador Final Report
The Louis Berger Group, Inc. 54
3. Information Technology This cluster was established in mid-1999, under the direction of the Ministry of Economy. It brought together professionals from various companies in the information technology sector (software, systems, packaging, hardware distribution, and telecommunications) with 120 Salvadorans who had recently returned from a 9-month information technology training program in India. The study in India had been partly financed by the government, with the hope of establishing an information technology training center in El Salvador with links to India. This project never materialized. For the first several months, this unwieldy group sought to define goals and activities for the cluster, but this proved unworkable. Late in 1999, the cluster was re-formed to include people with long-term visions and real-life working experience in the field of IT, in an attempt to produce more down-to-earth working proposals, and was reduced to about ten people in the various parts of the information technology business. The group spent much time over the next few months – usually with about one meeting per month – trying to develop a program that represented common interests. Ultimately, this did not prove possible, for the members of the cluster still represented very diverse businesses. They included firms interested in selling hardware or software, firms developing software, internet service providers and academics. Not enough common threads were found to bring them together on joint activities. Rather than continue to seek common ground, the group redirected its efforts to trying to visualize possible futures for information technology in El Salvador, without necessarily trying to link the work to activities of the companies represented in the cluster as the main objective of the group, although this was not excluded as a secondary goal. They saw this mainly as a contribution to the national strategic effort, rather than as a business proposition. After completing their work, they sought a foreign consultant to come to El Salvador to review their analysis and make recommendations about their feasibility. After a considerable period of seeking financing and developing a terms of reference, the IDB brought a consultant team to review the analysis. Reportedly, the IDB consultants concluded in November 2001 that the proposals were generally unfeasible in view of stronger competitive capabilities in other countries and the lack of a sufficient pool of trained Salvadoran information technology professionals.
With the review of the IDB study, the cluster effectively stopped operating, and did practically no work in 2002. In early 2003, one officer of the Ministry of Economy discussed with them the possibility of re-forming the cluster to be centered only around software development, in order to permit focus on a narrow set of common objectives. This seems to be a good learning process, as the diversity in the composition of the cluster proved to be more of an obstacle than an asset. As of early February, 2003, nothing more had happened to move this idea forward. 4. Fisheries The fisheries cluster was started in mid-1999, following a meeting called by the Ministry of Economy’s competitiveness unit, at which 30-40 people attended. The cluster

Report on Competitiveness Promotion In Colombia & El Salvador Final Report
The Louis Berger Group, Inc. 55
was established with representation from the commercial fishing sector, the artisan fishing cooperatives, the fisheries association, the Ministry of Economy and the Ministry of Agriculture. For most of the first several years, the cluster met weekly, with meetings lasting several hours. The cluster sought to increase cooperation between the artisan and the commercial sector and to provide a broad approach to the future development of the sector. It scored an early success by developing a contract for fuel purchases by the fishery sector with suppliers. Initially, this brought large benefits to the sector through lower prices. This joint purchasing saved the sector an estimated $40,000 per month in lower fuel bills. Severe weather problems (Hurricane Mitch, El Niño) led to sharply lower production, losses by firms, and failure by some to pay their fuel bills. This led to the collapse of the contract arrangement. Some fishermen still owed fuel suppliers several years later.
A second major initiative – so far unsuccessful – has been to convince the government to exempt fuel costs for fishing boats from the Fondo Vial tax – a tax on fuel used to fund highway maintenance and construction. They argue that the tax was intended only to cover fuel for road transport, which the fishing sector does not use. The period during which the cluster has operated has been a difficult one for the fisheries sector. Exports fell from $38 million in 1998 to $22 million in 2002. Shrimp has been the largest product. There was a slight recuperation of production in 2002, and some members are optimistic about possibilities for the industry’s future. Shrimp is not a growth industry, but diversification into other products – requiring new equipment, such as long-line boats – is thought to be more promising. The artisan sector includes 17 loosely-organized cooperatives in a federation (Facopades) and numerous independent fishermen. There are about 5,000 artisan fishermen. The cooperative sector has been declining, and is technologically and financially very weak. Nevertheless, representatives of the cooperative sector have found the cluster to be very useful, particularly as a vehicle for greater understanding with the commercial sector and the government. Before the development of the cluster, there were sharp antagonisms and mutual suspicion between the two artisan and the commercial fishermen. This appears to have declined sharply, as both recognize shared interests in maintaining the quality of the resource base and the need to work together on policy issues. The cluster contains the same players as the National Fisheries Council (Consejo Nacional de Pesca, Conapesca), but with the difference that the private sector has the lead role in the cluster. The cluster discussed extensively a new national fisheries law before it was approved two years ago, and members thought that they had achieved important improvements from the original draft of the law. Another cluster success may have been the decentralization of Conapesca. The cluster continues to operate, now meeting bi-weekly.

Report on Competitiveness Promotion In Colombia & El Salvador Final Report
The Louis Berger Group, Inc. 56
5. Agribusiness The Agribusiness cluster is organized around a few specialized crops – chile pimiento, loroco, and other specialized ethnic products. The cluster is composed of small firms, including cooperatives. Cluster activities have included promotion of understanding of U.S. EPA regulations, promotion of improved quality, and marketing of Salvadoran products. Donor funding has made it possible for cluster members to attend an agribusiness trade show in Vancouver in 2002, and, prospectively, one in Montreal in 2003. Some members complain that the cluster has achieved little, having spent two years debating what to do, and not arriving at a consensus. The heterogeneity of the cluster membership is one factor in this problem. Also, ambiguity of the lead government role between the Ministry of Agriculture, a cluster member, and the competitiveness unit of the Ministry of Economy is another issue. 6. Apiculture The apiculture, or honey products, cluster has been operating as an ongoing group since November 1998. The Monitor group had extensive meetings with the group, developed a study of the sector, a diagnosis of its problems and an action plan for further development. The cluster includes the three major producers of honey-based products, a representative of the Ministry of Agriculture, an academic researcher and the cooperative movement that brings together about 630 rural beekeepers who provide raw material. The beekeepers are generally small farmers, who have beekeeping as a part-time activity. There had been no national standards for quality of honey products prior to formation of the cluster, but two industry standards have now been developed. The cluster members have also jointly worked to standardize and improve the containers used for transporting honey, with an estimated 20% reduction in packaging costs. There has also been some joint exporting to achieve cost reductions. The cluster has benefited from substantial technical assistance mainly through Swiss Contract. Short term advisors on production, laboratory testing and other issues have come from five or six countries. Production of honey had declined from a peak in the 1980s of about 3,500 tons per year, to about 1,500 tons per year when the cluster was formed. There has been a recovery to about 1,800 tons at present. Expansion of production is limited by the scarcity of appropriate land in El Salvador for bee-keeping. Some efforts are underway to expand production in neighboring countries. Exports of honey products were about $5 million in 2002. Volume is likely to remain stable in the near future, though the value of exports might double in 2003 to $10 million because of sharply increased world prices due to production problems elsewhere. 7. Metalworking This cluster has 10 members, most of which are small firms producing specialized tools and dies. Most of the firms have annual sales in the $50,000-$200,000 per year

Report on Competitiveness Promotion In Colombia & El Salvador Final Report
The Louis Berger Group, Inc. 57
range. Metalworking was one of the second group of four clusters for which Monitor produced sector analysis and a diagnostic. It was chosen for support in part because the incipient cluster members agreed to contribute a share of the cost of the work. The Monitor diagnosis recommended that the firms in the cluster work to upgrade the quality of their products, adopting ISO standards, and investing in newer machinery to permit smaller tolerances. Cluster members considered the diagnostic to be very good, and have worked to implement the recommendations. The cluster members jointly participated in obtaining a computerized numerically-controlled machine to use for specialized work and for training and technical assistance to member firms. The cluster has been able to obtain technical assistance from several sources, and works closely with Salvadoran apprenticeship training institutions. The cluster maintains a web page that provides limited information about the capabilities of some member firms. 3.3.3 Conclusions about Clusters The seven cases above are clearly a very mixed bag. But five generalizations can be generated from the experience.
• Clustering has been no panacea. So far there have been no large, sustainable, financially important results from the effort.
• Support for the cluster effort has continued to be strong. The businessmen
who participate apparently derive some important benefits from the effort, or it would not continue. Since many participants are businesspeople who place a high value on their time, something valuable is being transmitted.
• The sectors where progress has been made are a very small share of El
Salvador’s exports. They may have importance in the longer term, but even rapid growth in the near term would have no noticeable impact on overall export statistics.
• The cases where there is substantial cooperation among members are those
with the longest track record of cooperation – a record that precedes the government’s effort to promote clusters. Such long periods of cooperation appear to have generated trust among the members that makes joint action easier.
• Finally, interviews identified – as in the Colombia case – individual
enterprises where the competitiveness effort led to major changes in strategy and operations in directions likely to be favorable to long-term competitiveness.

Report on Competitiveness Promotion In Colombia & El Salvador Final Report
The Louis Berger Group, Inc. 58
3.3.4 Other Competitiveness Promotion Activities
Beyond the promotion of the clusters discussed above, the Ministry of Economy has also promoted collaboration among small businesses in specific geographical regions. The Ministry sponsors an annual conference on associativity, which draws very large numbers of participants. Some interviewees considered this to be a useful and productive endeavor, but further exploration of this was not possible.
The government also established an export promotion organization and a public-private investment promotion entity. In both of these cases, NGOs with private-sector backing had been carrying out useful activities. The effect of creation of a government-supported institution seems to have been to create competition, rather than collaboration, with the private-sector predecessor. To the extent that this impression is correct, it is a reflection of the continued operation of the “old model” in Latin America, where the government needs control of activities in which it has an interest. In the “new model,” espoused by Porter and others, government would seek to complement the efforts of NGOs and private associations whenever useful for national purposes, rather than substitute for them. 3.4 Indications of Changes in Salvadoran Competitiveness
3.4.1 Export Statistics
The discussion above noted that there was no significant increase in exports at the sector level that can be associated with cluster development. Two – coffee and fish – suffered drastic declines, the former because of world prices and the latter because of climactic conditions.
Were there any sectors where exports did grow rapidly, and, if so, what were the
factors involved? Table 3.2 provides a comparison between 1998 and 2002 for all 2-digit harmonized-system categories where the export value rose by more than $10 million. A second part of the table shows those categories where export value declined by more than $10 million over the same period. Coffee and fisheries were joined by cosmetics in the latter listing.
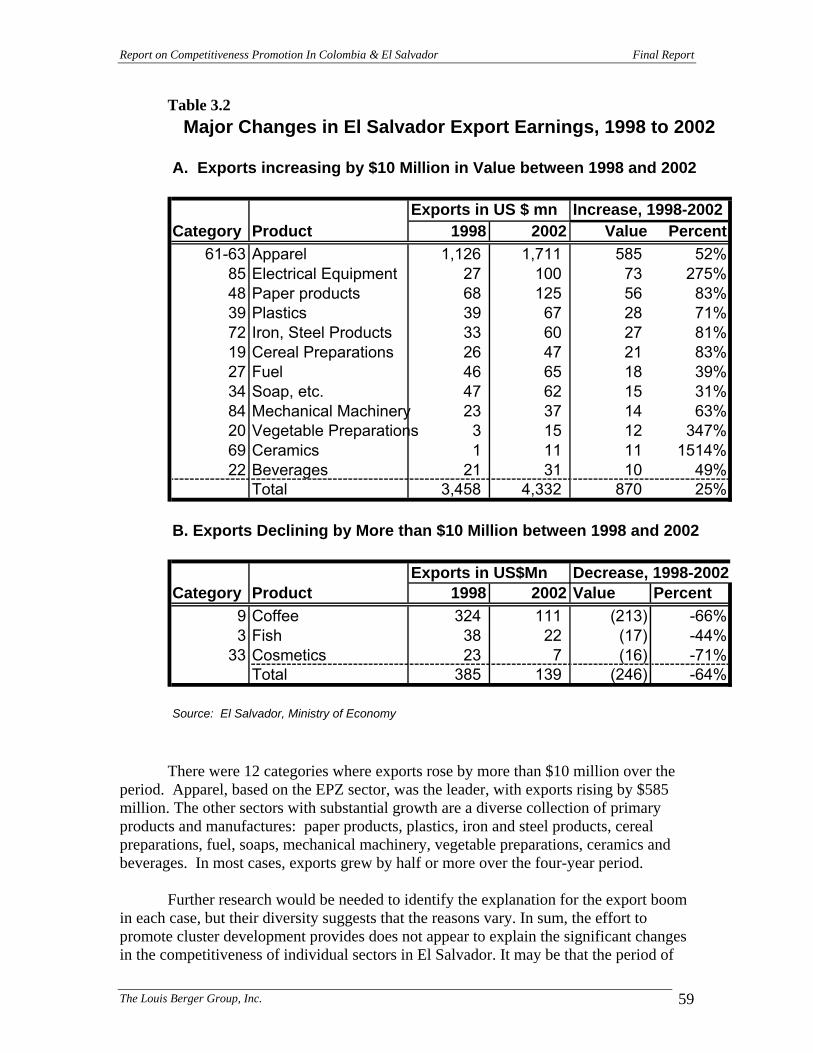
Report on Competitiveness Promotion In Colombia & El Salvador Final Report
The Louis Berger Group, Inc. 59
Table 3.2
There were 12 categories where exports rose by more than $10 million over the
period. Apparel, based on the EPZ sector, was the leader, with exports rising by $585 million. The other sectors with substantial growth are a diverse collection of primary products and manufactures: paper products, plastics, iron and steel products, cereal preparations, fuel, soaps, mechanical machinery, vegetable preparations, ceramics and beverages. In most cases, exports grew by half or more over the four-year period.
Further research would be needed to identify the explanation for the export boom
in each case, but their diversity suggests that the reasons vary. In sum, the effort to promote cluster development provides does not appear to explain the significant changes in the competitiveness of individual sectors in El Salvador. It may be that the period of
Major Changes in El Salvador Export Earnings, 1998 to 2002
A. Exports increasing by $10 Million in Value between 1998 and 2002
Exports in US $ mn Increase, 1998-2002Category Product 1998 2002 Value Percent
61-63 Apparel 1,126 1,711 585 52%85 Electrical Equipment 27 100 73 275%48 Paper products 68 125 56 83%39 Plastics 39 67 28 71%72 Iron, Steel Products 33 60 27 81%19 Cereal Preparations 26 47 21 83%27 Fuel 46 65 18 39%34 Soap, etc. 47 62 15 31%84 Mechanical Machinery 23 37 14 63%20 Vegetable Preparations 3 15 12 347%69 Ceramics 1 11 11 1514%22 Beverages 21 31 10 49%
Total 3,458 4,332 870 25%
B. Exports Declining by More than $10 Million between 1998 and 2002
Exports in US$Mn Decrease, 1998-2002Category Product 1998 2002 Value Percent
9 Coffee 324 111 (213) -66%3 Fish 38 22 (17) -44%
33 Cosmetics 23 7 (16) -71%Total 385 139 (246) -64%
Source: El Salvador, Ministry of Economy
Report on Competitiveness Promotion In Colombia & El Salvador Final Report
The Louis Berger Group, Inc. 60
time considered is too short for cluster work to achieve results. Alternatively, export statistics may be an inadequate indicator of changes in competitiveness, for any of a variety of reasons.
Two issues in particular should be mentioned. First, export statistics may be
unreliable. A comparison of El Salvador’s reported exports to its largest trading partner, the United States, with reported imports by the United States from El Salvador reveals differences that are often large -- sometimes dramatically so – between the two sets of numbers. Second, structural changes that enhance competitiveness in the longer term might be masked by world price declines. The most obvious possibility in this regard is coffee, but much greater refinement of statistics would be needed to uncover this. For example, Salvadoran exporters might be successfully exploiting niches in the world coffee market that allow their products to command higher prices than heretofore. Fluctuations in world prices and the existence of forward sales make the identification of such possibilities from aggregate value and volume data impossible to identify except through firm-level data.
3.4.2 Other Indicators of Progress
A second indicator of progress is that provided by the Global Competitiveness Report. The performance of this variable is discussed in the next chapter, along with the methodological issues related to that report.
In a broader sense, the government’s effort to promote competitiveness has had
mixed results. Some business firms interviewed credit the initial diagnosis and proposals by Monitor with helping spur them to re-orient their business strategy in a more successful direction. Others have seen the effort as having yielded few concrete results in changed outlooks, more active cooperation among firms for common purposes, or new investment decisions.
In terms of discussions among business leaders, the concepts have taken hold
much less effectively than in Colombia. Similarly, the extent of academic involvement in promoting Porter’s concepts, or in analyzing El Salvador’s production chains in efficiency terms seems far less developed than in Colombia. The original Monitor diagnoses are not matters of any current discussion. There appear to be few Salvadorans who participated in the original studies who continued to be active on these issues. Some attribute this to the use of foreign experts to carry out most of the studies, with little use of Salvadorans except for data-gathering.
The effort to promote collaboration among small businesses is possibly an area
where significant results are being achieved, but insufficient information was gathered on this issue to draw any conclusion.

Report on Competitiveness Promotion In Colombia & El Salvador Final Report
The Louis Berger Group, Inc. 61
3.5 Conclusions
1. El Salvador’s government has done much to promote the country’s competitiveness. These include:
• Various legal reforms; • Stable macroeconomic policy, including dollarization; • Creation of new support institutions for exporters and investors; and • Government procedural simplification, reducing lobbying role.
2. The initial efforts were not successful in changing business strategies or in catalyzing clustering of importance to the economy. Interviewees suggest that the Monitor studies were of very high quality and presented by capable people. Nevertheless, the approach was seen as including too much theory and too little practical implementation in the Salvadoran context. The effort to institutionalize the work and adapt it to the local culture was also seen as insufficient. Finally, the initial choice by the Ministry of Economy of the members of the initial clusters was seen to have been a mistake. 3. The current cluster program has more private-sector leadership than the initial effort, and good technical support from the Ministry of Economy, but several issues are evident. The successful clusters are still very unimportant to the overall economy. The interviews suggested that many – perhaps a majority of the participants in cluster work in El Salvador – did not see this as an economic activity. They saw no economic benefits (higher profits, lower costs) as near term outcomes. Rather, they were engaged more in what might be called a cultural change program. In part, this result may underscore an important difference with the Colombia model where the National Council and convenios play an important role. In general, participants saw increased communication among different segments of the production chain, or different sectors of the same part of the chain (e.g., commercial fishermen and artisan fishermen) as being important in an intangible sense to the country’s development. Profits to the individual firms might eventually come, but more from a change in the overall climate than from specific cluster actions.
4. Private-sector associations and other NGOs are evolving, some slowly, away from the lobby to government model towards the Porter model, where associations exist primarily to provide services for members. This is a promising area for donor support, as long as donors are selective, and effective in pushing associations toward provision of public goods and away from rent-seeking. The government appears to have difficulty playing a subsidiary role and giving the lead to non-governmental entities. This has produced conflict in some cases where cooperation with private groups would have been more beneficial, with the government establishing new organizations to replace – rather than to cooperate with – private efforts.

Report on Competitiveness Promotion In Colombia & El Salvador Final Report
The Louis Berger Group, Inc. 62
4. Measuring National Performance in Competitiveness 4.1 Introduction
This chapter addresses the question of how to measure performance at the national level in improving the competitive environment for business. Success at the level of clusters or of individual firms cannot be extrapolated to the country level. Even where a country is losing its capacity to keep up with the rest of the world, some industries will show dynamism and export and employment growth. Moreover, donor agencies are much more concerned with success at the country level than with success in a particular industry. Consequently, it is important to track the performance of the country as a whole in becoming more productive. This chapter provides an analysis of the major alternative sources of measurement in this regard, identifying the strengths and limitations of each of the major approaches.
The previous chapters suggested that the Global Competitiveness Report, or GCR,
an annual document produced by the World Economic Forum for measuring the degree of competitiveness of countries like Colombia and El Salvador, can be a useful tool in monitoring the performance of competitiveness projects. The GCR has been controversial, but it also provides much useful data, useful for tracking trends in a country’s competitive capacity relative to the rest of the world.
This chapter analyzes three different approaches to measuring country
performance. First, it discusses the GCR, the variables it uses, the changes over time in the Report’s approach, the critiques that have been made of the Report, and the extent to which the Report’s indicators can be used to assess progress in improving competitiveness. Second, it considers the usefulness of a very new database developed by the World Bank to assess conditions facing the private sector in a consistent manner across countries. Third, it considers an approach used by the Heritage foundation to measure country environments for private sector development.
4.2 The Global Competitiveness Report (GCR)
The Global Competitiveness Report ranks the competitiveness of countries by
assessing their prospects for medium-term economic growth as well as the development and quality of their current economic environment.
4.2.1 The Methodology of the Global Competitiveness Report
The first difficulty in using the GCR is that the report’s methodology, as well as
the countries examined, has changed each year since its inception. The number of countries included has risen steadily, year by year, from 49 in 1996 to 80 in 2002/03. The assessment methodology has also changed yearly. All changes are documented clearly in the Reports, and there is a steady progression toward more complex and more nuanced measurement. There is a clear break in approach with the 2000 Report, in which

Report on Competitiveness Promotion In Colombia & El Salvador Final Report
The Louis Berger Group, Inc. 63
a single index for competitiveness is replaced by two: one index of Growth and Competitiveness, and a Current Competitiveness Index. The discussion below discusses the general structure of the Reports, and reviews the changes that have been made over time.
For the early Reports (1996-1999), the indicators were grouped into eight factors,
linked to the Porter view of a country’s competitive environment. The 1999 report (p. 97), which presents the clearest and most sophisticated description of these factors, which include openness, government, finance, infrastructure, technology, management, labor and institutions. The ratings for some of these factor indices were constructed based entirely on quantitative data, some entirely on qualitative data (usually surveys of business firms), and the rest on a mixture of quantitative and qualitative data. Whenever both quantitative data and survey data was available, higher weight was given to quantitative data because econometrically this type of data is found to be more robust. In situations where quantitative data were not available or survey data was seen as preferable the weights reflected this.
The factors that make up the Competitiveness Index changed in 2000, in 2001 and
2002. The most dramatic change occurred in the 2000 report. In that year, the report stopped using a single overall ranking. It was replaced by two different indices: the Growth and Competitiveness Index and the Current Competitiveness Index. These two indices were based on most of the same factors used to determine the overall ranking in previous years, but there were key differences in emphasis. The model of competitiveness, though still intended to measure medium-term growth prospects, underwent significant changes. The key factors in the previous model—openness, government, finance, and labor—were mainly macroeconomic factors. From 2000 onward, the model gave more stress to microeconomic factors and to local “mindset” concerns -- such as “sophistication of company operations and strategy.” This approach included more extensive data on firm-level conditions and perceptions than the previous model, which subsumed these concerns into the management factor. Additionally, openness and labor were dropped as organizing factors in the construction of the competitiveness rankings in 2001 and 2002. Both were considered key determinants in the original model.
Table 4.1 shows the manner in which the structure of the ranking system has
evolved over time. Under the system used in 2000 and later, the Growth Competitiveness Index (GCI) incorporates most of the macroeconomic variables, grouped into three sub-indexes:
• Macroeconomic environment; • Public institutions; and • Technology.
This index is intended to be a predictor for economic growth for the next five to eight years. The second index, the Microeconomic Competitiveness Index (MCI) looks at two sub-factors:
• Quality of the business environment; and • Sophistication of company operations and strategy.

Report on Competitiveness Promotion In Colombia & El Salvador Final Report
The Louis Berger Group, Inc. 64
The authors argue that good performance on the overall macro policy, as measured by the GCI index, is necessary but not sufficient for rapid productivity growth. The MCI index is intended to serve as a determinant of the capacity and willingness of the business community in a country to respond to the environment. Altogether, the five sub-indices draw upon 188 individual indicators. These are listed in Appendix 3, together with the scores of Colombia and El Salvador for each measure.
Table 4.1. Changes in Determinants Used to Estimate Competitiveness Ranking in the Global Competitiveness Report 1996-1999 2000 2001-2002
Overall Ranking Growth Competitiveness Index Ranking
Growth Competitiveness Index Ranking
Openness Index Rank Economic Creativity Index Rank
Technology Index Rank
Government Index Rank Finance Index Rank Public Institutions Index Rank
Finance Index Rank Openness Index Rank Macroeconomic Environment Index Rank
Infrastructure Index Rank
Technology Index Rank Current Competitiveness Index Ranking
Current Competitiveness Index Ranking
Management Index Rank
Sophistication of Company Operations/Strategy Index Rank
Sophistication of Company Operations/Strategy Index Rank
Labor Index Rank Quality of the Business Environment Index Rank
Quality of the Business Environment Index Rank
Institutions Index Rank 4.2.2 Evaluation of the Methodology
There have been several critiques of the GCR. Sanjaya Lall ( 2001) is the most complete. His criticisms are quite extensive: that the definitions are too broad, the approach biased, the methodology flawed (with many of the qualitative measures vague, redundant or wrong), and the theoretical and empirical foundations weak. Oxford Analytica (2003) echoes most of Lall’s complaints, concluding that close inspection of the indices “arguably reveals a weak and unsound theoretical framework, a flawed methodology, and dubious and subjective data,” though without offering the detailed analysis provided by Lall. The objections to the GCR methodology are many, and easy to make. Rodriguez and Rodrik (2000) have already shown that many of the implicit assumptions about the desirability of trade liberalization or reductions in government spending cannot be shown to be desirable from the empirical record. The GCR gives higher valuations to capital account liberalization. Yet such paragons of economic orthodoxy as the IMF (see Prasad, et al, 2003) and The Economist (editorial, May 3, 2003) have come to question whether this is unambiguously desirable for developing countries.
Even where the GCR indicators can be closely linked to competitiveness, it may mistake effects for causes. As Lall argued, variables such as 'demanding regulatory

Report on Competitiveness Promotion In Colombia & El Salvador Final Report
The Louis Berger Group, Inc. 65
standards' and 'stringency of environmental regulations’ are seen in the Report as determinants of higher income, when the causation is surely the other way round.
The subjectivity of much of the GCR data is another obvious target. When WEF asks whether their country is ‘a world leader in technology’, respondents can interpret the question in so many different ways that one cannot place much confidence in the answer. It is as a result of such questions that Mauritius might outrank South Korea on the quality of its research institutions (as it did in the 1999 Report), as noted by Oxford Analytica. One could go on. And yet, the search by economists for perfection in measurement of such matters has not yet produced the perfect index of economic performance or productivity. One need not try to defend the GCR as perfect, when there seems to be no other competitor on the field that provides a more satisfying solution to the measurement problem it seeks to address. Unquestionably, there has been an improvement over time in the methodology of the GCR, and its designers have been receptive to criticism from others. In sum, this may not be perfect, but it seems to be the best available for the purpose it is intended. 4.2.3 Performance of El Salvador and Colombia in the GCR The Overall Ranking ceased to be used in 2000, replaced by two factors—the Growth Competitiveness Index Ranking and the Current Competitiveness Index Ranking. Consequently, tracking the performance of the two countries over timer requires some reformulation of the GCR to provide at least a rough consistency over time.
Table 4.2 Proxies Used to Estimate the Original Eight Factor Indices of Competitiveness in the Global Competitiveness Report 1996-1999 2000 2001-2002
Overall Ranking Growth Competitiveness* Growth Competitiveness
Openness Index Rank Openness Index Rank No Longer Included*
Government Index Rank Average of Indicators from Balance Sheet*
Macroeconomic Environment Index Rank*
Finance Index Rank Finance Index Rank Country Credit Rating*
Infrastructure Index Rank
Average of Indicators from Balance Sheet*
Average of Indicators from Balance Sheet
Technology Index Rank Average of Indicators from Balance Sheet* Technology Index Rank*
Management Index Rank
Sophistication of Company Operations and Strategy*
Sophistication of Company Operations and Strategy
Labor Index Rank Average of Indicators from Balance Sheet* No Longer Included*
Institutions Average of Indicators from Balance Sheet*
Public Institutions Index Rank*
Table 4.2 summarizes the methodology used to achieve this rough consistency,
trying to adapt the more recent structure to the earlier methodology. Table 4.3 shows the results of the effort, in trends over time in the absolute rankings of the two countries.

Report on Competitiveness Promotion In Colombia & El Salvador Final Report
The Louis Berger Group, Inc. 66
Table 4.3: Factor Index Rankings in The Global Competitiveness Report Country Colombia's Factor Index Rankings by Year El Salvador's Factor Index Rankings by Year
Factor Index Ranking 1996 1997 1998 1999 2000 2001 2002 1996-1998 1999 2000 2001 2002
Overall Ranking 40 41 47 54 52 (1.) 65 (1.) 56 (1.) 46 51 (1.) 61 (1.) 60 (1.)
Openness 20 34 44 49 35 N/A N/A 46 49 N/A N/A
Government 22 35 39 55 51 (2.) 66 (8.) 51 (8.) 6 46 (2.) 47 (8.) 48 (8.)
Finance 41 48 46 52 53 52 (9.) 55 (9.) 42 44 54 (9.) 52 (9.)
Infrastructure 47 43 45 48 55 (3.) 59 (3.) 65 (10.) 42 53 (3.) 68 (3.) N/A
Technology 45 49 49 57 54 (4.) 56 58 53 54 (4.) 58 69
Management 34 40 38 43 48 (5.) 52 (5.) 51 (5.) 44 53 (5.) 64 (5.) 62 (5.)
Labor 30 29 32 58 53 (6.) N/A N/A 55 54 (6.) N/A N/A
Institutions 44 53 50 53 56 (7.) 57 54 46 56 (7.) 60 48
Countries Ranked 49 53 53 59 59 75 80 El S
alva
dor w
as n
ot ra
nked
in th
e G
loba
l C
ompe
titiv
enes
s R
epor
t in
1996
, 199
7, a
nd 1
998.
Th
eref
ore,
ther
e is
no
data
for t
his
perio
d.
59 59 75 80
Proxies Introduced in 2000 Proxies Introduced in 2001
(1.) Growth Competitiveness Index Ranking (8.) Macroeconomic Environment Index Ranking
(2.) Average of Government Index Rankings in Other Indicators (9.) Country Credit Rating Index Ranking
(3.) Average of Infrastructure Index Rankings in Other Indicators
(4.) Average of Innovation Ranking and Technology Transfer
(5.) Sophistication of Company Operations and Strategy Proxies Introduced in 2002 (6.) Average of Labor Index Rankings in Other Indicators
(7.) Average of Institutions Index Rankings in Other Indicators (10.) Overall Infrastructure Quality in Micro. Competitiveness Indicators
Yet the absolute rankings of a country should be adjusted for the fact that, year by
year, the GCR has included more countries. Most – but not all – of the new entrants into the Report will be low on the rating scale. In principle, it would be desirable to develop a ranking for Colombia and El Salvador that included the same countries in all years. In practice, this has not been possible. A simpler method is to present the country ranking as a percentile. This is done in Table 4.4.
Table 4.4: Factor Index Rankings Corrected for Increases in Number of Countries Ranked Country Colombia's Factor Index Rankings by Year El Salvador's Factor Index Rankings by Year
Factor Index Ranking 1996 1997 1998 1999 2000 2001 2002 1996-1998
1999 2000 2001 2002
Overall Ranking 0.82 0.77 0.89 0.92 0.88 0.87 0.70 0.78 0.85 0.77 0.71
Openness 0.41 0.64 0.83 0.83 0.59 N/A N/A 0.78 0.83 N/A N/A
Government 0.45 0.66 0.74 0.93 0.86 0.88 0.64 0.10 0.80 0.63 0.41
Finance 0.84 0.91 0.87 0.88 0.90 0.69 0.69 0.71 0.75 0.72 0.65
Infrastructure 0.96 0.81 0.85 0.81 0.93 0.79 0.81 0.71 0.90 0.92 N/A
Technology 0.92 0.92 0.92 0.97 0.92 0.75 0.73 0.90 0.92 0.77 0.86
Management 0.69 0.75 0.72 0.73 0.81 0.69 0.64 0.75 0.90 0.88 0.76
Labor 0.61 0.55 0.60 0.98 0.90 N/A N/A 0.93 0.92 N/A N/A
Institutions 0.90 1.00 0.94 0.90 0.95 0.76 0.68 0.78 0.95 0.80 0.60
Countries Ranked 49 53 53 59 59 75 80 El S
alva
dor w
as n
ot ra
nked
in th
e G
loba
l C
ompe
titiv
enes
s R
epor
t in
1996
, 199
7, a
nd 1
998.
Th
eref
ore,
ther
e is
no
data
for t
his
perio
d.
59 59 75 80

Report on Competitiveness Promotion In Colombia & El Salvador Final Report
The Louis Berger Group, Inc. 67
Table 4.5 provides a final way of considering the rankings of the two countries. It attempts to summarize (again roughly) the annual change in the overall index and in the sub-indexes for the two countries. Table 4.5: Annual Changes in Factor Index Rankings in The Global Competitiveness Report Country Colombia's Factor Index Rankings by Year El Salvador's Factor Index Rankings by Year
Factor Index Ranking 1996 1997 1998 1999 2000 2001 2002 1996-1998 1999 2000 2001 2002
Overall Ranking 0% 5% -15% -3% 4% 2% 19% 0% -9% 9% 8%
Openness 0% -57% -29% 0% 29% N/A N/A 0% -7% N/A N/A
Government 0% -47% -11% -27% 7% -2% 28% 0% -683% 21% 34%
Finance 0% -8% 4% -2% -2% 23% 1% 0% -5% 3% 10%
Infrastructure 0% 15% -5% 4% -15% N/A N/A 0% -26% -2% N/A
Technology 0% -1% 0% -4% 5% 18% 3% 0% -2% 16% -12%
Management 0% -9% 5% -2% -12% 15% 8% 0% -20% 2% 13%
Labor 0% 11% -10% -63% 9% N/A N/A 0% 2% N/A N/A
Institutions 0% -11% 6% 5% -6% 20% 11% 0% -22% 16% 25%
Countries Ranked 49 53 53 59 59 75 80 El S
alva
dor w
as n
ot ra
nked
in th
e G
loba
l C
ompe
titiv
enes
s R
epor
t in
1996
, 199
7, a
nd 1
998.
Th
eref
ore,
ther
e is
no
data
for t
his
perio
d.
59 59 75 80
The data in the table above indicate annual changes in the factor rankings in the form of ∆x = (x:t=1 – x:t=2) / x:t=1. The data is from Table 1: Factor Index Rankings Corrected for Increases Number of Countries Ranked.
Numbers that are bolded are numbers that indicate significant change. Significant change is any change greater than 10%.
In this surfeit of data, Table 4.4 might be the best single way to look at the
performance of the two countries. The overall ratings improved in both cases. For Colombia, the improvement was from a nadir of .92 in 1999 to .70 in 2002. El Salvador improved from .78 in 1999 and .85 in 2000 to .71 in 2002. Looking at the individual factors might lead one to question the validity, or at least the year-to-year stability, of those sub-indexes. Some appear to fluctuate too much from one year to the next for one to place much confidence in their representation of an underlying reality. 4.2.4 Using the GCR in Assessing Competitiveness Programs The Global Competitiveness Report is not perfect. There are clear problems in its methodology. The model and its indices lack the rigor required to describe the relationship between medium-term growth and competitiveness or even competitiveness itself with precision. However, the GCR is an important resource simply because it contains empirical data on issues of importance to developing countries. One need not accept the rankings or the implicit theory behind them to believe that the large number of both quantitative and qualitative indicators in the Report can be put to good use in assessing country performance. This report does not attempt to identify the variables in the Report that are most relevant to any country’s development processes. But it does claim that the variables are available to be used for that purpose. Appendix 3 lists 81 variables for which the GCR provides estimates that might be used for measuring the effectiveness of competitiveness programs. Many of these variables have been introduced into the Report in the last year or two, so no significant track record of their performance is available. Year by year, this historical track record will become longer, so that judgments about consistency and reliability can be made. A selection of these
Report on Competitiveness Promotion In Colombia & El Salvador Final Report
The Louis Berger Group, Inc. 68
variables, after reviewing their historical performance to assure that they track real trends, can be an invaluable check on competitiveness programs. They provide an independent means to confront claims of such promoters, and can be the basis for initiating a productive dialogue on the real determinants of the country’s competitiveness, and what actions might improve it. 4.3 The World Bank’s Doing Business Database The World Bank’s dataset for business environment is described in World Bank (2004). The dataset is also available on the internet. The World Bank dataset is organized into five categories: starting a business; employment flexibility; contract enforcement, credit; and bankruptcy. Each category has a number of indicators, aggregating to a total of 24. Some indicators are self-explanatory, while others are arcane. Given below are the descriptions and coding system for each of the variables. Table 4.8 shows the scores for Colombia and El Salvador by these dimensions, along with those for Chile and the United States as comparator countries. According to the World Bank, the data was collected in early 2003. The indicators are as follows: A. Starting a Business
1. Number of steps to establish a new business. 2. Time required to establish a new business. 3. Cost of establishing a business, as a share of per capita income. 4. Minimum capital, if any, for a new business.
B. Hiring and Firing Workers
5. Flexibility of hiring index. This index goes from zero to 100, with smaller numbers representing more flexibility for contract and part-time work.
6. Conditions of Employment Index. This index also ranges from zero to 100, with higher numbers indicating a more rigid legal environment.
7. Flexibility of Firing Index. This ranges from zero to 100, and measures the legal protections against dismissal, notice periods, and severance pay.
8. Employment Laws Index. This is a summary indicator, formed by a simple average of the three previous labor-market indices. C. Enforcing a Contract
9. Number of Procedures. This is a measure of the number of steps needed to obtain payment from a purchaser, when the goods were delivered according to the contract and payment for them was refused.
10. Duration. This identifies the number of days required to enforce the contract from the previous case.
Report on Competitiveness Promotion In Colombia & El Salvador Final Report
The Louis Berger Group, Inc. 69
11. Cost of Enforcement. This measures the cost, as a share of the country’s per capita income, of carrying out the procedure above.
12. Procedural Complexity Index. This index, varying from zero to 100 with 100 being extremely complex, uses six sub-indices to relating to the nature of actions, the need for professional specialists, the nature of evidence required and judicial control, to measure the difficulty of enforcing a contract through the law. D. Getting Credit
13. Public Credit Registry (PCR). This identifies whether a country has a public credit registry that provides information on credit histories and prior defaults of borrowers.
14. PCR Coverage. This measures the size of the PCR, per thousand population. 15. Effectiveness of PCR. This is an index of the usefulness of the PCR for creditors
in terms of coverage, access, collections and quality. It goes from zero to 100, with lower numbers representing greater effectiveness.
16. Existence of Private Credit Bureaus. This identifies countries where private credit rating agencies operate.
17. Coverage of Private Credit Bureaus. This measures size of such private organizations, per thousand population.
18. Creditor Rights Index. This is a rating of the rights of creditors where the borrower is being liquidated or reorganized. It goes from zero (weak creditor rights) to four (strong creditor rights) E. Closing a Business
19. Actual Time. The normal length of time for completion of legal proceedings with a bankrupt firm, in years.
20. Actual Cost. This measures the cost, as a share of the net assets of the enterprise, in carrying out the legal processes.
21. Absolute Priority Preserved. This measures whether secured creditors will have preferential access to assets secured by their loans. A score of 100 means that their priority is preserved, and a score of zero means they are last in line, after workers, the government tax authority, and shareholders.
22. Efficient Outcome Achieved. This is either a one, where the outcome is efficient because of foreclosure, liquidation, or replacement of management, or zero, where a definitive outcome is not achieved.
23. Goals of Insolvency Index. This index synthesizes the information from the previous three, generating an index from zero to 100, with higher numbers reflecting greater success and efficiency.
24. Court Powers Index. This measures the extent to which the court or the creditors drive insolvency proceedings. It goes from zero to 100, with a lower value indicating greater creditor influence.
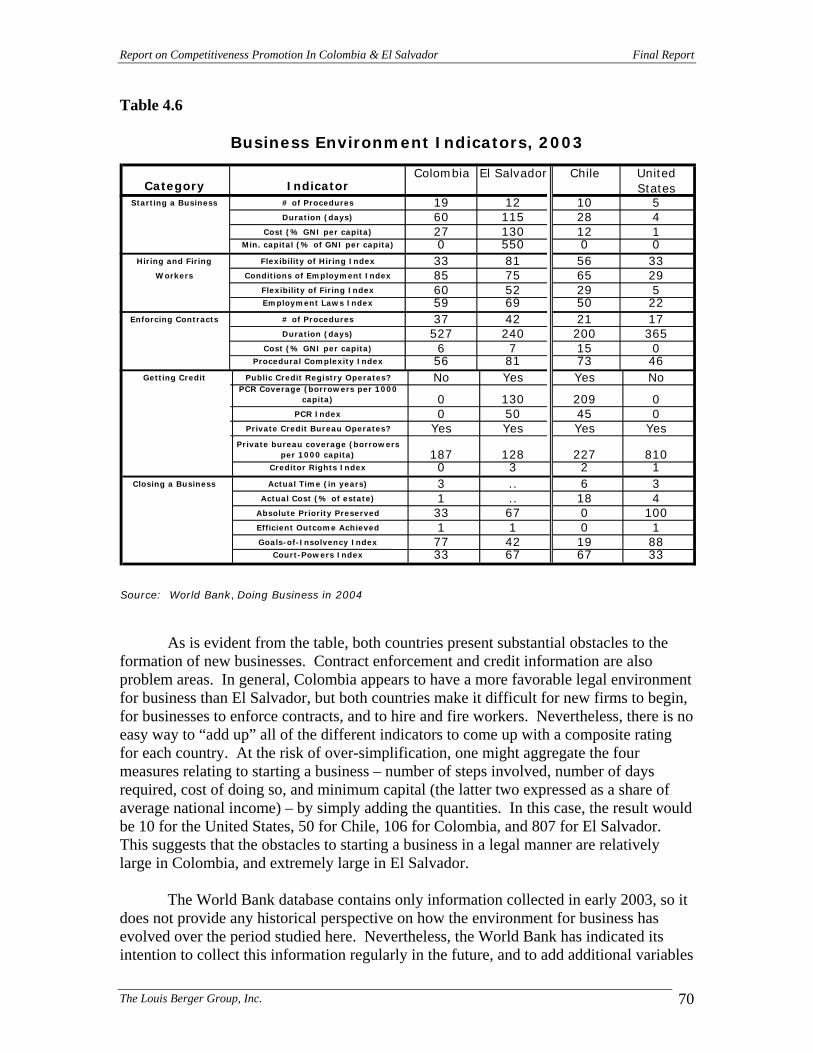
Report on Competitiveness Promotion In Colombia & El Salvador Final Report
The Louis Berger Group, Inc. 70
Table 4.6
As is evident from the table, both countries present substantial obstacles to the
formation of new businesses. Contract enforcement and credit information are also problem areas. In general, Colombia appears to have a more favorable legal environment for business than El Salvador, but both countries make it difficult for new firms to begin, for businesses to enforce contracts, and to hire and fire workers. Nevertheless, there is no easy way to “add up” all of the different indicators to come up with a composite rating for each country. At the risk of over-simplification, one might aggregate the four measures relating to starting a business – number of steps involved, number of days required, cost of doing so, and minimum capital (the latter two expressed as a share of average national income) – by simply adding the quantities. In this case, the result would be 10 for the United States, 50 for Chile, 106 for Colombia, and 807 for El Salvador. This suggests that the obstacles to starting a business in a legal manner are relatively large in Colombia, and extremely large in El Salvador. The World Bank database contains only information collected in early 2003, so it does not provide any historical perspective on how the environment for business has evolved over the period studied here. Nevertheless, the World Bank has indicated its intention to collect this information regularly in the future, and to add additional variables
Business Environment Indicators, 2003
Category IndicatorColombia El Salvador Chile United
StatesStarting a Business # of Procedures 19 12 10 5
Duration (days) 60 115 28 4Cost (% GNI per capita) 27 130 12 1
Min. capital (% of GNI per capita) 0 550 0 0Hiring and Firing Flexibility of Hiring Index 33 81 56 33
Workers Conditions of Employment Index 85 75 65 29Flexibility of Firing Index 60 52 29 5Employment Laws Index 59 69 50 22
Enforcing Contracts # of Procedures 37 42 21 17Duration (days) 527 240 200 365
Cost (% GNI per capita) 6 7 15 0Procedural Complexity Index 56 81 73 46
Getting Credit Public Credit Registry Operates? No Yes Yes NoPCR Coverage (borrowers per 1000
capita) 0 130 209 0PCR Index 0 50 45 0
Private Credit Bureau Operates? Yes Yes Yes YesPrivate bureau coverage (borrowers
per 1000 capita) 187 128 227 810Creditor Rights Index 0 3 2 1
Closing a Business Actual Time (in years) 3 .. 6 3Actual Cost (% of estate) 1 .. 18 4
Absolute Priority Preserved 33 67 0 100Efficient Outcome Achieved 1 1 0 1Goals-of-Insolvency Index 77 42 19 88
Court-Powers Index 33 67 67 33
Source: World Bank, Doing Business in 2004

Report on Competitiveness Promotion In Colombia & El Salvador Final Report
The Louis Berger Group, Inc. 71
to its database. This should provide an important tool for tracking performance of countries wanting to offer a competitive business climate for the private sector. 4.4 Other Measures of Country Competitiveness Two other organizations, the Fraser Institute and the Heritage Foundation also regularly measure country conditions relevant to competitiveness. Both are broadly similar in their approach, so only the Heritage approach is discussed here. Heritage uses ten dimensions of country environment, and scores each dimension on a scale of 1 to 5. A score of 1 is best, with progressively higher numbers for less favorable environments. Table 4.7
Table 4.7 provides the Heritage ratings for both countries between 1996 and 2003. The ratings for both countries are relatively stable over time, though some improvement is recorded for El Salvador after 1998, most notably on trade and monetary policy. El Salvador received a higher overall rating each year than Colombia. For 2003, El Salvador was ranked 26th out of 156 countries rated, while Colombia was ranked 72nd. There is a much greater divergence in the ranking of the two countries in this index than with the GCR, where both are near the bottom – 56th and 60th out of 80 countries. It seems likely that most of the countries that are rated by Heritage that are not rated by the GCR would receive lower ratings than either country, for the GCR concentrates on more advanced and more market-oriented economies. The Heritage index may be useful as a first approximation of a country’s general treatment of the private sector, but it seems of very limited value for tracking performance over time by individual countries. The measures used are relatively crude, and are less amenable to being linked to specific actions by government than either the World Bank indicators or the specific indicators used by the GCR.
Index of Economic FreedomRatings for Colombia and El Salvador, 1996-2003
Indicator Colombia El Salvador 1996 1998 2000 2003 1996 1998 2000 2003
Overall Rating 3 3 2.9 3 2.45 2.45 2 2.25Trade 4 3 3 4 3.0 3.0 3.0 2.0Fiscal Burden 4 4 3 3.5 2.5 2.5 1.5 2.0Government Intervention 1 2 2 3 1.0 1.0 1.5 2.0Monetary Policy 4 4 4 3 3.0 3.0 2.0 2.0Foreign Investment 2 2 2 2 2.0 2.0 1.0 2.0Banking 2 2 2 2 2.0 2.0 2.0 2.0Wages and Prices 2 2 2 2 2.0 2.0 2.0 2.0Property Rights 3 3 3 4 2.0 3.0 2.0 3.0Regulation 3 3 3 3 3.0 3.0 2.0 2.0Black Markets 5 5 5 3.5 3.0 3.0 3.0 3.5
Source: Heritage Foundation, Index of Economic Freedom, various years

Report on Competitiveness Promotion In Colombia & El Salvador Final Report
The Louis Berger Group, Inc. 72
4.5 Comparing the Three Indices Each of the three approaches gives a different answer regarding the relative situation of the two countries being studied. The GCR sees them as very similar in competitiveness, while the World Bank and Heritage suggest important differences in treatment of business. The latter two agree on the existence of a divergence, they disagree on which country is more business-friendly. The Heritage index identifies El Salvador as the country with greater economic freedom, while the World Bank indicators suggest that it imposes more obstacles to economic freedom than Colombia. In any event, neither of the broad indices provides much guidance for specific actions by governments. A low ranking by one or the other index may spur government leaders to act to improve the country’s position in the world, but they are very general with regard to what should be done. Some of the World Bank indicators are more useful in this regard. The indicators relating to starting a new business and for enforcing contracts seem particularly important. And while the GCR rankings are not particularly useful in themselves, some of the specific indicators used in gathering information to compute that ranking are potentially very useful.
Report on Competitiveness Promotion In Colombia & El Salvador Final Report
The Louis Berger Group, Inc. 73
5. SUMMARY COMMENTS AND CONCLUSIONS The previous chapter provided insights into various approaches and indicators to monitor and evaluate performance of competitiveness projects. This chapter provides more detailed comments on the strengths and weaknesses of utilizing the various indicators mentioned in other chapters (section 5.1). It also comments on the case studies that were conducted in Colombia and El Salvador (section 5.2). Finally, it provides some conclusions on the types of investments and programs donors might consider funding in the future (section 5.3). 5.1 Monitoring and Evaluation
5.1.1 Tracking Performance During Implementation In principle, quantitative indicators are the most desirable means for measuring progress during implementation of a competitiveness project. As Andrew Warner (2003) has argued, the increase in real value added is the optimal yardstick for ultimate impact, for it summarizes the change in incomes of people in the country as a result of the activity. The change in a country’s exports is usually a reasonable proxy if value-added statistics are not available, but it is an inferior measure in an important respect. Since the import content of different export products varies widely, the domestic impact, or value added will consequently vary. And export values may vary in the short term because of exogenous factors in external markets. Export statistics, however, have the advantage that they generally reflect valuations at world prices. In sectors where domestic production is shielded from world prices by high tariffs or other barriers, changes in value added may be misleading because of the price distortions. At the same time, the evidence in this report suggests that results in either additional value added or exports from promotion of clusters are likely to be small in the first several years of such activity. The evidence suggests that clustering meets some longer-term needs, but does not produce immediate quantitative results. Moreover, the nature of cluster groupings – relatively loose arrangements among a diverse group – raises the question of whose value added or exports are to be counted. If only cluster members are to be included, shifting membership over time will create problems for tracking performance even where baseline data has been collected. Where (as is the usual case) a sector association is a member of a cluster grouping, should the exports or value added of all the members be counted regardless of their degree of involvement? In sum, there are many imponderables in this area. In the best of cases exports or value added can suggest real progress – but their absence in the 3-5 year time horizon used by donors is not necessarily evidence of failure. What other indicators might be used? Firm-level productivity is another possibility, if appropriate baseline measures are obtained at the outset. Nevertheless, the complexity of the typical firm’s product mix is likely to make cluster-level estimates of productivity hard to obtain. Any change in each firm’s product mix is likely to change measured productivity, and aggregation of

Report on Competitiveness Promotion In Colombia & El Salvador Final Report
The Louis Berger Group, Inc. 74
productivity across the members of a cluster in a way that will identify real changes in productivity in the sector is likely to prove impossible. The evidence from the studies shows that creation of clusters, per se, is not a desirable performance measure. Cluster groupings can easily be created by government efforts, in the hope that government favors will follow in their wake. But success in cluster development is only likely when leadership comes from the private sector, and where its goal is productivity increase rather than special favors. Thus, governments should be reactive regarding such groupings, willing to respond to groups wanting assistance, and meeting technical criteria for likely effectiveness: effective leadership, broad representation, the beginnings of a strategy, and willingness to commit resources. There is no easy way to measure or track these variables. Proxies for the extent of private-sector leadership, such as willingness to commit resources, or one of the various recent attempts to measure the extent of social capital, may be useful. As suggested in the previous chapter, selected variables from the Global Competitiveness Report (GCR) may be useful. The GCR tracks 188 variables for the countries reviewed, both quantitative and drawn from surveys of business executives in the countries reviewed. Most Latin American countries are among the 80 countries included in the most recent report. The main drawback to use of data from the GCR is the lag between the collection of data and its use in the GCR. The most recent GCR, released at the end of 2002, is based on data from early 2001. The World Bank’s new set of business-related indicators promise to be more current, even though they lack baseline measures for years prior to 2003. This study recommends that a subset of GCR indicators – those most susceptible to improvement in the near term through government action – be used to measure progress in competitiveness projects, in combination with the specific World Bank indicators that seem most relevant to national problems. Appendix 3 provides a list of 82 GCR variables that seem most promising in this regard, along with the scores and rankings for Colombia and El Salvador for each. To address the time lag problem, local statistics agencies can be used to provide more timely information. In the case of Colombia, an effort to do this is already underway by the national statistics agency, DANE. The specific indicators to be monitored should reflect national priorities identified at the outset of the national competitiveness effort. For example, Appendix 3 shows El Salvador ranking 72nd out of 80 countries in internet users, and 73rd in internet hosts. Given the pervasive influence of the internet in current business environment, this might be a key variable to track Salvadoran performance, and to address through policy action. Colombia ranks very low in a number of dimensions (59th in burden of regulation, 66th in competence of public officials, 69th in business costs of corruption, 74th in linking pay and productivity) that suggest problems in the business environment. Again, special attention might be given to these variables, and their values tracked over time as the country undertakes efforts to increase its competitiveness. Periodic surveys – perhaps annually – of cluster members may be a useful tool for tracking performance of cluster promotion activities. Participants, and some non-

Report on Competitiveness Promotion In Colombia & El Salvador Final Report
The Louis Berger Group, Inc. 75
participants, could be queried periodically about reasons for participation or non-participation, what benefits they perceive from cluster activities, whether such activities are meeting their expectations, and the extent to which the cluster work is associated with productivity increases in their firms. Measurement of changes in social capital might also be attempted on an experimental basis. Such surveys might be done either by outside contractors or by employees of the government agency active in cluster promotion. Use of the former modality would yield more objective results, but the latter would likely be more useful in understanding private sector needs and in improving implementation by the government. Having all government professionals associated with competitiveness enhancement spend one week each year interviewing businesses about their problems might produce substantial results. Periodic external evaluations may be another alternative for measurement of progress. The 2003 evaluation of the Colombia cluster program, supported by CAF, was of great importance in providing the information necessary to identify weaknesses in the program. The usefulness of such evaluations depends critically on the quality of the work and the willingness of donors and implementing agencies to work together to find ways to increase effectiveness.
5.1.2 Longer-Term Impact Measurement Over the long term, both exports and ranking by the GCR should provide reasonable measures of success or failure. Nevertheless, the time periods of 10-20 years required to see definitive results are so long as to make such measures academic for development institutions or individual government administrations. As discussed above, measures of success at the cluster level, such as exports or productivity, could be useful over the longer term if appropriate baseline data are collected. But changes in the composition of cluster membership over time could make interpretation of data difficult. Did the overall outcome result from cluster activity or from factors irrelevant to the cluster work? Moreover, such data collection can be costly, so the likely benefits of such efforts need to be weighed against the costs. The earlier discussion has suggested that changes in “mental models,” or understanding of the world competitive environment, are an important effect of competitiveness projects. Unless such attitudinal changes can be measured, measures of impact will tend to understate the benefits of such activities. At present, despite efforts by a number of researchers, such as Michael Fairbanks of OntheFrontier and Ronald Inglehart of the University of Michigan, the tools for such comparisons are currently very crude.
Report on Competitiveness Promotion In Colombia & El Salvador Final Report
The Louis Berger Group, Inc. 76
5.2 Comparing the Two Cases The first point to recognize is that there are obvious differences between the two countries that would affect the way in which a competitiveness promotion program would operate. Colombia has seven times the population and fifty times the land area of El Salvador. The compactness of the latter country means that, geographically, it is more like a single region in Colombia than the entire country. Consequently, the extensive regional structure through the CARCEs established in Colombia has little application in El Salvador. Second, the intellectual milieu in each country affected the way in which ideas about competitiveness took root. The early Colombian dissemination of competitiveness concepts was immediately taken up by numerous Colombian academic, government and private-sector people. This led to considerable intellectual effort and discussion within the country, and to broad adaptation of the ideas to the Colombian context. A similar process was less apparent in El Salvador, where the early efforts conformed less well to Salvadoran views of the country’s economic challenges. Consequently, there was less intellectual ferment flowing from the effort, and considerable time and effort was required to develop a newer approach that seemed better adapted to the country context. Third, the faster and deeper reach of competitiveness concepts in Colombia may trace in part to the fact that many of the early efforts were generated at the grass-roots level, and not by the national government. The initial study was commissioned by Acoplasticos, a private cluster, and much subsequent work was funded by the chambers of commerce in major cities (initially not including Bogotá). In El Salvador, in contrast, the government initially sought to disseminate the concepts through central government leadership, with the government choosing cluster members. This “top down” approach may have created some resistance to the ideas because of the form in which they were promoted. Fourth, the country context has affected the direction in which the efforts have evolved over time. In El Salvador, the focus of attention gradually shifted heavily toward small business, which is perceived as in most need of technological upgrading and productivity increase. Some of the Salvadoran clusters – notably those of fisheries, agribusiness and the expatriate community – also sought to bridge social gaps between small enterprises, including cooperatives, and larger firms. In Colombia, on the other hand, the concern for small and medium business, while significant, has been less central. Instead, the larger focus has been on the improvement in quality and capacity for international competitiveness of relatively large and sophisticated industrial sectors. In sum, the country experience in both cases suggests that a competitiveness agenda cannot be imported directly from abroad. It needs to be adapted to the country situation, and be adapted by leading thinkers in the country to the milieu. Only when the process becomes “indigenized” by being adapted and internalized by a significant number of people committed to further dissemination, will these ideas begin to have a permanent and sustainable impact.
Report on Competitiveness Promotion In Colombia & El Salvador Final Report
The Louis Berger Group, Inc. 77
These observations suggest that donors need to be cautious in the manner and pace at which they undertake such programs. Rather than bringing substantial resources to bear at the outset, it may be wiser to use very small amounts of resources to promote conferences, short-term consultancies, and academic studies that can generate the domestic interest and analysis that will later point the right directions for more substantial activities. The CAF has followed this approach in Colombia (and apparently in other Andean countries) with significant success from a small investment. 5.3 Conclusions: What Can Donors Do? This paper argues that competitiveness is a very useful concept. It is neither a panacea, nor an approach that will yield short-term results at the macro level. The ideas that better communication among firms along the value chain, or “moving up the value chain” to more profitable niches, will yield rapid results were not substantiated by any of the interviews carried out for this study. Yet, the two country cases show it to be helpful in stimulating re-thinking by business firms, government, and academic institutions of their mental models, of the competitive process at work in the world, of the preferences of potential buyers of their products, in a way that is likely to generate long-term benefits that would otherwise not be obtained. What role does this imply for donor agencies? The first lesson from the experience is that – in the general order of donor activities – support for competitiveness programs of the type considered in this report (national councils, competitiveness units, and cluster development) is likely to be a low-budget matter. This study found no manner in which large sums of money (i.e., multiples of $10 million) could be usefully employed in a competitiveness effort. The experience suggests, if anything, that money is the enemy of real results in this area. A donor providing largess for firms seeking competitiveness would communicate exactly the wrong message by suggesting that cheap money from a donor, rather than internal change in the business firm, is the proper road ahead. (This is not to say that large, policy-based programs may not be important vehicles for promoting institutional reforms and policy changes essential to increased national competitiveness. But this study is focused only on one specific vehicle for competitiveness promotion.) Nevertheless, there are a variety of actions that donors might take. The usefulness of competitiveness as an organizing principle for government support to the private sector is a particularly powerful instrument for effectiveness, which donors may well want to encourage. Following are nine more specific recommendations. The first five are more specific to promotion of competitiveness; the others are more general, relating to the overall country environment conducive to improvements in competitiveness:
5.3.1 Competitiveness-specific Recommendations 1. Funding government competitiveness promotion efforts. The two countries had
relatively small professional staffs promoting competitiveness – seventeen in the case of Colombia, a half-dozen in the case of El Salvador. In both cases the staffs were supplemented by a few consultants. Even in the case of a large country like

Report on Competitiveness Promotion In Colombia & El Salvador Final Report
The Louis Berger Group, Inc. 78
Colombia, the sums involved in supporting such an effort are small. With modest funding, donors could support expansion of these efforts.
2. Matching grants for cluster competitiveness projects. Economic theory recognizes
the value of clustering, and the externalities (or public goods) that result. It also recognizes that these public goods will be under-funded because of collective action problems. Furthermore, some collective action is more likely to be detrimental to competitiveness than supportive, by seeking to sustain the country’s past, rather than promote its future. Donor funding can redress this imbalance by supporting collective action by “sunrise” industries and supporting export-oriented activities, rather than those directed solely at the domestic market. Requiring that at least half of the cost of any such project come from the cluster participants is one of several mechanisms needed to assure quality.
3. Conferences, seminars and studies. The CAF was particularly useful in Colombia in
this regard. The evaluation it financed of the Colombian cluster effort was both of high quality, and useful in re-directing government efforts in a more fruitful direction. Several other studies it supported stimulated academic work on cluster-relevant issues had double benefits. They helped increase the knowledge about cluster issues, and they drew academics and their students into interest in these areas. CABEI in Central America has funded studies by INCAE, though with a narrower focus and with less evident impact (at least in El Salvador) than the CAF work in Colombia. At a broader level, the Inter-American Development Bank has provided useful resources for this purpose.
4. Transformation of business associations. Latin America is thickly populated with
associations that promote the interests of the private sector in general or of business in a particular sector. Most such associations have grown up in an epoch where seeking favors from government was the most effective means of promoting the interests of the members. This is no longer the case in an inter-connected, globalized, world economy. Some associations have begun to recognize this, and have shifted from a model of the association as special pleader for government favors to one where productivity-increasing services to members is the raison d’etre of the association. Appropriate encouragement by donors can speed this transition. At the same time, it is important to recognize the importance of common purpose in a business association. An association of exporters is much more likely to agree on an action agenda to increase productivity than an association that combines firms that benefit from competing on world markets and firms benefiting from protection from foreign competition.
5. Firm Level Activities. The two case studies suggest that the most immediate successes
from competitiveness promotion come at the level of the individual firm, not the cluster. Pioneering firms that revise their business model to compete more effectively in world markets may – in leading by example – have more impact on a sector’s ability to compete in a sustainable manner than any number of regular meetings of firms not making internal changes. Firm-level support has always been controversial, but there is considerable evidence that pioneering firms can play an important

Report on Competitiveness Promotion In Colombia & El Salvador Final Report
The Louis Berger Group, Inc. 79
catalytic role (e.g. Rhee, 1989, Fox, 1994). Matching grants, discussed above, may be important for cluster development if directed to individual firms if:
• They support pioneering ventures; • There is a substantial contribution by the firm to the effort; and • The granting organization is highly selective, based on technical criteria.
6. First, do no wrong. More speculatively, one might argue that competitiveness is like
microfinance a decade ago: an area of great promise, but one requiring delicate treatment. In microfinance, donors recognized the danger that too much money and too little attention to proper conditions could destroy the industry. Donors established a set of principles of good practice in microfinance, and then created an institution, the Consultative Group to Assist the Poorest (CGAP), to help disseminate and improve these best practices. Like microfinance then, competitiveness is very trendy, but with the same risk that too much money and too many bad projects may discredit the ideas behind it. Collective commitment by donors to best practices might prevent this.
5.3.2 Broader Recommendations
7. Promotion of trade liberalization. The country environment matters, and firms will
respond to the incentive structure they face. As they did in El Salvador and Colombia for decades, they will produce in a protected import market, even though their technology and products fall steadily further behind world-class levels. Trade liberalization also pushes firms toward better technology by that effective spur to action – fear. (In economic discussions, greed has generally been overstated in comparison to fear as a stimulus to more efficient production.) Trade liberalization is a key ingredient of any competitiveness effort, for it introduces business firms in the clearest way to the challenges they face in a world economy where productivity increase is a standard feature.
8. General promotion of good economic policies. Without good economic policies,
efforts to promote competitiveness at the firm or sector level are likely to be fruitless. Donor assistance can help.
9. Infrastructure finance. Roads, ports, airports water systems and other parts of the
economic infrastructure are important features of any country’s productivity. Donors can support improvements in the quantity and efficiency of a country’s infrastructure.
10. Education reform. Bill Gates has predicted that, within two decades, a person’s
education will be a better predictor of his or her income than the person’s nationality. This may not come to pass, but the importance of education is surely likely to continue to increase. In Colombia and El Salvador, quality is a larger issue than access, and donor assistance that helped provide higher quality in education is likely to have high payoffs.

Report on Competitiveness Promotion In Colombia & El Salvador Final Report
The Louis Berger Group, Inc. 80
Appendix 1: Bibliography
Altenburg, Tilman and Jorg Meyer-Stamer, 1998. “How to Promote Clusters: Policy
Experiences from Lartin America,” World Development. Vol. 26:10, pp. 1693-1713.
Arango Londoño, Gilberto, 2000. Estructura Ecónomica Colombiana, 9th Edition,
McGraw Hill, Bogotá. Artavia, Roberto L. 1998. Análisis de Competitividad de los países centroamericanos.
CLADS. San José, Costa Rica. Baumol, William J., 2002. The Free-Market Innovation Machine: Analyzing the Growth
Miracle of Capitalism, Princeton University Press, Princeton Coase, R.H., 1992. “The Institutional Structure of Production,” American Economic
Review, Vol. 82:4, pp. 713-719. Cooke, Philip, 2002. Knowledge Economics: Clusters, learning and cooperative
advantage, Routledge, New York. Corporación Calidad and Corporación Andino de Fomento, 2003. “Evaluación de
Convenios de Competitividad Exportadora,” Bogotá. Donner, Jonathan, 2000. “Making Mental Models Explicit: Quantitative Techniques for
Encouraging Change,” The Monitor Group, Cambridge, 16 pp. Development Alternatives, Inc., 2003. “Competitiveness: That Obscure Object of
Desire,” Developing Alternatives, Vol. 9:1, pp. 1-36. Departamento Nacional de Planeación, 1997. “Los Acuerdos Sectorales de
Competitividad: Avances y Retos,” Documento CONPES 2899, Republica de Colombia, Bogotá.
Departamento Nacional de Planeación, 1998. “Politicas para el Desarrollo del Acuerdo
de Competitividad del Sector Textil Colombiano” Documento CONPES, Republica de Colombia, Bogotá, versión preliminar, 17 de febrero.
Echavarría, Juan José, and Cristina Gamboa, 2001. “Colombia and Venezuela after the
Uruguay Round: Trade Policy Reforms and Institucional Adjustments, Latin American Trade Network.
Fairbanks, Michael and Stace Lindsay, 1997. Plowing the Sea: Nurturing the Hidden
Sources of Growth in the Developing World, Harvard Business School Press, 1997.

Report on Competitiveness Promotion In Colombia & El Salvador Final Report
The Louis Berger Group, Inc. 81
Fukuyama, Francis, 2002. “Social Capital and Development: The Coming Agenda,” SAIS Review, Vol. 22:1, pp. 23-37.
Green, Roy. 2000. “Irish ICT Cluster,” OECD Cluster Focus Workshop, May 8-9, 2000,
U Trecht. Harberger, Arnold C., 1998. “A Vision of the Growth Process,” American Economic
Review, Vol. 98:1, pp. 1-32. Hirschman, Albert O., 1958. The Strategy of Economic Development, Yale University
Press, New Haven. Hirschman, Albert O., 1970, Exit, Voice and Loyalty: Responses to decline in firms,
organizations and states, Harvard University Press, Cambridge. Humphrey, John and Hubert Schmitz, 2002. “How Does Insertion in Global Value
Chains Affect Upgrading in Industrial Clusters,” Regional Studies, 36-9:1017-1027.
Instituto Centroamericano de Administración de Empresas/Harvard Institute for
International Development, 2000. Central America in the 21st Century: An Agenda for Competitiveness and Sustainable Development, processed.
Kamas, Linda, 2001. “Monetary and Exchange Rate Policy in Colombia: Effects on the
Real Exchange Rate in the 1990s,” Journal of Development Studies, Vol. 38:2, pp. 131-66.
Kaplinsky, Raphael, 2001. “Spreading the Gains from Globalisation: What Can Be
Learned from Value Chain Analysis?” Working Paper 110, Institute for Development Studies, University of Sussex.
Krugman, Paul, 1994. “The Fight over Competitiveness,” Foreign Affairs, July/August. Lall, Sanjaya. 2001. “Competitiveness Indices and Developing Countries: An Economic
Evaluation of the Global Competitiveness Report,” World Development, Vol. 29:9. pp. 1501-1525.
Langebaek, Andrés, 2002. “The Role of the Colombian Private Sector in Making
External Trade Policy,” in The Trade Policy-Making Process, Level One of a Two-Level Game: Country Studies in the Western Hemisphere, Occasional Paper 13, Intal, Buenos Aires.
Martinez, Astrid, 1997. “Colombia: Una Pólitica Nacional de Competitividad,” in
Wilson Peres (ed.), Politicas de Competitividad Industiral: América Latina y el Caribe en los años Noventa, Siglo Viente Editores, México, D.F..
Report on Competitiveness Promotion In Colombia & El Salvador Final Report
The Louis Berger Group, Inc. 82
McKean, Cressida, and James W. Fox, 1994. Export and Investment Promotion Services: Do They Work?, Program and Operations Evaluation Assessment Report No. 6, Office of Evaluation, USAID, Washington, DC.
Méndez, Gastón, and Franklin Vásquez, 2000. “Associatividad en El Salvador,” informe
final for Conamype, proyecto Emprende, processed. Méndez, Jose, 1991. “The Development of the Colombian Cut Flower Industry,” Policy,
Research and External Affairs Working Paper No. 660, World Bank, Washington, DC.
Millán, Felipe, 2002. “El Conglomerado del Azúcar del Valle de Cauca, Colombia,”
Serie desarrolo productivo No. 134, CEPAL, Santiago de Chile. Ministerio de Comercio Exterior, 2002. “Politica Nacional para la Productividad y
Competitividad: 1999-2009 Plan Decenal,” Republica de Colombia, Bogotá. Ministerio de Desarrollo Economico, 1993, El Desafío de la Competitividad, Editorial
Presencia, Bogotá. Montenegro, Santiago, and Steiner, Roberto. 2002. Propuestas para una Colombia
competitiva. CAF and University of los Andes, Bogotá. Morawetz, David, 1981. Why the Emperor’s Clothes Are Not Made in Colombia: A Case
Study in Latin American and East Asian Manufactured Goods, Oxford University Press, New York.
O’Malley, Eoin and Chris Van Egeraat, 2000. “Industry Clusters and Irish Indigenous
Manufacturing: Limits of the Porter View,” The Economic and Social Review, 31:1, 55-79.
Olson, Mancur, 1996. “Big Bills Left on the Sidewalk: Why Some Countries are Rich
and Others Poor,” Journal of Economic Perspectives, Vol 10:1, pp. 3-24. Olson, Mancur, 1971. The Logic of Collective Action: Public Goods and the Theory of
Groups, revised edition, Harvard University Press. Oxford Analytica, 2003. “International Brief: Competitiveness Indices,” April 21,
processed. Parr, John B., Geoffrey Hewings, Jungyul Sohn and Suahasil Nazara, 2002.
“Agglomeration and Trade: Some Additional Perspectives,” Regional Studies, Vol. 36:6, pp. 675-84
Porter, Michael E. 2002. “Microeconomics of Competitiveness: Learnings about
Process,” Presentation to the Inter-American Development Bank, November 18.
Report on Competitiveness Promotion In Colombia & El Salvador Final Report
The Louis Berger Group, Inc. 83
Porter, Michael E., 1990. The Competitive Advantage of Nations, Free Press, New York. Porter, Michael E., and Niels Ketelhohn, 2002. “Central America: Strategy for Economic
Integration,” Case Study N9-703-425, Harvard Business School. Porter, Michael E., Willis Emmons, Esteban Brenes, et al., 2002. “Institutions for
Competitiveness in Colombia: Summary Report,” Andean Competitiveness Project, processed.
Prasad, Eswar, Kenneth Rogoff, Shang-Jin Wei and M. Ayhan Kose, 2003. “Effects of
Financial Globalization on Developing Countries: Some Empirical Evidence,” March 17, International Monetary Fund, Washington, DC.
Rhee, Y.W., 1989. The Role of Catalytic Agents in Entering International Markets:
Preliminary Findings from a Review of Success Stories in Eleven Countries, Industry Series Paper No. 5, World Bank, Washington, DC.
Roa Mejía, Alfredo, 2002. Relaciones de producción con una nueva concepción social
de Clusters, Pontifica Universidad Javeriana, Cali. Rodríguez, Francisco and Dani Rodrik, 2000. “Trade Policy and Economic Growth: A
Skeptic’s Guide to the Cross-National Evidence,” in Ben Bernaanke and Kenneth Rogoff (eds.), Macroeconomics Annual 2000, MIT Press for the National Bureau of Economic Research, Cambridge.
Schmitz, Hubert, and Peter Knorringa, 2001, “Learning from Global Buyers,” Working
Paper 100, Institute for Development Studies, University of Sussex. Schumpeter, Joseph, 1943. Capitalism, Socialism and Democracy, Allen and Unwin,
New York. Schwab, Klaus, et al. various years. The Global Competitiveness Report, World
Economic Forum, Geneva. Sonobe, Tetsushi, Dinghuan Hu and Keijiro Otsuka, 2002. “Process of Cluster
Formation in China: A Case Study of a Garment Town,” Journal of Development Studies, 39:1, pp. 118-139.
Thorp, Rosemary, 2000. “Has the Coffee Federation Become Redundant: Collective
Action and the Market in Colombian Development,” Working Paper No. 183, United Nations University/WIDER, Helsinki.
Thurow, Lester, 1993. Head to Head: The Economic Battle Among Japan, Europe and
America. Time-Warner, New York. UNDP, 2001. Informe sobre Desarrollo Humano: El Salvador 2001, Algier’s
Impresores, San Salvador
Report on Competitiveness Promotion In Colombia & El Salvador Final Report
The Louis Berger Group, Inc. 84
Warner, Andrew, 2003. Presentation to an IDB Workshop on competitiveness, June 30,
Washington. Weder, Rolf, and Herbert Grubel, 1995. “The New Growth Theory and Cosean
Economics: Institutions to Capture Externalities,” Weltwirtshaftliches Archiv, World Bank, 1995. El Salvador, Competititiveness Enhancement Technical Assistance
Project, Report No. T-6679-ES, Washington, DC. World Bank, 1996. El Salvador: Meeting the Challenge of Globalization, World Bank,
Washington. World Bank, 2002. El Salvador: Country Assistance Evaluation, Report No. 23626, World Bank, Washington. World Bank 2004. Doing Business in 2004: Understanding Regulation, World Bank and Oxford University Press, Washington.

Report on Competitiveness Promotion In Colombia & El Salvador Final Report
The Louis Berger Group, Inc. 85
Appendix 2: Cluster-Relevant Indicators in the Global Competitiveness
Report 2002-2003
Variables Value Rank (Abs.) Rank (Rel.)
Code Type Indicator Col. El Sal. Col. El Sal. Col. El Sal.
2.04 Qual. Ease of access to loans 3 3 48 41 58.8% 50.0%
2.05 Qual. Access to credit 5 5 24 4 28.8% 3.8%
2.06 Qual. Venture capital availability 2 3 67 47 82.5% 57.5%
2.10 Qual. Hidden trade barriers 4 5 57 41 70.0% 50.0%
2.11 Qual. Cost of importing foreign equipment 3 2 63 41 77.5% 50.0%
2.12 Qual. Extent of distortive government subsidies 4 4 37 35 45.0% 42.5%
2.24 Quant. Average tariff rate, 2002 8 4 47 36 57.5% 43.8%
3.02 Qual. Firm-level innovation 5 5 68 45 83.8% 55.0%
3.03 Qual. Firm-level technology absorption 4 4 68 61 83.8% 75.0%
3.04 Qual. FDI and technology transfer 4 4 57 71 70.0% 87.5%
3.05 Qual. Prevalence of foreign technology licensing 4 4 62 70 76.3% 86.3%
3.06 Qual. Quality of scientific research institutions 4 3 57 77 70.0% 95.0%
3.07 Qual. Company spending on research and development 3 3 51 65 62.5% 80.0%
3.08 Qual. Subsidies and 5tax credits for firm-level research and development 3 2 49 75 60.0% 92.5%
3.09 Qual. University/industry research collaboration 3 2 52 75 63.8% 92.5%
4.01 Qual. Availability of mobile or cellular telephones 6 6 65 51 80.0% 62.5%
4.02 Qual. Internet access in schools 3 3 59 51 72.5% 62.5%
4.04 Qual. Government prioritization of ICT 4 3 54 68 66.3% 83.8%
4.05 Qual. Government success in ICT promotion 4 3 41 60 50.0% 73.8%
4.06 Qual. Laws relating to ICT 4 3 28 54 33.8% 66.3%
4.07 Quant. Cellular telephones, 2001 8 13 63 58 77.5% 71.3%
4.08 Quant. Internet users, 2001 270 80 58 72 71.3% 88.8%
4.09 Quant. Internet hosts, 2001 13 1 54 73 68.8% 93.5%
4.10 Quant. Telephone lines, 2001 17 9 51 62 62.5% 76.3%
4.11 Quant. Personal computers, 2001 4 2 52 63 65.4% 79.5%
5.06 Qual. Telephone/fax infrastructure quality 6 6 50 29 61.3% 35.0%
5.07 Qual. Postal efficiency 4 2 52 75 63.8% 92.5%
6.02 Qual. Efficiency of legal framework 3 3 51 52 62.5% 63.8%
6.03 Qual. Property rights 4 4 48 53 58.8% 65.0%
6.04 Qual. Intellectual property protection 4 4 47 42 57.5% 51.3%
6.06 Qual. Competence of public officials 2 3 66 45 81.3% 55.0%
6.07 Qual. Burden of regulation 2 3 59 15 72.5% 17.5%
6.08 Qual. Transparency of government policy-making 4 4 48 41 58.8% 50.0%
6.09 Qual. Favoritism in decisions of government officials 3 3 61 45 75.0% 55.0%
6.10 Qual. Extent of bureaucratic red tape 3 2 29 14 35.0% 16.3%
6.13 Qual. Reliability of police services 4 5 44 39 53.8% 47.5%
6.16 Qual. Informal sector 4 5 56 66 68.8% 81.3%
6.17 Qual. Strength of auditing and accounting standards 5 5 51 52 62.5% 63.8%
7.01 Qual. Irregular payments in exports & imports 5 5 35 41 42.5% 50.0%
7.02 Qual. Irregular payments in public utilities 5 6 44 32 53.8% 38.8%
7.03 Qual. Irregular payments in tax collection 5 5 41 38 50.0% 46.3%

Report on Competitiveness Promotion In Colombia & El Salvador Final Report
The Louis Berger Group, Inc. 86
7.04 Qual. Irregular payments in public contracts 4 4 40 49 48.8% 60.0%
7.05 Qual. Irregular payments in loan applications 5 5 33 41 40.0% 50.0%
7.06 Qual. Irregular payments in government policymaking 4 4 53 51 65.0% 62.5%
7.07 Qual. Irregular payments in judicial decisions 4 4 50 61 61.3% 75.0%
7.08 Qual. Frequency of payments or bribes 4 5 47 20 57.5% 23.8%
7.09 Qual. Reliability of payments or bribes 3 4 75 35 92.5% 42.5%
7.10 Qual. Diversion of public funds 2 4 69 41 85.0% 50.0%
7.11 Qual. Business costs of corruption 4 4 69 72 85.0% 88.8%
7.12 Qual. Public trust of politicians 2 2 67 51 82.5% 62.5%
7.13 Qual. Prevalence of illegal political donations 3 4 55 33 67.5% 40.0%
7.14 Qual. Policy consequences of legal political donations 3 3 71 54 87.5% 66.3%
7.15 Qual. Misuse of political donations 3 4 56 45 68.8% 55.0%
8.04 Qual. Administrative burden for startups 3 4 69 35 85.0% 42.5%
8.05 Qual. Effectiveness of antitrust policy 4 3 50 73 61.3% 90.0%
8.06 Quant. Number of procedures to resolve a dispute, 2002 37 N/A 65 N/A 91.4% N/A
8.07 Quant. Number of days to resolve a dispute, 2002 527 N/A 67 N/A 82.5% N/A
8.08 Quant. Number of procedure to start a business, 2002 18 N/A 69 N/A 94.4% N/A
8.09 Quant. Number of days to start a business, 2002 81 N/A 56 N/A 68.8% N/A
8.10 Quant. Total cost of starting a business, 2002 286 N/A 24 N/A 31.9% N/A
8.11 Quant. Total cost of starting a business relative to GNP per capita, 2002 14 N/A 30 N/A 40.3% N/A
9.04 Qual. Presence of demanding regulatory standards 4 3 48 71 58.8% 87.5%
9.05 Qual. Decentralization of corporate activity 3 3 73 72 90.0% 88.8%
9.06 Qual. State of cluster development 3 2 55 75 67.5% 92.5%
9.07 Qual. Extent of collaboration among clusters 3 3 64 72 78.8% 88.8%
9.08 Qual. Local availability of components and parts 3 3 49 71 60.0% 87.5%
9.09 Qual. Local availability of process machinery 2 2 57 67 70.0% 82.5%
9.10 Qual. Local availability of specialized research and training services 4 3 60 70 73.8% 86.3%
10.01 Qual. Nature of competitive advantage 3 4 42 32 51.3% 38.8%
10.02 Qual. Value chain presence 4 3 46 60 56.3% 73.8%
10.03 Qual. Extent of branding 3 3 53 68 65.0% 83.8%
10.04 Qual. Capacity for innovation 3 3 50 61 61.3% 75.0%
10.05 Qual. Ethical behavior of firms 4 4 45 50 55.0% 61.3%
10.14 Qual. Extent of incentive compensation 3 4 70 42 86.3% 51.3%
10.15 Qual. Reliance on professional management 4 4 52 66 63.8% 81.3%
10.16 Qual. Quality of management schools 4 3 44 66 53.8% 81.3%
10.17 Qual. Efficacy of corporate boards 4 4 46 57 56.3% 70.0%
10.18 Qual. Hiring and firing practices 3 5 64 7 78.8% 7.5%
10.19 Qual. Flexibility of wage determination 5 6 43 14 52.5% 16.3%
10.20 Qual. Cooperation in labor-employer relations 4 5 51 17 62.5% 20.0%
10.21 Qual. Pay and productivity 3 5 74 16 91.3% 18.8%
Report on Competitiveness Promotion In Colombia & El Salvador Final Report
The Louis Berger Group, Inc. 87
Appendix 3: Persons Interviewed
Cambridge, Massachussets Michael Fairbanks, President, OntheFrontier Stace Lindsay, OntheFrontier Colombia
Ivan Amaya V., President, Asociación Colombiana de Productores Textiles Belisario Acevedo Diaz, Manager, Alfa Ltda.. Perla de Angel, owner, Frutas Potosi Ltda. Orlando Barrets A., Technical Director, Agricultural Secretariat, Valle de Cauca Government Gustavo Canal, Recanal Leather Products Ana Rita Cárdenas Mendoza, Director of Special Projects, Acoplasticos Alejandro Ceballos, President, Orbitel, Medellín Hernan Ceballos, Director of Industry, Ministry of Exports, Industry and Tourism Jaime Ivan Ceballos Eraso, Manager of Operations, Corporación Calidad Marcela Corredor Martinez, Director of Competitiveness, Ministry of Exports, Industry and Tourism Paul Davis, Asst. Director for Economic Development, USAID Carlos Andres De Hart Pinto, Manager, Bucaramanga Section, ANDI Javier Diaz-Molina, President, Asociación Nacional de Comercio Exterior Gabriel Duque, Director of Enterprise Development, Dirección Nacional de Planeación Jaime Eduardo Echeverri Chavarriaga, Subdirector for Planning and Development, Camara de Comercio de Medellín Luis Gustavo Florez, President, Asocuero. Dario Herrera, Sucromiles, SA, Cali Andrés Langebaek, Corporación Andina de Fomento María Isabel Laserna, President, Andigraf Francisco Mejía Pardo, Extension Director, Universidad Autónoma de Occidente Ana Lucía Mejía P., Executive Director, CARCE de Antioquia Felipe Millán, Executive Director, Centro Nacional de Productividad, Cali Julián Piñeres Ramírez, Javeriana University, Cali Hernán Puyo, International Vice President, ANDI Juan José Reyes Peña, President, Camara de Comercio de Bucaramanga Carlos Rodriguez, Director of Competitiveness, Chamber of Commerce of Bogotá Nhora Rodriguez Chacon, Executive Director, CARCE de Santander Fabio Sánchez, Director of CEDE, University of Los Andes Milton Sánchez, Coordinator, Regional Programs, Ministry of Exports, Industry and Tourism Miriam Sanchez Mejia, Corporacion Biotec, Cali Carlos Ernesto Santa, President, CARCE de Antioquia, Medellín Alberto José Sinisterra Molina, Director, Enterprise Development, Camara de Comercio de Cali Augusto Solano, President, Ascoflores Marta Virginia Tafur González, Secretary of Social Development, Valle de Cauca
Report on Competitiveness Promotion In Colombia & El Salvador Final Report
The Louis Berger Group, Inc. 88
Christine Ternent, Sector Specialist, IDB Bogotá Efraim Vallejo Giraldo, President, Sociedad de Mejoras Públicas, Quindío María-Piedad Velasco, former Director of Competitiveness, Mincomex Luis Emilio Velasquez Botero, Executive Director, Corporación Calidad Olga Patricia Vesga Rueda, Manager, Industrias Lavco, Bucaramanga Ana Milena Yoshioka Vargas, Dean, Economics Faculty, Javeriana University, Cali El Salvador Emma Arauz, Director, Investment Promotion, FUSADES Carlos Arce, USAID, ex-director, Programa Nacional de Competitividad Jorge Arriaza Meléndez, Executive Director, ASI Lic. Rafael Barranza, Director, Escuela Superior de Economia y Negocios Enzo Bettaglio, Executive Director, American Chamber of Commerce of El Salvador Merlin Barrera, General Manager, Centromype Humberto Castedo, Sector Specialist, IDB, San Salvador Silvia M. Cuellar, Executive Director, Coexport Ing. Francisco Escobar Thompson, President, Asociacion Salvadorena de la Industria de la Confeccion (ASIC) Lic. Ricardo Esmahan, Executive Director, Camagro Michael Fairbanks, President, OntheFrontier, Cambridge, MA, USA Patricia Figueroa, ex-director, Programa Nacional de Competitividad Alvaro Ernesto Guatemala, Executive Director, FUSADES Leonel Guerra, Instituto Tecnológico de Estudios Superiores de Monetrrey, Mexico José Roberto Hueso, Specialist in Competitiveness, Ministry of Economy Rafael Antonio Ibarra Fernández, Director of Informatics, UCA John C. Ickis, Profesor, INCAE, Costa Rica Mauricio Infante, General Director, Proesa Jose Leon Bonilla, President, Asociación Clusa de El Salvador Blanca Imelda Jacó de Magaña, Vice Minister of Economy Ana María Majano, Executive Director, CLACDS, INCAE, Costa Rica Mario Molino, General Manager, Cafecoyo Hector Montalvo, Divagro Ing. Elena Muñoz, Fundemas Dr. William Pleitez, UNDP, Coordinator, El Salvador Human Development Report Rhina Reyes de Fuentes, Executive Director, Fundemas Norberto Romero Palacios, Director, Facopades de RL Claudio de Rosa, Executive Director, Abansa Rafael Ruiz, Director Ejecutivo, Programa Nacional de Competitividad Onan Sanchez, Specialist in Competitiveness, Ministry of Economy Ing. Jose Cecilio Silva Avalos, President, Husil Industries Billy Soto, President, San Marino Seafood Ing. Mario Urrutia, Manager, CLUSA El Salvador Elisa de Valiente, VAPE, Apiculture Cluster Co-ordinator Marc Vanderlinden, Director, Office of Co-ordination, European Union Luis Vergara, Country Representative, Inter-American Development Bank

Report on Competitiveness Promotion In Colombia & El Salvador Final Report
The Louis Berger Group, Inc. 89
Appendix 4: Competitiveness Agreements in Effect in 2002
Goods 1. Cotton, Fibers, Textiles, and Clothing 2. Motor Vehicles and Parts 3. Sugar, Candy and Chocolates 4. Leather, Leather Manufactures, and Shoes 5. Cosmetics and Soaps 6. Oilseeds and Lubricants 7. Potatos 8. Shrimp Farming 9. Shrimp Fisheries 10. Tuna 11. Export Fish-farming 12. Forestry Products and Wood Furniture 13. Domestic and Commercial Appliances 14. Electric and Electronic Machinery 15. Leather and Leather Products of Nariño Department 16. Meat Products 17. Milk and Milk Products 18. Electronic Products from the Coffee Region 19. Textiles and Clothing from the Coffee Region 20. Coffee 21. Bananas 22. Flowers 23. Petrochemicals 24. Fruits and Vegetables 25. Women’s Intimate Apparel 26. Metalworking 27. Wood Pulp, Paper and Graphic Arts 28. Housing 29. Natural Organic Products 30. Ecology Products Services 1. Software 2. Cartagena Tourism 3. San Andrés Tourism 4. Santa Marta Tourism 5. International Air Cargo Transport 6. Health Services 7. Air Transport Services 8. Logistics and Land Transport 9. Engineering and Consulting Services 10. Vallenata Music and Culture

Report on Competitiveness Promotion In Colombia & El Salvador Final Report
The Louis Berger Group, Inc. 90
Appendix 5: Scope of Work
UN ANÁLISIS COMPARATIVO DE PROGRAMAS NACIONALES DE COMPETITIVIDAD: LOS CASOS DE COLOMBIA Y EL SALVADOR
TÉRMINOS DE REFERENCIA
I. ANTECEDENTES
A. Experiencia Mundial y el Reto de Competitividad
1.1. Las tendencias de la globalización y la regionalización han cambiado fundamentalmente los términos de la competencia mundial. En especial en países de América Latina que llevaban décadas implementando sistemas proteccionistas para lograr el desarrollo, estas dos tendencias han sacudido no sólo las instituciones formales y las normas y regulaciones, sino los modelos mentales -- la forma de pensar sobre el desarrollo -- tanto del sector público como del sector privado y académico.
1.2. Las reformas propuestas a finales de los años 80, principios de los 90 fueron
implementadas, en mayor o menor medida, por la gran mayoría de los países en vías de desarrollo. Uno de los resultados más evidentes fue la apertura ó internacionalización de las economías, también con una variación importante de país a país, con la rebaja de aranceles y otros tipos de protección a los productos e industrias nacionales para dejar actuar la libre competencia/libre mercado asegurando la mejor asignación de recursos, eficiencia en la producción y mayor satisfacción del consumidor final. No obstante lo anterior, hoy, diez años después, las estadísticas no muestran mejoras sustanciales en la calidad de vida de los ciudadanos en los países en vías de desarrollo que implantaron reformas de primera generación. Se podría hipotetizar que una mayoría de las reformas propuestas se centraron en el tema macroeconómico, sin “bajar” al nivel de las empresas, que es en donde realmente se da la competencia ni invertir en las formas de capital social (instituciones, cultura, conocimiento y humano). Hoy se entiende que si bien el buen manejo macroeconómico de las economías es necesario, como lo es también la inversión en las llamadas formas físicas de capital (natural, financiero y de infraestructura), definitivamente no es suficiente para lograr la prosperidad de la mayoría de ciudadanos del tercer mundo.
1.3. Buscando otras opciones, muy en el nivel microeconómico y del ámbito de las
empresas, se encontró que varios países (y regiones dentro de los mismos) han tenido éxito con programas de competitividad que promueven, entre otras cosas, el desarrollo de clusters.
1.4. El Banco ha colocado el tema de competitividad entre los cuatro pilares de su
estrategia corporativa. Como consecuencia de ello, existen varias actividades y proyectos actualmente en marcha dentro del Banco: (i) elaboración de estrategias; (ii) elaboración de guías operativas; (iii) tramitación de préstamos y cooperaciones

Report on Competitiveness Promotion In Colombia & El Salvador Final Report
The Louis Berger Group, Inc. 91
técnicas para financiar proyectos de competitividad a nivel nacional y regional. Los países de la Región y otros Organismos Internacionales, a su vez, también están realizando o apoyando actividades en el mismo sentido a través de programas nacionales y regionales de competitividad. Como casi todas las iniciativas de promoción de la competitividad en la región llevan menos de 10 años, es importante que el Banco asuma un rol protagónico ya que: (i) existen costos iniciales de aprendizaje en estos proceso que, además, se ven acelerados por la rapidez del cambio y de la innovación, en un área que combina actividades públicas y privadas; (ii) si no se aprende de esas experiencias iniciales, es posible que se estén duplicando esfuerzos, desaprovechando recursos y utilizando conceptos que no significan lo mismo para todos los involucrados; y (iii) se puede crear y mantener un acervo de conocimiento para ponerlo a disposición de los demás países y regiones que quieran iniciar ó consolidar procesos de competitividad.
1.5. Si bien el Banco conoce el diseño de los programas nacionales de competitividad,
no conoce las dificultades que se presentan en su implementación y consolidación. Se conoce la experiencia de países desarrollados y las estrategias para promover clusters, pero no se conocen finalmente en Latinoamérica cuáles son los clusters que han reaccionado a los apoyos de los programas y las políticas de competitividad. Al tratarse de experiencias de menos de 10 años, los programas de competitividad basados en la promoción de clusters aún no han sido evaluados de manera sistemática y comparable y su relación costo-beneficio presenta incertidumbre, dado que se tiene la percepción de que se han invertido cuantiosos recursos pero que los resultados han sido poco claros.
B. Situación Actual en Colombia.
1.6. En Colombia, la orientación hacia el mercado se inicia a finales de los años 80 y
principio de los 90 con la política de apertura ejecutada durante la Administración del Presidente Gaviria (90-94). En el tema de la competitividad, en 1991, se inició el primer estudio de competitividad para Colombia, realizado por la firma Monitor Company, co fundada por Michael Porter. Durante el estudio, se analizó la competitividad de 7 sectores de la economía colombiana: petroquímica, jugos de frutas, cueros, textiles, artes gráficas, flores y metalmecánica, con un acercamiento al tema turístico. Asimismo, se realizó la primera Cumbre de Competitividad en Cartagena, liderada por el propio Presidente Gaviria y su Ministro de Desarrollo Económico, Luis Alberto Moreno. En 1993, Monitor Company fue contratado para hacer un segundo estudio de la competitividad en Colombia, esta vez focalizado en la plataforma ó entorno competitivo de 5 ciudades: Cali, Cartagena, Medellín, Barranquilla y Bucaramanga, y en 1996, se contrató también a Monitor para hacer el estudio de competitividad para Bogotá.
1.7. En 1994, se estableció un Consejo Nacional de Competitividad, recomendado por
el primer estudio de Monitor, adscrito directamente a la Presidencia de la República y bajo la dirección técnica del Ministerio de Desarrollo Económico. También se establecieron Consejos Regionales de Competitividad y dentro del sistema se contempló la conformación de acuerdos sectoriales de competitividad con las
Report on Competitiveness Promotion In Colombia & El Salvador Final Report
The Louis Berger Group, Inc. 92
cadenas productivas como declaración de voluntad entre el gobierno y el sector privado para establecer compromisos que permitieran impulsar la competitividad del conjunto.
1.8. Al inicio de la Administración del Presidente Pastrana (1998-02), se diseñó la
Política de Productividad y Competitividad 1999-2009, directamente ligada al desempeño exportador y, por ende, liderada por el Ministerio de Comercio Exterior y, muy específicamente, por la Ministra Marta Lucía Ramírez. A través del decreto 2222 de 1998, las funciones del extinto Consejo Nacional de Competitividad le son trasladas a la Comisión Mixta de Comercio Exterior.
1.9. Como parte de las acciones de la Política Nacional de Productividad y
Competitividad, se organizaron 6 encuentros semestrales de productividad y competitividad, se firmaron 41 convenios de competitividad de cadenas productivas, se organizaron los Comités Asesores Regionales de Comercio Exterior (CARCEs), se estableció la Red Colombia Compite, el Centro Nacional de Productividad, el Programa Nacional de Productividad y Competitividad (financiación), el Programa Exporte.org, la Corporación Colombia Digital Nations y la Cátedra Virtual de Innovación y Creación de empresas de Base Tecnológica; se diseñaron Planes Estratégicos Exportadores Regionales y se le dio gran énfasis a la promoción de una cultura exportadoras. Simultáneamente se crearon Consejos Regionales de Competitividad y algunos de los gobiernos locales incluyeron en sus planes de desarrollo, por primera vez, la promoción de la productividad.
1.10. Asimismo, Colombia ha sido considerada líder en América Latina en el tema de la
promoción de la micro, pequeña y mediana empresa. La primera política nacional para el desarrollo de la microempresa nació en 1984. La ley para la pequeña y mediana empresa se estableció en 1988 y la nueva ley Mipyme en el 2001. También se creó el programa Expopyme, en el cual las universidades apoyaron a las pymes, en varias regiones de Colombia, en el desarrollo de un plan exportador.
1.11. Por lo anterior, la institucionalidad alrededor de los temas de competitividad
regional y apoyo a la micro, pequeña y mediana empresa en Colombia, es considerada amplia, innovativa y líder en la región.
C. Situación Actual en El Salvador 1.12. De acuerdo a trabajos realizados por FUSADES y con la colaboración de la
Universidad de Harvard y la Compañía Consultora Monitor en 1995, las autoridades organizaron un almuerzo con personeros del Programa Nacional de Competitividad (PNC) del país, como un esfuerzo integrado/mancomunado para ver cómo aumentar las medidas de competitividad. Aspectos a ser planteados incluyen: (i) Calidad y eficiencia de los servicios públicos y de gobierno, (ii) calidad de los servicios de infraestructura, (iii) seguridad pública/(ciudadana) y (iv) acceso a dinero (capital). En forma paralela, (o Paralelamente) las autoridades realizaron avances en la privatización de los servicios de comunicaciones y de energía eléctrica como también de los servicios de aeropuertos y puertos.
Report on Competitiveness Promotion In Colombia & El Salvador Final Report
The Louis Berger Group, Inc. 93
Iniciativas también incluyen: (i) derregulación de inversiones, (ii) nuevos servicios comerciales, incluyendo tiendas (“one-stop-shop”), servicios de inversión, (iii) agencia de promoción e inversión, y (iv) desarrollando iniciativas basadas negocios de grupos (clusters). Estas iniciativas fueron efectuadas gracias a un préstamo concedido por el Banco Mundial para una Cooperación Técnica por un monto de US$16 en el año 1996.
1.13. Como en previas administraciones, el gobierno del Presidente Flores ha persuadido
en promover las invenciones de las microempresas, intensificar el clima de inversiones y facilitar la creación y registro de negocios, con énfasis en mantener las pequeñas y medianas empresas. Entre beneficios institucionales están la creación de la Oficina Nacional de Inversiones – ONI, y una propuesta para la creación de una Agencia de Promoción de Exportaciones – PROEXPORT, ambas proveerían ventanas para servicios de inversiones y comercios/negocios, la reciente creación de FOEX otorgando seguridad a los exportadores: la agencia de inversión y promoción PROES; fortaleciendo a los inversionistas y negocios, mercado de servicios de información, a través de los programas de “Trade Point and InfoCentros”, como también el Sistema de Inteligencia Competitiva – SIC, y en especial la promoción de pequeñas y medianas empresas, conexión al mercado de servicios de información en el marco regulatorio del programa de CONTROMYPE. Mejoramiento sustancial en el ambiente de negocios, también incluye políticas de regulación para nuevas inversiones, registro comercial, alquileres y fábricas, entre otros. En principio, estas iniciativas han sido coordinadas a través del Ministerio de Economía y la Unidad de Coordinación del Programa Nacional de Competitividad.
1.14. Entre otros programas, la llave de los elementos ha sido el esfuerzo de desarrollar
actividades productivas a través de mantener los grupos de firmas o grupos asociativos para la competitividad (GAC o clusters). En particular, firmas participantes han sido beneficiadas con bajos costos a través de acuerdos de compra, comercio compartido y comercialización de productos y servicios, mejoramiento de la calidad standard a través de la preparación de normas y certificaciones, adiestramiento en administración, mano de obra y mejoramiento al acceso a los recursos de fondos, incluyendo donaciones bilaterales.
Report on Competitiveness Promotion In Colombia & El Salvador Final Report
The Louis Berger Group, Inc. 94
II. OBJETIVOS Y ESTRATEGIA
A. Objetivo:
2.1. El objetivo de la consultoría es la identificación de mejores prácticas para el diseño, implementación y monitoreo de Programas Nacionales o Regionales de Competitividad para apoyar la labor del Banco y de los Países Miembros en este campo. Esto se llevará a cabo mediante una revisión de las evaluaciones de programas de competitividad en diferentes regiones del mundo y de un análisis de campo de los programas de Colombia y El Salvador. Los estudios comparativos de los casos de Colombia y El Salvador, identificarán 1) las bases institucionales y organizacionales de los dos programas, 2) las metas y logros operacionales de cada uno con respeto a sus objetivos, incluyendo la promoción de competitividad y clusters, y 3) evidencia de su impacto cuantitativo y cualitativo en base a una metodología común. Además, el consultor deberá preparar una guía para el monitoreo y evaluación de programas futuros.
B. Estrategia:
2.2. Varios países del mundo han tenido éxito con programas de competitividad o de
desarrollo de clusters, tales como México, Irlanda, España, Escocia, Noruega, Marruecos, Malasia, Tunes, África del Sur, Singapur, y Estados Unidos. En América Latina y el Caribe, el interés por diseñar e implementar programas nacionales de competitividad, con énfasis en el apoyo a clusters, ha crecido significativamente en los últimos diez años. Experiencias valiosas con programas de competitividad han sido realizadas en Chile, Colombia, República Dominicana y México. La Corporación Andina de Fomento (CAF) y el Banco Centroamericano de Integración Económica han apoyado a la región andina y a la región centroamericana, respectivamente, en el diseño de programas de competitividad.
2.3. La importancia de este estudio, en parte, radica en ser el primer intento de
impulsar un proceso sistemático de evaluaciones de los Programas de Competitividad en América Latina; se pretende incentivar programas con políticas transparentes, que rindan cuentas y que generen la información necesaria para evaluarlos. Por tanto, la metodología del estudio deberá encaminarse a generar información, hasta ahora no documentada, en un formato que facilite su uso para trabajar en el perfeccionamiento de los programas.
2.4. Este proyecto hará énfasis en los elementos más novedosos, innovadores y
exitosos de los programas de competitividad en Colombia y El Salvador, tanto a nivel del entorno competitivo como de los clusters. El estudio analizará el tema de clusters desde la óptica nacional, identificando los roles que han jugado los distintos actores y el impacto que se ha tenido. En particular analizará la colaboración entre los sectores público y privados en la formulación de una visión compartida de la competitividad, el rol de clusters y el impacto sobre la formulación de políticas y reformas que remueven barreras y crean entornos

Report on Competitiveness Promotion In Colombia & El Salvador Final Report
The Louis Berger Group, Inc. 95
propicios para la competitividad. Asimismo, se analizará la vinculación de los programas de competitividad con la infraestructura existente para evaluar el uso de la capacidad institucional instalada.
C. Metodologia
Examinar las proposiciones del estudio requerirá el uso de datos cuantitativos y cualitativos provenientes de fuentes secundarias y de entrevistas a informantes claves. La metodología preparada por el consultor o firma debe incluir como mínimo los siguientes elementos, a fin de cumplir con los 3 objetivos planteados para el estudio:
Objetivo 1: Análisis de la institucionalidad y del diseño de los programas Criterios de Valoración: Se requiere un análisis de las semejanzas y diferencias de los programas de competitividad en Colombia y El Salvador, y de las instituciones diseñadas para implementarlos. Específicamente, se espera que el estudio establezca las semejanzas y diferencias de ambos programas sobre los siguientes temas: * Diseño institucional * Definición de roles * Recursos económicos y humanos con que cuentan * Objetivos y metas planteadas * Coherencia y coordinación institucional * Cobertura (nacional, regional, sectores, clusters) * Grado de descentralización del sistema de instituciones y programas * Elección de instrumentos de apoyo * Presencia de mecanismos de evaluación de resultados y monitoreo de desempeño Aclarar estos criterios permitirá establecer de dónde provienen las posibles divergencias, que eventualmente se podrían encontrar, en el impacto de los programas y en su grado de cumplimiento de metas. Se requiere el uso de fuentes de información secundarias así como de entrevistas con informantes de los respectivos Consejos de Competitividad. Estos criterios no permiten evaluar la calidad del diseño y la eficiencia en la implementación de los programas; estos puntos se cubren a continuación. Objetivo 2: Verificar el grado de cumplimiento de los objetivos planteados por los programas. Criterios de Valoración: * Alcance: ¿Llegó el servicio a un número adecuado (meta propuesta) de empresas? * Satisfacción: ¿Satisfizo el programa las necesidades para las cuales fue diseñado? * Impacto en los beneficiarios: ¿Tuvo el programa el impacto deseado sobre el crecimiento, productividad, empleo, participación en el mercado, utilidades u otras metas trazadas para la empresa o grupo de empresas? ¿Existe evidencia de que las empresas beneficiarias del programa incrementan su competitividad más rápidamente que otras empresas comparables? * Impacto en el sector (clustering): ¿fueron difundidas en la localidad las innovaciones introducidas en las empresas vinculadas al Programa de Competitividad?
Report on Competitiveness Promotion In Colombia & El Salvador Final Report
The Louis Berger Group, Inc. 96
Con estos criterios se pretende definir la calidad en la implementación de los Programas, su gestoría. En este punto se requiere entrevistar a los actores claves de las empresas participantes en los Programas de Competitividad. Objetivo 3: Medición del Impacto de los Programas Criterios de Valoración: Análisis de semejanzas y diferencias sobre los siguientes temas: * ¿Cómo ha cambiado el comportamiento de las empresas con el Programa? * ¿Cómo ha cambiado la articulación de los organismos públicos y privados con el Programa? * ¿Cómo ha cambiado el tipo y grado de cooperación de los actores privados con el Programa? * ¿Se podrían obtener los mismos resultados sin el Programa? * ¿Los logros alcanzados en el comportamiento de los actores privados son sustentables sin el Programa? * ¿Qué clusters empresariales han respondido mejor a los programas? ¿Por qué? Con este punto se pretende conocer la calidad del diseño de los Programas, la eficiencia de su implementación, su oportunidad, y si sus resultados son espurios o no; en otras palabras, se trata de averiguar si el impacto de los Programas significó un cambio en el comportamiento de los agentes, o si solo se trata de comportamientos sujetos a incentivos de corto plazo. El análisis exige entrevistas a informantes claves de empresas participantes; y en la medida de lo posible, de entrevistas a informantes claves de empresas no participantes (comparables a las anteriores) que desean ser incluidas y que no desean ser incluidas en el Programa.
En suma, la evaluación no deberá limitarse a la medición de eficiencia de los Programas en su cumplimiento de metas, sino que deberá extenderse al diagnóstico del por qué de determinados comportamientos, para poder elevar conclusiones dirigidas a mejorar los resultados. El estudio comparativo debería aclarar los siguientes temas: * ¿Son los instrumentos de los Programas correctos para las necesidades específicas de la región/país y tienen el peso adecuado? A partir de este punto se puede llegar a recomendar los instrumentos que más elevan la eficiencia, innovación y competitividad del sector/país. * ¿Cuáles son las principales dificultades de la implementación de los Programas, cuáles son sus barreras y cuáles son sus actores claves? * Eficacia de la coordinación sobre la política fiscal y de la coordinación ejercida sobre el curso de políticas sectoriales (específicamente política comercial, ambiental, laboral, etc.). * impacto sobre reducción y simplificación de regulaciones y trámites que crean barreras a la actividad empresarial (especialmente Pymes). * impacto en la simplificación del aparato burocrático que entra en relación con los operadores empresariales y del perfeccionamiento del sistema de protección de derechos y obligaciones y resolución de conflictos (poder judicial).

Report on Competitiveness Promotion In Colombia & El Salvador Final Report
The Louis Berger Group, Inc. 97
* ¿Cuál es la metodología de seguimiento y evaluación que mejor capta el impacto de los Programas, y qué información éstos deberían generar para facilitar este proceso?
III. CARACTERÍSTICAS DE LA CONSULTORÍA 3.1 Tipo: Consultores individuales o empresa
3.2 Duración: Cinco meses no continuos a partir de Octubre, 2002.
3.3 Lugar de trabajo: Washington, Colombia, El Salvador, Caracas, Tegucigalpa y
lugar de residencia del consultor.
3.4 Calificaciones: Consultor(es) con reconocida experiencia en la evaluación de programas de apoyo al sector privado y de competitividad en países en vías de desarrollo, preferiblemente América Latina. Perfecto dominio del español. Disponibilidad inmediata y dedicación parcial (como mínimo el 50% del tiempo). Criterios de selección serán: (a) experiencia del consultor principal en la evaluación de proyectos y programas (30%); (b) experiencia del consultor principal con programas de competitividad y de apoyo al sector privado (20%); (c) experiencia de otro personal (10%); y (d) calidad de la metodología propuesta (40%).
IV. ACTIVIDADES 4.1 La metodología detallada del estudio será propuesta por los consultores
potenciales. A continuación se proponen algunas actividades que se deberían llevar a cabo para cumplir con los objetivos de la consultaría.
4.2 Análisis de las experiencias con programas de competitividad a nivel mundial. Se deben revisar las evaluaciones que existen a nivel mundial, incluyendo proyectos del Banco Mundial, de USAID, de la CAF y de otros donantes que hayan financiado programas de competitividad, para extraer las principales lecciones aprendidas en el diseño, implementación e impacto de estos programas. Además, el consultor debe analizar y evaluar las definiciones de términos como competitividad, cluster, cadenas productivas, cadenas de valor, etc., utilizadas en cada país, para concluir si existe o no un lenguaje común alrededor del tema de competitividad.
4.3 Evaluación de los Programas en Colombia y El Salvador. El consultor levantará la información referida a los aspectos institucionales de los programas de competitividad de Colombia y El Salvador con respecto a sus antecedentes (cómo, cuándo y por qué se inició), diseño, implementación y seguimiento en todos sus niveles, así como de los actores que han jugado un rol indispensable como líderes de los diversos aspectos del programa de competitividad.
Report on Competitiveness Promotion In Colombia & El Salvador Final Report
The Louis Berger Group, Inc. 98
4.4 El consultor analizará el desarrollo de los clusters que han participado en los programas y los beneficios que les ha reportado dicha participación. En particular, el proyecto documentará el proceso de identificación, selección y trabajo con los distintos clusters. También registrará casos concretos de impactos sobre el crecimiento de los clusters identificados como exitosos, la creación de actividades conjuntas por parte de los agentes económicos de los cluster en una forma colectiva (producción, distribución, investigación, control de calidad, recursos humanos) y qué efectos produjo dicha asociatividad (mejor acceso a mercado, mayor volumen, mejor calidad, creación de nuevas empresas, etc.), la presencia de externalidades o economías de aglomeración ó escala que mejoren la productividad de los factores de producción.
4.5 En los clusters exitosos, el consultor revisará si se mantienen estrategias de competir con base en bajo costo ó si se encuentra algún movimiento hacia la diferenciación del producto/servicio y búsqueda de clientes más sofisticados. También identificará si hay algún modelo mental (actitud ó mentalidad común) que esté presente en los participantes de los clusters exitosos. (Nota: El estudio de los convenios de competitividad en Colombia lo está realizando ya la CAF. El consultor deberá comunicarse con la CAF en Colombia para conocer los resultados e incorporarlos en el presente análisis).
4.6 El consultor identificará los impactos cualitativos del proyecto tales como la mayor visibilidad del tema de competitividad y la promoción de mejores espacios de colaboración entre el sector público y privado (capital social). También comprobará la eficacia del programa como herramienta para la identificación de barreras a nivel de las empresas y de los clusters que dificulten su competitividad y la promoción de una comunicación estratégica y efectiva entre los empresarios, el sector público, otros actores nacionales y regionales, así como internacionales relevantes, para su remoción ó ajuste. En esta etapa también se revisará el rol de los gremios y las cámaras de comercio en la promoción de la competitividad, evaluando el cambio de misión y acción frente al tema y su impacto real (no sólo discursos) sobre el mismo. Se identificarán los gremios y cámaras líderes en la promoción del tema, creando los criterios específicos para dicha evaluación (incremento presupuestal asignado a las actividades de la promoción de la competitividad, nuevos programas, proyectos, iniciativas creadas para los afiliados con base en la competitividad, reconocimiento de los afiliados como líderes de la promoción de la competitividad, etc).
4.7 Metodología de evaluación. El consultor desarrollará una metodología de evaluación que identifique los tipos de información de base que se debe recolectar, los tipos de resultados (outcomes) que se pueden esperar y como medirlos. Además, el consultor presentará bases analíticas para la evaluación del impacto de programas de competitividad. También deberá evaluar si los indicadores de competitividad de instituciones como el WEF, IMD y otros son relevantes para medir el impacto de las iniciativas a nivel de clusters.

Report on Competitiveness Promotion In Colombia & El Salvador Final Report
The Louis Berger Group, Inc. 99
4.8 Difusión. Al final del proyecto se espera una amplia difusión del estudio por parte
de las tres instituciones participantes a través de la distribución física del documento y de los sitios web de cada institución. Se propondrán talleres de revisión con una presentación del autor principal del documento y miembros del equipo cuando sea factible. El proyecto financiará los costos del viaje del autor principal a la sede del BID para la presentación. En tal ocasión se propondrá tener una video conferencia para que las otras instituciones participen en el evento. Para la publicación del texto, las tres instituciones contratarán una firma que preparará la traducción, edición, impresión y conversión a versiones electrónicas.
V. RESULTADOS 5.1 Desarrollo de instrumentos que faciliten la labor del Banco y de los países
miembros en el diseño, implementación, seguimiento y evaluación de programas de competitividad.
VI. INFORMES 6.1 Primer informe con un plan de trabajo detallado y con una propuesta de esquema
para los dos próximos informes. 6.2 Segundo informe con el resumen de las experiencias internacionales en programas
de competitividad y detallando la metodología de la evaluación de los programas de Colombia y El Salvador.
6.3 Tercer informe con el contenido de las evaluaciones de los Programas de
Colombia y El Salvador y con la identificación de las lecciones aprendidas que sirvan para mejorar tanto los programas en estos dos países como el diseño de programas futuros. Este informe debe contener un anexo con las guías para la evaluación de programas futuros, y un resumen ejecutivo de no más de diez páginas. Además, el consultor debe preparar una presentación de Powerpoint resumiendo los diferentes informes.
VII. COORDINACIÓN
7.1 La coordinación formal del estudio estará a cargo de Martín Chrisney (FI2) y Juan A. B. Belt (FI3) con el apoyo de Juan Jose Llisterri (SDS-MSM) y Koldo Echevarria (SDS/SCS) como ¨peer review¨. Se conformará un equipo de proyecto para revisar los informes que incluirá representantes de las oficinas del BID en El Salvador y Colombia, de la CAF, y del BCIE.