COMAL APPRAISAL DISTRICT 2017 ANNUAL APPRAISAL … Annual Appraisal Report.pdf · 2 INTRODUCTION...
13
COMAL APPRAISAL DISTRICT 2017 ANNUAL APPRAISAL REPORT
Transcript of COMAL APPRAISAL DISTRICT 2017 ANNUAL APPRAISAL … Annual Appraisal Report.pdf · 2 INTRODUCTION...
COMAL APPRAISAL DISTRICT
2017
ANNUAL APPRAISAL REPORT
1
TABLE OF CONTENTS
Introduction……………………………………………………………………………………..2
Mission Statement ..………………………………………………………………………….…2
Purpose of Report ……………………………………………………………………………...2
Entities Served…………………………………………………………………………………..2
Legislative Changes…………………………………………………………………………….3
Property Types………………………………………………………………………………….3
Appraisal Results……………………………………………………………………………….4
Summary
New Construction
Ratio Study
Performance Evaluation
Mass Appraisal Report
Preparation of Appraisal Roll
Certified Appraisal Roll
Exemptions……………………………………………………………………………………...9
Appeal Process…………………………………………………………………………………9
Final Performance Analysis…………………………………………………………………...11
Financial Results……………………………………………………………………………….12
Taxpayer Assistance Results…………………………………………………………………..12
Certification…………………………………………………………………………………….12
2
INTRODUCTION
The Comal Appraisal District (District) is a political subdivision of the State of Texas created
January 1, 1980. The provisions of the Texas Property Tax Code govern the legal, statutory, and
administrative requirements of appraisal districts. A Board of Directors, appointed by the voting
taxing units within the boundaries of the Comal Appraisal District, constitutes the District’s
governing body. The Chief Appraiser, appointed by the Board of Directors, is the chief
administrator and chief executive officer of the District.
MISSION STATEMENT
Value property and administer exemptions within the Comal Appraisal District’s jurisdiction,
fairly and equitably in accordance with the Texas Property Tax Code and other appraisal
practices and standards, using the staff and resources available to carry out the duties in a
professional, friendly, courteous, and ethical manner.
PURPOSE OF REPORT
This report serves as the official 2017 Annual Appraisal Report for Comal Appraisal District,
located at 900 S. Seguin Avenue, New Braunfels, TX 78130. It has been drafted in compliance
with the International Association of Assessing Officers (IAAO) Standards on Public Relations,
Section 6.5: Annual Reports. A copy of this report can be obtained in person from the District’s
office or from the District’s website at www.comalad.org.
The Annual Report highlights the results of our appraisal operations, our taxpayer assistance
programs, our financial stewardship, the appeals process, and the performance results by the
Property Tax Assistance Division.
ENTITIES SERVED
The District is responsible for local property tax appraisal, exemption administration and special
valuation of property for jurisdictions or taxing units in its county. Each taxing unit adopts its
own tax rate to generate revenue to pay for police and fire protection, public schools, road and
street maintenance, courts, water and sewer systems, and other public services. The following is
a list of all the taxing entities within the District’s jurisdiction:
Comal County
City of New Braunfels
City of Schertz
City of Garden Ridge
City of Bulverde
City of Fair Oaks Ranch
City of Selma
City of Spring Branch
Comal ISD (CISD)
3
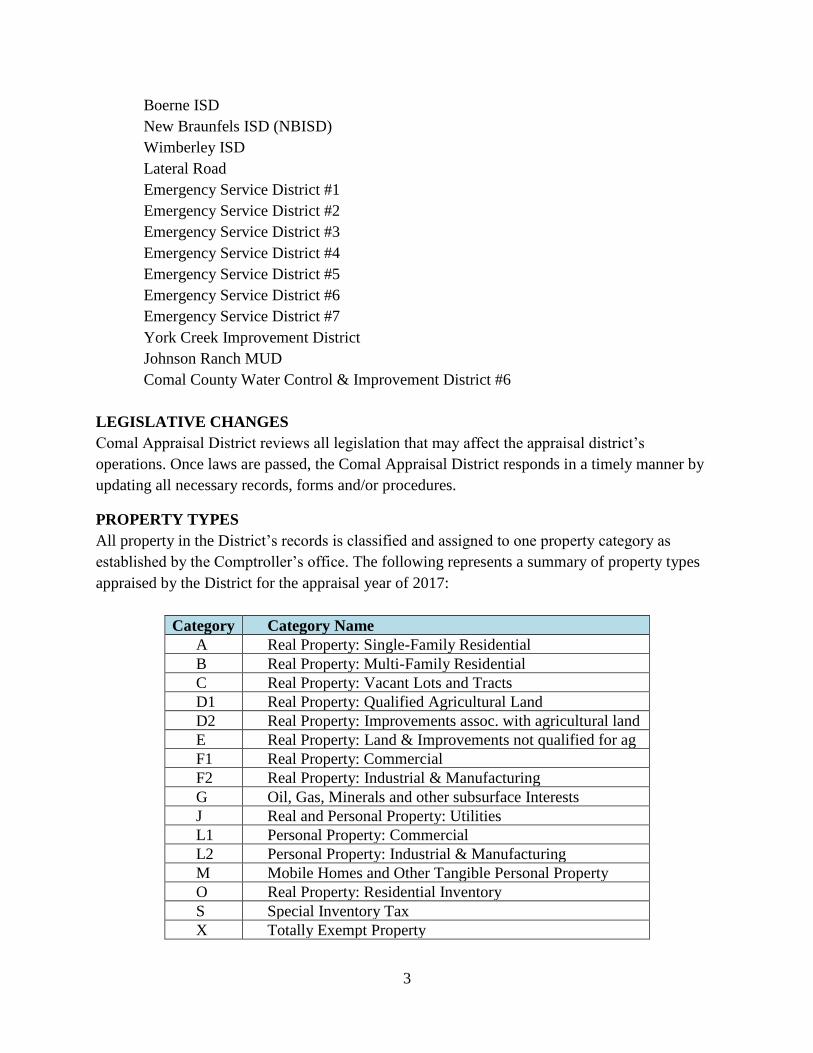
Boerne ISD
New Braunfels ISD (NBISD)
Wimberley ISD
Lateral Road
Emergency Service District #1
Emergency Service District #2
Emergency Service District #3
Emergency Service District #4
Emergency Service District #5
Emergency Service District #6
Emergency Service District #7
York Creek Improvement District
Johnson Ranch MUD
Comal County Water Control & Improvement District #6
LEGISLATIVE CHANGES
Comal Appraisal District reviews all legislation that may affect the appraisal district’s
operations. Once laws are passed, the Comal Appraisal District responds in a timely manner by
updating all necessary records, forms and/or procedures.
PROPERTY TYPES
All property in the District’s records is classified and assigned to one property category as
established by the Comptroller’s office. The following represents a summary of property types
appraised by the District for the appraisal year of 2017:
Category Category Name
A Real Property: Single-Family Residential
B Real Property: Multi-Family Residential
C Real Property: Vacant Lots and Tracts
D1 Real Property: Qualified Agricultural Land
D2 Real Property: Improvements assoc. with agricultural land
E Real Property: Land & Improvements not qualified for ag
F1 Real Property: Commercial
F2 Real Property: Industrial & Manufacturing
G Oil, Gas, Minerals and other subsurface Interests
J Real and Personal Property: Utilities
L1 Personal Property: Commercial
L2 Personal Property: Industrial & Manufacturing
M Mobile Homes and Other Tangible Personal Property
O Real Property: Residential Inventory
S Special Inventory Tax
X Totally Exempt Property
4
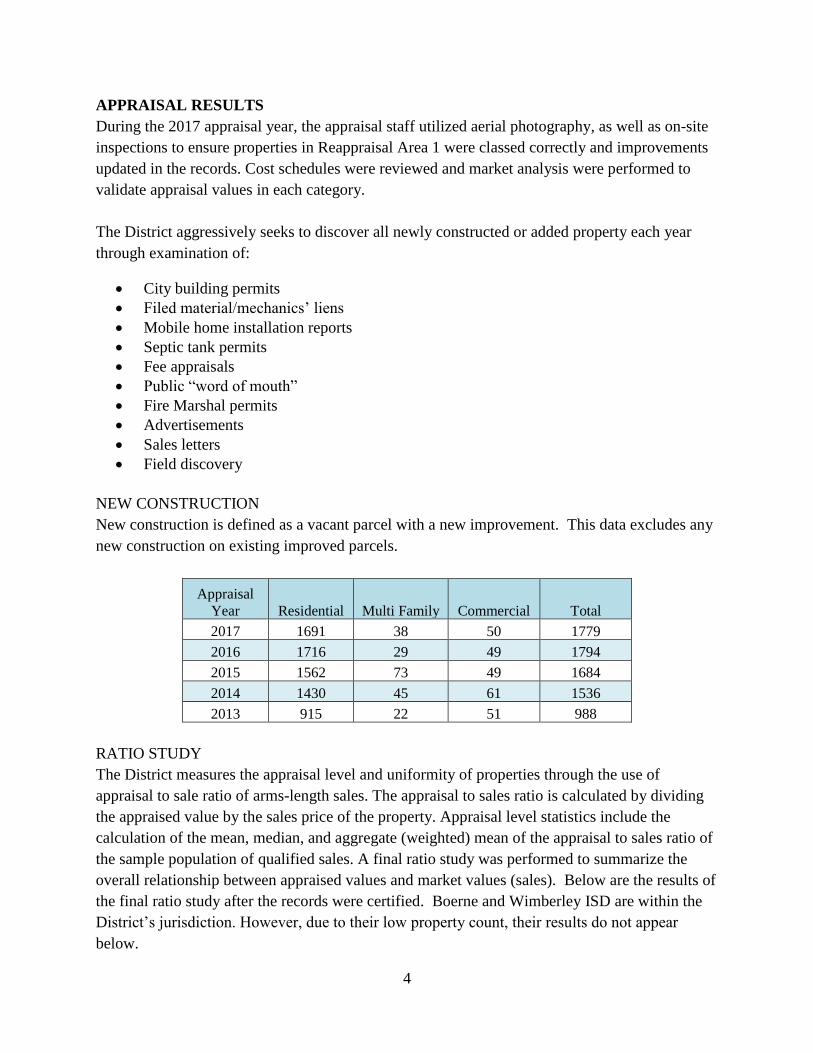
APPRAISAL RESULTS
During the 2017 appraisal year, the appraisal staff utilized aerial photography, as well as on-site
inspections to ensure properties in Reappraisal Area 1 were classed correctly and improvements
updated in the records. Cost schedules were reviewed and market analysis were performed to
validate appraisal values in each category.
The District aggressively seeks to discover all newly constructed or added property each year
through examination of:
• City building permits
• Filed material/mechanics’ liens
• Mobile home installation reports
• Septic tank permits
• Fee appraisals
• Public “word of mouth”
• Fire Marshal permits
• Advertisements
• Sales letters
• Field discovery
NEW CONSTRUCTION
New construction is defined as a vacant parcel with a new improvement. This data excludes any
new construction on existing improved parcels.
Appraisal
Year Residential Multi Family Commercial Total
2017 1691 38 50 1779
2016 1716 29 49 1794
2015 1562 73 49 1684
2014 1430 45 61 1536
2013 915 22 51 988
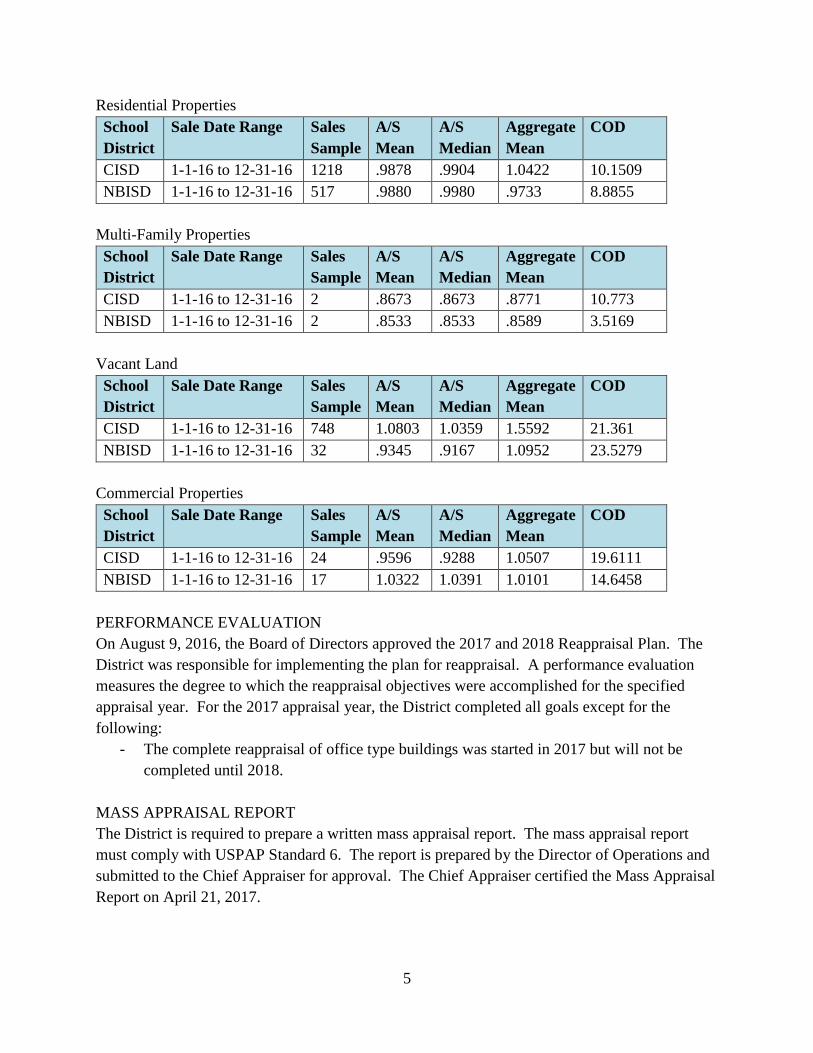
RATIO STUDY
The District measures the appraisal level and uniformity of properties through the use of
appraisal to sale ratio of arms-length sales. The appraisal to sales ratio is calculated by dividing
the appraised value by the sales price of the property. Appraisal level statistics include the
calculation of the mean, median, and aggregate (weighted) mean of the appraisal to sales ratio of
the sample population of qualified sales. A final ratio study was performed to summarize the
overall relationship between appraised values and market values (sales). Below are the results of
the final ratio study after the records were certified. Boerne and Wimberley ISD are within the
District’s jurisdiction. However, due to their low property count, their results do not appear
below.
5
Residential Properties
School
District
Sale Date Range Sales
Sample
A/S
Mean
A/S
Median
Aggregate
Mean
COD
CISD 1-1-16 to 12-31-16 1218 .9878 .9904 1.0422 10.1509
NBISD 1-1-16 to 12-31-16 517 .9880 .9980 .9733 8.8855
Multi-Family Properties
School
District
Sale Date Range Sales
Sample
A/S
Mean
A/S
Median
Aggregate
Mean
COD
CISD 1-1-16 to 12-31-16 2 .8673 .8673 .8771 10.773
NBISD 1-1-16 to 12-31-16 2 .8533 .8533 .8589 3.5169
Vacant Land
School
District
Sale Date Range Sales
Sample
A/S
Mean
A/S
Median
Aggregate
Mean
COD
CISD 1-1-16 to 12-31-16 748 1.0803 1.0359 1.5592 21.361
NBISD 1-1-16 to 12-31-16 32 .9345 .9167 1.0952 23.5279
Commercial Properties
School
District
Sale Date Range Sales
Sample
A/S
Mean
A/S
Median
Aggregate
Mean
COD
CISD 1-1-16 to 12-31-16 24 .9596 .9288 1.0507 19.6111
NBISD 1-1-16 to 12-31-16 17 1.0322 1.0391 1.0101 14.6458
PERFORMANCE EVALUATION
On August 9, 2016, the Board of Directors approved the 2017 and 2018 Reappraisal Plan. The
District was responsible for implementing the plan for reappraisal. A performance evaluation
measures the degree to which the reappraisal objectives were accomplished for the specified
appraisal year. For the 2017 appraisal year, the District completed all goals except for the
following:
- The complete reappraisal of office type buildings was started in 2017 but will not be
completed until 2018.
MASS APPRAISAL REPORT
The District is required to prepare a written mass appraisal report. The mass appraisal report
must comply with USPAP Standard 6. The report is prepared by the Director of Operations and
submitted to the Chief Appraiser for approval. The Chief Appraiser certified the Mass Appraisal
Report on April 21, 2017.
6
PREPARATION OF APPRAISAL ROLL
The Chief Appraiser prepared for the assessor of each county, municipality, and school district
participating in the District an estimate of the taxable value of property in that taxing unit per
Sec. 26.01 (e) of the Texas Property Tax Code. A letter was prepared for each of these taxing
units along with the estimate of taxable value of property in that taxing unit. Valuation notices
were mailed to property owners only after the above steps were completed. Real property
notices were mailed on April 28, 2017.
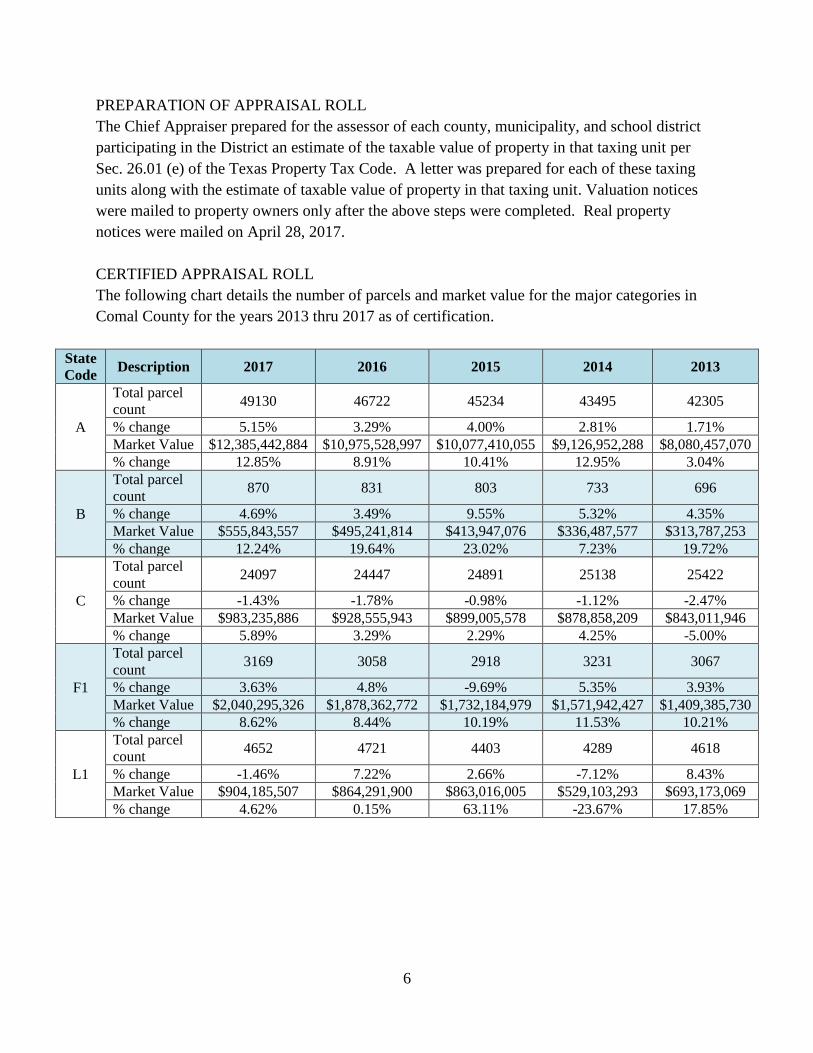
CERTIFIED APPRAISAL ROLL
The following chart details the number of parcels and market value for the major categories in
Comal County for the years 2013 thru 2017 as of certification.
State
Code Description 2017 2016 2015 2014 2013
A
Total parcel
count 49130 46722 45234 43495 42305
% change 5.15% 3.29% 4.00% 2.81% 1.71%
Market Value $12,385,442,884 $10,975,528,997 $10,077,410,055 $9,126,952,288 $8,080,457,070
% change 12.85% 8.91% 10.41% 12.95% 3.04%
B
Total parcel
count 870 831 803 733 696
% change 4.69% 3.49% 9.55% 5.32% 4.35%
Market Value $555,843,557 $495,241,814 $413,947,076 $336,487,577 $313,787,253
% change 12.24% 19.64% 23.02% 7.23% 19.72%
C
Total parcel
count 24097 24447 24891 25138 25422
% change -1.43% -1.78% -0.98% -1.12% -2.47%
Market Value $983,235,886 $928,555,943 $899,005,578 $878,858,209 $843,011,946
% change 5.89% 3.29% 2.29% 4.25% -5.00%
F1
Total parcel
count 3169 3058 2918 3231 3067
% change 3.63% 4.8% -9.69% 5.35% 3.93%
Market Value $2,040,295,326 $1,878,362,772 $1,732,184,979 $1,571,942,427 $1,409,385,730
% change 8.62% 8.44% 10.19% 11.53% 10.21%
L1
Total parcel
count 4652 4721 4403 4289 4618
% change -1.46% 7.22% 2.66% -7.12% 8.43%
Market Value $904,185,507 $864,291,900 $863,016,005 $529,103,293 $693,173,069
% change 4.62% 0.15% 63.11% -23.67% 17.85%
7
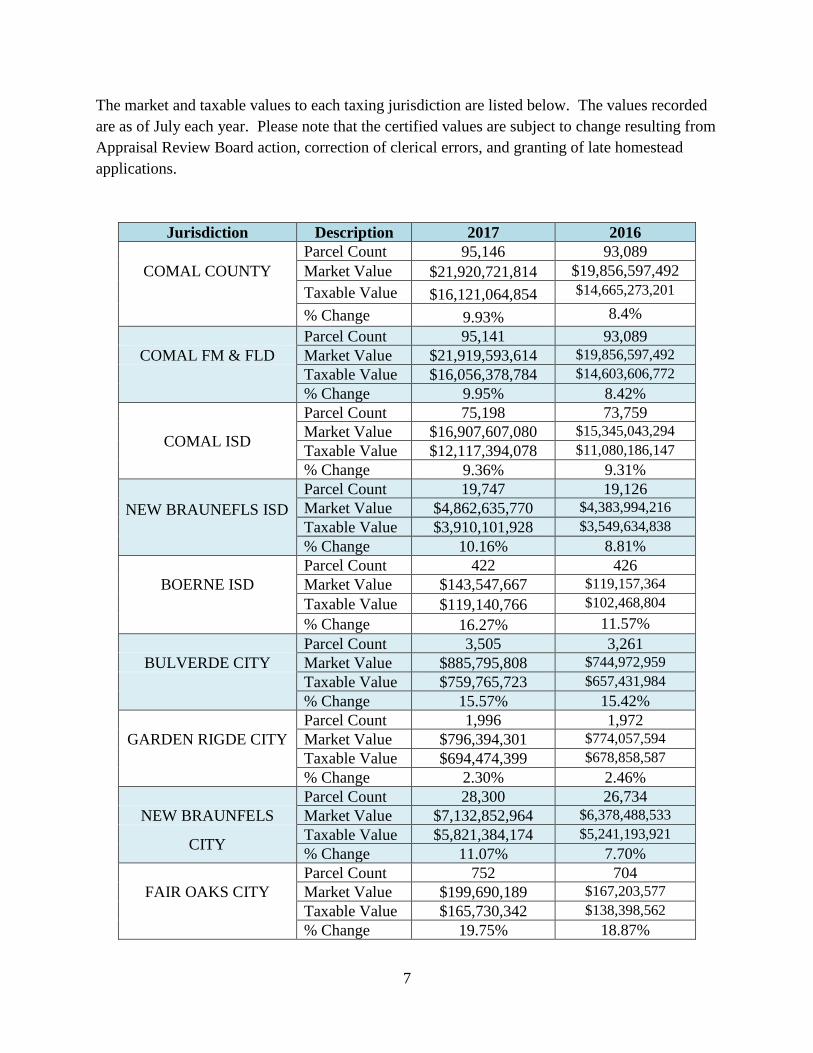
The market and taxable values to each taxing jurisdiction are listed below. The values recorded
are as of July each year. Please note that the certified values are subject to change resulting from
Appraisal Review Board action, correction of clerical errors, and granting of late homestead
applications.
Jurisdiction Description 2017 2016
Parcel Count 95,146 93,089
COMAL COUNTY Market Value $21,920,721,814 $19,856,597,492
Taxable Value $16,121,064,854 $14,665,273,201
% Change 9.93% 8.4%
Parcel Count 95,141 93,089
COMAL FM & FLD Market Value $21,919,593,614 $19,856,597,492
Taxable Value $16,056,378,784 $14,603,606,772
% Change 9.95% 8.42%
COMAL ISD
Parcel Count 75,198 73,759
Market Value $16,907,607,080 $15,345,043,294
Taxable Value $12,117,394,078 $11,080,186,147
% Change 9.36% 9.31%
NEW BRAUNEFLS ISD
Parcel Count 19,747 19,126
Market Value $4,862,635,770 $4,383,994,216
Taxable Value $3,910,101,928 $3,549,634,838
% Change 10.16% 8.81%
Parcel Count 422 426
BOERNE ISD Market Value $143,547,667 $119,157,364
Taxable Value $119,140,766 $102,468,804
% Change 16.27% 11.57%
Parcel Count 3,505 3,261
BULVERDE CITY Market Value $885,795,808 $744,972,959
Taxable Value $759,765,723 $657,431,984
% Change 15.57% 15.42%
Parcel Count 1,996 1,972
GARDEN RIGDE CITY Market Value $796,394,301 $774,057,594
Taxable Value $694,474,399 $678,858,587
% Change 2.30% 2.46%
Parcel Count 28,300 26,734
NEW BRAUNFELS Market Value $7,132,852,964 $6,378,488,533
CITY Taxable Value $5,821,384,174 $5,241,193,921
% Change 11.07% 7.70%
Parcel Count 752 704
FAIR OAKS CITY Market Value $199,690,189 $167,203,577
Taxable Value $165,730,342 $138,398,562
% Change 19.75% 18.87%
8
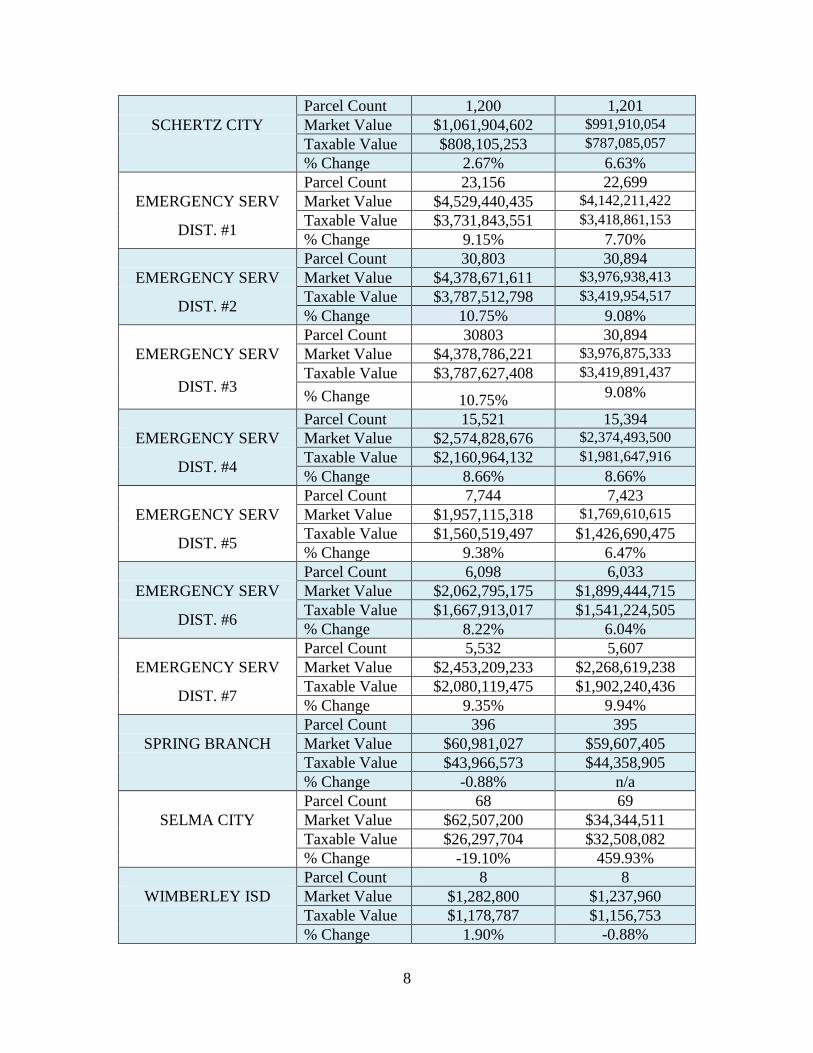
Parcel Count 1,200 1,201
SCHERTZ CITY Market Value $1,061,904,602 $991,910,054
Taxable Value $808,105,253 $787,085,057
% Change 2.67% 6.63%
Parcel Count 23,156 22,699
EMERGENCY SERV Market Value $4,529,440,435 $4,142,211,422
DIST. #1 Taxable Value $3,731,843,551 $3,418,861,153
% Change 9.15% 7.70%
Parcel Count 30,803 30,894
EMERGENCY SERV Market Value $4,378,671,611 $3,976,938,413
DIST. #2 Taxable Value $3,787,512,798 $3,419,954,517
% Change 10.75% 9.08%
Parcel Count 30803 30,894
EMERGENCY SERV Market Value $4,378,786,221 $3,976,875,333
DIST. #3 Taxable Value $3,787,627,408 $3,419,891,437
% Change 10.75% 9.08%
Parcel Count 15,521 15,394
EMERGENCY SERV Market Value $2,574,828,676 $2,374,493,500
DIST. #4 Taxable Value $2,160,964,132 $1,981,647,916
% Change 8.66% 8.66%
Parcel Count 7,744 7,423
EMERGENCY SERV Market Value $1,957,115,318 $1,769,610,615
DIST. #5 Taxable Value $1,560,519,497 $1,426,690,475
% Change 9.38% 6.47%
Parcel Count 6,098 6,033
EMERGENCY SERV Market Value $2,062,795,175 $1,899,444,715
DIST. #6 Taxable Value $1,667,913,017 $1,541,224,505
% Change 8.22% 6.04%
Parcel Count 5,532 5,607
EMERGENCY SERV Market Value $2,453,209,233 $2,268,619,238
DIST. #7 Taxable Value $2,080,119,475 $1,902,240,436
% Change 9.35% 9.94%
Parcel Count 396 395
SPRING BRANCH Market Value $60,981,027 $59,607,405
Taxable Value $43,966,573 $44,358,905
% Change -0.88% n/a
Parcel Count 68 69
SELMA CITY Market Value $62,507,200 $34,344,511
Taxable Value $26,297,704 $32,508,082
% Change -19.10% 459.93%
Parcel Count 8 8
WIMBERLEY ISD Market Value $1,282,800 $1,237,960
Taxable Value $1,178,787 $1,156,753
% Change 1.90% -0.88%
9
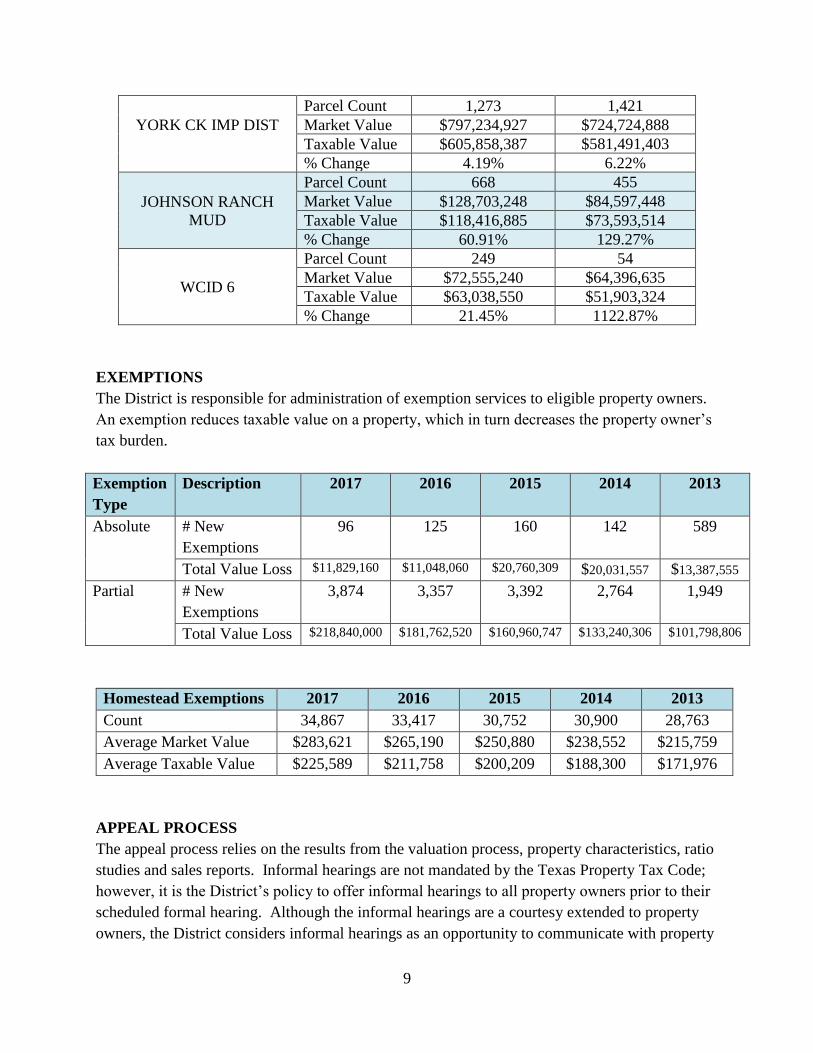
Parcel Count 1,273 1,421
YORK CK IMP DIST Market Value $797,234,927 $724,724,888
Taxable Value $605,858,387 $581,491,403
% Change 4.19% 6.22%
JOHNSON RANCH
MUD
Parcel Count 668 455
Market Value $128,703,248 $84,597,448
Taxable Value $118,416,885 $73,593,514
% Change 60.91% 129.27%
WCID 6
Parcel Count 249 54
Market Value $72,555,240 $64,396,635
Taxable Value $63,038,550 $51,903,324
% Change 21.45% 1122.87%
EXEMPTIONS
The District is responsible for administration of exemption services to eligible property owners.
An exemption reduces taxable value on a property, which in turn decreases the property owner’s
tax burden.
Exemption
Type
Description 2017 2016 2015 2014 2013
Absolute # New
Exemptions
96 125 160 142 589
Total Value Loss $11,829,160 $11,048,060 $20,760,309 $20,031,557 $13,387,555
Partial # New
Exemptions
3,874 3,357 3,392 2,764 1,949
Total Value Loss $218,840,000 $181,762,520 $160,960,747 $133,240,306 $101,798,806
Homestead Exemptions 2017 2016 2015 2014 2013
Count 34,867 33,417 30,752 30,900 28,763
Average Market Value $283,621 $265,190 $250,880 $238,552 $215,759
Average Taxable Value $225,589 $211,758 $200,209 $188,300 $171,976
APPEAL PROCESS
The appeal process relies on the results from the valuation process, property characteristics, ratio
studies and sales reports. Informal hearings are not mandated by the Texas Property Tax Code;
however, it is the District’s policy to offer informal hearings to all property owners prior to their
scheduled formal hearing. Although the informal hearings are a courtesy extended to property
owners, the District considers informal hearings as an opportunity to communicate with property
10
owners, verify records and identify any areas of the appraisal records which may require further
review. The District recognizes that informal hearings exist for both the benefit of the public and
the District. A protest that cannot be settled at an informal hearing may proceed to a scheduled
hearing with the Appraisal Review Board.
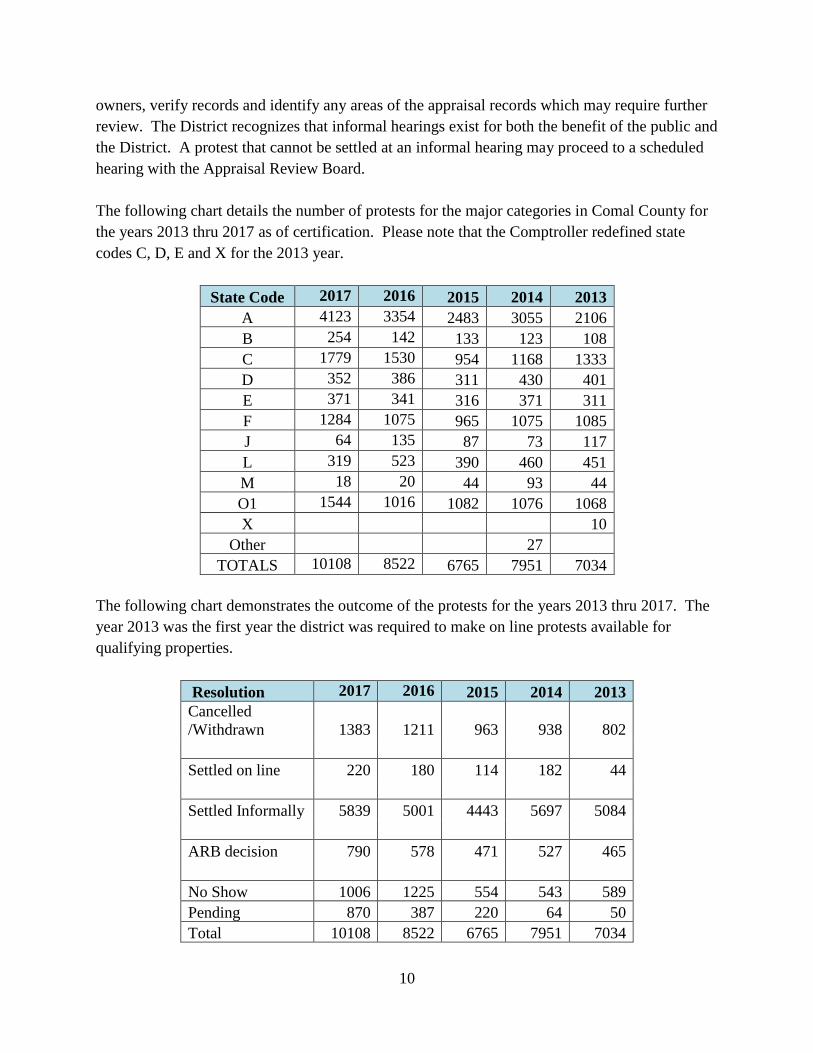
The following chart details the number of protests for the major categories in Comal County for
the years 2013 thru 2017 as of certification. Please note that the Comptroller redefined state
codes C, D, E and X for the 2013 year.
State Code 2017 2016 2015 2014 2013
A 4123 3354 2483 3055 2106
B 254 142 133 123 108
C 1779 1530 954 1168 1333
D 352 386 311 430 401
E 371 341 316 371 311
F 1284 1075 965 1075 1085
J 64 135 87 73 117
L 319 523 390 460 451
M 18 20 44 93 44
O1 1544 1016 1082 1076 1068
X 10
Other 27
TOTALS 10108 8522 6765 7951 7034
The following chart demonstrates the outcome of the protests for the years 2013 thru 2017. The
year 2013 was the first year the district was required to make on line protests available for
qualifying properties.
Resolution 2017 2016 2015 2014 2013
Cancelled
/Withdrawn 1383 1211 963 938 802
Settled on line 220 180 114 182 44
Settled Informally 5839 5001 4443 5697 5084
ARB decision 790 578 471 527 465
No Show 1006 1225 554 543 589
Pending 870 387 220 64 50
Total 10108 8522 6765 7951 7034
11
FINAL PERFORMANCE ANALYSIS
According to Chapter 5 of the Texas Property Tax Code and Section 403.302 of the Texas
Government Code, the State Comptroller’s Property Tax Assistance Division (PTD) conducts a
biannual Property Value Study (PVS) of each Texas school district and each appraisal district.
The Comal Appraisal District undergoes a property value study on odd years. The 2017
appraisal year is an odd numbered year; therefore, a property value study will be conducted by
the Comptroller. The 2017 PVS results are not available.
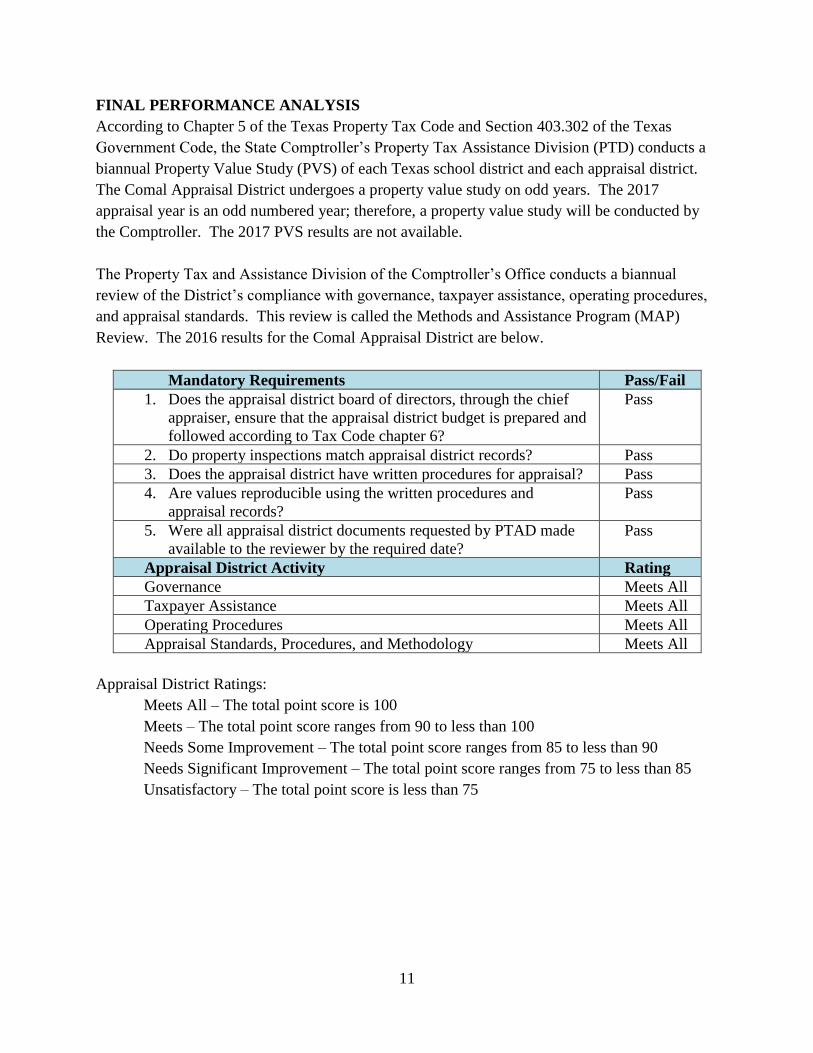
The Property Tax and Assistance Division of the Comptroller’s Office conducts a biannual
review of the District’s compliance with governance, taxpayer assistance, operating procedures,
and appraisal standards. This review is called the Methods and Assistance Program (MAP)
Review. The 2016 results for the Comal Appraisal District are below.
Mandatory Requirements Pass/Fail
1. Does the appraisal district board of directors, through the chief
appraiser, ensure that the appraisal district budget is prepared and
followed according to Tax Code chapter 6?
Pass
2. Do property inspections match appraisal district records? Pass
3. Does the appraisal district have written procedures for appraisal? Pass
4. Are values reproducible using the written procedures and
appraisal records?
Pass
5. Were all appraisal district documents requested by PTAD made
available to the reviewer by the required date?
Pass
Appraisal District Activity Rating
Governance Meets All
Taxpayer Assistance Meets All
Operating Procedures Meets All
Appraisal Standards, Procedures, and Methodology Meets All
Appraisal District Ratings:
Meets All – The total point score is 100
Meets – The total point score ranges from 90 to less than 100
Needs Some Improvement – The total point score ranges from 85 to less than 90
Needs Significant Improvement – The total point score ranges from 75 to less than 85
Unsatisfactory – The total point score is less than 75
12
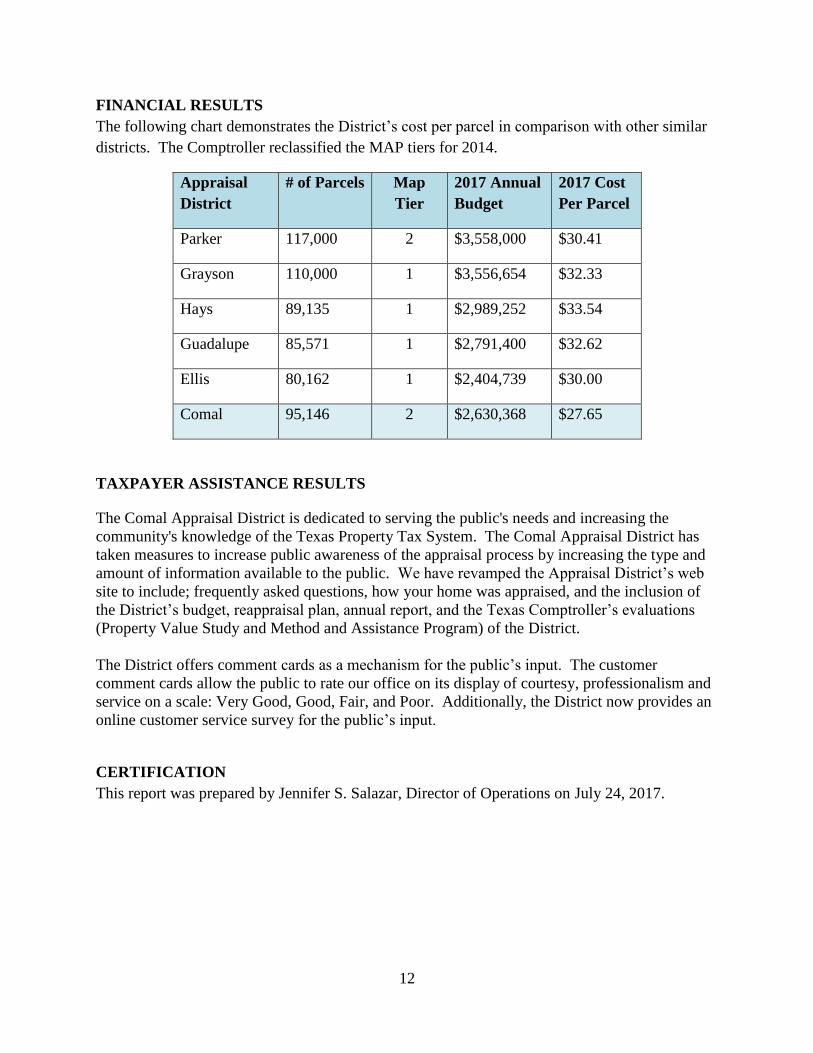
FINANCIAL RESULTS
The following chart demonstrates the District’s cost per parcel in comparison with other similar
districts. The Comptroller reclassified the MAP tiers for 2014.
Appraisal
District
# of Parcels Map
Tier
2017 Annual
Budget
2017 Cost
Per Parcel
Parker 117,000 2 $3,558,000 $30.41
Grayson 110,000 1 $3,556,654 $32.33
Hays 89,135 1 $2,989,252 $33.54
Guadalupe 85,571 1 $2,791,400 $32.62
Ellis 80,162 1 $2,404,739 $30.00
Comal 95,146 2 $2,630,368 $27.65
TAXPAYER ASSISTANCE RESULTS
The Comal Appraisal District is dedicated to serving the public's needs and increasing the
community's knowledge of the Texas Property Tax System. The Comal Appraisal District has
taken measures to increase public awareness of the appraisal process by increasing the type and
amount of information available to the public. We have revamped the Appraisal District’s web
site to include; frequently asked questions, how your home was appraised, and the inclusion of
the District’s budget, reappraisal plan, annual report, and the Texas Comptroller’s evaluations
(Property Value Study and Method and Assistance Program) of the District.
The District offers comment cards as a mechanism for the public’s input. The customer
comment cards allow the public to rate our office on its display of courtesy, professionalism and
service on a scale: Very Good, Good, Fair, and Poor. Additionally, the District now provides an
online customer service survey for the public’s input.
CERTIFICATION
This report was prepared by Jennifer S. Salazar, Director of Operations on July 24, 2017.