Cold Storage Monitoring System Using Internet of Thing (IoT)
24
Cold Storage Monitoring System Using Internet of Thing (IoT) Siti Nursyahirah Binti Sarija Bachelor of Computer Science with Honours (Network Computing) 2020
Transcript of Cold Storage Monitoring System Using Internet of Thing (IoT)

Cold Storage Monitoring System Using Internet of Thing (IoT)
Siti Nursyahirah Binti Sarija
Bachelor of Computer Science with Honours
(Network Computing)
2020

COLD STORAGE MONITORING SYSTEM USING INTERNET OF THING (IoT)
SITI NURSYAHIRAH BINTI SARIJA
This project is submitted in partial fulfilment of the
requirement for the degree of
Bachelor of Computer Science and Information Technology
Faculty of Computer Science and Information Technology
UNIVERSITI MALAYSIA SARAWAK
2020

SISTEM PEMANTAUAN PENYIMPANAN DINGIN MENGGUNAKAN IOT
SITI NURSYAHIRAH BINTI SARIJA
Projek ini merupakan salah satu keperluan untuk
Ijazah Sarjana Muda Sains Komputer dan Teknologi Maklumat
Fakulti Sains Komputer dan Teknologi Maklumat
UNIVERSITI MALAYSIA SARAWAK
2020

DECLARATION OF ORIGINALITY
I hereby declare that the project with the title 'Cold Storage Monitoring System Using Internet
of Thing (IoT)' submitted by me to the faculty of Computer Science and Information
Technology, University Malaysia Sarawak (UNIMAS) is my genuine work under the guidance
of Dr Mohamad Imran Bin Hj Bandan.
___________
Siti Nursyahirah Binti Sarija
Faculty of Computer Science and Information Technology
Universiti Malaysia Sarawak

i
ACKNOWLEDGEMENT
First of all, I would like to thank ALLAH S.W.T and HIS messenger, Prophet
Muhammad S.A.W. Because of HIS guidance and blessing, I am able to finish my final year
project. It has been an intense journey for me to complete this project. I am grateful that I have
family that always become my backbone and friends that support me with all positive vibes. I
would like to give my biggest thank to both of my parents Mr Sarija Bin Sulaiman and Mrs
Sohana Bin Madon for their continuous prayers and blessings.
Special thanks to my supervisor Dr Mohamad Imran Bin Hj Bandan, who spare his time
and continuous guidance to me also for being patient with me from the beginning until the end
of this project. Finally, thank you to all my lecturer from Computer Science and Information
Technology that has taught me from the first semester until now. I pray that He blesses all of
you for what you have done for me throughout the process.

ii
ABSTRACT
Food is an essential part of human life. Food is being consumed to allow humans to
generate energy and stay healthy. The low intake on a specific type of food can lead to a risk of
getting cancer. For example, a low intake of vegetable and fruit can cause human to be exposed
to particular lung cancer (Block et al., 1992). Due to this issue, human started to realise the
importance of consuming healthy food. Older generations have already understood the link
between nutrition and health that gain through food. Their interest in 'healthy living' food
consuming has to increase affluence and education among the world population (Kern, 2006).
As the years go by, the food consumption trend is changing. Human is focusing more on fresh
food consumption, especially for fruits and vegetables. Percentage of human consuming fresh
food is increasing from 16.4% in the year 2001 to 17.4% in 2014 (McLynn, 2015). The cold
storage is created in supermarkets and mini-market in order to ensure people live in urbanise
area able to consume fresh and good quality of products such as vegetables and fruits.
iii
ABSTRAK
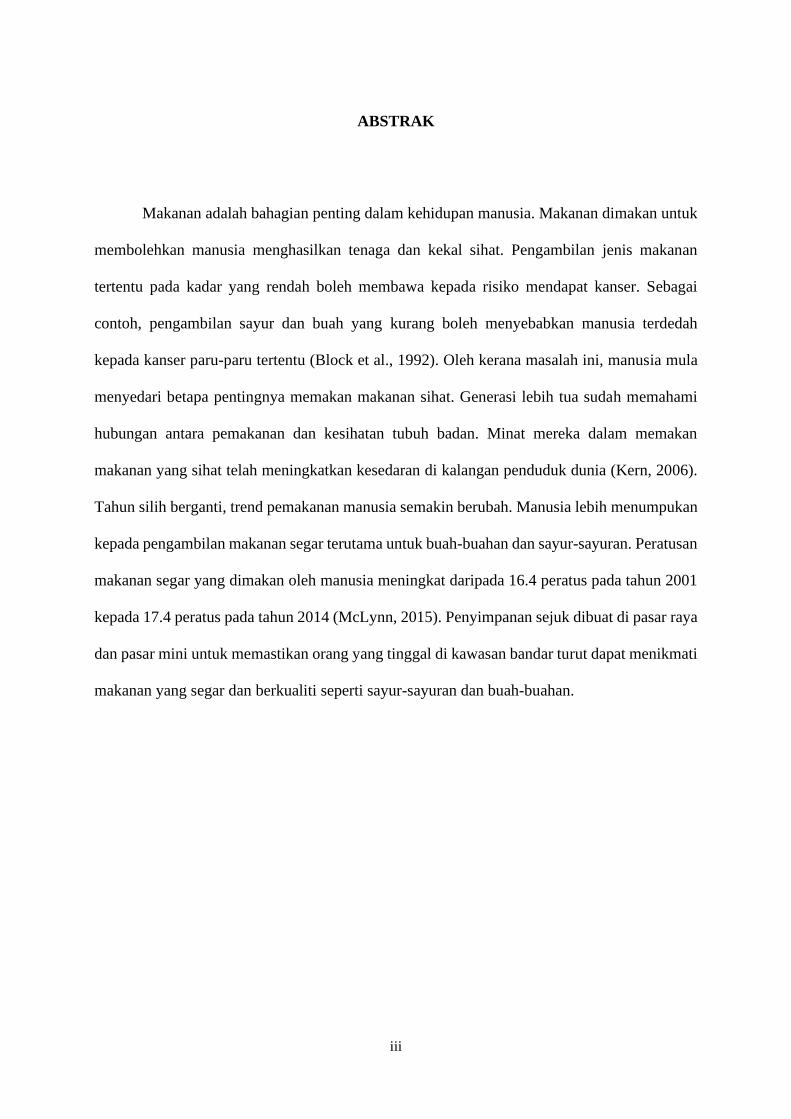
Makanan adalah bahagian penting dalam kehidupan manusia. Makanan dimakan untuk
membolehkan manusia menghasilkan tenaga dan kekal sihat. Pengambilan jenis makanan
tertentu pada kadar yang rendah boleh membawa kepada risiko mendapat kanser. Sebagai
contoh, pengambilan sayur dan buah yang kurang boleh menyebabkan manusia terdedah
kepada kanser paru-paru tertentu (Block et al., 1992). Oleh kerana masalah ini, manusia mula
menyedari betapa pentingnya memakan makanan sihat. Generasi lebih tua sudah memahami
hubungan antara pemakanan dan kesihatan tubuh badan. Minat mereka dalam memakan
makanan yang sihat telah meningkatkan kesedaran di kalangan penduduk dunia (Kern, 2006).
Tahun silih berganti, trend pemakanan manusia semakin berubah. Manusia lebih menumpukan
kepada pengambilan makanan segar terutama untuk buah-buahan dan sayur-sayuran. Peratusan
makanan segar yang dimakan oleh manusia meningkat daripada 16.4 peratus pada tahun 2001
kepada 17.4 peratus pada tahun 2014 (McLynn, 2015). Penyimpanan sejuk dibuat di pasar raya
dan pasar mini untuk memastikan orang yang tinggal di kawasan bandar turut dapat menikmati
makanan yang segar dan berkualiti seperti sayur-sayuran dan buah-buahan.
iv
TABLE OF CONTENT
ACKNOWLEDGEMENT .......................................................................................................... i
ABSTRACT ............................................................................................................................... ii
ABSTRAK ................................................................................................................................ iii
TABLE OF CONTENT ............................................................................................................ iv
LIST OF TABLES .................................................................................................................. viii
LIST OF FIGURES ................................................................................................................... ix
CHAPTER 1: INTRODUCTION .............................................................................................. 1
1.1 INTRODUCTION ....................................................................................................... 1
1.2 PROBLEM STATEMENT .......................................................................................... 3
1.3 SCOPE ......................................................................................................................... 3
1.4 AIMS AND OBJECTIVES ......................................................................................... 4
1.5 BRIEF METHODOLOGY .......................................................................................... 4
1.6 SIGNIFICANCE OF PROJECT ................................................................................. 7
1.7 PROJECT SCHEDULE .............................................................................................. 7
1.8 EXPECTED OUTCOME ............................................................................................ 8
1.9 PROJECT OUTLINE .................................................................................................. 8
CHAPTER 2: LITERATURE REVIEW ................................................................................. 10
2.1 INTRODUCTION .......................................................................................................... 10
2.2 BACKGROUND STUDY .............................................................................................. 10
2.3 REVIEWS ON SIMILAR SYSTEMS ........................................................................... 11
v
2.3.1 MONITORING AND CONTROLLING IN FOOD STORAGE SYSTEM USING
WIRELESS SENSOR NETWORK (WSN) BASED ON ZIGBEE & BLUETOOTH
MODULE ......................................................................................................................... 12
2.3.2 WSN BASED ONLINE PARAMETER MONITORING IN COLD STORAGE
WAREHOUSES IN CLOUD USING IOT CONCEPTS ................................................. 15
2.3.3 ACURITE 01083 INDOOR THERMOMETER & HYGROMETER .................... 18
2.4 DISCUSSION ................................................................................................................. 20
2.5 SUMMARY.................................................................................................................... 21
CHAPTER 3: METHODOLOGY ........................................................................................... 22
3.1 INTRODUCTION .......................................................................................................... 22
3.2 WATERFALL METHODOLOGY ................................................................................ 22
3.3 USER REQUIREMENT ................................................................................................ 25
3.4 SOFTWARE REQUIREMENT ..................................................................................... 27
3.4.1 ARDUINO IDE ....................................................................................................... 27
3.4.2 BLYNK APPLICATION ......................................................................................... 29
3.4.3 DRAW.IO ................................................................................................................ 30
3.4.4 BALSAMIQ MOCKUPS ........................................................................................ 31
3.5 HARDWARE REQUIREMENT ................................................................................... 32
3.5.1 NODE MCU ESP8266 ............................................................................................ 32
3.5.2 TEMPERATURE AND HUMIDITY SENSOR ..................................................... 34
3.5.3 BUZZER .................................................................................................................. 36
vi
3.5.4 BREADBOARD ...................................................................................................... 37
3.5.5 JUMPER WIRE ....................................................................................................... 38
3.5.6 AC POWER SUPPLY ............................................................................................. 38
3.6 SYSTEM ARCHITECTURE ......................................................................................... 39
3.7 SYSTEM DESIGN ......................................................................................................... 40
3.7.1 BLOCK DIAGRAM ................................................................................................ 40
3.7.2 FLOW CHART DIAGRAM .................................................................................... 41
3.7.3 DATA FLOW DIAGRAM ...................................................................................... 44
3.8 USER INTERFACE DESIGN ....................................................................................... 48
3.9 SUMMARY.................................................................................................................... 50
CHAPTER 4: IMPLEMENTATION AND TESTING ........................................................... 52
4.1 INTRODUCTION .......................................................................................................... 52
4.2 SOFTWARE INSTALLATION AND CONFIGURATION ......................................... 52
4.2.1 ARDUINO IDE ....................................................................................................... 52
4.2.2 Blynk Application .................................................................................................... 59
4.3 HARDWARE INSTALLATION AND CODES ........................................................... 67
4.3.1 HARDWARE INSTALLATION ............................................................................ 67
4.3.2 CODES FOR THE SYSTEM .................................................................................. 69
4.4 TESTING........................................................................................................................ 74
4.4.1 COMPONENT TESTING ....................................................................................... 74
4.4.2 PROCESS OF TESTING ........................................................................................ 86

vii
4.5 SUMMARY.................................................................................................................. 101
CHAPTER 5: CONCLUSION AND FUTURE WORK ....................................................... 102
5.1 INTRODUCTION ........................................................................................................ 102
5.2 OBJECTIVES ACHIEVEMENTS ............................................................................... 102
5.3 PROJECT IMITATIONS ............................................................................................. 103
5.4 FUTURE WORKS ....................................................................................................... 103
5.5 CONCLUSION ............................................................................................................ 103
REFERENCES ....................................................................................................................... 104

viii
LIST OF TABLES
Table 2.1: Comparison of Existing Systems with Proposed System ....................................... 20
Table 3.1: Comparison Table on Microcontroller .................................................................... 33
Table 3.2: Comparison Table on Temperature and Humidity Temperature ............................ 35
Table 4.1: A test case for NodeMCU ESP8266 module. ......................................................... 76
Table 4.2: A test case for temperature and humidity sensor module. ...................................... 77
Table 4.3: A test case for Buzzer module ................................................................................ 78
Table 4.4: A test case for switching between tab module ........................................................ 79
Table 4.5: A test case for the temperature display module ...................................................... 79
Table 4.6: A test case for the humidity display module ........................................................... 80
Table 4.7: A test case for temperature graph module .............................................................. 81
Table 4.8: A test case for humidity graph module ................................................................... 82
Table 4.9: A test case for alert notification module ................................................................. 83
Table 4.10: A test case for report generating module .............................................................. 84
Table 4.11: A test case for a complete system ......................................................................... 86
Table 5.1: Comparison between objectives and achievement table ....................................... 102
ix
LIST OF FIGURES
Figure 1.1: The Waterfall Model (Bassil, 2012). ....................................................................... 5
Figure 1.2: FYP 1 Schedule. ...................................................................................................... 7
Figure 1.3: FYP 2 Schedule. ...................................................................................................... 8
Figure 2.1: Hardware designing of wireless sensor networks .................................................. 12
Figure 2.2: The flow chart of the system that retrieved through reverse engineering. ............ 13
Figure 2.3: The flow chart of the transmitter node that retrieved through reverse engineering.
.................................................................................................................................................. 16
Figure 2.4: The flow chart of the receiver node that retrieved through reverse engineering. .. 17
Figure 2.5: AcuRite 01083 Indoor Thermometer & Hygrometer ............................................ 18
Figure 3.1: The Waterfall Model (Bassil, 2012) ...................................................................... 23
Figure 3.2: The Arduino IDE interface (Aqeel, 2018) ............................................................. 28
Figure 3.3: Major components in Blynk platform (How Blynk Works, n.d) ........................... 29
Figure 3.4: User interface of the Draw.io (Disrupting the Business of Diagramming, n.d) .... 30
Figure 3.5: The User interface of the Balsamiq Mockups (Balsamiq Mockups 3 Application
Overview - Balsamiq for Desktop Documentation, n.d) .......................................................... 31
Figure 3.6: Node MCU ESP8266 (Insight Into ESP8266 NodeMCU Features & Using It With
Arduino IDE, n.d) ..................................................................................................................... 32
Figure 3.7: DHT22 temperature and humidity sensor module (Dejan, n.d) ............................ 34
Figure 3.8: The buzzer (Active Passive Buzzer, 2017) ............................................................ 36
Figure 3.9: The terminal lead of a buzzer (Active Passive Buzzer, 2017) ............................... 36
Figure 3.10: The breadboard (Buckley, 2018) ......................................................................... 37
Figure 3.11: The male-to-female jumper wire (Hemmings, 2018) .......................................... 38
Figure 3.12: The AC power supply (Micro USB Cable & Power Adapter, n.d) ..................... 38

x
Figure 3.13: System architecture of the proposed system ........................................................ 39
Figure 3.14: Block Diagram of the proposed system ............................................................... 40
Figure 3.15: Flow chart of the proposed system ...................................................................... 42
Figure 3.16: Flow chart of the mobile application for the proposed system ............................ 43
Figure 3.17: Context diagram of the proposed system. ............................................................ 44
Figure 3.18: DFD Level-0 of the proposed system. ................................................................. 45
Figure 3.19: DFD Level-1 process 1.0 of the proposed system ............................................... 46
Figure 3.20: DFD Level-1 process 2.0 of the proposed system ............................................... 46
Figure 3.21: DFD Level-1 process 3.0 of the proposed system ............................................... 47
Figure 3.22: DFD Level-1 process 4.0 of the proposed system ............................................... 47
Figure 3.23: The main menu tab .............................................................................................. 48
Figure 3.24: The temperature tab ............................................................................................. 49
Figure 3.25: The humidity tab .................................................................................................. 49
Figure 3.26: Alert notification for temperature ........................................................................ 50
Figure 3.27: Alert notification for humidity ............................................................................. 50
Figure 4.1: Arduino IDE in Microsoft Store ............................................................................ 53
Figure 4.2: An Arduino IDE .................................................................................................... 53
Figure 4.3: Preferences button in Arduino IDE ....................................................................... 54
Figure 4.4: Adding URLs into Additional/Boards Manager URLs ......................................... 55
Figure 4.5: Enter the Boards Manager ..................................................................................... 55
Figure 4.6: Install the ESP8266 board ..................................................................................... 56
Figure 4.7: Change Board to NodeMCU 1.0 (ESP-12E Module) ............................................ 56
Figure 4.8: Manage Libraries button ........................................................................................ 57
Figure 4.9: Install DHT sensor library ..................................................................................... 57
xi
Figure 4.10: Manage Libraries button ...................................................................................... 58
Figure 4.11: Install Blynk library ............................................................................................. 58
Figure 4.12: Installing Blynk Application ................................................................................ 59
Figure 4.13: Sign up in Blynk Application 1 ........................................................................... 60
Figure 4.14: Sign up in Blynk Application 2 ........................................................................... 60
Figure 4.15: Create a new project in Blynk Application 1 ....................................................... 60
Figure 4.16: Create a new project in Blynk Application 2 ....................................................... 60
Figure 4.17: Widget box in Blynk ............................................................................................ 61
Figure 4.18: Configuration window for the tabs ...................................................................... 61
Figure 4.19: The main interface of Cold Storage MS mobile application ............................... 62
Figure 4.20: Configuration window for the temperature label value display .......................... 63
Figure 4.21: Configuration window for the humidity label value display ............................... 63
Figure 4.22: Configuration window for the temperature SuparChart 1 ................................... 63
Figure 4.23: Configuration window for the temperature SuparChart 2 ................................... 63
Figure 4.24: Configuration window for the temperature SuparChart 3 ................................... 64
Figure 4.25: Configuration window for the humidity SuparChart 1 ........................................ 64
Figure 4.26: Configuration window for the humidity SuparChart 2 ........................................ 65
Figure 4.27: Configuration window for the humidity SuparChart 3 ........................................ 65
Figure 4.28: Configuration window for the notification feature .............................................. 66
Figure 4.29: Configuration window report feature .................................................................. 66
Figure 4.30: The overall design of the Cold Storage Monitoring System for main menu tab in
the Blynk application ............................................................................................................... 66
Figure 4.31: The overall design of the Cold Storage Monitoring System for temperature tab in
Blynk application ..................................................................................................................... 66
xii
Figure 4.32: The overall design of the Cold Storage Monitoring System for humidity tab in
Blynk application ..................................................................................................................... 67
Figure 4.33: NodeMCU ESP8266 connection ......................................................................... 68
Figure 4.34: DHT22 connect to NodeMCU ESP8266 ............................................................. 68
Figure 4.35: Buzzer connect to NodeMCU ESP8266 .............................................................. 69
Figure 4.36: Libraries include in the codes .............................................................................. 69
Figure 4.37: Setup connection between the hardware and android Blynk application ............ 70
Figure 4.38: Define DHT and BlynkTimer .............................................................................. 70
Figure 4.39: Declare virtual pin of label value display widget ................................................ 71
Figure 4.40: Declare buzzer and thresholds ............................................................................. 71
Figure 4.41: The void setup ...................................................................................................... 72
Figure 4.42: The void loop ....................................................................................................... 72
Figure 4.43: The void sendSensor ............................................................................................ 73
Figure 4.44: The thresholds checking ...................................................................................... 74
Figure 4.45: Wi-Fi module successfully connected ................................................................. 86
Figure 4.46: Wi-Fi module successfully connected ................................................................. 87
Figure 4.47: Some temperature and humidity reading ............................................................. 88
Figure 4.48: Temperature display in the mobile application ................................................... 89
Figure 4.49: Humidity display in the mobile application ........................................................ 89
Figure 4.50: Latest temperature and humidity value in the serial monitor .............................. 90
Figure 4.51: Live mode in the temperature graph .................................................................... 90
Figure 4.52: One-hour mode in the temperature graph ............................................................ 91
Figure 4.53: One-day mode in the temperature graph ............................................................. 91
Figure 4.54: One-week mode in the temperature graph ........................................................... 92

xiii
Figure 4.55: One-month mode in the temperature graph ......................................................... 92
Figure 4.56: live mode in humidity graph ................................................................................ 93
Figure 4.57: one-hour mode in humidity graph ....................................................................... 93
Figure 4.58: one-day mode in humidity graph ......................................................................... 94
Figure 4.59: one-week mode in humidity graph ...................................................................... 94
Figure 4.60: one-month mode in humidity graph .................................................................... 95
Figure 4.61: Alert notification on DHT failure ........................................................................ 95
Figure 4.62: Temperature message notification on the lock screen ......................................... 96
Figure 4.63: Temperature message notification on unlock screen .......................................... 96
Figure 4.64: Humidity message notification on the lock screen .............................................. 97
Figure 4.65: Humidity message notification on the unlock screen ......................................... 97
Figure 4.66: Report generated is emailed from Blynk ............................................................ 97
Figure 4.67: The hardware inside transparent plastic wrap ..................................................... 98
Figure 4.68: The temperature of the freezer and fridge compartment ..................................... 99
Figure 4.69: The hardware is located inside the freezer compartment .................................. 100
Figure 4.70: The hardware is located inside the fridge compartment .................................... 101
1
CHAPTER 1: INTRODUCTION
1.1 INTRODUCTION
Food is an essential part of human life. Food is being consumed to allow humans to
generate energy and stay healthy. The low intake on a specific type of food can lead to a risk of
getting cancer. For example, a low intake of vegetable and fruit can cause human to be exposed
to particular lung cancer (Block et al., 1992). Due to this issue, human started to realise the
importance of consuming healthy food. Older generations have already understood the link
between nutrition and health that gain through food. Their interest in 'healthy living' food
consuming has to increase affluence and education among the world population (Kern, 2006).
As the years go by, the food consumption trend is changing. Human is focusing more on fresh
food consumption, especially for fruits and vegetables. Percentage of human consuming fresh
food is increasing from 16.4% in the year 2001 to 17.4% in 2014 (McLynn, 2015).
However, fresh food consumption in urbanise area can be quiet challenging. People who
live in the city or any urbanise places usually get their fresh supply of vegetables and fruits
from supermarkets or minimarkets. This is because of the land limitation that prevents farmers
from farming in those urbanise area. Supermarkets and minimarkets get their fresh food supply
from farmers that live outside of the city. In order to maintain the freshness of the products,
supermarkets or minimarkets need to keep their product stocks in cold room storage.
Temperature and humidity are a vital element of cold storage which always needed to be
maintained and monitored (Most Common Challenges for Cold Storage, n.d.).
2
The temperature and humidity of cold storage are varying according to the type of
product storage and the size of it. According to mynewdesk.com (2013), there are three types
of cold storage that had been used. The first one is the modular cold room which is used for
commercial purposes. Supermarket and minimarket usually use this type of cold storage
because it allows the feature of the customised refrigerating setting. The second one is the
industrial cold storage which suitable for storing a massive number of products. This cold
storage is really big that it allows vehicles to be used to transport products in it. This storage is
made for industries use which industries always involving the amount of product or stock.
Lastly is the combi refrigeration, which is cold storage that has a combination of two different
temperatures. One part of this cold storage is the chiller with the range of 2℃ - 12℃ while the
other part is the freezer which used a temperature of -22℃ (Alvin, 2016).
The temperature and humidity of this cold storage room must be maintained according
to the type of products stored. The ideal temperature for a dry foods product is between 10℃
to 15℃. For refrigerated products, it is better to be stored at temperature 4℃ and below. Next,
dairy products such as yoghurt, cheese and butter are advised to be kept at a temperature of 2℃
to 4℃. Fresh seafood needs to be kept at -1℃ to 2℃ in order to maintain its freshness. Lastly,
frozen food like chickens, shrimps and potatoes need to be kept at -18℃ to maintain it's colour
and vitamin content (Storage Temperatures and Procedures, n.d.).
The low temperature of cold storage is important to preserve the quality of the products
since it slows down the growth of bacteria. While high humidity of cold storage is essential in
slow down the ripening process, this is due to the less amount of moisture loss from fresh
products (CB, 2019). The cold storage's temperature and humidity also need to be monitored

3
frequently by the respected worker. The conventional cold storage monitoring system is quite
hard to use. This is because the workers need to go to the cold storage in person, to be able to
check the current temperature and humidity. Based on this particular problem, the Cold Storage
Monitoring System Using Internet of Things (IoT) is proposed to overcome this problem.
1.2 PROBLEM STATEMENT
Cold storage is commonly known as a cold room that used to preserve and store a
particular type of product at a specific temperature. They are usually used by supermarkets or
mini-markets to store their vegetables and frozen food to maintain quality and product safety
standards. The most concern issues regarding cold storage are the maintaining of temperature
and humidity continually (Most Common Challenges for Cold Storage, n.d.).
Besides that, the temperature and humidity of cold storage need to be monitored at least
two times a day. Some standards also stated that it needed to be monitored every two hours
(How often should you record the temperature of a commercial fridge?, 2016). The traditional
monitoring system can cause overloaded work to the user as the monitoring job can only be
done when the user goes to the cold storage to check the current temperature and humidity
(Most Common Challenges for Cold Storage, n.d.). Lastly, unexpected incidents that might
occur in cold storage such as the malfunction of the cooling machines without prior notice.
1.3 SCOPE
Cold Storage Monitoring System Using Internet of Things (IoT) allows the user to
monitor the current humidity and temperature of cold storage remotely. The user can monitor
it through a mobile application, which able to display the current temperature and humidity of
4
the cold storage. The mobile application also enables the user to view the pattern of temperature
and humidity weekly and generate a report by sending it directly to the email. Besides, the
mobile application will notify the user through an alert message, and the buzzer will beep when
there is a drastic increase or decrease in humidity and temperature. The buzzer will
automatically switch off after the temperature or humidity return to the ideal value. Lastly, this
cold storage is only in the size of a prototype, and it specifically focuses on storing vegetables.
1.4 AIMS AND OBJECTIVES
1. To design a monitoring system that enables the supermarket/minimarket to
monitor their cold room environment.
2. To develop a prototype of the Cold Storage Monitoring System using Internet
of Things (IoT).
3. To test and evaluate the functionality of the prototype.
1.5 BRIEF METHODOLOGY
Powel-Morse (2016) had stated that Dr Winston W. Royce introduces waterfall
Methodology in the year 1970. The author also stated that his methodology is a software
development process which stressed on accomplishing a logical step-up throughout the
software development life cycle (SDLC) process. This logical progression is just like a waterfall
which each phase is not overlapping as the next phase can only begin once the previous step is
finished (Sharma, 2016). According to Sharma (2016) also, Waterfall Methodology is the
earliest to be introduced and easy to understand and use.

5
This method has been chosen for the development of the Cold Storage Monitoring
System using Internet of Things (IoT). There are two main reasons this methodology is chosen.
The first reason is that this methodology suits well with the Final Year Project's Schedule that
has been assigned by the faculty. The second reason is that it is suitable for Milestone-Focused
Development which also focuses on the deadlines (Powel-Morse, 2016). This is very applicable
to Final Year Project since there are deadlines given that need to be followed.
Figure 1.1: The Waterfall Model (Bassil, 2012).
The author, Bassil (2012) had indicated five phases comprises in this methodology. The
phases are analysis phase, design phase, implementation phase, testing phase and maintenance
phase, as shown in the diagram above. Each of the phases will be explained as below:
i. Analysis phase
This phase is the first phase of the Waterfall methodology. In this phase, project
requirement analysis will be figured out based on the information gathered from the users and

6
the study done. The information-gathering process will be made by interviewing the targeted
user. The requirements gathering will be analysed and finalise. Then, problem statement,
objectives and scope of this project will be studied and defined.
ii. Design phase
The design phase is the second phase of this methodology. During this phase, the overall
flow of the system will be design based on the requirement analysis in the previous phase. The
designs that will be included are the architecture of the system, the block diagram of the system,
the flow chart and the data flow diagram of the system.
iii. Implementation phase
The third phase is the implementation phase. In this phase, the system will be developing
based on the design created in the previous phase. All the hardware will be assembling, and the
code of the system will be written in this phase. The mobile application will also be developing
in this phase.
iv. Testing phase
The next phase is the testing phase. This phase will allow the project to be testing and
run at different scenarios in order to make sure that it is fully functioning. The testing that will
be performing for this project is component testing. This testing allows each component and
feature of the system to run and tested according to the design.
v. Maintenance phase
The last phase in this methodology is the maintenance part. This phase can be done once