
CO 2 Tool Workshop Sudhir Gota & Alvin Mejia Clean Air Initiative for Asian Cities Center ITDP's...
62
CO 2 Tool Workshop Sudhir Gota & Alvin Mejia Clean Air Initiative for Asian Cities Center ITDP's Annual Staff Meeting and ClimateWorks' Transport Systems Sector Meeting September 28 - October 2, 2010 Guangzhou
-
Upload
delilah-evans -
Category
Documents
-
view
213 -
download
0
Transcript of CO 2 Tool Workshop Sudhir Gota & Alvin Mejia Clean Air Initiative for Asian Cities Center ITDP's...
CO2 Tool Workshop
Sudhir Gota & Alvin MejiaClean Air Initiative for Asian Cities Center
ITDP's Annual Staff Meeting and ClimateWorks' Transport Systems Sector MeetingSeptember 28 - October 2, 2010Guangzhou
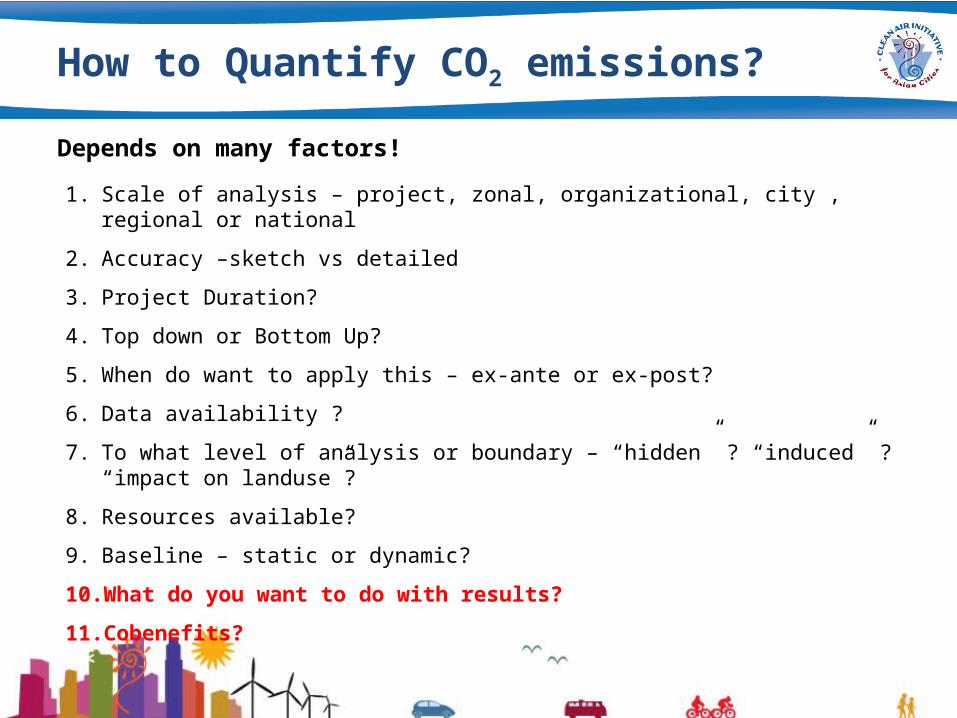
How to Quantify CO2 emissions?
1. Scale of analysis – project, zonal, organizational, city , regional or national
2. Accuracy –sketch vs detailed
3. Project Duration?
4. Top down or Bottom Up?
5. When do want to apply this – ex-ante or ex-post?
6. Data availability ?
7. To what level of analysis or boundary – “hidden” ? “induced” ? “impact on landuse”?
8. Resources available?
9. Baseline – static or dynamic?
10. What do you want to do with results?
11. Cobenefits?
Depends on many factors!
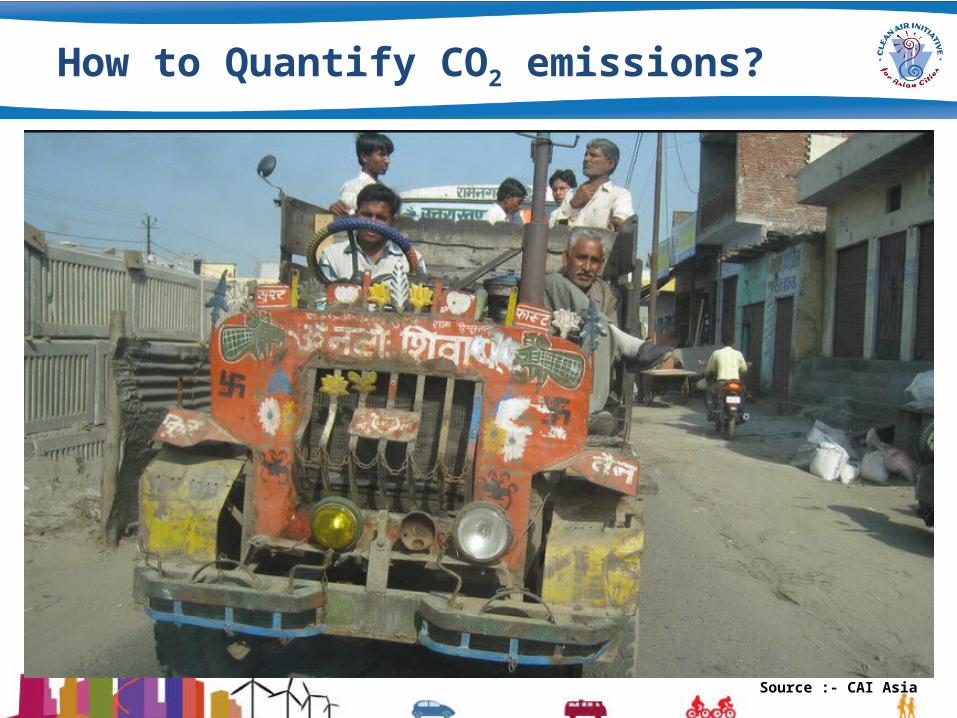
How to Quantify CO2 emissions?
Source :- CAI Asia
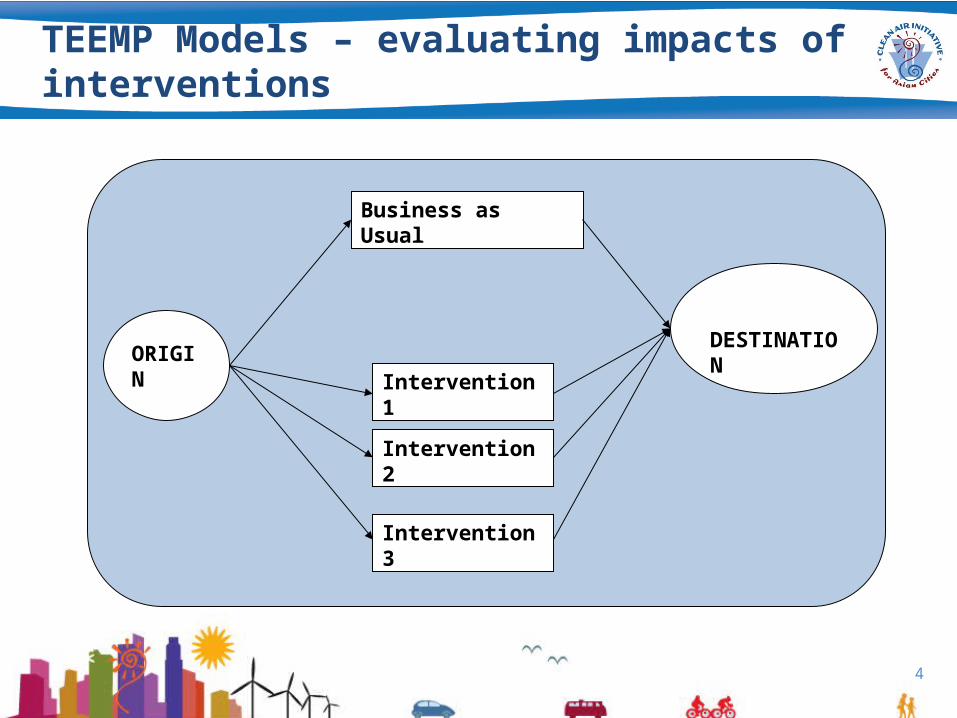
TEEMP Models – evaluating impacts of interventions
4
ORIGINDESTINATION
Business as Usual
Intervention 2
Intervention 3
Intervention 1
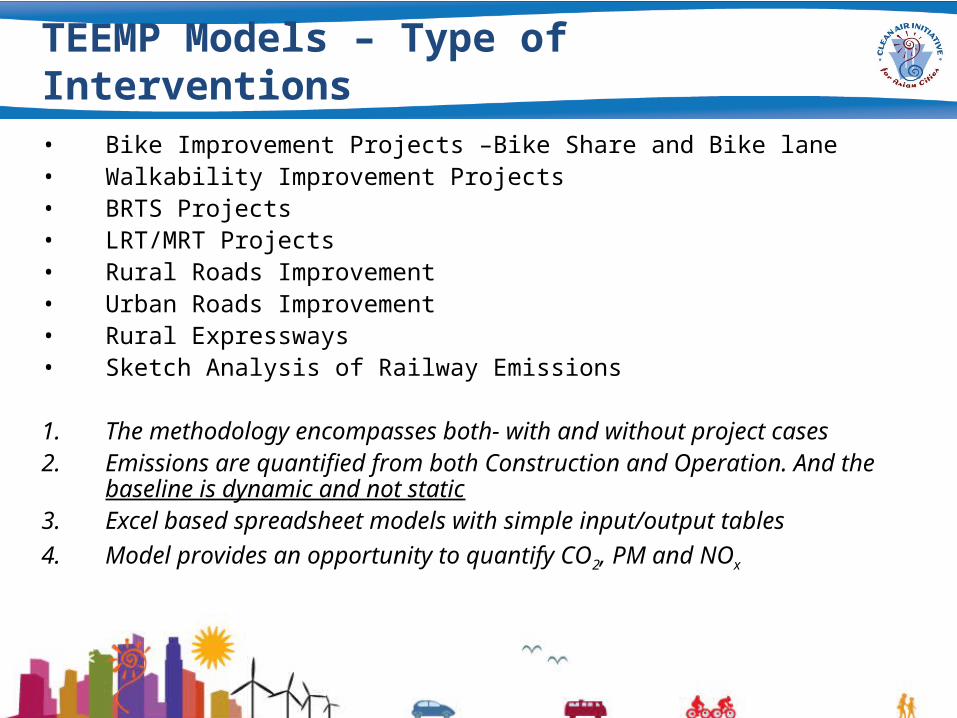
TEEMP Models – Type of Interventions • Bike Improvement Projects –Bike Share and Bike lane• Walkability Improvement Projects• BRTS Projects• LRT/MRT Projects• Rural Roads Improvement • Urban Roads Improvement• Rural Expressways• Sketch Analysis of Railway Emissions
1. The methodology encompasses both- with and without project cases2. Emissions are quantified from both Construction and Operation. And
the baseline is dynamic and not static3. Excel based spreadsheet models with simple input/output tables4. Model provides an opportunity to quantify CO2, PM and NOx
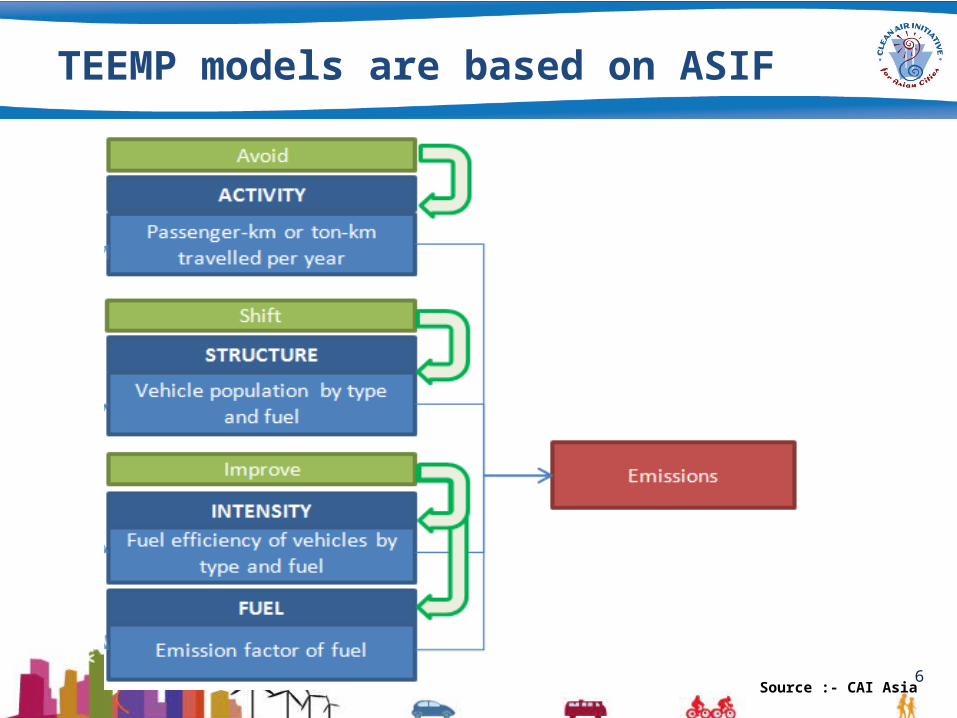
TEEMP models are based on ASIF
6Source :- CAI Asia
Bike Sharing System
8
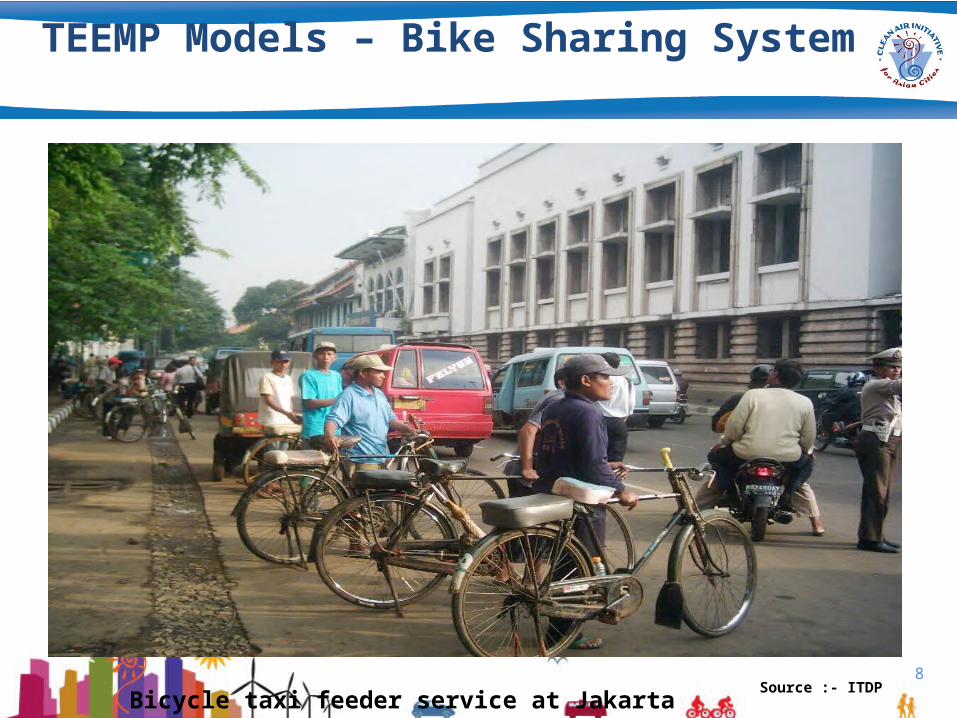
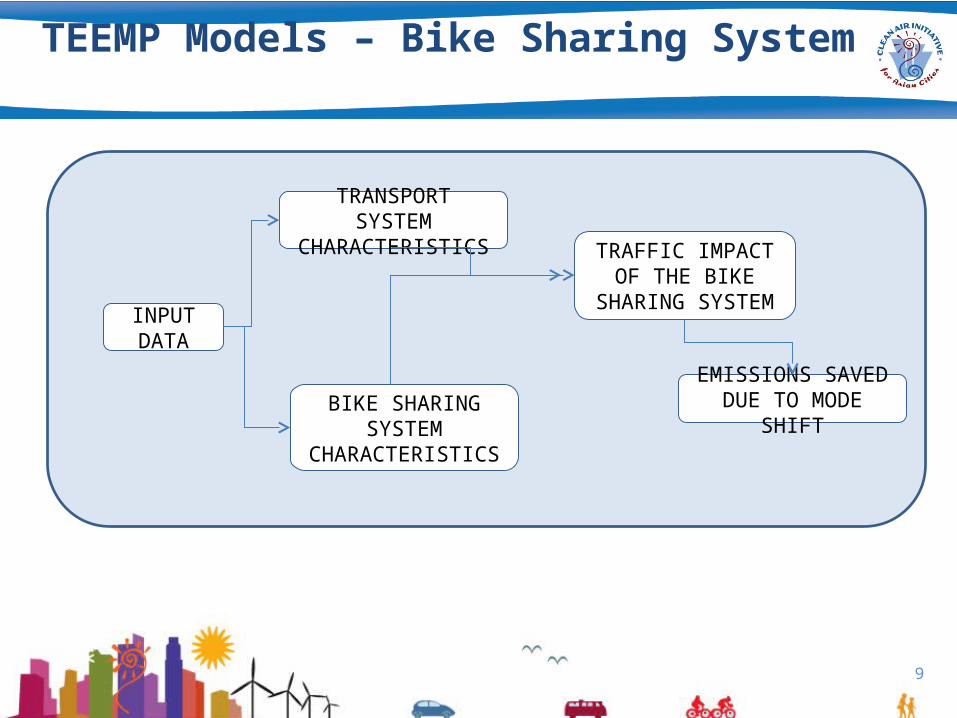
TEEMP Models – Bike Sharing System
Bicycle taxi feeder service at JakartaSource :- ITDP
9
INPUT DATA
BIKE SHARING SYSTEM CHARACTERISTICS
TRAFFIC IMPACT OF THE BIKE SHARING
SYSTEM
TRANSPORT SYSTEM CHARACTERISTICS
EMISSIONS SAVED DUE TO MODE SHIFT
TEEMP Models – Bike Sharing System
TEEMP Models – Bike Sharing System
10
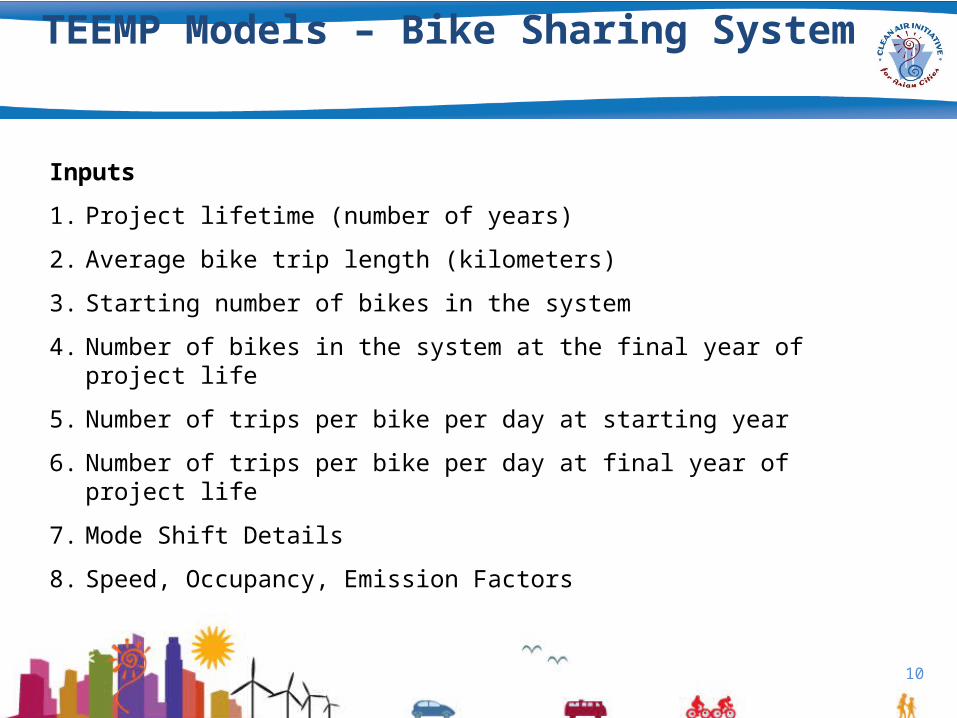
Inputs
1. Project lifetime (number of years)
2. Average bike trip length (kilometers)
3. Starting number of bikes in the system
4. Number of bikes in the system at the final year of project life
5. Number of trips per bike per day at starting year
6. Number of trips per bike per day at final year of project life
7. Mode Shift Details
8. Speed, Occupancy, Emission Factors
11
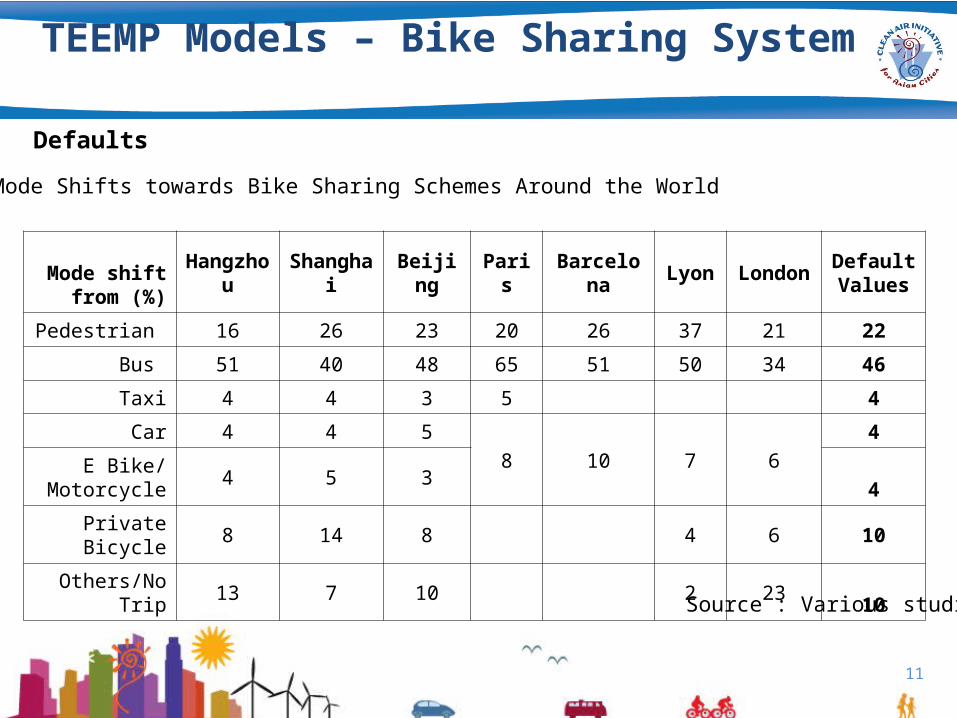
Defaults
Mode Shifts towards Bike Sharing Schemes Around the World
Mode shift from (%)
Hangzhou Shanghai Beijing Paris Barcelona Lyon London Default Values
Pedestrian 16 26 23 20 26 37 21 22
Bus 51 40 48 65 51 50 34 46
Taxi 4 4 3 5 4
Car 4 4 58 10 7 6
4
E Bike/Motorcycle 4 5 3 4
Private Bicycle 8 14 8 4 6 10
Others/No Trip 13 7 10 2 23 10
Source : Various studies
TEEMP Models – Bike Sharing System
Example – Beijing Bike Share System
TEEMP Models – Bike Sharing System
Bikeways
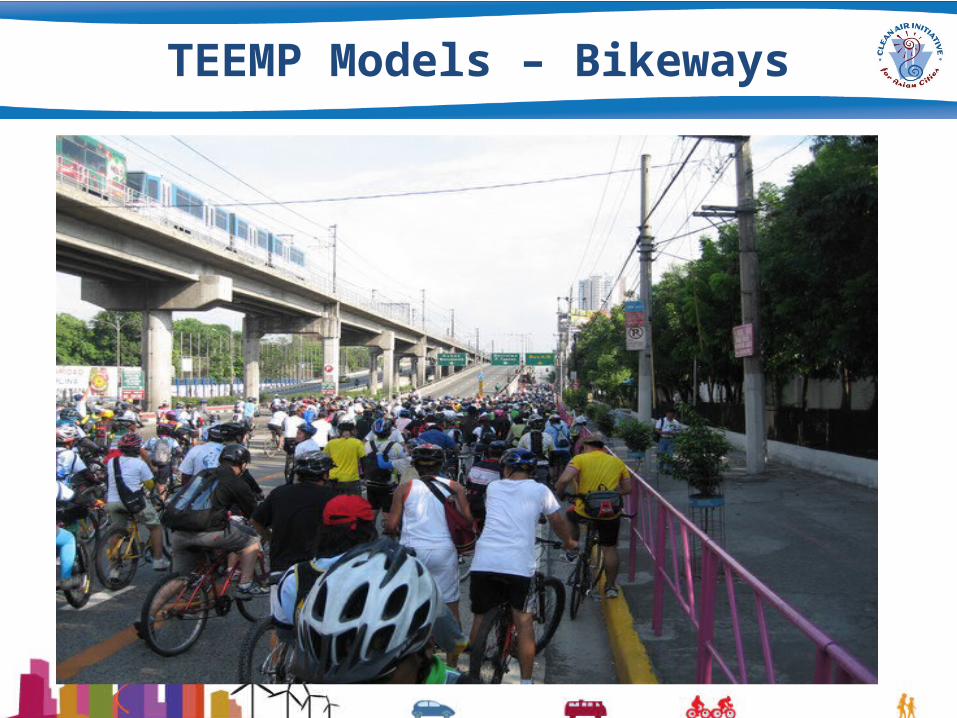
TEEMP Models – Bikeways
TEEMP Models – Bikeways
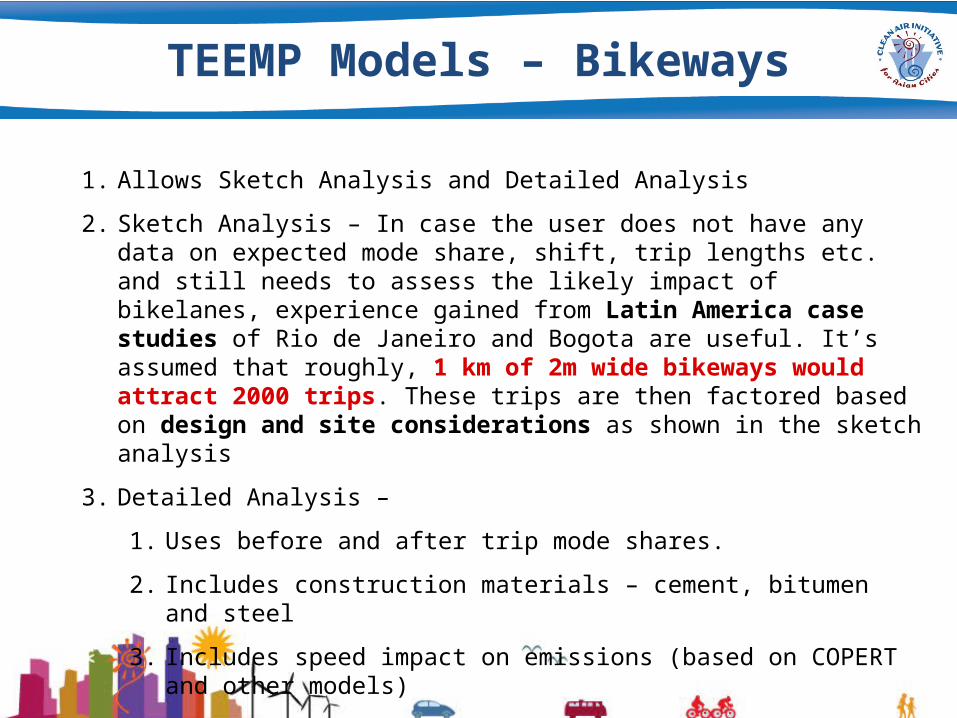
1. Allows Sketch Analysis and Detailed Analysis
2. Sketch Analysis – In case the user does not have any data on expected mode share, shift, trip lengths etc. and still needs to assess the likely impact of bikelanes, experience gained from Latin America case studies of Rio de Janeiro and Bogota are useful. It’s assumed that roughly, 1 km of 2m wide bikeways would attract 2000 trips. These trips are then factored based on design and site considerations as shown in the sketch analysis
3. Detailed Analysis –
1. Uses before and after trip mode shares.
2. Includes construction materials – cement, bitumen and steel
3. Includes speed impact on emissions (based on COPERT and other models)
4. Allows quantification of PM and NOx emissions
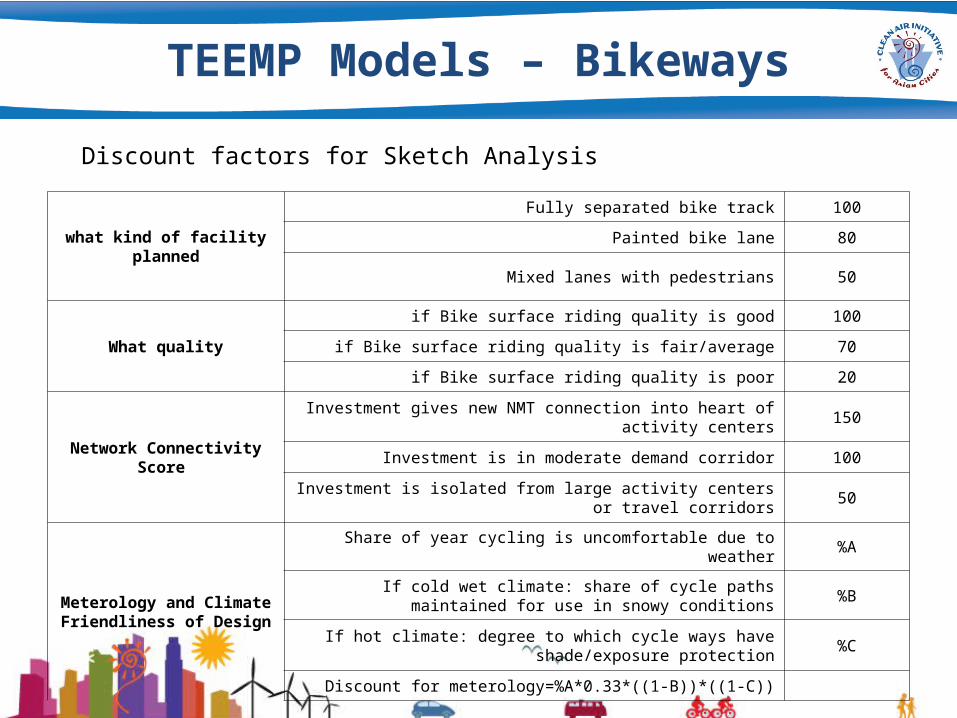
TEEMP Models – Bikeways
what kind of facility planned
Fully separated bike track 100
Painted bike lane 80
Mixed lanes with pedestrians 50
What quality
if Bike surface riding quality is good 100
if Bike surface riding quality is fair/average 70
if Bike surface riding quality is poor 20
Network Connectivity Score
Investment gives new NMT connection into heart of activity centers 150
Investment is in moderate demand corridor 100
Investment is isolated from large activity centers or travel corridors 50
Meterology and Climate Friendliness of Design
Share of year cycling is uncomfortable due to weather %A
If cold wet climate: share of cycle paths maintained for use in snowy conditions %B
If hot climate: degree to which cycle ways have shade/exposure protection %C
Discount for meterology=%A*0.33*((1-B))*((1-C))
Discount factors for Sketch Analysis
TEEMP Models – Bikeways
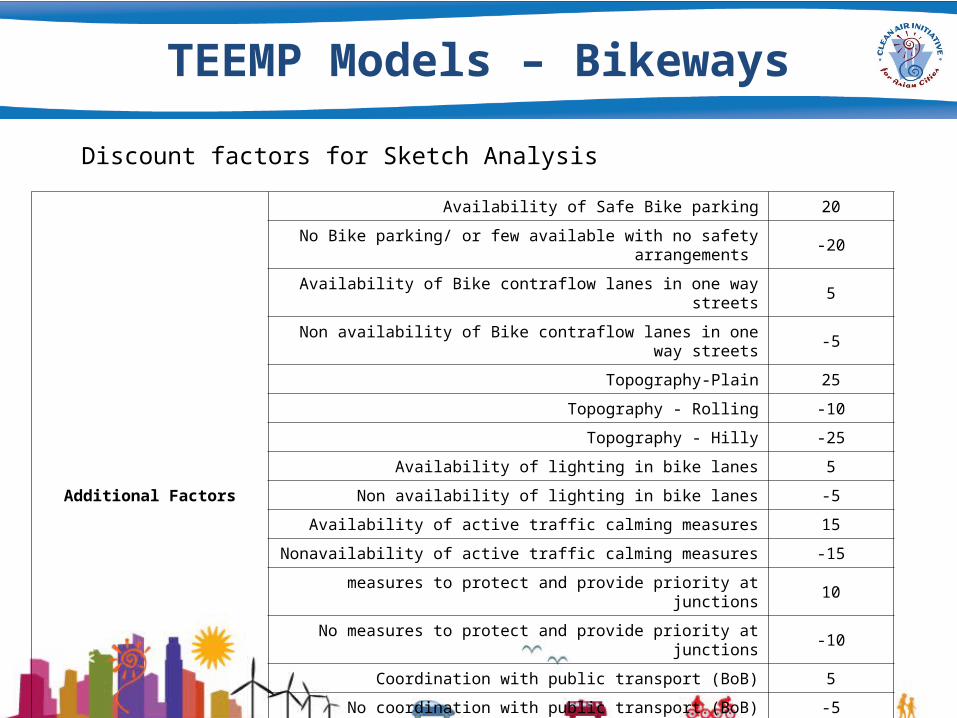
Discount factors for Sketch Analysis
Additional Factors
Availability of Safe Bike parking 20
No Bike parking/ or few available with no safety arrangements -20
Availability of Bike contraflow lanes in one way streets 5
Non availability of Bike contraflow lanes in one way streets -5
Topography-Plain 25
Topography - Rolling -10
Topography - Hilly -25
Availability of lighting in bike lanes 5
Non availability of lighting in bike lanes -5
Availability of active traffic calming measures 15
Nonavailability of active traffic calming measures -15
measures to protect and provide priority at junctions 10
No measures to protect and provide priority at junctions -10
Coordination with public transport (BoB) 5
No coordination with public transport (BoB) -5
Soft Measures - Exclusive bike policy , sympathetic traffic laws, campaigns 15
No soft measures -15
TEEMP Models – Bikeways
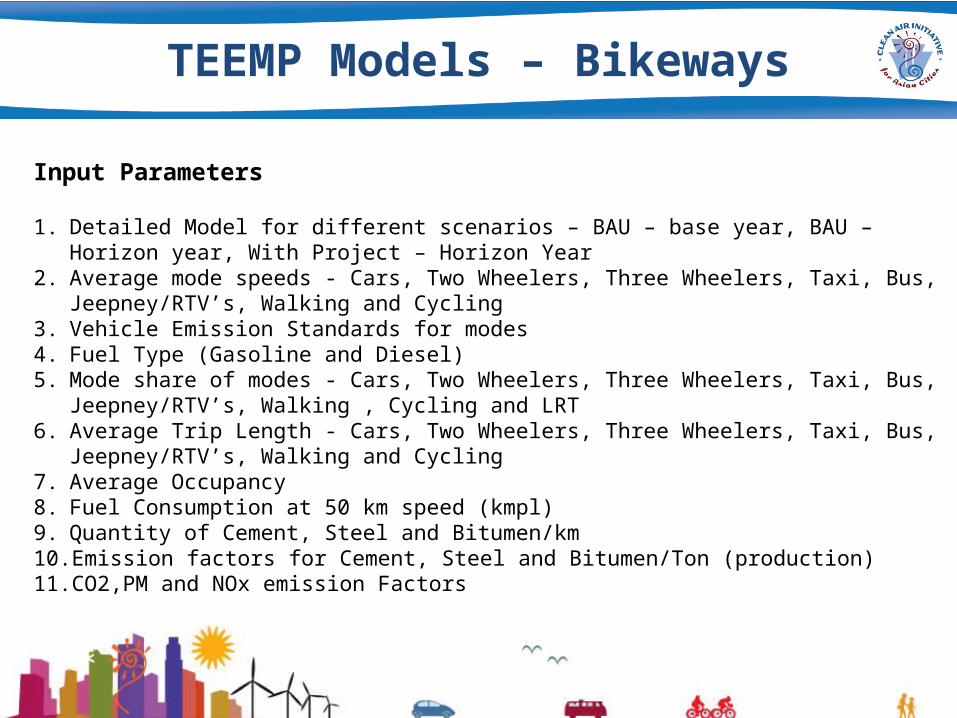
Input Parameters
1. Detailed Model for different scenarios – BAU – base year, BAU – Horizon year, With Project – Horizon Year
2. Average mode speeds - Cars, Two Wheelers, Three Wheelers, Taxi, Bus, Jeepney/RTV’s, Walking and Cycling
3. Vehicle Emission Standards for modes4. Fuel Type (Gasoline and Diesel)5. Mode share of modes - Cars, Two Wheelers, Three Wheelers, Taxi, Bus, Jeepney/RTV’s,
Walking , Cycling and LRT6. Average Trip Length - Cars, Two Wheelers, Three Wheelers, Taxi, Bus, Jeepney/RTV’s,
Walking and Cycling7. Average Occupancy8. Fuel Consumption at 50 km speed (kmpl)9. Quantity of Cement, Steel and Bitumen/km10. Emission factors for Cement, Steel and Bitumen/Ton (production)11. CO2,PM and NOx emission Factors
TEEMP Models – Bikeways
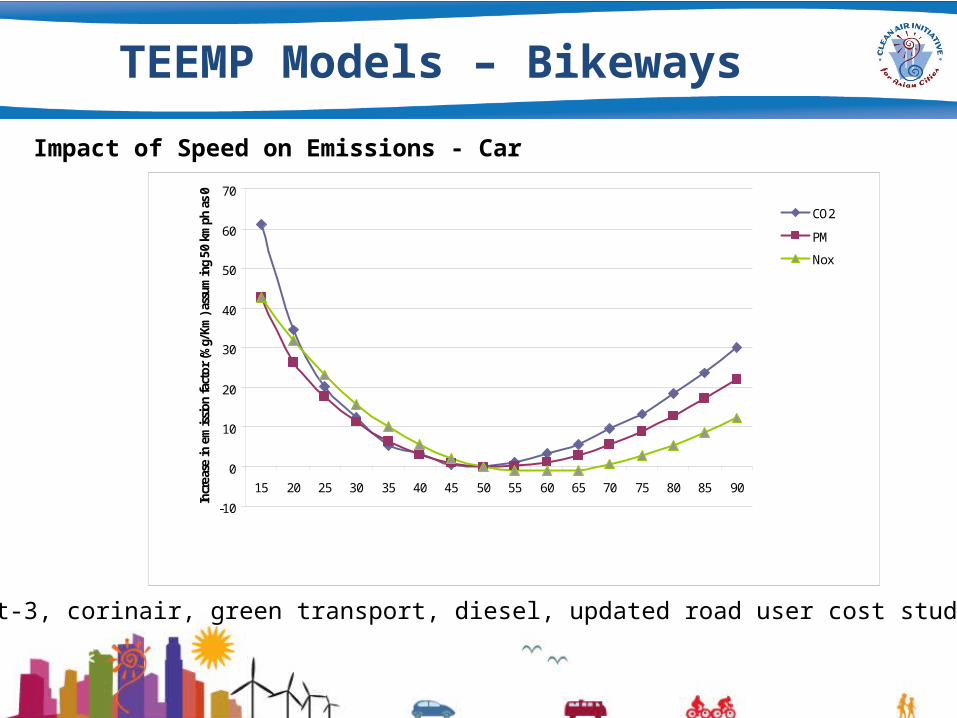
Impact of Speed on Emissions - Car
-10
0
10
20
30
40
50
60
70
15 20 25 30 35 40 45 50 55 60 65 70 75 80 85 90
Incr
ease
in e
mis
sion
fact
or (%
g/Km
) ass
umin
g 50
km
ph a
s 0
CO2
PM
Nox
copert-3, corinair, green transport, diesel, updated road user cost study and trl

TEEMP Models – Bikeways
Example – Marikina Bikeway Project (Manila)
Walkability Improvement Projects
TEEMP Models – Walkability Improvement Projects
Source: Times of India
TEEMP Models – Walkability Improvement Projects
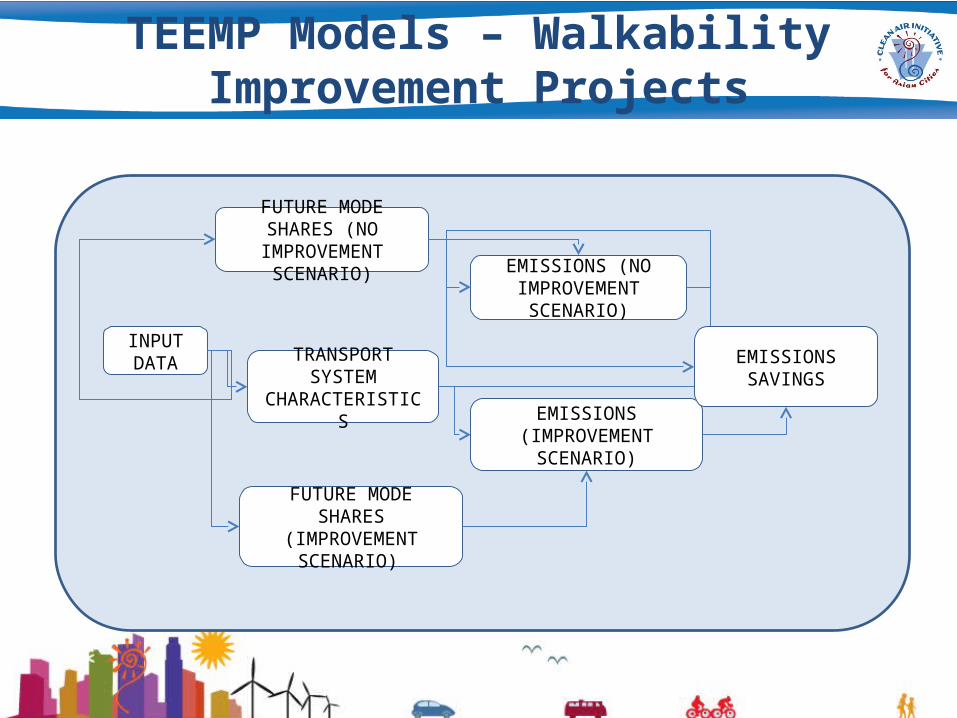
INPUT DATA
TRANSPORT SYSTEM CHARACTERISTICS
FUTURE MODE SHARES (NO IMPROVEMENT
SCENARIO)
FUTURE MODE SHARES (IMPROVEMENT
SCENARIO)
EMISSIONS (NO IMPROVEMENT
SCENARIO)
EMISSIONS (IMPROVEMENT
SCENARIO)
EMISSIONS SAVINGS
TEEMP Models – Walkability Improvement Projects
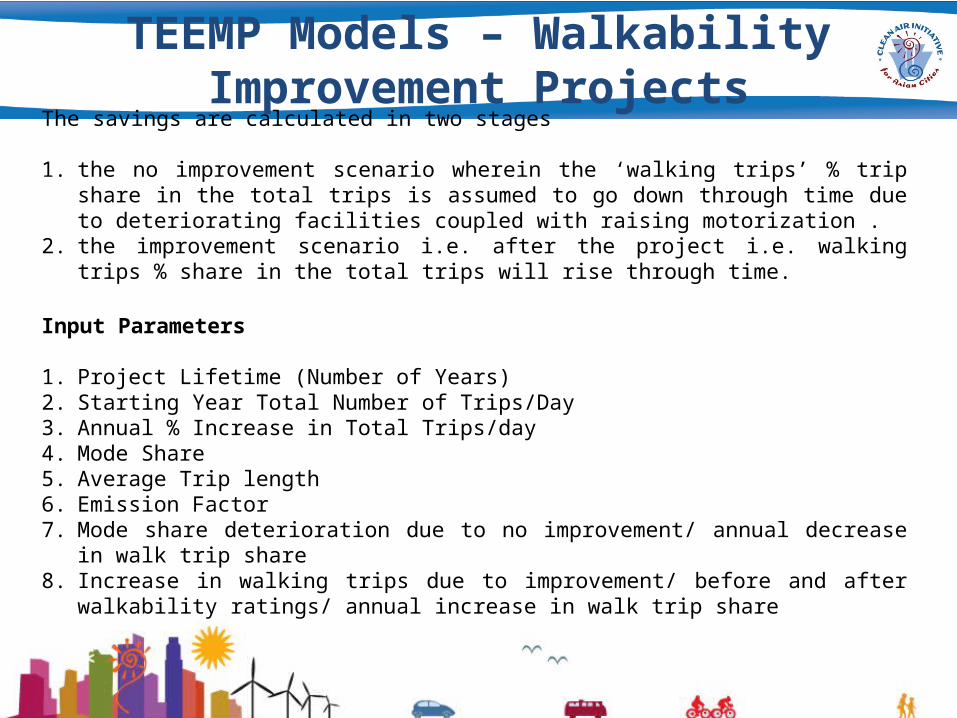
The savings are calculated in two stages
1. the no improvement scenario wherein the ‘walking trips’ % trip share in the total trips is assumed to go down through time due to deteriorating facilities coupled with raising motorization .
2. the improvement scenario i.e. after the project i.e. walking trips % share in the total trips will rise through time.
Input Parameters
1. Project Lifetime (Number of Years)2. Starting Year Total Number of Trips/Day3. Annual % Increase in Total Trips/day4. Mode Share5. Average Trip length6. Emission Factor7. Mode share deterioration due to no improvement/ annual decrease in walk trip share8. Increase in walking trips due to improvement/ before and after walkability ratings/
annual increase in walk trip share
TEEMP Models – Walkability Improvement Projects
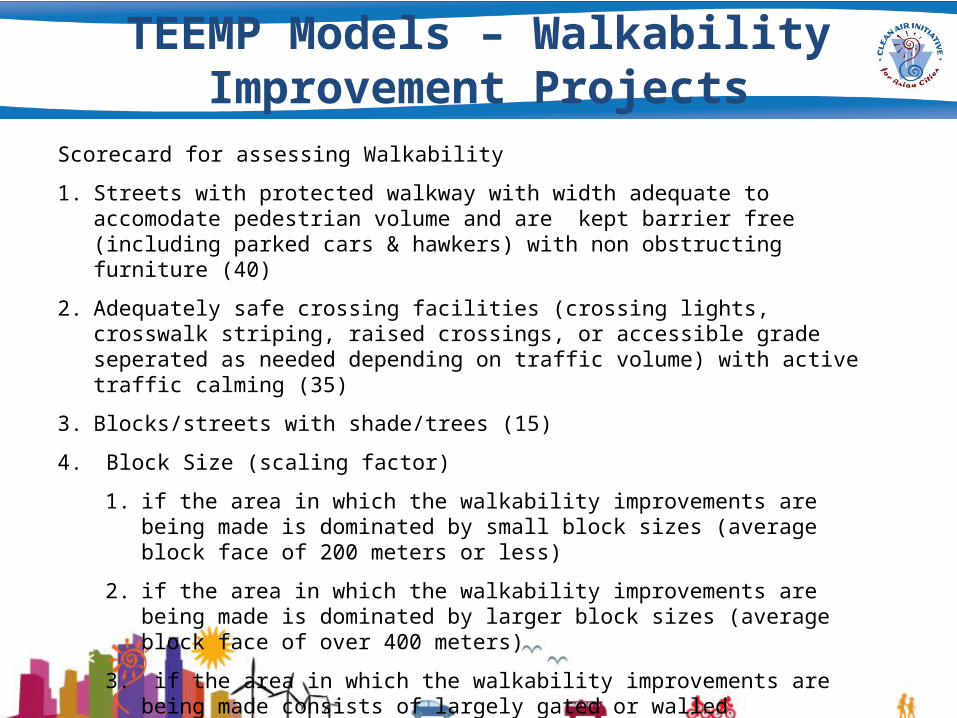
Scorecard for assessing Walkability
1. Streets with protected walkway with width adequate to accomodate pedestrian volume and are kept barrier free (including parked cars & hawkers) with non obstructing furniture (40)
2. Adequately safe crossing facilities (crossing lights, crosswalk striping, raised crossings, or accessible grade seperated as needed depending on traffic volume) with active traffic calming (35)
3. Blocks/streets with shade/trees (15)
4. Block Size (scaling factor)
1. if the area in which the walkability improvements are being made is dominated by small block sizes (average block face of 200 meters or less)
2. if the area in which the walkability improvements are being made is dominated by larger block sizes (average block face of over 400 meters)
3. if the area in which the walkability improvements are being made consists of largely gated or walled superblocks (average block face of 600 meters or more)
TEEMP Models – Walkability Improvement Projects
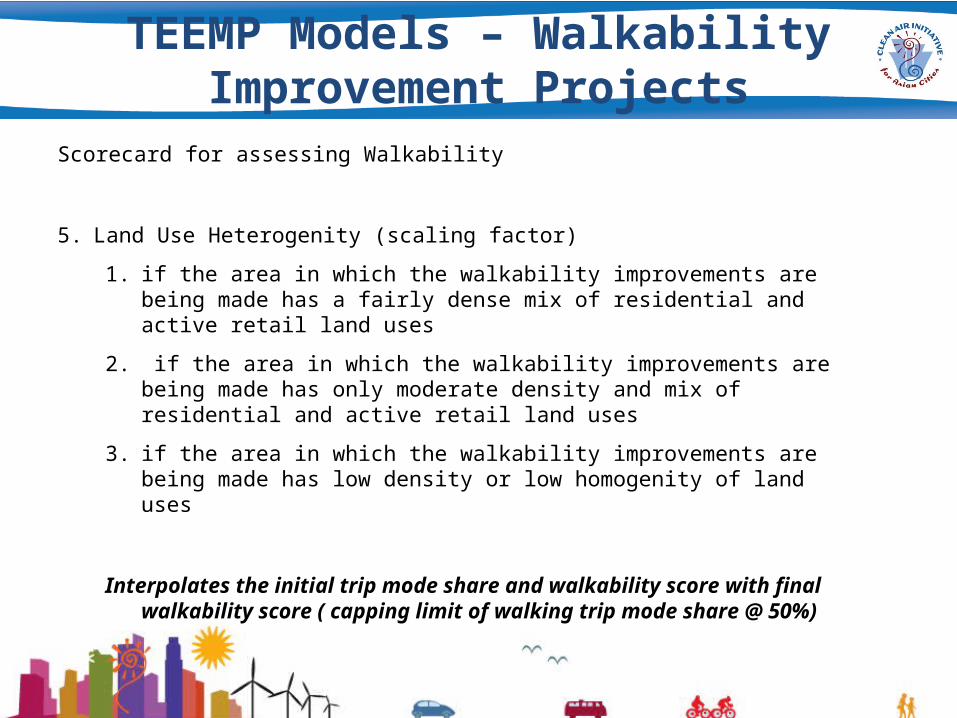
Scorecard for assessing Walkability
5. Land Use Heterogenity (scaling factor)
1. if the area in which the walkability improvements are being made has a fairly dense mix of residential and active retail land uses
2. if the area in which the walkability improvements are being made has only moderate density and mix of residential and active retail land uses
3. if the area in which the walkability improvements are being made has low density or low homogenity of land uses
Interpolates the initial trip mode share and walkability score with final walkability score ( capping limit of walking trip mode share @ 50%)
TEEMP Models – Walkability Improvement Projects
Example – Walkability Improvement Project
BRTS Projects
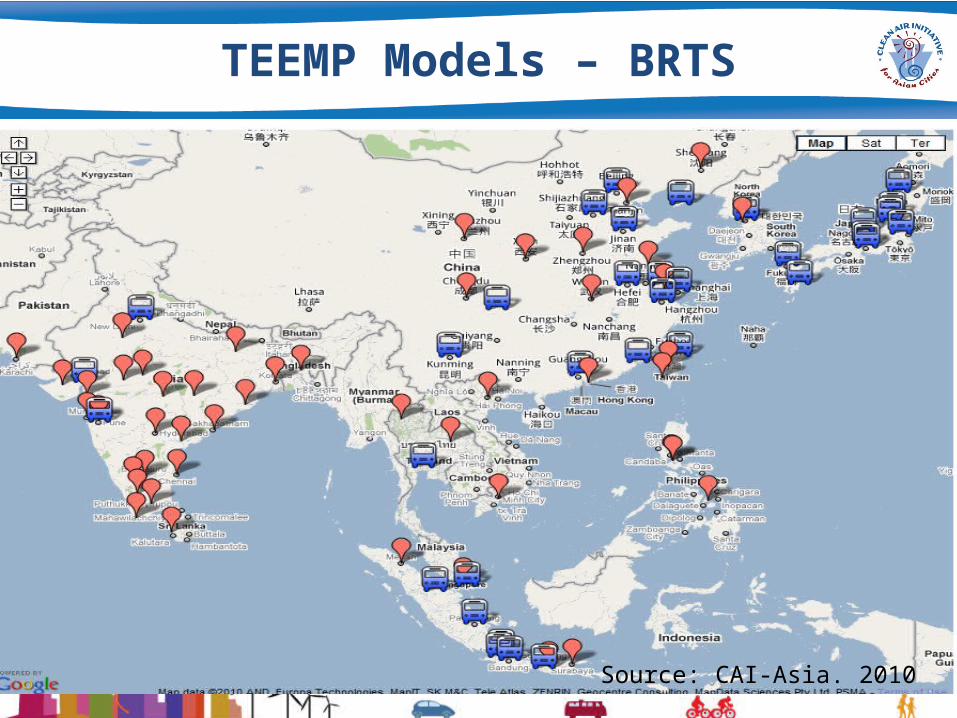
TEEMP Models – BRTS
Source: CAI-Asia. 2010
TEEMP Models – BRTS
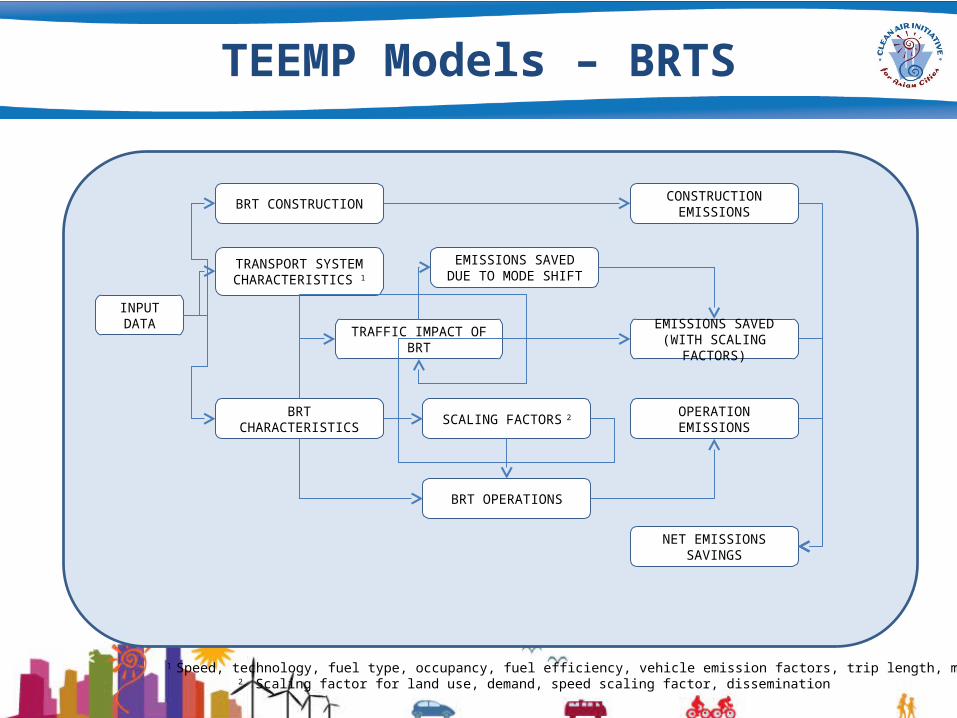
Source: CAI-Asia
TEEMP Models – BRTS
INPUT DATA
BRT CONSTRUCTION
BRT CHARACTERISTICS
CONSTRUCTION EMISSIONS
BRT OPERATIONS
TRAFFIC IMPACT OF BRT
TRANSPORT SYSTEM CHARACTERISTICS 1
1 Speed, technology, fuel type, occupancy, fuel efficiency, vehicle emission factors, trip length, mode shares
EMISSIONS SAVED DUE TO MODE SHIFT
OPERATION EMISSIONSSCALING FACTORS 2
EMISSIONS SAVED (WITH SCALING FACTORS)
NET EMISSIONS SAVINGS
2 Scaling factor for land use, demand, speed scaling factor, dissemination
TEEMP Models – BRTS
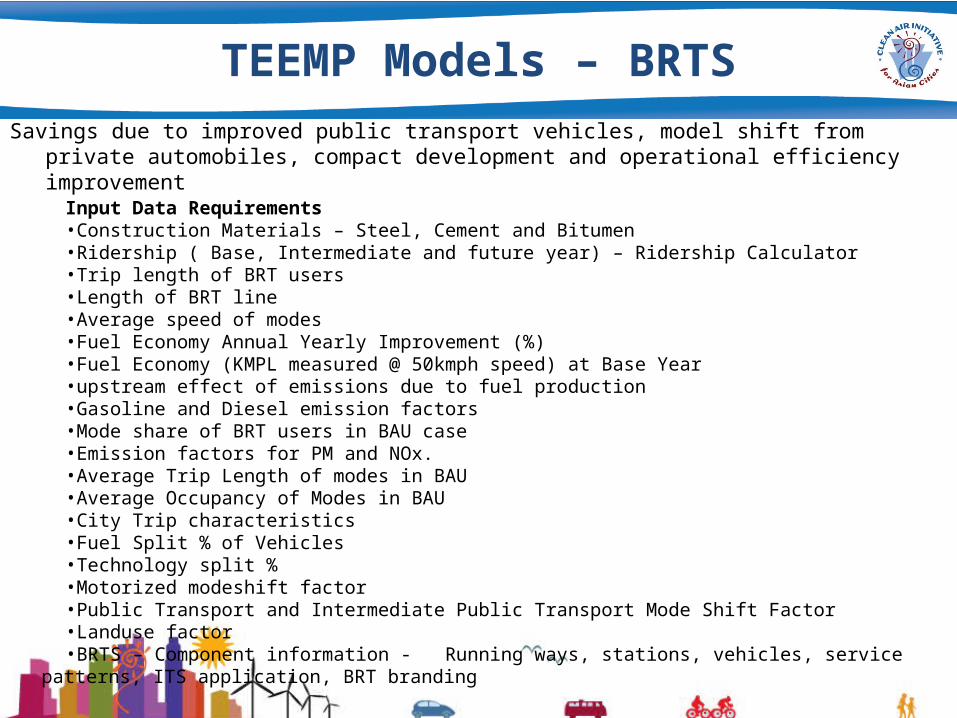
Savings due to improved public transport vehicles, model shift from private automobiles, compact development and operational efficiency improvement
Input Data Requirements•Construction Materials – Steel, Cement and Bitumen•Ridership ( Base, Intermediate and future year) – Ridership Calculator•Trip length of BRT users•Length of BRT line•Average speed of modes•Fuel Economy Annual Yearly Improvement (%)•Fuel Economy (KMPL measured @ 50kmph speed) at Base Year•upstream effect of emissions due to fuel production•Gasoline and Diesel emission factors•Mode share of BRT users in BAU case•Emission factors for PM and NOx.•Average Trip Length of modes in BAU•Average Occupancy of Modes in BAU•City Trip characteristics•Fuel Split % of Vehicles•Technology split %•Motorized modeshift factor•Public Transport and Intermediate Public Transport Mode Shift Factor•Landuse factor•BRTS – Component information - Running ways, stations, vehicles, service patterns, ITS application, BRT
branding
TEEMP Models – BRTS
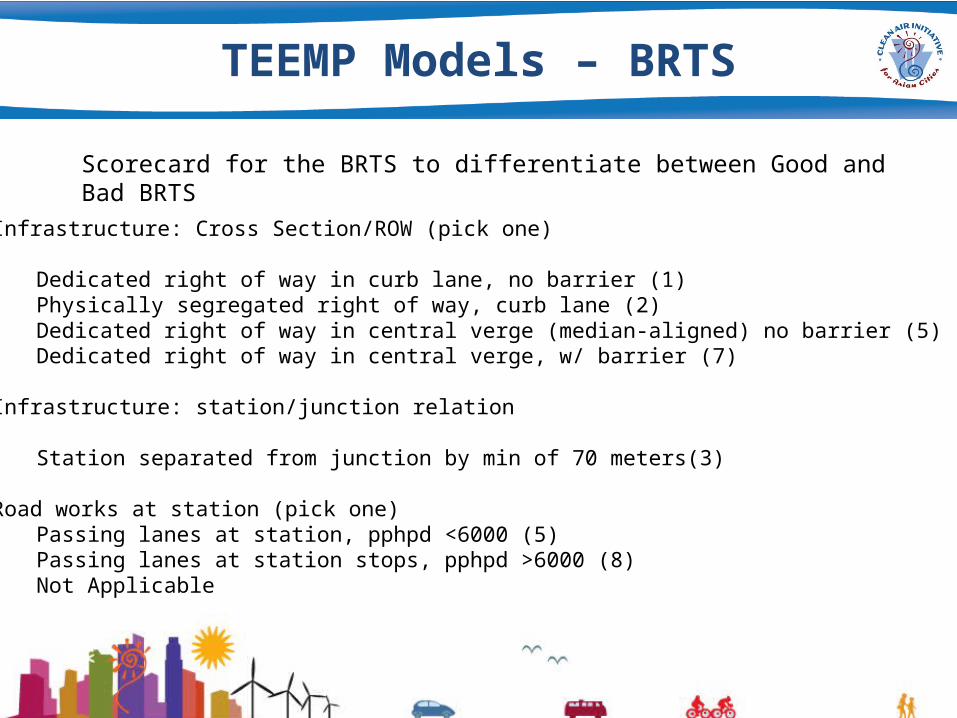
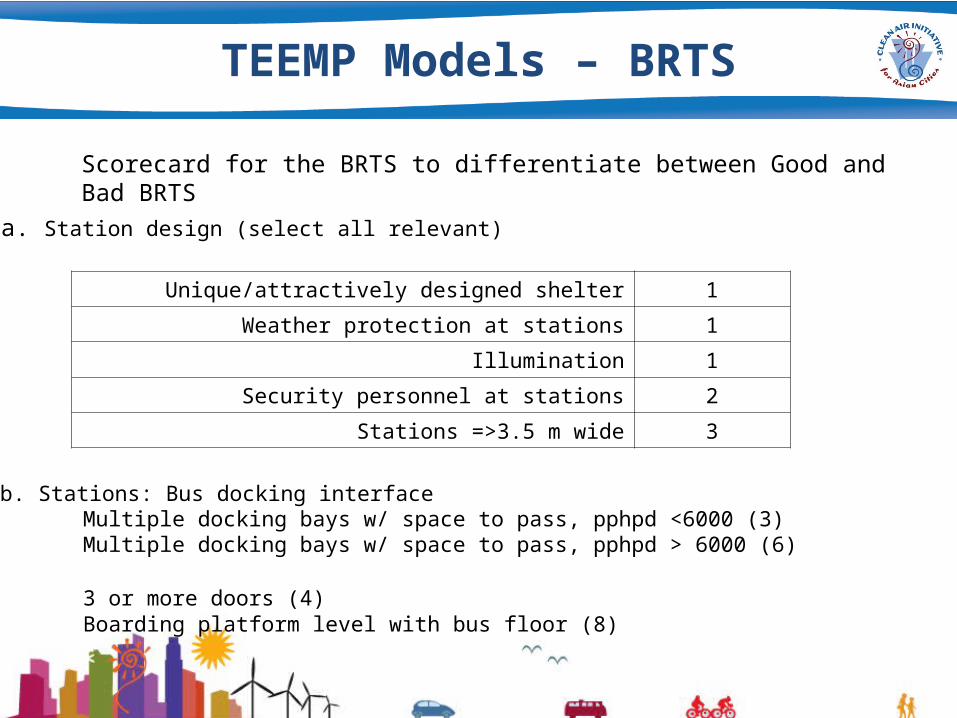
Scorecard for the BRTS to differentiate between Good and Bad BRTS
1a. Infrastructure: Cross Section/ROW (pick one)
Dedicated right of way in curb lane, no barrier (1)Physically segregated right of way, curb lane (2)Dedicated right of way in central verge (median-aligned) no barrier (5)Dedicated right of way in central verge, w/ barrier (7)
1b. Infrastructure: station/junction relation
Station separated from junction by min of 70 meters(3)
1c. Road works at station (pick one)Passing lanes at station, pphpd <6000 (5)Passing lanes at station stops, pphpd >6000 (8)Not Applicable
TEEMP Models – BRTS
Scorecard for the BRTS to differentiate between Good and Bad BRTS
2a. Station design (select all relevant)
Unique/attractively designed shelter 1
Weather protection at stations 1
Illumination 1
Security personnel at stations 2
Stations =>3.5 m wide 3
2b. Stations: Bus docking interfaceMultiple docking bays w/ space to pass, pphpd <6000 (3)Multiple docking bays w/ space to pass, pphpd > 6000 (6)
3 or more doors (4)Boarding platform level with bus floor (8)
TEEMP Models – BRTS
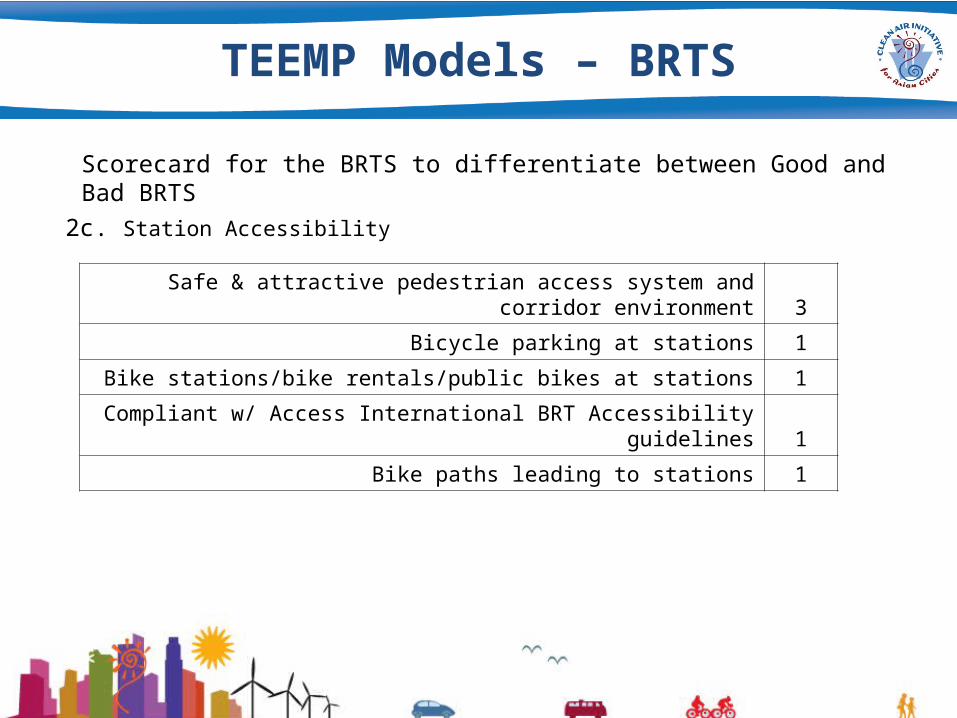
Scorecard for the BRTS to differentiate between Good and Bad BRTS
2c. Station Accessibility
Safe & attractive pedestrian access system and corridor environment 3
Bicycle parking at stations 1
Bike stations/bike rentals/public bikes at stations 1
Compliant w/ Access International BRT Accessibility guidelines 1
Bike paths leading to stations 1
TEEMP Models – BRTS
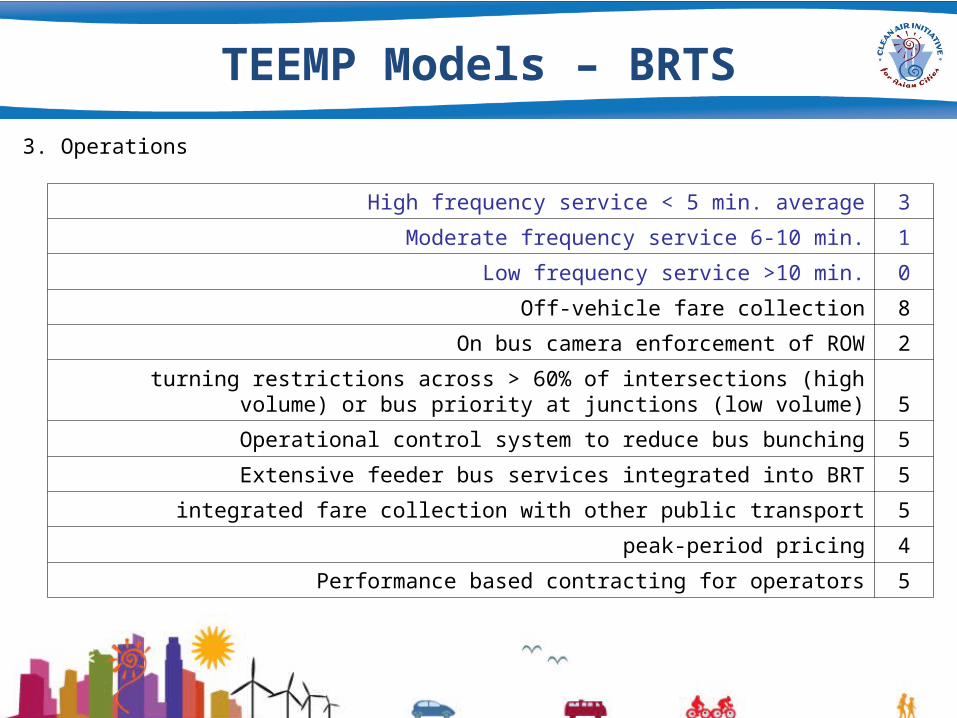
High frequency service < 5 min. average 3
Moderate frequency service 6-10 min. 1
Low frequency service >10 min. 0
Off-vehicle fare collection 8
On bus camera enforcement of ROW 2
turning restrictions across > 60% of intersections (high volume) or bus priority at junctions (low volume) 5
Operational control system to reduce bus bunching 5
Extensive feeder bus services integrated into BRT 5
integrated fare collection with other public transport 5
peak-period pricing 4
Performance based contracting for operators 5
3. Operations
TEEMP Models – BRTS
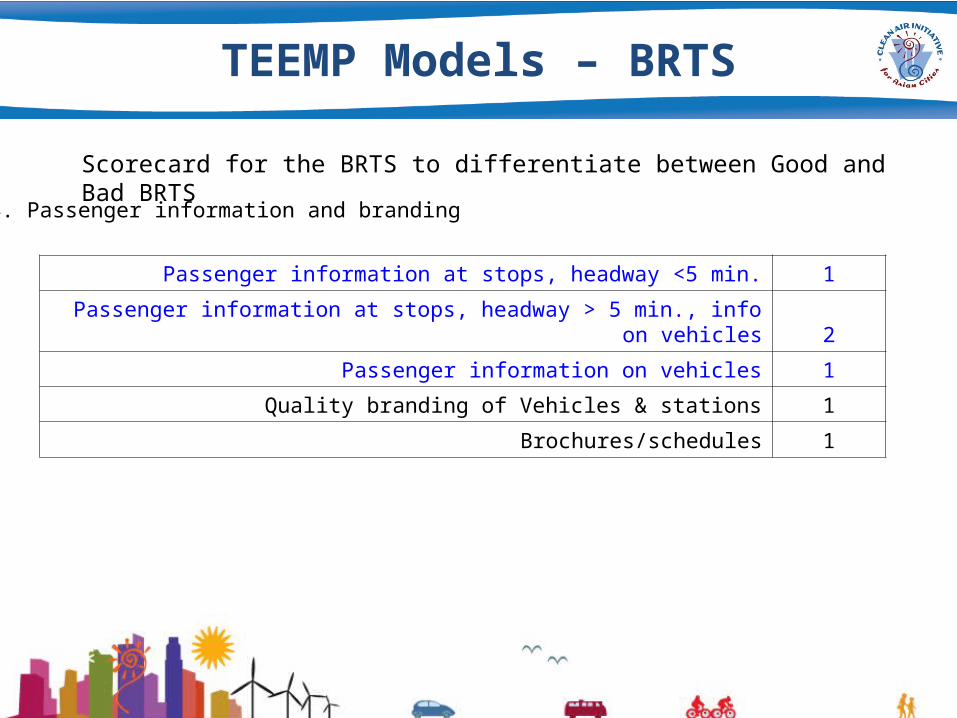
Scorecard for the BRTS to differentiate between Good and Bad BRTS
4. Passenger information and branding
Passenger information at stops, headway <5 min. 1
Passenger information at stops, headway > 5 min., info on vehicles 2
Passenger information on vehicles 1
Quality branding of Vehicles & stations 1
Brochures/schedules 1
TEEMP Models – BRTS
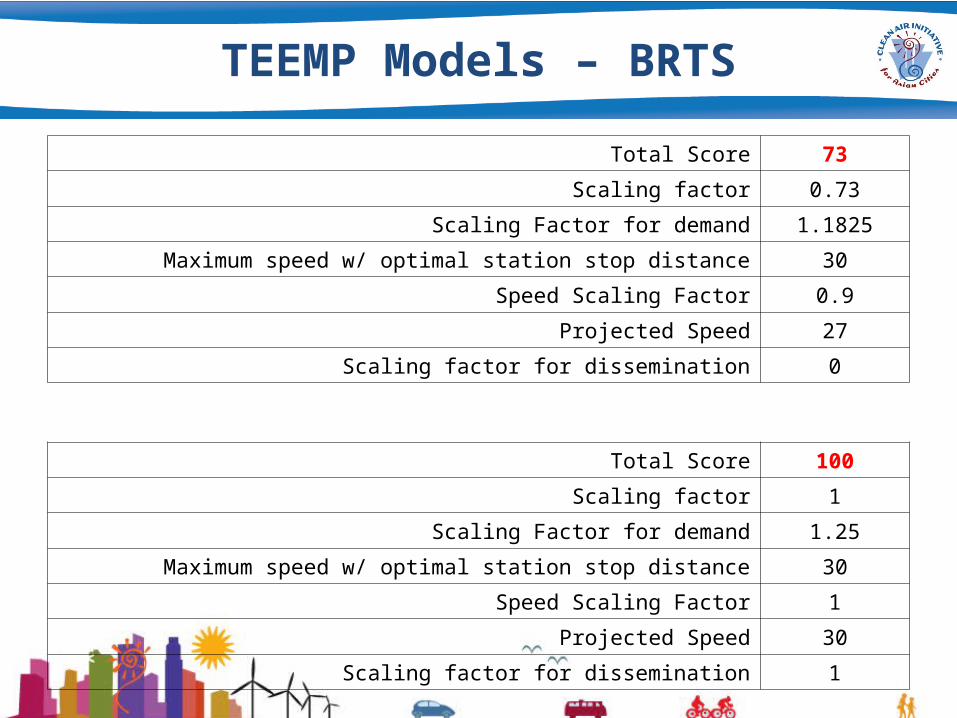
Total Score 73
Scaling factor 0.73
Scaling Factor for demand 1.1825
Maximum speed w/ optimal station stop distance 30
Speed Scaling Factor 0.9
Projected Speed 27
Scaling factor for dissemination 0
Total Score 100
Scaling factor 1
Scaling Factor for demand 1.25
Maximum speed w/ optimal station stop distance 30
Speed Scaling Factor 1
Projected Speed 30
Scaling factor for dissemination 1
TEEMP Models – BRTS
Factors used
1. Motorized Mode Shift Factor - % of MRT Users who would use motorized transport in absence of MRT
2. Land Use Impact Factor - Its Vehicle Mile displaced per MRT passenger Mile. Research by APTA suggests a value of 1.9 as a placeholder.
TEEMP Models – BRTS
Example
Metro/LRT Projects

TEEMP Models – Metro/LRT
Source: LA Times
TEEMP Models – Metro/LRT
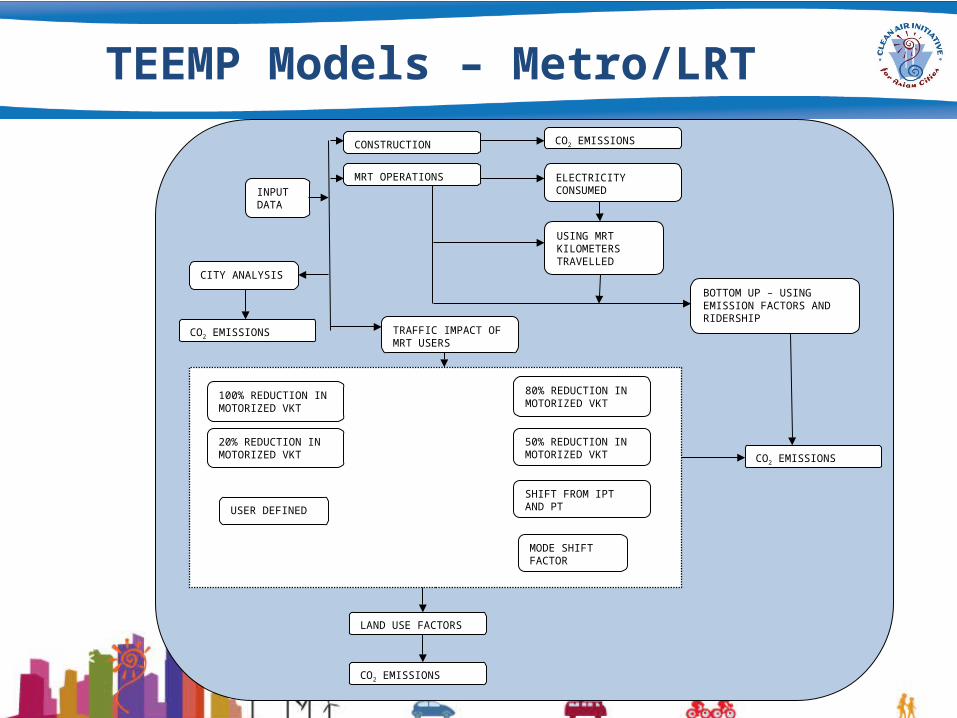
INPUT DATA
CONSTRUCTION CO2 EMISSIONS
MRT OPERATIONS
TRAFFIC IMPACT OF MRT USERS
ELECTRICITY CONSUMED
USING MRT KILOMETERS TRAVELLED
BOTTOM UP – USING EMISSION FACTORS AND RIDERSHIP
100% REDUCTION IN MOTORIZED VKT
80% REDUCTION IN MOTORIZED VKT
50% REDUCTION IN MOTORIZED VKT
20% REDUCTION IN MOTORIZED VKT
SHIFT FROM IPT AND PT
MODE SHIFT FACTOR
USER DEFINED
CITY ANALYSIS
LAND USE FACTORS
CO2 EMISSIONS
CO2 EMISSIONS
CO2 EMISSIONS
TEEMP Models – Metro/LRT
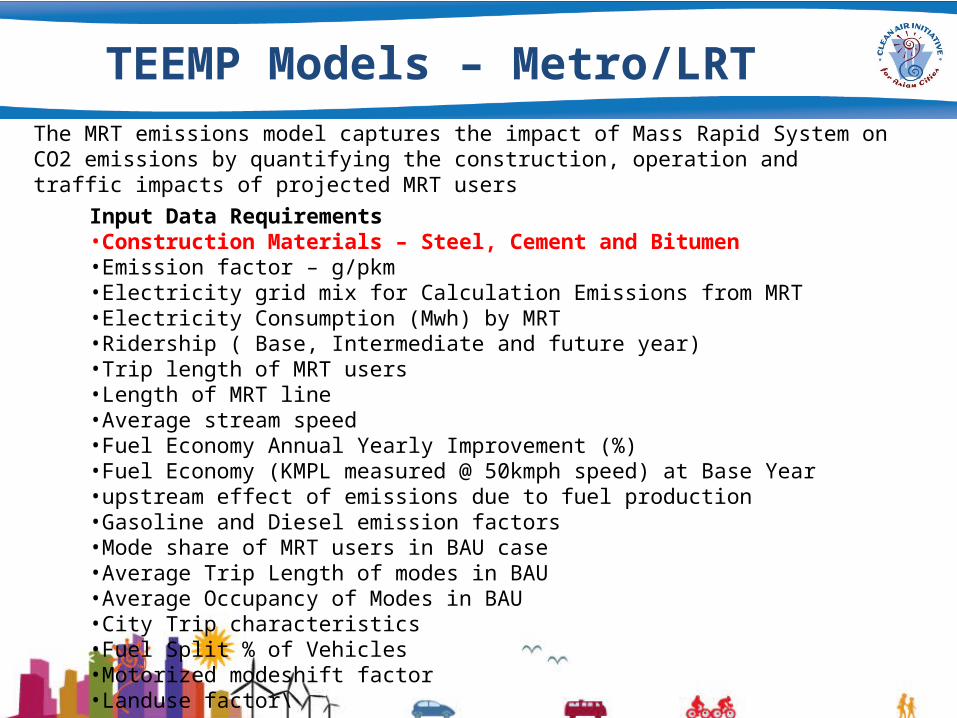
The MRT emissions model captures the impact of Mass Rapid System on CO2 emissions by quantifying the construction, operation and traffic impacts of projected MRT users
Input Data Requirements•Construction Materials – Steel, Cement and Bitumen•Emission factor – g/pkm•Electricity grid mix for Calculation Emissions from MRT•Electricity Consumption (Mwh) by MRT•Ridership ( Base, Intermediate and future year)•Trip length of MRT users•Length of MRT line•Average stream speed•Fuel Economy Annual Yearly Improvement (%)•Fuel Economy (KMPL measured @ 50kmph speed) at Base Year•upstream effect of emissions due to fuel production•Gasoline and Diesel emission factors•Mode share of MRT users in BAU case•Average Trip Length of modes in BAU•Average Occupancy of Modes in BAU•City Trip characteristics•Fuel Split % of Vehicles•Motorized modeshift factor•Landuse factor\
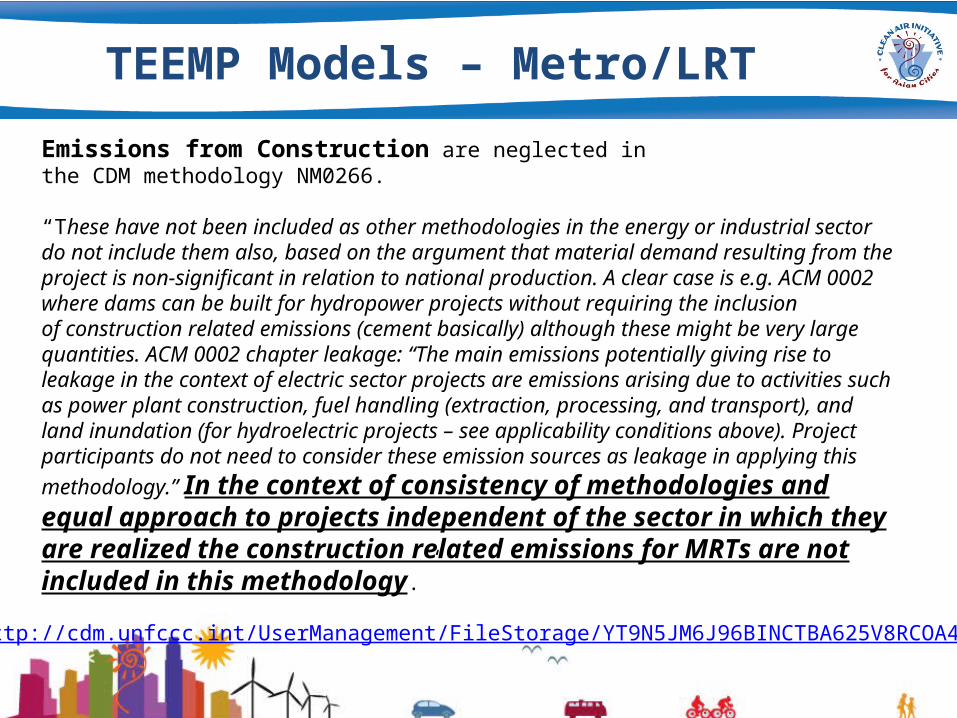
Emissions from Construction are neglected in the CDM methodology NM0266.
“These have not been included as other methodologies in the energy or industrial sector do not include them also, based on the argument that material demand resulting from the project is non-significant in relation to national production. A clear case is e.g. ACM 0002 where dams can be built for hydropower projects without requiring the inclusion of construction related emissions (cement basically) although these might be very large quantities. ACM 0002 chapter leakage: “The main emissions potentially giving rise to leakage in the context of electric sector projects are emissions arising due to activities such as power plant construction, fuel handling (extraction, processing, and transport), and land inundation (for hydroelectric projects – see applicability conditions above). Project participants do not need to consider these emission sources as leakage in applying this
methodology.” In the context of consistency of methodologies and equal approach to projects independent of the sector in which they are realized the construction related emissions for MRTs are not included in this methodology.”
TEEMP Models – Metro/LRT
http://cdm.unfccc.int/UserManagement/FileStorage/YT9N5JM6J96BINCTBA625V8RCOA4EP

TEEMP Models – Metro/LRT
0
50
100
150
200
250
Toky
oSa
ppor
oTo
kyo
Man
ilaCr
oydo
n Tr
amlin
kM
anch
este
r M
etro
link
Lond
on to
Par
is b
y Eu
rost
arCO
2 pe
r pk
m) –
Eur
osta
tvCO
2 pe
r pk
m –
AEA
x CO
2 pe
r pk
m –
CAN
vii
UK
2002
Pass
enge
r ra
il –
Elet
ric
USA
200
2Ch
ines
e Ra
il Tr
ansi
tU
K - P
asse
nger
rai
l - e
lect
ric
Aver
age
Euro
pean
spe
cific
US
2006
Nati
onal
rai
lU
K - P
asse
nger
rai
l - o
vera
llPa
ssen
ger
rail
– Av
erag
eLo
ndon
und
ergr
ound
Edm
onto
nU
S 20
06D
LR (D
ockl
ands
Lig
ht R
ail)
UK
- Pas
seng
er r
ail -
die
sel
Pass
enge
r ra
il –
dies
elTu
rkey
200
5Li
ght r
ail (
and
tram
) N
ew Y
ork
City
Ta
ipei
Hon
g Ko
ng L
os A
ngel
es
Tyne
& W
ear
Met
roU
K - R
oute
2 -
Clas
s 14
2 N
ew Y
ork
City
U
K - R
oute
2 -
Clas
s 10
1 N
ew Y
ork
City
U
K - R
oute
4SF
Bay
Are
a
g/pk
m
EMISSION FACTORS
TEEMP Models – Metro/LRT
Example – Bangalore Metro

Expressways, Rural and Urban Road
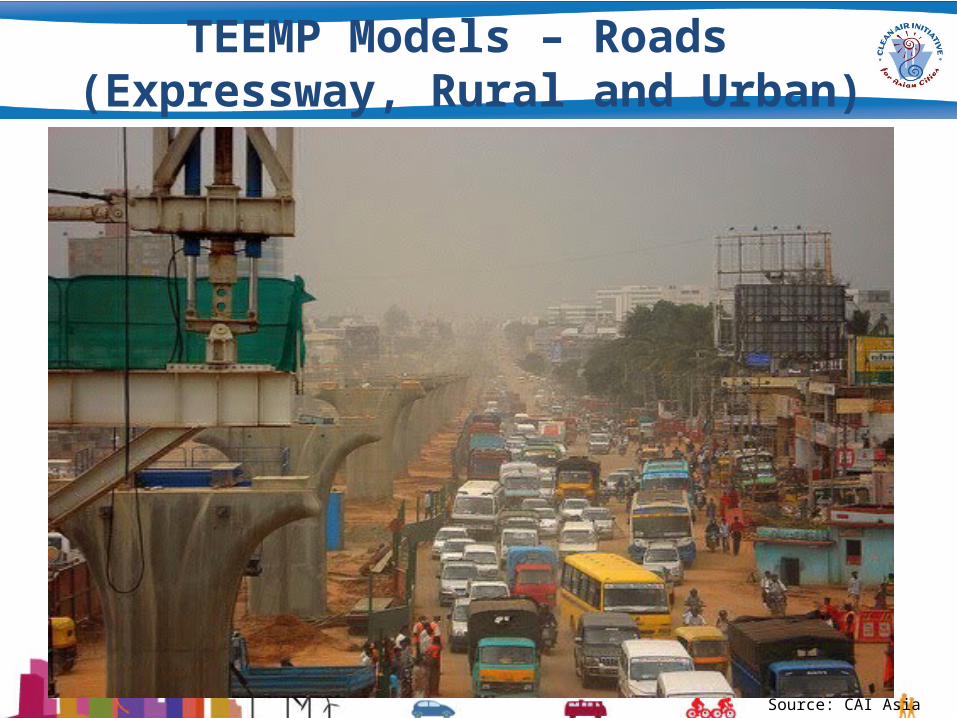
TEEMP Models – Roads (Expressway, Rural and Urban)
Source: CAI Asia
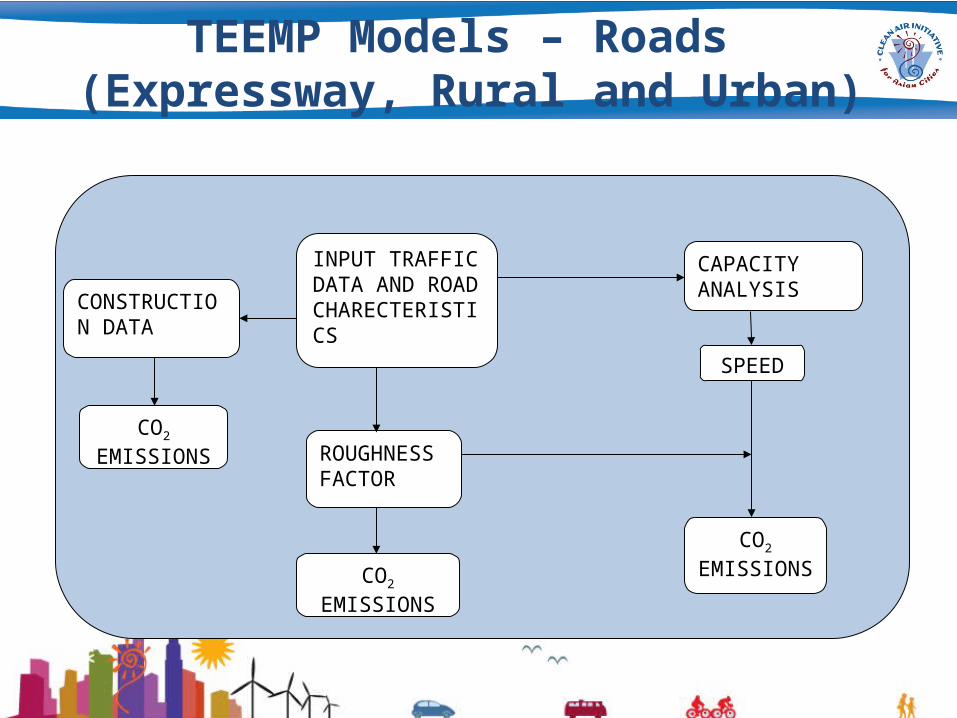
TEEMP Models – Roads (Expressway, Rural and Urban)
CONSTRUCTION DATA
INPUT TRAFFIC DATA AND ROAD CHARECTERISTICS
CAPACITY ANALYSIS
SPEED
CO2 EMISSIONS
ROUGHNESS FACTOR
CO2 EMISSIONS
CO2 EMISSIONS

TEEMP Models – Roads (Expressway, Rural and Urban)
Input Data1. Year – Base and Project lifetime (20 years)2. Number of lanes existing and proposed3. Length 4. Average Trip Lengths of each Mode 5. Base Year Traffic Volumes with Projections for Normal growth 6. Induced Traffic Elasticity 7. Passenger Car Units of Modes 8. Fuel Consumption at 50 km speed (liters for 100km)9. CO2 Emission factor in kg/l for modes depending on gasoline and Diesel fuel split10. Occupancy/Loading of each modes11. Roughness (m/km) of before and after improvement. 12. The option is provided in case user would like to segregate local vs through traffic.13. Quantity of Cement, Steel and Bitumen/km14. Average Road Length of each stretch15. Rate of Annual Improvement in Fuel Economy 16. Input Emission Factor for PM (g/km) and Nox (g/km) 17. Upstream Emission Factor to account for fuel manufacture18. V/C Saturation on a Road
52
TEEMP Models – Roads (Expressway, Rural and Urban)
52
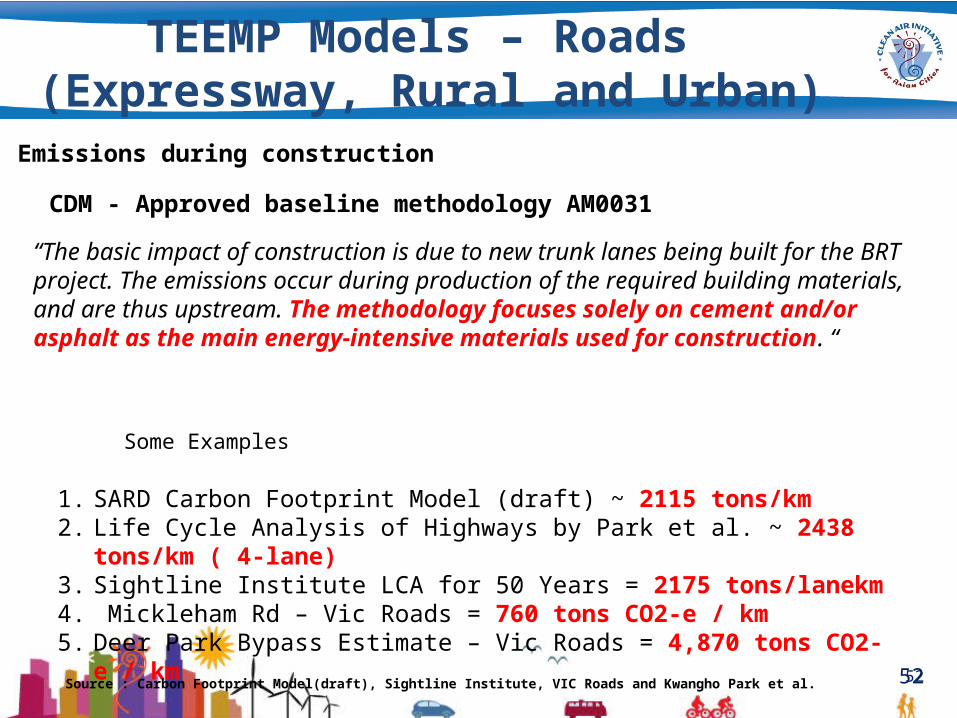
“The basic impact of construction is due to new trunk lanes being built for the BRT project. The emissions occur during production of the required building materials, and are thus upstream. The methodology focuses solely on cement and/or asphalt as the main energy-intensive materials used for construction. “
CDM - Approved baseline methodology AM0031
1. SARD Carbon Footprint Model (draft) ~ 2115 tons/km2. Life Cycle Analysis of Highways by Park et al. ~ 2438 tons/km ( 4-
lane)3. Sightline Institute LCA for 50 Years = 2175 tons/lanekm4. Mickleham Rd – Vic Roads = 760 tons CO2-e / km5. Deer Park Bypass Estimate – Vic Roads = 4,870 tons CO2-e / km
Source : Carbon Footprint Model(draft), Sightline Institute, VIC Roads and Kwangho Park et al.
Some Examples
Emissions during construction
53
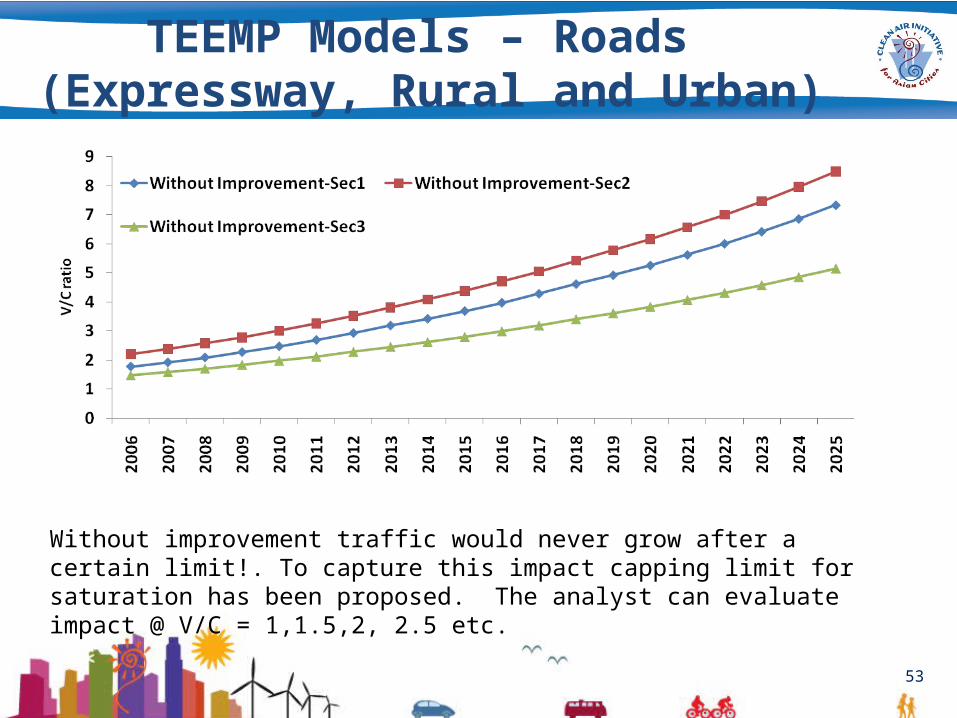
Without improvement traffic would never grow after a certain limit!. To capture this impact capping limit for saturation has been proposed. The analyst can evaluate impact @ V/C = 1,1.5,2, 2.5 etc.
TEEMP Models – Roads (Expressway, Rural and Urban)
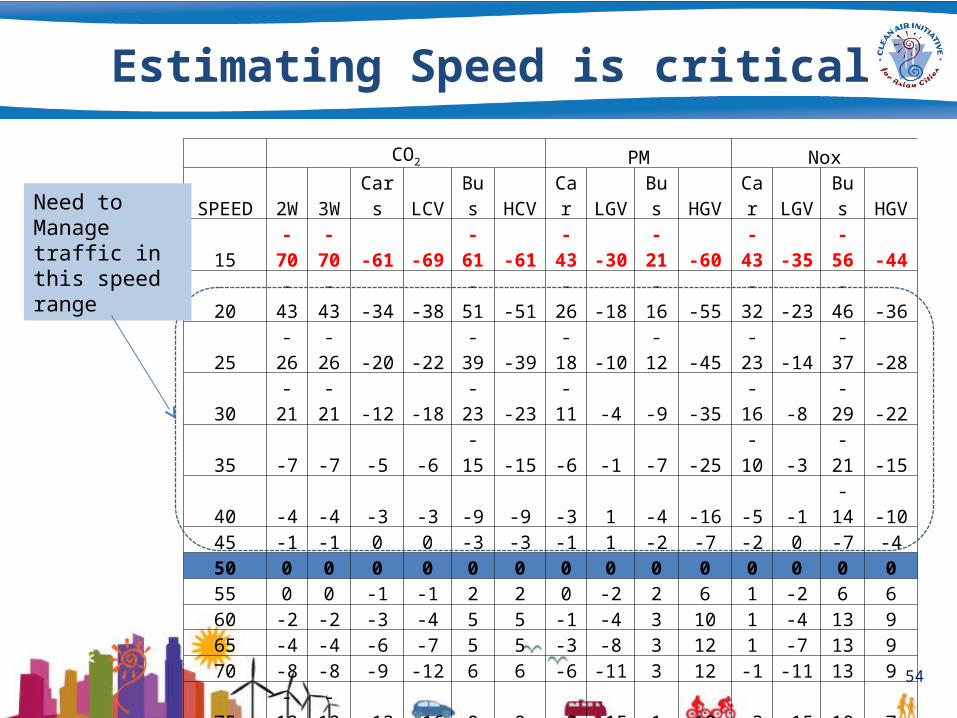
Estimating Speed is critical
54
CO2 PM NoxSPEED 2W 3W Cars LCV Bus HCV Car LGV Bus HGV Car LGV Bus HGV
15 -70 -70 -61 -69 -61 -61 -43 -30 -21 -60 -43 -35 -56 -4420 -43 -43 -34 -38 -51 -51 -26 -18 -16 -55 -32 -23 -46 -3625 -26 -26 -20 -22 -39 -39 -18 -10 -12 -45 -23 -14 -37 -2830 -21 -21 -12 -18 -23 -23 -11 -4 -9 -35 -16 -8 -29 -2235 -7 -7 -5 -6 -15 -15 -6 -1 -7 -25 -10 -3 -21 -1540 -4 -4 -3 -3 -9 -9 -3 1 -4 -16 -5 -1 -14 -1045 -1 -1 0 0 -3 -3 -1 1 -2 -7 -2 0 -7 -450 0 0 0 0 0 0 0 0 0 0 0 0 0 055 0 0 -1 -1 2 2 0 -2 2 6 1 -2 6 660 -2 -2 -3 -4 5 5 -1 -4 3 10 1 -4 13 965 -4 -4 -6 -7 5 5 -3 -8 3 12 1 -7 13 970 -8 -8 -9 -12 6 6 -6 -11 3 12 -1 -11 13 975 -12 -12 -13 -16 0 0 -9 -15 1 12 -3 -15 10 780 -18 -18 -18 -23 -4 -4 -13 -19 -1 10 -5 -19 7 485 -23 -23 -24 -29 -7 -7 -17 -23 -5 7 -9 -24 4 190 -30 -30 -30 -37 -12 -12 -22 -28 -8 4 -12 -28 1 -295 -37 -37 -36 -45 -16 -16 -27 -32 -8 -14 -16 -33
100 -37 -37 -36 -45 -16 -16 -32 -36 -8 -16 -20 -38
Need to Manage traffic in this speed range
55
TEEMP Models – Roads (Expressway, Rural and Urban)
Emissions are dependent on speed, thus using the highway capacity analysis; first the model establishes the V/C (Volume Capacity) Ratios. Using the insights on speed-flow equations from the Updated Road User Cost Study (IRC-SP, Manual of Economic Analysis of Highway Projects), the China Green Transport Project and the Bangalore Metro Study, an impact of V/C on speed was quantified.
56
TEEMP Models – Roads (Expressway, Rural and Urban)
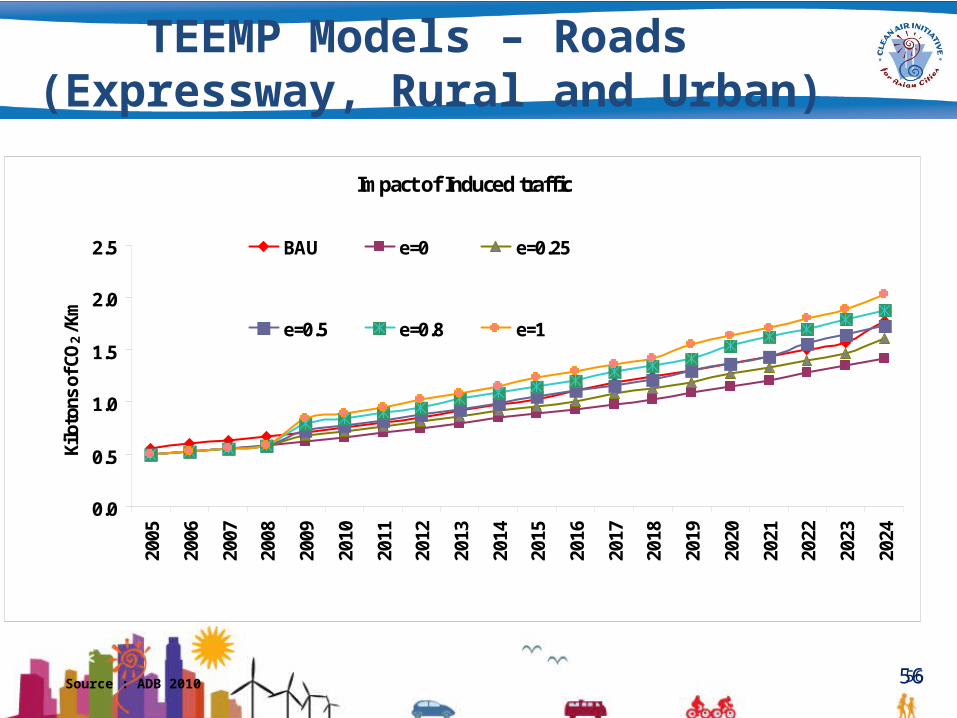
56Source : ADB 2010
Impact of Induced traffic
0.0
0.5
1.0
1.5
2.0
2.5
2005
2006
2007
2008
2009
2010
2011
2012
2013
2014
2015
2016
2017
2018
2019
2020
2021
2022
2023
2024
Kilo
tons
of C
O2
/Km
BAU e=0 e=0.25
e=0.5 e=0.8 e=1

57
TEEMP Models – Roads (Expressway, Rural and Urban)
Example – Expressway in VietNam (ADB)
58
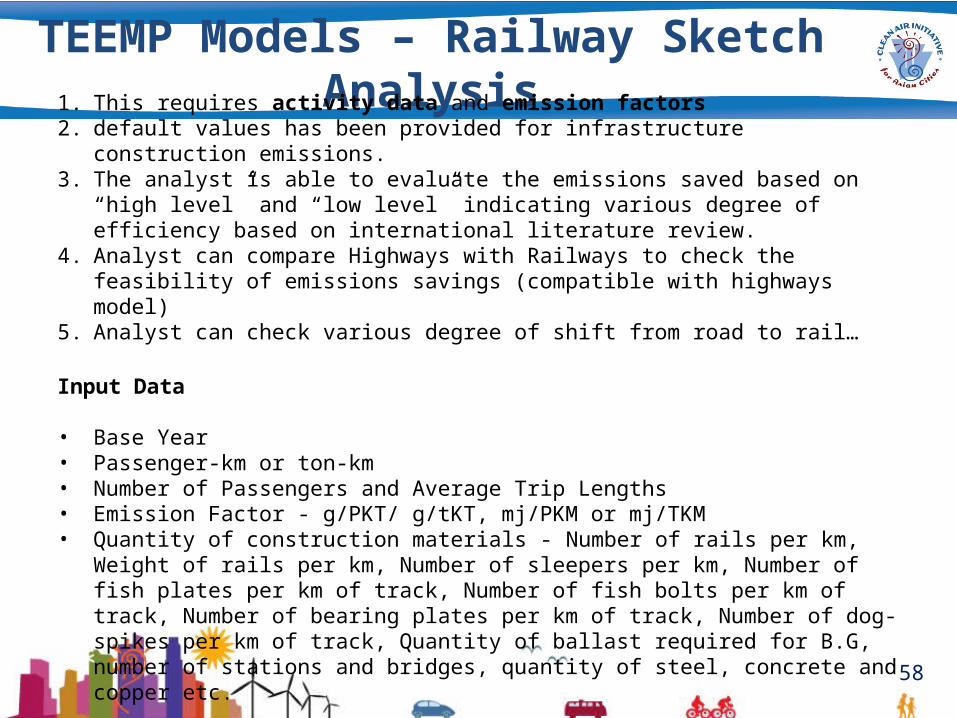
TEEMP Models – Railway Sketch Analysis
1. This requires activity data and emission factors 2. default values has been provided for infrastructure construction emissions. 3. The analyst is able to evaluate the emissions saved based on “high level” and “low
level” indicating various degree of efficiency based on international literature review.4. Analyst can compare Highways with Railways to check the feasibility of emissions
savings (compatible with highways model)5. Analyst can check various degree of shift from road to rail…
Input Data
• Base Year• Passenger-km or ton-km• Number of Passengers and Average Trip Lengths• Emission Factor - g/PKT/ g/tKT, mj/PKM or mj/TKM• Quantity of construction materials - Number of rails per km, Weight of rails per km,
Number of sleepers per km, Number of fish plates per km of track, Number of fish bolts per km of track, Number of bearing plates per km of track, Number of dog-spikes per km of track, Quantity of ballast required for B.G, number of stations and bridges, quantity of steel, concrete and copper etc.
59
Example – Expressway in VietNam (ADB)
TEEMP Models – Railway Sketch Analysis
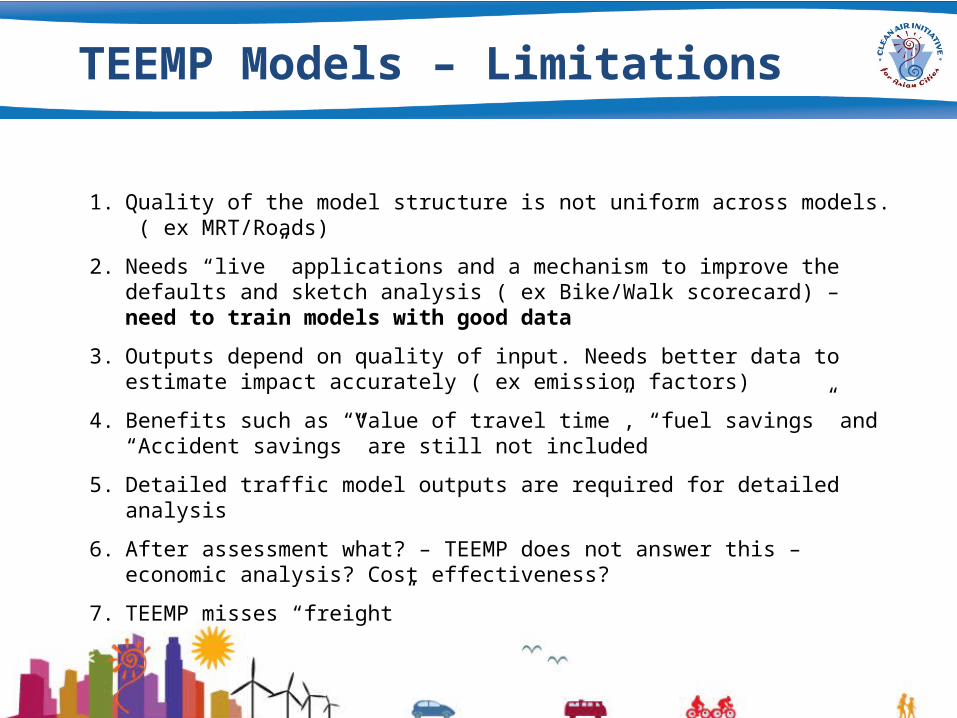
TEEMP Models – Limitations
1. Quality of the model structure is not uniform across models. ( ex MRT/Roads)
2. Needs “live” applications and a mechanism to improve the defaults and sketch analysis ( ex Bike/Walk scorecard) – need to train models with good data
3. Outputs depend on quality of input. Needs better data to estimate impact accurately ( ex emission factors)
4. Benefits such as “Value of travel time”, “fuel savings” and “Accident savings” are still not included
5. Detailed traffic model outputs are required for detailed analysis
6. After assessment what? – TEEMP does not answer this – economic analysis? Cost effectiveness?
7. TEEMP misses “freight”
61
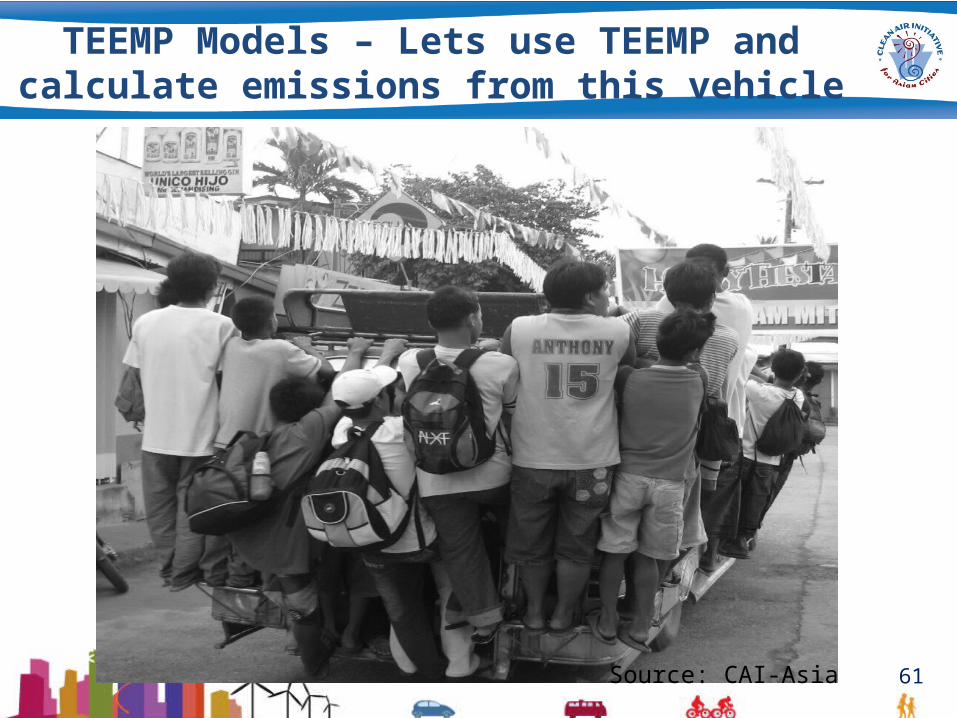
TEEMP Models – Lets use TEEMP and calculate emissions from this vehicle
Source: CAI-Asia
Find out more:
62
www.cleanairinitiative.orgwww.cleanairinitiative.org/portal/GreenTrucksPilot
CAI-Asia Center
“Air Quality in a Changing Climate”
www.BAQ2010.orgFor information email: [email protected]
Bert Fabian, Transport Program [email protected]
Sudhir Gota, Transport [email protected]
Unit 3505, 35th floorRobinsons-Equitable Tower
ADB Avenue, Pasig CityMetro Manila 1605
Philippines


![Sudhir Project[1]](https://static.fdocument.pub/doc/165x107/577d38111a28ab3a6b970544/sudhir-project1.jpg)


![VINJAMURI SAI SUDHIR [ ID NO] 2008B3A4475H](https://static.fdocument.pub/doc/165x107/577d2bab1a28ab4e1eab0f42/vinjamuri-sai-sudhir-id-no-2008b3a4475h.jpg)