
Class-Biased Institutional Change and Rising Wage Inequality Kim A. Weeden David B. Grusky RC28,...
21
Class-Biased Institutional Change and Rising Wage Inequality Kim A. Weeden David B. Grusky RC28, Brno, 2007
-
Upload
jason-moody -
Category
Documents
-
view
224 -
download
0
Transcript of Class-Biased Institutional Change and Rising Wage Inequality Kim A. Weeden David B. Grusky RC28,...
Class-Biased Institutional Change and Rising Wage Inequality
Kim A. Weeden David B. Grusky
RC28, Brno, 2007
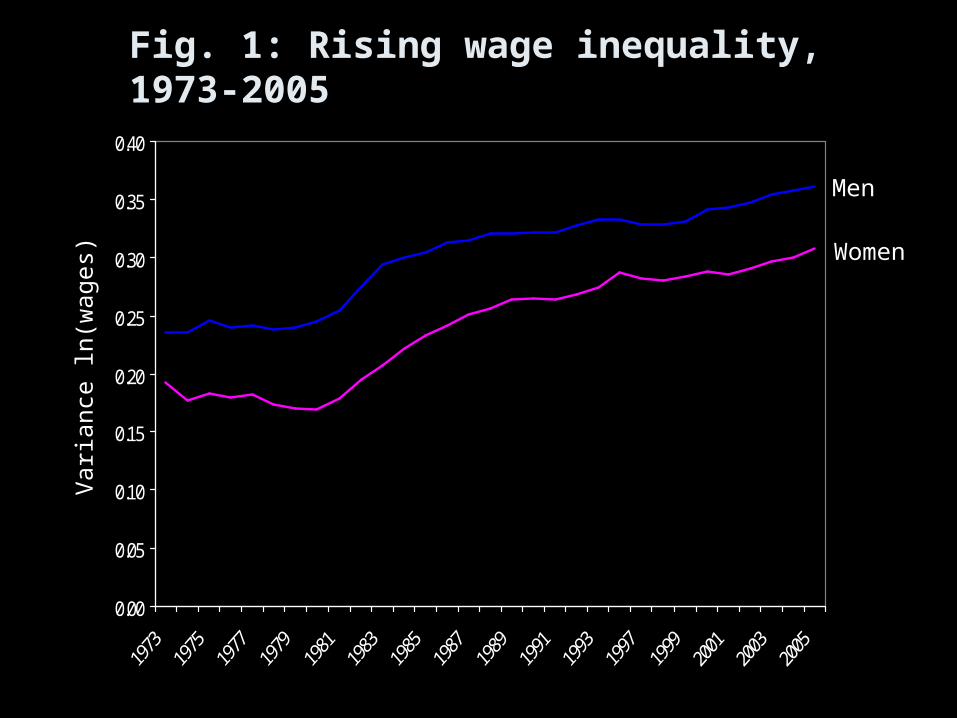
Fig. 1: Rising wage inequality, 1973-2005
Men
Women
Var
ianc
e ln
(wag
es)
0.00
0.05
0.10
0.15
0.20
0.25
0.30
0.35
0.40
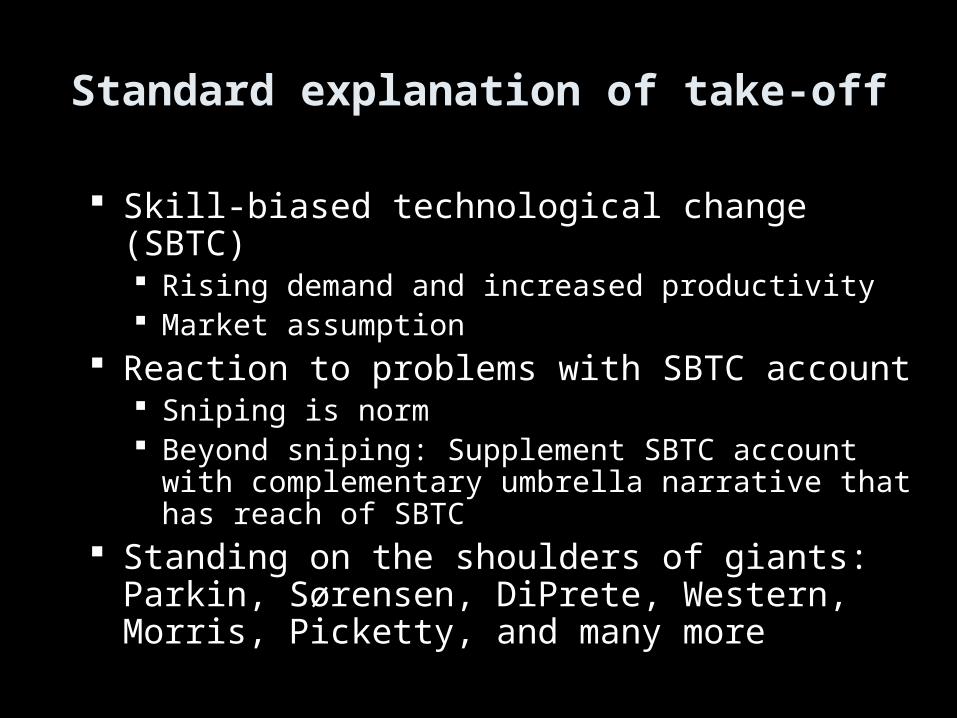
Standard explanation of take-off
Skill-biased technological change (SBTC) Rising demand and increased productivity Market assumption
Reaction to problems with SBTC account Sniping is norm Beyond sniping: Supplement SBTC account with
complementary umbrella narrative that has reach of SBTC
Standing on the shoulders of giants: Parkin, Sørensen, DiPrete, Western, Morris, Picketty, and many more
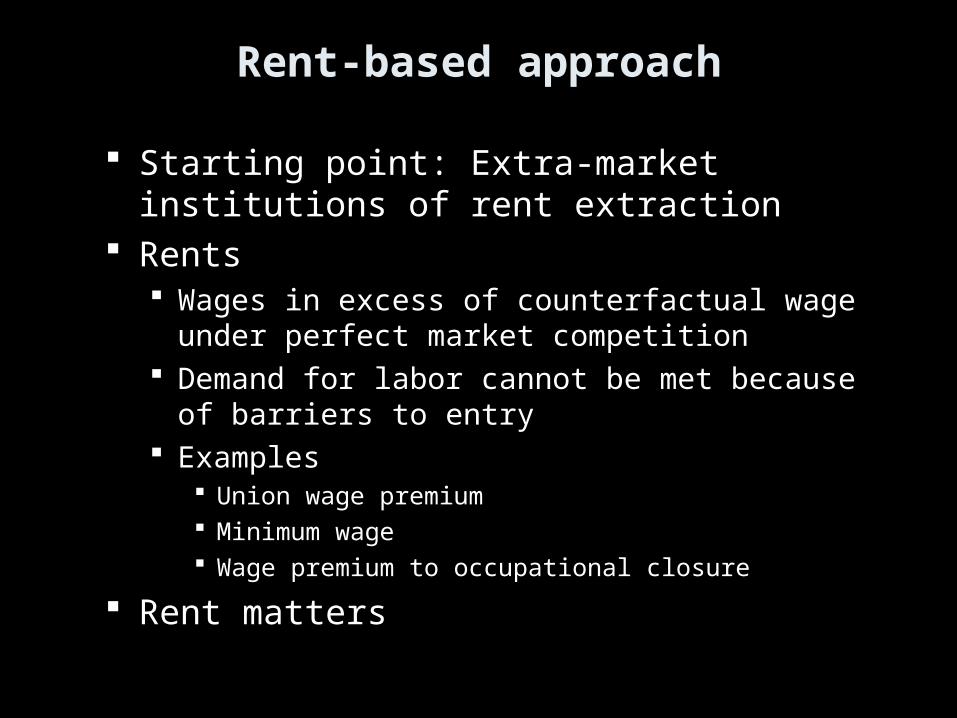
Rent-based approach
Starting point: Extra-market institutions of rent extraction
Rents Wages in excess of counterfactual wage under
perfect market competition Demand for labor cannot be met because of
barriers to entry Examples
Union wage premium Minimum wage Wage premium to occupational closure
Rent matters
Laws of motion of rent
Conventional view (e.g., Sørensen) Rent destruction is global, inevitable More inequality, but “structureless”
Class-biased institutional change (CBIC) Rent destruction at bottom of class structure
Unions Minimum wage
Rent creation at top of class structure Successful occupational closure projects Market expansion more likely for nonmanual workers
Asymmetry of rent creation and destruction is powerful force for inequality-generation
Why the asymmetry? Rent at top is better cloaked with efficiency story (as it’s only partly a “story”)
Rent creation
Diffusion of occupational “closure” Licenses: Mandated by state
10% (1970s) to 20% (2004) of labor force: More licensed workers than union workers
MN data: 47 closed occupations in 1968, approx. 160 in 2004
Certifications: Voluntary credentials offered by associations also increasing (see Procertis)
Increasing use of educational credentials (e.g., MBA)
Expanding markets for services of closed occupations
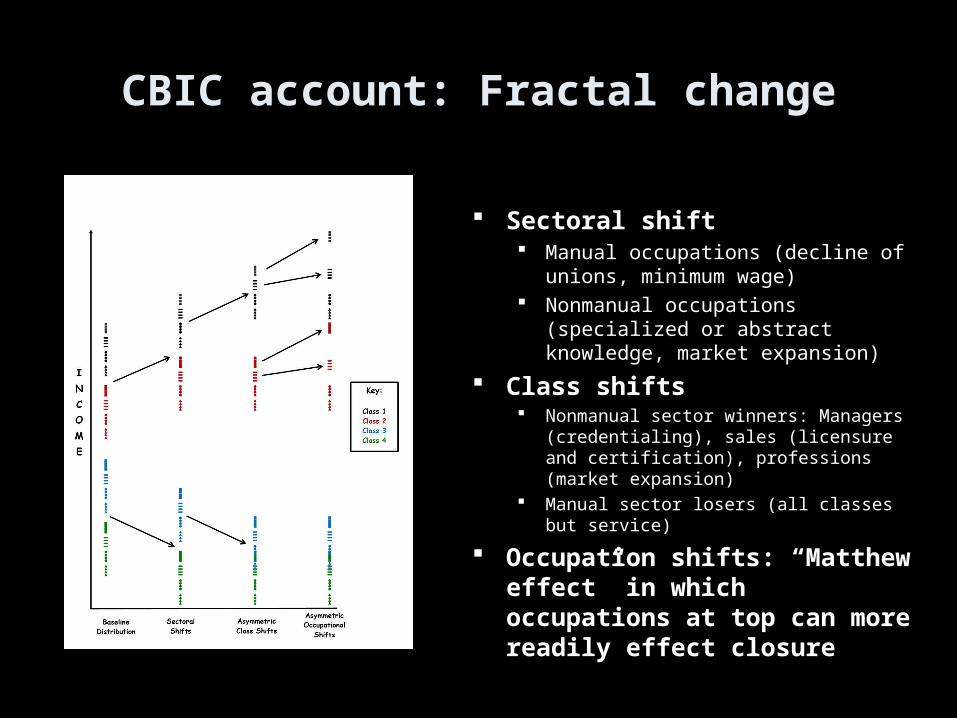
CBIC account: Fractal change
Sectoral shift Manual occupations (decline of unions,
minimum wage) Nonmanual occupations (specialized or
abstract knowledge, market expansion)
Class shifts Nonmanual sector winners: Managers
(credentialing), sales (licensure and certification), professions (market expansion)
Manual sector losers (all classes but service)
Occupation shifts: “Matthew effect” in which occupations at top can more readily effect closure
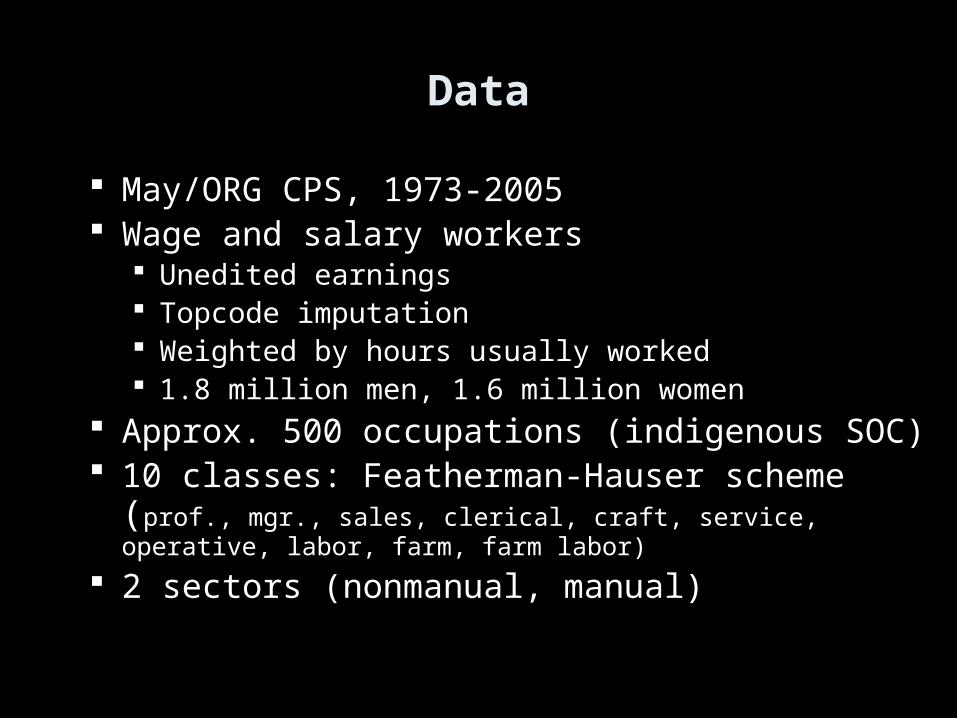
Data
May/ORG CPS, 1973-2005 Wage and salary workers
Unedited earnings Topcode imputation Weighted by hours usually worked 1.8 million men, 1.6 million women
Approx. 500 occupations (indigenous SOC) 10 classes: Featherman-Hauser scheme (prof.,
mgr., sales, clerical, craft, service, operative, labor, farm, farm labor)
2 sectors (nonmanual, manual)
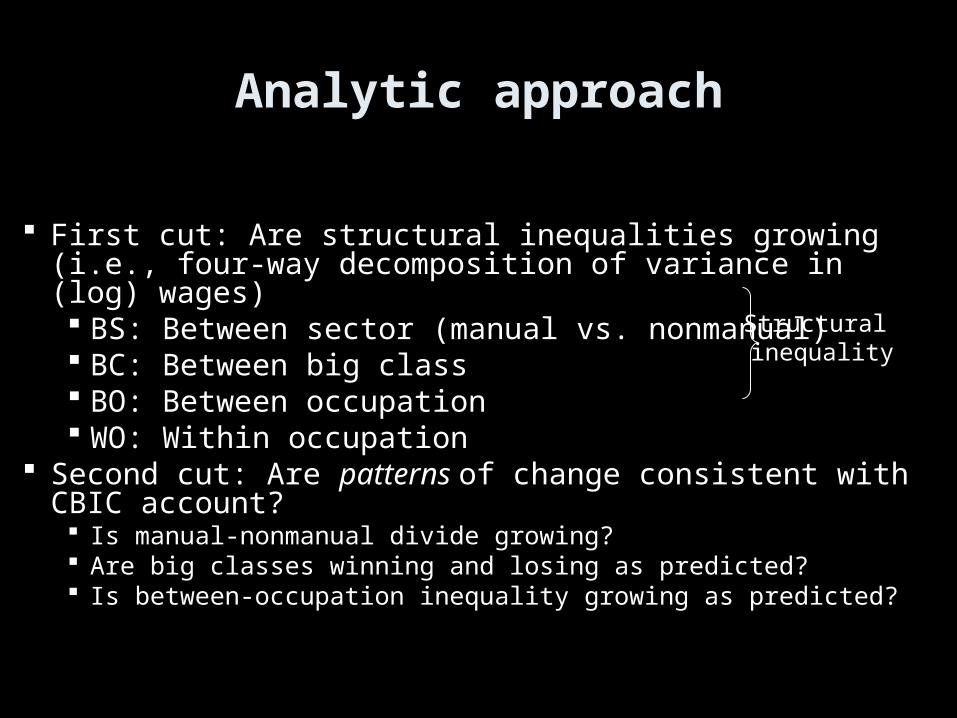
Analytic approach
First cut: Are structural inequalities growing (i.e., four-way decomposition of variance in (log) wages) BS: Between sector (manual vs. nonmanual) BC: Between big class BO: Between occupation WO: Within occupation
Second cut: Are patterns of change consistent with CBIC account? Is manual-nonmanual divide growing? Are big classes winning and losing as predicted? Is between-occupation inequality growing as predicted?
Structural inequality
0
0.05
0.1
0.15
0.2
0.25
0.3
0.35
0.4
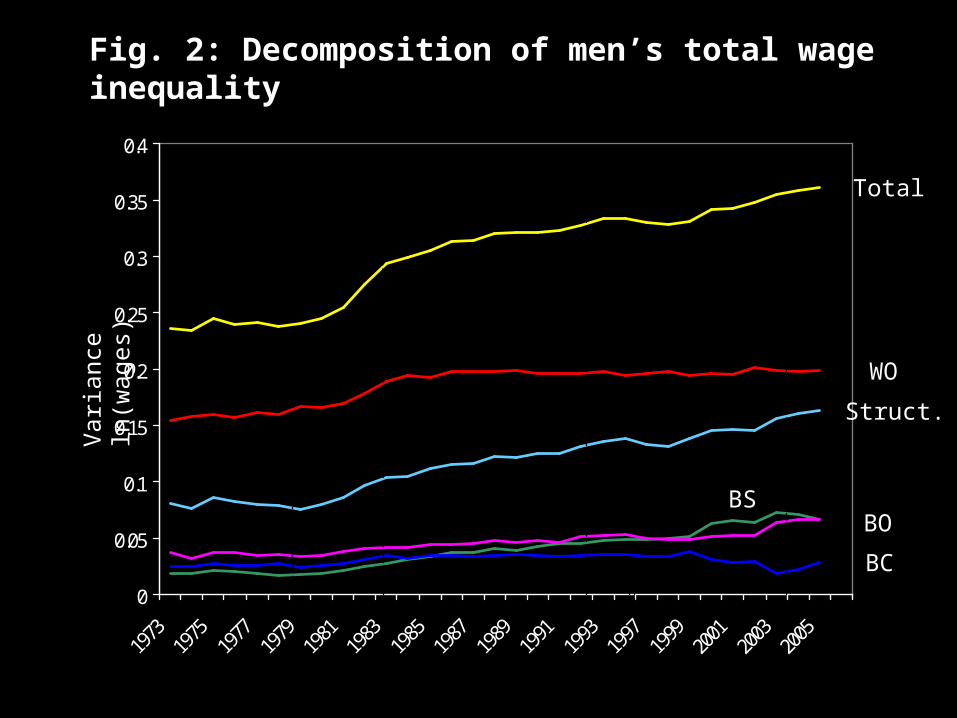
Fig. 2: Decomposition of men’s total wage inequality
Total
WO
BSBO
Var
ianc
e ln
(wag
es)
Struct.
BC
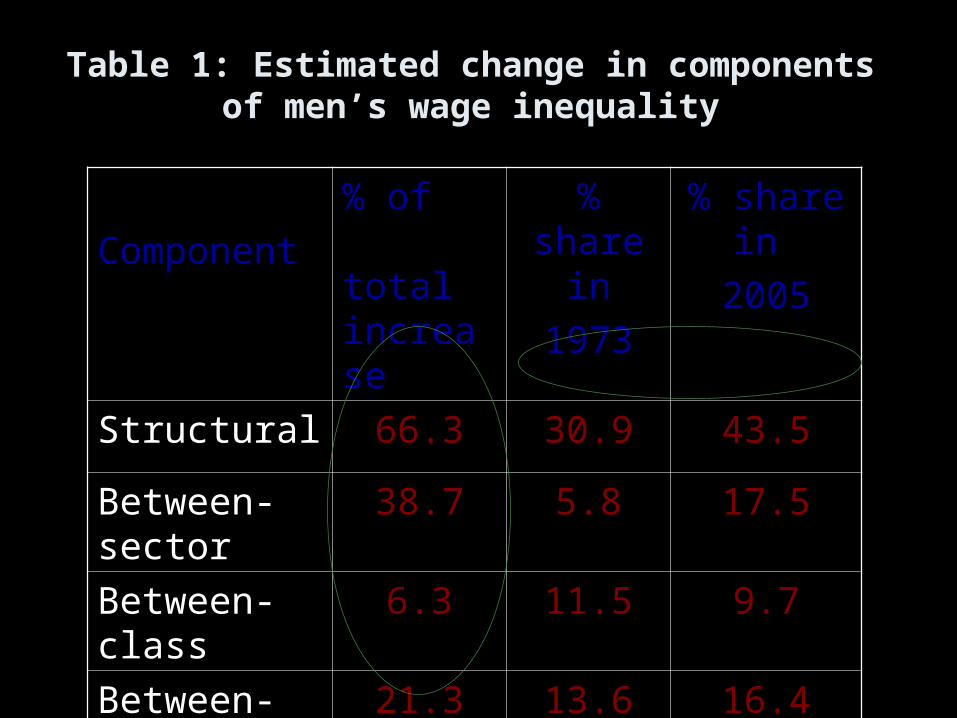
Table 1: Estimated change in components of men’s wage inequality
Component
% of total increase
% share in
1973
% share in
2005
Structural 66.3 30.9 43.5
Between-sector
38.7 5.8 17.5
Between-class
6.3 11.5 9.7
Between-occupation
21.3 13.6 16.4
0
0.05
0.1
0.15
0.2
0.25
0.3
0.35
0.4
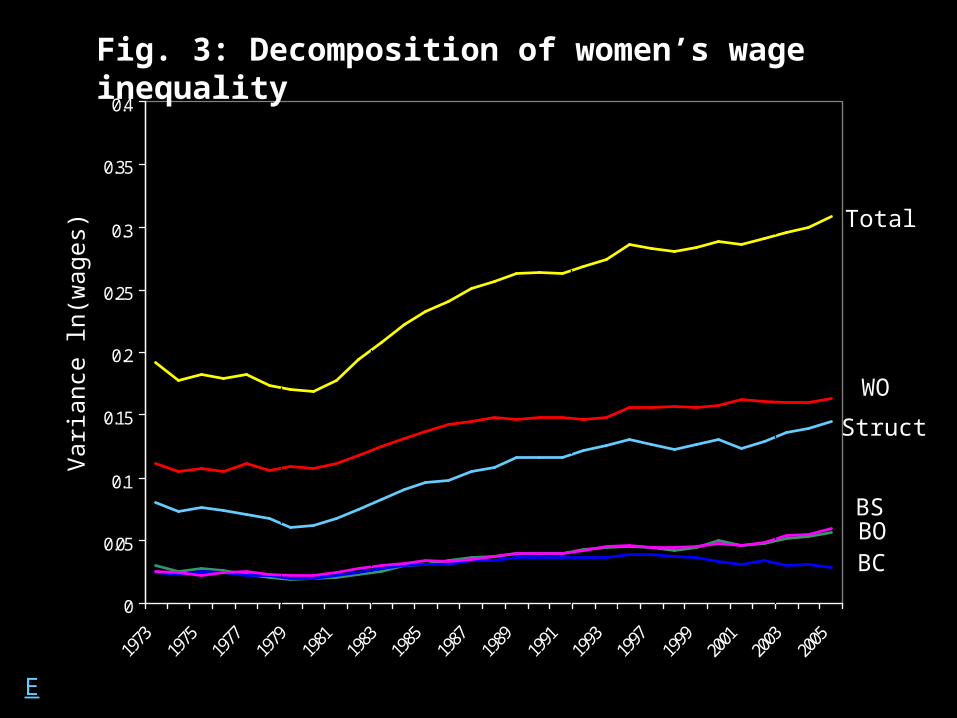
Fig. 3: Decomposition of women’s wage inequality
Total
WO
BCBO
Var
ianc
e ln
(wag
es)
E
Struct
BS
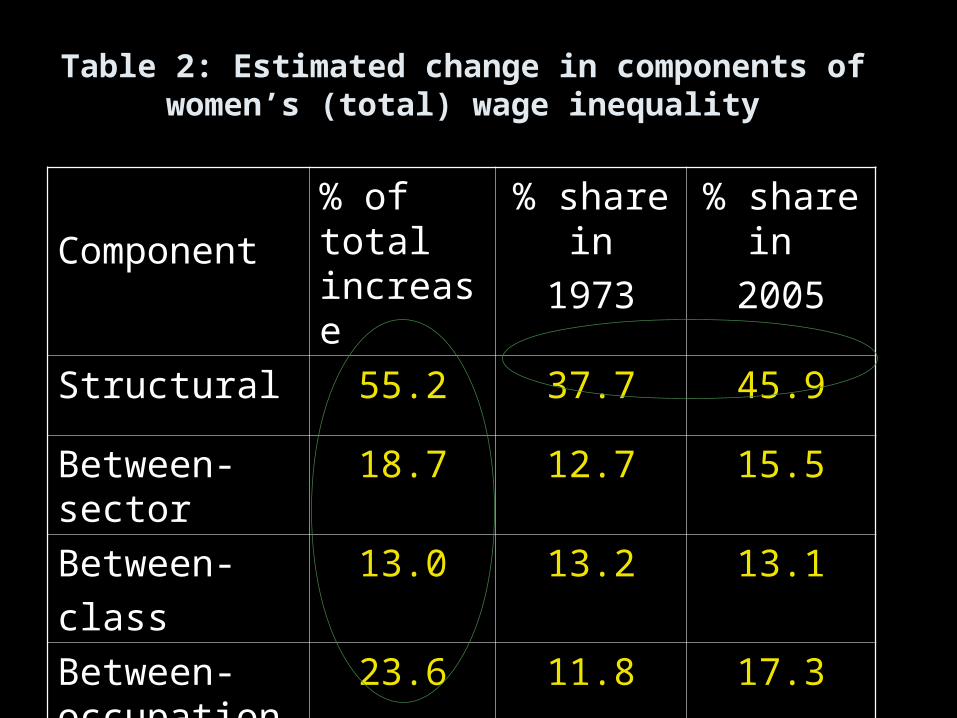
Table 2: Estimated change in components of women’s (total) wage inequality
Component
% of total increase
% share in
1973
% share in
2005
Structural 55.2 37.7 45.9
Between-sector
18.7 12.7 15.5
Between-
class
13.0 13.2 13.1
Between-occupation
23.6 11.8 17.3
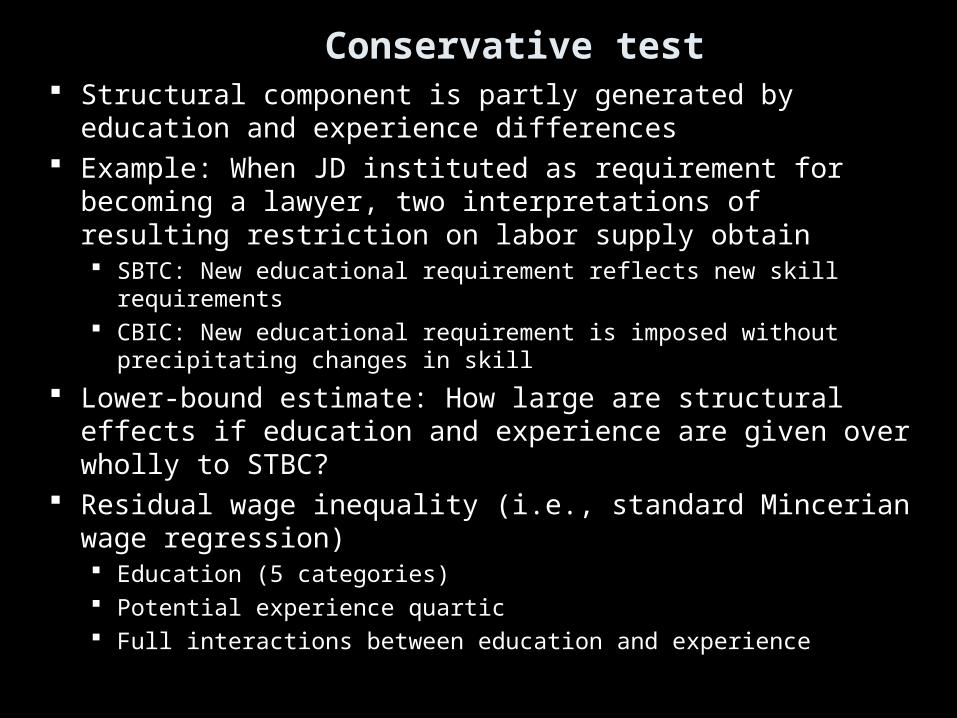
Conservative test Structural component is partly generated by education and
experience differences Example: When JD instituted as requirement for becoming
a lawyer, two interpretations of resulting restriction on labor supply obtain SBTC: New educational requirement reflects new skill requirements CBIC: New educational requirement is imposed without precipitating
changes in skill
Lower-bound estimate: How large are structural effects if education and experience are given over wholly to STBC?
Residual wage inequality (i.e., standard Mincerian wage regression) Education (5 categories) Potential experience quartic Full interactions between education and experience
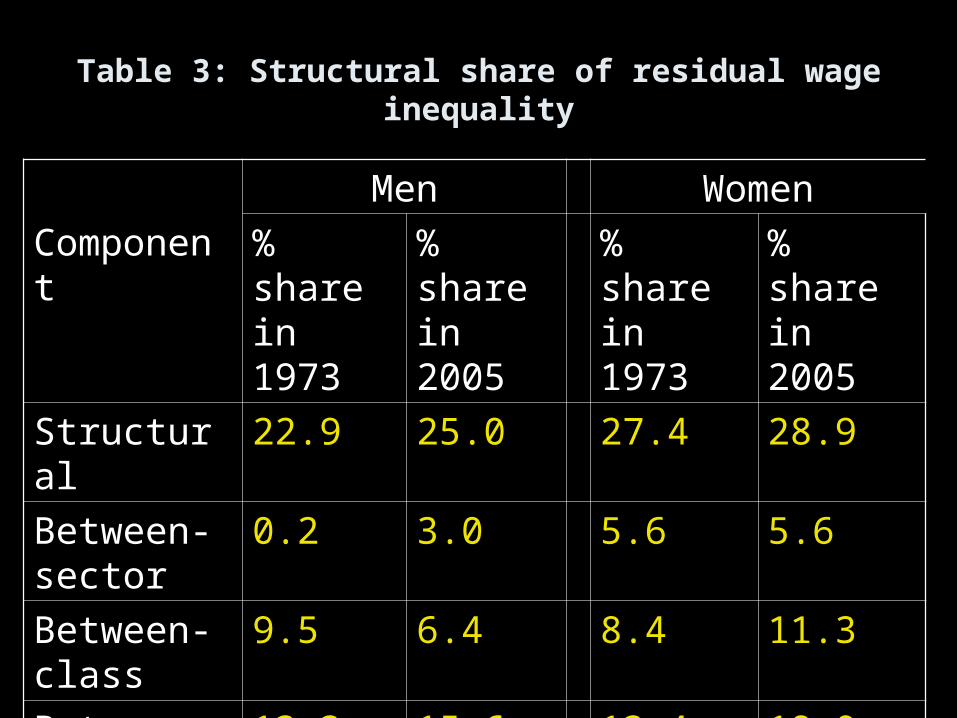
Table 3: Structural share of residual wage inequality
Component
Men Women
% share in 1973
% share in 2005
% share in 1973
% share in 2005
Structural 22.9 25.0 27.4 28.9
Between-sector
0.2 3.0 5.6 5.6
Between-class
9.5 6.4 8.4 11.3
Between-occupation
13.3 15.6 13.4 18.0
-0.2
-0.15
-0.1
-0.05
0
0.05
0.1
0.15
0.2
0.25
0.3
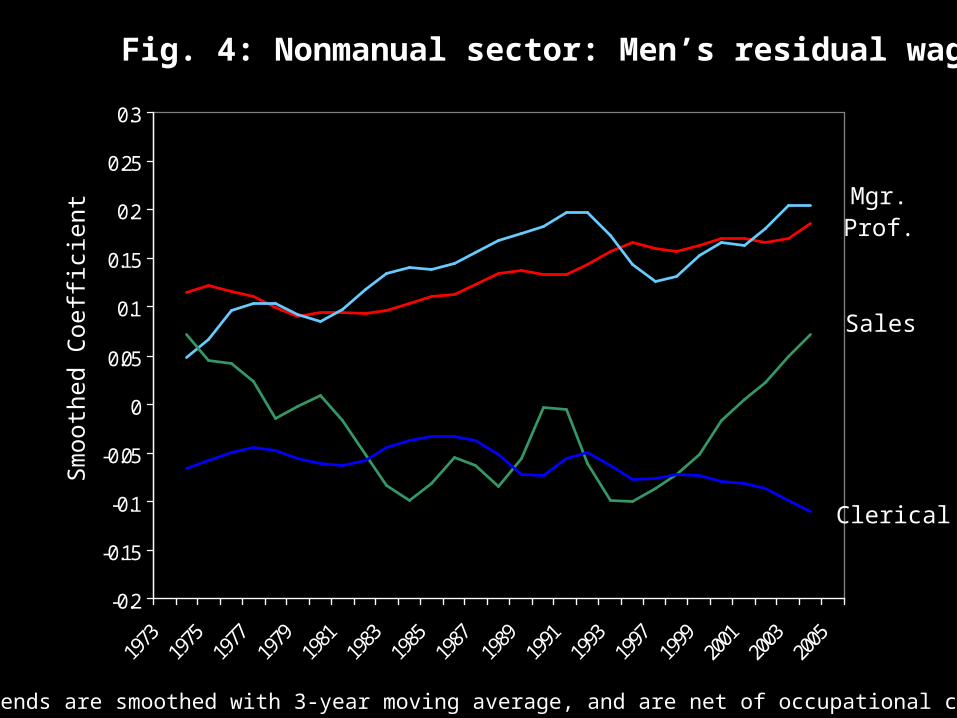
Fig. 4: Nonmanual sector: Men’s residual wages
Mgr.Prof.
Clerical
NOTE: Trends are smoothed with 3-year moving average, and are net of occupational composition
Smoo
thed
Coe
ffic
ient
Sales
-0.2
-0.15
-0.1
-0.05
0
0.05
0.1
0.15
0.2
0.25
0.3
Mgr.Prof.
Clerical
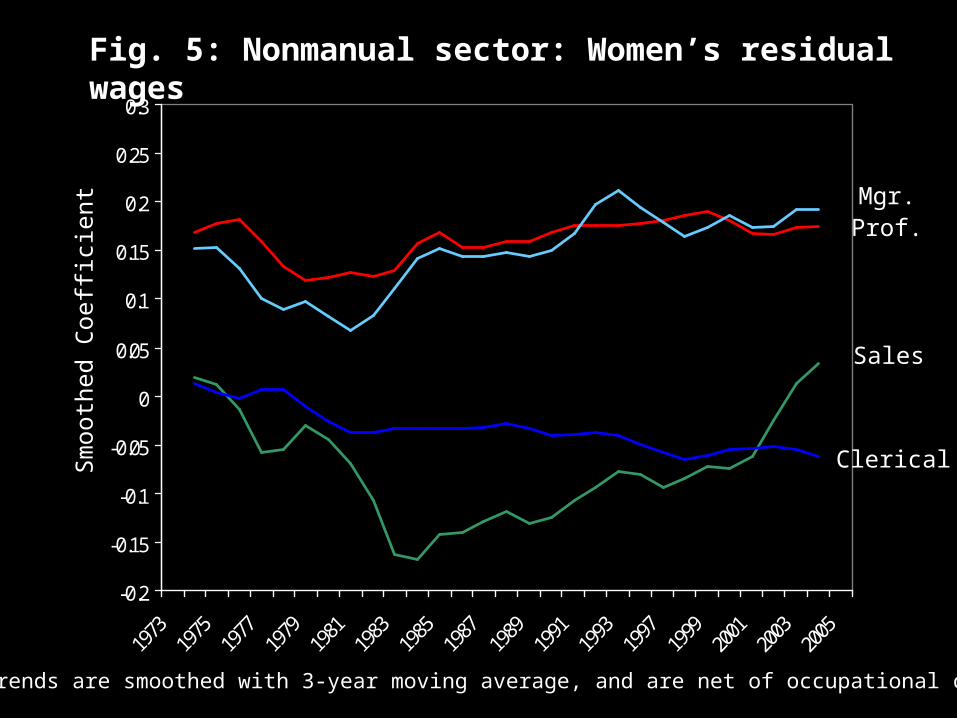
NOTE: Trends are smoothed with 3-year moving average, and are net of occupational composition
Smoo
thed
Coe
ffic
ient
Sales
Fig. 5: Nonmanual sector: Women’s residual wages
-0.4
-0.35
-0.3
-0.25
-0.2
-0.15
-0.1
-0.05
0
0.05
0.1
Craft
Labor
Service
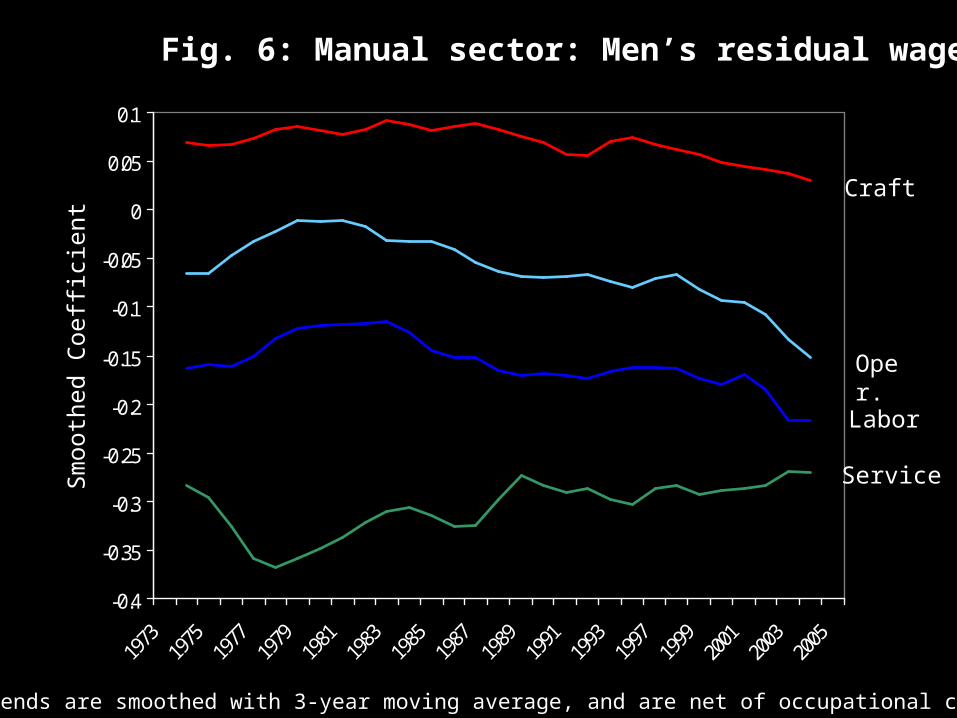
NOTE: Trends are smoothed with 3-year moving average, and are net of occupational composition
Smoo
thed
Coe
ffic
ient
Oper.
Fig. 6: Manual sector: Men’s residual wages
-0.35
-0.3
-0.25
-0.2
-0.15
-0.1
-0.05
0
0.05
0.1
0.15
Craft
Labor
Service
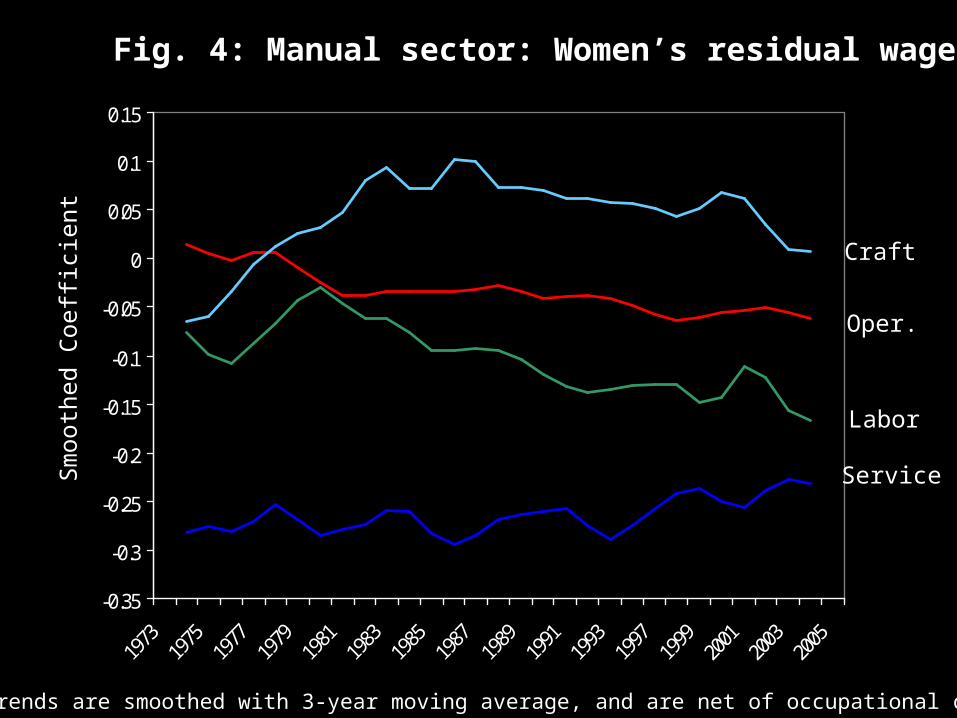
NOTE: Trends are smoothed with 3-year moving average, and are net of occupational composition
Smoo
thed
Coe
ffic
ient
Oper.
Fig. 4: Manual sector: Women’s residual wages
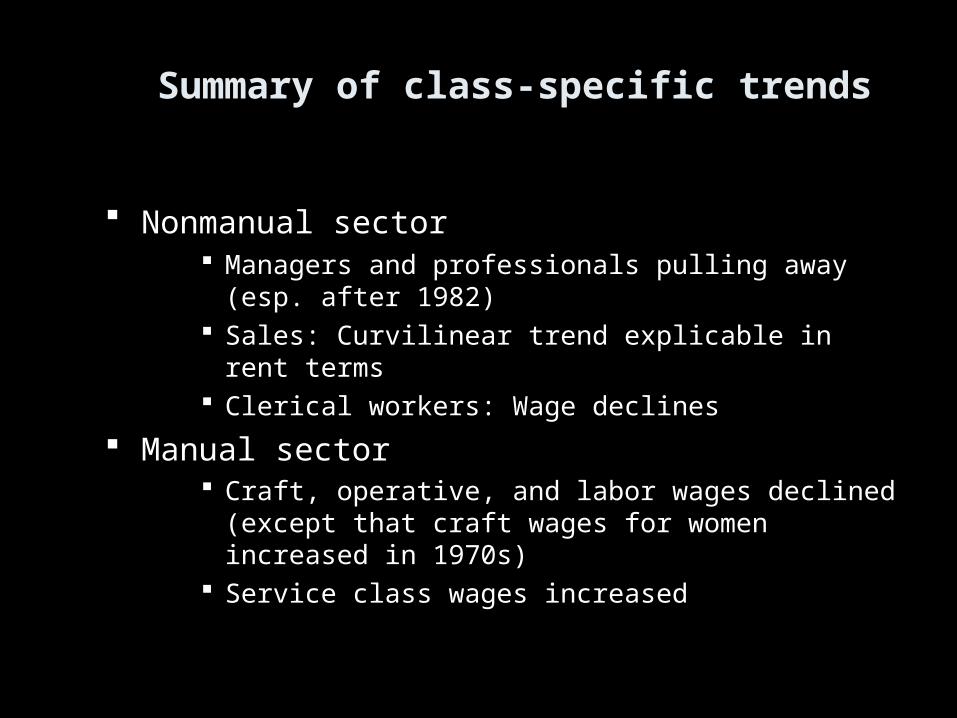
Summary of class-specific trends
Nonmanual sector Managers and professionals pulling away (esp. after
1982) Sales: Curvilinear trend explicable in rent terms Clerical workers: Wage declines
Manual sector Craft, operative, and labor wages declined (except that
craft wages for women increased in 1970s) Service class wages increased
Conclusions
CBIC account has potential (albeit evidence is just as indirect as that on behalf of SBTC)
Implications for future of inequality Decline in inequality is not intrinsic effect of industrialization
(e.g., Kuznets Curve) but historically contingent process Rent-creation at top has more staying power
Culture: Cloaked with efficiency story Power: Backed by powerful actors
A long run-up is plausible