
Chelation as a strategy with the potential to overcome ...
243
Chelation as a strategy with the potential to overcome multidrug resistance in cancer Dissertation zur Erlangung des Doktorgrades (Dr. rer. nat.) der Mathematisch-Naturwissenschaftlichen Fakultät der Rheinischen Friedrich-Wilhelms-Universität Bonn vorgelegt von Dipl. Chem. Veronika Friederike Sophia Pape aus Unna Bonn, 2015
Transcript of Chelation as a strategy with the potential to overcome ...
Chelation as a strategy with the potential
to overcome multidrug resistance in cancer
Dissertation
zur Erlangung des Doktorgrades (Dr. rer. nat.)
der
Mathematisch-Naturwissenschaftlichen Fakultät
der
Rheinischen Friedrich-Wilhelms-Universität Bonn
vorgelegt von
Dipl. Chem. Veronika Friederike Sophia Pape
aus Unna
Bonn, 2015

Angefertigt mit Genehmigung der Mathematisch-Naturwissenschaftlichen Fakultät der
Rheinischen Friedrich-Wilhelms-Universität Bonn
1. Gutachter: Prof. Dr. M. Wiese
2. Gutachter: Prof. Dr. G. Bendas
Tag der Promotion: 17.06.2016
Erscheinungsjahr: 2016

für meine Familie
und für die Freunde, die wie Familie für mich sind
for my family
and for those friends, who are like family for me
mind a hivatalos,
mind a közeli barátokból álló választott családomnak
I HAVE LEARNT THAT ALL OUR THEORIES ARE NOT TRUTH ITSELF, BUT
RESTING PLACES OR STAGES ON THE WAY TO THE CONQUEST OF
TRUTH, AND THAT WE MUST BE CONTENTED TO HAVE OBTAINED FOR
THE STRIVERS AFTER TRUTH SUCH A RESTING PLACE WHICH, IF IT IS ON A MOUNTAIN, PERMITS US TO VIEW
THE PROVINCES ALREADY WON AND THOSE STILL TO BE CONQUERED.
— Justus von Liebig (in a letter to Joseph Henry Gilbert, 25th of December 1870)

Chelation as a strategy with the potential to overcome multidrug resistance in cancer
1. Introduction
1.1. MDR – making Cancer invulnerable? 1
1.2. ABC-transporters – stories from a family album 2
1.3. Attempts to overcome MDR 6
1.4. Collateral sensitivity – in search for the Achilles’ heel 8
1.5. Putting the bite on metals – Role of Chelation in (MDR) Cancer therapy 17
1.6. Keeping the balance on a double edged sword – ROS 22
2. Objective 29
3. Results and discussion
3.1. Critical evaluation of literature reports
3.1.1. Serendipitous findings 31
3.1.2. Pharmacogenomic approach 35
3.2. Development of new compounds – Design of a focused library 40
3.2.1. Thiosemicarbazones – Compound classes I/II/III 48
3.2.2. Arylhydrazones – Compound class IV 54
3.2.3. Hydrazino-benzothiazoles – Compound classes V/VI 55
3.2.4. Combination of chemical entities – Compound class VII 58
3.2.5. Structure activity relationships in the focused library and beyond 59
3.3 Having a closer look at the 8-hydroxyquinoline scaffold 69
3.4. Elucidation of putative mechanism(s) of action
3.4.1. Impact of ROS 78
3.4.2. Impact of metals – co-incubation with FeCl3 and CuCl2 80
3.4.3. Investigation of Fe(III) and Cu(II) complexes – stabilities and stoichiometries 84
3.4.4. In vitro testing of preformed complexes – and the impact of P-gp on their toxicity 94
3.4.5. Redox activity of complexes
3.4.5.1. Cyclic voltammetry 98
3.4.5.2. Reactivity with antioxidants 101
3.4.6. Relevance of redox activity of the complexes for toxicity 105
3.5. Establishing techniques to measure ROS
3.5.1. DCFDA 108
3.5.2. HyPer fluorescent protein 117
4. Summary 127
5. Tumor models and biological methods
5.1. Cell lines, media and buffer 136
5.2. Cell culturing 137
5.3. Determination of cell numbers 138
5.4. Cryo-conservation and revitalization of cells 139
5.5. Test for Mycoplasma infections 139
5.6. Measurement of cell viability
5.6.1. MTT viability assay 141
5.6.2. Presto Blue viability assay 142
5.6.3. mCherry, eGFP, DsRed fluorescence assays 143
5.6.4. Evaluation of dose response curves 144
5.7. Verification of MDR phenotype
5.7.1. Toxicity of P-gp substrates 145
5.7.2. Calcein AM assay 146
5.8. ROS determination
5.8.1. DCFDA 149
5.8.2. HyPer
5.8.2.1. Preparation of stably HyPer-expressing cells 151
5.8.2.1.1. Transformation into Top10 competent E.coli cells 152
5.8.2.1.2. Isolation and Purification of amplified plasmid DNA 153
5.8.2.1.3. Quantification of DNA 153
5.8.2.1.4. Transient expression and selection in neomycin G418 154
5.8.2.1.5. Lentiviral transfection 155
5.8.2.2. Real time measurement of intracellular H2O2-levels 155
6. Synthesis and analytical chemical methods
6.1. Synthesis of a focused library 157
6.2. UV‒Vis spectrophotometric measurements for complex stability evaluation 178
6.3. Electrochemical Studies
6.3.1. Cyclic voltammetry 181
6.3.2. Oxidation of ascorbic acid (ASC) and glutathione (GSH) 185
7. List of Abbreviations 187
8. Bibliography 191
9. Appendix 221
10. Acknowledgement 229
11. Verfassererklärung 232
12. List of Publications 233
13. Conference Presentations 234

1. Introduction 1
1. Introduction
1.1. MDR – making Cancer invulnerable?
Cancer is the second highest cause of death in industrialized countries [1,2]. A broad range of
diverse compounds with distinct mechanisms of anticancer activity has been developed and
become available for treatment and is used in the clinical practice. Approved drugs include
Vinca alkaloids (like vincristine), which depolymerize microtubules, Anthracyclines (like
doxorubicin), that intercalate into DNA and inhibit DNA topoisomerase II, antimetabolites
like methotrexate, DNA intercalating agents like cisplatin and several others [3]. Despite the
diversity of drugs used for the treatment of cancer the development of drug resistance is a
frequent reason for the failure of cancer chemotherapy [1,2]. Moreover, cells that are resistant
to a certain cytotoxic agent can build up cross-resistance to other structurally and
mechanistically unrelated drugs, leading to the phenotype of Multidrug Resistance (MDR)
[3].
Resistance can emerge as a result of genetic changes, whereby targets are overexpressed or
structurally modified in a manner that the binding of cytostatic agents is reduced [3–6]. An
adaption can also consist of increased repair of damage caused by the applied drug, as for
example in the case of DNA repair [3–5]. Signaling pathways can be modified, in order to
overcome the dependence on the drug target [7]. An altered cellular metabolism can
furthermore lead to an increased inactivation or decreased activation of a cytotoxic agent [3–
6]. The cellular response to drugs can also be altered as a result of decreased availability of
the agent. This can be achieved by sequestering of drugs within cellular compartments, a
reduced inward- or mostly active outward transport (efflux) of cytotoxic agents [3–5].
This efflux is energy dependent and mediated by transport proteins of the ATP-binding-
cassette (ABC) family. The human genome contains 48 genes that encode ABC transporters.
The gene product of ABCB1, P-glycoprotein (P-gp), stands out among ABC transporters by
conferring the strongest resistance to the widest variety of compounds [3–5,8–10].
Since the development of MDR is a multifactorial process, additionally to the increased
expression of drug efflux pumps (which will be covered in detail in the next chapter), many
other genetic changes are implicated with the MDR phenotype [3].
In the 1920ies Warburg discovered that the cellular energy metabolism of cancer cells is
shifted from oxidative phosphorylation to (aerobic) glycolysis [11]. MDR cancer cells are
reported to undergo a further metabolic shift, which results in an even higher rate of cytosolic
glycolysis and oxygen consumption accompanied with an increased utilization of fat as a fuel
source for the mitochondria [12,13]. As a consequence of this metabolic shift, the
2
mitochondrial membrane potential as well as the proton transfer against the gradient of the
mitochondria are smaller in MDR cancer cells as compared to their parental cell lines [13].
The metabolic changes that occur during the development of resistance render the cells less
susceptible for reactive oxygen species (ROS), DNA damage and apoptosis [13].
Since the transport of xenobiotic or endogenous substrates imposes a considerable cost in
energy on a cell, metabolic changes and ABC transporter mediated drug resistance are
interconnected [14,15]. As a result of increased glycolysis the production of lactic acid is
increased. As evidenced by drug induced increase in lactate production and extracellular
acidification rates (ECAR) of MDR cells, the energy consumption caused by the interaction
of a substrate with P-gp is compensated for by increased glycolysis [15–17]. Inhibition of P-
gp decreased the measured ECAR values, which furthermore correlated well with activation
profiles of the transporter obtained by means of phosphate release measurements in inverted
membrane vesicles for the same drugs [16,17].
Further metabolic enzymes like the methylglyoxal detoxifying glyoxalase system, might
confer resistance to antitumor agents [18]. Numerous metabolic changes are mediated by
Hypoxia inducible factor HIF-1α, as a result of PI3K/AKT/mTOR pathway stimulation
[19,20]. Disclosing a further connectivity between metabolic changes and ABC transporters,
this pathway is furthermore reported to upregulate the expression of P-gp either via activation
of NFκB [21] or via HIF-1α [19,22,23].
The lysosomal accumulation of drugs has been suggested to differ in parental and MDR cells.
Proton pumps like the vacuolar type H+-ATPase mediate intracellular pH gradients, which
drive the lysosomal sequestration [24]. Recently the presence of P-gp in lysosomal
membranes has been suggested as an additional mediator of the sequestration of drugs into the
lysosome [25].
1.2. ABC transporters – stories from a family album
The superfamily of ATP-binding cassette (ABC) transport proteins consists of seven
subfamilies, which are classified on the basis of sequence homology and domain organization.
They are encoded by the ABCA1-10/12/13, ABCB1-11, ABCC1-12, ABCD1-4, ABCE1,
ABCF1-3 and ABCG1/2/4/5/8 genes [26].
In the context of MDR, the first discovered ABC transporter was P-glycoprotein (P-gp,
encoded by the ABCB1 gene). Investigating Ehrlich ascites tumor cells in 1973 Dano was the
1. Introduction 3
first to observe the active, energy dependent outward transport of the cytotoxic agent
Daunorubicin [27]. Only three years later Juliano and Ling ascertained connectivity between
MDR and the ABC transporter P-gp [28]. In 1992 a further ABC transporter, the Multidrug
Resistance associated Protein, MRP1 (encoded by the ABCC1 gene), was identified to be
linked to MDR and altering intracellular GSH levels [29,30]. As the third important
transporter involved in MDR the Breast Cancer Resistance Protein BCRP (encoded by the
ABCG2 gene) was discovered in 1998 [31]. These three transporters are the most important
efflux transporters conferring MDR.
In their structural composition they share the presence of two nucleotide binding domains
(NBD), which are responsible for the ATP binding and hydrolysis that drives drug transport,
and two transmembrane domains (TMD), which contain the drug-binding sides [32,33]. The
TMDs are built by six membrane-spanning α-helixes. In case of MRP1 an additional 5-helical
TMD is present at the N-terminus of the protein, while BCRP is a half-transporter, that needs
to dimerize (or even oligomerize [34]) in order to function [33,35].
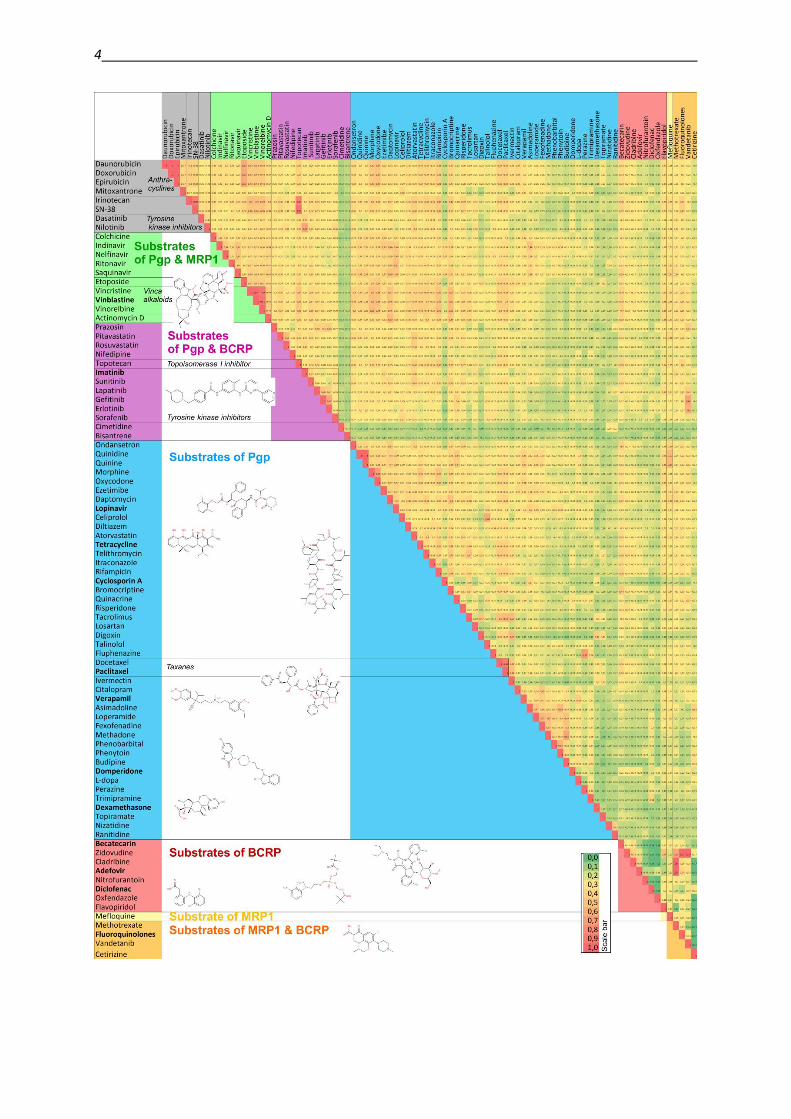
The wide substrate spectrum of compounds that is translocated across cellular membranes by
the three presented transporters is partially overlapping. The heat-map in Figure 1 illustrates
the structural similarity between the particular substrates. Compounds highlighted in grey are
transported by all three transporters. Compounds that are transported by a single protein only
are highlighted by primary colors: P-gp substrates are indicated in blue, BCRP substrates in
red and MRP1 substrates in yellow. Substrates of two of these transport proteins are indicated
by the mixed color, therefore compounds transported by P-gp and BCRP are highlighted in
violet, substrates of P-gp and MRP1 in green, and BCRP and MRP1 substrates in orange.
Figure 1: Heat-map of substrates transported by the three MDR transporters P-gp, MRP1 and BCRP.
The coloring on the upper half illustrates the structural similarity between the compounds as calculated
from Tanimoto coefficients with the help of the InstantJChem software [36] (as shown in the scale bar
in the right lower corner, red indicates a coefficient of 1, which is 100% identity, while green indicates
a coefficient of 0 with no detectable similarity). Due to the symmetry of the heat-map, in the lower
half of the figure is indicated by which transporter the respective compound is recognized and
transported: grey: P-gp, MRP1 and BCRP; blue: P-gp, red: BCRP; yellow: MRP1; violet: P-gp and
BCRP, green: P-gp and MRP1, orange: MRP1 and BCRP. Data on substrate specificity were collected
from [10,37–40].
4
1. Introduction 5
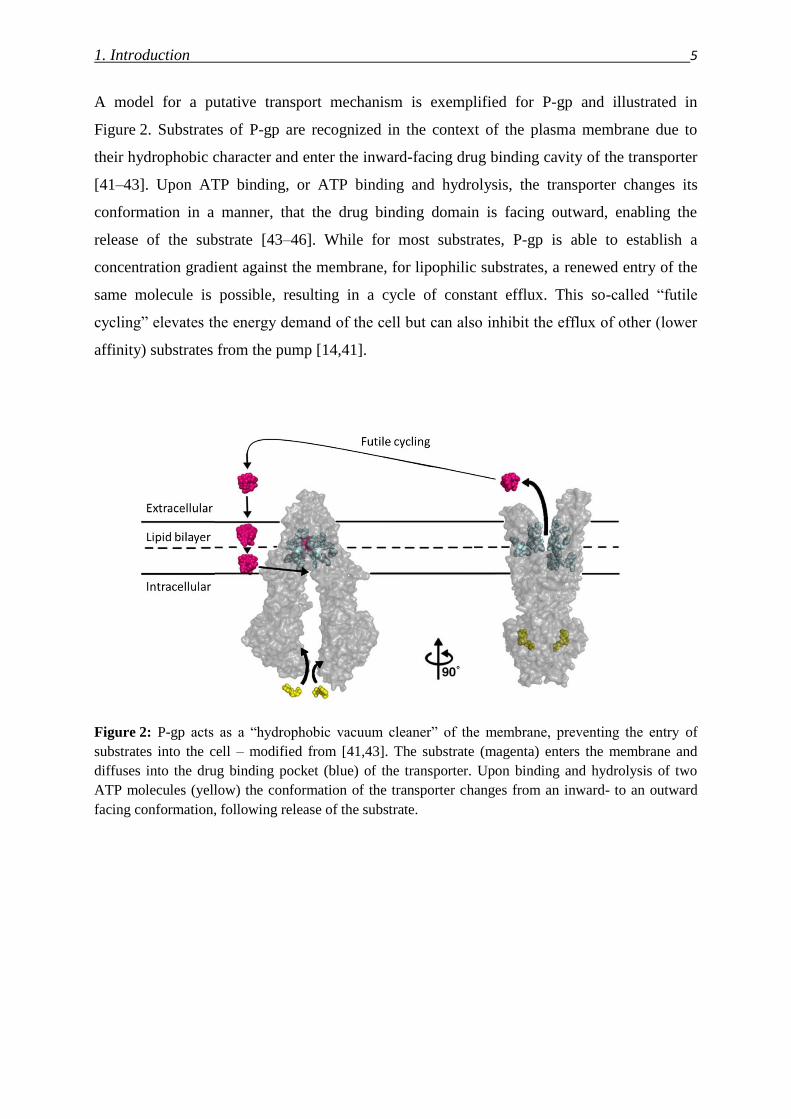
A model for a putative transport mechanism is exemplified for P-gp and illustrated in
Figure 2. Substrates of P-gp are recognized in the context of the plasma membrane due to
their hydrophobic character and enter the inward-facing drug binding cavity of the transporter
[41–43]. Upon ATP binding, or ATP binding and hydrolysis, the transporter changes its
conformation in a manner, that the drug binding domain is facing outward, enabling the
release of the substrate [43–46]. While for most substrates, P-gp is able to establish a
concentration gradient against the membrane, for lipophilic substrates, a renewed entry of the
same molecule is possible, resulting in a cycle of constant efflux. This so-called “futile
cycling” elevates the energy demand of the cell but can also inhibit the efflux of other (lower
affinity) substrates from the pump [14,41].
Figure 2: P-gp acts as a “hydrophobic vacuum cleaner” of the membrane, preventing the entry of
substrates into the cell – modified from [41,43]. The substrate (magenta) enters the membrane and
diffuses into the drug binding pocket (blue) of the transporter. Upon binding and hydrolysis of two
ATP molecules (yellow) the conformation of the transporter changes from an inward- to an outward
facing conformation, following release of the substrate.
6
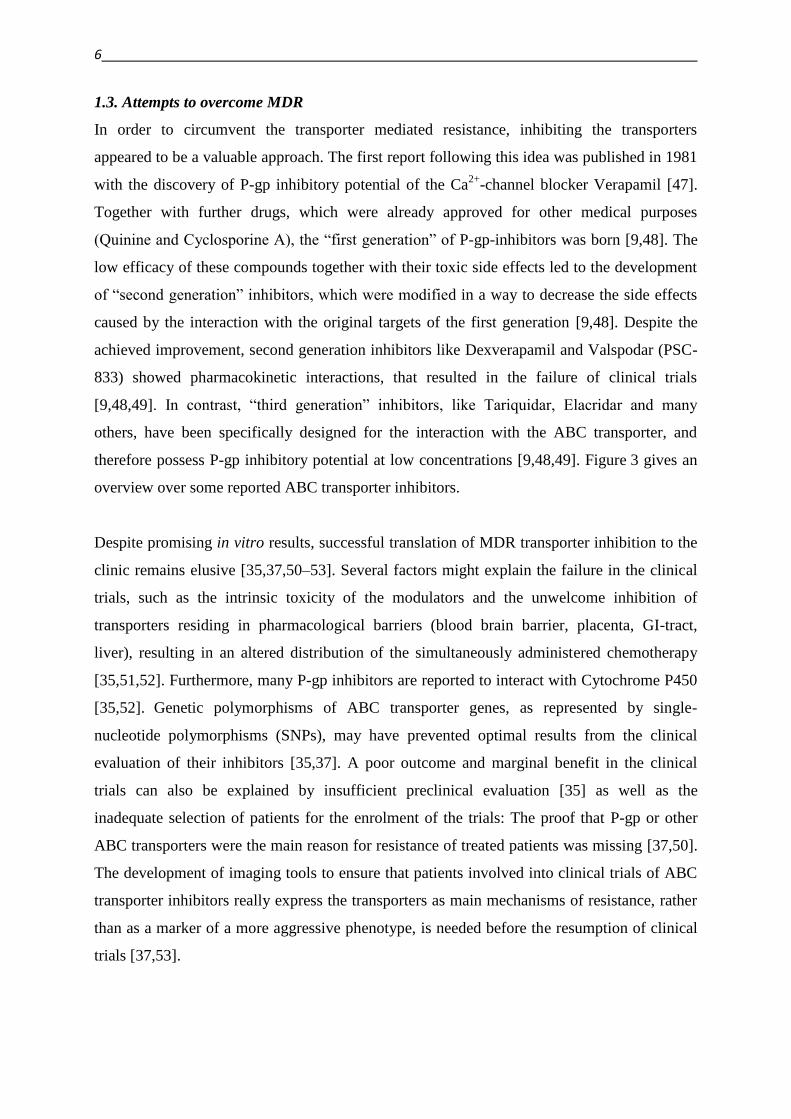
1.3. Attempts to overcome MDR
In order to circumvent the transporter mediated resistance, inhibiting the transporters
appeared to be a valuable approach. The first report following this idea was published in 1981
with the discovery of P-gp inhibitory potential of the Ca2+
-channel blocker Verapamil [47].
Together with further drugs, which were already approved for other medical purposes
(Quinine and Cyclosporine A), the “first generation” of P-gp-inhibitors was born [9,48]. The
low efficacy of these compounds together with their toxic side effects led to the development
of “second generation” inhibitors, which were modified in a way to decrease the side effects
caused by the interaction with the original targets of the first generation [9,48]. Despite the
achieved improvement, second generation inhibitors like Dexverapamil and Valspodar (PSC-
833) showed pharmacokinetic interactions, that resulted in the failure of clinical trials
[9,48,49]. In contrast, “third generation” inhibitors, like Tariquidar, Elacridar and many
others, have been specifically designed for the interaction with the ABC transporter, and
therefore possess P-gp inhibitory potential at low concentrations [9,48,49]. Figure 3 gives an
overview over some reported ABC transporter inhibitors.
Despite promising in vitro results, successful translation of MDR transporter inhibition to the
clinic remains elusive [35,37,50–53]. Several factors might explain the failure in the clinical
trials, such as the intrinsic toxicity of the modulators and the unwelcome inhibition of
transporters residing in pharmacological barriers (blood brain barrier, placenta, GI-tract,
liver), resulting in an altered distribution of the simultaneously administered chemotherapy
[35,51,52]. Furthermore, many P-gp inhibitors are reported to interact with Cytochrome P450
[35,52].
Genetic polymorphisms of ABC transporter genes, as represented by single-
nucleotide polymorphisms (SNPs), may have prevented optimal results from the clinical
evaluation of their inhibitors [35,37]. A poor outcome and marginal benefit in the clinical
trials can also be explained by insufficient preclinical evaluation [35] as well as the
inadequate selection of patients for the enrolment of the trials: The proof that P-gp or other
ABC transporters were the main reason for resistance of treated patients was missing [37,50].
The development of imaging tools to ensure that patients involved into clinical trials of ABC
transporter inhibitors really express the transporters as main mechanisms of resistance, rather
than as a marker of a more aggressive phenotype, is needed before the resumption of clinical
trials [37,53].
1. Introduction 7
Figure 3: Inhibitors of ABC transport proteins, reported in the literature [35,37–39,52,54–64].
Applying the color code used in Figure 1, compounds inhibiting P-gp are marked in blue, inhibitors of
BCRP in red, and MRP1 inhibitors in yellow. Compounds inhibiting more than one transporter are
located in the intersections.
8
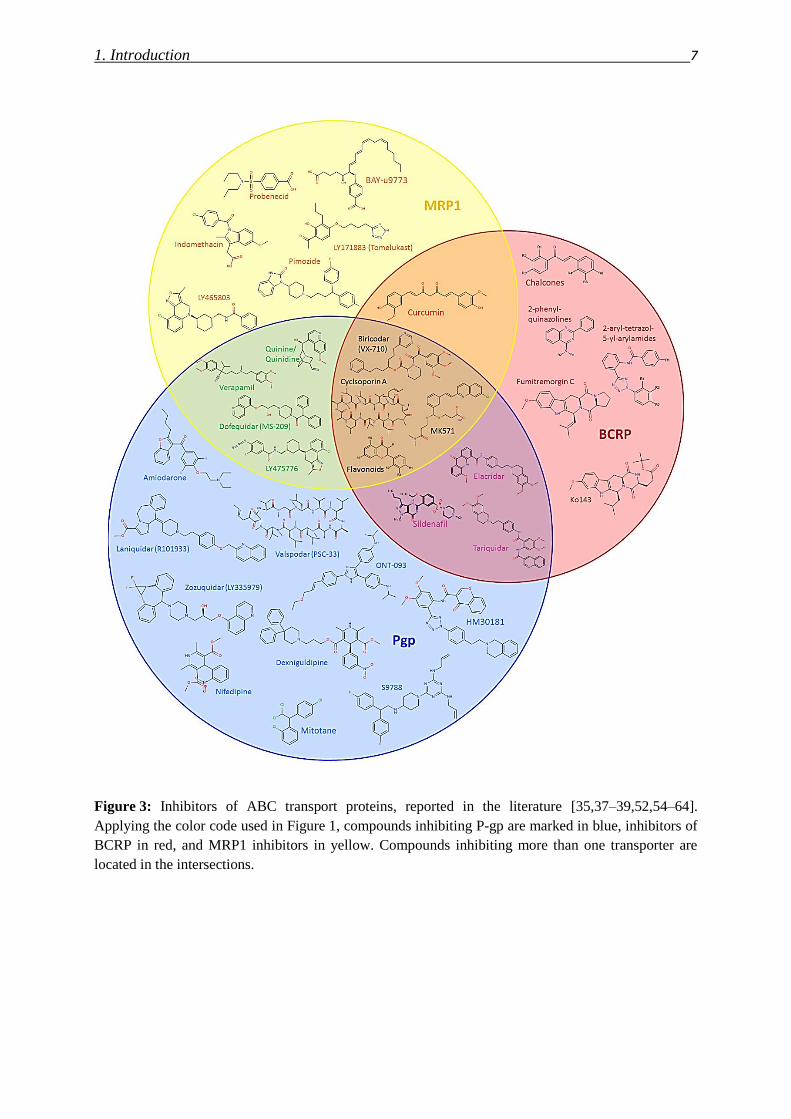
As summarized in Figure 4, further strategies to overcome ABC-transporter mediated MDR
exist next to the inhibition of the transporters, which might “engage” the transporter. Another
approach is, to develop compounds that do not interact with the transport protein and
therefore “evade” it. The third strategy employs compounds, which selectively kill the MDR
cells, “exploiting” vulnerabilities that are connected to the MDR phenotype.
Figure 4: Strategies to overcome ABC transporter mediated MDR (top) include “engaging” the
protein with the use of inhibitors (left), “evading” the transporter by the development of compounds
which are not recognized (down), and “exploiting” it, by application of collateral sensitivity [9].
1.4. Collateral sensitivity – in search for the Achilles’ heel
The term “collateral sensitivity” (CS) was first used by Szybalski and Bryson in 1952 to
describe the increased sensitivity of Escherichia coli bacteria strains treated with a certain
chemotherapeutic agent toward other, unrelated antibiotics [65].
Similarly, many reports can be found on MDR cancer cells exhibiting an – compared to their
parental cell lines – enhanced sensitivity toward diverse compounds with distinct putative
mechanisms of action [41,42,66]. As insinuated in chapter 1.1. the adaption processes that
occur during the development of the MDR phenotype comprise numerous cellular changes,
which, next to the benefit of survival in the presence of chemotherapeutic agents, may also
provide vulnerable target points for the selective elimination of MDR cells [42]. For example,
an increased drug metabolizing activity of MDR cells might result in a higher activation of
xenobiotics, as observed for the natural product austocystin D. It has been shown, that the
1. Introduction 9
enhanced P-gp expression in cell lines collateral sensitive to austocystin D is rather
coincidental, since the selective toxicity of the compound toward MDR cell lines arises from
its selective activation by cytochrome P450 (CYP) enzymes in specific cancer cell lines [67].
In contrast, in many cases ABC transporters have been reported to mediate paradoxical
hypersensitivity by different mechanisms. One possible explanation could be that an MDR
selective agent facilitates or stimulates the extrusion of an endogenous essential molecule
by the transporter [66]. In case of MRP1 mediated collateral sensitivity, an enhanced toxicity
of compounds might be explained by the (co-)transport of glutathione and glutathione-drug
conjugates by the transporter: an enhanced export of this antioxidant will disturb the
intracellular redox-homeostasis to a higher extent in the transporter expressing cells as
compared to the parental cell lines, causing a higher extent of oxidative stress and cellular
damage [68]. Since GSH is not a substrate of P-gp, this mechanism might not apply for the
multiple cases of reported collateral sensitivity in cells, in which P-gp is responsible for the
MDR phenotype of investigated cells [69].
The first reports on collateral sensitivity in P-gp expressing cells cover compounds that
disrupt the plasma membrane, like the detergent Triton X-100 [70]. Similarly, several
opiates induced collateral sensitivity that was related to fluidizing effects on membrane
biophysical properties of P-gp expressing cells [71]. Since P-gp requires interaction with
phospholipids for continuous drug-mediated ATPase activity and interaction with the
substrate, a disruption of the plasma membrane will also affect the activity of the transport
protein [72,73]. Even though differences in the biophysical properties of plasma membranes
of drug-sensitive and MDR cells could be confirmed on a panel of cell lines, the increased
toxic effect of Triton-X-100 on P-gp expressing cells could not be verified in a tetracycline-
repressible (tet-off) plasmid system, in which P-gp expression was repressed upon treatment
with tetracycline [74]. A further example of membrane perturbing agents causing collateral
sensitivity is given by the block-copolymers Pluronic P85 and P105. A possible interaction of
such a polymer with the lipid raft region, the micro domain of the cellular membrane
surrounding P-gp, is shown in Figure 5. As stated above, this interaction will inhibit the
function of P-gp, and therefore sensitize MDR cell lines toward cytotoxic drugs [73].
10
Figure 5: Cellular membrane with incorporated P-gp in the absence (left) and presence (right) of a
Pluronic block-copolymer (blue / intense red). The intracellular lumen is located below the membrane,
which is shown in Top (top) and side angle (below) view. P-gp (blue) is embedded in the membrane
containing phospholipids with mainly unsaturated fatty acids (grey) in a micro domain called lipid
raft. Lipid rafts contain cholesterol (red) and sphingomyelin (orange) – modified from [73].
In addition to the effect on the cellular membrane, Pluronic co-polymers P85 and P105 have
been reported to decrease cellular ATP pools in MDR cells, but not in their parental
counterparts [75,76]. The resulting sensitizing effect of Pluronics toward cytotoxic agents
could be abolished by ATP supplementation [75]. It has been described that the block co-
polymers differentially affect the mitochondrial functions in MDR and non-MDR cells,
evoking an increased toxicity in P-gp expressing cells [76]. Even though the lower
mitochondrial membrane potential found in MDR cells as compared to parental cells might
explain the intrinsically increased sensitivity of the MDR cells toward the co-polymers, two
evidences suggest a role of P-gp in this effect [13,76]: the higher responsiveness of the
respiratory chain of MDR cells is not only abrogated in the presence of the P-gp inhibitor
Elacridar, but also not only observed in drug-selected MDR cells, but also in cells transfected
with P-gp [76].
Due to the energy dependence of the efflux by ABC transporters, P-gp-expressing cells might
be more sensitive to compounds that interfere with cellular metabolic pathways and therefore
cause changes in energy utilization [66]. Yet, the interaction of a compound with the cellular
metabolic pathways does not necessarily require it’s interaction with P-gp. An increased
sensitivity to changes in energy levels of MDR cells might explain the preferentially killing
1. Introduction 11
of MDR cells by the antimetabolites, like 2-deoxy-d-glucose, and the electron transport chain
inhibitors rotenone and antimycin A [66,77,78].
Figure 6: Structures of compounds with reports on CS (for details, see text).
Since the first reports about application in MDR cancer cells due to the interaction with P-gp
in 1981 [47], the Ca2+
-channel blocker Verapamil has received a lot of attention. At lower
concentrations Verapamil is a (“nontransported”) P-gp substrate, which has an ATP depleting
effect on MDR cells due to a rapid cyclical efflux, re-entry and efflux (“futile cycling”,
Figure 6) [14,15,41,79]. This elevated energy depletion in P-gp expressing cells might be a
possible explanation for the differential effect on cell viability of MDR and non MDR
Chinese Hamster ovary (CHO) cells, which was already reported as early as 1986 [80]. Also
in other cell line models Verapamil preferentially induced apoptosis in MDR cells compared
to drug-sensitive cells [81,82]. A biphasic effect was observed for the effect of Verapamil on
P-gp ATPase activity and cell viability: while at lower concentrations the ATPase activity was
stimulated (in agreement with Verapamil being transported out of the cell), at higher
concentrations it was inhibited. Similarly the induction of apoptosis followed a biphasic trend
[82,83]. Even though increased glycolysis has been suggested as the compensation of higher
12
energy demands due to the “futile cycling” [15–17], reactive oxygen species (ROS), which
might occur as side products of oxidative phosphorylation, have been suggested to be
involved in the apoptosis induction by Verapamil [82]. An increased production of ROS is a
further suggested putative mechanism of increased toxicity toward MDR cell lines [42,66].
ROS might also have other sources and causes than futile cycling of P-gp substrates. For
example the N-(2-mercaptopropionyl)glycine Tiopronin has been reported to possess
enhanced (but still not very high) toxicity toward a subset of (but not all investigated) MDR
cell lines expressing P-gp and MRP1 [84]. While inhibiting MRP1, Tiopronin has no impact
on the function of P-gp [84]. In case of P-gp expressing cell lines, inhibition of the transporter
by Tariquidar did not alter the activity of the compound [84]. Together with the cell line
specificity of the effect this suggests, that the collateral sensitivity of MDR cells toward
Tiopronin might be linked to other factors than P-gp. Follow up studies revealed, that the
enhanced toxicity toward certain MDR cell lines is indeed linked to the inhibition of
glutathione peroxidase (GPx), to which Tiopronin covalently binds [85]. In agreement with
this, the addition of the ROS scavenger N-acetylcysteine (NAC) protected the investigated
cells from Tiopronin induced toxicity [85].
Likewise, chelators might induce ROS upon formation of redox active metal complexes [86–
89]. A paradoxical hypertoxicity against the Vinblastine selected P-gp-overexpressing cervix
carcinoma cell line KB-V1 as compared to its parental cell line KB-3-1 has been reported for
the thiosemicarbazone metal chelator di-2-pyridylketone-4,4,-dimethyl-3-thiosemicarbazone
(Dp44mT) [86,90]. The lysosomal accumulation of the redox active copper complex of the
ligand might be involved in the mechanism of toxicity of this ligand [87]. It has been
suggested, that lysosomal P-gp might contribute to this mechanism, explaining a potential
hypersensitivity [90]. Yet, experiments performed on different cell lines suggested, that this
effect might not be generalized, as only a weak correlation could be found between the
sensitivity of investigated cell lines toward the P-gp substrate Doxorubicin and Dp44mT
(based on data of Supplement from [86]).
Further compounds with remarkably enhanced toxicity toward a P-gp expressing cell line,
namely the Vincristine selected KB-VIN cell line, are derivatives of the natural product
Desmosdumotin B, which was isolated from the root Desmos dumosus [91]. While the parent
compound 5-hydroxy-7-one-6,8,8-trimethylflavone, already showed a 20-fold higher activity
in KB-VIN cells, than in KB-3-1 cells [92], derivatives were designed in order to increase the
selectivity. The three 6,8,8-triethyl analogues proved to be especially promising, with 4’
alkylated derivatives possessing up to 460-fold higher toxicity in the MDR cell line [93,94].
1. Introduction 13
The P-gp dependence of this effect was investigated by co-administration of Verapamil,
which partially reversed the selectivity of Desmosdumotin B and the triethyl-derivative
(TEDB). Despite this promising data, the effect was stated to be not generally linked to P-gp,
but rather restricted to only a few cell lines [93,94].
A promising strategy to find compounds that might exploit MDR in a P-gp dependent manner
is based on a pharmacogenomic approach which utilizes publically available data from the
Developmental Therapeutics Program (DTP) of the National Cancer Institute (NCI) [95–97].
With the help of this tool, the gene expression profiles of human ABC transporters were
correlated with patterns of drug activity within the NCI60 cell line panel [95,96]. These 60
cell lines represent tumor types from different origin, including leukemia, colon, lung, central
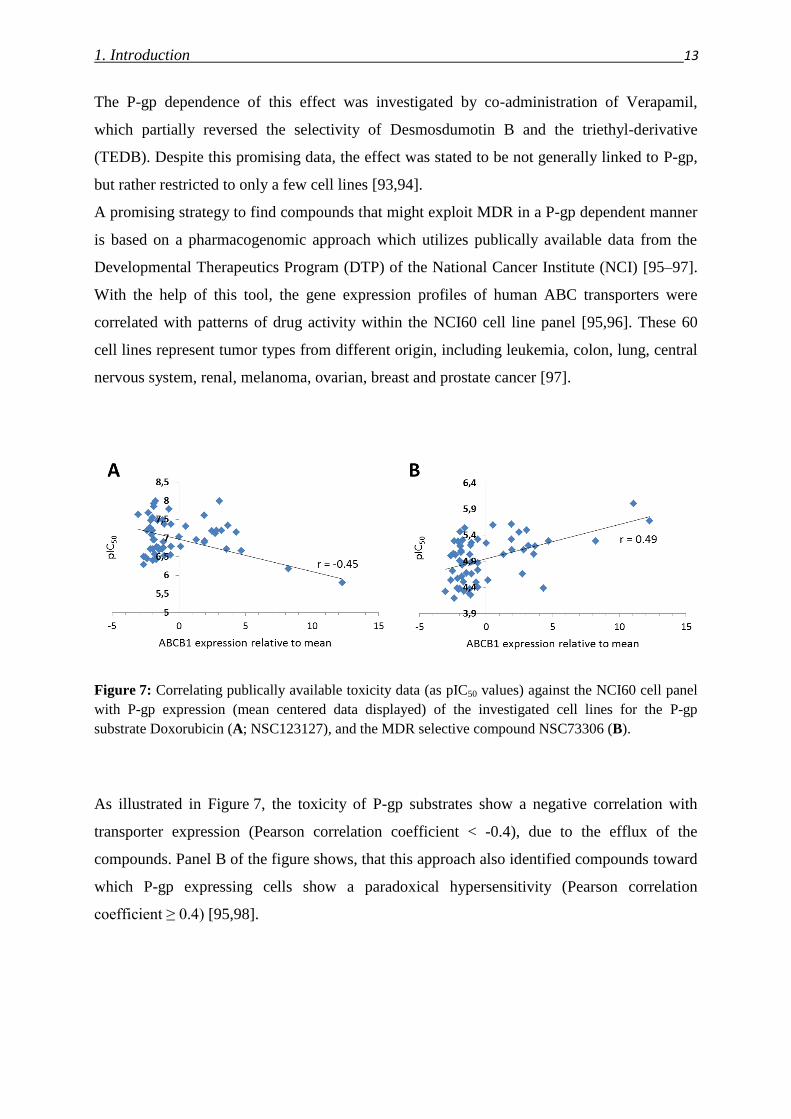
nervous system, renal, melanoma, ovarian, breast and prostate cancer [97].
Figure 7: Correlating publically available toxicity data (as pIC50 values) against the NCI60 cell panel
with P-gp expression (mean centered data displayed) of the investigated cell lines for the P-gp
substrate Doxorubicin (A; NSC123127), and the MDR selective compound NSC73306 (B).
As illustrated in Figure 7, the toxicity of P-gp substrates show a negative correlation with
transporter expression (Pearson correlation coefficient < -0.4), due to the efflux of the
compounds. Panel B of the figure shows, that this approach also identified compounds toward
which P-gp expressing cells show a paradoxical hypersensitivity (Pearson correlation
coefficient ≥ 0.4) [95,98].
14
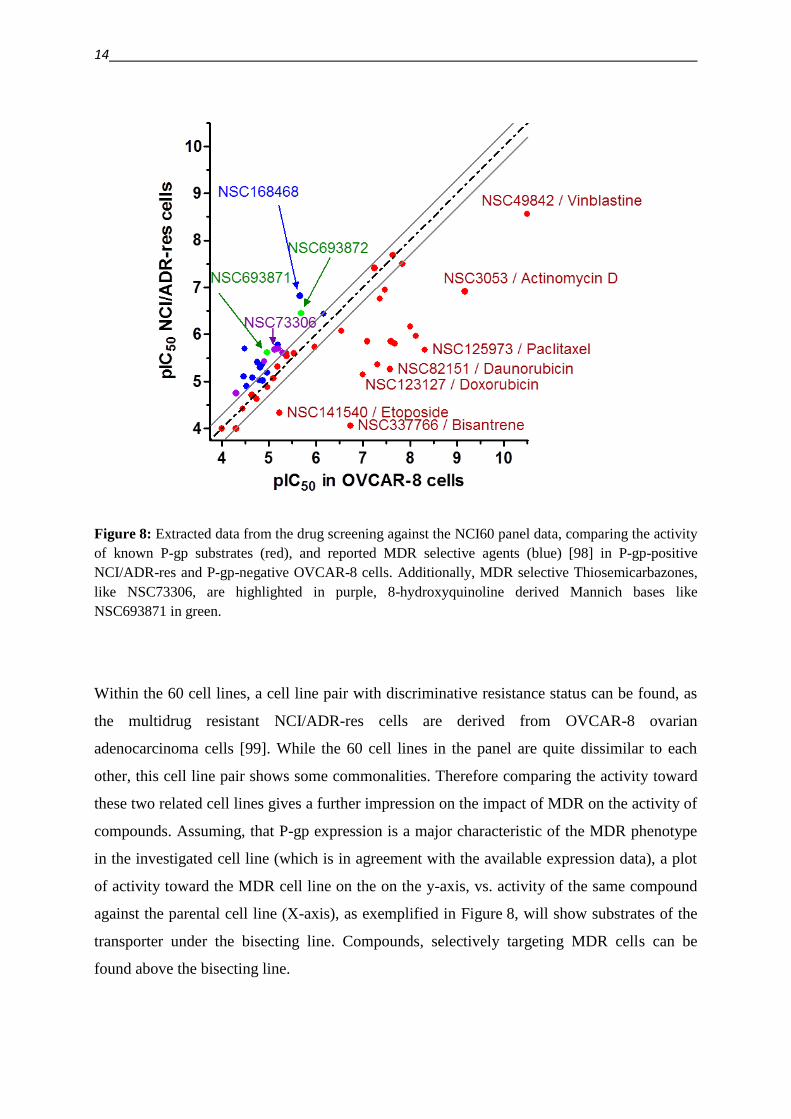
Figure 8: Extracted data from the drug screening against the NCI60 panel data, comparing the activity
of known P-gp substrates (red), and reported MDR selective agents (blue) [98] in P-gp-positive
NCI/ADR-res and P-gp-negative OVCAR-8 cells. Additionally, MDR selective Thiosemicarbazones,
like NSC73306, are highlighted in purple, 8-hydroxyquinoline derived Mannich bases like
NSC693871 in green.
Within the 60 cell lines, a cell line pair with discriminative resistance status can be found, as
the multidrug resistant NCI/ADR-res cells are derived from OVCAR-8 ovarian
adenocarcinoma cells [99]. While the 60 cell lines in the panel are quite dissimilar to each
other, this cell line pair shows some commonalities. Therefore comparing the activity toward
these two related cell lines gives a further impression on the impact of MDR on the activity of
compounds. Assuming, that P-gp expression is a major characteristic of the MDR phenotype
in the investigated cell line (which is in agreement with the available expression data), a plot
of activity toward the MDR cell line on the on the y-axis, vs. activity of the same compound
against the parental cell line (X-axis), as exemplified in Figure 8, will show substrates of the
transporter under the bisecting line. Compounds, selectively targeting MDR cells can be
found above the bisecting line.
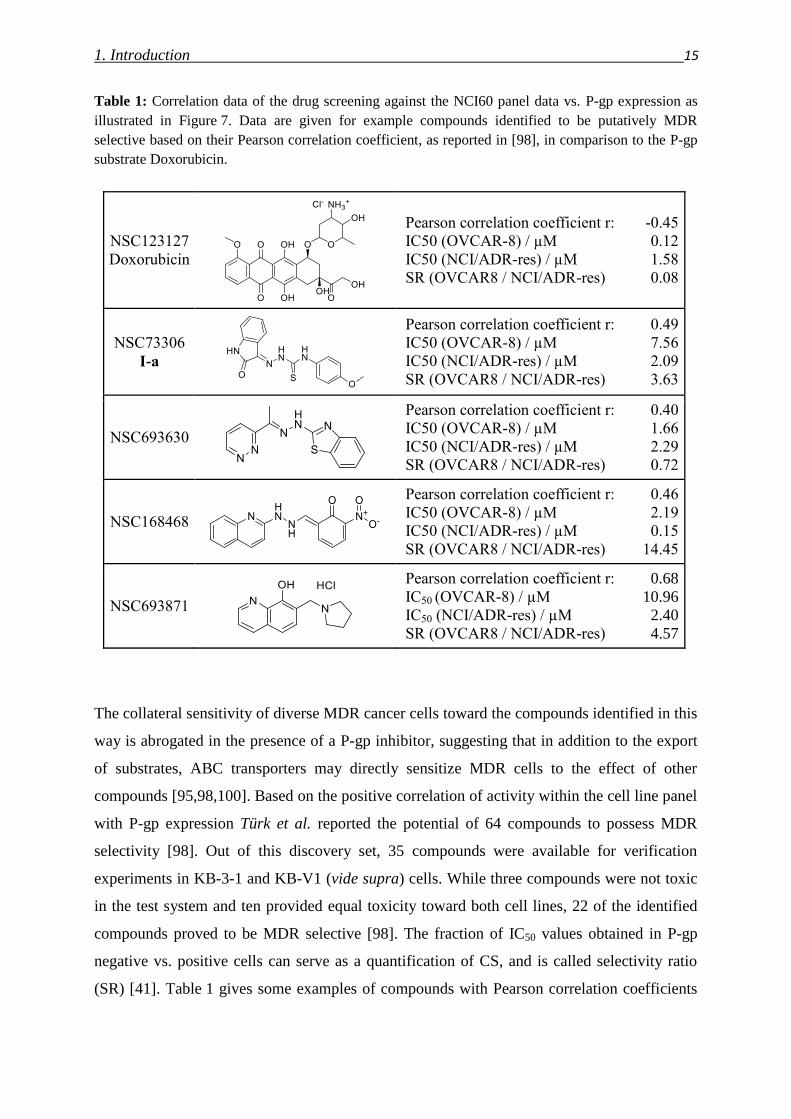
1. Introduction 15
Table 1: Correlation data of the drug screening against the NCI60 panel data vs. P-gp expression as
illustrated in Figure 7. Data are given for example compounds identified to be putatively MDR
selective based on their Pearson correlation coefficient, as reported in [98], in comparison to the P-gp
substrate Doxorubicin.
NSC123127
Doxorubicin
Pearson correlation coefficient r: -0.45
IC50 (OVCAR-8) / µM 0.12
IC50 (NCI/ADR-res) / µM 1.58
SR (OVCAR8 / NCI/ADR-res) 0.08
NSC73306
I-a
Pearson correlation coefficient r: 0.49
IC50 (OVCAR-8) / µM 7.56
IC50 (NCI/ADR-res) / µM 2.09
SR (OVCAR8 / NCI/ADR-res) 3.63
NSC693630
Pearson correlation coefficient r: 0.40
IC50 (OVCAR-8) / µM 1.66
IC50 (NCI/ADR-res) / µM 2.29
SR (OVCAR8 / NCI/ADR-res) 0.72
NSC168468
Pearson correlation coefficient r: 0.46
IC50 (OVCAR-8) / µM 2.19
IC50 (NCI/ADR-res) / µM 0.15
SR (OVCAR8 / NCI/ADR-res) 14.45
NSC693871
Pearson correlation coefficient r: 0.68
IC50 (OVCAR-8) / µM 10.96
IC50 (NCI/ADR-res) / µM 2.40
SR (OVCAR8 / NCI/ADR-res) 4.57
The collateral sensitivity of diverse MDR cancer cells toward the compounds identified in this
way is abrogated in the presence of a P-gp inhibitor, suggesting that in addition to the export
of substrates, ABC transporters may directly sensitize MDR cells to the effect of other
compounds [95,98,100]. Based on the positive correlation of activity within the cell line panel
with P-gp expression Türk et al. reported the potential of 64 compounds to possess MDR
selectivity [98]. Out of this discovery set, 35 compounds were available for verification
experiments in KB-3-1 and KB-V1 (vide supra) cells. While three compounds were not toxic
in the test system and ten provided equal toxicity toward both cell lines, 22 of the identified
compounds proved to be MDR selective [98]. The fraction of IC50 values obtained in P-gp
negative vs. positive cells can serve as a quantification of CS, and is called selectivity ratio
(SR) [41]. Table 1 gives some examples of compounds with Pearson correlation coefficients
16
calculated from the drug effects over the NCI60 cell panel against the P-gp expression, as
well as IC50 and SR values comparing the toxicity toward ovarian carcinoma cells OVCAR-8
(P-gp negative) and NCI/ADR-res (P-gp positive). The well-known P-gp substrate
Doxorubicin gives a negative correlation coefficient and an inverse (< 1) SR [8,10,35,37,101],
while the confirmed MDR selective agents NSC73306 [95,98,100,102,103] and NSC168468
[98] show positive correlations and a SR higher than two.
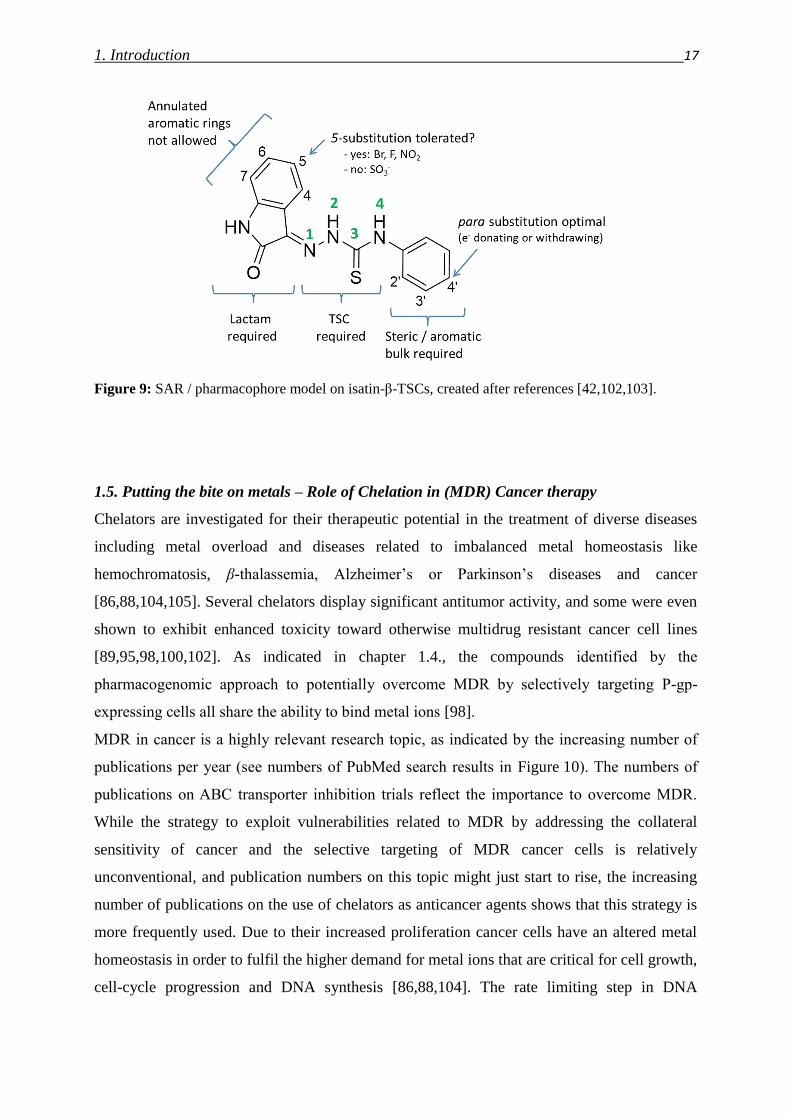
Despite of showing some degree of diversity, the compounds identified by the pharmaco-
genomic approach share the ability to chelate metal ions. Strikingly, an enrichment in isatin-β-
thiosemicarbazone structures like NSC73306 can be found (9 out of the 64 potentially MDR
selective compounds) [95,98,100,102,103]. Several attempts have been made to identify the
structural features of isatin-β-thiosemicarbazones that are responsible for the MDR selective
activity. The major findings, that resulted in a pharmacophore model are summarized in
Figure 9 [102]. The thiosemicarbazone (TSC) scaffold is required for the selective toxicity
toward MDR cell lines: replacement of the sulfur to oxygen significantly decreases toxicity
[102,103]. Likewise, a bulky or aromatic moiety appears to be required at the N4 of the TSC
moiety (counting of atoms in the TSC moiety according to green numbers) [42,102,103]. This
aromatic moiety might be substituted at positions 2’, 3’ or 4’, out of which the para
substitution (4’) was found to be optimal, while ortho (2’) and meta (3’) substitutions have
been concluded to be not beneficial [42]. Although the available data on ortho and meta
substituted aromatic rings might not be sufficiently convincing, to definitely exclude the
activity of these compounds, since many of those reported compounds show multiple
substitutions on the aromatic ring. For chloro-substitutions, the meta substituted derivative
was even superior to the para one, in terms of toxicity, while being equally selective [103].
The isatin moiety – or at least the lactam – seems to be necessary for selective activity. An
extension of the aromatic ring system disrupts activity, while substitution at the 5th position
might be tolerated in case of halogens or a nitro-group, but not in case of a sulfonate, which
might be explained by a reduced cell permeability of the resulting negatively charged
molecule [102].
1. Introduction 17
Figure 9: SAR / pharmacophore model on isatin-β-TSCs, created after references [42,102,103].
1.5. Putting the bite on metals – Role of Chelation in (MDR) Cancer therapy
Chelators are investigated for their therapeutic potential in the treatment of diverse diseases
including metal overload and diseases related to imbalanced metal homeostasis like
hemochromatosis, β-thalassemia, Alzheimer’s or Parkinson’s diseases and cancer
[86,88,104,105]. Several chelators display significant antitumor activity, and some were even
shown to exhibit enhanced toxicity toward otherwise multidrug resistant cancer cell lines
[89,95,98,100,102]. As indicated in chapter 1.4., the compounds identified by the
pharmacogenomic approach to potentially overcome MDR by selectively targeting P-gp-
expressing cells all share the ability to bind metal ions [98].
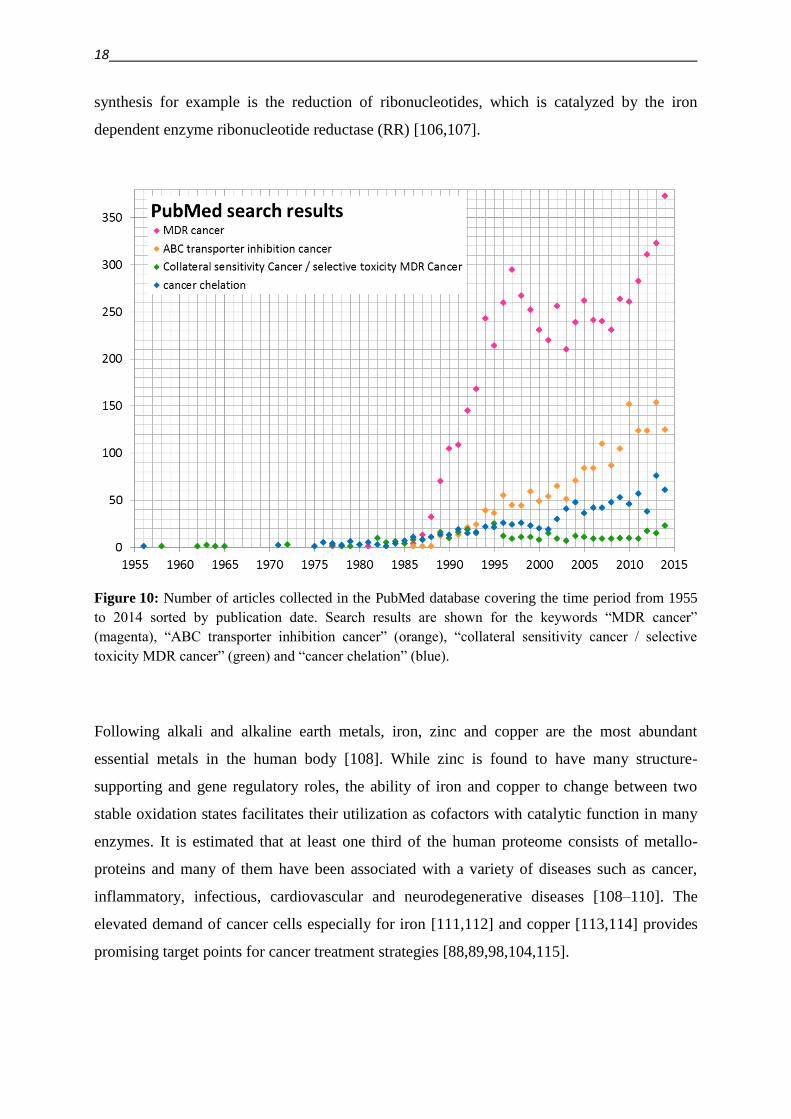
MDR in cancer is a highly relevant research topic, as indicated by the increasing number of
publications per year (see numbers of PubMed search results in Figure 10). The numbers of
publications on ABC transporter inhibition trials reflect the importance to overcome MDR.
While the strategy to exploit vulnerabilities related to MDR by addressing the collateral
sensitivity of cancer and the selective targeting of MDR cancer cells is relatively
unconventional, and publication numbers on this topic might just start to rise, the increasing
number of publications on the use of chelators as anticancer agents shows that this strategy is
more frequently used. Due to their increased proliferation cancer cells have an altered metal
homeostasis in order to fulfil the higher demand for metal ions that are critical for cell growth,
cell-cycle progression and DNA synthesis [86,88,104]. The rate limiting step in DNA
18
synthesis for example is the reduction of ribonucleotides, which is catalyzed by the iron
dependent enzyme ribonucleotide reductase (RR) [106,107].
Figure 10: Number of articles collected in the PubMed database covering the time period from 1955
to 2014 sorted by publication date. Search results are shown for the keywords “MDR cancer”
(magenta), “ABC transporter inhibition cancer” (orange), “collateral sensitivity cancer / selective
toxicity MDR cancer” (green) and “cancer chelation” (blue).
Following alkali and alkaline earth metals, iron, zinc and copper are the most abundant
essential metals in the human body [108]. While zinc is found to have many structure-
supporting and gene regulatory roles, the ability of iron and copper to change between two
stable oxidation states facilitates their utilization as cofactors with catalytic function in many
enzymes. It is estimated that at least one third of the human proteome consists of metallo-
proteins and many of them have been associated with a variety of diseases such as cancer,
inflammatory, infectious, cardiovascular and neurodegenerative diseases [108–110]. The
elevated demand of cancer cells especially for iron [111,112] and copper [113,114] provides
promising target points for cancer treatment strategies [88,89,98,104,115].
1. Introduction 19
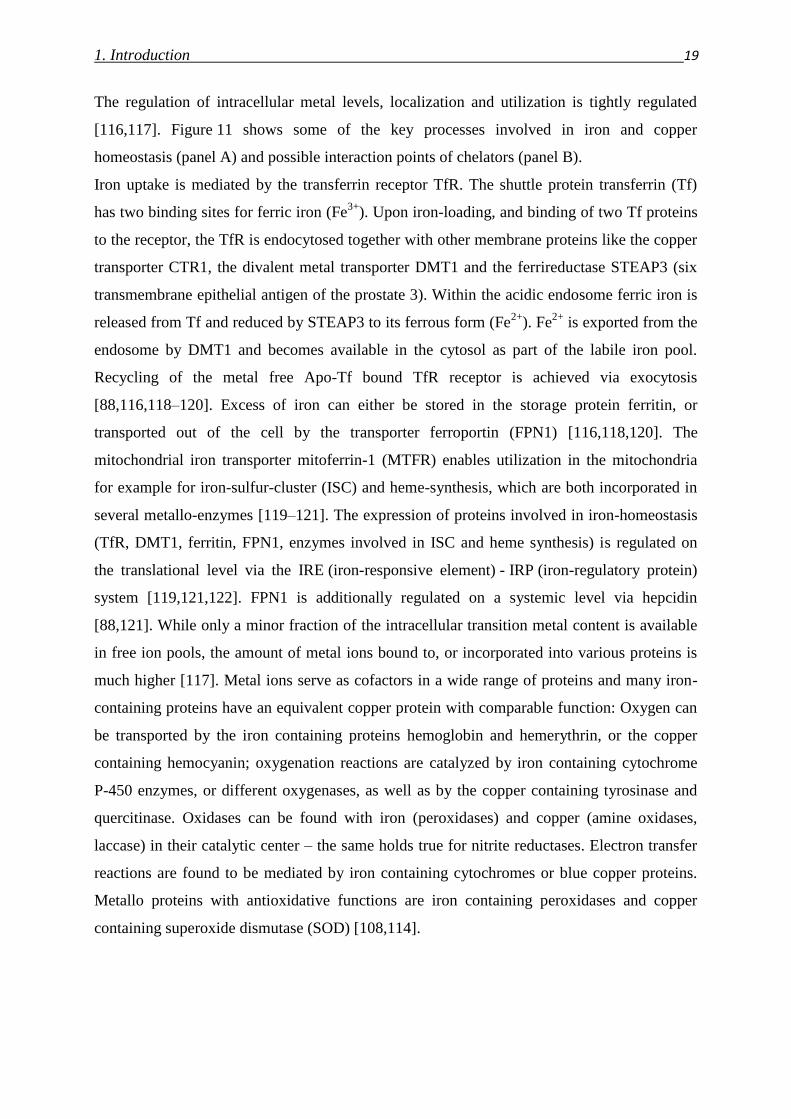
The regulation of intracellular metal levels, localization and utilization is tightly regulated
[116,117]. Figure 11 shows some of the key processes involved in iron and copper
homeostasis (panel A) and possible interaction points of chelators (panel B).
Iron uptake is mediated by the transferrin receptor TfR. The shuttle protein transferrin (Tf)
has two binding sites for ferric iron (Fe3+
). Upon iron-loading, and binding of two Tf proteins
to the receptor, the TfR is endocytosed together with other membrane proteins like the copper
transporter CTR1, the divalent metal transporter DMT1 and the ferrireductase STEAP3 (six
transmembrane epithelial antigen of the prostate 3). Within the acidic endosome ferric iron is
released from Tf and reduced by STEAP3 to its ferrous form (Fe2+
). Fe2+
is exported from the
endosome by DMT1 and becomes available in the cytosol as part of the labile iron pool.
Recycling of the metal free Apo-Tf bound TfR receptor is achieved via exocytosis
[88,116,118–120]. Excess of iron can either be stored in the storage protein ferritin, or
transported out of the cell by the transporter ferroportin (FPN1) [116,118,120]. The
mitochondrial iron transporter mitoferrin-1 (MTFR) enables utilization in the mitochondria
for example for iron-sulfur-cluster (ISC) and heme-synthesis, which are both incorporated in
several metallo-enzymes [119–121]. The expression of proteins involved in iron-homeostasis
(TfR, DMT1, ferritin, FPN1, enzymes involved in ISC and heme synthesis) is regulated on
the translational level via the IRE (iron-responsive element) - IRP (iron-regulatory protein)
system [119,121,122]. FPN1 is additionally regulated on a systemic level via hepcidin
[88,121]. While only a minor fraction of the intracellular transition metal content is available
in free ion pools, the amount of metal ions bound to, or incorporated into various proteins is
much higher [117]. Metal ions serve as cofactors in a wide range of proteins and many iron-
containing proteins have an equivalent copper protein with comparable function: Oxygen can
be transported by the iron containing proteins hemoglobin and hemerythrin, or the copper
containing hemocyanin; oxygenation reactions are catalyzed by iron containing cytochrome
P-450 enzymes, or different oxygenases, as well as by the copper containing tyrosinase and
quercitinase. Oxidases can be found with iron (peroxidases) and copper (amine oxidases,
laccase) in their catalytic center – the same holds true for nitrite reductases. Electron transfer
reactions are found to be mediated by iron containing cytochromes or blue copper proteins.
Metallo proteins with antioxidative functions are iron containing peroxidases and copper
containing superoxide dismutase (SOD) [108,114].
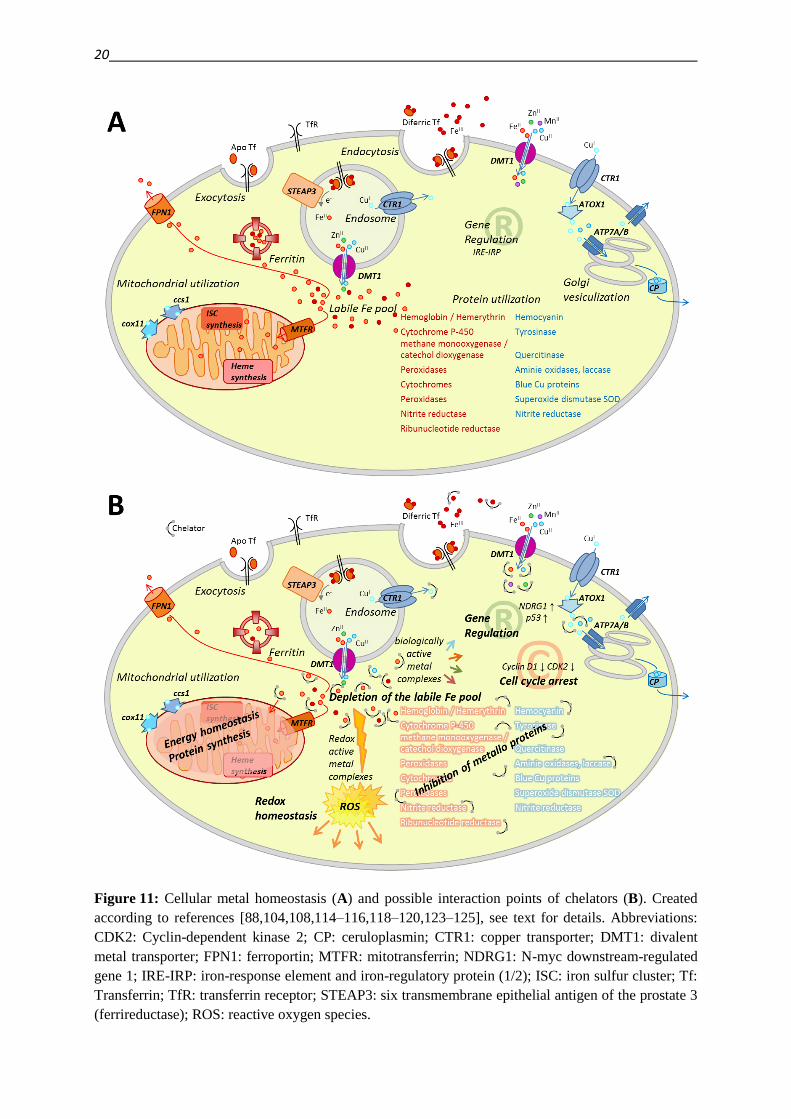
20
Figure 11: Cellular metal homeostasis (A) and possible interaction points of chelators (B). Created
according to references [88,104,108,114–116,118–120,123–125], see text for details. Abbreviations:
CDK2: Cyclin-dependent kinase 2; CP: ceruloplasmin; CTR1: copper transporter; DMT1: divalent
metal transporter; FPN1: ferroportin; MTFR: mitotransferrin; NDRG1: N-myc downstream-regulated
gene 1; IRE-IRP: iron-response element and iron-regulatory protein (1/2); ISC: iron sulfur cluster; Tf:
Transferrin; TfR: transferrin receptor; STEAP3: six transmembrane epithelial antigen of the prostate 3
(ferrireductase); ROS: reactive oxygen species.
1. Introduction 21
In order to supply the cellular demands on copper, uptake of cuprous copper (Cu+) is
regulated via the copper transporter CTR1, while cupric copper (Cu2+
) is taken up by DMT1.
Specific chaperones distribute copper to its target proteins: Ccs1 facilitates the incorporation
of copper into SOD, cox11 delivers copper for the synthesis of cytochrome c oxidase and
ATOX1 enables transportation by the ATPases ATP7A and B out of the cells or into the
secretory trans-Golgi apparatus [116,118]. In the Golgi apparatus, copper is sequestered and
incorporated into ceruloplasmin and exported out of the cell, where it acts as a ferroxidase
[114,116,126,127].
The incorporation of metal ions in several metallo proteins provides a broad spectrum of
possible targets for chelators. Panel B of Figure 11 summarizes some general mechanisms by
which chelators might interfere with the metal homeostasis. Triapine, a tridentate α-N-pyridyl
thiosemicarbazone, is a prominent example for a chelator, inhibiting the metallo-enzyme
ribonucleotide reductase (RR). Triapine is currently undergoing different phase I and II
clinical trials [128]. In its mechanism of inhibition the chelation by Triapine will not only lead
to the withdrawal of the necessary iron from the enzyme, but also result in redox active
complexes, which interfere with the intra-enzymatical electron transfer of the enzyme. The
electron transfer from subunit R2 (which contains a tyrosyl radical and a diiron center) to
subunit R1 (which harbors the catalytically active center) is pivotal for the function of the
enzyme [106,129,130].
Next to their impact on DNA synthesis, chelators have been reported to result in cell cycle
arrest via the down-regulation of Cyclin D1 and cyclin-dependent kinase 2 (CDK2)
[88,115,131,132]. Furthermore, they regulate tumor suppressors like p53 and metastasis
suppressors like the N-myc downstream regulated gene-1 (NDRG1) are down
[88,115,131,133]. Iron depletion can foster apoptosis by up-regulation of the pro-apoptotic
protein Bax and downregulation of the anti-apoptotic Bcl-2 [131,134]. Interfering with the
IRE-IRP system, the expression of proteins involved in iron homeostasis will be regulated
[119,121,122]. By chelating, ligands might deprive the cells from essential metal ions and
deplete the labile iron pool [88,115]. Apart from the depleting effect, chelators might enable
the transfer of metal ions through membranes, and for example shuttle additional iron into
mitochondria [125]. Interfering with mitochondrial metal homeostasis, chelators might
influence energy homeostasis and protein synthesis. Formed complexes might also possess
biological activity, which is partially linked to their redox properties [87,124,135,136].
Copper complexes have been reported to intercalate into DNA [124,137,138], act as chemical
nucleases, cleaving DNA by oxidative [124,138–140] or hydrolytic [124,141–143]
22
mechanisms or inhibit topoisomerase [124,144] and the proteasome [124,145,146]. Forming
redox active complexes, chelators might enhance the production of reactive oxygen species,
which might cause cellular damage, as addressed in detail in chapter 1.5. [88,115,116].
Several chelator classes have been described as pan assay interference compounds (PAINs).
In a wide range of target-based assays, covering ion channels, enzymes, and protein-protein-
interactions, these compounds have been reported to be problematic due to their reactivity,
spectroscopic properties and the ability to form metal complexes as well as aggregates
[147,148]. Redox active compounds might interfere with proteins, and by inactivating the
target lead to false positive results [148]. Still in the areas of oncology, microbiology, and
parasitology, reactive, photosensitive, and redox-active compounds may be particularly suited
for therapeutic uses [147]. Often, in these areas the exact target of chelators is not known, and
therefore the phenotypic drug discovery strategy is applied, where little assumptions are made
concerning the participation of specific molecular targets and/or signaling pathways. Instead,
compounds are investigated in complex biological systems and compound induced
physiological responses or phenotypes are monitored in cells, tissues or whole organisms
[149,150]. The induction of cell death upon treatment with a certain compound can be seen as
a phenotypic effect [150].
1.6. Keeping the balance on a double edged sword – ROS
Reactive oxygen species (ROS) appear naturally as side products in the metabolism of aerobic
organisms [113,116,151]. The main sources for cellular ROS are the complexes I and III
(MCX-I, MCI-III) in the mitochondrial electron transport chain [152–155], as well as NADH
cytochrome c reductase and cytochrome P-450 enzymes in the endoplasmatic reticulum (ER)
[153,156], and oxidases (OX) like the membrane associated NADPH oxidases (NOX)
[152,156]. The particular reactive species that can be found are oxygen containing radicals
like the superoxide anion (O2-·), hydroperoxyl (HOO
·), or other peroxyl radicals (ROO
·), the
hydroxyl radical (·OH), nitric oxide (
·NO), and other species like hydrogen peroxide (H2O2),
singlet oxygen (1O2), hypochlorous acid (HOCl) and peroxynitrite (ONOO
-) [151,157]. Also
diverse radicals are formed by hydrogen abstraction (R·) [151]. Out of these the three most
physiologically relevant (with increasing reactivity) are hydrogen peroxide (H2O2), the
superoxide anion (O2-·) and the hydroxyl radical (
·OH) [116]. With a reduction potential of a
1-molar (oxidized and reduced form) solution at physiological pH of E°’ = 0.32 V, H2O2 is
1. Introduction 23
the weakest oxidizing agent of the three. Its reactivity is comparably poor, but it is highly
diffusible and able to cross cellular membranes, which renders it the most efficient signal
messenger and physiological regulator [113,116,153,158]. The superoxide radical O2-· cannot
cross cellular membranes freely, but can utilize ion channels for its translocation. It has a
redox potential of E°’ = 0.94 V and its inherent reactivity at physiological pH is relatively
low, though it causes cellular damage mainly due to further reactions [116]. The hydroxyl
radical, on the contrary is the most reactive of the three species, reacting on a diffusion
limited manner [116,153,159]. With E°’ = 2.31 V its reduction potential is the highest of the
three species [116].
Reactive oxygen species can cause cellular damage by oxidizing biological macromolecules,
namely lipids, proteins, sugars and DNA [115,151–153,157]. The oxidation of lipids mainly
occurs as a consequence of reaction with the hydroxyl-radical, leading to the most common
final products malondialdehyde and 4-hydroxynonenal, which can furthermore react with
DNA bases, and cause mutations and DNA damage [113,155,160,161]. Since these species
can be deleterious especially at high concentration, cells have developed an antioxidant
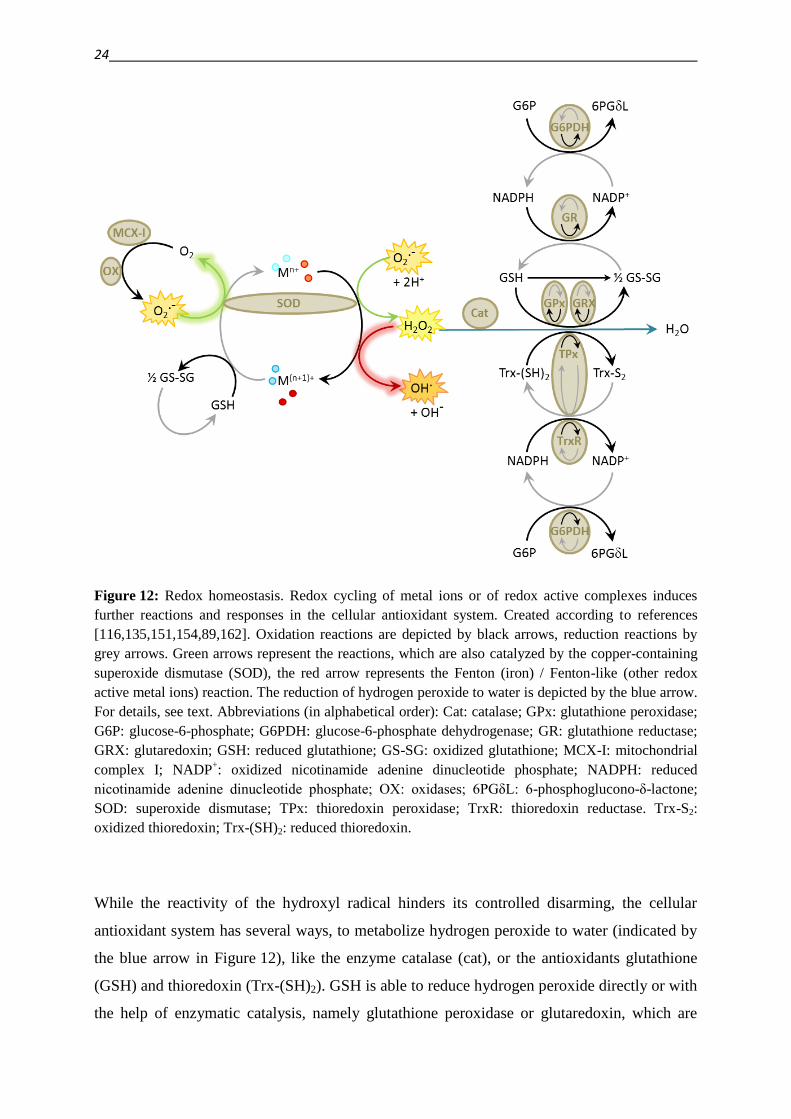
system in order to disarm them [116,151,152]. Parts of the enzymatic and non-enzymatic
antioxidant defense system are illustrated in Figure 12.
As indicated in chapter 1.4., metal and redox homeostasis are in tight connection
[86,104,113]. Redox active metal ions or complexes can trigger oxidative stress by increased
production of ROS via redox cycling [86]. On the other hand, this redox activity can be
exploited for example in the antioxidant copper-containing enzyme superoxide dismutase
(SOD), which catalyzes the disproportionation of superoxide (O2-·) to hydrogen peroxide
(H2O2) and molecular oxygen (O2), as indicated by the green arrows in Figure 12.
Likewise, these reactions can be catalyzed by metal ions or redox active complexes. Also the
subsequent production of the reactive hydroxyl radical, which occurs via the Fenton (in case
of iron) or Fenton-like (in case of other metal ions) reaction (red arrow in Figure 12), is
catalyzed by metal ions or complexes, as depicted by the red arrow. The Fenton reaction is
part of the so called Haber-Weiss reaction (indicated by highlighted arrows in Figure 12), that
describes the metal ion catalyzed reaction of hydrogen peroxide with superoxide
[86,104,113,116,121,135,151,154].
24
Figure 12: Redox homeostasis. Redox cycling of metal ions or of redox active complexes induces
further reactions and responses in the cellular antioxidant system. Created according to references
[116,135,151,154,89,162]. Oxidation reactions are depicted by black arrows, reduction reactions by
grey arrows. Green arrows represent the reactions, which are also catalyzed by the copper-containing
superoxide dismutase (SOD), the red arrow represents the Fenton (iron) / Fenton-like (other redox
active metal ions) reaction. The reduction of hydrogen peroxide to water is depicted by the blue arrow.
For details, see text. Abbreviations (in alphabetical order): Cat: catalase; GPx: glutathione peroxidase;
G6P: glucose-6-phosphate; G6PDH: glucose-6-phosphate dehydrogenase; GR: glutathione reductase;
GRX: glutaredoxin; GSH: reduced glutathione; GS-SG: oxidized glutathione; MCX-I: mitochondrial
complex I; NADP+: oxidized nicotinamide adenine dinucleotide phosphate; NADPH: reduced
nicotinamide adenine dinucleotide phosphate; OX: oxidases; 6PGδL: 6-phosphoglucono-δ-lactone;
SOD: superoxide dismutase; TPx: thioredoxin peroxidase; TrxR: thioredoxin reductase. Trx-S2:
oxidized thioredoxin; Trx-(SH)2: reduced thioredoxin.
While the reactivity of the hydroxyl radical hinders its controlled disarming, the cellular
antioxidant system has several ways, to metabolize hydrogen peroxide to water (indicated by
the blue arrow in Figure 12), like the enzyme catalase (cat), or the antioxidants glutathione
(GSH) and thioredoxin (Trx-(SH)2). GSH is able to reduce hydrogen peroxide directly or with
the help of enzymatic catalysis, namely glutathione peroxidase or glutaredoxin, which are
1. Introduction 25
themselves reduced by GSH [116,151,154,162]. As a result of these reactions, GSH is
oxidized to GSSG, which can be reduced by glutathione reductase (GR). The reducing power
for this reduction comes from NADPH (nicotinamide adenine dinucleotide phosphate), which
is itself reduced in the course of the oxidation of glucose-6-phosphate (G6P) to 6-
phosphoglucono-δ-lactone (6PGδL) by glucose-6-phosphate dehydrogenase (G6PDH)
[116,151,154,163] (reactions on top of the blue arrow in Figure 12).
The thioredoxin centered reducing system works in a similar manner. The reduction of
hydrogen peroxide by thioredoxin can be mediated by Trx-(SH)2 directly or via catalysis
through thioredoxin peroxidase (TPx). Unlike GPx, TPx can only be reduced by NADPH, like
the oxidized thioredoxin (Trx-S2) [116,151,152,154].
These several redox systems enable the cell to balance between oxidant and antioxidant
forces. The term “oxidative stress” therefore describes a disturbance of this balance [113,116].
While ROS at high concentrations are deleterious, their important roles in cellular functions
including activation and modulation of signal transduction pathways, as well as several redox-
sensitive transcription factors evidence the “two-faced” character of these species
[113,116,152,155,158,159,164]. Also the duration of the oxidative stress seems to be
important, as short lived redox changes, like transient and localized ROS production is
involved in normal growth factor signaling, while long-lived oxidative stress often leads to
cellular senescence [165].
Figure 13 illustrates some of the pathways that are activated by certain levels of reactive
oxygen species. Lower levels of (or short term exposure to) ROS have mainly pro-survival
effects, while increasing levels can lead to tumor promotion, proliferation and progression,
and finally to apoptosis or even necrosis [113,155].
Redox regulation of the pro-survival Nrf2 pathway works via disruption of the Keap1-Nrf2
(Kelch-like ECH-associated protein 1 – Nuclear factor (erythroid-derived 2)-like 2) - complex
that enables the translocation of Nrf2 to the nucleus, where it induces the transcription of
antioxidant enzymes. In association with Keap1, the transcription factor is subject to
ubiquitination and protein degradation [158,166,167]. Oxidative stress can furthermore induce
this pathway by activation of protein kinase C (PKC), which phosphorylates Nrf2 [167]. Also
the translocation of nuclear factor κB (NFκB) is activated by ROS. The kinases IκB-kinase
(IKK) and protein kinase D (PKD) catalyze the disruption of the complex formed by NFκB
with its inhibitor IκB (inhibitor of NFκB), allowing the translocation of the transcription
factor to the nucleus (and the degradation of IκB). Genes, that are regulated by NFκB include
26
anti-apoptosis factors like BcL2, the antioxidant enzyme SOD and ABC transporters
[21,152,158,166,167].
Figure 13: Examples for ROS-induced signaling pathways. While at low concentrations pro-survival
pathways are activated, high levels lead to apoptosis, or even necrosis. Figure created according to
[113,152,155,158,160,161,164,166–169]. Redox-responsive transcription factors (Nrf2, NFκB, p53)
are indicated by blue boxes, kinases are shown in boxes (green for pro-survival signaling, brown for
apoptotic signaling). Grey boxes surround inactive protein-complexes that are activated by kinases or
ROS. Arrows indicating pathways are colored in green for pro-survival or brown for apoptotic
signaling. Regulation of MDR associated genes is highlighted by a star. Abbreviations (in alphabetical
order): Akt1: threonine-protein kinase (PKB); ASK1: apoptosis signal-regulating kinase-1; Bad: Bcl-
2-associated death promoter; Bax: Bcl-2-associated X protein; GSTπ: Glutathione S-transferase π;
IκB: inhibitor of NFκB; IKK: IκB-kinase; JNK: c-Jun N-terminal kinase; Keap1: Kelch-like ECH-
associated protein 1; mTOR: mammalian target of rapamycin; NFκB: nuclear factor κB; Nrf2: Nuclear
factor (erythroid-derived 2)-like 2; PDK1: 3’-phosphoinositide-dependent kinase-1; PI3K:
phosphatidylinositol-3-kinase; PKC: protein kinase C; PKD: protein kinase D; PTEN:
phosphatidylinositol-3,4,5-trisphosphate 3-phosphatase; Trx: thioredoxin.
1. Introduction 27
Another pro-survival signaling induced by ROS is the activation of the threonine-protein
kinase Akt1, which is the result of a signaling cascade starting with the oxidative inhibition of
phosphatidylinositol-3,4,5-trisphosphate 3-phosphatase (PTEN) [152,166]. By activating
IKK, Akt1 also induces the NFκB pathway, leading to an increased expression of P-gp [21].
Furthermore activation of Akt1 down-regulates pro-apoptosis factors, partially through a
crosstalk to the apoptosis signal-regulating kinase ASK1 [21,152,166].
ASK1 is involved in apoptosis signaling. Under non-stress conditions it is associated to
thioredoxin (Trx), which renders the protein inactive. Upon oxidation, Trx undergoes
conformational changes that lead to activation of ASK1 [152,164,166,168]. As a consequence
of ASK1 activation, mitochondrial cytochrome C is released, which activates caspases 9 and 3
and leads to apoptosis [168]. Next to the direct mitochondrial cytochrome C release, ASK1
can also activate p53, which in turn phosphorylates the pro-apoptotic Bcl-2-associated X
protein (Bax), enabling it to induce cytochrome C release [168].
Activation of ASK1 can also lead to the activation of c-Jun N-terminal kinase (JNK), which
leads to the decomposition of the Bax/BcL2 complex, enabling the homo-dimerization of
Bax, and the phosphorylation and downregulation of BcL2 [152]. Similar to ASK1, JNK can
be inhibited under non-stress conditions by forming a redox sensitive complex with
glutathione-S-transferase-π. Upon oxidative stress JNK is released from this complex and
activated [166]. A crosstalk between NFκB and JNK has been suggested to be of importance
for the final cell fate in response to oxidative stress [166].
In comparison to healthy tissues, ROS levels have been found to be elevated in cancer
patients. Additionally to the direct measurement of elevated levels, increased lipid
peroxidation serves as an indirect proof [113,158]. The increase of ROS might be caused by
oncogenic stimulation, increased metabolic activity due to the higher energy demand caused
by rapid proliferation, or mitochondrial malfunction. Also a decrease in the antioxidant
capacity of cancer cells has been suggested as a cause. Though, documented studies
comparing the levels of antioxidant enzymes in cancer patients vs. healthy subjects were not
conclusive, most probably due to huge variations in patients and control populations. Also the
geographical location and the time of the study (data were collected over the last three or four
decades) might have caused this variation [113].
Figure 13 shows the different pathways favoring the cellular survival, tumor promotion,
proliferation and progression or apoptosis in dependence of the cellular ROS levels. A higher
oxidative stress level in cancer cells, might therefore provide the opportunity for a selective
28
targeting, since the tumor cells might be more sensitive to additionally induced oxidative
stress as compared to normal (healthy) cells [113,155].
Also ABC transporter mediated multidrug resistance of cancer is partly regulated by ROS on
several levels. Direct oxidation of the transport proteins might result in conformational
changes that render the proteins inactive. Especially in case of MRP1, where GSH is co-
transported, ROS might influence the activity of the transporter [167]. The regulation of P-gp
expression on the transcriptional level has first been identified on the rat paralogues mdr1a
and mdr1b, but later been confirmed for the human protein as well [167]. As indicated in
Figure 13, the ROS sensitive NFκB and Nrf2 pathways have been suggested to not only
upregulate antioxidant enzymes but also the ABC transporter P-gp [167,169]. Further effects
on P-gp expression include a ROS induced gene amplification, but also regulation of
expression on post-translational and epigenetic levels [167].
2. Objective 29
2. Objective
As indicated in the introduction, the development of multidrug resistance (MDR) is a major
obstacle in cancer treatment. One strategy to overcome this obstacle is the selective targeting
of MDR cells by exploiting their collateral sensitivity (CS).
As indicated in chapter 1.4, several reports can be found in the literature on diverse
compounds with the potential to induce CS via different mechanisms. While some of these
agents have been identified in a pharmacogenomic approach by correlating the drug activity
to expression of the ABC transporter P-gp, the impact of the transporter on serendipitously
found MDR selective agents seems elusive. Therefore, selected agents should be tested for
their potential to induce MDR selective toxicity in a panel of cell lines. In order to exclude
cell line specific effects and ensure the importance of transporter activity on the selectivity,
transporter inhibition and P-gp-transfected cell lines should be investigated (addressed in
chapter 3.1.1.).
New data was released in 2010, updating the database of the National Cancer Institute (NCI)
– Developmental Therapeutics Program (DTP), thus enabling the re-evaluation of the reported
pharmacogenomic approach. Data analysis might lead to the identification of scaffolds that
can be associated with P-gp-mediated MDR selective toxicity. Furthermore, the MDR
selective anticancer potential of previously identified compound classes might be verified in
this new data set and a preliminary structure activity relationship analysis might be
performed.
In order to confirm these (re-)identified scaffolds, and to gain more insight into the chemical
features responsible for (MDR selective) toxicity of the chelators, a focused library should be
designed. Isatin-β-thiosemicarbazones, like I-a, have been described to be MDR selective
based on the previously reported pharmacogenomic approach. Starting from this chelator, the
library should be intended to cover aspects of different chelator donor-atom sets and further
variations that might be applied to fine-tune toxicity. Furthermore, the scaffold should be
extended to closely related compound classes like hydrazino-benzothiazoles and aryl-
hydrazones (chapter 3.2.). Compounds should be investigated for their potential to overcome
MDR in several cell lines. In case of compounds, identified to selectively kill MDR cell lines,
the effect of P-gp should be addressed by co-administration of an inhibitor.
On the basis of the previously reported pharmacogenomic approach, also 8-hydroxyquinoline
derived Mannich bases might be a promising chelator class. Closely related derivatives might
provide further insight into structural motives that render these compounds MDR selective.
30
A set of closely related compounds with varying MDR selective activity might provide a
useful tool for the elucidation of putative mechanisms of (MDR selective) action.
Furthermore, the comparison to a derivative with cell line specific selective toxicity that is
independent of P-gp (identified in the library, chapter 3.2.), might be interesting.
As described in the introduction, chelators might affect the intracellular redox homeostasis for
example via the formation of redox active complexes, and eventually cause cellular damage
through the formation of excess of reactive oxygen species (ROS). In order to address the
impact of ROS on the toxicity of selected chelators toward parental and MDR cells, the ROS-
scavenger N-acetylcysteine (NAC) should be co-administered.
Intracellular complexes might be formed with the two most physiologically relevant redox
active metals iron and copper, therefore the impact of these two metals on the selective
toxicity of the ligands toward MDR cell lines, should be addressed by co-administration of the
metal salts.
Since a putatively differential cellular response to the metal ion co-administration to MDR
selective and non-MDR selective ligands might be caused by different chemical properties of
the ligands and their complexes, complex stability and redox activity of the complexes formed
with iron (III) and copper (II) should be investigated.
In case of stable complex formation, pre-formed complexes should be investigated in vitro, in
order to investigate the effect of supplemented metal ions at fixed metal to ligand ratios. The
impact of redox activity of these complexes on the toxicity should be investigated by co-
administration of antioxidants in the in vitro studies.
In order to further investigate the impact of ROS on the mechanism of (MDR selective)
toxicity of ligands and metal complexes, techniques should be established for the
measurement of intracellular ROS.
3.1. Critical evaluation of literature reports 31
3. Results and discussion
3.1. Critical evaluation of literature reports
3.1.1. Serendipitous findings
Based on the increasing number of literature reports on MDR in cancer, the selective targeting
of otherwise MDR cancer cell lines seems to be a promising approach. As detailed in the
introduction (chapter 1.4.) very diverse agents with distinct mechanisms of action have been
reported to show hypertoxicity toward MDR cell lines.
In order to elucidate the impact of P-gp on the activity of the reported compounds and to rule
out cell line specific effects, several cell line models should be employed. Experimental data
on the reported MDR selective agents are summarized in Table 2. The investigated cell line
panel comprises pairs of MDR and parental cell lines from different origin. The ovarian
carcinoma cell line A2780 and the uterine sarcoma cell line MES-SA were used in
comparison to their doxorubicin-selected counterparts A2780adr and Dx5, respectively
[24,170,171], while the cervix carcinoma cell line KB-3-1 was compared to the Vinblastine-
selected line KB-V1 [172,173]. The NCI/ADR-res and OVCAR-8 cell lines were introduced
in chapter 1.4. as parts of the NCI60 cell line panel [99]. The impact of P-gp activity on the
toxicity of the compounds was furthermore addressed by co-administration of the P-gp
inhibitor Tariquidar, as well as by the usage of a genetically modified Madin–Darby canine
kidney (MDCK-II) cell line, which was engineered to overexpress cDNA-derived P-gp. This
cell line was established by Dr. Dóra Türk, a brief description of the cells is given in the
methods section (chapter 5.1.) [89].
While a standard method to measure cellular viability is the MTT assay, this method requires
the removal of medium before the lysing of cells (for details see methods section chapter
5.6.1.), which might be a possible source of errors in case of agents, which might act via a
perturbation of membrane properties. The putative loss of cells with perturbed membrane
properties during the experiment might lead to artefacts in the measurement. Therefore the
detergent Triton-X-100, as well as the block co-polymers pluronics P-85 and P-105 were
measured with fluorescence based assays, namely with cell lines stably transfected with the
fluorescent proteins eGfP or DsRed (for details, see method section chapter 5.6.3.), or by the
application of Presto Blue reagent (for details, see method section chapter 5.6.2.). In
comparison to the MTT reagent, this method has the advantage that a medium replacement is
not necessary in cases, where an interaction of the test compound with the assay compound
32
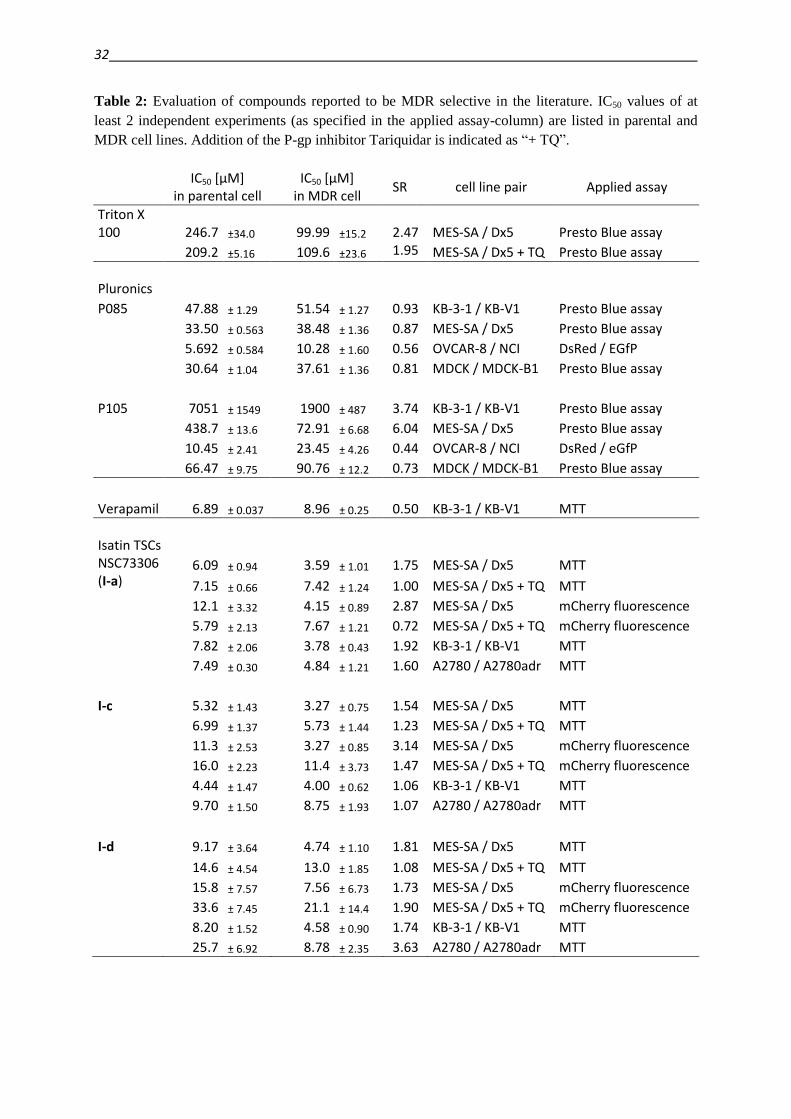
Table 2: Evaluation of compounds reported to be MDR selective in the literature. IC50 values of at
least 2 independent experiments (as specified in the applied assay-column) are listed in parental and
MDR cell lines. Addition of the P-gp inhibitor Tariquidar is indicated as “+ TQ”.
IC50 [µM]
in parental cell IC50 [µM]
in MDR cell SR cell line pair Applied assay
Triton X 100 246.7 ±34.0 99.99 ±15.2 2.47 MES-SA / Dx5 Presto Blue assay
209.2 ±5.16 109.6 ±23.6 1.95 MES-SA / Dx5 + TQ Presto Blue assay
Pluronics
P085 47.88 ± 1.29 51.54 ± 1.27 0.93 KB-3-1 / KB-V1 Presto Blue assay
33.50 ± 0.563 38.48 ± 1.36 0.87 MES-SA / Dx5 Presto Blue assay
5.692 ± 0.584 10.28 ± 1.60 0.56 OVCAR-8 / NCI DsRed / EGfP
30.64 ± 1.04 37.61 ± 1.36 0.81 MDCK / MDCK-B1 Presto Blue assay
P105 7051 ± 1549 1900 ± 487 3.74 KB-3-1 / KB-V1 Presto Blue assay
438.7 ± 13.6 72.91 ± 6.68 6.04 MES-SA / Dx5 Presto Blue assay
10.45 ± 2.41 23.45 ± 4.26 0.44 OVCAR-8 / NCI DsRed / eGfP
66.47 ± 9.75 90.76 ± 12.2 0.73 MDCK / MDCK-B1 Presto Blue assay
Verapamil 6.89 ± 0.037 8.96 ± 0.25 0.50 KB-3-1 / KB-V1 MTT
Isatin TSCs NSC73306 (I-a)
6.09 ± 0.94 3.59 ± 1.01 1.75 MES-SA / Dx5 MTT
7.15 ± 0.66 7.42 ± 1.24 1.00 MES-SA / Dx5 + TQ MTT
12.1 ± 3.32 4.15 ± 0.89 2.87 MES-SA / Dx5 mCherry fluorescence
5.79 ± 2.13 7.67 ± 1.21 0.72 MES-SA / Dx5 + TQ mCherry fluorescence
7.82 ± 2.06 3.78 ± 0.43 1.92 KB-3-1 / KB-V1 MTT
7.49 ± 0.30 4.84 ± 1.21 1.60 A2780 / A2780adr MTT
I-c 5.32 ± 1.43 3.27 ± 0.75 1.54 MES-SA / Dx5 MTT
6.99 ± 1.37 5.73 ± 1.44 1.23 MES-SA / Dx5 + TQ MTT
11.3 ± 2.53 3.27 ± 0.85 3.14 MES-SA / Dx5 mCherry fluorescence
16.0 ± 2.23 11.4 ± 3.73 1.47 MES-SA / Dx5 + TQ mCherry fluorescence
4.44 ± 1.47 4.00 ± 0.62 1.06 KB-3-1 / KB-V1 MTT
9.70 ± 1.50 8.75 ± 1.93 1.07 A2780 / A2780adr MTT
I-d 9.17 ± 3.64 4.74 ± 1.10 1.81 MES-SA / Dx5 MTT
14.6 ± 4.54 13.0 ± 1.85 1.08 MES-SA / Dx5 + TQ MTT
15.8 ± 7.57 7.56 ± 6.73 1.73 MES-SA / Dx5 mCherry fluorescence
33.6 ± 7.45 21.1 ± 14.4 1.90 MES-SA / Dx5 + TQ mCherry fluorescence
8.20 ± 1.52 4.58 ± 0.90 1.74 KB-3-1 / KB-V1 MTT
25.7 ± 6.92 8.78 ± 2.35 3.63 A2780 / A2780adr MTT
3.1. Critical evaluation of literature reports 33
can be excluded (in case of Triton-X-100 a reaction is very unlikely by chemical means, but
generally, an interaction could by excluded by using cell-free conditions).
While Triton-X-100 seemed to have a 2.47-fold increased toxicity in MES-SA/Dx5 cells as
compared to the parental MES-SA cells, this difference seemed to be independent of P-gp
function, as the co-administration of Tariquidar did not abolish selectivity.
The toxicity of Pluronic P-85 was comparable throughout the investigated cell line panel. In
NCI/ADR-res it even seemed less toxic as compared to the parental OVCAR-8 cell line. In
contrast, the derivative P-105 showed enhanced toxicity toward MDR cells in two out of the
four investigated cell line models. Experiments performed with the transfected MDCK-II-B1
cells showed, that the selectivity observed in these models was not caused by the transport
protein.
Despite promising reports on up to 100-fold increased toxicity of Verapamil toward a P-gp-
expressing cell line in comparison to the parental line [82], these reports seem to be based on
rather cell line dependent effects, as these observations could not be confirmed in the KB-V1
vs. KB-3-1 cell line model (Table 2). Furthermore, Verapamil was found in the DTP database
as NSC657799, and biodata on this compound was available on a major set of cell lines from
the NCI60 panel. As summarized in Table 3, the Pearson correlation coefficient for the
correlation of activity vs. P-gp expression was negative, supporting reports on the substrate
properties of Verapamil, rather than those reporting about MDR selective activity. Since data
for OVCAR-8 cells were not available, a selectivity ratio for the NCI/ADR-res vs. OVCAR-8
cell line pair could not be given based on the database data.
NSC73306 (I-a) has been identified as a putatively MDR selective agent based on the NCI60
panel data, and confirmed in several models [95,98,100]. Even though the magnitude of the
effect was rather small in some cases, a selective effect could be observed in all investigated
cell line pairs. Application of Tariquidar abolished the selectivity, indicating the P-gp-
dependence of the selectivity. Two close derivatives have been reported to possess increased
selectivity toward MDR cell lines, namely I-c and I-d [102,103]. Compound I-d indeed
showed selective toxicity toward the investigated MDR cell lines in a P-gp-dependent
manner, even though not in the reported magnitude. Compound I-c, in contrast, showed
selective toxicity only in one test system, namely in MES-SA/Dx5 cells, measured by the
mCherry assay. Since the effect could neither be verified by the MTT assay in the same cell
lines, nor in other cell lines, other factors than P-gp might be responsible for the reported
selectivity.
34
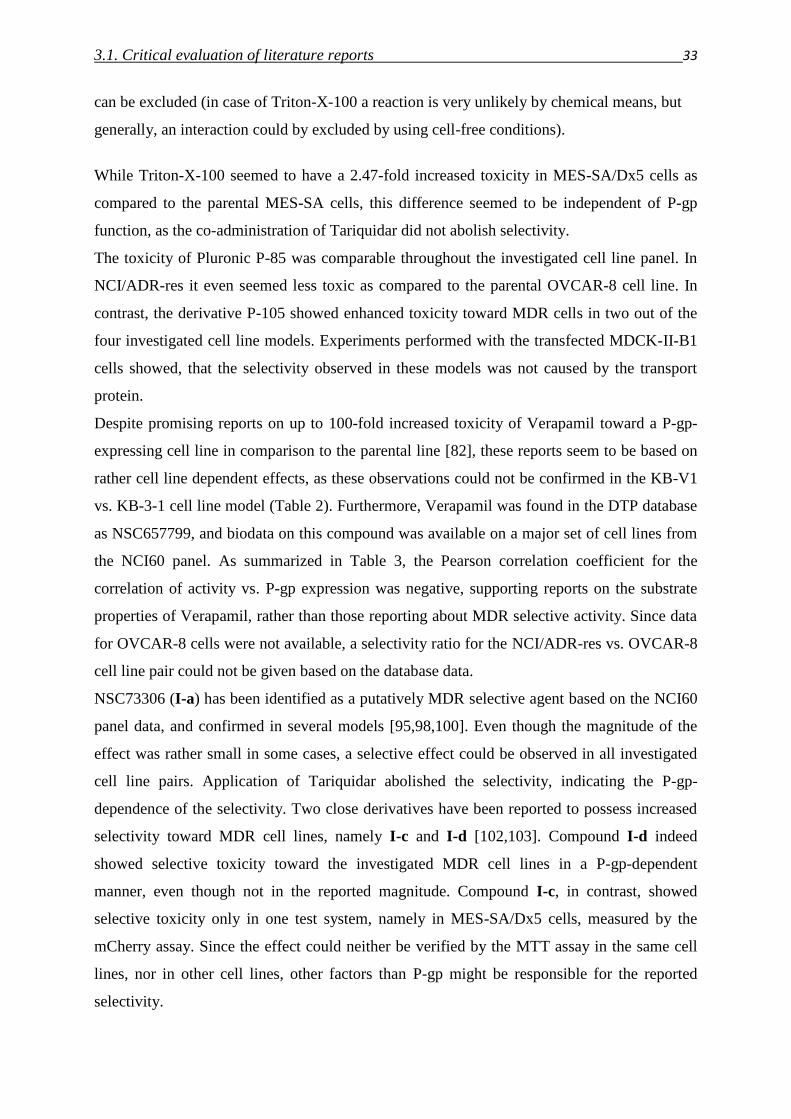
Furthermore, I-c and I-d were identified in the DTP database as NSC668502 and
NSC670960, respectively. As summarized in Table 3, the available biodata and provided
relatively low Pearson correlation coefficients against P-gp-expression data. Also the low SR
comparing OVCAR8 and NCI/ADR-res cells, confirm (in agreement with the measured data,
as summarized in Table 2) the suggestion that putatively observed selectivity of these
compounds might be linked to other factors than P-gp.
Table 3: correlation of activity within the NCI60 panel vs. P-gp expression for isatin-β-thiosemicarba-
zones in comparison to reported MDR selectivity.
NSC657799
Verapamil
Pearson correlation coefficient r: -0.25
IC50 (OVCAR-8) / µM -
IC50 (NCI/ADR-res) / µM 100
SR (OVCAR8 / NCI/ADR-res) -
NSC73306
I-a
Pearson correlation coefficient r: 0.49
IC50 (OVCAR-8) / µM 7.56
IC50 (NCI/ADR-res) / µM 2.09
SR (OVCAR8 / NCI/ADR-res) 3.63
NSC668502
I-c
Pearson correlation coefficient r: 0.01
IC50 (OVCAR-8) / µM ≥ 100
IC50 (NCI/ADR-res) / µM 51.29
SR (OVCAR8 / NCI/ADR-res) 1.95
reported SR (KB-3-1 / KB-V1) [103] 9.2
NSC670960
I-d
Pearson correlation coefficient r: 0.20
IC50 (OVCAR-8) / µM 1.78
IC50 (NCI/ADR-res) / µM 3.02
SR (OVCAR8 / NCI/ADR-res) 0.59
reported SR (KB-3-1 / KB-V1) [103] 8.3
Therefore, the results suggest, that the elevated toxicity of putative MDR selective
compounds reported in the literature is often cell line dependent and not linked to P-gp, but
rather to nonspecific factors arising during the development of the MDR phenotype. In
contrast the selective toxicity of compound I-a, which was identified by the pharmaco-
genomic approach, could be confirmed in other test systems, and was found to be P-gp-
mediated. Therefore, it seems to be necessary to investigate several cell lines, in order to find
P-gp-mediated MDR selective agents. The approach of correlating biodata across the NCI60
3.1. Critical evaluation of literature reports 35
cell line panel against gene expression data seems to be a reliable strategy to find general
MDR selective agents.
3.1.2. Pharmacogenomic approach
In 2010, a new updated dataset containing toxicity profiles of 49169 compounds across the
NCI60 panel was released. In order to identify further MDR selective compounds, the
previously described pharmacogenomic approach of correlating toxicity against P-gp
expression was repeated using the new dataset. The bioinformatic analysis and biological
testing of the identified compounds was performed by Szilárd Tóth, András Füredi, and Dr.
Anna Lovrics. The analysis revealed 82 putative MDR selective compounds with Pearson
correlation coefficient >0.4. Out of these, 61 compounds were already identified in the
previously described set [174].
Structural motives and molecular features known to be associated with MDR selective
toxicity reappear within the 21 novel compounds. Available compounds were tested in a panel
of MDR (KB-V1, MES-SA/Dx5) and parental cell lines (KB-3-1, MES-SA) with the
Presto Blue viability assay. To clearly delineate the effect of P-gp on the toxicity of the
compounds, MDCK-II-ABCB1 cells, which were engineered to overexpress cDNA-derived
P-gp and the control MDCK-II cells, were included (see chapter 3.1.1.). Additionally the
effect of co-administered P-gp inhibitor Tariquidar was investigated in the MES-SA cell line
pair.
In order to compare to previous findings, five reference compounds are included in the study
of the newly investigated compound set (NSC693871, NSC73306, KP772, 1,10-
phenanthroline, 8-hydroxyquinoline (8OHQ)). The molecular similarity of the chemical
structures can be quantified by Tanimoto coefficients, which are based on molecular
fingerprints, that describe molecular structures as binary vectors [175]. These coefficients
were calculated with ChemAxon software and hierarchical clustered into a dendrogram [36].
Data describing structural similarity and biological activity are illustrated in Figure 14.
In agreement with prior observations based on the 2007 DTP data release, the newly
identified compounds are contain a significant number of structures enabling metal chelation
[174].
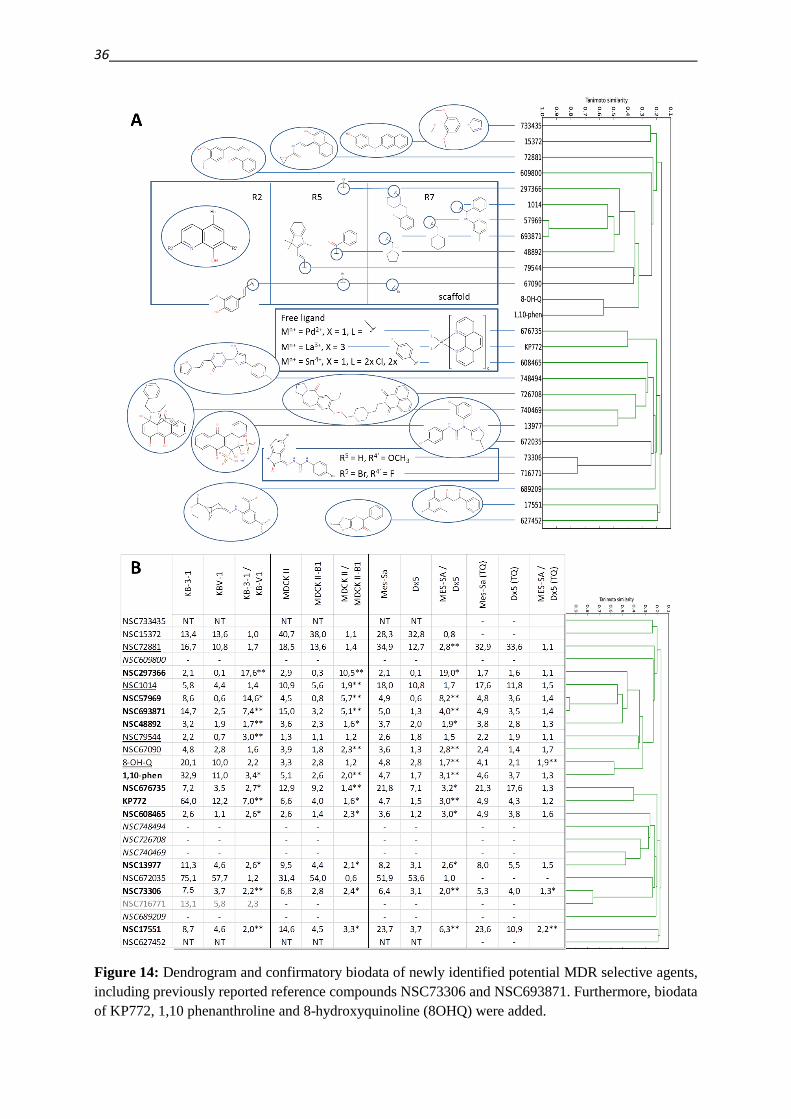
36
Figure 14: Dendrogram and confirmatory biodata of newly identified potential MDR selective agents,
including previously reported reference compounds NSC73306 and NSC693871. Furthermore, biodata
of KP772, 1,10 phenanthroline and 8-hydroxyquinoline (8OHQ) were added.
3.1. Critical evaluation of literature reports 37
NSC716771 was identified as a very close analogue of the isatin-β-thiosemicarbazone
NSC73306. While the compound was not available for testing, Hall et al. report the MDR
selectivity of this thiosemicarbazone in the KB-V1 vs. KB-3-1 cell line pair [176].
Also the 8OHQ derived Mannich base NSC693871 has previously been identified in the
pharmacogenomic approach and confirmed to possess MDR selective activity [174]. In the
updated data set six further 8-hydroxyquinoline derivatives were found with putative MDR
selective activity. The 7-(piperidylmethyl)-8-hydroxyquinoline NSC57969 shows the highest
similarity to with the previously reported compound NSC693871, with a piperidine-ring
replacing the pyrrolidine-moiety. According to their structural similarity, both compounds are
comparable with respect to their preferential targeting of MDR cell lines. Interestingly, the
pyrrolidino derivative is less toxic than the newly identified piperidino derivative.
NSC297366 can also be considered as a close derivative, which could be obtained by a
similar Mannich reaction as the previously mentioned derivatives. The presence of an
additional equivalent of formaldehyde in the synthesis process enables an additional ring-
closure between the 8-OH group and the benzyl amino-nitrogen. This compound harboring a
fluorobenzylamine moiety has an outstandingly high selectivity for MDR cells with IC50
values in the submicromolar concentration range and SR values between 10 and 19.
In contrast, introduction of an aromatic moiety at the employed aldehyde resulting in
compound NSC1014 seems to have detrimental effects on toxicity and selectivity.
The cluster furthermore contains two 5-substituted 8OHQ derived derivatives (NSC79544 and
NSC48892), which both show toxicity in the 1-3 µM range with only slight selectivity toward
MDR cell lines (with SR values between 1.5 and 3). A similar behavior can be observed for
NSC67090, which is halogenated in positions 5 and 7 and harbors a substituted styryl-moiety
in position 2. Interestingly, the unsubstituted 8OHQ scaffold does not show MDR selective
properties.
The naphthol-carbaldehyde-hydrazone NSC72881 and the naphthylamine NSC15372 are
relatively far analogues of the 8OHQ derived Mannich bases. They show comparable activity
across the cell line panel in the range of 10 to 40 µM, regardless of the resistance status of the
cells. Two further distantly related analogues can be found in the cluster around the 8-
hydroxyquinoline derived Mannich bases, namely the 1,4-benzopyrone derivative
NSC609800 and the 1-(3,5-trimethoxyphenyl)-imidazole NSC733435. While the first one was
not available for testing, the latter was not toxic in any of the investigated cell lines up to a
concentration of 100 µM. While chelation of metal ions might be possible for NSC72881, it is
rather unlikely for the other three far derivatives (NSC15372, NSC609800 and NSC733435).
38
The unsubstituted 8-OHQ scaffold clusters together with 1,10-phenanthroline, which has been
reported earlier to possess MDR selective activity both as the free ligand and complexed with
different metals [174,177]. The [Tris(1,10-phenanthroline)lanthanum(III)] trithiocyanate
complex (KP772) was included in the study as a reference compound [177]. A stock solution
of the complex was prepared following the procedure described by Hart and Laming [178]. In
order to be able to compare the activity of KP772 with that of the free ligand, IC50 are given
in ligand equivalents, therefore as the IC50 value of {1/3 [La(phen)3](SCN)3} (accordingly, the
IC50 value of the complex would be three times lower). The analysis of the pharmacogenomic
correlation retrieved two new 1,10-phenanthroline complexes formed with either tin
(NSC608465) or palladium (NSC676735). Since most programs, which calculate chemical
and physicochemical properties, are mainly made for the analysis of organic compounds, and
might not be able to cope with metal ions in a chemical structure, the complexes and the free
ligand do not cluster together. The preferential killing effect of free ligand toward MDR cells
is preserved in the presence of the metal ions lanthanum, tin and palladium.
The aryl-urea derivative NSC672035 shows some degree of similarity to the TSC structures.
However, its activity was comparably low with IC50 values ≥ 50 µM across the cell line panel
(SR 0.6-1.2). In contrast to the 8OHQ and TSC derivatives, upon chelation this compound
will form a 6-membered ring incorporating the metal ion, while the other chelators will form
5-membered rings, which is considered more stable [179]. Also the diketon NSC17551 and
the naphthol-derivative NSC72881, which display moderate toxicity in the investigated cell
line panel (10-35 µM) will form 6-membered rings, applying either the two keto-oxygen
atoms or the naphthol-hydroxyl group and a hydrazone-N as donor atoms. While the
selectivity of the naphthol derivative is only significant in one cell line pair (MES-SA vs.
MES-SA/Dx5), the diketon NSC17551 shows selective toxicity toward several MDR lines.
One further structural connection can be seen in the newly identified compound set, namely
between two structures with a quinoidic system (NSC13977 and NSC740469), the remaining
molecules are quite dissimilar. Interestingly NSC13977, which is the dye Alizarin blue, shares
the N,O-metal binding donors in the same distance as found in the 8OHQ-scaffold, yet the
disruption of aromaticity and the presence of further substituents explain the huge distance in
the dendrogram. Alizarin Blue NSC13977 showed a two-fold higher activity in MDR cells
compared to the parental cells, while the derivative NSC740469 was not available for testing.
NSC748494 and NSC726708 were not available, and the singleton NSC627452 was not toxic
in any of the tested cell lines up to a concentration of 100 µM.
3.1. Critical evaluation of literature reports 39
Taken together, P-gp expressing MDR cells from different origin show enhanced sensitivity
over their parental P-gp negative cell lines against the compounds identified by the correlative
approach. The occurrence of this effect also in ABCB1 transfected MDCK-II cells and the
ability of the P-gp inhibitor Tariquidar to abolish selectivity, point to the importance of
functional transport protein in sensitizing MDR cells.
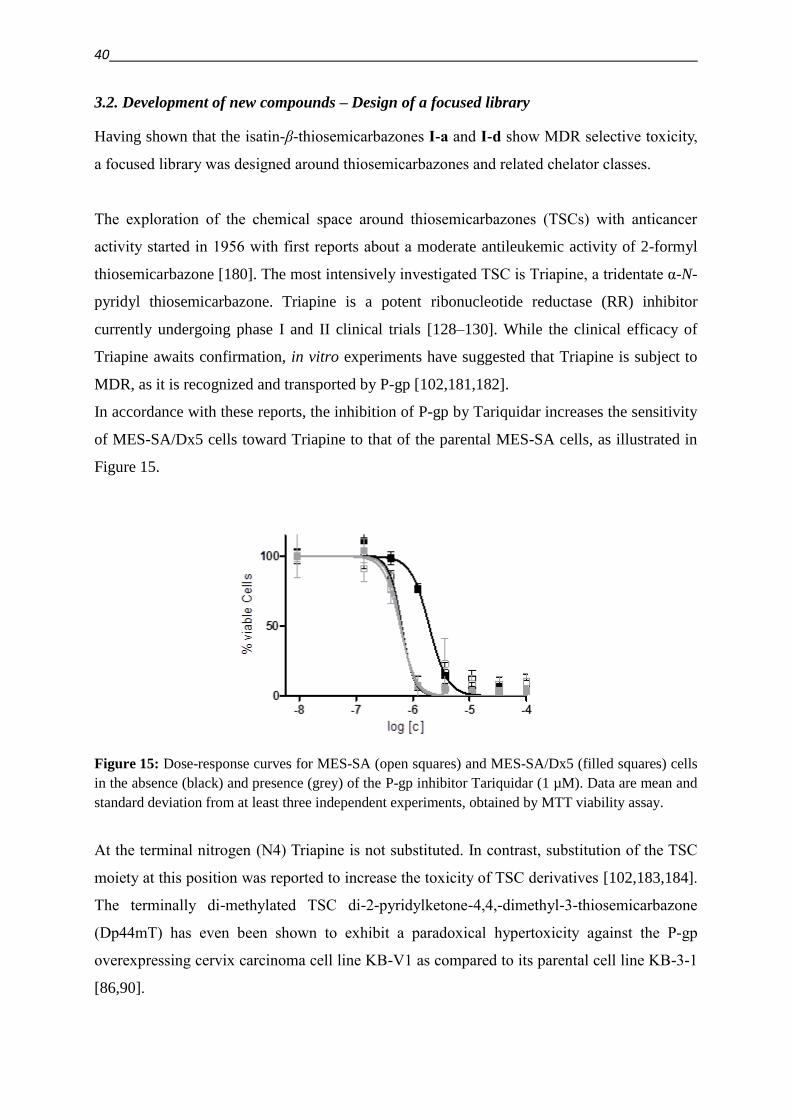
40
3.2. Development of new compounds – Design of a focused library
Having shown that the isatin-β-thiosemicarbazones I-a and I-d show MDR selective toxicity,
a focused library was designed around thiosemicarbazones and related chelator classes.
The exploration of the chemical space around thiosemicarbazones (TSCs) with anticancer
activity started in 1956 with first reports about a moderate antileukemic activity of 2-formyl
thiosemicarbazone [180]. The most intensively investigated TSC is Triapine, a tridentate α-N-
pyridyl thiosemicarbazone. Triapine is a potent ribonucleotide reductase (RR) inhibitor
currently undergoing phase I and II clinical trials [128–130]. While the clinical efficacy of
Triapine awaits confirmation, in vitro experiments have suggested that Triapine is subject to
MDR, as it is recognized and transported by P-gp [102,181,182].
In accordance with these reports, the inhibition of P-gp by Tariquidar increases the sensitivity
of MES-SA/Dx5 cells toward Triapine to that of the parental MES-SA cells, as illustrated in
Figure 15.
Figure 15: Dose-response curves for MES-SA (open squares) and MES-SA/Dx5 (filled squares) cells
in the absence (black) and presence (grey) of the P-gp inhibitor Tariquidar (1 µM). Data are mean and
standard deviation from at least three independent experiments, obtained by MTT viability assay.
At the terminal nitrogen (N4) Triapine is not substituted. In contrast, substitution of the TSC
moiety at this position was reported to increase the toxicity of TSC derivatives [102,183,184].
The terminally di-methylated TSC di-2-pyridylketone-4,4,-dimethyl-3-thiosemicarbazone
(Dp44mT) has even been shown to exhibit a paradoxical hypertoxicity against the P-gp
overexpressing cervix carcinoma cell line KB-V1 as compared to its parental cell line KB-3-1
[86,90].
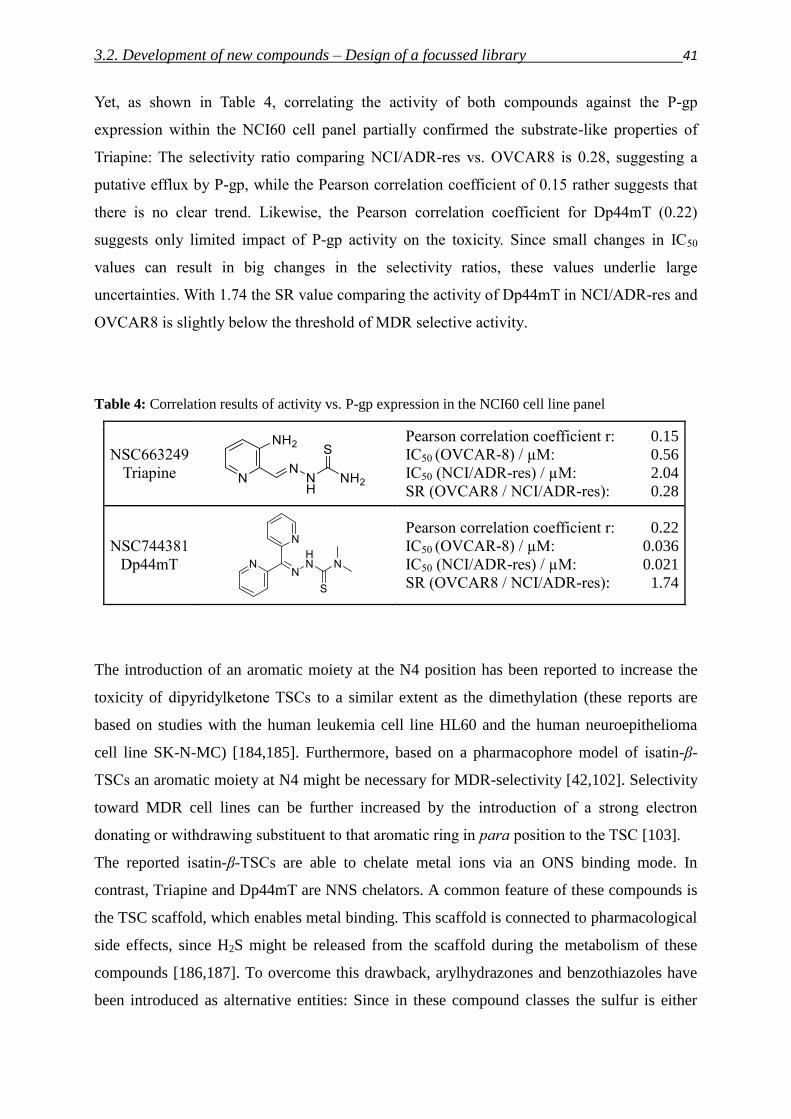
3.2. Development of new compounds – Design of a focussed library 41
Yet, as shown in Table 4, correlating the activity of both compounds against the P-gp
expression within the NCI60 cell panel partially confirmed the substrate-like properties of
Triapine: The selectivity ratio comparing NCI/ADR-res vs. OVCAR8 is 0.28, suggesting a
putative efflux by P-gp, while the Pearson correlation coefficient of 0.15 rather suggests that
there is no clear trend. Likewise, the Pearson correlation coefficient for Dp44mT (0.22)
suggests only limited impact of P-gp activity on the toxicity. Since small changes in IC50
values can result in big changes in the selectivity ratios, these values underlie large
uncertainties. With 1.74 the SR value comparing the activity of Dp44mT in NCI/ADR-res and
OVCAR8 is slightly below the threshold of MDR selective activity.
Table 4: Correlation results of activity vs. P-gp expression in the NCI60 cell line panel
NSC663249
Triapine
Pearson correlation coefficient r: 0.15
IC50 (OVCAR-8) / µM: 0.56
IC50 (NCI/ADR-res) / µM: 2.04
SR (OVCAR8 / NCI/ADR-res): 0.28
NSC744381
Dp44mT
Pearson correlation coefficient r: 0.22
IC50 (OVCAR-8) / µM: 0.036
IC50 (NCI/ADR-res) / µM: 0.021
SR (OVCAR8 / NCI/ADR-res): 1.74
The introduction of an aromatic moiety at the N4 position has been reported to increase the
toxicity of dipyridylketone TSCs to a similar extent as the dimethylation (these reports are
based on studies with the human leukemia cell line HL60 and the human neuroepithelioma
cell line SK-N-MC) [184,185]. Furthermore, based on a pharmacophore model of isatin-β-
TSCs an aromatic moiety at N4 might be necessary for MDR-selectivity [42,102]. Selectivity
toward MDR cell lines can be further increased by the introduction of a strong electron
donating or withdrawing substituent to that aromatic ring in para position to the TSC [103].
The reported isatin-β-TSCs are able to chelate metal ions via an ONS binding mode. In
contrast, Triapine and Dp44mT are NNS chelators. A common feature of these compounds is
the TSC scaffold, which enables metal binding. This scaffold is connected to pharmacological
side effects, since H2S might be released from the scaffold during the metabolism of these
compounds [186,187]. To overcome this drawback, arylhydrazones and benzothiazoles have
been introduced as alternative entities: Since in these compound classes the sulfur is either
42
replaced by a nitrogen [187], or incorporated into a ring system [186], H2S release is
abolished or hindered. Nevertheless, these compound classes provide metal chelation abilities
similar to the TSCs, which has been suggested to be an important feature in their mechanism
of action [89,188,189].
While the set of chelators with potential MDR selective activity identified with the previously
described pharmacogenomic approach includes a hydrazino-benzothiazole (NSC693630, see
introduction, Table 1 for the structure) [98], also arylhydrazones have been reported in the
context of multidrug resistance, yet not in the context of cancer: Several pyridinyl- or
pyrimidinylhydrazones are effective even against multidrug resistant strains of leprosy and
tuberculosis by inhibition of the mycobacterial RR [187,190]. Pyridylphthalazinyl- and
quinolylhydrazones have been suggested to possess anticancer activity based on the inhibition
of human RR [191]. Further applications of arylhydrazones can be found due to their
antibacterial, antimycobacterial, analgesic and anticancer activities [190,192–194].
Derivatives with pyridinyl- or pyrimidinyl moieties chelate via an NNN binding mode.
As illustrated in Figure 16, the designed library contains ONS, NNS and NNN donor
chelators. The first compound class (I) is built around isatin-β-thiosemicarbazones like the
reported MDR selective NSC73306 (I-a). In view of the reported structure-activity
relationship of the DpT series [184] and the pharmacophore model of isatin-β-TSCs [42,102]
the library contains derivatives with an aromatic moiety at N4. Additionally, the current
pharmacophore model suggests that either electron withdrawing or donating groups in para
position of the aromatic ring might be beneficial for selective activity toward MDR cell lines
[42,103]. Therefore compounds with either nitro, methyl, or methoxy groups in this position
were included in the library.
Incorporation of these substituted aromatic moieties into the N4-position of the pyridinyl TSC
scaffold resulted in compound class II. Additionally, the acetaniline derivative II-p was
prepared, which is able to chelate via an NNS binding mode like the pyridinyl TSC, but has
an anilinic NH2 instead of the ring-incorporated pyridinyl nitrogen.
By changing the pyridinyl moiety to a hydroxyphenyl moiety, the similarity to the MDR
selective isatin-β-TSC compounds is increased, since these compounds, forming compound
class III, again provide an ONS donor atom set for metal chelation. The previously mentioned
NNN chelating arylhydrazones are embraced in compound class IV. Hydrazino-benzothiazole
derivatives like NSC693630 can chelate via either an NNS or NNN donor atom set through
rotation around a single bond. Therefore they share chemical features with the TSC as well as
with the hydrazones. Benzothiazoles containing pyridine-moieties are encompassed by
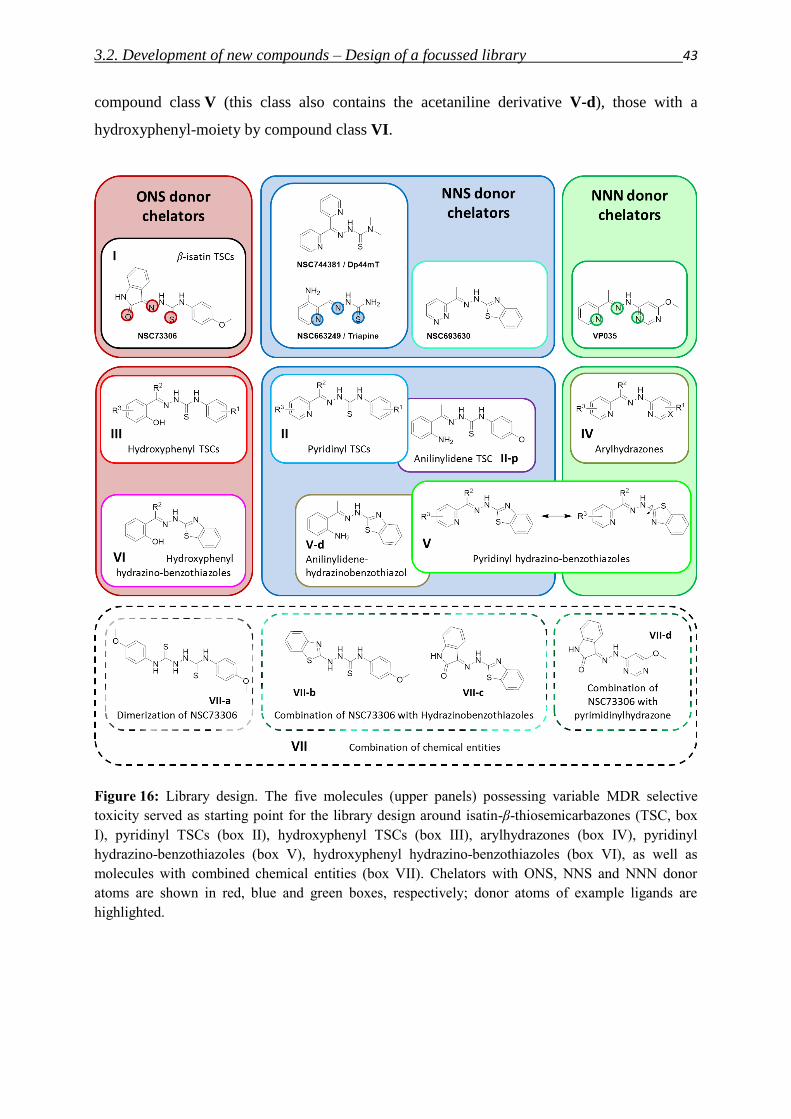
3.2. Development of new compounds – Design of a focussed library 43
compound class V (this class also contains the acetaniline derivative V-d), those with a
hydroxyphenyl-moiety by compound class VI.
Figure 16: Library design. The five molecules (upper panels) possessing variable MDR selective
toxicity served as starting point for the library design around isatin-β-thiosemicarbazones (TSC, box
I), pyridinyl TSCs (box II), hydroxyphenyl TSCs (box III), arylhydrazones (box IV), pyridinyl
hydrazino-benzothiazoles (box V), hydroxyphenyl hydrazino-benzothiazoles (box VI), as well as
molecules with combined chemical entities (box VII). Chelators with ONS, NNS and NNN donor
atoms are shown in red, blue and green boxes, respectively; donor atoms of example ligands are
highlighted.
44
In a further step chemical entities of the previously described compound classes were
combined and resulted in the four derivatives that form class VII: In compound VII-a the
“non-isatin moiety” of I-a is dimerized. Compounds VII-b and VII-c are hydrazino-
benzothiazoles that contain moieties of compound I-a, and compound VII-d is an isatin-
containing arylhydrazone.
It is noteworthy, that calculations of the lowest energy confirmations of the free ligands
revealed that the Schiff base double bound is in the E-confirmation, which rather suggests a
bidentate over a tridentate binding mode [36]. Crystal structures of diverse NNS ligands like
II-b [195] and II-g [196] or Triapine [197] confirm the calculated E-conformation. Also for
hydroxyphenyl thiosemicarbazones like those related to class III [198,199] and for N-
heteroarylhydrazones related to class IV [200] the ligands preferably crystalize in their E-
conformations. Nevertheless, in the presence of metal ions an isomerization about the N=CH
bond seems to occur, since these ligands form complexes with diverse metal ions in tridentate
binding mode. Therefore, pyridinyl thiosemicarbazones like Triapine and related derivatives
bind via NNS chelation motive [183,197,201–203] and hydroxyphenyl thiosemicarbazones
via ONS [199,204–211]. Though some cases of hydroxyphenyl thiosemicarbazone bis-
complexes of nickel and palladium, it has been reported, that the second ligand might bind
either via one, two or three donor atoms [212,213]. N-heteroarylhydrazones without imino
carbon substitution [214–216], as well as substituted derivatives [200,217] bind via an NNN
donor atom set [203].
Even though for the hydroxyphenyl hydrazino-benzothiazoles related to class VI ONS and
ONN binding modes are possible, mostly complexes with ONN binding have been crystalized
[188,189,218,219]. In analogy, the acetaniline derivative V-d has been reported to bind via an
NNN binding mode [189,220], while in case of Cu bis-complexes rather a bi-dentate (NN)
binding
can be found [189]. Taken together, the review of reported crystal structures shows, that the
assumption of a tridentate binding mode is generally valid.
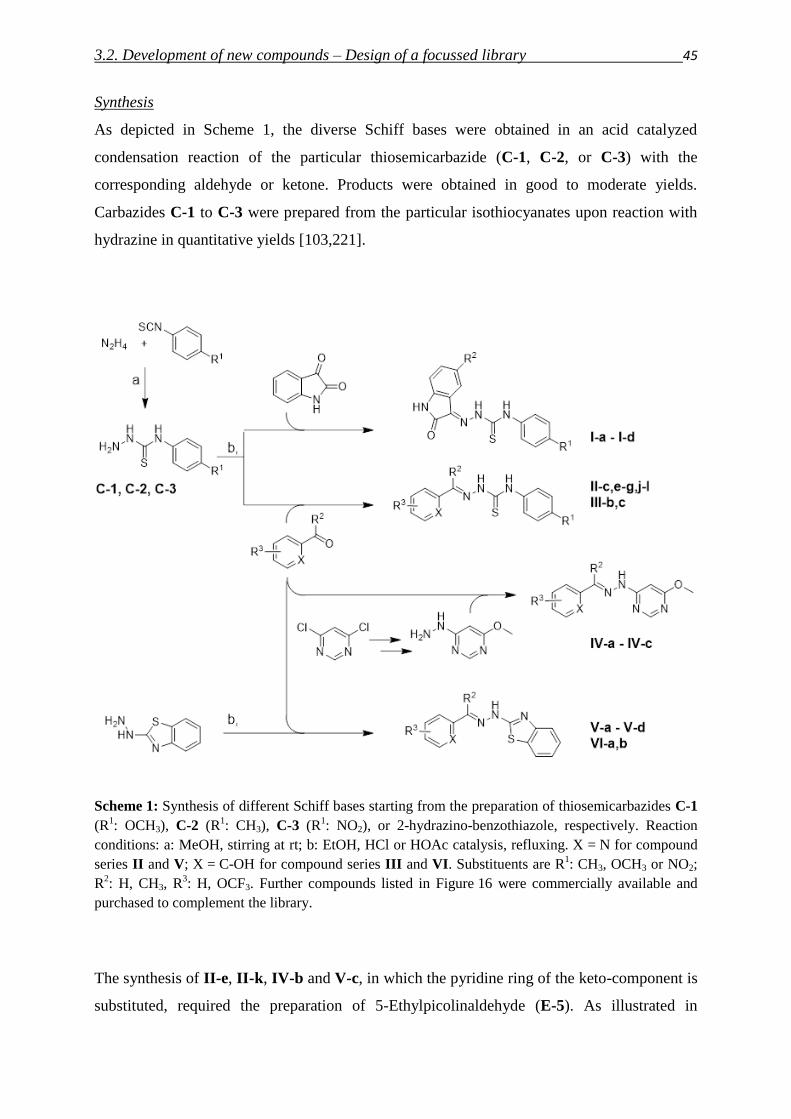
3.2. Development of new compounds – Design of a focussed library 45
Synthesis
As depicted in Scheme 1, the diverse Schiff bases were obtained in an acid catalyzed
condensation reaction of the particular thiosemicarbazide (C-1, C-2, or C-3) with the
corresponding aldehyde or ketone. Products were obtained in good to moderate yields.
Carbazides C-1 to C-3 were prepared from the particular isothiocyanates upon reaction with
hydrazine in quantitative yields [103,221].
Scheme 1: Synthesis of different Schiff bases starting from the preparation of thiosemicarbazides C-1
(R1: OCH3), C-2 (R
1: CH3), C-3 (R
1: NO2), or 2-hydrazino-benzothiazole, respectively. Reaction
conditions: a: MeOH, stirring at rt; b: EtOH, HCl or HOAc catalysis, refluxing. X = N for compound
series II and V; X = C-OH for compound series III and VI. Substituents are R1: CH3, OCH3 or NO2;
R2: H, CH3, R
3: H, OCF3. Further compounds listed in Figure 16 were commercially available and
purchased to complement the library.
The synthesis of II-e, II-k, IV-b and V-c, in which the pyridine ring of the keto-component is
substituted, required the preparation of 5-Ethylpicolinaldehyde (E-5). As illustrated in
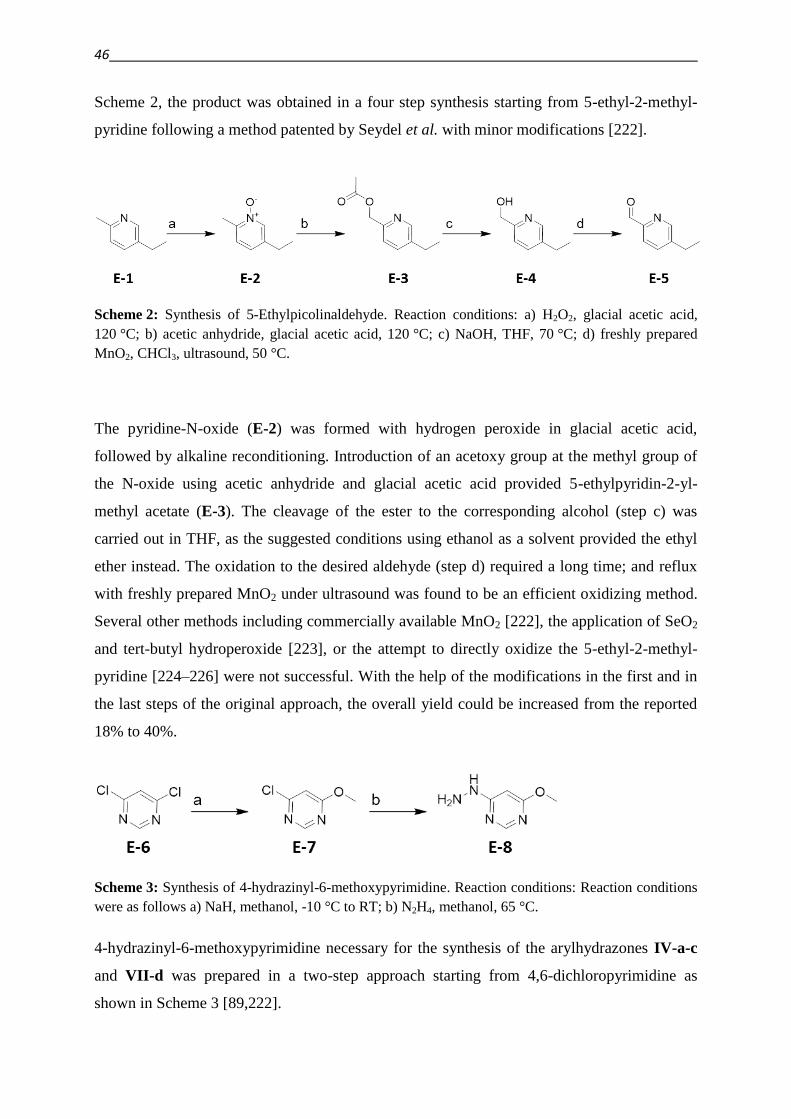
46
Scheme 2, the product was obtained in a four step synthesis starting from 5-ethyl-2-methyl-
pyridine following a method patented by Seydel et al. with minor modifications [222].
Scheme 2: Synthesis of 5-Ethylpicolinaldehyde. Reaction conditions: a) H2O2, glacial acetic acid,
120 °C; b) acetic anhydride, glacial acetic acid, 120 °C; c) NaOH, THF, 70 °C; d) freshly prepared
MnO2, CHCl3, ultrasound, 50 °C.
The pyridine-N-oxide (E-2) was formed with hydrogen peroxide in glacial acetic acid,
followed by alkaline reconditioning. Introduction of an acetoxy group at the methyl group of
the N-oxide using acetic anhydride and glacial acetic acid provided 5-ethylpyridin-2-yl-
methyl acetate (E-3). The cleavage of the ester to the corresponding alcohol (step c) was
carried out in THF, as the suggested conditions using ethanol as a solvent provided the ethyl
ether instead. The oxidation to the desired aldehyde (step d) required a long time; and reflux
with freshly prepared MnO2 under ultrasound was found to be an efficient oxidizing method.
Several other methods including commercially available MnO2 [222], the application of SeO2
and tert-butyl hydroperoxide [223], or the attempt to directly oxidize the 5-ethyl-2-methyl-
pyridine [224–226] were not successful. With the help of the modifications in the first and in
the last steps of the original approach, the overall yield could be increased from the reported
18% to 40%.
Scheme 3: Synthesis of 4-hydrazinyl-6-methoxypyrimidine. Reaction conditions: Reaction conditions
were as follows a) NaH, methanol, -10 °C to RT; b) N2H4, methanol, 65 °C.
4-hydrazinyl-6-methoxypyrimidine necessary for the synthesis of the arylhydrazones IV-a-c
and VII-d was prepared in a two-step approach starting from 4,6-dichloropyrimidine as
shown in Scheme 3 [89,222].
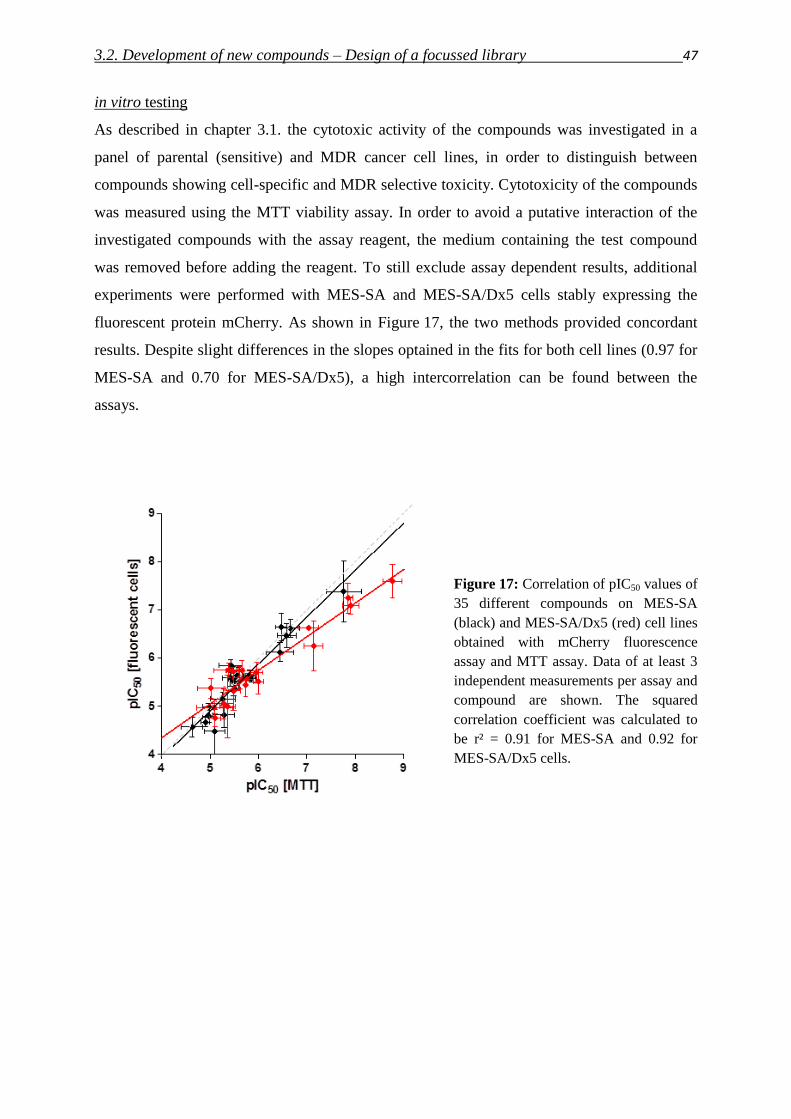
3.2. Development of new compounds – Design of a focussed library 47
in vitro testing
As described in chapter 3.1. the cytotoxic activity of the compounds was investigated in a
panel of parental (sensitive) and MDR cancer cell lines, in order to distinguish between
compounds showing cell-specific and MDR selective toxicity. Cytotoxicity of the compounds
was measured using the MTT viability assay. In order to avoid a putative interaction of the
investigated compounds with the assay reagent, the medium containing the test compound
was removed before adding the reagent. To still exclude assay dependent results, additional
experiments were performed with MES-SA and MES-SA/Dx5 cells stably expressing the
fluorescent protein mCherry. As shown in Figure 17, the two methods provided concordant
results. Despite slight differences in the slopes optained in the fits for both cell lines (0.97 for
MES-SA and 0.70 for MES-SA/Dx5), a high intercorrelation can be found between the
assays.
Figure 17: Correlation of pIC50 values of
35 different compounds on MES-SA
(black) and MES-SA/Dx5 (red) cell lines
obtained with mCherry fluorescence
assay and MTT assay. Data of at least 3
independent measurements per assay and
compound are shown. The squared
correlation coefficient was calculated to
be r² = 0.91 for MES-SA and 0.92 for
MES-SA/Dx5 cells.
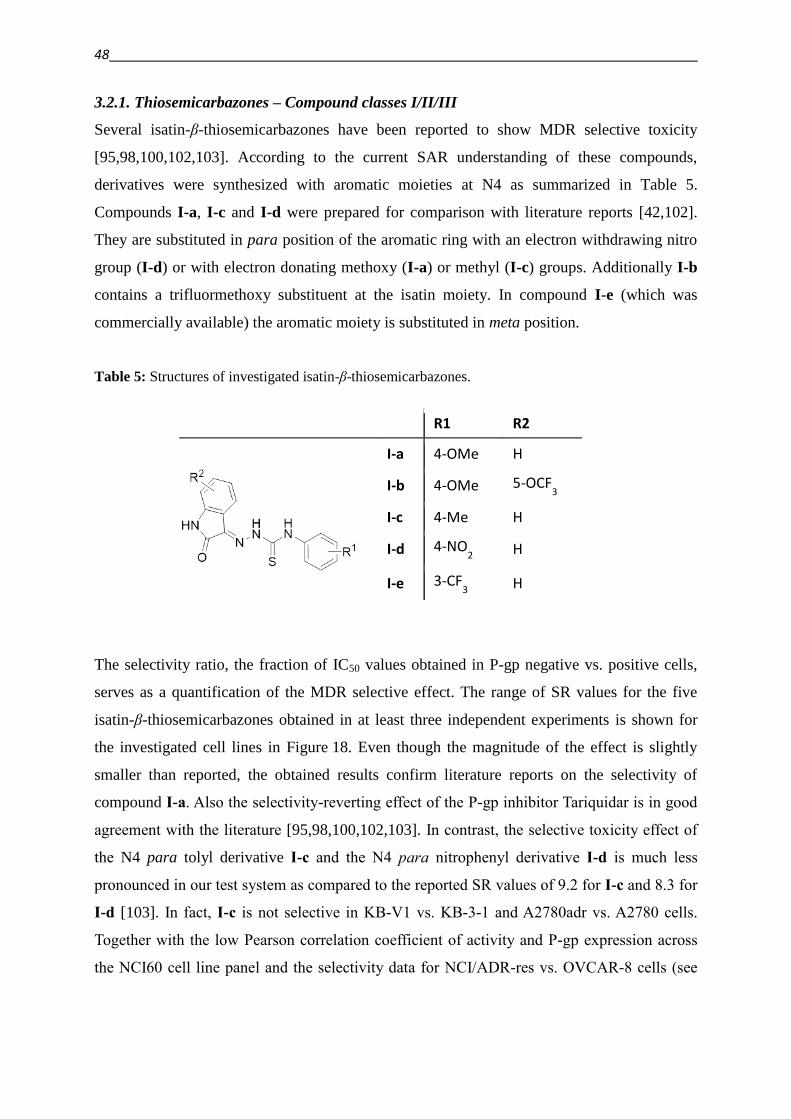
48
3.2.1. Thiosemicarbazones – Compound classes I/II/III
Several isatin-β-thiosemicarbazones have been reported to show MDR selective toxicity
[95,98,100,102,103]. According to the current SAR understanding of these compounds,
derivatives were synthesized with aromatic moieties at N4 as summarized in Table 5.
Compounds I-a, I-c and I-d were prepared for comparison with literature reports [42,102].
They are substituted in para position of the aromatic ring with an electron withdrawing nitro
group (I-d) or with electron donating methoxy (I-a) or methyl (I-c) groups. Additionally I-b
contains a trifluormethoxy substituent at the isatin moiety. In compound I-e (which was
commercially available) the aromatic moiety is substituted in meta position.
Table 5: Structures of investigated isatin-β-thiosemicarbazones.
R1 R2
I-a 4-OMe H
I-b 4-OMe 5-OCF3
I-c 4-Me H
I-d 4-NO2 H
I-e 3-CF3 H
The selectivity ratio, the fraction of IC50 values obtained in P-gp negative vs. positive cells,
serves as a quantification of the MDR selective effect. The range of SR values for the five
isatin-β-thiosemicarbazones obtained in at least three independent experiments is shown for
the investigated cell lines in Figure 18. Even though the magnitude of the effect is slightly
smaller than reported, the obtained results confirm literature reports on the selectivity of
compound I-a. Also the selectivity-reverting effect of the P-gp inhibitor Tariquidar is in good
agreement with the literature [95,98,100,102,103]. In contrast, the selective toxicity effect of
the N4 para tolyl derivative I-c and the N4 para nitrophenyl derivative I-d is much less
pronounced in our test system as compared to the reported SR values of 9.2 for I-c and 8.3 for
I-d [103]. In fact, I-c is not selective in KB-V1 vs. KB-3-1 and A2780adr vs. A2780 cells.
Together with the low Pearson correlation coefficient of activity and P-gp expression across
the NCI60 cell line panel and the selectivity data for NCI/ADR-res vs. OVCAR-8 cells (see
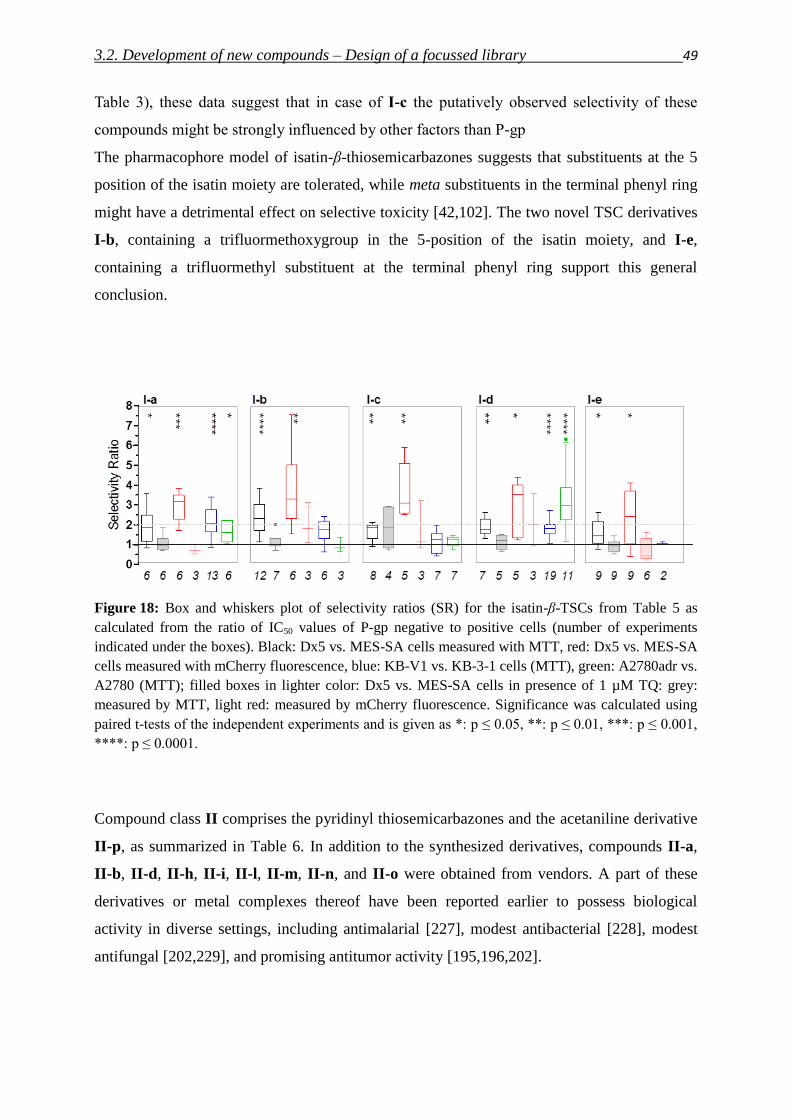
3.2. Development of new compounds – Design of a focussed library 49
Table 3), these data suggest that in case of I-c the putatively observed selectivity of these
compounds might be strongly influenced by other factors than P-gp
The pharmacophore model of isatin-β-thiosemicarbazones suggests that substituents at the 5
position of the isatin moiety are tolerated, while meta substituents in the terminal phenyl ring
might have a detrimental effect on selective toxicity [42,102]. The two novel TSC derivatives
I-b, containing a trifluormethoxygroup in the 5-position of the isatin moiety, and I-e,
containing a trifluormethyl substituent at the terminal phenyl ring support this general
conclusion.
Figure 18: Box and whiskers plot of selectivity ratios (SR) for the isatin-β-TSCs from Table 5 as
calculated from the ratio of IC50 values of P-gp negative to positive cells (number of experiments
indicated under the boxes). Black: Dx5 vs. MES-SA cells measured with MTT, red: Dx5 vs. MES-SA
cells measured with mCherry fluorescence, blue: KB-V1 vs. KB-3-1 cells (MTT), green: A2780adr vs.
A2780 (MTT); filled boxes in lighter color: Dx5 vs. MES-SA cells in presence of 1 µM TQ: grey:
measured by MTT, light red: measured by mCherry fluorescence. Significance was calculated using
paired t-tests of the independent experiments and is given as *: p ≤ 0.05, **: p ≤ 0.01, ***: p ≤ 0.001,
****: p ≤ 0.0001.
Compound class II comprises the pyridinyl thiosemicarbazones and the acetaniline derivative
II-p, as summarized in Table 6. In addition to the synthesized derivatives, compounds II-a,
II-b, II-d, II-h, II-i, II-l, II-m, II-n, and II-o were obtained from vendors. A part of these
derivatives or metal complexes thereof have been reported earlier to possess biological
activity in diverse settings, including antimalarial [227], modest antibacterial [228], modest
antifungal [202,229], and promising antitumor activity [195,196,202].
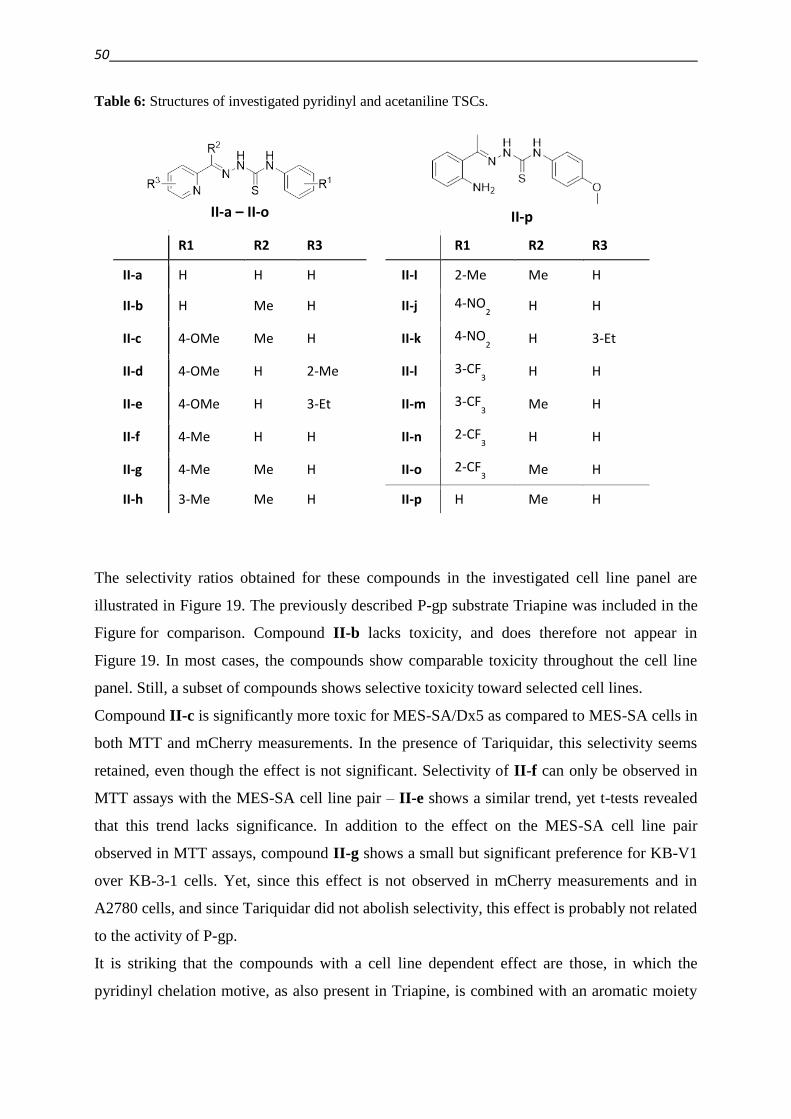
50
Table 6: Structures of investigated pyridinyl and acetaniline TSCs.
II-a – II-o
II-p
R1 R2 R3 R1 R2 R3
II-a H H H II-I 2-Me Me H
II-b H Me H II-j 4-NO2 H H
II-c 4-OMe Me H II-k 4-NO2 H 3-Et
II-d 4-OMe H 2-Me II-l 3-CF3 H H
II-e 4-OMe H 3-Et II-m 3-CF3 Me H
II-f 4-Me H H II-n 2-CF3 H H
II-g 4-Me Me H II-o 2-CF3 Me H
II-h 3-Me Me H II-p H Me H
The selectivity ratios obtained for these compounds in the investigated cell line panel are
illustrated in Figure 19. The previously described P-gp substrate Triapine was included in the
Figure for comparison. Compound II-b lacks toxicity, and does therefore not appear in
Figure 19. In most cases, the compounds show comparable toxicity throughout the cell line
panel. Still, a subset of compounds shows selective toxicity toward selected cell lines.
Compound II-c is significantly more toxic for MES-SA/Dx5 as compared to MES-SA cells in
both MTT and mCherry measurements. In the presence of Tariquidar, this selectivity seems
retained, even though the effect is not significant. Selectivity of II-f can only be observed in
MTT assays with the MES-SA cell line pair – II-e shows a similar trend, yet t-tests revealed
that this trend lacks significance. In addition to the effect on the MES-SA cell line pair
observed in MTT assays, compound II-g shows a small but significant preference for KB-V1
over KB-3-1 cells. Yet, since this effect is not observed in mCherry measurements and in
A2780 cells, and since Tariquidar did not abolish selectivity, this effect is probably not related
to the activity of P-gp.
It is striking that the compounds with a cell line dependent effect are those, in which the
pyridinyl chelation motive, as also present in Triapine, is combined with an aromatic moiety
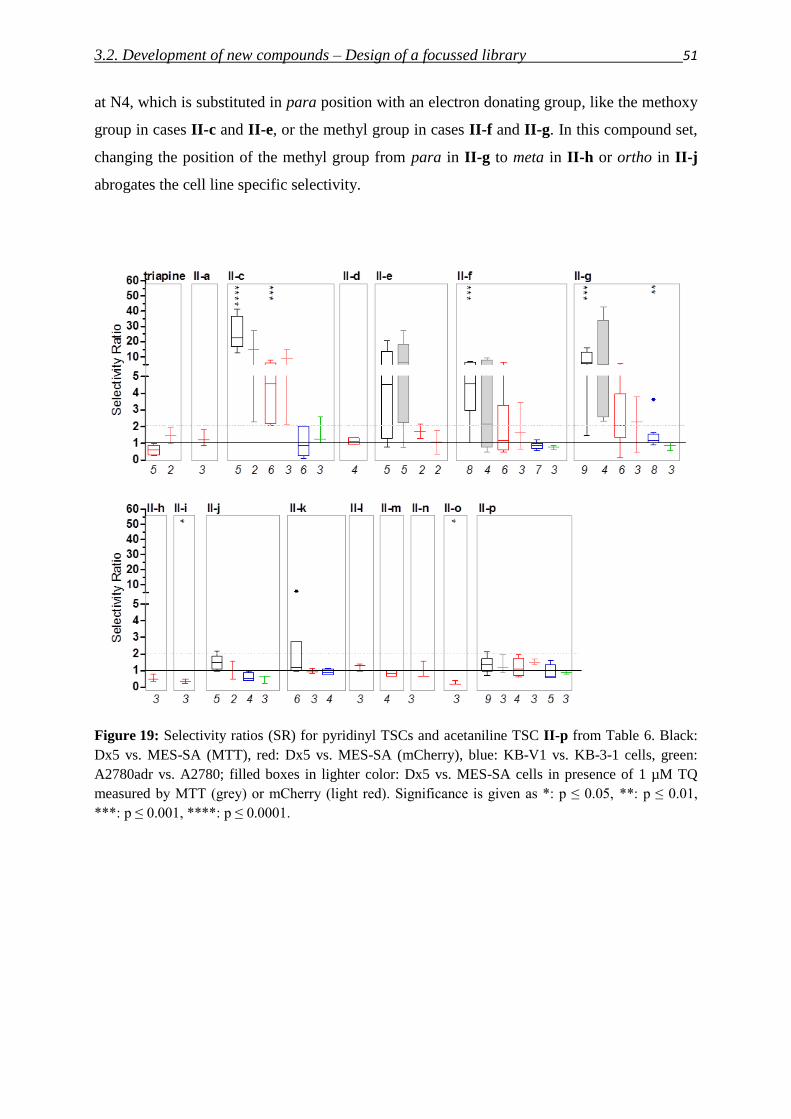
3.2. Development of new compounds – Design of a focussed library 51
at N4, which is substituted in para position with an electron donating group, like the methoxy
group in cases II-c and II-e, or the methyl group in cases II-f and II-g. In this compound set,
changing the position of the methyl group from para in II-g to meta in II-h or ortho in II-j
abrogates the cell line specific selectivity.
Figure 19: Selectivity ratios (SR) for pyridinyl TSCs and acetaniline TSC II-p from Table 6. Black:
Dx5 vs. MES-SA (MTT), red: Dx5 vs. MES-SA (mCherry), blue: KB-V1 vs. KB-3-1 cells, green:
A2780adr vs. A2780; filled boxes in lighter color: Dx5 vs. MES-SA cells in presence of 1 µM TQ
measured by MTT (grey) or mCherry (light red). Significance is given as *: p ≤ 0.05, **: p ≤ 0.01,
***: p ≤ 0.001, ****: p ≤ 0.0001.
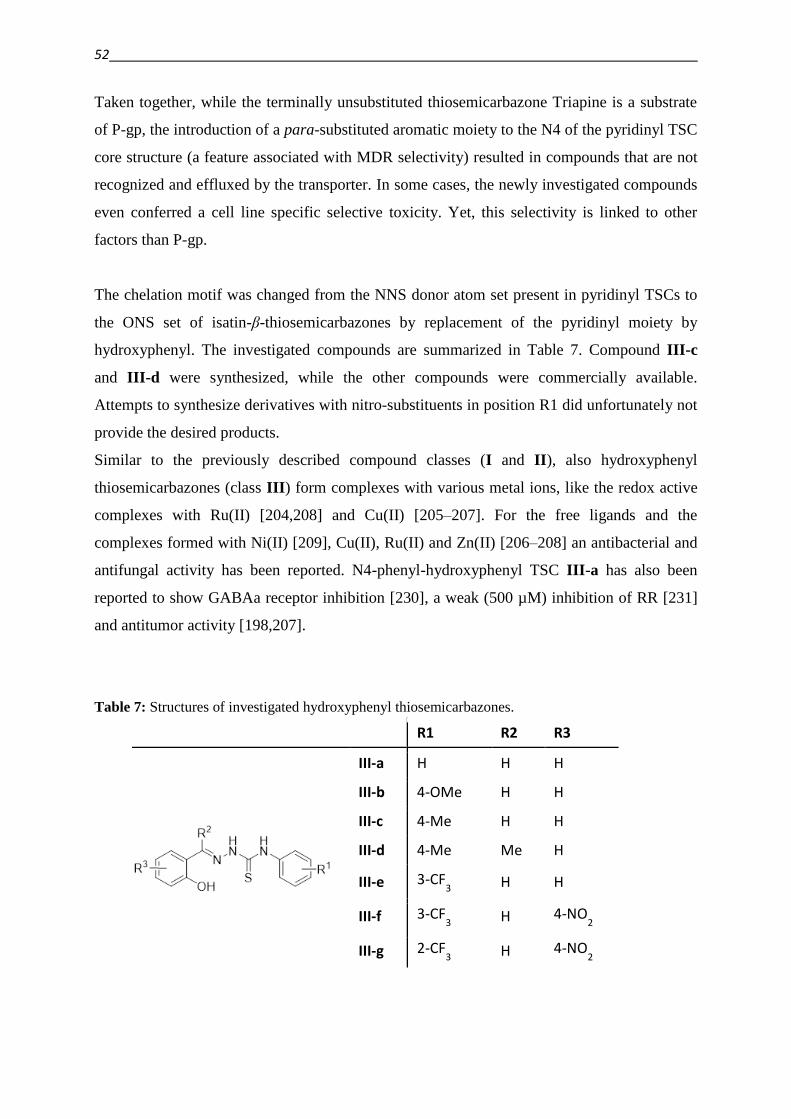
52
Taken together, while the terminally unsubstituted thiosemicarbazone Triapine is a substrate
of P-gp, the introduction of a para-substituted aromatic moiety to the N4 of the pyridinyl TSC
core structure (a feature associated with MDR selectivity) resulted in compounds that are not
recognized and effluxed by the transporter. In some cases, the newly investigated compounds
even conferred a cell line specific selective toxicity. Yet, this selectivity is linked to other
factors than P-gp.
The chelation motif was changed from the NNS donor atom set present in pyridinyl TSCs to
the ONS set of isatin-β-thiosemicarbazones by replacement of the pyridinyl moiety by
hydroxyphenyl. The investigated compounds are summarized in Table 7. Compound III-c
and III-d were synthesized, while the other compounds were commercially available.
Attempts to synthesize derivatives with nitro-substituents in position R1 did unfortunately not
provide the desired products.
Similar to the previously described compound classes (I and II), also hydroxyphenyl
thiosemicarbazones (class III) form complexes with various metal ions, like the redox active
complexes with Ru(II) [204,208] and Cu(II) [205–207]. For the free ligands and the
complexes formed with Ni(II) [209], Cu(II), Ru(II) and Zn(II) [206–208] an antibacterial and
antifungal activity has been reported. N4-phenyl-hydroxyphenyl TSC III-a has also been
reported to show GABAa receptor inhibition [230], a weak (500 µM) inhibition of RR [231]
and antitumor activity [198,207].
Table 7: Structures of investigated hydroxyphenyl thiosemicarbazones.
R1 R2 R3
III-a H H H
III-b 4-OMe H H
III-c 4-Me H H
III-d 4-Me Me H
III-e 3-CF3 H H
III-f 3-CF3 H 4-NO
2
III-g 2-CF3 H 4-NO
2
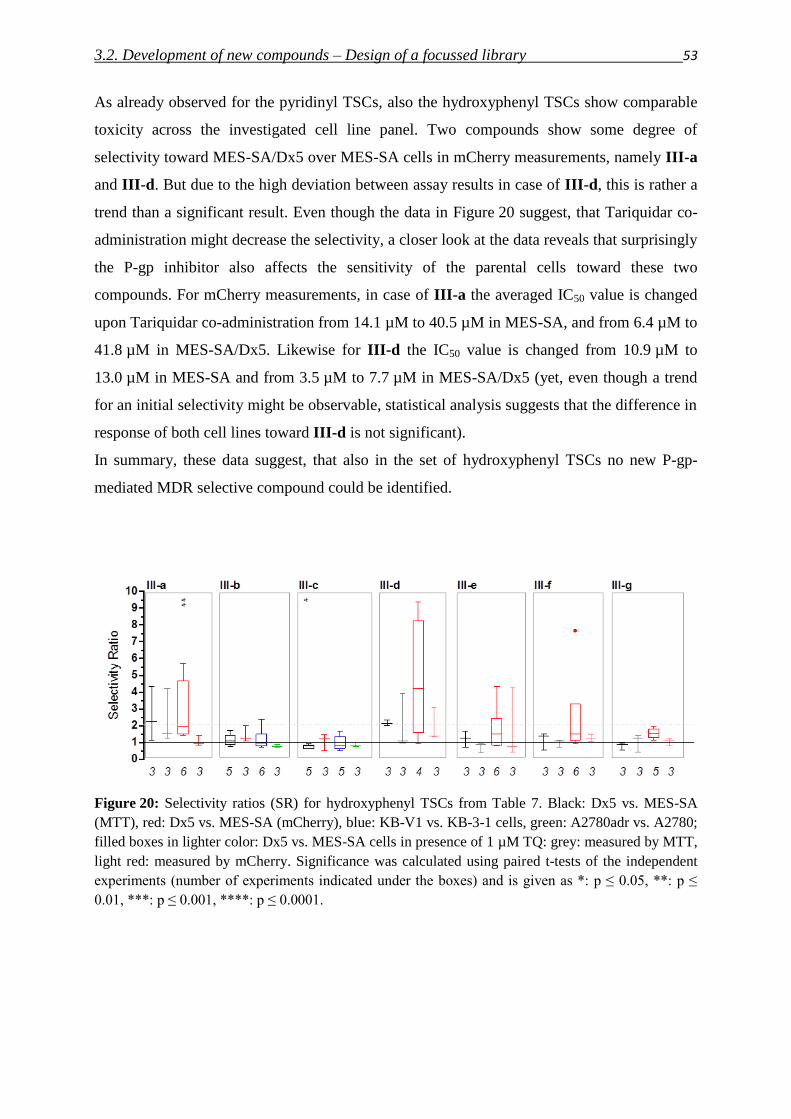
3.2. Development of new compounds – Design of a focussed library 53
As already observed for the pyridinyl TSCs, also the hydroxyphenyl TSCs show comparable
toxicity across the investigated cell line panel. Two compounds show some degree of
selectivity toward MES-SA/Dx5 over MES-SA cells in mCherry measurements, namely III-a
and III-d. But due to the high deviation between assay results in case of III-d, this is rather a
trend than a significant result. Even though the data in Figure 20 suggest, that Tariquidar co-
administration might decrease the selectivity, a closer look at the data reveals that surprisingly
the P-gp inhibitor also affects the sensitivity of the parental cells toward these two
compounds. For mCherry measurements, in case of III-a the averaged IC50 value is changed
upon Tariquidar co-administration from 14.1 µM to 40.5 µM in MES-SA, and from 6.4 µM to
41.8 µM in MES-SA/Dx5. Likewise for III-d the IC50 value is changed from 10.9 µM to
13.0 µM in MES-SA and from 3.5 µM to 7.7 µM in MES-SA/Dx5 (yet, even though a trend
for an initial selectivity might be observable, statistical analysis suggests that the difference in
response of both cell lines toward III-d is not significant).
In summary, these data suggest, that also in the set of hydroxyphenyl TSCs no new P-gp-
mediated MDR selective compound could be identified.
Figure 20: Selectivity ratios (SR) for hydroxyphenyl TSCs from Table 7. Black: Dx5 vs. MES-SA
(MTT), red: Dx5 vs. MES-SA (mCherry), blue: KB-V1 vs. KB-3-1 cells, green: A2780adr vs. A2780;
filled boxes in lighter color: Dx5 vs. MES-SA cells in presence of 1 µM TQ: grey: measured by MTT,
light red: measured by mCherry. Significance was calculated using paired t-tests of the independent
experiments (number of experiments indicated under the boxes) and is given as *: p ≤ 0.05, **: p ≤
0.01, ***: p ≤ 0.001, ****: p ≤ 0.0001.
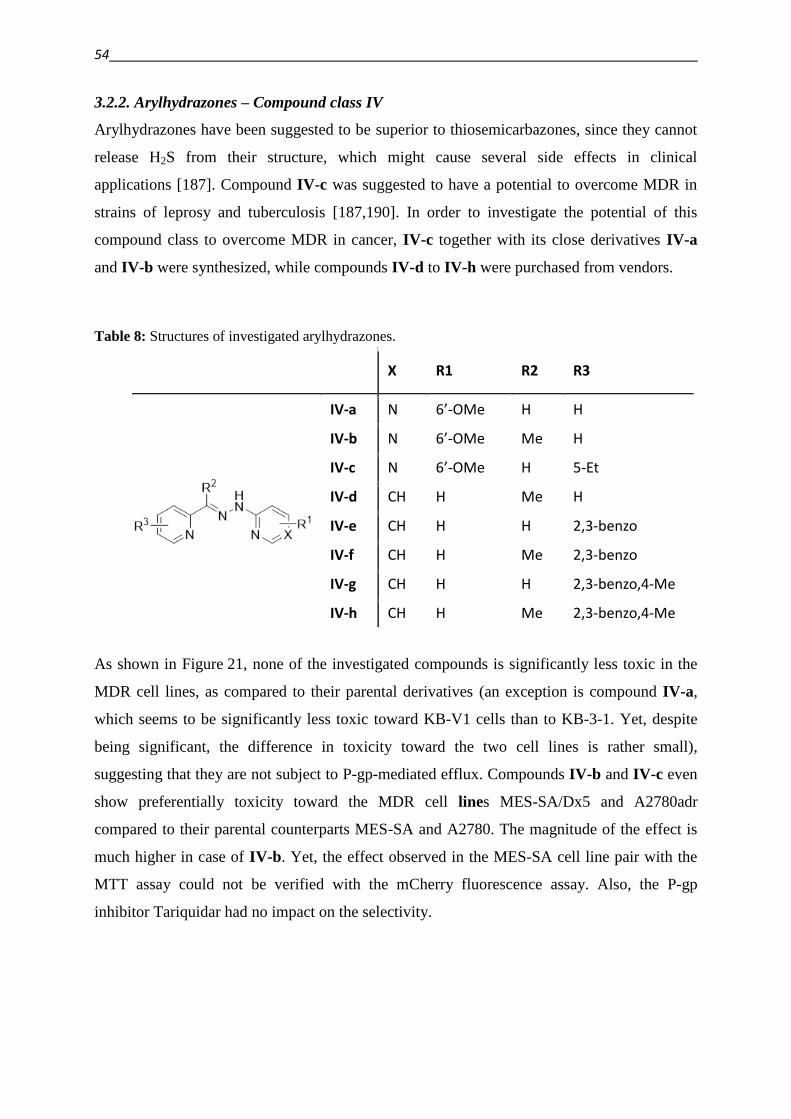
54
3.2.2. Arylhydrazones – Compound class IV
Arylhydrazones have been suggested to be superior to thiosemicarbazones, since they cannot
release H2S from their structure, which might cause several side effects in clinical
applications [187]. Compound IV-c was suggested to have a potential to overcome MDR in
strains of leprosy and tuberculosis [187,190]. In order to investigate the potential of this
compound class to overcome MDR in cancer, IV-c together with its close derivatives IV-a
and IV-b were synthesized, while compounds IV-d to IV-h were purchased from vendors.
Table 8: Structures of investigated arylhydrazones.
X R1 R2 R3
IV-a N 6’-OMe H H
IV-b N 6’-OMe Me H
IV-c N 6’-OMe H 5-Et
IV-d CH H Me H
IV-e CH H H 2,3-benzo
IV-f CH H Me 2,3-benzo
IV-g CH H H 2,3-benzo,4-Me
IV-h CH H Me 2,3-benzo,4-Me
As shown in Figure 21, none of the investigated compounds is significantly less toxic in the
MDR cell lines, as compared to their parental derivatives (an exception is compound IV-a,
which seems to be significantly less toxic toward KB-V1 cells than to KB-3-1. Yet, despite
being significant, the difference in toxicity toward the two cell lines is rather small),
suggesting that they are not subject to P-gp-mediated efflux. Compounds IV-b and IV-c even
show preferentially toxicity toward the MDR cell lines MES-SA/Dx5 and A2780adr
compared to their parental counterparts MES-SA and A2780. The magnitude of the effect is
much higher in case of IV-b. Yet, the effect observed in the MES-SA cell line pair with the
MTT assay could not be verified with the mCherry fluorescence assay. Also, the P-gp
inhibitor Tariquidar had no impact on the selectivity.
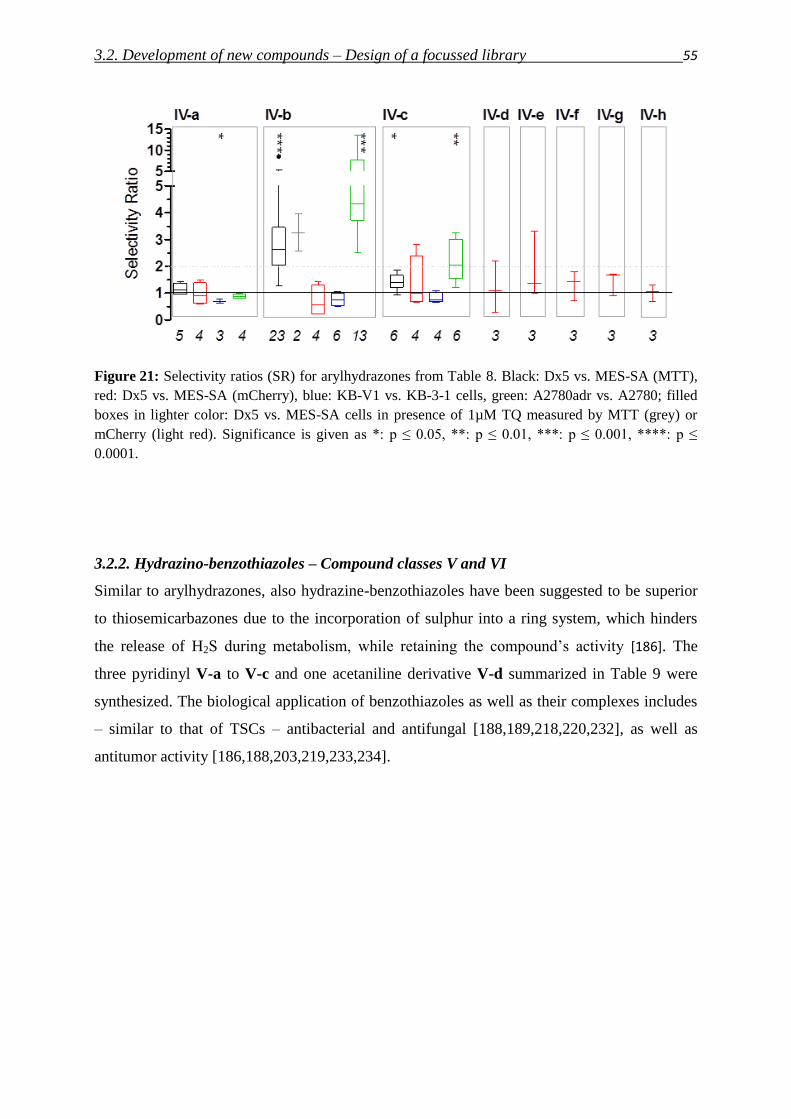
3.2. Development of new compounds – Design of a focussed library 55
Figure 21: Selectivity ratios (SR) for arylhydrazones from Table 8. Black: Dx5 vs. MES-SA (MTT),
red: Dx5 vs. MES-SA (mCherry), blue: KB-V1 vs. KB-3-1 cells, green: A2780adr vs. A2780; filled
boxes in lighter color: Dx5 vs. MES-SA cells in presence of 1µM TQ measured by MTT (grey) or
mCherry (light red). Significance is given as *: p ≤ 0.05, **: p ≤ 0.01, ***: p ≤ 0.001, ****: p ≤
0.0001.
3.2.2. Hydrazino-benzothiazoles – Compound classes V and VI
Similar to arylhydrazones, also hydrazine-benzothiazoles have been suggested to be superior
to thiosemicarbazones due to the incorporation of sulphur into a ring system, which hinders
the release of H2S during metabolism, while retaining the compound’s activity [186]. The
three pyridinyl V-a to V-c and one acetaniline derivative V-d summarized in Table 9 were
synthesized. The biological application of benzothiazoles as well as their complexes includes
– similar to that of TSCs – antibacterial and antifungal [188,189,218,220,232], as well as
antitumor activity [186,188,203,219,233,234].
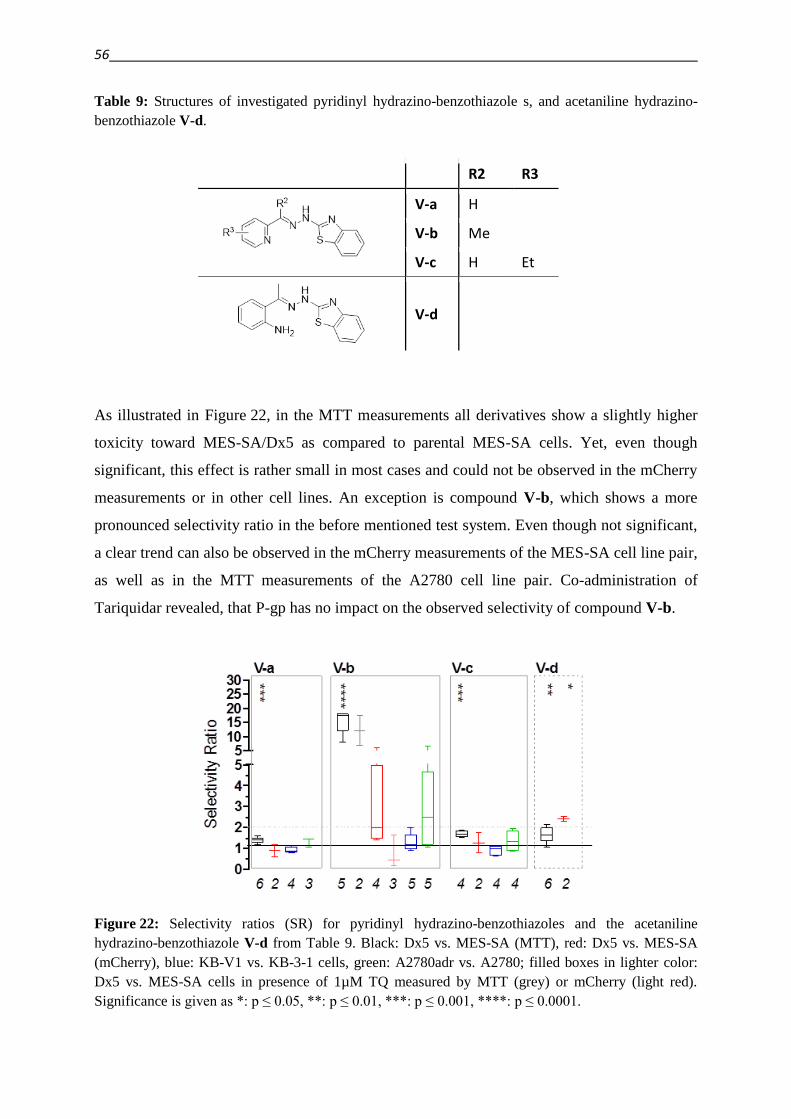
56
Table 9: Structures of investigated pyridinyl hydrazino-benzothiazole s, and acetaniline hydrazino-
benzothiazole V-d.
R2 R3
V-a H
V-b Me
V-c H Et
V-d
As illustrated in Figure 22, in the MTT measurements all derivatives show a slightly higher
toxicity toward MES-SA/Dx5 as compared to parental MES-SA cells. Yet, even though
significant, this effect is rather small in most cases and could not be observed in the mCherry
measurements or in other cell lines. An exception is compound V-b, which shows a more
pronounced selectivity ratio in the before mentioned test system. Even though not significant,
a clear trend can also be observed in the mCherry measurements of the MES-SA cell line pair,
as well as in the MTT measurements of the A2780 cell line pair. Co-administration of
Tariquidar revealed, that P-gp has no impact on the observed selectivity of compound V-b.
Figure 22: Selectivity ratios (SR) for pyridinyl hydrazino-benzothiazoles and the acetaniline
hydrazino-benzothiazole V-d from Table 9. Black: Dx5 vs. MES-SA (MTT), red: Dx5 vs. MES-SA
(mCherry), blue: KB-V1 vs. KB-3-1 cells, green: A2780adr vs. A2780; filled boxes in lighter color:
Dx5 vs. MES-SA cells in presence of 1µM TQ measured by MTT (grey) or mCherry (light red).
Significance is given as *: p ≤ 0.05, **: p ≤ 0.01, ***: p ≤ 0.001, ****: p ≤ 0.0001.
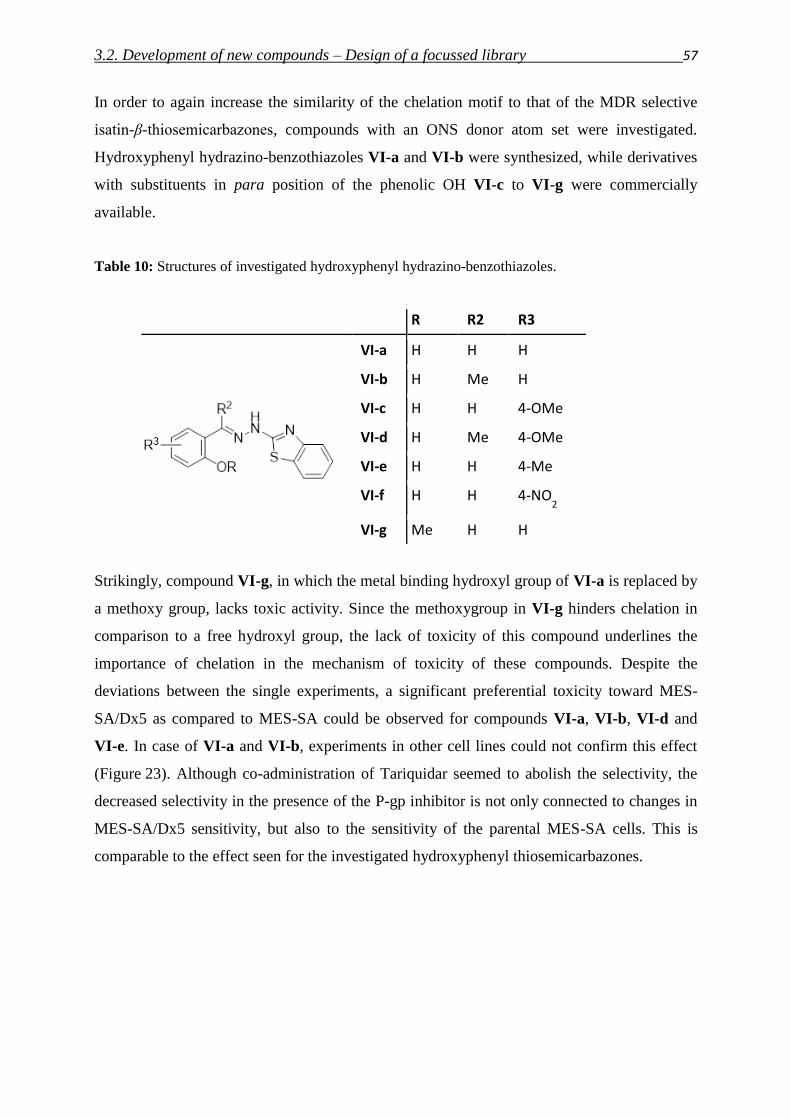
3.2. Development of new compounds – Design of a focussed library 57
In order to again increase the similarity of the chelation motif to that of the MDR selective
isatin-β-thiosemicarbazones, compounds with an ONS donor atom set were investigated.
Hydroxyphenyl hydrazino-benzothiazoles VI-a and VI-b were synthesized, while derivatives
with substituents in para position of the phenolic OH VI-c to VI-g were commercially
available.
Table 10: Structures of investigated hydroxyphenyl hydrazino-benzothiazoles.
R R2 R3
VI-a H H H
VI-b H Me H
VI-c H H 4-OMe
VI-d H Me 4-OMe
VI-e H H 4-Me
VI-f H H 4-NO2
VI-g Me H H
Strikingly, compound VI-g, in which the metal binding hydroxyl group of VI-a is replaced by
a methoxy group, lacks toxic activity. Since the methoxygroup in VI-g hinders chelation in
comparison to a free hydroxyl group, the lack of toxicity of this compound underlines the
importance of chelation in the mechanism of toxicity of these compounds. Despite the
deviations between the single experiments, a significant preferential toxicity toward MES-
SA/Dx5 as compared to MES-SA could be observed for compounds VI-a, VI-b, VI-d and
VI-e. In case of VI-a and VI-b, experiments in other cell lines could not confirm this effect
(Figure 23). Although co-administration of Tariquidar seemed to abolish the selectivity, the
decreased selectivity in the presence of the P-gp inhibitor is not only connected to changes in
MES-SA/Dx5 sensitivity, but also to the sensitivity of the parental MES-SA cells. This is
comparable to the effect seen for the investigated hydroxyphenyl thiosemicarbazones.
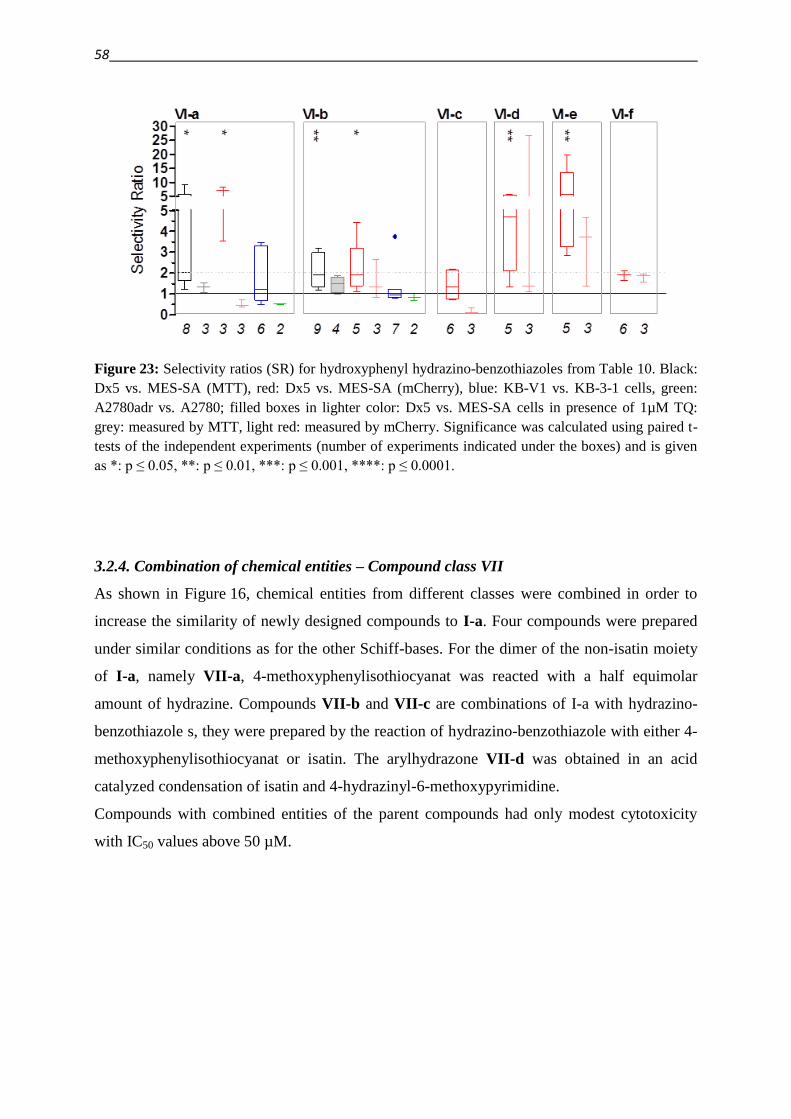
58
Figure 23: Selectivity ratios (SR) for hydroxyphenyl hydrazino-benzothiazoles from Table 10. Black:
Dx5 vs. MES-SA (MTT), red: Dx5 vs. MES-SA (mCherry), blue: KB-V1 vs. KB-3-1 cells, green:
A2780adr vs. A2780; filled boxes in lighter color: Dx5 vs. MES-SA cells in presence of 1µM TQ:
grey: measured by MTT, light red: measured by mCherry. Significance was calculated using paired t-
tests of the independent experiments (number of experiments indicated under the boxes) and is given
as *: p ≤ 0.05, **: p ≤ 0.01, ***: p ≤ 0.001, ****: p ≤ 0.0001.
3.2.4. Combination of chemical entities – Compound class VII
As shown in Figure 16, chemical entities from different classes were combined in order to
increase the similarity of newly designed compounds to I-a. Four compounds were prepared
under similar conditions as for the other Schiff-bases. For the dimer of the non-isatin moiety
of I-a, namely VII-a, 4-methoxyphenylisothiocyanat was reacted with a half equimolar
amount of hydrazine. Compounds VII-b and VII-c are combinations of I-a with hydrazino-
benzothiazole s, they were prepared by the reaction of hydrazino-benzothiazole with either 4-
methoxyphenylisothiocyanat or isatin. The arylhydrazone VII-d was obtained in an acid
catalyzed condensation of isatin and 4-hydrazinyl-6-methoxypyrimidine.
Compounds with combined entities of the parent compounds had only modest cytotoxicity
with IC50 values above 50 µM.
3.2. Development of new compounds – Design of a focussed library 59
3.2.5. Structure activity relationships in the focused library and beyond
Even though most of the scrutinized compounds do not show enhanced toxicity toward P-gp
expressing MDR cell lines over their parental P-gp negative cells, the test results of the library
disclose trends in toxicity, which are independent of the resistance status of the investigated
cell lines. For illustration, results are summarized in the structure activity relationship matrix
(SARM) shown in Figure 24 [235]. Numbers represent averaged pIC50 values of at least three
independent experiments and are colored according to the color code given in the inset next to
the matrix.
As already mentioned in chapter 3.2.4., the combination of chemical entities resulted in
nontoxic compounds VII-a, VII-b, VII-c and VII-d.
Hydrazino-benzothiazoles have been described in the literature as metabolically more stable
derivatives of thiosemicarbazones with retained pharmacological activity [186]. Indeed,
comparison of the respective columns in the SARM confirms the retained (anticancer-)
activity of the two scaffolds: the pyridinyl hydrazino-benzothiazole V-a shows similar
toxicity compared to the corresponding TSC II-a. Likewise the hydroxyphenyl hydrazino-
benzothiazole VI-a is comparable to the corresponding TSC III-a. Furthermore comparing
the columns of differently substituted N4-aromatic moieties in the investigated
thiosemicarbazones it appears that N4-para-nitrophenyl derivatives have a lower toxicity
compared to para-tolyl and para-methoxyphenyl substituted counterparts (I-d vs. I-a, I-c; II-
j vs. II-f; II-k vs. II-e).
Comparing the rows of the SARM, further trends can be identified with respect to the impact
of different donor atom sets and imino carbon substitution on toxicity of the compounds. Both
will influence the metal binding properties of the chelators, which might be crucial in the
mechanism of toxicity of these compounds.
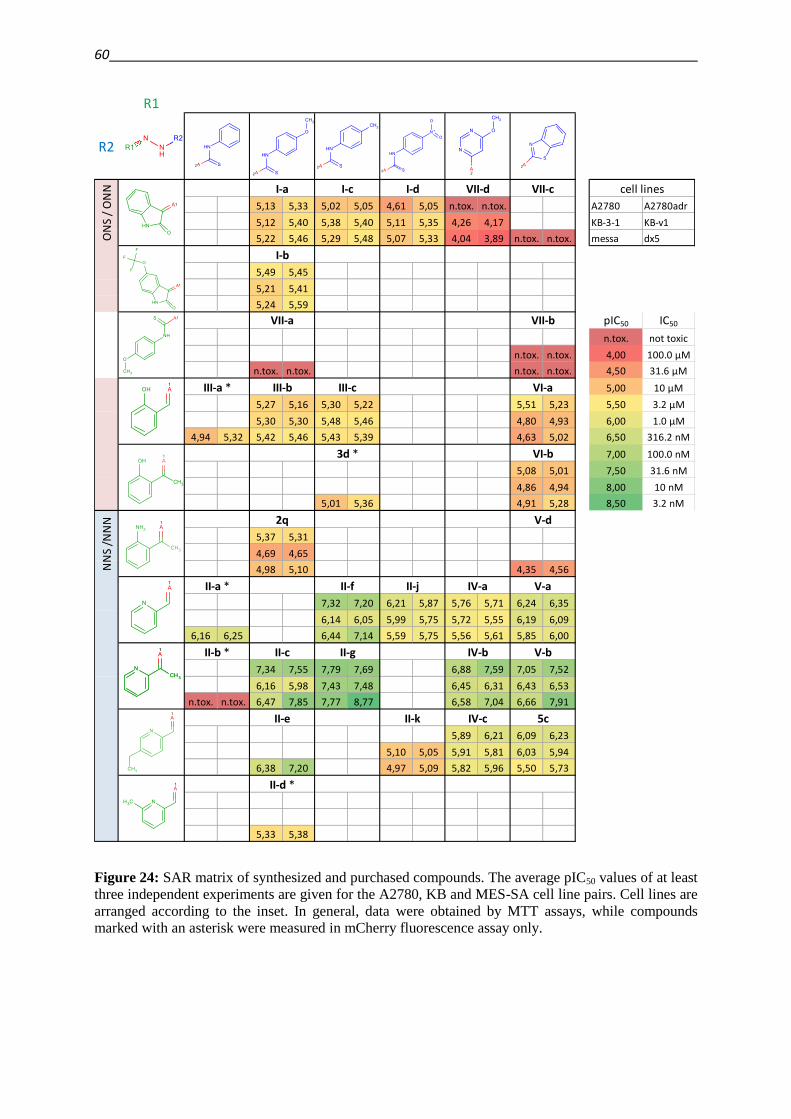
60
Figure 24: SAR matrix of synthesized and purchased compounds. The average pIC50 values of at least
three independent experiments are given for the A2780, KB and MES-SA cell line pairs. Cell lines are
arranged according to the inset. In general, data were obtained by MTT assays, while compounds
marked with an asterisk were measured in mCherry fluorescence assay only.
R1
R2
5,13 5,33 5,02 5,05 4,61 5,05 n.tox. n.tox. A2780 A2780adr
5,12 5,40 5,38 5,40 5,11 5,35 4,26 4,17 KB-3-1 KB-v1
5,22 5,46 5,29 5,48 5,07 5,33 4,04 3,89 n.tox. n.tox. messa dx5
5,49 5,45
5,21 5,41
5,24 5,59
pIC50 IC50
n.tox. not toxic
n.tox. n.tox. 4,00 100.0 µM
n.tox. n.tox. n.tox. n.tox. 4,50 31.6 µM
5,00 10 µM
5,27 5,16 5,30 5,22 5,51 5,23 5,50 3.2 µM
5,30 5,30 5,48 5,46 4,80 4,93 6,00 1.0 µM
4,94 5,32 5,42 5,46 5,43 5,39 4,63 5,02 6,50 316.2 nM
7,00 100.0 nM
5,08 5,01 7,50 31.6 nM
4,86 4,94 8,00 10 nM
5,01 5,36 4,91 5,28 8,50 3.2 nM
5,37 5,31
4,69 4,65
4,98 5,10 4,35 4,56
7,32 7,20 6,21 5,87 5,76 5,71 6,24 6,35
6,14 6,05 5,99 5,75 5,72 5,55 6,19 6,09
6,16 6,25 6,44 7,14 5,59 5,75 5,56 5,61 5,85 6,00
7,34 7,55 7,79 7,69 6,88 7,59 7,05 7,52
6,16 5,98 7,43 7,48 6,45 6,31 6,43 6,53
n.tox. n.tox. 6,47 7,85 7,77 8,77 6,58 7,04 6,66 7,91
5,89 6,21 6,09 6,23
5,10 5,05 5,91 5,81 6,03 5,94
6,38 7,20 4,97 5,09 5,82 5,96 5,50 5,73
5,33 5,38
VII-d VII-c cell lines
VI-b
IV-a V-a
ON
S /
ON
N I-a I-c I-d
VI-a
VII-a
I-b
VII-b
3d *
III-a * III-b III-c
IV-b V-b
II-a * II-f II-j
NN
S /N
NN 2q V-d
II-e II-k
II-b * II-c II-g
IV-c 5c
II-d *
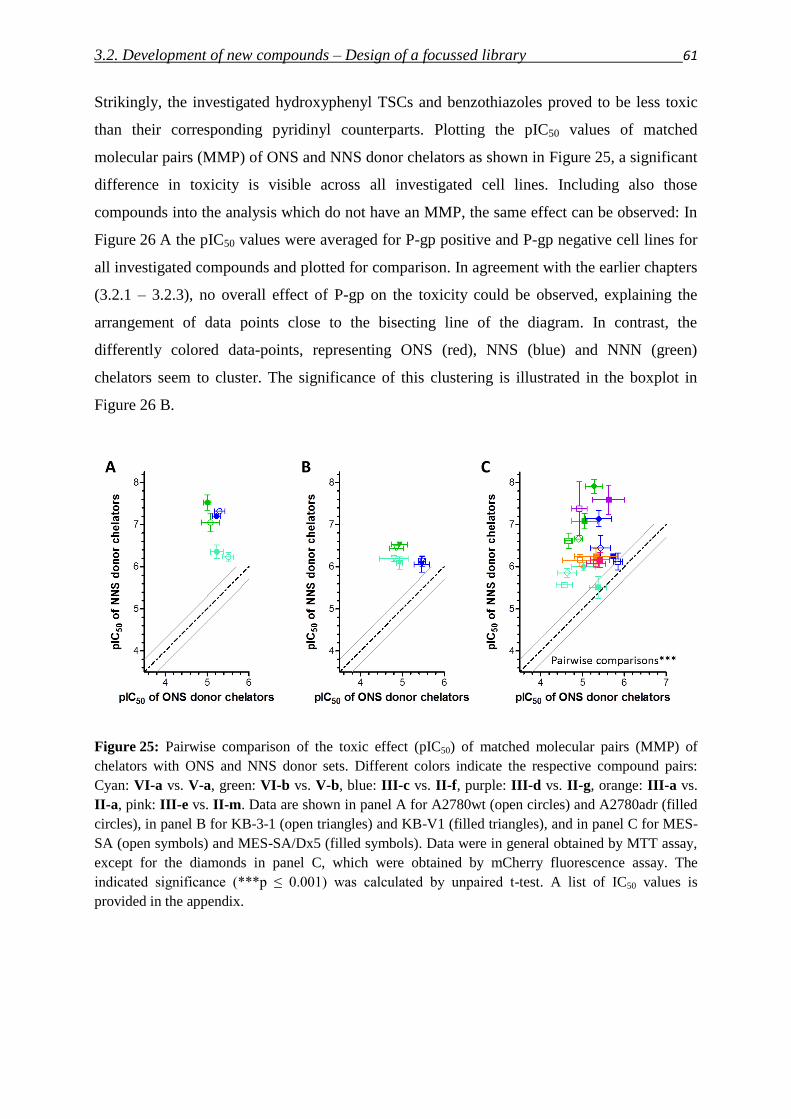
3.2. Development of new compounds – Design of a focussed library 61
Strikingly, the investigated hydroxyphenyl TSCs and benzothiazoles proved to be less toxic
than their corresponding pyridinyl counterparts. Plotting the pIC50 values of matched
molecular pairs (MMP) of ONS and NNS donor chelators as shown in Figure 25, a significant
difference in toxicity is visible across all investigated cell lines. Including also those
compounds into the analysis which do not have an MMP, the same effect can be observed: In
Figure 26 A the pIC50 values were averaged for P-gp positive and P-gp negative cell lines for
all investigated compounds and plotted for comparison. In agreement with the earlier chapters
(3.2.1 – 3.2.3), no overall effect of P-gp on the toxicity could be observed, explaining the
arrangement of data points close to the bisecting line of the diagram. In contrast, the
differently colored data-points, representing ONS (red), NNS (blue) and NNN (green)
chelators seem to cluster. The significance of this clustering is illustrated in the boxplot in
Figure 26 B.
Figure 25: Pairwise comparison of the toxic effect (pIC50) of matched molecular pairs (MMP) of
chelators with ONS and NNS donor sets. Different colors indicate the respective compound pairs:
Cyan: VI-a vs. V-a, green: VI-b vs. V-b, blue: III-c vs. II-f, purple: III-d vs. II-g, orange: III-a vs.
II-a, pink: III-e vs. II-m. Data are shown in panel A for A2780wt (open circles) and A2780adr (filled
circles), in panel B for KB-3-1 (open triangles) and KB-V1 (filled triangles), and in panel C for MES-
SA (open symbols) and MES-SA/Dx5 (filled symbols). Data were in general obtained by MTT assay,
except for the diamonds in panel C, which were obtained by mCherry fluorescence assay. The
indicated significance (***p ≤ 0.001) was calculated by unpaired t-test. A list of IC50 values is
provided in the appendix.
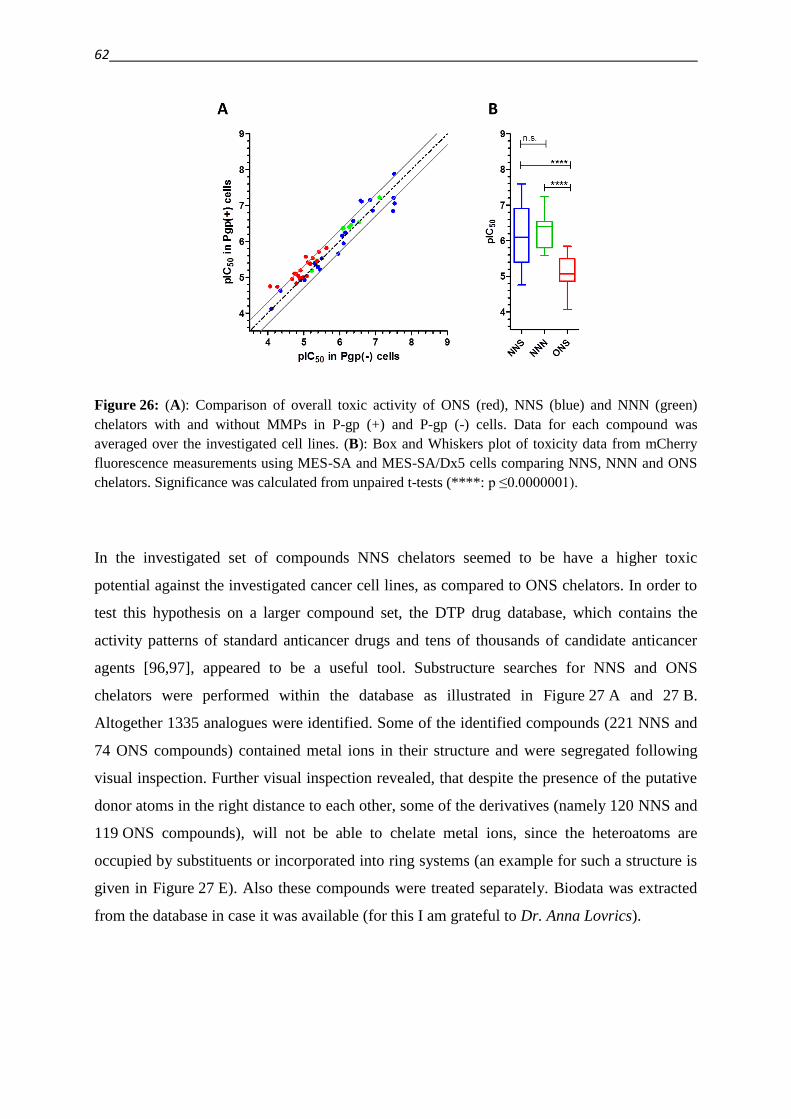
62
Figure 26: (A): Comparison of overall toxic activity of ONS (red), NNS (blue) and NNN (green)
chelators with and without MMPs in P-gp (+) and P-gp (-) cells. Data for each compound was
averaged over the investigated cell lines. (B): Box and Whiskers plot of toxicity data from mCherry
fluorescence measurements using MES-SA and MES-SA/Dx5 cells comparing NNS, NNN and ONS
chelators. Significance was calculated from unpaired t-tests (****: p ≤0.0000001).
In the investigated set of compounds NNS chelators seemed to be have a higher toxic
potential against the investigated cancer cell lines, as compared to ONS chelators. In order to
test this hypothesis on a larger compound set, the DTP drug database, which contains the
activity patterns of standard anticancer drugs and tens of thousands of candidate anticancer
agents [96,97], appeared to be a useful tool. Substructure searches for NNS and ONS
chelators were performed within the database as illustrated in Figure 27 A and 27 B.
Altogether 1335 analogues were identified. Some of the identified compounds (221 NNS and
74 ONS compounds) contained metal ions in their structure and were segregated following
visual inspection. Further visual inspection revealed, that despite the presence of the putative
donor atoms in the right distance to each other, some of the derivatives (namely 120 NNS and
119 ONS compounds), will not be able to chelate metal ions, since the heteroatoms are
occupied by substituents or incorporated into ring systems (an example for such a structure is
given in Figure 27 E). Also these compounds were treated separately. Biodata was extracted
from the database in case it was available (for this I am grateful to Dr. Anna Lovrics).
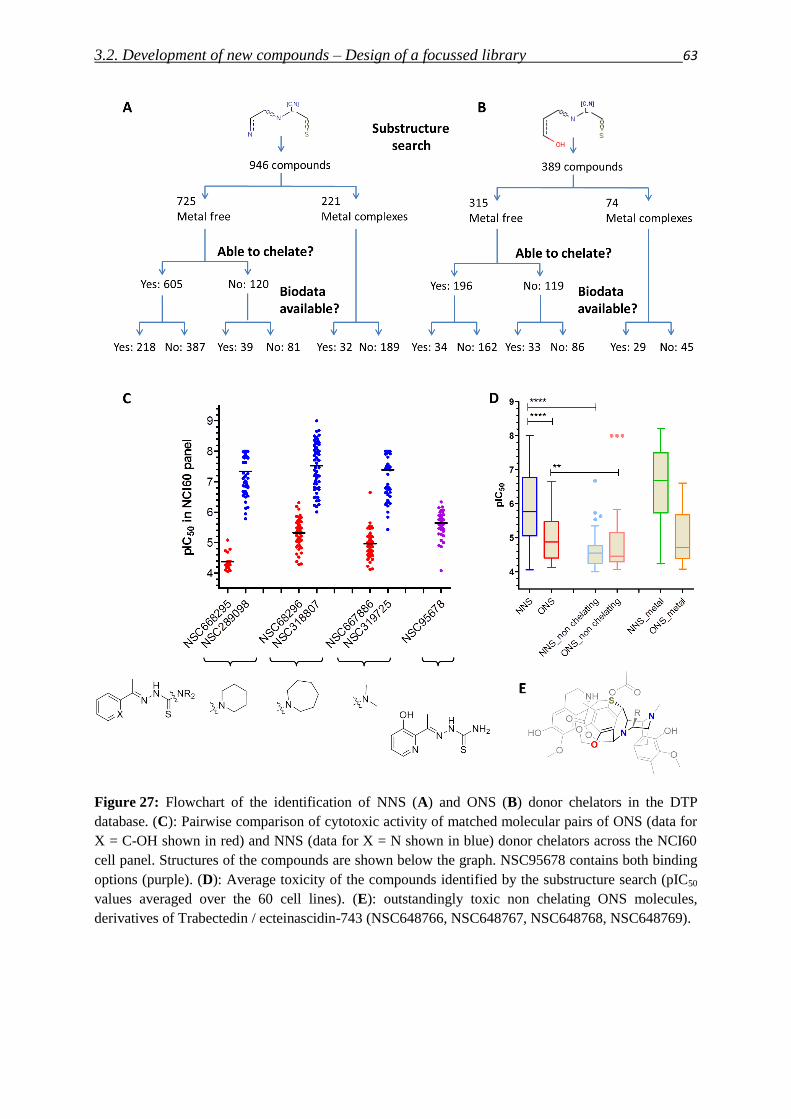
3.2. Development of new compounds – Design of a focussed library 63
Figure 27: Flowchart of the identification of NNS (A) and ONS (B) donor chelators in the DTP
database. (C): Pairwise comparison of cytotoxic activity of matched molecular pairs of ONS (data for
X = C-OH shown in red) and NNS (data for X = N shown in blue) donor chelators across the NCI60
cell panel. Structures of the compounds are shown below the graph. NSC95678 contains both binding
options (purple). (D): Average toxicity of the compounds identified by the substructure search (pIC50
values averaged over the 60 cell lines). (E): outstandingly toxic non chelating ONS molecules,
derivatives of Trabectedin / ecteinascidin-743 (NSC648766, NSC648767, NSC648768, NSC648769).
64
Within the set of compounds with available biodata, three matched molecular pairs (MMPs)
could be identified with ONS and NNS donor atom sets. Figure 27 C shows the available
biodata of these compounds across the NCI60 panel. The structures of these pairs are
displayed below the data with X representing C-OH for the ONS donor chelators (data in red),
or N for the NNS donor chelators (data in blue). The three additional MMPs confirm a higher
toxicity of NNS chelators over their ONS counterparts irrespective of the investigated cell
line. Interestingly, NSC95678, which is able to chelate in either NNS or ONS binding mode,
has a moderate toxicity between that of the other NNS and ONS chelators.
In order to compare the activity of the 385 compounds for which biodata were available, the
average pIC50 value over the NCI60 panel was determined for each compound. The boxplot in
Figure 27 D shows that the superior activity of NNS over ONS chelators found in the DTP
database is significant. This is especially interesting, since the identified compounds display a
high diversity that is presumably associated with different mechanisms of toxicity.
A similar trend could also be observed for the diverse metal complexes. Though, it has to be
noted, that the identified complexes contain different metal ions, which might lead to
misleading conclusions, since not only the properties of the ligand, but also the nature of the
metal ions that are incorporated into the complex, will affect its biological activity.
The lack of activity of the non-chelating derivative VI-g within the designed library suggested
a huge impact of chelation on the toxicity of the investigated compounds. Indeed, non-
chelating derivatives identified in the DTP, despite their structural diversity, show a
significantly decreased toxicity. Within the non-chelating derivatives there is no difference in
toxicity between NNS and ONS containing structures. In comparison to the chelating
derivatives these compounds are generally less potent. Nevertheless, within this non-chelating
subset, four compounds show an outstandingly high toxicity. The structural scaffold of these
compounds is shown in Figure 27 E (within the four derivatives R is differing). It is apparent,
that despite the putative metal-binding substructure motive, by which they were identified,
their structure is very different from the other compounds: they are derivatives of the marine
natural product Trabectedin (ecteinascidin-743, Figure 27 E), which is currently undergoing
clinical trials (phase III) in the USA, while it is approved for cancer treatment in Europe
[236–238].
Since chelation seems to be crucial for the activity of the investigated compounds, the
superior activity of NNS (and NNN) donor atom chelators over ONS donors might be related
to different metal binding preferences. Chelators with distinct donor atoms show a binding
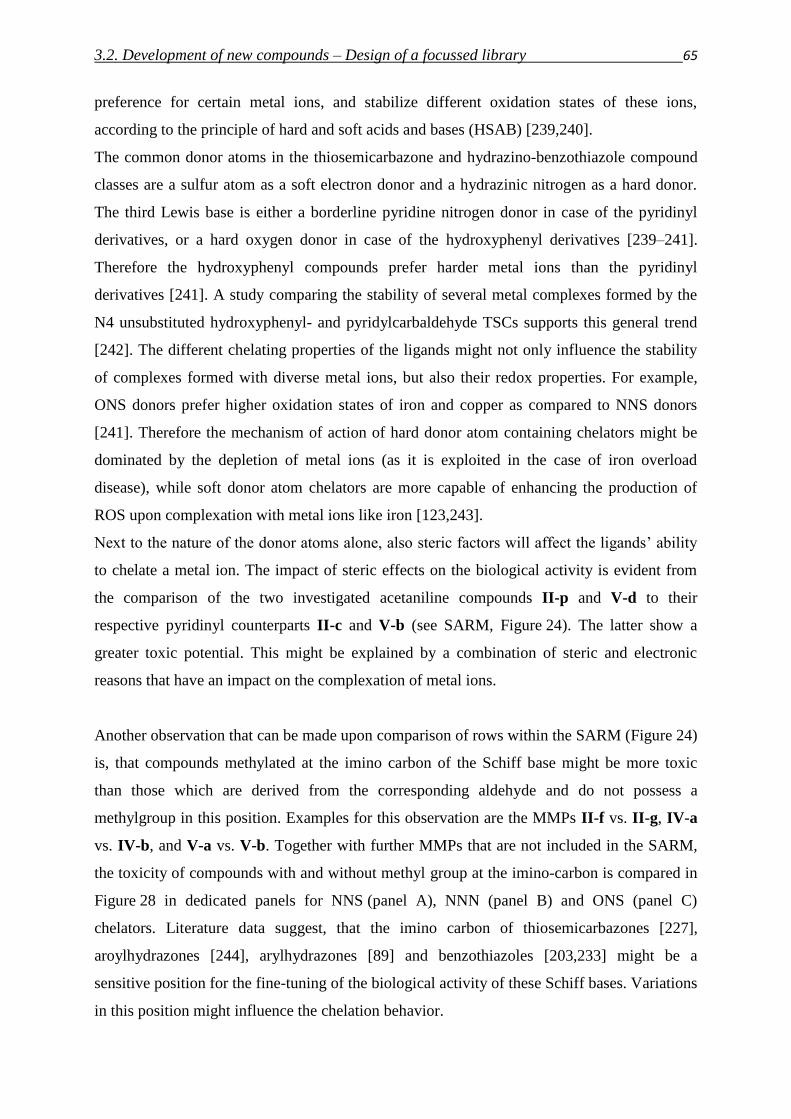
3.2. Development of new compounds – Design of a focussed library 65
preference for certain metal ions, and stabilize different oxidation states of these ions,
according to the principle of hard and soft acids and bases (HSAB) [239,240].
The common donor atoms in the thiosemicarbazone and hydrazino-benzothiazole compound
classes are a sulfur atom as a soft electron donor and a hydrazinic nitrogen as a hard donor.
The third Lewis base is either a borderline pyridine nitrogen donor in case of the pyridinyl
derivatives, or a hard oxygen donor in case of the hydroxyphenyl derivatives [239–241].
Therefore the hydroxyphenyl compounds prefer harder metal ions than the pyridinyl
derivatives [241]. A study comparing the stability of several metal complexes formed by the
N4 unsubstituted hydroxyphenyl- and pyridylcarbaldehyde TSCs supports this general trend
[242]. The different chelating properties of the ligands might not only influence the stability
of complexes formed with diverse metal ions, but also their redox properties. For example,
ONS donors prefer higher oxidation states of iron and copper as compared to NNS donors
[241]. Therefore the mechanism of action of hard donor atom containing chelators might be
dominated by the depletion of metal ions (as it is exploited in the case of iron overload
disease), while soft donor atom chelators are more capable of enhancing the production of
ROS upon complexation with metal ions like iron [123,243].
Next to the nature of the donor atoms alone, also steric factors will affect the ligands’ ability
to chelate a metal ion. The impact of steric effects on the biological activity is evident from
the comparison of the two investigated acetaniline compounds II-p and V-d to their
respective pyridinyl counterparts II-c and V-b (see SARM, Figure 24). The latter show a
greater toxic potential. This might be explained by a combination of steric and electronic
reasons that have an impact on the complexation of metal ions.
Another observation that can be made upon comparison of rows within the SARM (Figure 24)
is, that compounds methylated at the imino carbon of the Schiff base might be more toxic
than those which are derived from the corresponding aldehyde and do not possess a
methylgroup in this position. Examples for this observation are the MMPs II-f vs. II-g, IV-a
vs. IV-b, and V-a vs. V-b. Together with further MMPs that are not included in the SARM,
the toxicity of compounds with and without methyl group at the imino-carbon is compared in
Figure 28 in dedicated panels for NNS (panel A), NNN (panel B) and ONS (panel C)
chelators. Literature data suggest, that the imino carbon of thiosemicarbazones [227],
aroylhydrazones [244], arylhydrazones [89] and benzothiazoles [203,233] might be a
sensitive position for the fine-tuning of the biological activity of these Schiff bases. Variations
in this position might influence the chelation behavior.
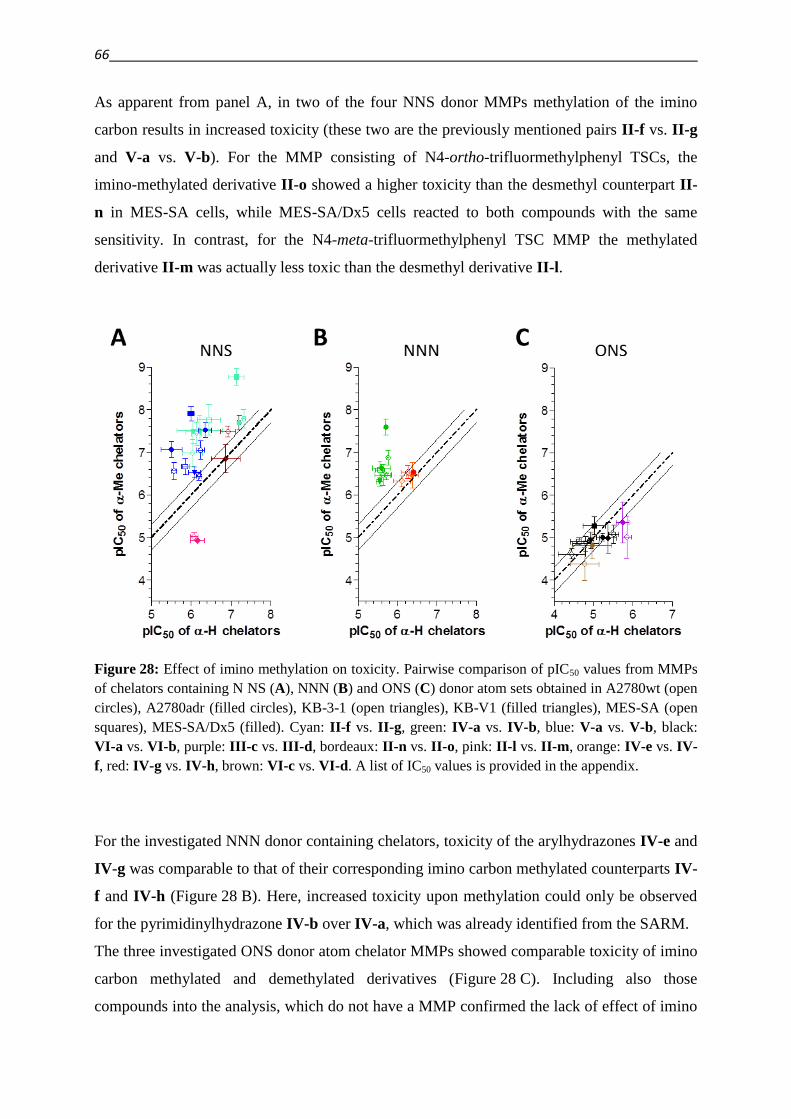
66
As apparent from panel A, in two of the four NNS donor MMPs methylation of the imino
carbon results in increased toxicity (these two are the previously mentioned pairs II-f vs. II-g
and V-a vs. V-b). For the MMP consisting of N4-ortho-trifluormethylphenyl TSCs, the
imino-methylated derivative II-o showed a higher toxicity than the desmethyl counterpart II-
n in MES-SA cells, while MES-SA/Dx5 cells reacted to both compounds with the same
sensitivity. In contrast, for the N4-meta-trifluormethylphenyl TSC MMP the methylated
derivative II-m was actually less toxic than the desmethyl derivative II-l.
Figure 28: Effect of imino methylation on toxicity. Pairwise comparison of pIC50 values from MMPs
of chelators containing N NS (A), NNN (B) and ONS (C) donor atom sets obtained in A2780wt (open
circles), A2780adr (filled circles), KB-3-1 (open triangles), KB-V1 (filled triangles), MES-SA (open
squares), MES-SA/Dx5 (filled). Cyan: II-f vs. II-g, green: IV-a vs. IV-b, blue: V-a vs. V-b, black:
VI-a vs. VI-b, purple: III-c vs. III-d, bordeaux: II-n vs. II-o, pink: II-l vs. II-m, orange: IV-e vs. IV-
f, red: IV-g vs. IV-h, brown: VI-c vs. VI-d. A list of IC50 values is provided in the appendix.
For the investigated NNN donor containing chelators, toxicity of the arylhydrazones IV-e and
IV-g was comparable to that of their corresponding imino carbon methylated counterparts IV-
f and IV-h (Figure 28 B). Here, increased toxicity upon methylation could only be observed
for the pyrimidinylhydrazone IV-b over IV-a, which was already identified from the SARM.
The three investigated ONS donor atom chelator MMPs showed comparable toxicity of imino
carbon methylated and demethylated derivatives (Figure 28 C). Including also those
compounds into the analysis, which do not have a MMP confirmed the lack of effect of imino
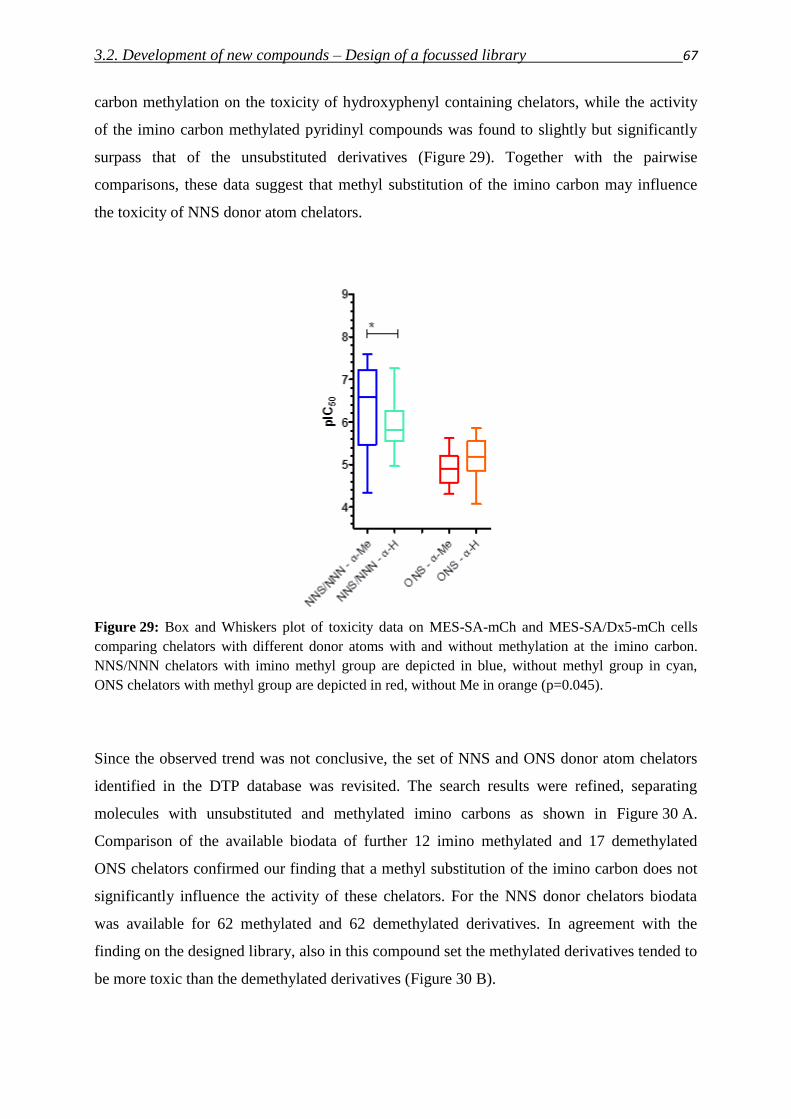
3.2. Development of new compounds – Design of a focussed library 67
carbon methylation on the toxicity of hydroxyphenyl containing chelators, while the activity
of the imino carbon methylated pyridinyl compounds was found to slightly but significantly
surpass that of the unsubstituted derivatives (Figure 29). Together with the pairwise
comparisons, these data suggest that methyl substitution of the imino carbon may influence
the toxicity of NNS donor atom chelators.
Figure 29: Box and Whiskers plot of toxicity data on MES-SA-mCh and MES-SA/Dx5-mCh cells
comparing chelators with different donor atoms with and without methylation at the imino carbon.
NNS/NNN chelators with imino methyl group are depicted in blue, without methyl group in cyan,
ONS chelators with methyl group are depicted in red, without Me in orange (p=0.045).
Since the observed trend was not conclusive, the set of NNS and ONS donor atom chelators
identified in the DTP database was revisited. The search results were refined, separating
molecules with unsubstituted and methylated imino carbons as shown in Figure 30 A.
Comparison of the available biodata of further 12 imino methylated and 17 demethylated
ONS chelators confirmed our finding that a methyl substitution of the imino carbon does not
significantly influence the activity of these chelators. For the NNS donor chelators biodata
was available for 62 methylated and 62 demethylated derivatives. In agreement with the
finding on the designed library, also in this compound set the methylated derivatives tended to
be more toxic than the demethylated derivatives (Figure 30 B).
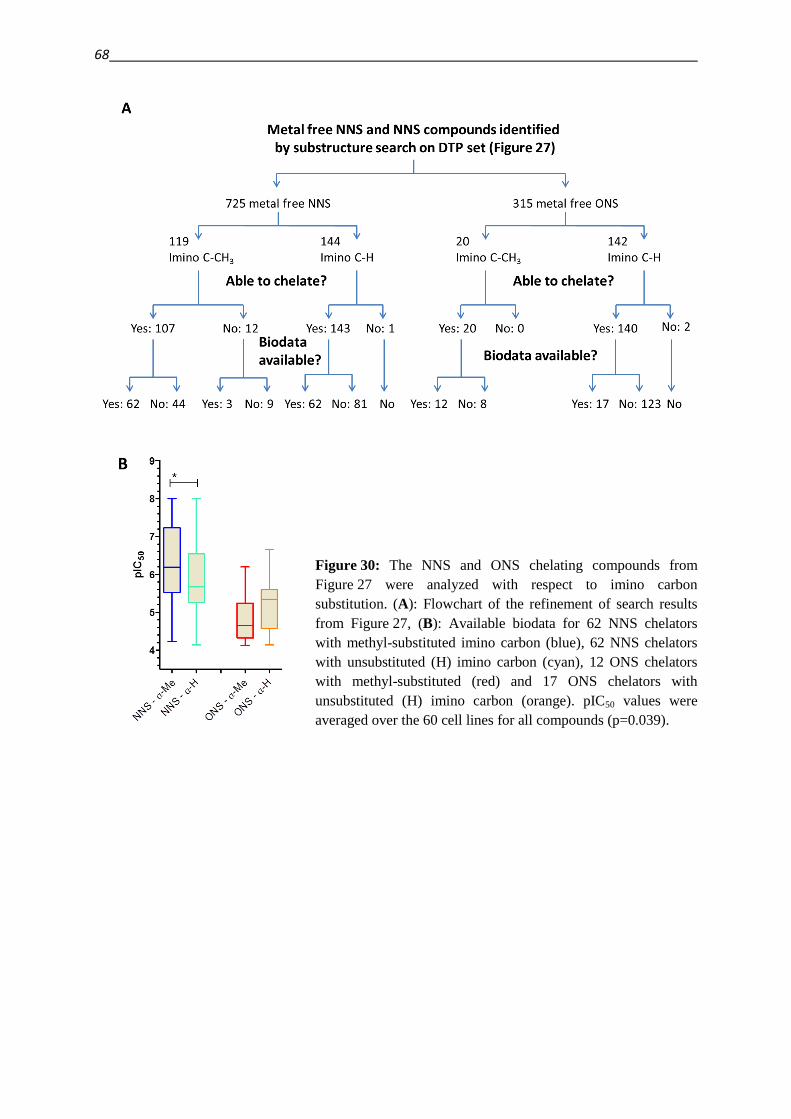
68
Figure 30: The NNS and ONS chelating compounds from
Figure 27 were analyzed with respect to imino carbon
substitution. (A): Flowchart of the refinement of search results
from Figure 27, (B): Available biodata for 62 NNS chelators
with methyl-substituted imino carbon (blue), 62 NNS chelators
with unsubstituted (H) imino carbon (cyan), 12 ONS chelators
with methyl-substituted (red) and 17 ONS chelators with
unsubstituted (H) imino carbon (orange). pIC50 values were
averaged over the 60 cell lines for all compounds (p=0.039).
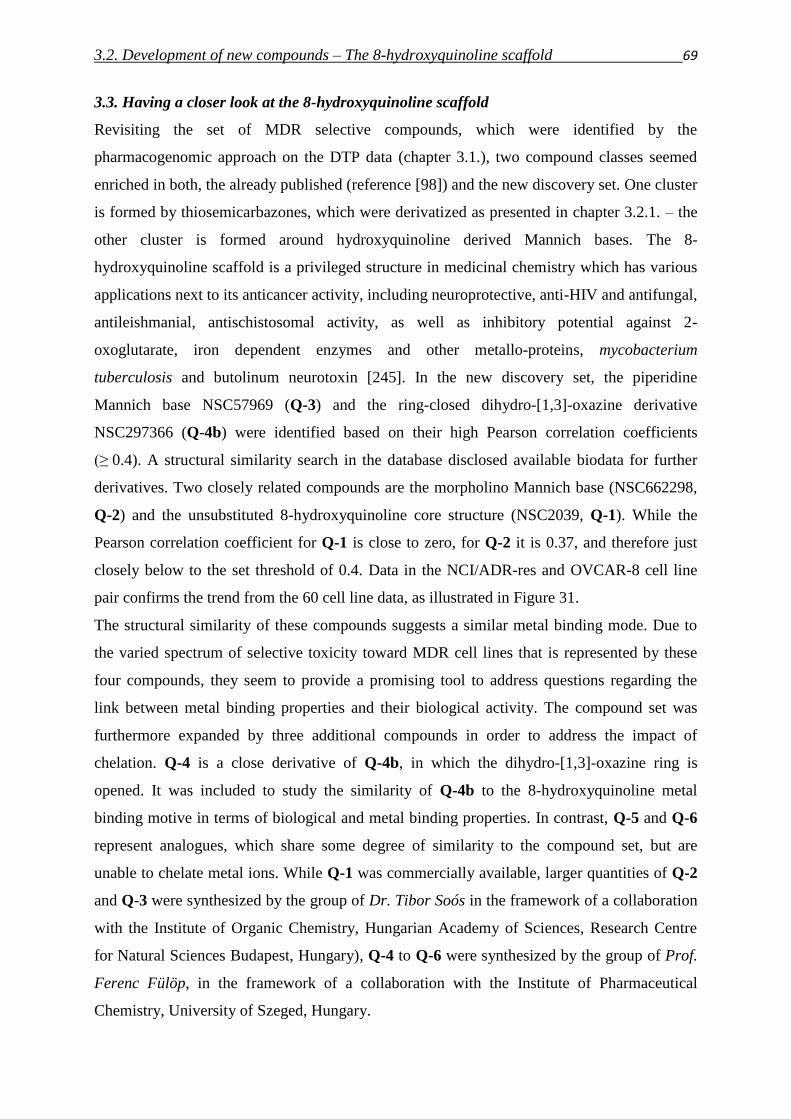
3.2. Development of new compounds – The 8-hydroxyquinoline scaffold 69
3.3. Having a closer look at the 8-hydroxyquinoline scaffold
Revisiting the set of MDR selective compounds, which were identified by the
pharmacogenomic approach on the DTP data (chapter 3.1.), two compound classes seemed
enriched in both, the already published (reference [98]) and the new discovery set. One cluster
is formed by thiosemicarbazones, which were derivatized as presented in chapter 3.2.1. – the
other cluster is formed around hydroxyquinoline derived Mannich bases. The 8-
hydroxyquinoline scaffold is a privileged structure in medicinal chemistry which has various
applications next to its anticancer activity, including neuroprotective, anti-HIV and antifungal,
antileishmanial, antischistosomal activity, as well as inhibitory potential against 2-
oxoglutarate, iron dependent enzymes and other metallo-proteins, mycobacterium
tuberculosis and butolinum neurotoxin [245]. In the new discovery set, the piperidine
Mannich base NSC57969 (Q-3) and the ring-closed dihydro-[1,3]-oxazine derivative
NSC297366 (Q-4b) were identified based on their high Pearson correlation coefficients
(≥ 0.4). A structural similarity search in the database disclosed available biodata for further
derivatives. Two closely related compounds are the morpholino Mannich base (NSC662298,
Q-2) and the unsubstituted 8-hydroxyquinoline core structure (NSC2039, Q-1). While the
Pearson correlation coefficient for Q-1 is close to zero, for Q-2 it is 0.37, and therefore just
closely below to the set threshold of 0.4. Data in the NCI/ADR-res and OVCAR-8 cell line
pair confirms the trend from the 60 cell line data, as illustrated in Figure 31.
The structural similarity of these compounds suggests a similar metal binding mode. Due to
the varied spectrum of selective toxicity toward MDR cell lines that is represented by these
four compounds, they seem to provide a promising tool to address questions regarding the
link between metal binding properties and their biological activity. The compound set was
furthermore expanded by three additional compounds in order to address the impact of
chelation. Q-4 is a close derivative of Q-4b, in which the dihydro-[1,3]-oxazine ring is
opened. It was included to study the similarity of Q-4b to the 8-hydroxyquinoline metal
binding motive in terms of biological and metal binding properties. In contrast, Q-5 and Q-6
represent analogues, which share some degree of similarity to the compound set, but are
unable to chelate metal ions. While Q-1 was commercially available, larger quantities of Q-2
and Q-3 were synthesized by the group of Dr. Tibor Soós in the framework of a collaboration
with the Institute of Organic Chemistry, Hungarian Academy of Sciences, Research Centre
for Natural Sciences Budapest, Hungary), Q-4 to Q-6 were synthesized by the group of Prof.
Ferenc Fülöp, in the framework of a collaboration with the Institute of Pharmaceutical
Chemistry, University of Szeged, Hungary.
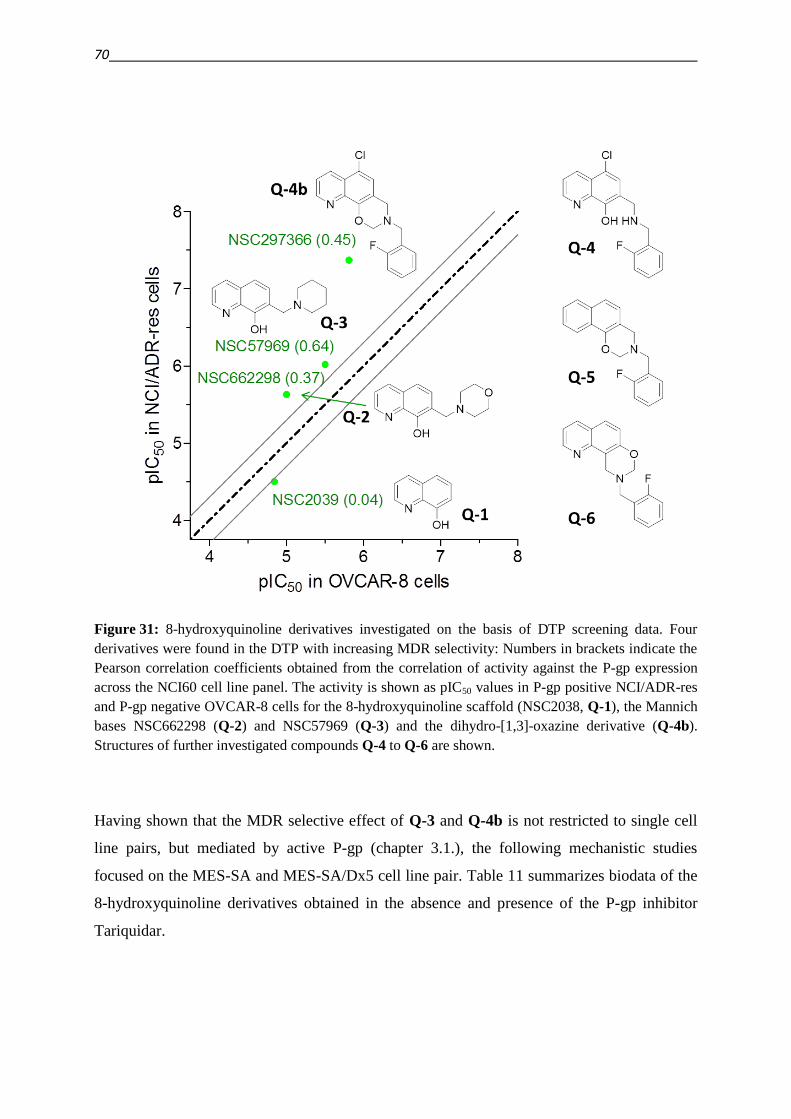
70
Figure 31: 8-hydroxyquinoline derivatives investigated on the basis of DTP screening data. Four
derivatives were found in the DTP with increasing MDR selectivity: Numbers in brackets indicate the
Pearson correlation coefficients obtained from the correlation of activity against the P-gp expression
across the NCI60 cell line panel. The activity is shown as pIC50 values in P-gp positive NCI/ADR-res
and P-gp negative OVCAR-8 cells for the 8-hydroxyquinoline scaffold (NSC2038, Q-1), the Mannich
bases NSC662298 (Q-2) and NSC57969 (Q-3) and the dihydro-[1,3]-oxazine derivative (Q-4b).
Structures of further investigated compounds Q-4 to Q-6 are shown.
Having shown that the MDR selective effect of Q-3 and Q-4b is not restricted to single cell
line pairs, but mediated by active P-gp (chapter 3.1.), the following mechanistic studies
focused on the MES-SA and MES-SA/Dx5 cell line pair. Table 11 summarizes biodata of the
8-hydroxyquinoline derivatives obtained in the absence and presence of the P-gp inhibitor
Tariquidar.
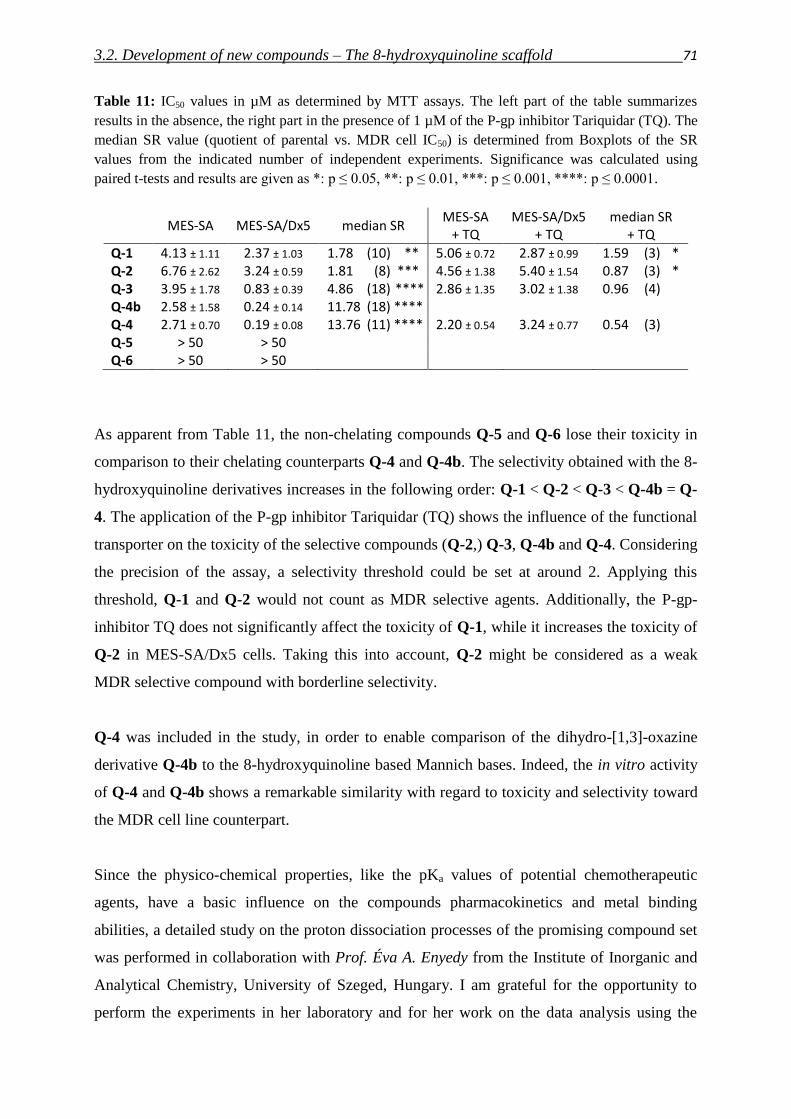
3.2. Development of new compounds – The 8-hydroxyquinoline scaffold 71
Table 11: IC50 values in µM as determined by MTT assays. The left part of the table summarizes
results in the absence, the right part in the presence of 1 µM of the P-gp inhibitor Tariquidar (TQ). The
median SR value (quotient of parental vs. MDR cell IC50) is determined from Boxplots of the SR
values from the indicated number of independent experiments. Significance was calculated using
paired t-tests and results are given as *: p ≤ 0.05, **: p ≤ 0.01, ***: p ≤ 0.001, ****: p ≤ 0.0001.
MES-SA MES-SA/Dx5 median SR MES-SA
+ TQ MES-SA/Dx5
+ TQ median SR
+ TQ
Q-1 4.13 ± 1.11 2.37 ± 1.03 1.78 (10) ** 5.06 ± 0.72 2.87 ± 0.99 1.59 (3) * Q-2 6.76 ± 2.62 3.24 ± 0.59 1.81 (8) *** 4.56 ± 1.38 5.40 ± 1.54 0.87 (3) * Q-3 3.95 ± 1.78 0.83 ± 0.39 4.86 (18) **** 2.86 ± 1.35 3.02 ± 1.38 0.96 (4) Q-4b 2.58 ± 1.58 0.24 ± 0.14 11.78 (18) **** Q-4 2.71 ± 0.70 0.19 ± 0.08 13.76 (11) **** 2.20 ± 0.54 3.24 ± 0.77 0.54 (3) Q-5 > 50 > 50 Q-6 > 50 > 50
As apparent from Table 11, the non-chelating compounds Q-5 and Q-6 lose their toxicity in
comparison to their chelating counterparts Q-4 and Q-4b. The selectivity obtained with the 8-
hydroxyquinoline derivatives increases in the following order: Q-1 < Q-2 < Q-3 < Q-4b = Q-
4. The application of the P-gp inhibitor Tariquidar (TQ) shows the influence of the functional
transporter on the toxicity of the selective compounds (Q-2,) Q-3, Q-4b and Q-4. Considering
the precision of the assay, a selectivity threshold could be set at around 2. Applying this
threshold, Q-1 and Q-2 would not count as MDR selective agents. Additionally, the P-gp-
inhibitor TQ does not significantly affect the toxicity of Q-1, while it increases the toxicity of
Q-2 in MES-SA/Dx5 cells. Taking this into account, Q-2 might be considered as a weak
MDR selective compound with borderline selectivity.
Q-4 was included in the study, in order to enable comparison of the dihydro-[1,3]-oxazine
derivative Q-4b to the 8-hydroxyquinoline based Mannich bases. Indeed, the in vitro activity
of Q-4 and Q-4b shows a remarkable similarity with regard to toxicity and selectivity toward
the MDR cell line counterpart.
Since the physico-chemical properties, like the pKa values of potential chemotherapeutic
agents, have a basic influence on the compounds pharmacokinetics and metal binding
abilities, a detailed study on the proton dissociation processes of the promising compound set
was performed in collaboration with Prof. Éva A. Enyedy from the Institute of Inorganic and
Analytical Chemistry, University of Szeged, Hungary. I am grateful for the opportunity to
perform the experiments in her laboratory and for her work on the data analysis using the
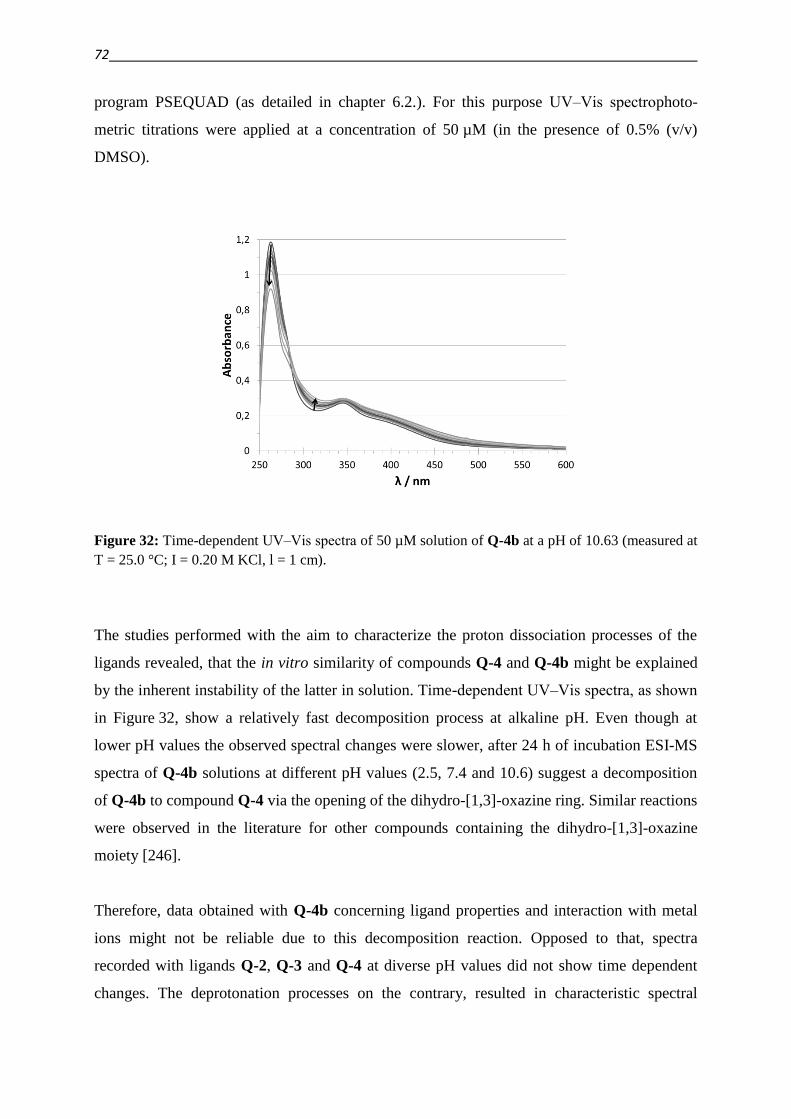
72
program PSEQUAD (as detailed in chapter 6.2.). For this purpose UV‒Vis spectrophoto-
metric titrations were applied at a concentration of 50 µM (in the presence of 0.5% (v/v)
DMSO).
Figure 32: Time-dependent UV‒Vis spectra of 50 µM solution of Q-4b at a pH of 10.63 (measured at
T = 25.0 °C; I = 0.20 M KCl, l = 1 cm).
The studies performed with the aim to characterize the proton dissociation processes of the
ligands revealed, that the in vitro similarity of compounds Q-4 and Q-4b might be explained
by the inherent instability of the latter in solution. Time-dependent UV‒Vis spectra, as shown
in Figure 32, show a relatively fast decomposition process at alkaline pH. Even though at
lower pH values the observed spectral changes were slower, after 24 h of incubation ESI-MS
spectra of Q-4b solutions at different pH values (2.5, 7.4 and 10.6) suggest a decomposition
of Q-4b to compound Q-4 via the opening of the dihydro-[1,3]-oxazine ring. Similar reactions
were observed in the literature for other compounds containing the dihydro-[1,3]-oxazine
moiety [246].
Therefore, data obtained with Q-4b concerning ligand properties and interaction with metal
ions might not be reliable due to this decomposition reaction. Opposed to that, spectra
recorded with ligands Q-2, Q-3 and Q-4 at diverse pH values did not show time dependent
changes. The deprotonation processes on the contrary, resulted in characteristic spectral
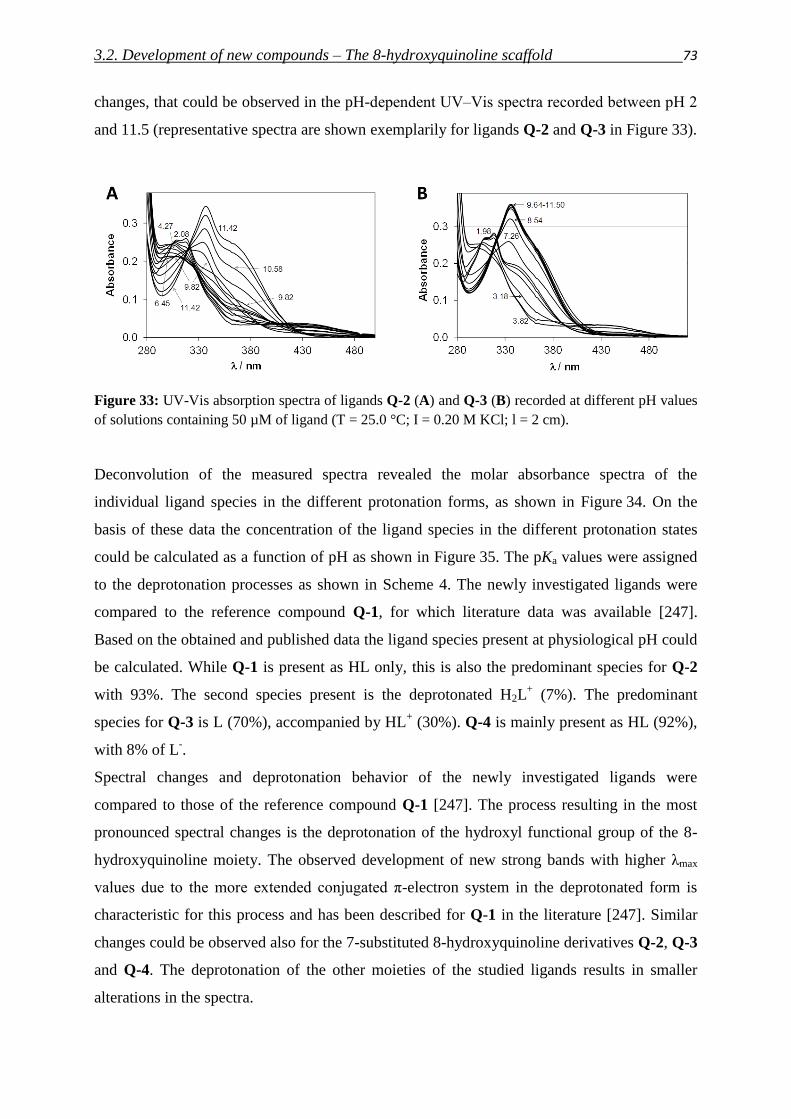
3.2. Development of new compounds – The 8-hydroxyquinoline scaffold 73
changes, that could be observed in the pH-dependent UV‒Vis spectra recorded between pH 2
and 11.5 (representative spectra are shown exemplarily for ligands Q-2 and Q-3 in Figure 33).
Figure 33: UV-Vis absorption spectra of ligands Q-2 (A) and Q-3 (B) recorded at different pH values
of solutions containing 50 µM of ligand (T = 25.0 °C; I = 0.20 M KCl; l = 2 cm).
Deconvolution of the measured spectra revealed the molar absorbance spectra of the
individual ligand species in the different protonation forms, as shown in Figure 34. On the
basis of these data the concentration of the ligand species in the different protonation states
could be calculated as a function of pH as shown in Figure 35. The pKa values were assigned
to the deprotonation processes as shown in Scheme 4. The newly investigated ligands were
compared to the reference compound Q-1, for which literature data was available [247].
Based on the obtained and published data the ligand species present at physiological pH could
be calculated. While Q-1 is present as HL only, this is also the predominant species for Q-2
with 93%. The second species present is the deprotonated H2L+ (7%). The predominant
species for Q-3 is L (70%), accompanied by HL+ (30%). Q-4 is mainly present as HL (92%),
with 8% of L-.
Spectral changes and deprotonation behavior of the newly investigated ligands were
compared to those of the reference compound Q-1 [247]. The process resulting in the most
pronounced spectral changes is the deprotonation of the hydroxyl functional group of the 8-
hydroxyquinoline moiety. The observed development of new strong bands with higher λmax
values due to the more extended conjugated π-electron system in the deprotonated form is
characteristic for this process and has been described for Q-1 in the literature [247]. Similar
changes could be observed also for the 7-substituted 8-hydroxyquinoline derivatives Q-2, Q-3
and Q-4. The deprotonation of the other moieties of the studied ligands results in smaller
alterations in the spectra.
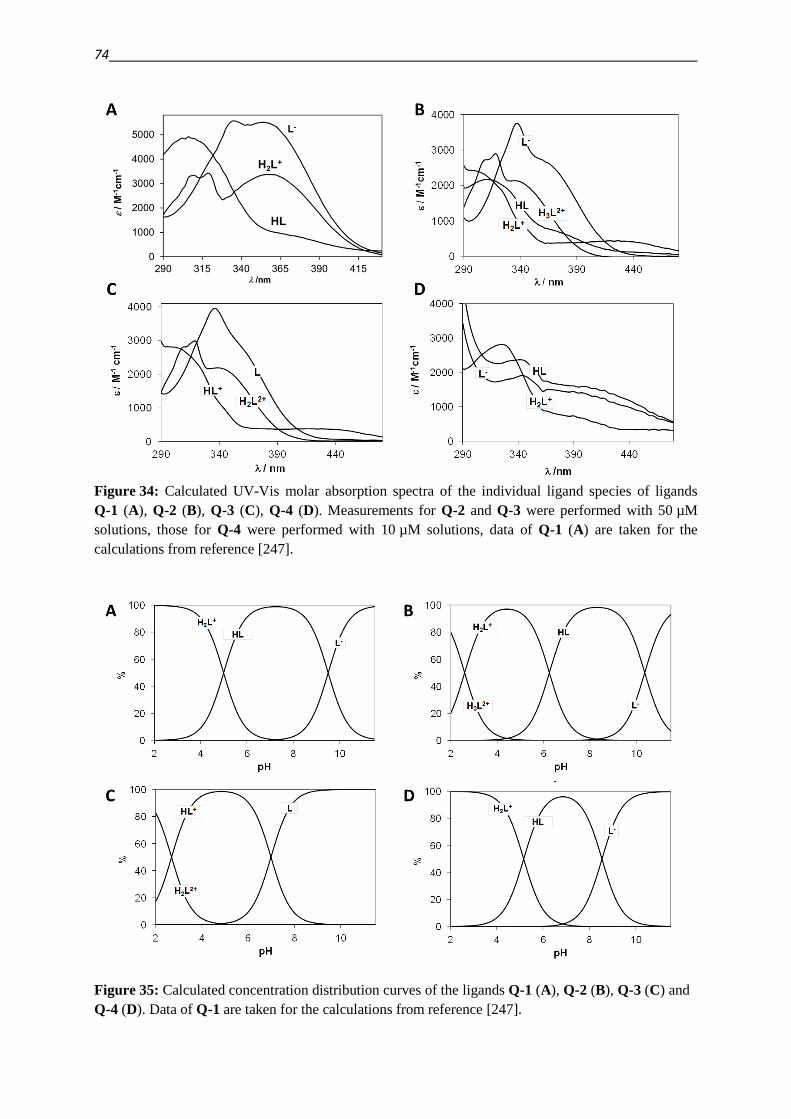
74
Figure 34: Calculated UV-Vis molar absorption spectra of the individual ligand species of ligands
Q-1 (A), Q-2 (B), Q-3 (C), Q-4 (D). Measurements for Q-2 and Q-3 were performed with 50 µM
solutions, those for Q-4 were performed with 10 µM solutions, data of Q-1 (A) are taken for the
calculations from reference [247].
Figure 35: Calculated concentration distribution curves of the ligands Q-1 (A), Q-2 (B), Q-3 (C) and
Q-4 (D). Data of Q-1 are taken for the calculations from reference [247].
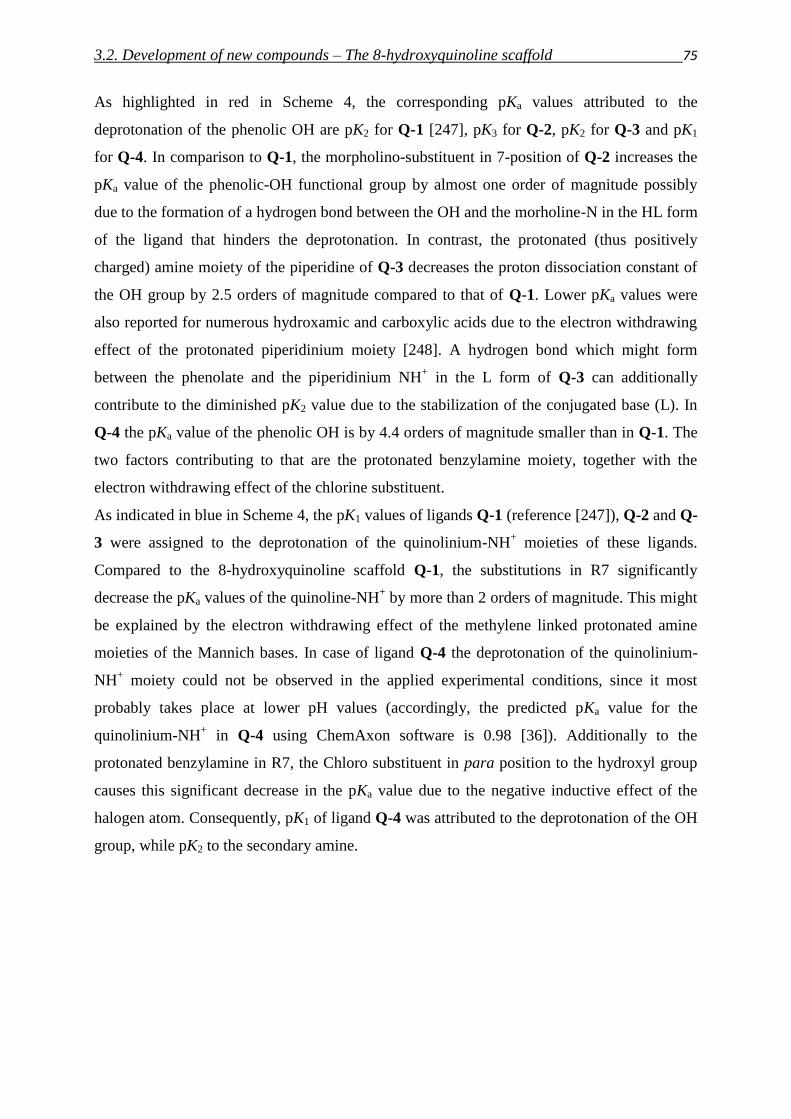
3.2. Development of new compounds – The 8-hydroxyquinoline scaffold 75
As highlighted in red in Scheme 4, the corresponding pKa values attributed to the
deprotonation of the phenolic OH are pK2 for Q-1 [247], pK3 for Q-2, pK2 for Q-3 and pK1
for Q-4. In comparison to Q-1, the morpholino-substituent in 7-position of Q-2 increases the
pKa value of the phenolic-OH functional group by almost one order of magnitude possibly
due to the formation of a hydrogen bond between the OH and the morholine-N in the HL form
of the ligand that hinders the deprotonation. In contrast, the protonated (thus positively
charged) amine moiety of the piperidine of Q-3 decreases the proton dissociation constant of
the OH group by 2.5 orders of magnitude compared to that of Q-1. Lower pKa values were
also reported for numerous hydroxamic and carboxylic acids due to the electron withdrawing
effect of the protonated piperidinium moiety [248]. A hydrogen bond which might form
between the phenolate and the piperidinium NH+ in the L form of Q-3 can additionally
contribute to the diminished pK2 value due to the stabilization of the conjugated base (L). In
Q-4 the pKa value of the phenolic OH is by 4.4 orders of magnitude smaller than in Q-1. The
two factors contributing to that are the protonated benzylamine moiety, together with the
electron withdrawing effect of the chlorine substituent.
As indicated in blue in Scheme 4, the pK1 values of ligands Q-1 (reference [247]), Q-2 and Q-
3 were assigned to the deprotonation of the quinolinium-NH+ moieties of these ligands.
Compared to the 8-hydroxyquinoline scaffold Q-1, the substitutions in R7 significantly
decrease the pKa values of the quinoline-NH+ by more than 2 orders of magnitude. This might
be explained by the electron withdrawing effect of the methylene linked protonated amine
moieties of the Mannich bases. In case of ligand Q-4 the deprotonation of the quinolinium-
NH+ moiety could not be observed in the applied experimental conditions, since it most
probably takes place at lower pH values (accordingly, the predicted pKa value for the
quinolinium-NH+ in Q-4 using ChemAxon software is 0.98 [36]). Additionally to the
protonated benzylamine in R7, the Chloro substituent in para position to the hydroxyl group
causes this significant decrease in the pKa value due to the negative inductive effect of the
halogen atom. Consequently, pK1 of ligand Q-4 was attributed to the deprotonation of the OH
group, while pK2 to the secondary amine.
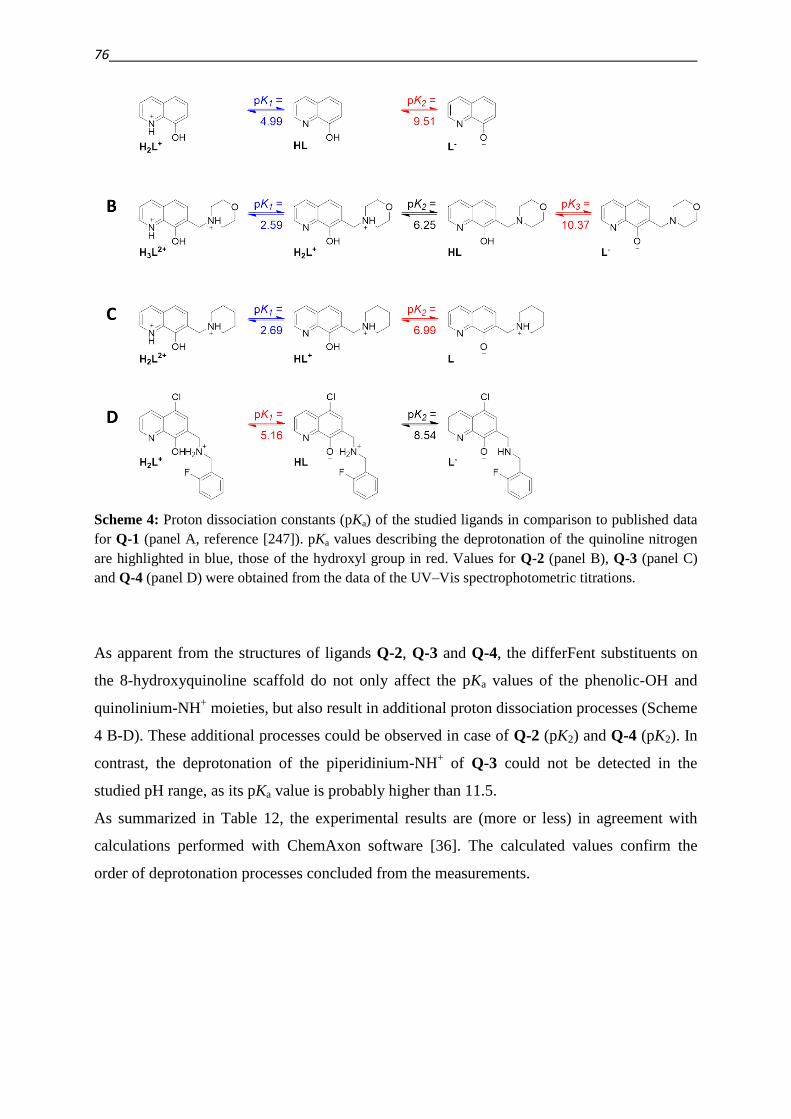
76
Scheme 4: Proton dissociation constants (pKa) of the studied ligands in comparison to published data
for Q-1 (panel A, reference [247]). pKa values describing the deprotonation of the quinoline nitrogen
are highlighted in blue, those of the hydroxyl group in red. Values for Q-2 (panel B), Q-3 (panel C)
and Q-4 (panel D) were obtained from the data of the UV–Vis spectrophotometric titrations.
As apparent from the structures of ligands Q-2, Q-3 and Q-4, the differFent substituents on
the 8-hydroxyquinoline scaffold do not only affect the pKa values of the phenolic-OH and
quinolinium-NH+ moieties, but also result in additional proton dissociation processes (Scheme
4 B-D). These additional processes could be observed in case of Q-2 (pK2) and Q-4 (pK2). In
contrast, the deprotonation of the piperidinium-NH+ of Q-3 could not be detected in the
studied pH range, as its pKa value is probably higher than 11.5.
As summarized in Table 12, the experimental results are (more or less) in agreement with
calculations performed with ChemAxon software [36]. The calculated values confirm the
order of deprotonation processes concluded from the measurements.
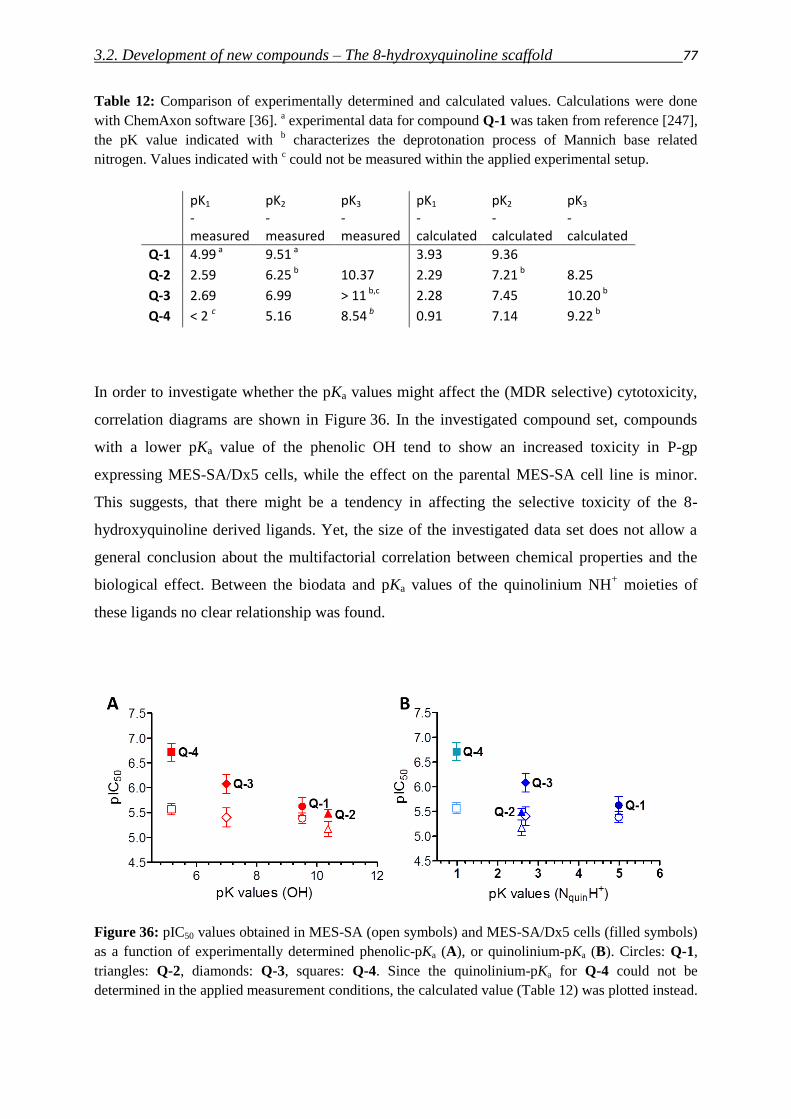
3.2. Development of new compounds – The 8-hydroxyquinoline scaffold 77
Table 12: Comparison of experimentally determined and calculated values. Calculations were done
with ChemAxon software [36]. a experimental data for compound Q-1 was taken from reference [247],
the pK value indicated with b characterizes the deprotonation process of Mannich base related
nitrogen. Values indicated with c could not be measured within the applied experimental setup.
pK1 - measured
pK2 - measured
pK3 - measured
pK1 - calculated
pK2 - calculated
pK3 - calculated
Q-1 4.99 a 9.51 a 3.93 9.36
Q-2 2.59 6.25 b 10.37 2.29 7.21 b 8.25
Q-3 2.69 6.99 > 11 b,c 2.28 7.45 10.20 b
Q-4 < 2 c 5.16 8.54 b 0.91 7.14 9.22 b
In order to investigate whether the pKa values might affect the (MDR selective) cytotoxicity,
correlation diagrams are shown in Figure 36. In the investigated compound set, compounds
with a lower pKa value of the phenolic OH tend to show an increased toxicity in P-gp
expressing MES-SA/Dx5 cells, while the effect on the parental MES-SA cell line is minor.
This suggests, that there might be a tendency in affecting the selective toxicity of the 8-
hydroxyquinoline derived ligands. Yet, the size of the investigated data set does not allow a
general conclusion about the multifactorial correlation between chemical properties and the
biological effect. Between the biodata and pKa values of the quinolinium NH+ moieties of
these ligands no clear relationship was found.
Figure 36: pIC50 values obtained in MES-SA (open symbols) and MES-SA/Dx5 cells (filled symbols)
as a function of experimentally determined phenolic-pKa (A), or quinolinium-pKa (B). Circles: Q-1,
triangles: Q-2, diamonds: Q-3, squares: Q-4. Since the quinolinium-pKa for Q-4 could not be
determined in the applied measurement conditions, the calculated value (Table 12) was plotted instead.
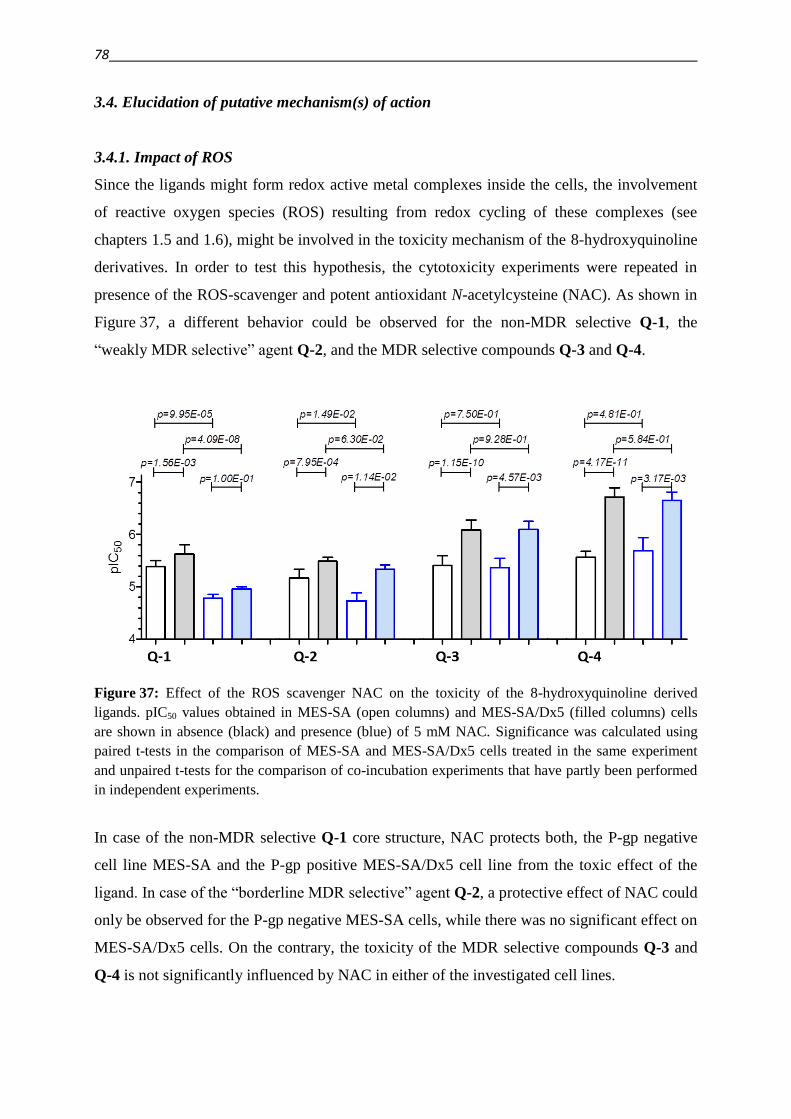
78
3.4. Elucidation of putative mechanism(s) of action
3.4.1. Impact of ROS
Since the ligands might form redox active metal complexes inside the cells, the involvement
of reactive oxygen species (ROS) resulting from redox cycling of these complexes (see
chapters 1.5 and 1.6), might be involved in the toxicity mechanism of the 8-hydroxyquinoline
derivatives. In order to test this hypothesis, the cytotoxicity experiments were repeated in
presence of the ROS-scavenger and potent antioxidant N-acetylcysteine (NAC). As shown in
Figure 37, a different behavior could be observed for the non-MDR selective Q-1, the
“weakly MDR selective” agent Q-2, and the MDR selective compounds Q-3 and Q-4.
Figure 37: Effect of the ROS scavenger NAC on the toxicity of the 8-hydroxyquinoline derived
ligands. pIC50 values obtained in MES-SA (open columns) and MES-SA/Dx5 (filled columns) cells
are shown in absence (black) and presence (blue) of 5 mM NAC. Significance was calculated using
paired t-tests in the comparison of MES-SA and MES-SA/Dx5 cells treated in the same experiment
and unpaired t-tests for the comparison of co-incubation experiments that have partly been performed
in independent experiments.
In case of the non-MDR selective Q-1 core structure, NAC protects both, the P-gp negative
cell line MES-SA and the P-gp positive MES-SA/Dx5 cell line from the toxic effect of the
ligand. In case of the “borderline MDR selective” agent Q-2, a protective effect of NAC could
only be observed for the P-gp negative MES-SA cells, while there was no significant effect on
MES-SA/Dx5 cells. On the contrary, the toxicity of the MDR selective compounds Q-3 and
Q-4 is not significantly influenced by NAC in either of the investigated cell lines.
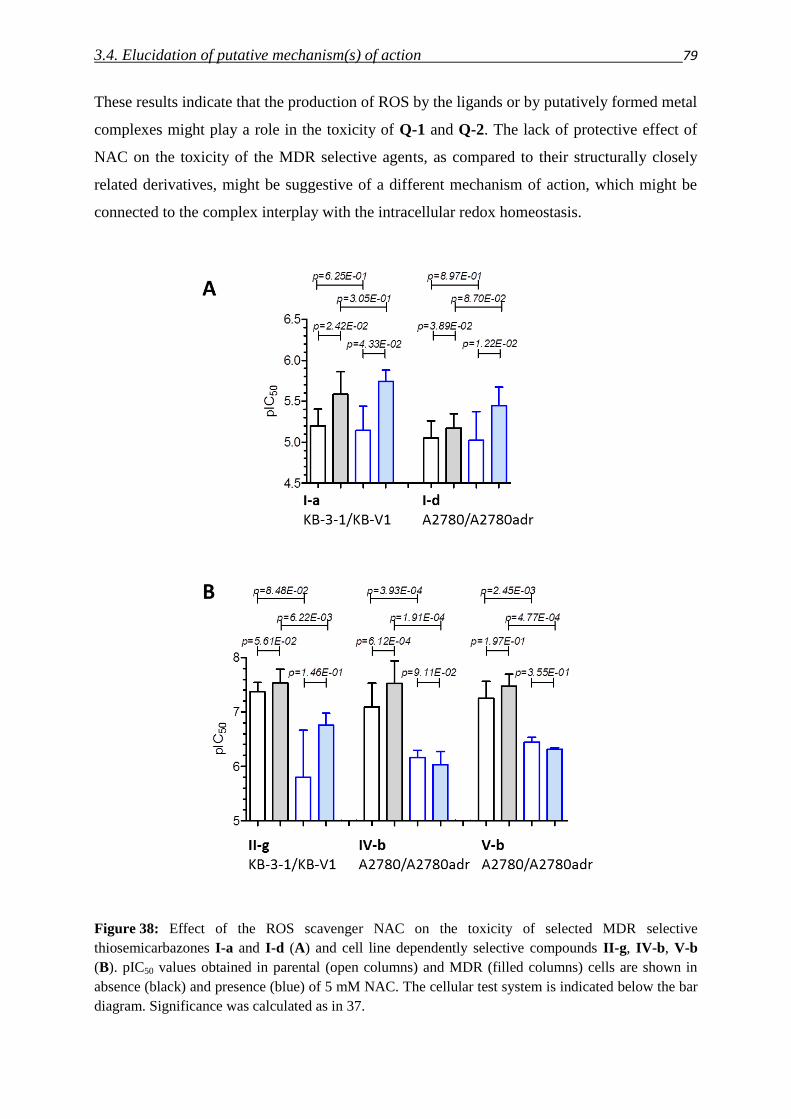
3.4. Elucidation of putative mechanism(s) of action 79
These results indicate that the production of ROS by the ligands or by putatively formed metal
complexes might play a role in the toxicity of Q-1 and Q-2. The lack of protective effect of
NAC on the toxicity of the MDR selective agents, as compared to their structurally closely
related derivatives, might be suggestive of a different mechanism of action, which might be
connected to the complex interplay with the intracellular redox homeostasis.
Figure 38: Effect of the ROS scavenger NAC on the toxicity of selected MDR selective
thiosemicarbazones I-a and I-d (A) and cell line dependently selective compounds II-g, IV-b, V-b
(B). pIC50 values obtained in parental (open columns) and MDR (filled columns) cells are shown in
absence (black) and presence (blue) of 5 mM NAC. The cellular test system is indicated below the bar
diagram. Significance was calculated as in 37.
80
For comparison, compounds from the focused designed library (chapters 3.2.1. – 3.2.5.) were
co-administered to cells with NAC. As shown in Figure 38, comparably to the effect of the
MDR selective 8-hydroxyquinoline Mannich bases Q-3 and Q-4, also the toxicity of the
MDR selective isatin-β-thiosemicarbazones I-a and I-d was not affected by the ROS-
scavenger. In contrast, compounds that showed an increased toxicity toward single MDR cell
lines in a P-gp independent manner behaved differently. The toxicity of the pyridinyl thio-
semicarbazone II-g, the pyrimidinyl hydrazone IV-b, and the hydrazino benzothiazole V-b
was attenuated in the presence of NAC. Despite the parallel that can be drawn to the non-
MDR selective Q-1, in contrast to the effect on the 8-hydroxyquinoline scaffold, the (relative)
protective effect of the antioxidant against IV-b is more pronounced in the drug resistant cells
as compared to their sensitive counterparts.
3.4.2. Impact of metals – co-incubation with FeCl3 and CuCl2
Since the formation of redox active metal complexes might be a source of ROS, the biological
activity of metal binding compounds is often modified upon complex formation with metal
ions [87,129]. Therefore in the next step the toxicity of the ligands was compared in the
absence and in the presence of increasing iron (III) and copper (II) concentrations (0.5 µM,
5.0 µM, 50 µM). The metal salts alone did not influence the cell viability within the
timeframe of the assay, indicating that the observed effects are not additive.
Iron (III) co-incubation did not influence the toxicity of the 8-hydroxyquinoline core structure
Q-1 (Figure 39 A). In contrast, for the weakly MDR selective agent Q-2 in the presence of
50 µM FeCl3 a significant protective effect could be observed for the MDR cell line MES-
SA/Dx5, while the P-gp negative parental cell line MES-SA was not affected (Figure 39 B).
In sharp contrast, both cell lines were significantly protected from the toxic effect of the two
MDR selective derivatives Q-3 and Q-4 in the presence of 5 and 50 µM FeCl3
(Figure 39 C,D). Though, the magnitude of this effect is much higher in the P-gp positive
MES-SA/Dx5 cell line, resulting in a decrease of selective toxicity of the ligands in the
presence of FeCl3.
Contrary to these results, the rescuing effect of FeCl3 was more pronounced in MES-SA as
compared to MES-SA/Dx5 cells in case of the P-gp independently MDR selective pyrimidi-
nylhydrazone IV-b, resulting in an enhanced selectivity in the presence of iron (Figure 39 E).
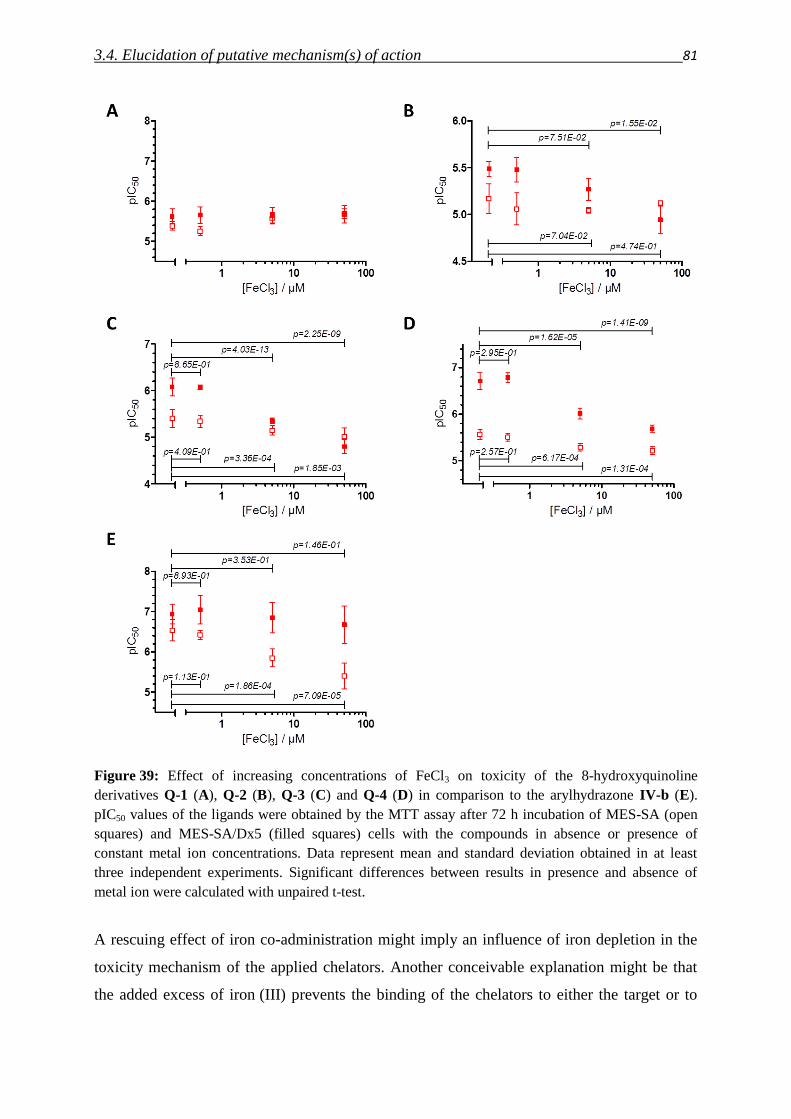
3.4. Elucidation of putative mechanism(s) of action 81
Figure 39: Effect of increasing concentrations of FeCl3 on toxicity of the 8-hydroxyquinoline
derivatives Q-1 (A), Q-2 (B), Q-3 (C) and Q-4 (D) in comparison to the arylhydrazone IV-b (E).
pIC50 values of the ligands were obtained by the MTT assay after 72 h incubation of MES-SA (open
squares) and MES-SA/Dx5 (filled squares) cells with the compounds in absence or presence of
constant metal ion concentrations. Data represent mean and standard deviation obtained in at least
three independent experiments. Significant differences between results in presence and absence of
metal ion were calculated with unpaired t-test.
A rescuing effect of iron co-administration might imply an influence of iron depletion in the
toxicity mechanism of the applied chelators. Another conceivable explanation might be that
the added excess of iron (III) prevents the binding of the chelators to either the target or to
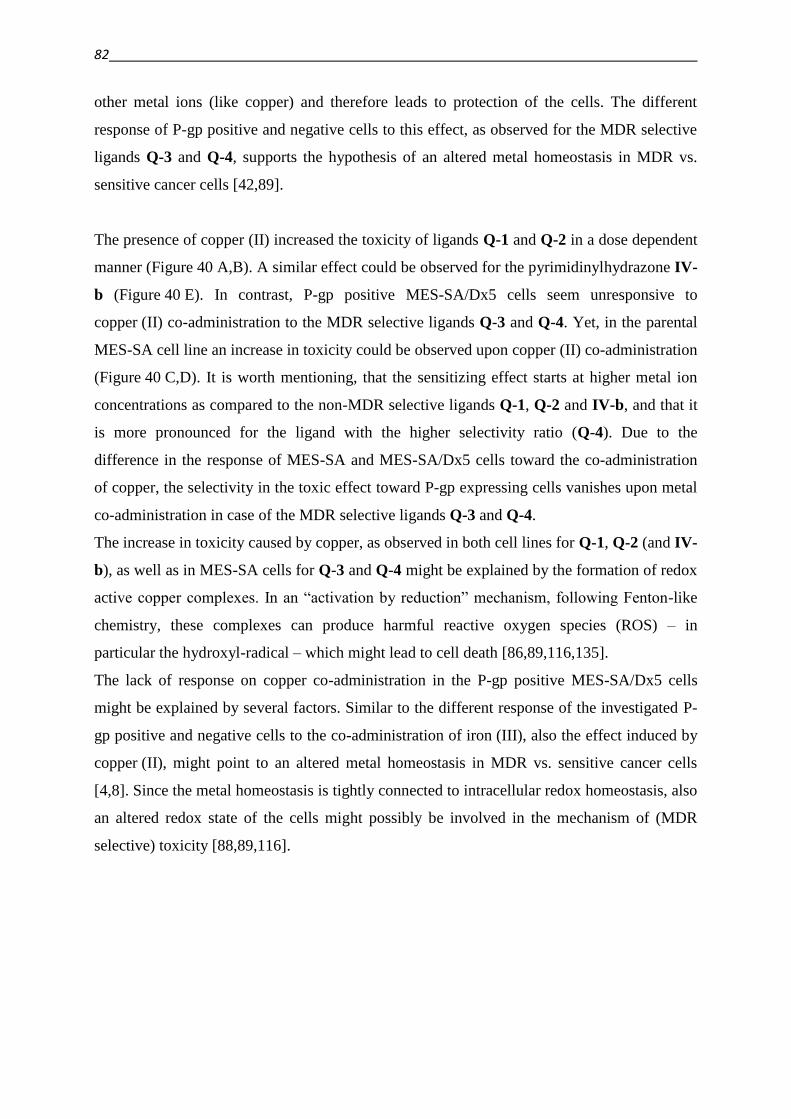
82
other metal ions (like copper) and therefore leads to protection of the cells. The different
response of P-gp positive and negative cells to this effect, as observed for the MDR selective
ligands Q-3 and Q-4, supports the hypothesis of an altered metal homeostasis in MDR vs.
sensitive cancer cells [42,89].
The presence of copper (II) increased the toxicity of ligands Q-1 and Q-2 in a dose dependent
manner (Figure 40 A,B). A similar effect could be observed for the pyrimidinylhydrazone IV-
b (Figure 40 E). In contrast, P-gp positive MES-SA/Dx5 cells seem unresponsive to
copper (II) co-administration to the MDR selective ligands Q-3 and Q-4. Yet, in the parental
MES-SA cell line an increase in toxicity could be observed upon copper (II) co-administration
(Figure 40 C,D). It is worth mentioning, that the sensitizing effect starts at higher metal ion
concentrations as compared to the non-MDR selective ligands Q-1, Q-2 and IV-b, and that it
is more pronounced for the ligand with the higher selectivity ratio (Q-4). Due to the
difference in the response of MES-SA and MES-SA/Dx5 cells toward the co-administration
of copper, the selectivity in the toxic effect toward P-gp expressing cells vanishes upon metal
co-administration in case of the MDR selective ligands Q-3 and Q-4.
The increase in toxicity caused by copper, as observed in both cell lines for Q-1, Q-2 (and IV-
b), as well as in MES-SA cells for Q-3 and Q-4 might be explained by the formation of redox
active copper complexes. In an “activation by reduction” mechanism, following Fenton-like
chemistry, these complexes can produce harmful reactive oxygen species (ROS) – in
particular the hydroxyl-radical – which might lead to cell death [86,89,116,135].
The lack of response on copper co-administration in the P-gp positive MES-SA/Dx5 cells
might be explained by several factors. Similar to the different response of the investigated P-
gp positive and negative cells to the co-administration of iron (III), also the effect induced by
copper (II), might point to an altered metal homeostasis in MDR vs. sensitive cancer cells
[4,8]. Since the metal homeostasis is tightly connected to intracellular redox homeostasis, also
an altered redox state of the cells might possibly be involved in the mechanism of (MDR
selective) toxicity [88,89,116].
3.4. Elucidation of putative mechanism(s) of action 83
Figure 40: Effect of increasing concentrations of CuCl2 on toxicity of the 8-hydroxyquinoline
derivatives Q-1 (A), Q-2 (B), Q-3 (C) and Q-4 (D) in comparison to the arylhydrazone IV-b (E).
pIC50 values of the ligands were measured by the MTT assay after 72 h incubation of MES-SA (open
squares) and MES-SA/Dx5 (filled squares) cells with the compounds in absence or presence of
constant metal ion concentrations. Data represent mean and standard deviation obtained in at least
three independent experiments. Significant differences between results in presence and absence of
metal ion were calculated with unpaired t-test.
84
3.4.3. Investigation of Fe(III) and Cu(II) complexes – stabilities and stoichiometries
Characterization of the ligands’ metal binding ability, and the most plausible chemical species
formed in aqueous solution in the biologically relevant pH range might give further insight
into the mechanism of action of metal binding compounds [89]. Therefore the stoichiometry
and stability constants of the complexes of the ligands Q-2, Q-3 and Q-4 in the presence of
iron (III) and copper (II) were determined by means of UV‒Vis spectrophotometry. These
studies were performed in collaboration with Prof. Éva A. Enyedy from the Institute of
Inorganic and Analytical Chemistry, University of Szeged, Hungary. The solution speciation
data were furthermore compared to those of the reference compound Q-1 [249,250]. The
complex formation processes could be followed by the characteristic changes of charge
transfer (CT) bands, which are partially overlapping with the ligands’ bands. In case of
iron (III), additional changes of the d-d bands could be monitored. In case of copper (II) the d-
d bands could not be detected under the applied conditions due to their fairly low molar
absorptivities.
In the spectra obtained during titrations with both metal ions the absorbance values tend to
decrease at pH > ~8. In case of the iron (III) complexes the hydrolysis of the metal ion, which
might occur at alkaline pH values, might suppress the complex formation. Compared to the
titrations in the presence of iron (III), the decrease in absorbance seems to be even more
pronounced in the case of the copper (II) complexes. This might be explained by a
precipitation of the formed neutral complexes, which also becomes visible in form of yellow
precipitates at pH > ~9. Thus, only data collected at pH < 8 were evaluated in all cases.
In the case of the iron (III) complexes the spectral changes upon complexation detected in the
350-750 nm wavelength range were most useful for the calculations since bands located in
this range are relatively well-separated from the ligands’ bands. Representative spectra are
shown for the ligands Q-2 (Figure 41 A) and Q-3 (Figure 41 B) in the presence of
0.33 equivalents of iron (III). The arrow indicates the shift of the peak maxima λmax upon
alkalization of the solution. Molar absorbance spectra were computed by the deconvolution of
UV-Vis spectra recorded at different pH values and revealed that the shift in absorbance
maxima is indicative for the consecutive coordination of the ligands to the metal ion. The
coordination sphere of iron (III) is octahedral, therefore with the (Nquinoline,O-) bidentate 8-
hydroxyquinoline derivatives the formation of mono-, bis- and tris-ligand complexes is
expected [251]. A shift in λmax values upon filling of the metal coordination-sphere, as
indicated by the arrows in Figure 41, has also been reported for the complexes of Q-1 [250].
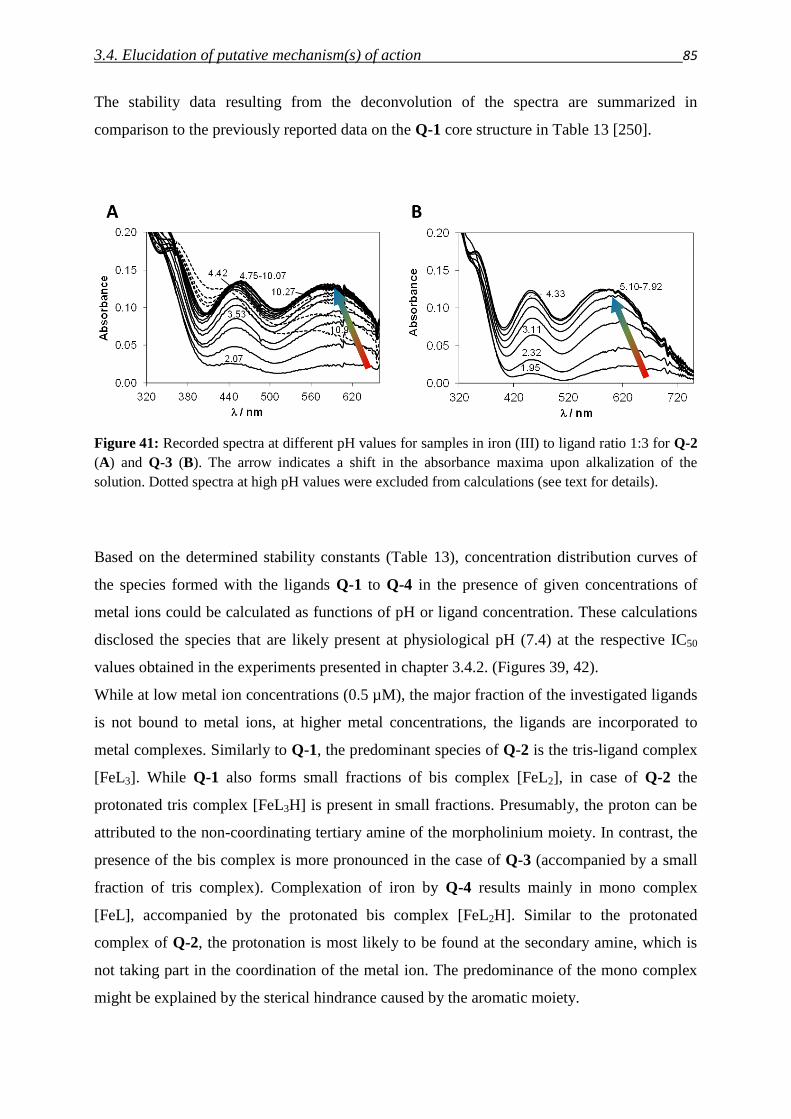
3.4. Elucidation of putative mechanism(s) of action 85
The stability data resulting from the deconvolution of the spectra are summarized in
comparison to the previously reported data on the Q-1 core structure in Table 13 [250].
Figure 41: Recorded spectra at different pH values for samples in iron (III) to ligand ratio 1:3 for Q-2
(A) and Q-3 (B). The arrow indicates a shift in the absorbance maxima upon alkalization of the
solution. Dotted spectra at high pH values were excluded from calculations (see text for details).
Based on the determined stability constants (Table 13), concentration distribution curves of
the species formed with the ligands Q-1 to Q-4 in the presence of given concentrations of
metal ions could be calculated as functions of pH or ligand concentration. These calculations
disclosed the species that are likely present at physiological pH (7.4) at the respective IC50
values obtained in the experiments presented in chapter 3.4.2. (Figures 39, 42).
While at low metal ion concentrations (0.5 µM), the major fraction of the investigated ligands
is not bound to metal ions, at higher metal concentrations, the ligands are incorporated to
metal complexes. Similarly to Q-1, the predominant species of Q-2 is the tris-ligand complex
[FeL3]. While Q-1 also forms small fractions of bis complex [FeL2], in case of Q-2 the
protonated tris complex [FeL3H] is present in small fractions. Presumably, the proton can be
attributed to the non-coordinating tertiary amine of the morpholinium moiety. In contrast, the
presence of the bis complex is more pronounced in the case of Q-3 (accompanied by a small
fraction of tris complex). Complexation of iron by Q-4 results mainly in mono complex
[FeL], accompanied by the protonated bis complex [FeL2H]. Similar to the protonated
complex of Q-2, the protonation is most likely to be found at the secondary amine, which is
not taking part in the coordination of the metal ion. The predominance of the mono complex
might be explained by the sterical hindrance caused by the aromatic moiety.
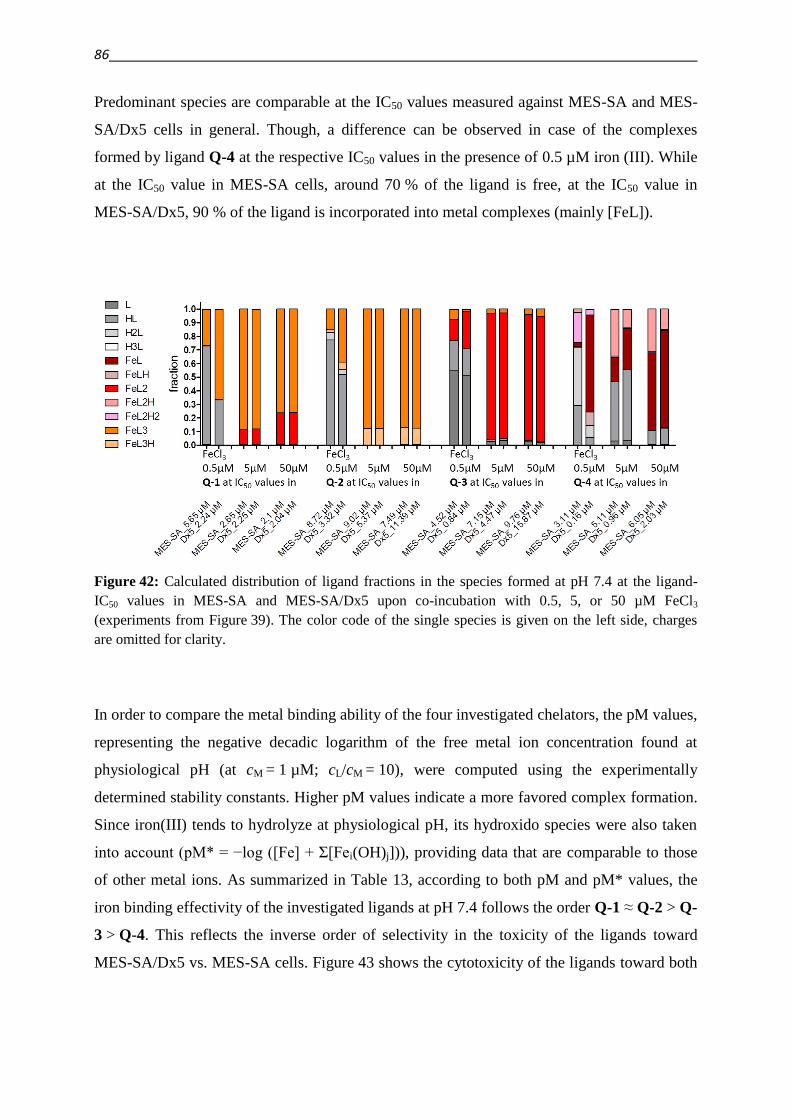
86
Predominant species are comparable at the IC50 values measured against MES-SA and MES-
SA/Dx5 cells in general. Though, a difference can be observed in case of the complexes
formed by ligand Q-4 at the respective IC50 values in the presence of 0.5 µM iron (III). While
at the IC50 value in MES-SA cells, around 70 % of the ligand is free, at the IC50 value in
MES-SA/Dx5, 90 % of the ligand is incorporated into metal complexes (mainly [FeL]).
Figure 42: Calculated distribution of ligand fractions in the species formed at pH 7.4 at the ligand-
IC50 values in MES-SA and MES-SA/Dx5 upon co-incubation with 0.5, 5, or 50 µM FeCl3
(experiments from Figure 39). The color code of the single species is given on the left side, charges
are omitted for clarity.
In order to compare the metal binding ability of the four investigated chelators, the pM values,
representing the negative decadic logarithm of the free metal ion concentration found at
physiological pH (at cM = 1 µM; cL/cM = 10), were computed using the experimentally
determined stability constants. Higher pM values indicate a more favored complex formation.
Since iron(III) tends to hydrolyze at physiological pH, its hydroxido species were also taken
into account (pM* = −log ([Fe] + Σ[Fei(OH)j])), providing data that are comparable to those
of other metal ions. As summarized in Table 13, according to both pM and pM* values, the
iron binding effectivity of the investigated ligands at pH 7.4 follows the order Q-1 ≈ Q-2 > Q-
3 > Q-4. This reflects the inverse order of selectivity in the toxicity of the ligands toward
MES-SA/Dx5 vs. MES-SA cells. Figure 43 shows the cytotoxicity of the ligands toward both
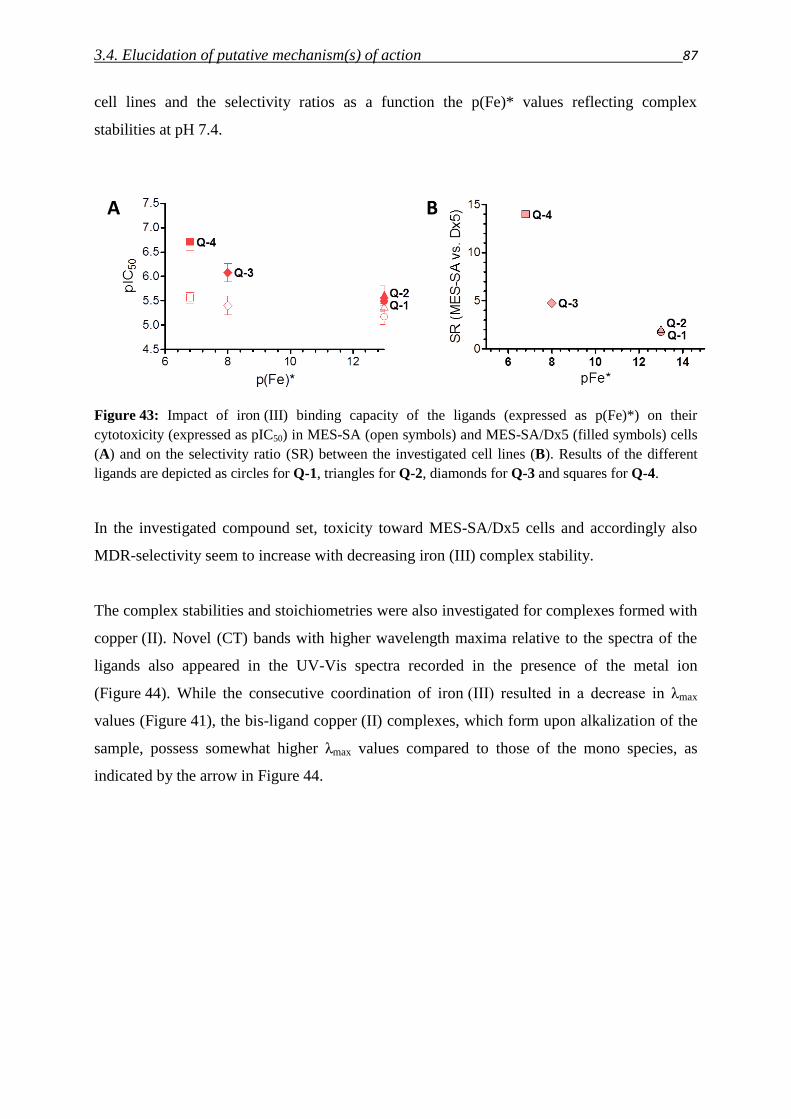
3.4. Elucidation of putative mechanism(s) of action 87
cell lines and the selectivity ratios as a function the p(Fe)* values reflecting complex
stabilities at pH 7.4.
Figure 43: Impact of iron (III) binding capacity of the ligands (expressed as p(Fe)*) on their
cytotoxicity (expressed as pIC50) in MES-SA (open symbols) and MES-SA/Dx5 (filled symbols) cells
(A) and on the selectivity ratio (SR) between the investigated cell lines (B). Results of the different
ligands are depicted as circles for Q-1, triangles for Q-2, diamonds for Q-3 and squares for Q-4.
In the investigated compound set, toxicity toward MES-SA/Dx5 cells and accordingly also
MDR-selectivity seem to increase with decreasing iron (III) complex stability.
The complex stabilities and stoichiometries were also investigated for complexes formed with
copper (II). Novel (CT) bands with higher wavelength maxima relative to the spectra of the
ligands also appeared in the UV-Vis spectra recorded in the presence of the metal ion
(Figure 44). While the consecutive coordination of iron (III) resulted in a decrease in λmax
values (Figure 41), the bis-ligand copper (II) complexes, which form upon alkalization of the
sample, possess somewhat higher λmax values compared to those of the mono species, as
indicated by the arrow in Figure 44.
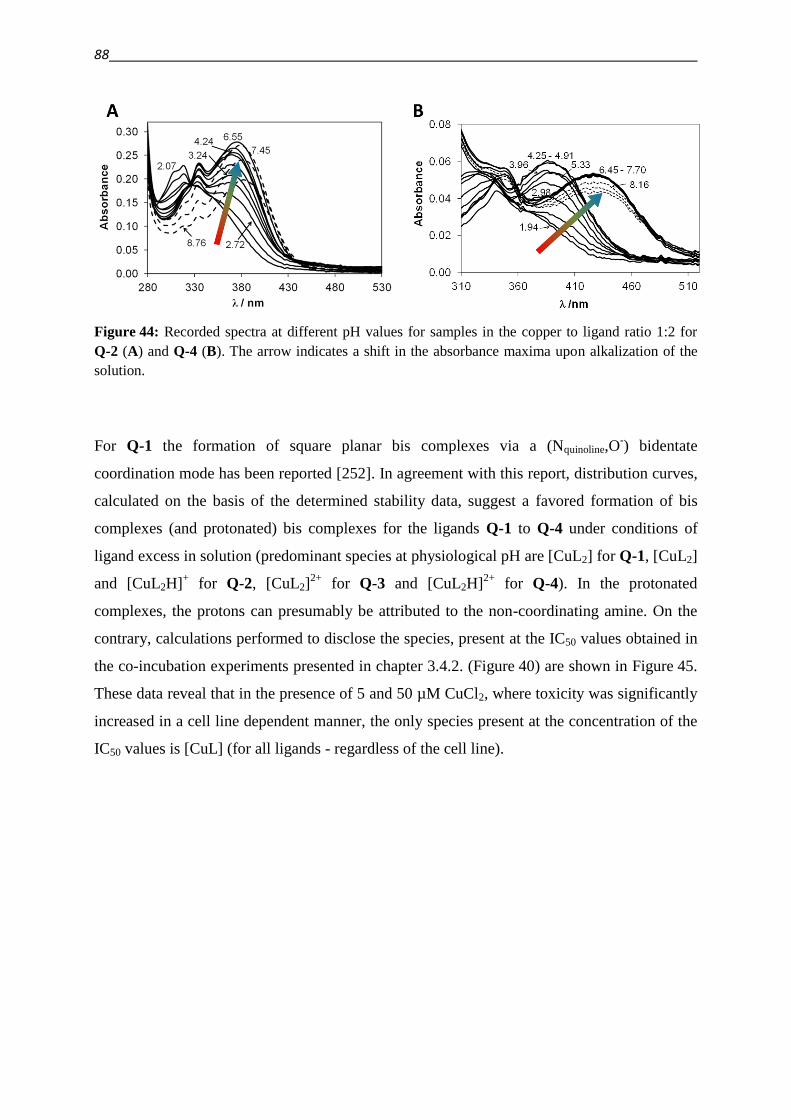
88
Figure 44: Recorded spectra at different pH values for samples in the copper to ligand ratio 1:2 for
Q-2 (A) and Q-4 (B). The arrow indicates a shift in the absorbance maxima upon alkalization of the
solution.
For Q-1 the formation of square planar bis complexes via a (Nquinoline,O-) bidentate
coordination mode has been reported [252]. In agreement with this report, distribution curves,
calculated on the basis of the determined stability data, suggest a favored formation of bis
complexes (and protonated) bis complexes for the ligands Q-1 to Q-4 under conditions of
ligand excess in solution (predominant species at physiological pH are [CuL2] for Q-1, [CuL2]
and [CuL2H]+ for Q-2, [CuL2]
2+ for Q-3 and [CuL2H]
2+ for Q-4). In the protonated
complexes, the protons can presumably be attributed to the non-coordinating amine. On the
contrary, calculations performed to disclose the species, present at the IC50 values obtained in
the co-incubation experiments presented in chapter 3.4.2. (Figure 40) are shown in Figure 45.
These data reveal that in the presence of 5 and 50 µM CuCl2, where toxicity was significantly
increased in a cell line dependent manner, the only species present at the concentration of the
IC50 values is [CuL] (for all ligands - regardless of the cell line).
3.4. Elucidation of putative mechanism(s) of action 89
Figure 45: Calculated distribution of ligand fractions in the species formed at pH 7.4 at the ligand-
IC50 values in MES-SA and MES-SA/Dx5 upon co-incubation with CuCl2 (experiments from
Figure 40). The color code of the single species is given on the left side, charges are omitted for
clarity.
Comparably to the calculations done for iron (III), also for copper (II) co-incubation with a
concentration of 0.5 µM a clear difference can be seen for the predominant species formed at
the IC50 values of Q-4 in the different cell lines. While at the IC50 value in the MDR MES-
SA/Dx5 cells the predominant species is still the [CuL] complex, at the IC50 value of the
parental cell line most of the ligand is unbound, while approximately 40% are incorporated in
the [CuL2] complex. Also in case of Q-3 a difference in species formed at the respective IC50
could be observed: Similar to Q-4 also here [CuL] is present at the IC50 value in the resistant
cell line, but not at the IC50 value of the parental counterpart. Even though in a smaller
fraction, this can also be observed in case of the non MDR selective ligand Q-1.
In order to compare the copper (II) binding ability between the investigated ligands and to the
previously described iron (III) binding ability, pM values were also computed for the
copper (II) systems based on the experimentally determined stability constants. The relative
copper (II) chelating ability of the ligands at physiological pH follows the order Q-2 > Q-
1 > Q-3 > Q-4 (Table 13). Compared to the iron binding abilities, the order is similar, with
the exception, that for iron (III) binding Q-2 and Q-1 were equally potent. Like in case of
iron (III), the biological data can be correlated with the p(Cu) values, revealing a higher
toxicity and selectivity for ligands with lower p(Cu) values (Figure 46).
90
Figure 46: Impact of copper (II) binding capacity of the ligands (expressed as p(Cu)*) on their
cytotoxicity (expressed as pIC50) in MES-SA (open symbols) and MES-SA/Dx5 (filled symbols) cells
(A) and on the selectivity ratio (SR) between the investigated cell lines (B). Results of the different
ligands are depicted as circles for Q-1, triangles for Q-2, diamonds for Q-3 and squares for Q-4.
Comparing the binding abilities of the ligands toward the two investigated metal ions, the
higher p(Cu) values over the p(Fe)* values indicate a preference of the ligands for copper(II)
binding over the complexation with iron(III) at pH 7.4. Interestingly, this preference is much
more pronounced in case of the MDR selective ligands Q-3 and Q-4 as compared to the non-
MDR selective derivatives Q-1 and Q-2 (Figure 47).
Figure 47: Selectivity ratio (SR) between MES-SA and MES-SA/Dx5 cells as a function of
preferential binding toward copper over iron (expressed as the fraction of pM* values). Results of the
different ligands are depicted as circles for Q-1, triangles for Q-2, diamonds for Q-3 and squares for
Q-4.
3.4. Elucidation of putative mechanism(s) of action 91
The pyrimidinylhydrazone IV-b showed MDR selective toxicity in a cell line dependent
manner. Similar to Q-1 and further cell line dependently selective agents, namely the
pyridinyl TSC II-g and the pyridinyl hydrazino-benzothiazole V-b, its toxicity was attenuated
in the presence of NAC (see chapter 3.4.1.). Since metal complexes might be involved in this
process, the metal binding properties of IV-b were investigated in similar experiments, in
order to compare its metal binding properties to that of the presented 8-hydroxyquinoline
derivatives. pK values were determined and are given in the Scheme in Figure 48. In contrast
to the 8-hydroxyquinoline compound set, which binds to metal ions via an (Nquinoline,O-)
bidentate coordination mode [252], ligand IV-b binds to metal ions via an NNN coordination
mode (see chapter 3.2.).
Upon metal binding, well-defined charge transfer bands appear in the visible wavelength
range of the pH-dependent UV‒Vis spectra shown in Figure 48 D and E. While the CT bands
considerably overlap with the ligand bands, the d-d bands are too weak to be detected in the
applied concentration of 50 µM. Deconvolution of the spectra suggests the formation of mono
and bis complexes with iron (III), with a predominance for the bis-complex [FeL2]3+
in the
physiologic pH range, although the hydrolysis of the metal ion suppresses the complex
formation at alkaline pH values. Surprisingly, at alkaline pH values (pH > ~ 8.5), the
development of CT bands in the 510–610 nm wavelength range could be detected. These
bands are characteristic for the formation of Fe (II) complexes formed with ligands consisting
of aromatic nitrogen donor atoms. Also at lower pH values, the formation of minor amounts
of iron (II) complexes might be possible, but the redox process of the complex seems to be
pH-dependent and much faster in the basic pH range. Thus data collected at pH > 7.5 were
not used for the complex stability calculations. The pM value of the ligand allows the
comparison of its iron (III) binding ability to that of other ligands. With a pM of 17.6, the
iron (III) binding ability of IV-b can be settled between that of the borderline MDR selective
ligand Q-2 and the MDR selective agent Q-3.
92
Figure 48: UV-Vis absorption spectra recorded at different pH values for 50 µM ligand IV-b (A)
alone or in the presence of 20 µM FeCl3 (D), or 50 µM CuCl2 (E). The molar absorption spectra for
the ligand species (B) and pH dependent species distribution of the ligand (C) were calculated from
the spectral data, and pK values were assigned as indicated in the Scheme. Data of IV-b were
published in reference [89].
Also in case of copper complexation, the formation of mono-, protonated mono- and bis-
complexes could be observed, although the formation of the [CuL2]2+
complex seems less
pronounced as in the case of iron (III). With a pM value of 8.6 calculated for the copper
binding ability, IV-b is a much weaker copper chelator compared to the 8-hydroxyquinoline
set of chelators Q-1 to Q-4. A further difference to the 8-hydroxyquinolines can be seen in the
metal binding preference: While in case of the MDR selective ligands Q-3 and Q-4 a clear
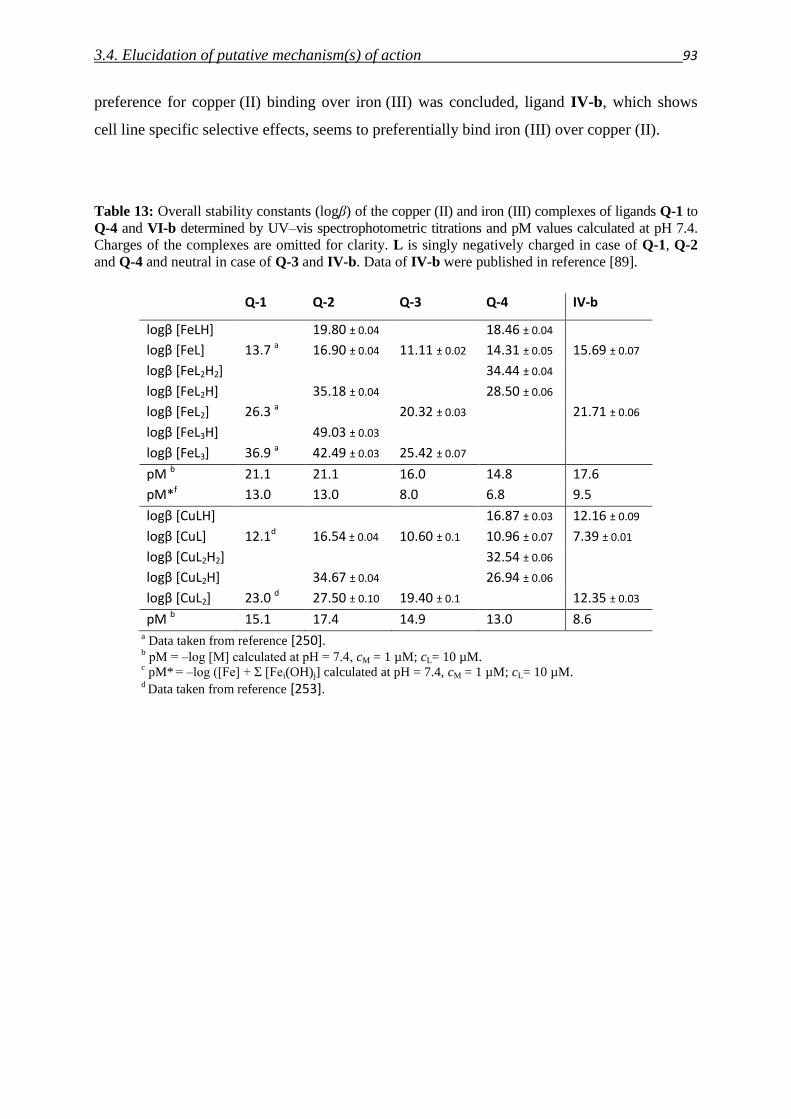
3.4. Elucidation of putative mechanism(s) of action 93
preference for copper (II) binding over iron (III) was concluded, ligand IV-b, which shows
cell line specific selective effects, seems to preferentially bind iron (III) over copper (II).
Table 13: Overall stability constants (logβ) of the copper (II) and iron (III) complexes of ligands Q-1 to
Q-4 and VI-b determined by UV–vis spectrophotometric titrations and pM values calculated at pH 7.4.
Charges of the complexes are omitted for clarity. L is singly negatively charged in case of Q-1, Q-2
and Q-4 and neutral in case of Q-3 and IV-b. Data of IV-b were published in reference [89].
Q-1 Q-2 Q-3 Q-4 IV-b
logβ [FeLH] 19.80 ± 0.04 18.46 ± 0.04
logβ [FeL] 13.7 a 16.90 ± 0.04 11.11 ± 0.02 14.31 ± 0.05 15.69 ± 0.07
logβ [FeL2H2] 34.44 ± 0.04
logβ [FeL2H] 35.18 ± 0.04 28.50 ± 0.06
logβ [FeL2] 26.3 a 20.32 ± 0.03 21.71 ± 0.06
logβ [FeL3H] 49.03 ± 0.03
logβ [FeL3] 36.9 a 42.49 ± 0.03 25.42 ± 0.07
pM b 21.1 21.1 16.0 14.8 17.6
pM*f 13.0 13.0 8.0 6.8 9.5
logβ [CuLH] 16.87 ± 0.03 12.16 ± 0.09
logβ [CuL] 12.1d 16.54 ± 0.04 10.60 ± 0.1 10.96 ± 0.07 7.39 ± 0.01
logβ [CuL2H2] 32.54 ± 0.06
logβ [CuL2H] 34.67 ± 0.04 26.94 ± 0.06
logβ [CuL2] 23.0 d 27.50 ± 0.10 19.40 ± 0.1 12.35 ± 0.03
pM b 15.1 17.4 14.9 13.0 8.6 a Data taken from reference [250].
b pM = ‒log [M] calculated at pH = 7.4, cM = 1 µM; cL= 10 µM.
c pM*
= ‒log ([Fe] + Σ [Fei(OH)j] calculated at pH = 7.4, cM = 1 µM; cL= 10 µM.
d Data taken from reference [253].
94
3.4.4. In vitro testing of preformed complexes – and the impact of P-gp on their toxicity
Following the characterization of the iron (III) and copper (II) binding ability of the selected
ligands, complexes were prepared in solution in order to test their antitumor potential in vitro.
Since metal complexes of these ligand types are reported to be poorly soluble in water [254],
for the biological tests, 10 mM stock solutions of ligands were prepared in DMSO in presence
of 1, 0.5 and 0.33 equivalents of the respective metal ion. In contrast to the co-incubation
experiments (presented in 3.4.2.), a constant metal-to-ligand ratio is ensured over the
investigated concentration range by the application of preformed complexes. In order to avoid
misinterpretation due to different amount of ligand present in the respective complexes,
concentrations are expressed as ligand equivalents. Therefore in the 1:3 metal-to-ligand ratio,
the IC50 values were in general viewed as 1/3 [ML3]. In order to compare the activity of the
free and complexed ligands, fold changes upon metal binding were calculated as the fraction
of the average IC50 values of free vs. complexed ligands with negative values representing a
decrease in toxicity, while positive values are indicating an increase in toxicity upon metal ion
complexation. The results are summarized and illustrated in Figure 49 A-D for the 8-hydroxy-
quinoline compound set. In agreement with the co-incubation data (chapter 3.4.2.), the
iron (III) complexes of Q-1 behaved very similar to the free ligand – the only significant
difference is a slight increase in toxicity in MES-SA cells at 1:1 ratio. Comparably, the
toxicity of Q-2 upon iron (III) complexation was slightly increased in MES-SA cells in the
metal-to-ligand ratios 1:3 and 1:2, and significantly decreased in MES-SA/Dx5 cells at the 1:1
ratio. While the tris complex [FeL3] of the MDR selective ligand Q-3 was more toxic in MES-
SA cells, the bis and mono complexes ([FeL2]+ and [FeL]
2+) were less toxic than the free
ligands in MES-SA/Dx5 cells. This is in agreement with the protection of MES-SA/Dx5 cells
against the toxicity of Q-3 by co-incubated FeCl3. Also the bis- and mono-complexes of
ligand Q-4 were found to be less toxic than the free ligand.
On the contrary, complexation with copper generally seemed to increase the toxicity of the
ligands. While for Q-1 a significant effect could only be observed for the mono complex in
both cell lines, for Q-2 complexation in the metal to ligand ratios 1:3 to 1:1 resulted in
increased toxicity in both cell lines, with a higher magnitude in MES-SA as compared to the
MDR MES-SA/Dx5 cells. For the MDR selective ligands Q-3 and Q-4 a significant increase
could be observed upon complexation with copper (II) in all investigated metal-to-ligand
ratios in MES-SA cells, but not in P-gp-expressing MES-SA/Dx5 cells.
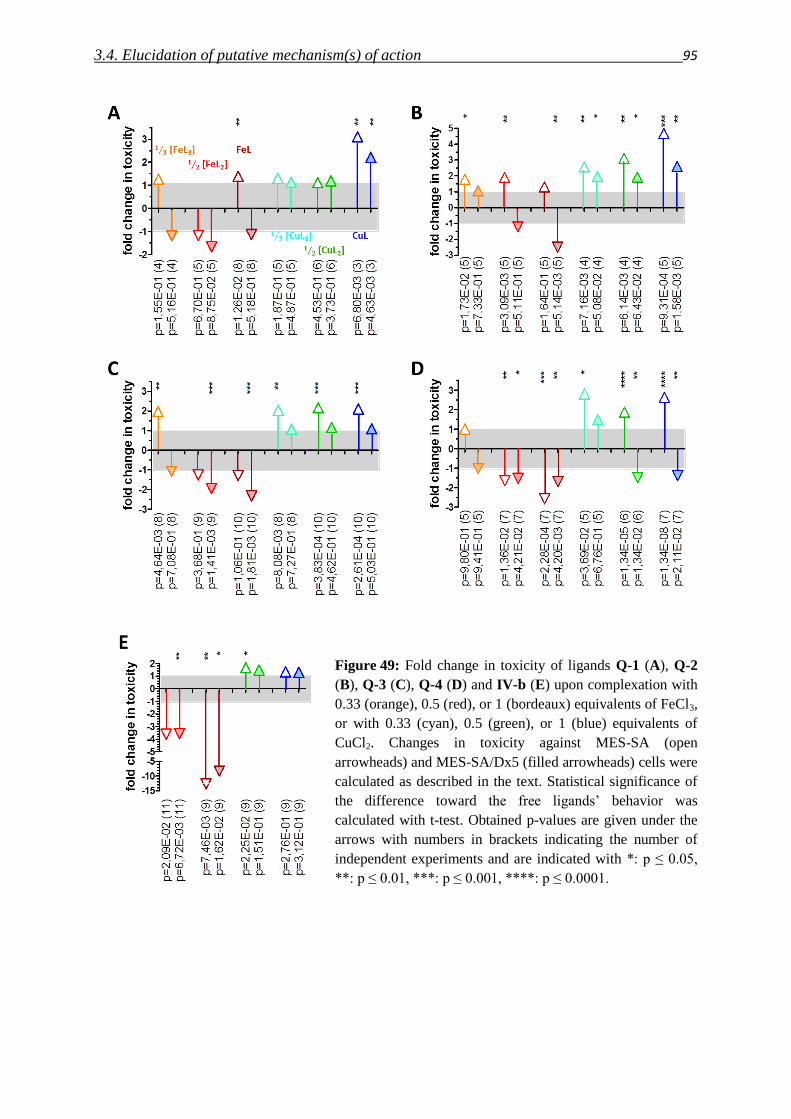
3.4. Elucidation of putative mechanism(s) of action 95
Figure 49: Fold change in toxicity of ligands Q-1 (A), Q-2
(B), Q-3 (C), Q-4 (D) and IV-b (E) upon complexation with
0.33 (orange), 0.5 (red), or 1 (bordeaux) equivalents of FeCl3,
or with 0.33 (cyan), 0.5 (green), or 1 (blue) equivalents of
CuCl2. Changes in toxicity against MES-SA (open
arrowheads) and MES-SA/Dx5 (filled arrowheads) cells were
calculated as described in the text. Statistical significance of
the difference toward the free ligands’ behavior was
calculated with t-test. Obtained p-values are given under the
arrows with numbers in brackets indicating the number of
independent experiments and are indicated with *: p ≤ 0.05,
**: p ≤ 0.01, ***: p ≤ 0.001, ****: p ≤ 0.0001.
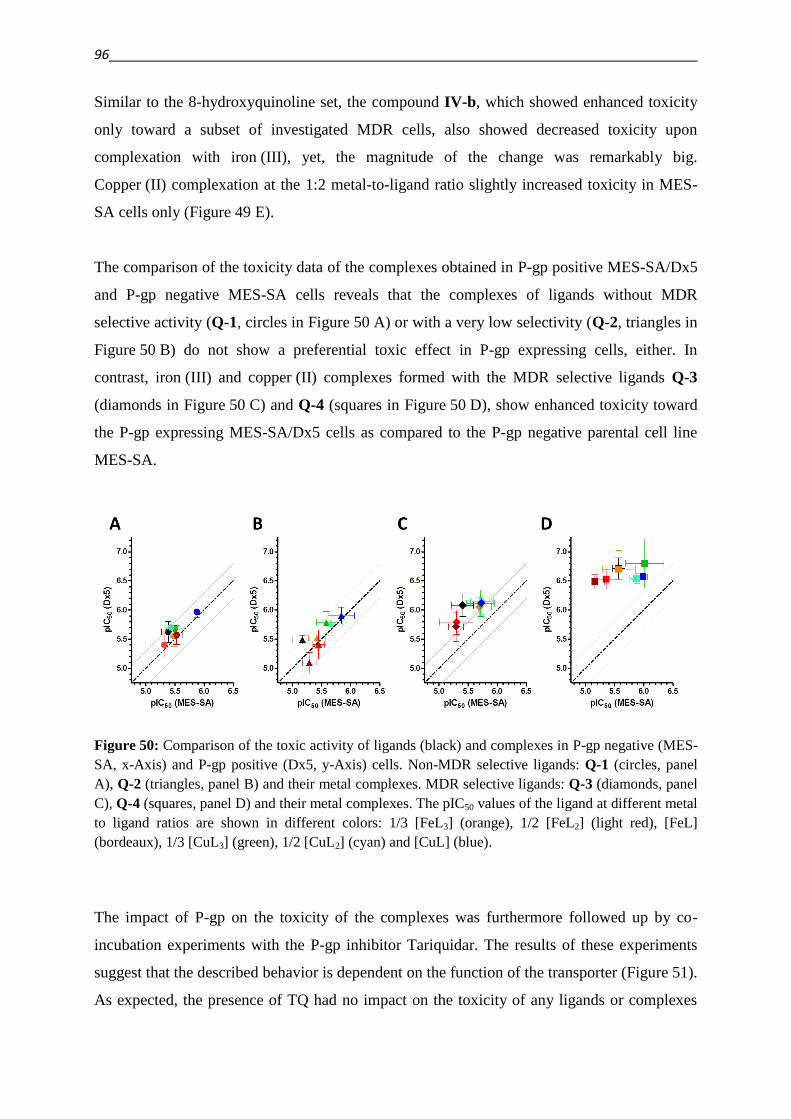
96
Similar to the 8-hydroxyquinoline set, the compound IV-b, which showed enhanced toxicity
only toward a subset of investigated MDR cells, also showed decreased toxicity upon
complexation with iron (III), yet, the magnitude of the change was remarkably big.
Copper (II) complexation at the 1:2 metal-to-ligand ratio slightly increased toxicity in MES-
SA cells only (Figure 49 E).
The comparison of the toxicity data of the complexes obtained in P-gp positive MES-SA/Dx5
and P-gp negative MES-SA cells reveals that the complexes of ligands without MDR
selective activity (Q-1, circles in Figure 50 A) or with a very low selectivity (Q-2, triangles in
Figure 50 B) do not show a preferential toxic effect in P-gp expressing cells, either. In
contrast, iron (III) and copper (II) complexes formed with the MDR selective ligands Q-3
(diamonds in Figure 50 C) and Q-4 (squares in Figure 50 D), show enhanced toxicity toward
the P-gp expressing MES-SA/Dx5 cells as compared to the P-gp negative parental cell line
MES-SA.
Figure 50: Comparison of the toxic activity of ligands (black) and complexes in P-gp negative (MES-
SA, x-Axis) and P-gp positive (Dx5, y-Axis) cells. Non-MDR selective ligands: Q-1 (circles, panel
A), Q-2 (triangles, panel B) and their metal complexes. MDR selective ligands: Q-3 (diamonds, panel
C), Q-4 (squares, panel D) and their metal complexes. The pIC50 values of the ligand at different metal
to ligand ratios are shown in different colors: 1/3 [FeL3] (orange), 1/2 [FeL2] (light red), [FeL]
(bordeaux), 1/3 [CuL3] (green), 1/2 [CuL2] (cyan) and [CuL] (blue).
The impact of P-gp on the toxicity of the complexes was furthermore followed up by co-
incubation experiments with the P-gp inhibitor Tariquidar. The results of these experiments
suggest that the described behavior is dependent on the function of the transporter (Figure 51).
As expected, the presence of TQ had no impact on the toxicity of any ligands or complexes
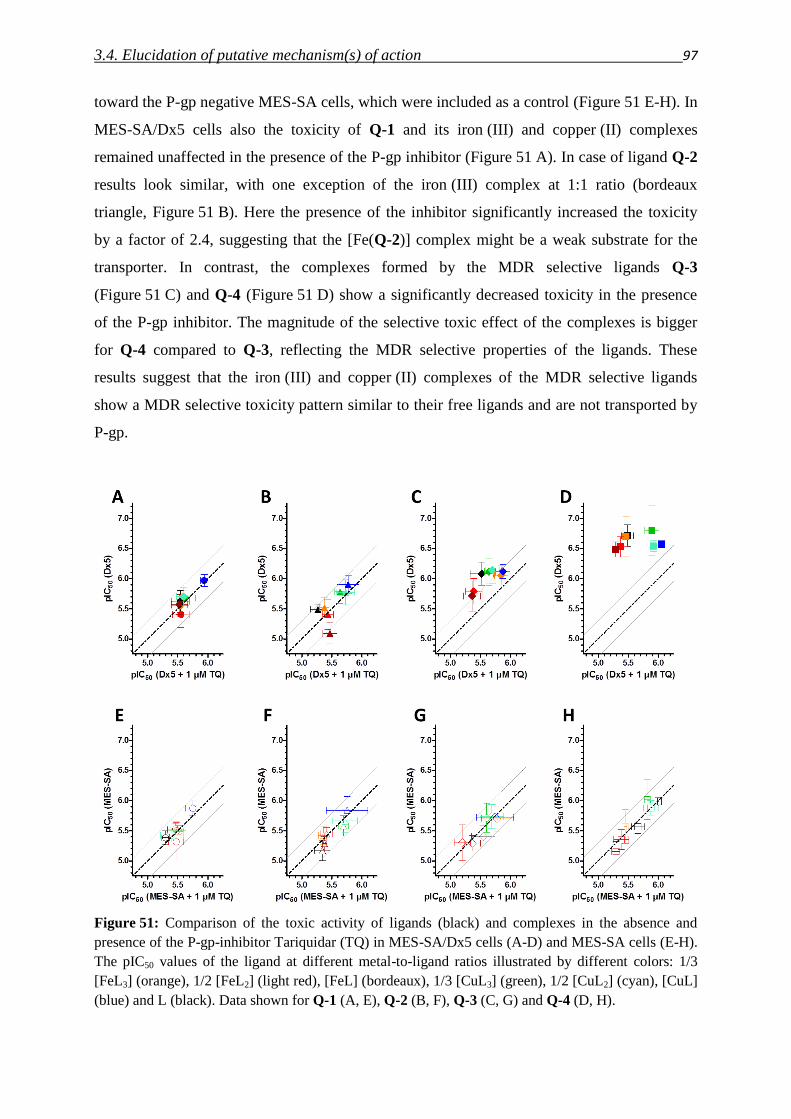
3.4. Elucidation of putative mechanism(s) of action 97
toward the P-gp negative MES-SA cells, which were included as a control (Figure 51 E-H). In
MES-SA/Dx5 cells also the toxicity of Q-1 and its iron (III) and copper (II) complexes
remained unaffected in the presence of the P-gp inhibitor (Figure 51 A). In case of ligand Q-2
results look similar, with one exception of the iron (III) complex at 1:1 ratio (bordeaux
triangle, Figure 51 B). Here the presence of the inhibitor significantly increased the toxicity
by a factor of 2.4, suggesting that the [Fe(Q-2)] complex might be a weak substrate for the
transporter. In contrast, the complexes formed by the MDR selective ligands Q-3
(Figure 51 C) and Q-4 (Figure 51 D) show a significantly decreased toxicity in the presence
of the P-gp inhibitor. The magnitude of the selective toxic effect of the complexes is bigger
for Q-4 compared to Q-3, reflecting the MDR selective properties of the ligands. These
results suggest that the iron (III) and copper (II) complexes of the MDR selective ligands
show a MDR selective toxicity pattern similar to their free ligands and are not transported by
P-gp.
Figure 51: Comparison of the toxic activity of ligands (black) and complexes in the absence and
presence of the P-gp-inhibitor Tariquidar (TQ) in MES-SA/Dx5 cells (A-D) and MES-SA cells (E-H).
The pIC50 values of the ligand at different metal-to-ligand ratios illustrated by different colors: 1/3
[FeL3] (orange), 1/2 [FeL2] (light red), [FeL] (bordeaux), 1/3 [CuL3] (green), 1/2 [CuL2] (cyan), [CuL]
(blue) and L (black). Data shown for Q-1 (A, E), Q-2 (B, F), Q-3 (C, G) and Q-4 (D, H).
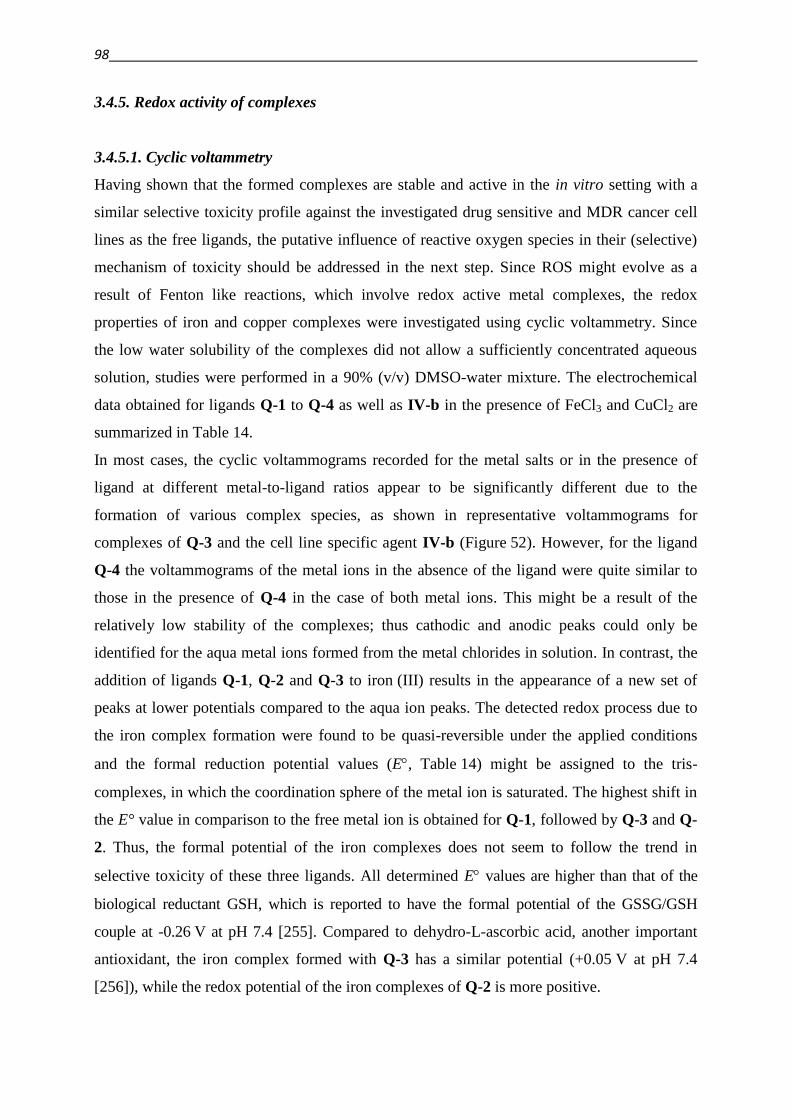
98
3.4.5. Redox activity of complexes
3.4.5.1. Cyclic voltammetry
Having shown that the formed complexes are stable and active in the in vitro setting with a
similar selective toxicity profile against the investigated drug sensitive and MDR cancer cell
lines as the free ligands, the putative influence of reactive oxygen species in their (selective)
mechanism of toxicity should be addressed in the next step. Since ROS might evolve as a
result of Fenton like reactions, which involve redox active metal complexes, the redox
properties of iron and copper complexes were investigated using cyclic voltammetry. Since
the low water solubility of the complexes did not allow a sufficiently concentrated aqueous
solution, studies were performed in a 90% (v/v) DMSO-water mixture. The electrochemical
data obtained for ligands Q-1 to Q-4 as well as IV-b in the presence of FeCl3 and CuCl2 are
summarized in Table 14.
In most cases, the cyclic voltammograms recorded for the metal salts or in the presence of
ligand at different metal-to-ligand ratios appear to be significantly different due to the
formation of various complex species, as shown in representative voltammograms for
complexes of Q-3 and the cell line specific agent IV-b (Figure 52). However, for the ligand
Q-4 the voltammograms of the metal ions in the absence of the ligand were quite similar to
those in the presence of Q-4 in the case of both metal ions. This might be a result of the
relatively low stability of the complexes; thus cathodic and anodic peaks could only be
identified for the aqua metal ions formed from the metal chlorides in solution. In contrast, the
addition of ligands Q-1, Q-2 and Q-3 to iron (III) results in the appearance of a new set of
peaks at lower potentials compared to the aqua ion peaks. The detected redox process due to
the iron complex formation were found to be quasi-reversible under the applied conditions
and the formal reduction potential values (E, Table 14) might be assigned to the tris-
complexes, in which the coordination sphere of the metal ion is saturated. The highest shift in
the E° value in comparison to the free metal ion is obtained for Q-1, followed by Q-3 and Q-
2. Thus, the formal potential of the iron complexes does not seem to follow the trend in
selective toxicity of these three ligands. All determined E values are higher than that of the
biological reductant GSH, which is reported to have the formal potential of the GSSG/GSH
couple at -0.26 V at pH 7.4 [255]. Compared to dehydro-L-ascorbic acid, another important
antioxidant, the iron complex formed with Q-3 has a similar potential (+0.05 V at pH 7.4
[256]), while the redox potential of the iron complexes of Q-2 is more positive.
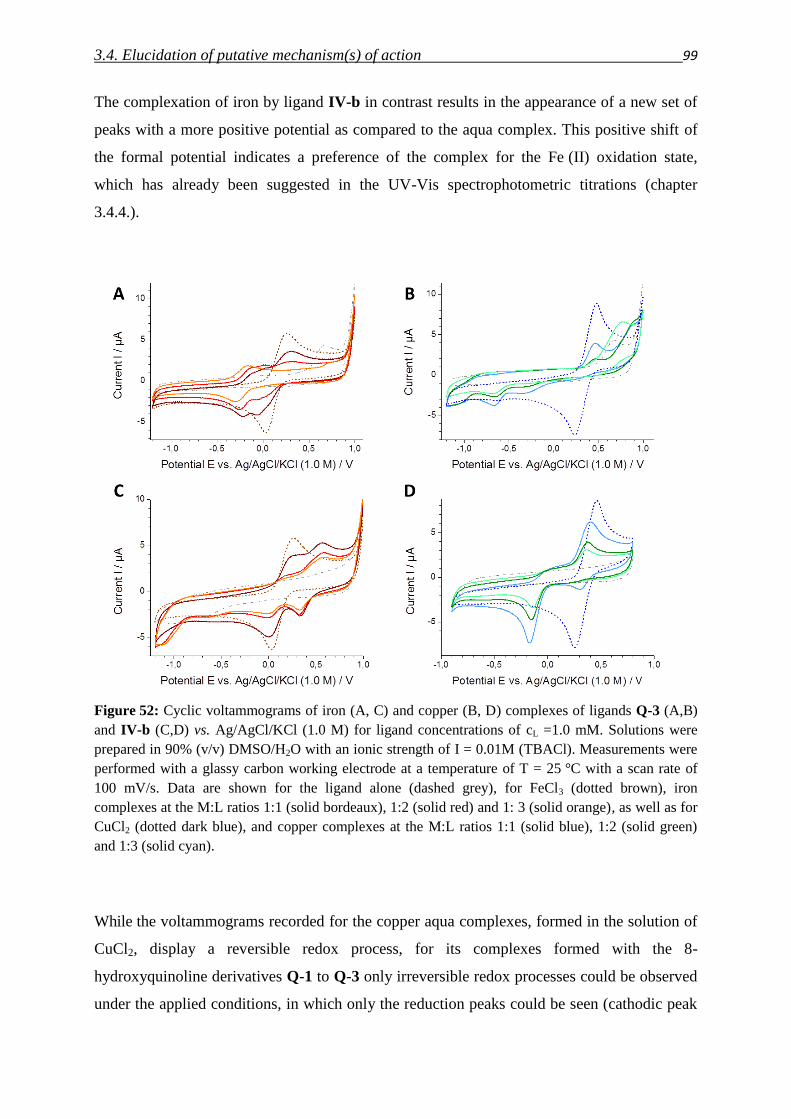
3.4. Elucidation of putative mechanism(s) of action 99
The complexation of iron by ligand IV-b in contrast results in the appearance of a new set of
peaks with a more positive potential as compared to the aqua complex. This positive shift of
the formal potential indicates a preference of the complex for the Fe (II) oxidation state,
which has already been suggested in the UV-Vis spectrophotometric titrations (chapter
3.4.4.).
Figure 52: Cyclic voltammograms of iron (A, C) and copper (B, D) complexes of ligands Q-3 (A,B)
and IV-b (C,D) vs. Ag/AgCl/KCl (1.0 M) for ligand concentrations of cL =1.0 mM. Solutions were
prepared in 90% (v/v) DMSO/H2O with an ionic strength of I = 0.01M (TBACl). Measurements were
performed with a glassy carbon working electrode at a temperature of T = 25 °C with a scan rate of
100 mV/s. Data are shown for the ligand alone (dashed grey), for FeCl3 (dotted brown), iron
complexes at the M:L ratios 1:1 (solid bordeaux), 1:2 (solid red) and 1: 3 (solid orange), as well as for
CuCl2 (dotted dark blue), and copper complexes at the M:L ratios 1:1 (solid blue), 1:2 (solid green)
and 1:3 (solid cyan).
While the voltammograms recorded for the copper aqua complexes, formed in the solution of
CuCl2, display a reversible redox process, for its complexes formed with the 8-
hydroxyquinoline derivatives Q-1 to Q-3 only irreversible redox processes could be observed
under the applied conditions, in which only the reduction peaks could be seen (cathodic peak
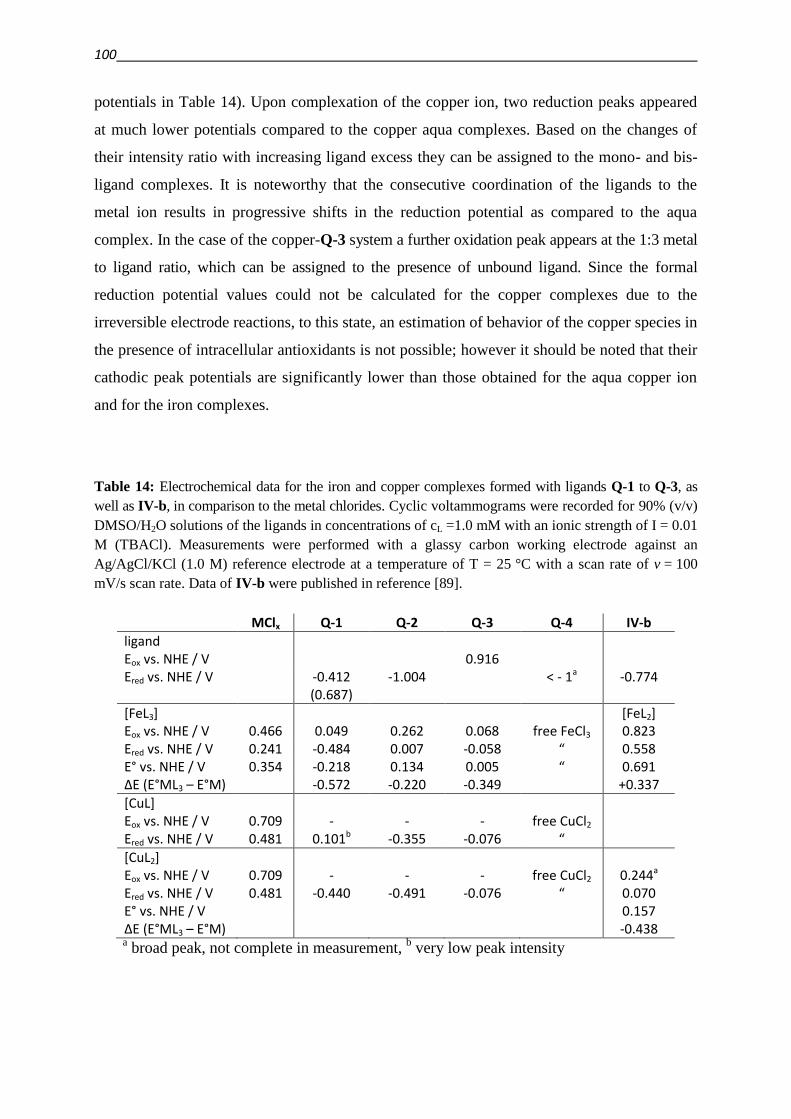
100
potentials in Table 14). Upon complexation of the copper ion, two reduction peaks appeared
at much lower potentials compared to the copper aqua complexes. Based on the changes of
their intensity ratio with increasing ligand excess they can be assigned to the mono- and bis-
ligand complexes. It is noteworthy that the consecutive coordination of the ligands to the
metal ion results in progressive shifts in the reduction potential as compared to the aqua
complex. In the case of the copper-Q-3 system a further oxidation peak appears at the 1:3 metal
to ligand ratio, which can be assigned to the presence of unbound ligand. Since the formal
reduction potential values could not be calculated for the copper complexes due to the
irreversible electrode reactions, to this state, an estimation of behavior of the copper species in
the presence of intracellular antioxidants is not possible; however it should be noted that their
cathodic peak potentials are significantly lower than those obtained for the aqua copper ion
and for the iron complexes.
Table 14: Electrochemical data for the iron and copper complexes formed with ligands Q-1 to Q-3, as
well as IV-b, in comparison to the metal chlorides. Cyclic voltammograms were recorded for 90% (v/v)
DMSO/H2O solutions of the ligands in concentrations of cL =1.0 mM with an ionic strength of I = 0.01
M (TBACl). Measurements were performed with a glassy carbon working electrode against an
Ag/AgCl/KCl (1.0 M) reference electrode at a temperature of T = 25 °C with a scan rate of v = 100
mV/s scan rate. Data of IV-b were published in reference [89].
MClx Q-1 Q-2 Q-3 Q-4 IV-b
ligand Eox vs. NHE / V 0.916 Ered vs. NHE / V -0.412
(0.687) -1.004 < - 1a -0.774
[FeL3] [FeL2] Eox vs. NHE / V 0.466 0.049 0.262 0.068 free FeCl3 0.823 Ered vs. NHE / V 0.241 -0.484 0.007 -0.058 “ 0.558 E° vs. NHE / V 0.354 -0.218 0.134 0.005 “ 0.691 ∆E (E°ML3 – E°M) -0.572 -0.220 -0.349 +0.337
[CuL] Eox vs. NHE / V 0.709 - - - free CuCl2 Ered vs. NHE / V 0.481 0.101b -0.355 -0.076 “
[CuL2] Eox vs. NHE / V 0.709 - - - free CuCl2 0.244a Ered vs. NHE / V 0.481 -0.440 -0.491 -0.076 “ 0.070 E° vs. NHE / V 0.157 ∆E (E°ML3 – E°M) -0.438 a broad peak, not complete in measurement,
b very low peak intensity
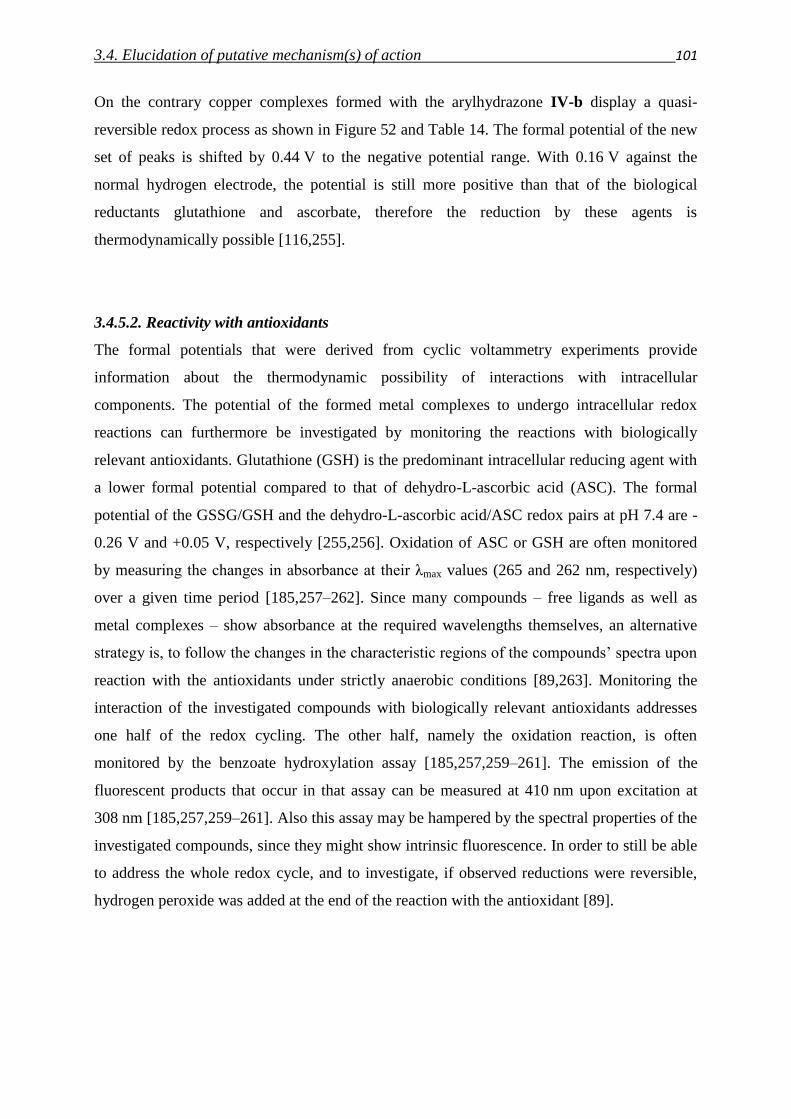
3.4. Elucidation of putative mechanism(s) of action 101
On the contrary copper complexes formed with the arylhydrazone IV-b display a quasi-
reversible redox process as shown in Figure 52 and Table 14. The formal potential of the new
set of peaks is shifted by 0.44 V to the negative potential range. With 0.16 V against the
normal hydrogen electrode, the potential is still more positive than that of the biological
reductants glutathione and ascorbate, therefore the reduction by these agents is
thermodynamically possible [116,255].
3.4.5.2. Reactivity with antioxidants
The formal potentials that were derived from cyclic voltammetry experiments provide
information about the thermodynamic possibility of interactions with intracellular
components. The potential of the formed metal complexes to undergo intracellular redox
reactions can furthermore be investigated by monitoring the reactions with biologically
relevant antioxidants. Glutathione (GSH) is the predominant intracellular reducing agent with
a lower formal potential compared to that of dehydro-L-ascorbic acid (ASC). The formal
potential of the GSSG/GSH and the dehydro-L-ascorbic acid/ASC redox pairs at pH 7.4 are -
0.26 V and +0.05 V, respectively [255,256]. Oxidation of ASC or GSH are often monitored
by measuring the changes in absorbance at their λmax values (265 and 262 nm, respectively)
over a given time period [185,257–262]. Since many compounds – free ligands as well as
metal complexes – show absorbance at the required wavelengths themselves, an alternative
strategy is, to follow the changes in the characteristic regions of the compounds’ spectra upon
reaction with the antioxidants under strictly anaerobic conditions [89,263]. Monitoring the
interaction of the investigated compounds with biologically relevant antioxidants addresses
one half of the redox cycling. The other half, namely the oxidation reaction, is often
monitored by the benzoate hydroxylation assay [185,257,259–261]. The emission of the
fluorescent products that occur in that assay can be measured at 410 nm upon excitation at
308 nm [185,257,259–261]. Also this assay may be hampered by the spectral properties of the
investigated compounds, since they might show intrinsic fluorescence. In order to still be able
to address the whole redox cycle, and to investigate, if observed reductions were reversible,
hydrogen peroxide was added at the end of the reaction with the antioxidant [89].
102
Figure 53: Time-dependent UV–Vis spectra of the [CuL] complexes of Q-1 (A), Q-2 (B), Q-3 (C)
and Q-4 (D) upon addition of 5 equivalents of GSH. Black dashed line denotes the initial spectrum
before addition of GSH, grey dashed line the spectrum upon addition of H2O2.
3.4. Elucidation of putative mechanism(s) of action 103
Even though the formal redox potentials obtained from cyclic voltammetric studies of the 8-
hydroxyquinoline set suggested a putative reduction by GSH, spectral changes were not
observed in any of the investigated iron complexes upon addition of GSH (tmax = 90 min).
This suggests that under the applied conditions the formed iron complexes of ligands Q-1 to
Q-4 seem to be redox inert.
In contrast, moderately fast redox reactions were observed in case of the copper (II)
complexes when GSH was added. As illustrated in Figure 53, the recorded time-dependent
spectra revealed a significant decrease of the absorbance values at the respective λmax of the
copper (II) complexes of ligands Q-1 to Q-4 during the reaction with GSH. Additionally, the
absorbance at the λmax values of the free ligands (~ 304 nm) seemed to increase with
progressing time, indicating a possible ligand release of ligand upon re-organization of the
coordination sphere in the reduced copper (I) complexes. In order to investigate the
reversibility of the observed reaction, H2O2 was added to the samples. The oxidant restored
the spectra obtained with the original copper (II) complexes, showing the reversibility of the
redox process.
Comparing the rates of the reduction reactions (as on the right side on the Figure 53), it
seems, that the reduction of the [Cu(Q-4)] complex, which possessed the highest MDR
selectivity among the studied systems, shows the slowest reaction. Yet, the investigation of
two further compounds with high MDR selectivity did not follow that trend (data not shown),
suggesting that this observation might not be an explanation for the selectivity.
As for the 8-hydroxyquinoline ligand set, also the kinetic runs of the [CuL]2+
complex formed
with ligand IV-b were performed at pH 7.40, while in case of the [FeL]3+
complex the pH was
lowered to 5.45 in order to avoid metal ion hydrolysis and the possible formation of the Fe
(II) species in the Fe (III) - ligand system in the basic pH range (see chapters 3.4.3. and
3.4.5.1.). In line with the high redox potential observed for [Fe(IV-b)]3+
(chapter 3.4.5.1.),
this complex was reduced by ascorbate, as shown in Figure 54 B. Addition of hydrogen
peroxide at the end of the kinetic run resulted in only negligible changes in the spectra, even
after 30 min, suggesting that the observed reduction is not reversible, and that the complex is
therefore unlikely to undergo intracellular redox cycling. Surprisingly, a ten-fold excess of the
stronger reducing agent GSH did not provoke spectral changes in the [Fe(IV-b)]3+
system
within 90 min. This suggests that this reaction might be kinetically hindered. A similar trend
in the reduction kinetics of the two reducing agents has been reported for the reactions of
vanadium complexes [262,263].
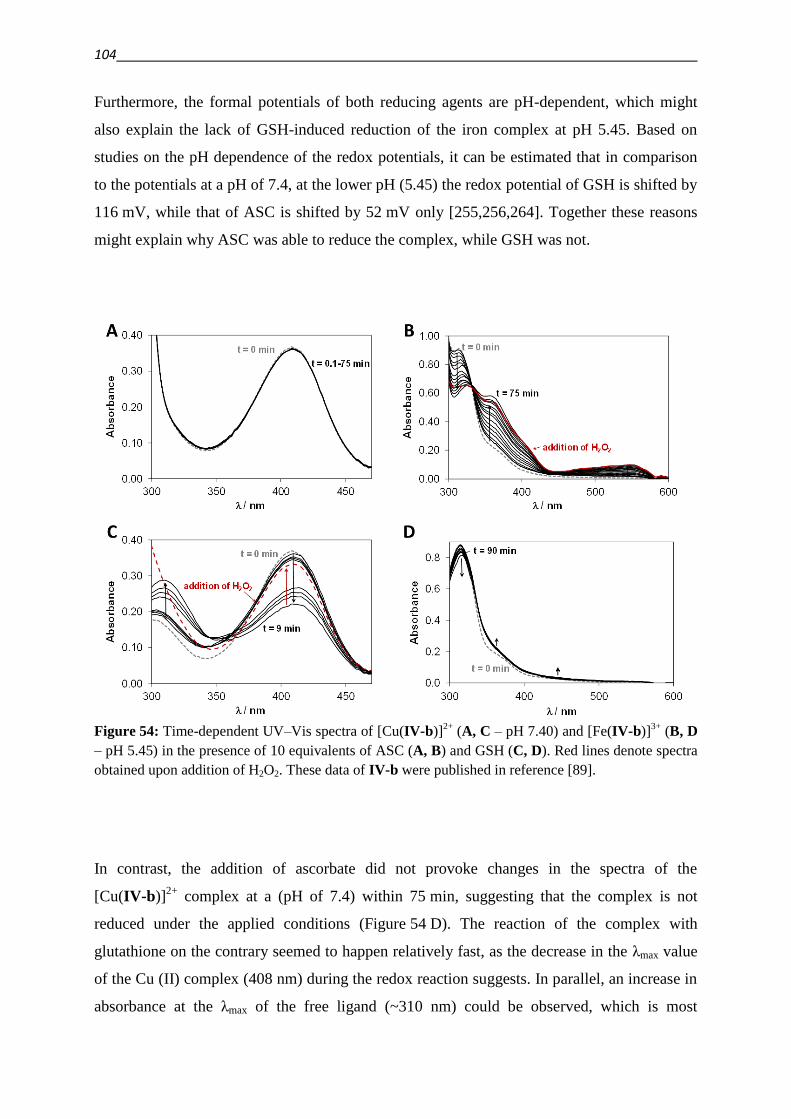
104
Furthermore, the formal potentials of both reducing agents are pH-dependent, which might
also explain the lack of GSH-induced reduction of the iron complex at pH 5.45. Based on
studies on the pH dependence of the redox potentials, it can be estimated that in comparison
to the potentials at a pH of 7.4, at the lower pH (5.45) the redox potential of GSH is shifted by
116 mV, while that of ASC is shifted by 52 mV only [255,256,264]. Together these reasons
might explain why ASC was able to reduce the complex, while GSH was not.
Figure 54: Time-dependent UV–Vis spectra of [Cu(IV-b)]2+
(A, C – pH 7.40) and [Fe(IV-b)]3+
(B, D
– pH 5.45) in the presence of 10 equivalents of ASC (A, B) and GSH (C, D). Red lines denote spectra
obtained upon addition of H2O2. These data of IV-b were published in reference [89].
In contrast, the addition of ascorbate did not provoke changes in the spectra of the
[Cu(IV-b)]2+
complex at a (pH of 7.4) within 75 min, suggesting that the complex is not
reduced under the applied conditions (Figure 54 D). The reaction of the complex with
glutathione on the contrary seemed to happen relatively fast, as the decrease in the λmax value
of the Cu (II) complex (408 nm) during the redox reaction suggests. In parallel, an increase in
absorbance at the λmax of the free ligand (~310 nm) could be observed, which is most
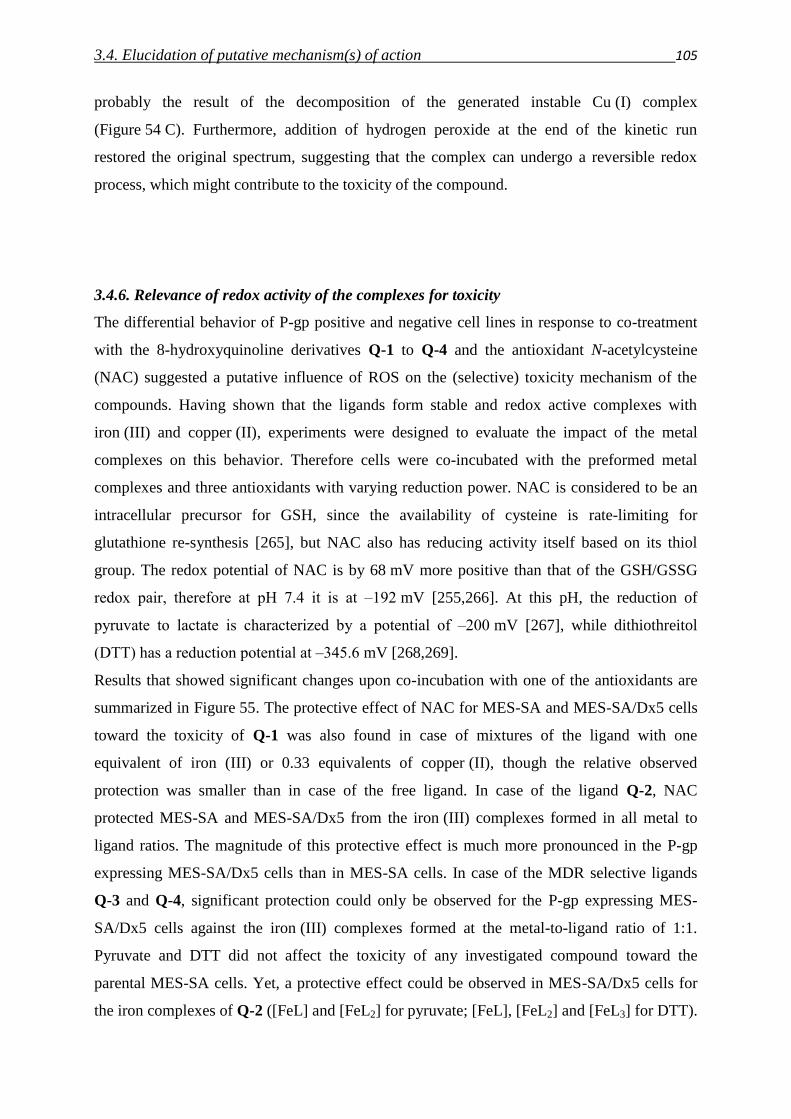
3.4. Elucidation of putative mechanism(s) of action 105
probably the result of the decomposition of the generated instable Cu (I) complex
(Figure 54 C). Furthermore, addition of hydrogen peroxide at the end of the kinetic run
restored the original spectrum, suggesting that the complex can undergo a reversible redox
process, which might contribute to the toxicity of the compound.
3.4.6. Relevance of redox activity of the complexes for toxicity
The differential behavior of P-gp positive and negative cell lines in response to co-treatment
with the 8-hydroxyquinoline derivatives Q-1 to Q-4 and the antioxidant N-acetylcysteine
(NAC) suggested a putative influence of ROS on the (selective) toxicity mechanism of the
compounds. Having shown that the ligands form stable and redox active complexes with
iron (III) and copper (II), experiments were designed to evaluate the impact of the metal
complexes on this behavior. Therefore cells were co-incubated with the preformed metal
complexes and three antioxidants with varying reduction power. NAC is considered to be an
intracellular precursor for GSH, since the availability of cysteine is rate-limiting for
glutathione re-synthesis [265], but NAC also has reducing activity itself based on its thiol
group. The redox potential of NAC is by 68 mV more positive than that of the GSH/GSSG
redox pair, therefore at pH 7.4 it is at ‒192 mV [255,266]. At this pH, the reduction of
pyruvate to lactate is characterized by a potential of ‒200 mV [267], while dithiothreitol
(DTT) has a reduction potential at ‒345.6 mV [268,269].
Results that showed significant changes upon co-incubation with one of the antioxidants are
summarized in Figure 55. The protective effect of NAC for MES-SA and MES-SA/Dx5 cells
toward the toxicity of Q-1 was also found in case of mixtures of the ligand with one
equivalent of iron (III) or 0.33 equivalents of copper (II), though the relative observed
protection was smaller than in case of the free ligand. In case of the ligand Q-2, NAC
protected MES-SA and MES-SA/Dx5 from the iron (III) complexes formed in all metal to
ligand ratios. The magnitude of this protective effect is much more pronounced in the P-gp
expressing MES-SA/Dx5 cells than in MES-SA cells. In case of the MDR selective ligands
Q-3 and Q-4, significant protection could only be observed for the P-gp expressing MES-
SA/Dx5 cells against the iron (III) complexes formed at the metal-to-ligand ratio of 1:1.
Pyruvate and DTT did not affect the toxicity of any investigated compound toward the
parental MES-SA cells. Yet, a protective effect could be observed in MES-SA/Dx5 cells for
the iron complexes of Q-2 ([FeL] and [FeL2] for pyruvate; [FeL], [FeL2] and [FeL3] for DTT).
106
DTT additionally protected MES-SA/Dx5 cells from the free ligand Q-1 and the iron (III)
complex formed with Q-3 at 1:1 ratio.
These results seem to be contradictory to the lack of observed interaction with GSH in the
monitored reactions (chapter 3.4.5.2.). Though, this ostensible contradiction might show a
weakness of the model, since it has to be kept in mind that the (intracellular) redox reactions
depend on actual concentrations and are also not independent of pH. Furthermore, it has been
reported that the reduction by GSH in the model might be kinetically hindered in some cases.
Accordingly, for some metal complexes that did not show reactions with GSH, a reduction by
the weaker antioxidant ascorbate has been reported [262,263].
Figure 55: Significant fold changes in toxicity upon co-incubation with the indicated antioxidants
(concentrations were 5 mM for NAC, 5 mM for pyruvate (pyr) and 100 µM for DTT). Ligands are
indicated in the boxes. Changes in toxicity against MES-SA (open arrowheads) and MES-SA/Dx5
(filled arrowheads) cells were calculated as the fraction of IC50 values in the presence vs. the absence
of the antioxidant. Thereby positive values indicate an increase in toxicity, while negative values
indicate a decrease in toxicity. Results obtained with free ligands are shown in black, that of [FeL3] in
orange, [FeL2] in red, [FeL] in bordeaux, [CuL3] in cyan, and [CuL] in blue. Statistical significance
was calculated with t-test, three independent experiments were performed. Obtained p-values are
given under the arrows and are indicated with *: p ≤ 0.05, **: p ≤ 0.01, ***: p ≤ 0.001, ****: p ≤
0.0001.
In contrast, for the copper (II) complexes, the only significant change upon co-incubation was
observed for [Cu(Q-4)]2+
. Even though this observation could not be found with the other
3.4. Elucidation of putative mechanism(s) of action 107
antioxidants pyruvate and DTT, the toxicity toward MES-SA/Dx5 cells was found to be
slightly increased in the presence of NAC.
Taken together, these observations underline the “Janus-face” like character of the
antioxidant: while on one hand it can scavenge reactive oxygen species, on the other hand, it
might induce a mechanism of “activation by reduction” [86,116,135], and increase the
oxidative stress leading to increased cellular damage. The lack of effect of antioxidants on the
toxicity of most copper complexes might therefore either mean a real lack of effect, or be
caused by parallel processes that counteract each other.
The different reactivity of MES-SA and MES-SA/Dx5 cells toward the combination of 8-
hydroxyquinoline derivatives of different MDR selectivity, or metal complexes thereof, with
antioxidants might again imply a different redox homeostasis of the parental and drug
resistant cells.
108
4. Establishing techniques to measure ROS
4.1. DCFDA
The inherent instability and reactivity of most ROS and their very low steady state levels
render the precise determination of their intracellular levels challenging [270]. The most
frequently used method to measure intracellular ROS is based on the membrane permeable
reagent 2’7’-Dichlorofluoresceindiacetate (DCFDA). As detailed in the methods section
(Chapter 5.8.1.), upon cleavage of the ester bonds by intracellular esterases, the membrane
impermeable, but still non-fluorescent Dichlorofluorescin (DCF-H) is formed, which is
oxidized by ROS to the fluorescent Dichlorofluorescein (DCF) [271,272]. Even though being
membrane impermeable in principle, studies revealed, that it is a substrate for the ABC-
transporters MRP1 and BCRP. In contrast it is not recognized and exported by P-gp, allowing
the application in the test setup of MDR selective compounds [273].
As summarized in Table 15, different protocols can be found for the application of the DCF-
DA dye in the literature. The dye can be used for measurements of ROS levels within tumor
spheroids [274], primary cells [275], as well as in suspension [135,276,277] and adherent cell
lines [278–282]. Applicable methods for the measurement of intracellular fluorescence of the
dye include flow cytometry, microscopy and spectrofluorimetric measurements. Often, the
effect of test compounds on the cellular redox homeostasis is investigated. In these cases,
three different experimental setups can be found with respect to the incubation protocols. The
treatment of the cells can occur in parallel (Table 15, entry 2, [278]), prior to (Table 15,
entries 3-6, [276,279–281,283]) or after loading of the cells with the DCFDA-reagent (Table
15, entries 7-10, [135,271,275,277,282]).
In order to establish a measurement system, the assay protocol was optimized using hydrogen
peroxide (H2O2) and tert-butyl hydroperoxide (tBHP) as positive controls. Furthermore, cell
free controls were used, to detect interactions of the dye with the oxidants as well as
background reactions that might occur in solution (in the absence of the oxidants) due to
hydrolysis and subsequent oxidation by atmospheric oxygen. Changes in fluorescence were
investigated over a time period of one to four hours. A simultaneous incubation of cells with
the test compounds and the DCFDA dye did not seem to be a preferential method, as high
background signals were observed, which caused an unsatisfactory signal-to-noise ratio.
In a next step, cells were seeded to plates, attached overnight and treated with the oxidants.
3.5. Establishing techniques to measure ROS 109
Table 15: Different protocols used for the measurement of reactive oxygen species with the DCFDA-
dye in the literature.
loading with DCFDA
treatment with compound
measurement method
medium Ref.
1 multicellular tumor spheroids
no compound treatment
confocal laser scanning microscopy
HEPES-containing buffer
[274]
2 simultaneous incubation with DCFDA and test compound; trypsinization of adherent cells after incubation
flow cytometry not specified [278]
3 after treatment, test-compound not removed during loading, trypsinization after loading
cells attached, compound treatment prior to DCFDA loading
flow cytometry after washing with cold buffer
culture medium
[279] [280]
4 after treatment, test-compound not removed during loading
suspension cells, treatment prior to DCFDA-loading
flow cytometry not specified [276]
5 after treatment, putatively in the presence of test compound (not specified)
prior to DCFDA loading
measurement of cell-lysates at spectrofluorimeter; cell free controls added
not specified [283]
6 a) after treatment, test-compound not removed, trypsinization after loading
b) attached cells, simultaneously with treatment
a) cells attached, treatment prior to DCFDA loading.
b) attached cells, simultaneously with DCFDA-loading
a) flow cytometry after washing with buffer
b) laser cytometry on attached cells
a) buffer
b) serum-free culture medium
[281]
7 cells attached on a chip, DCFDA-loading prior to treatment
treatment after loading, DCFDA not removed
fluorescence microscopy
culture medium
[282]
8 suspension cells, labeling prior to treatment
treatment after loading
flow cytometry not specified ([277]) / HBSS buffer ([135])
[277] [135]
9 freshly isolated glomeruli, loading prior to treatment
treatment after DCFDA-loading and removal of loading medium
plate reader (note: cell free control missing)
culture medium
[275]
10 loading of suspended cells in buffer prior to treatment, removal of loading buffer for treatment
treatment after loading, following a recovery time for esterases
not specified (amine-free) buffer
[271]
110
Before incubation with the dye, the test compounds were removed. After loading with the
dye, recovery times of 0 min, 30 min, 60 min, or 120 min were applied before trypsinization
and subsequent measurement of the cell suspensions by flow cytometry. Differences in the
fluorescence of treated and untreated cells were minor; the overall signals decreased with an
elongated recovery time. Since the process of trypsinization might represent a certain stress
for the cells, which might elevate the overall ROS levels, the protocol was modified for
measurement with the microplate reader. However, this modification did not result in a
reliable method either, since only one of four investigated cell lines showed small changes in
fluorescence upon treatment with the oxidants.
Therefore the protocol was further modified, shifting the loading of the cells with the dye
prior to the treatment with the oxidants in the schedule of the experiment. After staining with
DCFDA for 30 min at 37°C, cells were washed and seeded to 96 well plates in a density of
20.000 C/W. Basal fluorescence levels were determined prior to the addition of test
compounds and the measured data could be expressed as fold change toward the basal levels
and the untreated controls (see methods part, chapter 5.8.1. for details).
Figure 56 shows results obtained with the optimized protocol using the oxidant tBHP. The
induced signal was found to be dose dependent and increasing over time. MES-SA and MES-
SA/Dx5 cells showed a comparable behavior in the assay.
Figure 56: Using the DCFDA assay for the measurement of intracellular tBHP. (A): representative
kinetic curve of an experiment showing the measured fluorescence signal of stained, but untreated
(grey) MES-SA (open squares) and MES-SA/Dx5 (filled squares), with the cell-free control (stars) in
comparison to the treatment condition with 5 mM of tBHP. (B): Dose-dependence of induced signal by
tBHP after 60 min of incubation. Average and standard deviation of 6 independent experiments
performed in duplicates are shown.
3.5. Establishing techniques to measure ROS 111
Being able to detect the addition of the peroxide tBHP, which can be considered as a ROS
itself, the next step was, to test the established system with a compound that is able to induce
reactive oxygen species as a cellular response. One example for such a compound is the
natural occurring naphthoquinone Plumbagin, which is used in Traditional Chinese Medicine.
It has antitumor activity, which is reported to involve the formation of ROS via its copper
complexes [284–287].
Prior to the experiments, the impact of ROS in the mechanism of cytotoxicity of Plumbagin
was investigated by co-incubation with N-acetylcysteine. As shown in Figure 57, the ROS-
scavenger was able to protect MES-SA and MES-SA/Dx5 from the toxic effect of Plumbagin
in a dose-dependent manner, confirming a role of ROS in the activity of the compound.
Figure 57: Involvement of ROS in the toxicity mechanism of Plumbagin. Dose response curves
showing average and standard deviation of 5 independent experiments with MES-SA (A) and MES-
SA/Dx5 (B) cells in the absence (black) and presence of 1 mM (green) and 5 mM (blue) NAC.
Resulting IC50 values are summarized in panel C.
112
As apparent from Figure 58, Plumbagin was able to induce a fluorescence signal in the
DCFDA-assay in both MES-SA and MES-SA/Dx5 cells. Furthermore, co-administration of
the ROS-scavenger NAC attenuated the intensity of the signal, confirming a connection
between signal intensity and ROS production.
Figure 58: ROS induction of tBHP and Plumbagin as measured by DCFDA assay in the absence
(black) or presence of 1mM (green) NAC. Data represent the mean and standard error (SEM) of
compound induced change in fluorescence after 1 h obtained in 5 independent experiments performed
in duplicate. Cell free controls are shown in striped columns, while open columns show the signals
obtained with MES-SA and filled columns that in MES-SA/Dx5 cells.
It is noteworthy, that also in cell-free conditions, an increased fluorescence could be observed
for the measurements with 100 µM of Plumbagin. Its quinoidic substructure enables the
compound to redox cycle and consequently take part in chemical reactions with the dye. This
indicates, that results obtained with the assay, might have to be interpreted with caution in
some cases. Still, the difference between cell free and cellular samples is significant and
relatively high. Therefore the established assay seems to provide a powerful tool for the
measurement of ROS in cellular systems.
3.5. Establishing techniques to measure ROS 113
In a next step, a set of 8-hydroxyquinoline derivatives Q-1, Q-3 and Q-4, as well as their
iron (III) and copper (II) complexes were investigated for their potential to induce reactive
oxygen species in a cellular context. As shown in Figure 59, the pronounced signal induction
in cell free conditions does unfortunately not allow a reliable conclusion in the cases of the
MDR selective compounds Q-3 and Q-4.
Figure 59: ROS induction of 8-hydroxyquinoline derivatives Q-1 (A), Q-3 (B) and Q-4 (C) and their
metal complexes in comparison to tBHP as measured by the DCFDA assay. Changes in fluorescence
after 1h of treatment with 100 µM of the indicated compounds are shown. Cell free controls are shown
in striped columns, while open columns show the signals obtained with MES-SA and filled columns
that in MES-SA/Dx5 cells. Free ligands are shown in black, iron complexes FeL in bordeaux and 1/2
[FeL2] in bright red, copper complexes CuL in blue and 1/2 [CuL2] in green.
114
In chapter 3.4. the set of 8-hydroxyquinoline derivatives with varying MDR selective activity
was compared to the arylhydrazone IV-b, which showed enhanced toxicity toward a subset of
MDR cell lines, yet in a P-gp independent manner. It has been shown, that – similar to the 8-
hydroxyquinolines Q-1 to Q-4 – compound IV-b is able to form stable and redox active
complexes. Cellular antioxidants could interact with the formed complexes of iron (III) and
copper (II). Furthermore protection of cells against the toxic effect of IV-b and its metal
complexes by the ROS-scavenger NAC indicates an involvement of ROS in the toxicity
mechanism of the ligand and its complexes.
In order to characterize the extent of ROS formation, the newly established assay was applied.
Figure 60 summarizes the fold changes in fluorescence obtained after 80 min of incubation
with either 50 or 100 µM of the ligand or the indicated complexes. In contrast to the 8-
hydroxyquinoline derivatives, IV-b and its complexes showed only minor interaction with the
DCFDA dye in cell free conditions, rendering the obtained results more reliable. The ligand
alone did not provoke a ROS-related increase in fluorescence, suggesting that the presence of
metal ions is necessary for the induction of ROS. In contrast, complexation with iron (III) in
both metal-to-ligand ratios ([FeL]3+
and [FeL2]3+
) resulted in a dose dependent ROS induction
in equal measure in MES-SA and in MES-SA/Dx5 cells. The presence of NAC prevented the
signal induction (Figure 60 A). In case of the copper complexes, ROS induction could be
observed in the 1:1 metal-to-ligand ratio in both investigated cell lines, but not in case of the
1:2 ratio, in which the Cu-coordination sphere of the formed complexes is saturated
(Figure 60 B). Interestingly, the effect of NAC on the observed ROS-induction of [CuL]2+
depended on the concentration of the complex. While at 50 µM concentration NAC reduced
the fluorescent signal, an increase in fluorescence could be observed at 100 µM. The
diminishing effect of NAC on the signal, induced by 50 µM of the complex is in agreement
with a scavenging activity of the antioxidant. In contrast, the augmenting effect of NAC at the
higher concentration could also be observed in the cell free condition, suggesting that a direct
oxidation of the DCF-H is possible under this condition [288,289]. Still, it is possible that
NAC initiates redox cycling of the formed complex within the cellular context, which –
following Fenton-like chemistry (see Chapter 1.6.) – will increase the formation of reactive
oxygen species by a mechanism of “activation by reduction” [89,135].
3.5. Establishing techniques to measure ROS 115
Figure 60: ROS induction of arylhydrazone IV-b and its iron (III) (A) and Cu (II) (B) in comparison
to tBHP, as measured by the DCFDA assay. Changes in fluorescence after 80 min of treatment with
indicated concentrations are shown. Co-incubation with 1 mM NAC is indicated in the table and
highlighted with a grey background. Cell free controls are shown in striped columns, while open
columns show the signals obtained with MES-SA and filled columns that in MES-SA/Dx5 cells. Free
ligands are shown in black, iron complexes FeL in bordeaux and 1/2 [FeL2] in bright red, copper
complexes CuL in blue and 1/2 [CuL2] in green.
116
The application of DCFDA for the measurement of reactive oxygen species is frequently
used, since it is based on an easy principle; it is cheap and enables the detection of a broad
range of ROS [288,289]. Despite these advantages, the method has certain limitations, which
have to be kept in mind analyzing the data obtained with this system: several intracellular
enzymes have been reported to interact with the ROS mediated oxidation of DCFH to DCF,
such as diverse oxidases [288,290], peroxidases [288,290], catalase [288] and superoxide
dismutase [288], but also non-enzymatic interaction partners can be found like hematin,
hemoglobin, myoglobin [283] and cytochrome c [283,288,289,291]. Furthermore an
artifactual increase in fluorescence can also be the result of photochemistry (followed by
oxidation of the semiquinone radical) [288,289,292,293]. The DCFDA reagent (or derived
intermediates) can also directly interact with the investigated compounds, metal ions and
metal complexes [289,293]. This could be observed in the cases of the 8-hydroxyquinoline
derivatives Q-1, Q-3 and Q-4 as well as for Plumbagin and the copper (II) complex of
compound IV-a, underlining the importance of cell free controls in the application of the
method. A rational use of the DCFDA probe requires an increased awareness for the possible
pitfalls of the assay, which are related to possible mechanistic interactions and pathways
[293]. The number of compounds which might theoretically interfere with DCFDA
emphasizes the importance of proper controls and a careful interpretation of the results. It has
been suggested to use the assay rather as a marker of the cellular oxidative stress, than as
quantitative indicator for the formation of certain reactive oxygen species [270,271,288].
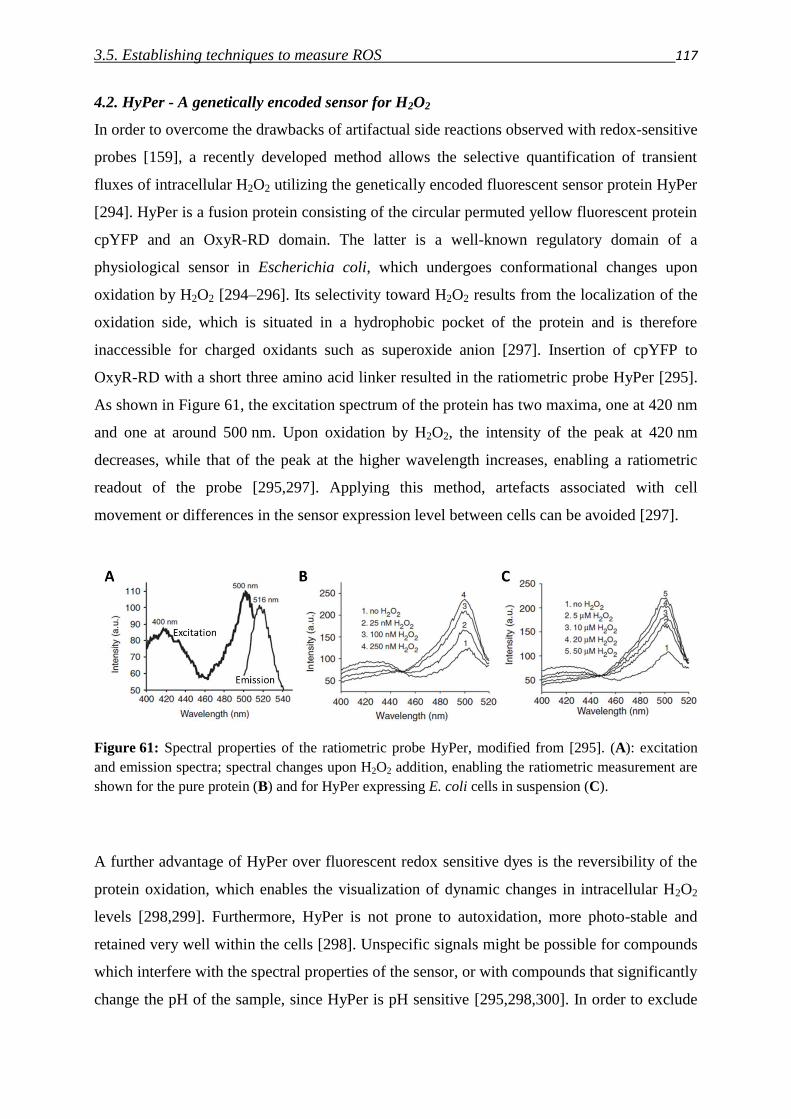
3.5. Establishing techniques to measure ROS 117
4.2. HyPer - A genetically encoded sensor for H2O2
In order to overcome the drawbacks of artifactual side reactions observed with redox-sensitive
probes [159], a recently developed method allows the selective quantification of transient
fluxes of intracellular H2O2 utilizing the genetically encoded fluorescent sensor protein HyPer
[294]. HyPer is a fusion protein consisting of the circular permuted yellow fluorescent protein
cpYFP and an OxyR-RD domain. The latter is a well-known regulatory domain of a
physiological sensor in Escherichia coli, which undergoes conformational changes upon
oxidation by H2O2 [294–296]. Its selectivity toward H2O2 results from the localization of the
oxidation side, which is situated in a hydrophobic pocket of the protein and is therefore
inaccessible for charged oxidants such as superoxide anion [297]. Insertion of cpYFP to
OxyR-RD with a short three amino acid linker resulted in the ratiometric probe HyPer [295].
As shown in Figure 61, the excitation spectrum of the protein has two maxima, one at 420 nm
and one at around 500 nm. Upon oxidation by H2O2, the intensity of the peak at 420 nm
decreases, while that of the peak at the higher wavelength increases, enabling a ratiometric
readout of the probe [295,297]. Applying this method, artefacts associated with cell
movement or differences in the sensor expression level between cells can be avoided [297].
Figure 61: Spectral properties of the ratiometric probe HyPer, modified from [295]. (A): excitation
and emission spectra; spectral changes upon H2O2 addition, enabling the ratiometric measurement are
shown for the pure protein (B) and for HyPer expressing E. coli cells in suspension (C).
A further advantage of HyPer over fluorescent redox sensitive dyes is the reversibility of the
protein oxidation, which enables the visualization of dynamic changes in intracellular H2O2
levels [298,299]. Furthermore, HyPer is not prone to autoxidation, more photo-stable and
retained very well within the cells [298]. Unspecific signals might be possible for compounds
which interfere with the spectral properties of the sensor, or with compounds that significantly
change the pH of the sample, since HyPer is pH sensitive [295,298,300]. In order to exclude
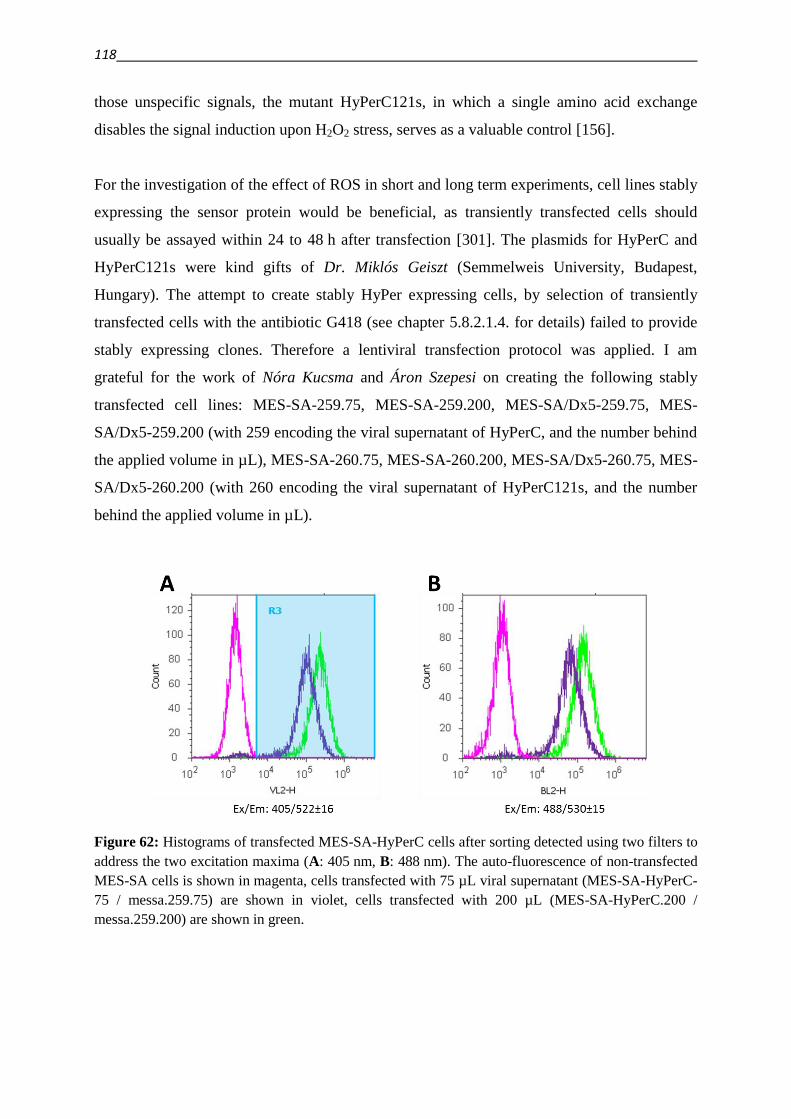
118
those unspecific signals, the mutant HyPerC121s, in which a single amino acid exchange
disables the signal induction upon H2O2 stress, serves as a valuable control [156].
For the investigation of the effect of ROS in short and long term experiments, cell lines stably
expressing the sensor protein would be beneficial, as transiently transfected cells should
usually be assayed within 24 to 48 h after transfection [301]. The plasmids for HyPerC and
HyPerC121s were kind gifts of Dr. Miklós Geiszt (Semmelweis University, Budapest,
Hungary). The attempt to create stably HyPer expressing cells, by selection of transiently
transfected cells with the antibiotic G418 (see chapter 5.8.2.1.4. for details) failed to provide
stably expressing clones. Therefore a lentiviral transfection protocol was applied. I am
grateful for the work of Nóra Kucsma and Áron Szepesi on creating the following stably
transfected cell lines: MES-SA-259.75, MES-SA-259.200, MES-SA/Dx5-259.75, MES-
SA/Dx5-259.200 (with 259 encoding the viral supernatant of HyPerC, and the number behind
the applied volume in µL), MES-SA-260.75, MES-SA-260.200, MES-SA/Dx5-260.75, MES-
SA/Dx5-260.200 (with 260 encoding the viral supernatant of HyPerC121s, and the number
behind the applied volume in µL).
Figure 62: Histograms of transfected MES-SA-HyPerC cells after sorting detected using two filters to
address the two excitation maxima (A: 405 nm, B: 488 nm). The auto-fluorescence of non-transfected
MES-SA cells is shown in magenta, cells transfected with 75 µL viral supernatant (MES-SA-HyPerC-
75 / messa.259.75) are shown in violet, cells transfected with 200 µL (MES-SA-HyPerC.200 /
messa.259.200) are shown in green.
3.5. Establishing techniques to measure ROS 119
Due to their basal fluorescence, the transfected cells could be sorted by flow cytometry.
Exemplarily, Figure 62 shows histograms of sorted MES-SA cells transfected with two
different volumes of HyPerC viral supernatant in comparison to the non-transfected cells.
Transfection with the mutant HyPerC121s and of MES-SA/Dx5 cells resulted in comparable
histograms, as shown in the methods part (Chapter 5.8.2.1.5).
Due to the ratiometric use of the sensor, the results should not depend on the transfection
efficiency [297]. Since initial trials incorporating all eight cell lines were in agreement with
this, in the following studies only those cells transfected with 200 µL supernatant were used.
As MES-SA and MES-SA/Dx5 are adherent cell lines, the signal induction of H2O2 on the
transfected cells was initially investigated on cells that were allowed to attach to 96 well
plates overnight. In order to optimize fluorescence intensity, the cell number was adjusted to
reach confluency for the time of the measurement (40.000C/W were used). In order to avoid
putative disturbance through the components of the medium, measurements were performed
in PBS buffer. Upon baseline measurement, H2O2 was added, and changes in emission at
525 nm upon excitation at 420 and 490 nm were followed. Figure 63 A shows the fold change
of the ratio between both measurements compared to the baseline over time for a
representative experiment upon treatment with 200 µM H2O2. While a signal is induced in
cell lines transfected with HyPerC, cell lines transfected with the mutant HyPerC121s served
as the negative control and did not show signal induction. The induced oxidative stress is
compensated for by the antioxidant system of the cells, provoking a decrease of intracellular
H2O2 levels and concordantly in signal intensity over time.
In Figure 63 B the dose-dependent signal inductions in MES-SA and MES-SA/Dx5 cells are
compared at the time point of 5 min. Based on the three independent experiments (performed
in duplicate) presented in this figure, no significant difference can be observed between the
cell lines. Even though the measurements performed with the plate reader appeared
promising, a drawback of this method is the time shift between the measurements of each
sample with the different excitation wavelength, that provide data for one ratiometric data
point. This time-shift is not negligible and might cause an uncertainty in kinetic
measurements when fast changes occur.
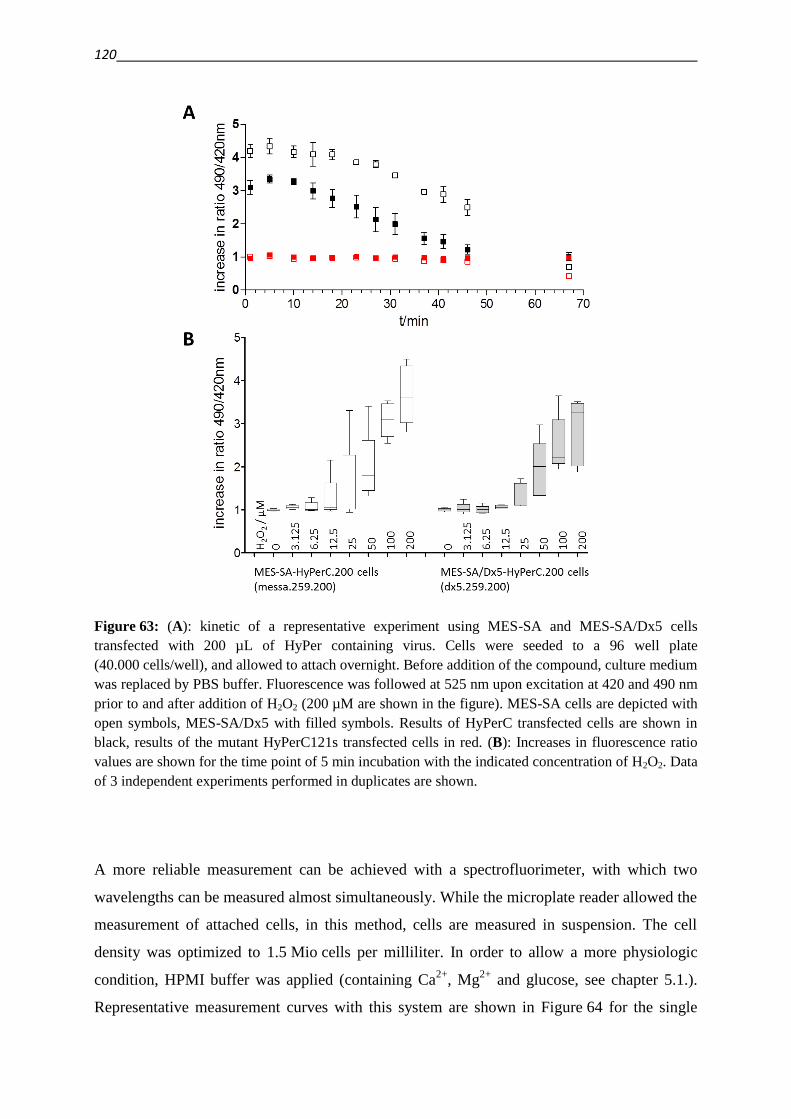
120
Figure 63: (A): kinetic of a representative experiment using MES-SA and MES-SA/Dx5 cells
transfected with 200 µL of HyPer containing virus. Cells were seeded to a 96 well plate
(40.000 cells/well), and allowed to attach overnight. Before addition of the compound, culture medium
was replaced by PBS buffer. Fluorescence was followed at 525 nm upon excitation at 420 and 490 nm
prior to and after addition of H2O2 (200 µM are shown in the figure). MES-SA cells are depicted with
open symbols, MES-SA/Dx5 with filled symbols. Results of HyPerC transfected cells are shown in
black, results of the mutant HyPerC121s transfected cells in red. (B): Increases in fluorescence ratio
values are shown for the time point of 5 min incubation with the indicated concentration of H2O2. Data
of 3 independent experiments performed in duplicates are shown.
A more reliable measurement can be achieved with a spectrofluorimeter, with which two
wavelengths can be measured almost simultaneously. While the microplate reader allowed the
measurement of attached cells, in this method, cells are measured in suspension. The cell
density was optimized to 1.5 Mio cells per milliliter. In order to allow a more physiologic
condition, HPMI buffer was applied (containing Ca2+
, Mg2+
and glucose, see chapter 5.1.).
Representative measurement curves with this system are shown in Figure 64 for the single
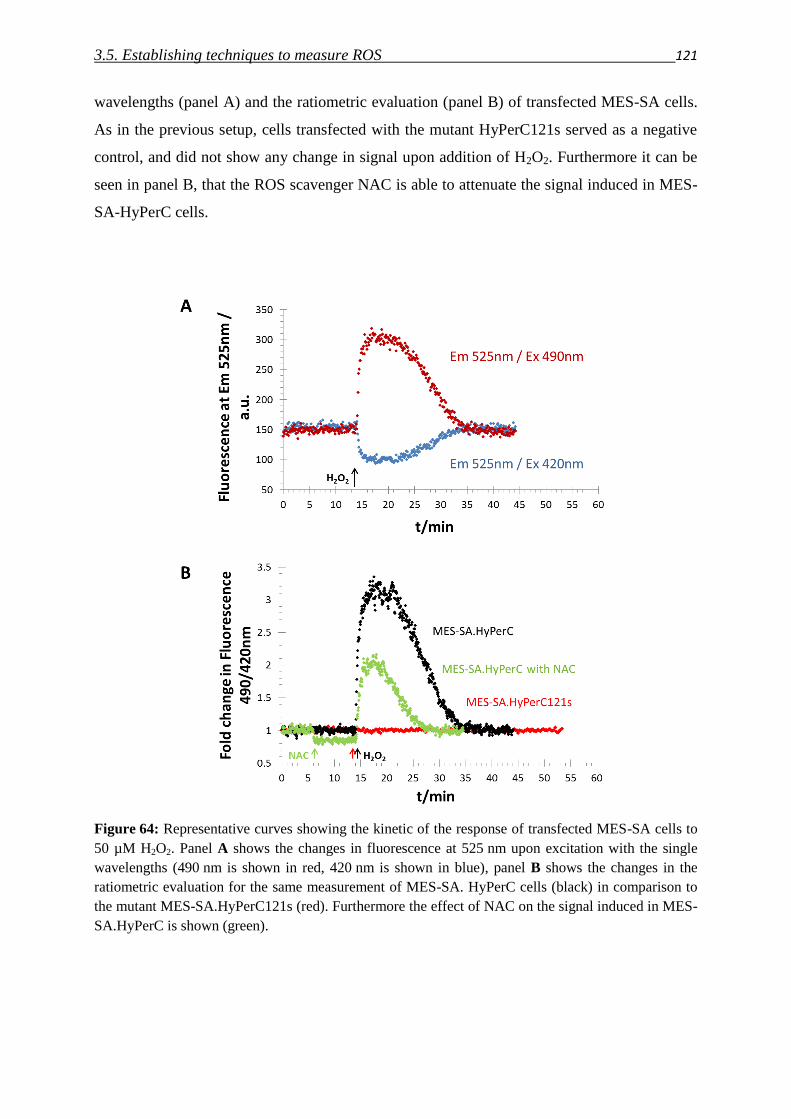
3.5. Establishing techniques to measure ROS 121
wavelengths (panel A) and the ratiometric evaluation (panel B) of transfected MES-SA cells.
As in the previous setup, cells transfected with the mutant HyPerC121s served as a negative
control, and did not show any change in signal upon addition of H2O2. Furthermore it can be
seen in panel B, that the ROS scavenger NAC is able to attenuate the signal induced in MES-
SA-HyPerC cells.
Figure 64: Representative curves showing the kinetic of the response of transfected MES-SA cells to
50 µM H2O2. Panel A shows the changes in fluorescence at 525 nm upon excitation with the single
wavelengths (490 nm is shown in red, 420 nm is shown in blue), panel B shows the changes in the
ratiometric evaluation for the same measurement of MES-SA. HyPerC cells (black) in comparison to
the mutant MES-SA.HyPerC121s (red). Furthermore the effect of NAC on the signal induced in MES-
SA.HyPerC is shown (green).
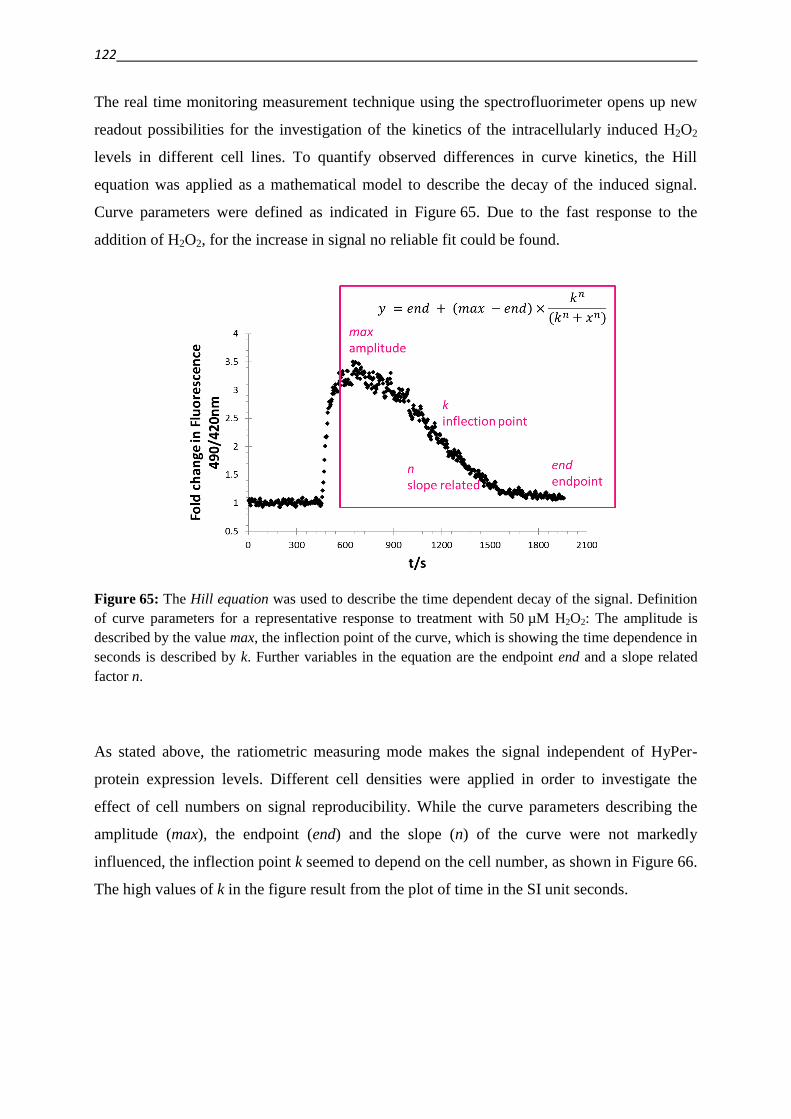
122
The real time monitoring measurement technique using the spectrofluorimeter opens up new
readout possibilities for the investigation of the kinetics of the intracellularly induced H2O2
levels in different cell lines. To quantify observed differences in curve kinetics, the Hill
equation was applied as a mathematical model to describe the decay of the induced signal.
Curve parameters were defined as indicated in Figure 65. Due to the fast response to the
addition of H2O2, for the increase in signal no reliable fit could be found.
Figure 65: The Hill equation was used to describe the time dependent decay of the signal. Definition
of curve parameters for a representative response to treatment with 50 µM H2O2: The amplitude is
described by the value max, the inflection point of the curve, which is showing the time dependence in
seconds is described by k. Further variables in the equation are the endpoint end and a slope related
factor n.
As stated above, the ratiometric measuring mode makes the signal independent of HyPer-
protein expression levels. Different cell densities were applied in order to investigate the
effect of cell numbers on signal reproducibility. While the curve parameters describing the
amplitude (max), the endpoint (end) and the slope (n) of the curve were not markedly
influenced, the inflection point k seemed to depend on the cell number, as shown in Figure 66.
The high values of k in the figure result from the plot of time in the SI unit seconds.
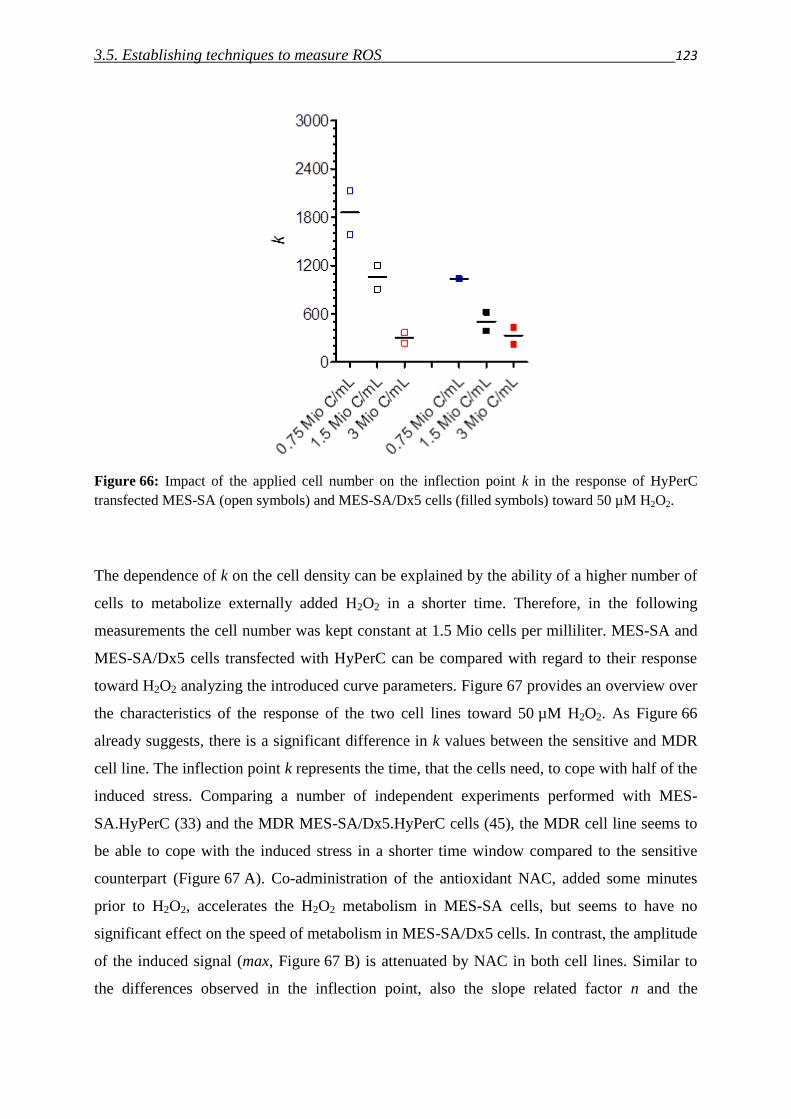
3.5. Establishing techniques to measure ROS 123
Figure 66: Impact of the applied cell number on the inflection point k in the response of HyPerC
transfected MES-SA (open symbols) and MES-SA/Dx5 cells (filled symbols) toward 50 µM H2O2.
The dependence of k on the cell density can be explained by the ability of a higher number of
cells to metabolize externally added H2O2 in a shorter time. Therefore, in the following
measurements the cell number was kept constant at 1.5 Mio cells per milliliter. MES-SA and
MES-SA/Dx5 cells transfected with HyPerC can be compared with regard to their response
toward H2O2 analyzing the introduced curve parameters. Figure 67 provides an overview over
the characteristics of the response of the two cell lines toward 50 µM H2O2. As Figure 66
already suggests, there is a significant difference in k values between the sensitive and MDR
cell line. The inflection point k represents the time, that the cells need, to cope with half of the
induced stress. Comparing a number of independent experiments performed with MES-
SA.HyPerC (33) and the MDR MES-SA/Dx5.HyPerC cells (45), the MDR cell line seems to
be able to cope with the induced stress in a shorter time window compared to the sensitive
counterpart (Figure 67 A). Co-administration of the antioxidant NAC, added some minutes
prior to H2O2, accelerates the H2O2 metabolism in MES-SA cells, but seems to have no
significant effect on the speed of metabolism in MES-SA/Dx5 cells. In contrast, the amplitude
of the induced signal (max, Figure 67 B) is attenuated by NAC in both cell lines. Similar to
the differences observed in the inflection point, also the slope related factor n and the
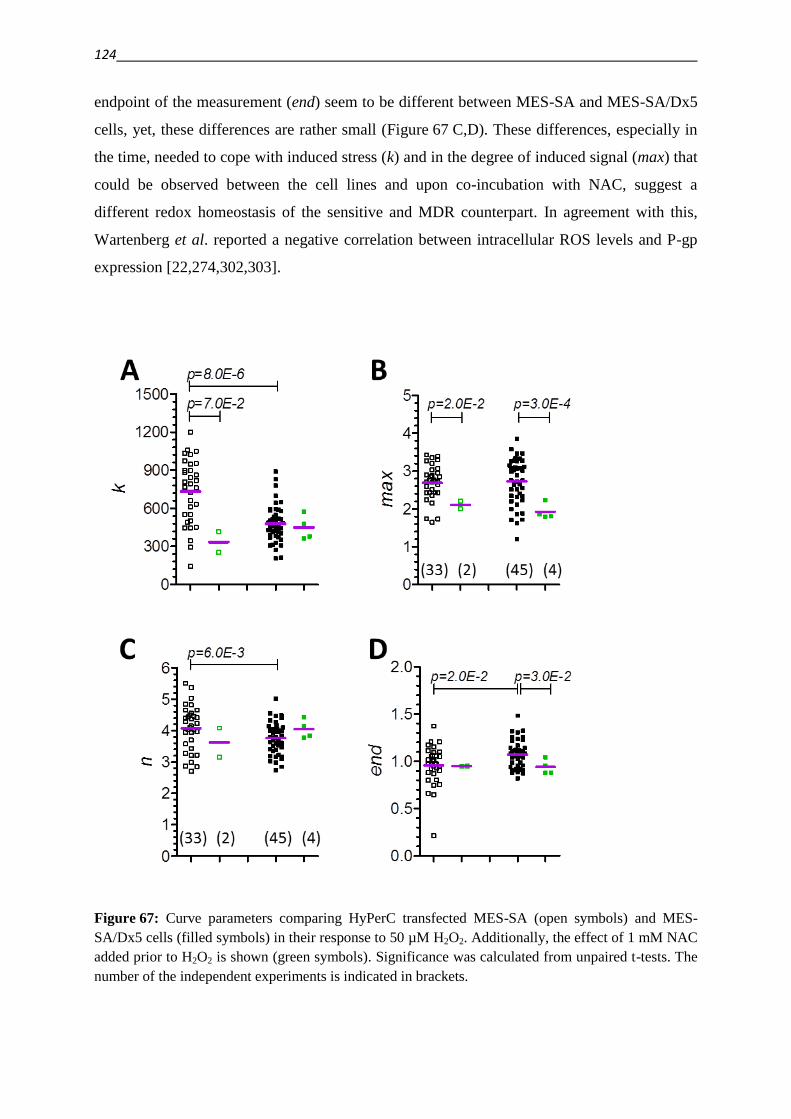
124
endpoint of the measurement (end) seem to be different between MES-SA and MES-SA/Dx5
cells, yet, these differences are rather small (Figure 67 C,D). These differences, especially in
the time, needed to cope with induced stress (k) and in the degree of induced signal (max) that
could be observed between the cell lines and upon co-incubation with NAC, suggest a
different redox homeostasis of the sensitive and MDR counterpart. In agreement with this,
Wartenberg et al. reported a negative correlation between intracellular ROS levels and P-gp
expression [22,274,302,303].
Figure 67: Curve parameters comparing HyPerC transfected MES-SA (open symbols) and MES-
SA/Dx5 cells (filled symbols) in their response to 50 µM H2O2. Additionally, the effect of 1 mM NAC
added prior to H2O2 is shown (green symbols). Significance was calculated from unpaired t-tests. The
number of the independent experiments is indicated in brackets.
3.5. Establishing techniques to measure ROS 125
In order to test, whether the observed differences in the cellular response to H2O2 between
MES-SA and MES-SA/Dx5 cells was dependent on the function of P-gp, the effect of
Tariquidar was investigated. The inhibitor was administered either directly before the
measurement (Figure 68 A,B) or cells were incubated with TQ for 72 h (Figure 68 C,D). As
seen from the curve parameters k and max of these experiments, the currently available data
do not allow a conclusion. Surprisingly, the curve parameters also changed in case of MES-
SA cells. Further experiments would be needed to draw conclusions.
Figure 68: Curve parameters k and max comparing HyPerC transfected MES-SA (open symbols) and
MES-SA/Dx5 cells (filled symbols) in their response to 50 µM H2O2. The effect of 1 or 10 µM TQ,
added 5 min (A, B) or 72 h (C, D) prior to H2O2 is shown (grey symbols). The 72 h treatment was
performed on 6 well plates, the untreated samples in this experiment are given as control values in
these panels (in case of MES-SA cells in the presence of TQ over 72 h, a reliable curve fitting was
only possible for one prepared sample). Significance was calculated from unpaired t-tests. The number
of the independent experiments is indicated in brackets.
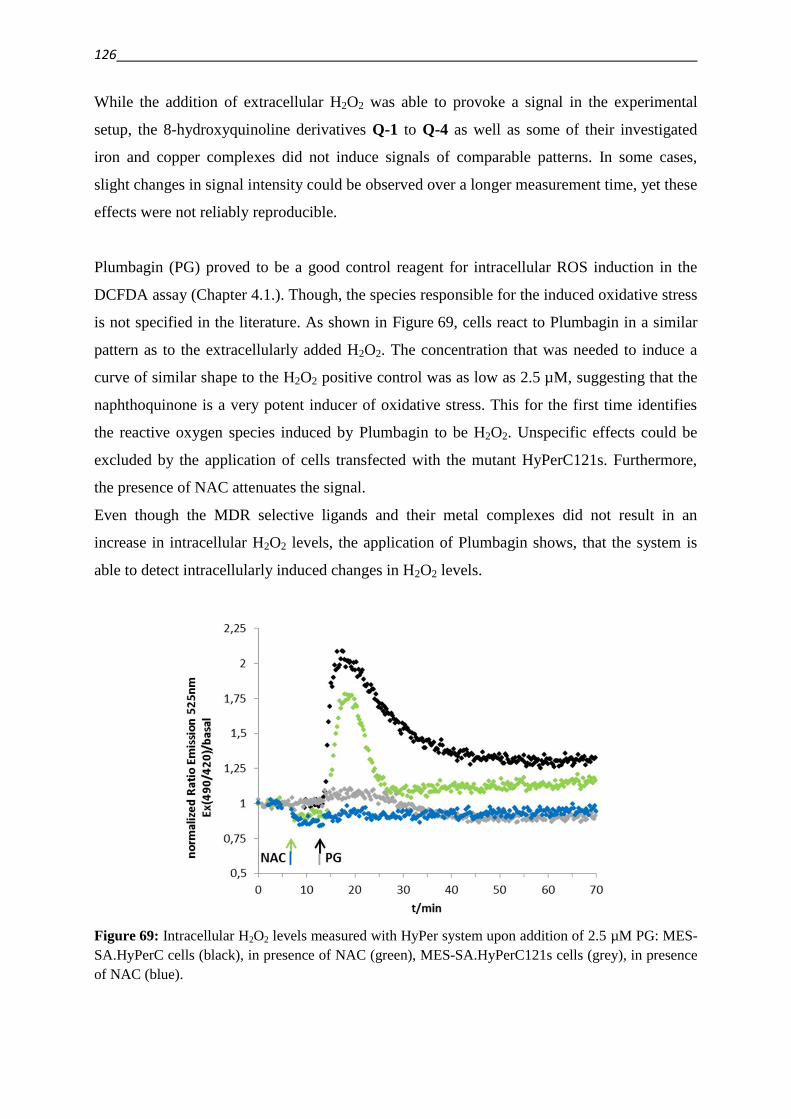
126
While the addition of extracellular H2O2 was able to provoke a signal in the experimental
setup, the 8-hydroxyquinoline derivatives Q-1 to Q-4 as well as some of their investigated
iron and copper complexes did not induce signals of comparable patterns. In some cases,
slight changes in signal intensity could be observed over a longer measurement time, yet these
effects were not reliably reproducible.
Plumbagin (PG) proved to be a good control reagent for intracellular ROS induction in the
DCFDA assay (Chapter 4.1.). Though, the species responsible for the induced oxidative stress
is not specified in the literature. As shown in Figure 69, cells react to Plumbagin in a similar
pattern as to the extracellularly added H2O2. The concentration that was needed to induce a
curve of similar shape to the H2O2 positive control was as low as 2.5 µM, suggesting that the
naphthoquinone is a very potent inducer of oxidative stress. This for the first time identifies
the reactive oxygen species induced by Plumbagin to be H2O2. Unspecific effects could be
excluded by the application of cells transfected with the mutant HyPerC121s. Furthermore,
the presence of NAC attenuates the signal.
Even though the MDR selective ligands and their metal complexes did not result in an
increase in intracellular H2O2 levels, the application of Plumbagin shows, that the system is
able to detect intracellularly induced changes in H2O2 levels.
Figure 69: Intracellular H2O2 levels measured with HyPer system upon addition of 2.5 µM PG: MES-
SA.HyPerC cells (black), in presence of NAC (green), MES-SA.HyPerC121s cells (grey), in presence
of NAC (blue).
4. Summary 127
4. Summary
The development of the multidrug resistant phenotype is a multi-factorial process [3]. The
multiple changes that endow MDR cells with benefits in survival might also create
vulnerabilities that can be exploited to selectively target resistant cancer cells [42]. Therefore,
the application of such MDR selective agents appears to be a promising approach to
overcome multidrug resistance in cancer.
In order to find P-gp mediated MDR selective agents, a panel of several cell lines and the
application of a P-gp inhibitor should be considered:
Analysis of reported compounds, that were serendipitously found to have higher toxicity
toward MDR as compared to sensitive cell lines, revealed that the reported selectivity seems
to be related to cell-line specific alterations other than the expression and function of P-gp
(chapter 3.1.1.). In contrast, compounds that were identified as a result of data analysis from
several cell lines of different P-gp expression levels proved to be more potent in MDR cell
lines as compared to their sensitive counterparts (chapter 3.1.2. – common project with
Szilárd Tóth, András Füredi, and Dr. Anna Lovrics). Furthermore, the selectivity of those
compounds could be abrogated in the presence of the P-gp inhibitor Tariquidar, confirming
that the activity of the transport protein is indeed responsible for the increased toxicity.
Chelation is necessary for MDR selective anticancer activity – but not sufficient:
Despite some degree of chemical diversity, a commonality between the identified MDR
selective agents is their ability to chelate metal ions. Especially thiosemicarbazones (like I-a)
and 8-hydroxyquinoline derived Mannich bases (like Q-3) are prevalently found scaffolds.
Modification of the compounds’ scaffold in a way that disables the binding of metal ions leads
to inactive compounds, with a lack of anticancer toxicity regardless of the resistance status of
investigated cells. Nevertheless, by far not every chelator shows an enhanced activity toward
MDR cell lines.
A focused library around the chemical space of the chelator I-a was designed and tested for
the potential to overcome MDR (chapter 3.2.). While most of the scrutinized compounds from
the focused library show a comparable toxicity throughout the investigated cell line panel,
single compounds show an enhanced toxicity toward certain P-gp expressing cell lines.
Though, this effect appears to be restricted to single cell line pairs and not reversible in the
presence of the P-gp inhibitor Tariquidar.
128
Despite the lack of new generally MDR selective compounds in this library, structure-activity
relationships can be observed with respect to the toxicity of the investigated compounds. In a
comparison of chelators with different metal binding motives – namely pyridinyl TSCs
(NNS), hydroxyphenyl TSCs (ONS), arylhydrazones (NNN), pyridinyl hydrazino-
benzothiazoles (NNS) and hydroxyphenyl hydrazino-benzothiazoles (ONS) – NNS and NNN
donor atom chelators show a superior activity over ONS chelators. Analysis of larger
compound sets in the DTP database could confirm this trend. A putative explanation might be
the preferential binding of these different chelators to certain metal ions, and the stabilization
of different oxidation states of these ions according to the principle of hard and soft acids and
bases (HSAB) [239,240]. Furthermore, a tendency could be observed for higher toxicity
among NNS donors with imino carbon methylation. Though, a pairwise comparison of
matched molecular pairs did not always follow this trend. For the ONS donor chelators,
methylation of the imino carbon did not significantly influence the toxicity of the investigated
compounds.
Differences between MDR selective and non-MDR selective chelators from a bioinorganic
chemical viewpoint:
Experiments were designed and performed in order to find characteristics, which discriminate
those chelators that show a preferential toxicity toward P-gp expressing cells from other non-
MDR selective chelators.
In particular, a set of four structurally related compounds with a range of P-gp mediated MDR
selectivity (Q-1 < Q-2 < Q-3 < Q-4) was investigated in detail and compared to a compound
with cell-line specific selectivity, identified in the library (IV-b). Despite the limited size of
this compound set, that does not allow general conclusions, differences and trends could be
observed, that are promising starting points for follow up studies on larger compound sets.
As implied in the introduction, chelators can have a wide range of various targets within
biological setups including the inhibition of metallo-proteins, interfering with gene regulation
and cell cycle progression [115,116]. By binding to intracellular metal ions chelators can
deplete the labile ion pools, but also form biologically active complexes with a broad range of
possible activities [124]. Since these complexes might be redox-active, also a disturbance of
redox homeostasis and an interaction with the cellular antioxidant network is possible.
In order to investigate a putative involvement of reactive oxygen species (ROS) in the
mechanism of (selective) toxicity of the compounds, the ability of the ROS-scavenger and
potent antioxidant N-acetylcysteine (NAC), to protect cells from the toxic effect of the
4. Summary 129
compounds was investigated. Remarkably, NAC had different effects on the cellular response
toward MDR selective and non-MDR selective compounds (chapter 3.4.1.). While the toxicity
of the not MDR selective core structure Q-1 was attenuated in the presence of NAC in both,
MES-SA and MES-SA/Dx5 cells, NAC had no effect on the toxicity of the MDR selective
agents Q-3 and Q-4. The same trend could be observed in a subset of structurally unrelated
chelators. The toxicity of the two MDR selective isatin-β-thiosemicarbazones I-a and I-d was
not influenced by co-administration of NAC. In contrast, cells were significantly protected
against the toxic effect of the pyridinyl TSC II-g, the arylhydrazone IV-b and the pyridinyl
hydrazino-benzothiazole V-b, which showed a cell-line specific selective toxicity.
These results might suggest a different interaction of MDR selective and non-MDR selective
chelators with the intracellular redox homeostasis, which could be a consequential
characteristic involved in the selective targeting of MDR cells.
In those cases, were NAC offered protection, redox active metal complexes might cause
oxidative stress, which is antagonized by the ROS-scavenger. On the other hand, antioxidants
might not only protect, but also sensitize cells to the toxic effect of metal complexes via an
“activation by reduction” mechanism, following Fenton-like chemistry, that will increase the
ROS levels and therefore cause cellular damage [86,116,135]. Since these two processes
might occur in parallel, they might counteract each other, which might be a hypothetical
explanation for the lack of detectable effect of NAC on the toxicity of MDR selective ligands.
The differential response of MDR selective and non-MDR selective ligands to the co-
administration of NAC might be caused by different properties of the putatively formed metal
complexes. In order to investigate this theory, complexes formed with iron (III) and
copper (II) were characterized with regards to stability and redox activity.
The spider-net diagrams in Figure 70 summarize some characteristics that describe the metal
binding and biological activity of the 8-hydroxyquinoline derivatives Q-1 to Q-4 and the
pyrimidinylhydrazone IV-b (chapters 3.3. / 3.4.3.). A correlation of chemical properties like
the pKa values and metal binding abilities (expressed as pM* values) with toxicity and
selectivity can be found in the set of 8-hydroxyquinolines. While MDR selectivity seems to
increase with decreasing pKa and pM* values, a clear tendency can be seen that derivatives
with higher MDR selectivity show a higher preference for copper (II) over Fe (III) binding.
The trend in copper binding preference seems to follow the trend of MDR selectivity. Though
the size of the investigated compound set does not allow a general conclusion, these results
might indicate an impact of copper chelation on the mechanism of (selective) toxicity.
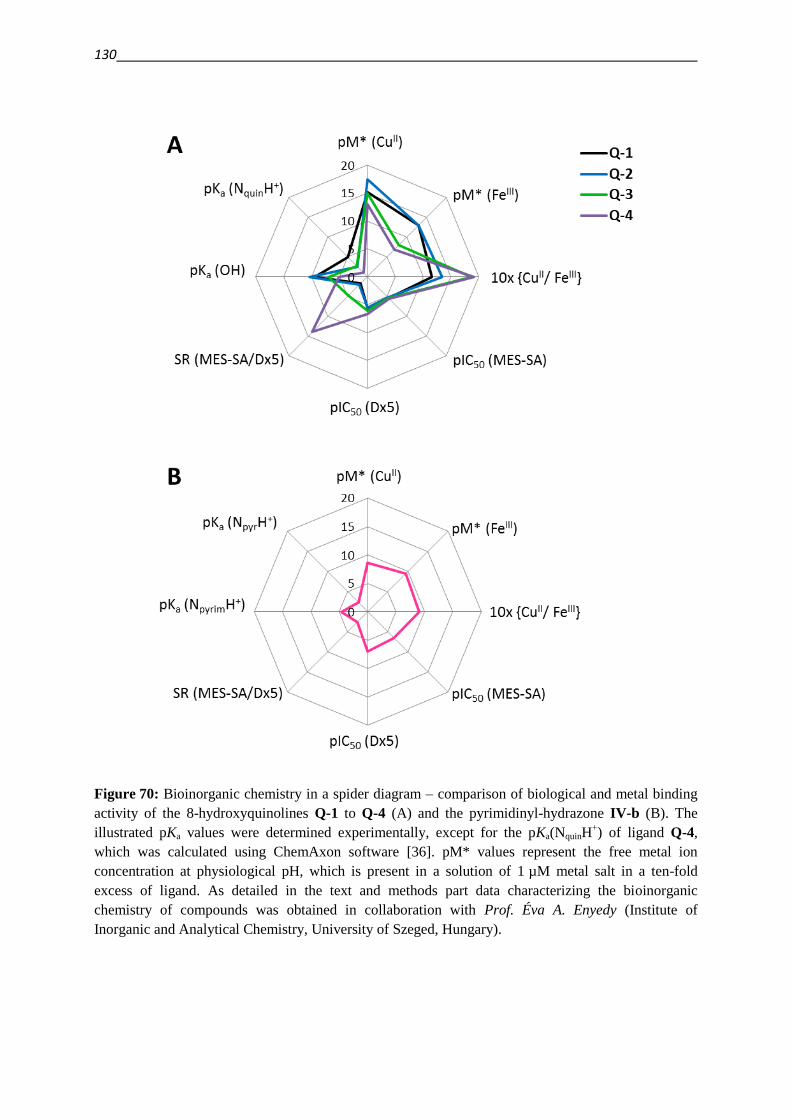
130
Figure 70: Bioinorganic chemistry in a spider diagram – comparison of biological and metal binding
activity of the 8-hydroxyquinolines Q-1 to Q-4 (A) and the pyrimidinyl-hydrazone IV-b (B). The
illustrated pKa values were determined experimentally, except for the pKa(NquinH+) of ligand Q-4,
which was calculated using ChemAxon software [36]. pM* values represent the free metal ion
concentration at physiological pH, which is present in a solution of 1 µM metal salt in a ten-fold
excess of ligand. As detailed in the text and methods part data characterizing the bioinorganic
chemistry of compounds was obtained in collaboration with Prof. Éva A. Enyedy (Institute of
Inorganic and Analytical Chemistry, University of Szeged, Hungary).
4. Summary 131
Since IV-b does not share the same scaffold, its pKa values, on which the ligands’ ability to
bind to metal ions highly depends, belong to different chemical entities. Therefore this
compound is shown separately in panel B of Figure 70. Remarkably, for this cell line
dependently selective pyrimidinylhydrazone IV-b, a clear difference in the metal chelating
properties could be observed in comparison to the 8-hydroxyquinoline set, since IV-b shows a
slight preference for iron (III) over copper (II) binding. Thus, these observed trends in metal
binding preferences (chapter 3.4.3.) provide a promising starting point for further
investigations on larger compound sets.
In order to address the impact of iron and copper on the toxicity of the compounds, the
toxicity of the ligands was investigated in the presence of non-toxic, fixed concentrations of
FeCl3 or CuCl2 (chapter 3.4.2.). Depending on the investigated ligand, MDR and parental cell
lines responded differently toward the co-administration of the metal ions.
Upon iron co-administration, the MDR cell line MES-SA/Dx5 was protected from the toxic
effect of the MDR selective ligands Q-2, Q-3 and Q-4 in a dose dependent manner. The fold
protection appeared to follow the trend of MDR selectivity, since in the presence of the
highest applied FeCl3-concentration (50 µM) MDR and parental cell lines were comparably
sensitive to the toxic effect of the investigated ligands. In contrast, iron co-administration had
no significant effect on the toxicity of the non-MDR selective core structure Q-1. Furthermore
the sensitivity of parental MES-SA cells to the investigated 8-hydroxyquinoline set was
comparable in the presence and in the absence of FeCl3.
In contrast, FeCl3 offered protection to MES-SA cells against the pyrimidinylhydrazone IV-b,
while it did not affect the sensitivity of the MDR cell line MES-SA/Dx5 against IV-b.
The rescuing effect of iron that could be observed in MDR cell lines in case of MDR selective
ligands might indicate an involvement of iron-depletion in the mechanism of toxicity, which
might be more pronounced in the MDR cell line as compared to the parental counterpart. On
the other hand, an excess of iron (III) might also prevent the binding of the chelators to its
target or to other metal ions (like copper) and therefore result in protection of the cells.
Also in the case of copper co-administration, differences could be observed in a cell line and
compound specific manner. Both, parental and MDR cells, became more sensitive to the
ligand in the presence of copper for the non-MDR selective quinoline Q-1, the “borderline”
derivative Q-2, and the cell line dependently selective pyrimidinylhydrazone IV-b. In
contrast, copper co-administration only sensitized the parental MES-SA cells toward the
132
MDR selective ligands Q-3 and Q-4, while the MDR cell line MES-SA/Dx5 did not show an
increase in sensitivity.
Similar to the rescuing effect of FeCl3, also the differential response of the two cell lines
toward the sensitizing by CuCl2 causes a loss in selectivity in the presence of the highest
applied the metal ion concentration (50 µM). In contrast to the protection by iron, a
sensitizing effect of copper co-administration might be explained by an involvement of redox
active complexes. The redox cycling of the complexes in Fenton-like reactions can harm the
cells by the production of reactive oxygen species (ROS) – in particular the hydroxyl-radical
[86,116,135].
The application of preformed complexes in fixed metal-to-ligand ratios confirmed the
observations made on the co-incubation with a fixed metal concentration (chapter 3.4.4.):
While iron complexes show a lower toxicity as compared to the free ligand (partially more
pronounced in the parental cell line), copper complexes have an increased toxicity (especially
in the MDR cell line). Furthermore, the inhibition of P-gp had similar effects on the toxicity
of the complexes, as it had to the free ligands. While metal complexes formed with Q-1 were
comparably toxic in the presence and in the absence of the inhibitor Tariquidar, the enhanced
activity of both iron (III) and copper (II) complexes formed with the MDR selective ligands
Q-3 and Q-4 seemed to require the activity of the transporter.
Taken together these results might point to an altered metal homeostasis in MDR vs. sensitive
cancer cells [42]. Since the metal homeostasis is tightly linked to intracellular redox
homeostasis, also an altered redox state of the cells might be a possible explanation for the
differential response of the cells toward MDR selective ligands [88,116].
The redox properties of the iron (III) and copper (II) complexes formed with the respective
ligands might result in a different ability to induce ROS, and therefore cause the differential
cellular response toward the complexes in the presence of the ROS scavenger. Therefore the
redox behavior of the complexes was investigated by cyclic voltammetry (chapter 3.4.5.1.)
and by monitoring reactions with intracellular antioxidants (chapter 3.4.5.2.).
All formed complexes occurred to be redox active. In case of the iron complexes formed with
the 8-hydroxyquinoline derivatives Q-1 to Q-4, the redox potential was shifted to the negative
direction in comparison to the iron-aqua complex, indicating a preferential stabilization of the
ferric (III) oxidation state. In contrast, the redox potential of iron complexes formed with the
4. Summary 133
NNN-donating pyrimidinylhydrazone IV-b was more positive than the aqua complex,
indicating a stabilization of the ferrous (II) oxidation state.
The reactions of the copper complexes were irreversible (Q-1 to Q-4) or quasi-reversible
(IV-b) under the applied conditions. Yet, reduction potentials were found to be (much) more
negative than that of the copper aqua complex.
Monitoring of reactions with intracellular antioxidants in a buffered solution serves as a
model of intracellular conditions. While under the applied conditions, GSH was not able to
reduce the investigated iron (III) complexes, it underwent redox reactions with the copper
complexes formed with the investigated ligands. The observed re-oxidation upon addition of
H2O2 suggests the reversibility of the reaction, enabling intracellular redox cycling of the
investigated copper (II) complexes and Fenton-like chemistry.
In order to investigate the relevance of the redox activity of the complexes in vitro, co-
incubation experiments were performed with NAC, pyruvate and DTT. The toxicity of some
iron complexes (mostly of Q-2) was markedly reduced in the presence of the antioxidants
(chapter 3.4.6.). This ostensible contradiction to the lack of observed interaction with GSH in
the monitored reactions might show a weakness of the model, since many factors will
influence the intracellular redox reactions (e.g. actual concentrations and pH).
In case of the copper-complexes, the cellular response to most complexes was not affected by
the addition of antioxidants. An exception is the [Cu(Q-4)] complex, which exhibits a slightly
increased toxicity toward MES-SA/Dx5 cells in the presence of NAC.
These observations might underline the “Janus-face” like character of the antioxidant: while
on one hand it can scavenge reactive oxygen species, on the other hand, it might induce a
mechanism of “activation by reduction”, and increase the oxidative stress leading to increased
cellular damage. While the lack of effect of antioxidants on the toxicity of most copper
complexes might of course mean a real lack of effect, it might also be caused by parallel
processes that counteract each other.
It is noteworthy, that both effects of the antioxidants (protection against iron-complexes and
sensitization against the copper-complex of Q-4) seem more pronounced in MES-SA/Dx5
cells as compared to the parental MES-SA cells.
Techniques for the measurement of ROS were established:
In order to further investigate the hypotheses about the involvement of reactive oxygen
species (ROS) on the toxicity of the investigated ligands and complexes, and the differential
134
response of parental and MDR cell lines, the detection and monitoring of ROS on a cellular
level would be eligible.
Therefore, two complementary measurement techniques were established (chapter 3.5.).
While the application of the redox-sensitive dye DCFDA can detect a broad range of ROS, it
is also prone to artefacts (as discussed in chapter 3.5.1.). Due to an interaction of compounds
with the assay reagent, the ROS induction by the free ligands as well as the complexes formed
with ligands Q-1 to Q-4 could not reliably be investigated. In contrast, IV-b and its
complexes did not show unspecific interactions with the reagent. For this ligand and its
complexes an involvement of ROS in the mechanism of toxicity of the complexes formed
with the pyrimidinylhydrazone could be concluded from the measurements. The two-faced
character of NAC becomes apparent from its effect on the induced fluorescent signal upon
treatment with different concentrations of the [Cu(IV-b)]2+
complex. While NAC reduces the
signal intensity up to concentrations of 50 µM of the complex, at higher complex
concentrations, the co-administration of NAC increases the signal. This indicates a higher
ROS production, which might putatively be the result of the “activation by reduction”
mechanism.
The application of the fluorescent sensor protein HyPer provides a more specific
measurement method [156,295,300]. Upon selective oxidation by hydrogen peroxide the
spectral properties of the sensor change in a way that the fluorescence intensity in one
maximum (emission 525 nm / excitation 500 nm) increases while it decreases in the other
(emission 525 nm / excitation 420 nm). This property enables a ratiometric measurement of
intracellular H2O2 levels in real-time. As detailed in the methods part (chapter 5.8.2.), cell
lines stably expressing HyPerC and the mutant HyPerC121s, which can serve as a control to
exclude unspecific effects [156], were created with the help of Nóra Kucsma, Áron Szepesi
and Zsuzsana Nagy (plasmids were kind gifts of Miklós Geiszt, Semmelweis University,
Budapest, Hungary). Stably transfected MES-SA and MES-SA/Dx5 cell lines were
characterized and their differential response to H2O2 was investigated using a plate reader and
a spectro-fluorimeter measurement setup. The “half-live” of the induced signal (k) and its
amplitude (max) were defined as important characteristics describing the cellular response
toward intracellular H2O2 (-induced stress). Comparison of multidrug resistant MES-SA/Dx5
to parental MES-SA cells revealed, that the antioxidant system of both cell lines might be
different, enabling the resistant counterpart to cope with induced stress faster than their
sensitive counterpart.
4. Summary 135
These results show the previously suggested difference in redox homoeostasis of the two
investigated cell lines. In comparison to MES-SA cells, the higher capability of MES-SA/Dx5
cells to cope with oxidative stress might be indicative of a stronger antioxidant system.
Following a mechanism of “activation by reduction” of formed copper complexes
[86,116,135], the potentially stronger antioxidant system of MES-SA/Dx5 (in comparison to
the parental MES-SA cells) cells might therefore result in a more pronounced production of
ROS following the Fenton-like chemistry of formed metal complexes with the MDR selective
ligands.
The toxicity increasing effect of copper co-administration only in MES-SA cells, but not in
the MDR MES-SA/Dx5 cells, might be in agreement with this. Also the metal binding
preference of MDR selective ligands for copper over iron and the observed ability of the
copper complexes to redox cycle in biologically relevant conditions are in line with this
theory.
The respective preferences in metal binding and the redox properties of the formed complexes
might be relevant descriptors of the MDR selective ligands. In order to find out, if these
descriptors are putative discrimination factors of MDR vs. non-MDR ligands, a higher
number of compounds should be investigated.
While experiments investigating the effect of P-gp activity and MDR selective compounds on
the intracellular H2O2 levels with the HyPer measurement system did not provide conclusive
results so far, the naphthoquinone Plumbagin, which was reported to have anticancer activity
via ROS formation, induced a signal that was comparable to that of H2O2 already in the low
micro-molar concentration range. This shows that an intracellular response in H2O2 levels can
be provoked by the addition of compounds. Therefore the established measurement system
provides a useful tool for further investigation of the impact of MDR selective compounds on
the H2O2 levels and on the intracellular antioxidant network. This tool also enables the
cellular monitoring over longer incubation time periods.
136
5. Tumor models and biological methods
5.1. Cell lines, media and buffer
The human ovarian carcinoma cell lines A2780 and the Doxorubicin selected multidrug
resistant counterpart A2780adr were obtained from ECACC, UK, (A2780: No. 93112519,
A2780adr: No. 93112520) [304], and cultivated in RPMI (Sigma Aldrich, Germany)
supplemented with 10% fetal bovine serum and 50 unit/mL penicillin and streptomycin,
respectively (Sigma Aldrich, Germany).
The human uterine sarcoma cell lines MES-SA and the Doxorubicin selected MES-SA/Dx5
were obtained from ATCC (MES-SA: No. CRL-1976™, MES-SA/Dx5: No. CRL-1977™)
and cultivated in Dulbecco’s Modified Eagle Medium (DMEM, Sigma Aldrich, Hungary)
[24,171].
The Madin–Darby canine kidney (MDCK-II) cell line was genetically modified by Dr. Dóra
Türk, to overexpress cDNA-derived P-gp. by the Sleeping Beauty (SB) transposon-based gene
delivery system, using the 100x hyperactive SB transposase [305]. Cells were co-transfected
with the SB transposon vector containing the wild type human MDR1 cDNA [306] and the
SB transposase vector construct, using the Lipofectamine 2000 reagent (Life Technologies) in
accordance with the manufacturer’s instructions. Transfected cells were sorted by flow
cytometry (FACS Aria High Speed Cell Sorter, Beckton-Dickinson) based on the cell surface
expression of MDR1/ABCB1. Protein expression was measured by antibody labeling using
the human MDR1/ABCB1 specific monoclonal antibody MRK16 (Abnova). In order to
obtain homogenous transgene positive cell population, sorting procedure was repeated 4 times
in 2-week intervals [89]. MDCK-II and MDCK-II-ABCB1 cells were cultured in DMEM
medium.
The human cervix carcinoma cell line KB-3-1 and the Vinblastine selected KB-V1 as well as
the human ovarian carcinoma cell line OVCAR-8 and the Doxorubicin selected counterpart
NCI/ADR-RES stably expressing fluorescent label proteins (see chapter 5.6.3.) were kind gifts
of Dr. Michael M. Gottesman, National Institutes of Health [172,307]. KB-3-1 and KB-V1
cells were cultivated in DMEM. OVCAR-8 and NCI/ADR-RES cells were maintained in RPMI
medium (Life Technologies, Hungary) supplemented with 10% fetal bovine serum, 5 mmol/L
glutamine, and 50 unit/mL penicillin and streptomycin, respectively (Life Technologies,
Hungary).
5. Tumor models and biological methods 137
DMEM media (Sigma Aldrich, Hungary) were supplemented with 10% fetal bovine serum,
5 mmol/L glutamine, and 50 unit/mL penicillin and streptomycin, respectively (Life
Technologies).
The most frequently applied buffers in the biological testing were phosphate-buffered saline
(PBS) and HPMI. Buffers were prepared in 10x concentrated stock solutions and diluted for
usage. The pH was adjusted to 7.4 using NaOH and HCl. The ingredients are given in Table
16 [308].
Table 16: Composition of PBS and HPMI buffers [308].
PBS HPMI
conc
mmol/L
g/L for
10x stock
conc
mmol/L
g/L for
10x stock
NaCl 136.89 80.00 119.77 70.00
KCl 2.68 2.00 5.00 3.73
Na2HPO4 9.86 14.00 5.00 7.10
KH2PO4 1.41 2.00
MgCl2 0.85 0.81
CaCl2·2H2O 0.04 0.06
HEPES 10.00 23.83
NaHCO3 10.00 8.40
Glucose 10.00 18.00
5.2. Cell culturing
All cell lines were cultivated under aseptic conditions using a laminar air flow cabinet and
sterilized equipment (serological pipets and pipet tips), work surfaces were chemically
disinfected prior to and following work using 70% ethanol and (in Budapest additionally)
exposed to UV-light at the end of each working day [309–311]. Cells were kept in the
indicated media at 37 °C, 5% CO2 with a relative humidity of 96%. All used cell lines display
adherent growth properties. Therefore, the described general cultivation protocol is valid for
all cell lines used in this study. Dependent on the required cell numbers, cells were grown in
T-25, T-75, or T-175 culture flasks. The used volumes for the respective culture flask sizes
are given in the table below (Table 17). Cells were sub-cultivated after reaching a confluency
level of 80-90%. Briefly, after removal of the culture medium, the cell layer was rinsed with
PBS buffer, in order to remove traces of serum which contains trypsin inhibitor. The buffer
was removed and the indicated volume of Trypsin (0.25% (w/v))-EDTA (0.53 mM) (Sigma,
138
Germany / Hungary) solution was added and allowed to incubate until the cell layer started to
disperse. Cells were aspirated by gently pipetting with fresh growth medium. Cells were
transferred to falcon tubes and sub-cultivated in a 1:4 to 1:12 ratio or used for assays after
washing with PBS buffer.
The general washing procedure consisted of a centrifugation of cell suspension with 281 x g
for four minutes, following by resuspension of the cell pellet in PBS buffer, a repeated
centrifugation step, and the resuspension of the pellet in the desired medium (buffer or culture
medium). Further mentioning of washing steps will refer to this general procedure if not
stated otherwise.
Table 17: Volumes of Media, Trypsin and buffer used for the different cell culture flasks
Flask
Surface
area /
mm²
Total
Volume
of
medium /
mL
Initial cell
number /
Mio Cells
Harvested
cell
number /
Mio Cells
Volume
of PBS
for
washing
Volume
of
Trypsin-
EDTA /
mL
Volume of
Medium for
Resusp. / mL
T-25 2.500 5-6 0.5-1 3-5 3 mL 0.75 4
T-75 7.500 15-18 1.5-3 5-10 5 mL 2.0 5
T-175 17.500 23-26 3-5 15-20 8 mL 3.0 7
5.3. Determination of cell numbers
To determine the cell numbers in the suspension after harvesting, two instruments were used.
For cell counting with the CASY©1 TT (Schärfe, Germany) instrument, 20 µL of the cell
suspension were transferred to 10 mL of the sterile filtered isosmotic electrolyte solution
CASY©ton and counted with the indicated instrument. The CASY technology is an electric
field multi-channel cell counting system that combines the measurements of particle size and
resistance based on the interaction of the cells with the applied low voltage field in the
capillary. Based on the number and extent of changes in resistance upon flow of cell
suspension through the capillary the instrument creates a histogram of cellular size
distribution.
For determination of the cell numbers using the BioRad TC10™ instrument (Biorad,
Hungary), samples were prepared by mixing the cell suspension with Trypan Blue 0.4% stock
solution (Sigma Aldrich, Hungary) in a 1:1 ratio, in order to and exclude stain dead cells.
5. Tumor models and biological methods 139
Ten µL of the mixture were transferred to respective counting slides (Biorad TC10 dual-
chamber counting slides (Biorad, Hungary)) and measured. The instrument uses an autofocus
technology and a digital image analysis algorithm to provide the number of cells and the
percentage of viability (which is based on the Trypan blue staining).
5.4. Cryo-conservation and revitalization of cells
For the long term storage of cellular samples, aliquots of 2-4 Mio Cells were frozen in the
respective culture medium supplemented with 40% FBS containing 10% DMSO. Aliquots of
1 mL of the suspensions were filled into screw cap cryo vials (Greiner bio-one, Germany /
Corning, New York) and cooled down to - 80°C, using a Cryo Freezing Container (Nalgene,
Sigma, Hungary) filled with isopropanol, which allows a constant cooling rate of 1°C/min.
After that, vials were transferred to a tank of liquid nitrogen.
To revitalize the cells, vials were thawed in a 37 °C water bath, transferred into falcon tubes
containing 5 mL of culture medium and centrifuged to remove the DMSO. After resuspension
of the cell pellet in fresh medium, cells were transferred to culture flasks and cultured as
described above. In order to ensure the resistant phenotype of drug selected cell lines, at the
second passage after thawing, cells were selected for two passages in medium supplemented
with 500 nM Doxorubicin for A2780adr and Dx5 cells, or 300 nM Vinblastine for KB-V1
cells. Before using the cells for experiments, cells were grown without selection agents for at
least one passage.
5.5. Testing for Mycoplasma
Mycoplasma are the smallest known Gram-negative bacteria and represent a common kind of
contamination in cell culture [312]. Firstly noted in the 1950s, until today mycoplasma
became probably the most prevalent and serious microbial contaminant of cell culture systems
used in research and industry today [309]. They can pass through pores of more than 0.1 mm
in diameter and often stay unnoticed due to the lack of visible signs of the infection [309,313].
Still they alter many host cell functions including growth, morphology, metabolism, the
genome and antigenicity, leading to unreliable experimental results [309,310,313,314]. In order
to ensure that cell lines are free of contamination good tissue culture practice and frequent
140
testing is required [309]. A specific method to test for mycoplasma is the MycoAlert kit
[309,313].
It exploits the activity of certain mycoplasmal enzymes, which are set free upon lysis with the
assay reagent. The enzymes react with the assay substrate, catalyzing the conversion of ADP
to ATP:
𝐴𝑇𝑃 + 𝐿𝑢𝑐𝑖𝑓𝑒𝑟𝑖𝑛 + 𝑂2 𝐿𝑢𝑐𝑖𝑓𝑒𝑟𝑎𝑠𝑒, 𝑀𝑔2+
→ 𝑂𝑥𝑦𝑙𝑢𝑐𝑖𝑓𝑒𝑟𝑖𝑛 + 𝐴𝑀𝑃 + 𝑃𝑃𝑖 +𝐶𝑂2 + ℎν
Comparing the ATP levels of a sample before and after the addition of the mycoplasma
specific MycoAlert™ substrate, a ratio can be obtained which is indicative of the presence or
absence of mycoplasma [313]. Cells were tested for mycoplasma infections one or two
passages after thawing using the MycoAlert™ mycoplasma detection kit (Lonza, Hungary)
[313]. From a confluent culture flask 1 mL medium was transferred to an Eppendorf tube and
centrifuged for 5 minutes at 129 x g. 35 µL of the upper layer were transferred to an OptiPlate
(white 96 well plate, Perkin Elmer, Hungary) and 35 µL of MycoAlert reagent was added to
each well. After 5 minutes of incubation the first luminescence measurement was performed
(measurement 1). 35 µL of MycoAlert substrate were added to each well and incubated for
10 minutes. Luminescence was measured (measurement 2) and the ratio of both measurement
values was calculated:
𝑋 =𝑚𝑒𝑎𝑠𝑢𝑟𝑒𝑚𝑒𝑛𝑡 2
𝑚𝑒𝑎𝑠𝑢𝑟𝑒𝑚𝑒𝑛𝑡 1
If the ratio X was smaller than 1, the sample was negative for mycoplasma. If it was between
1 and 1.3, the determination should be repeated at the next passage, a ratio higher than 1.3
indicates an infection of the investigated cell line. Only non-infected cell lines were used.
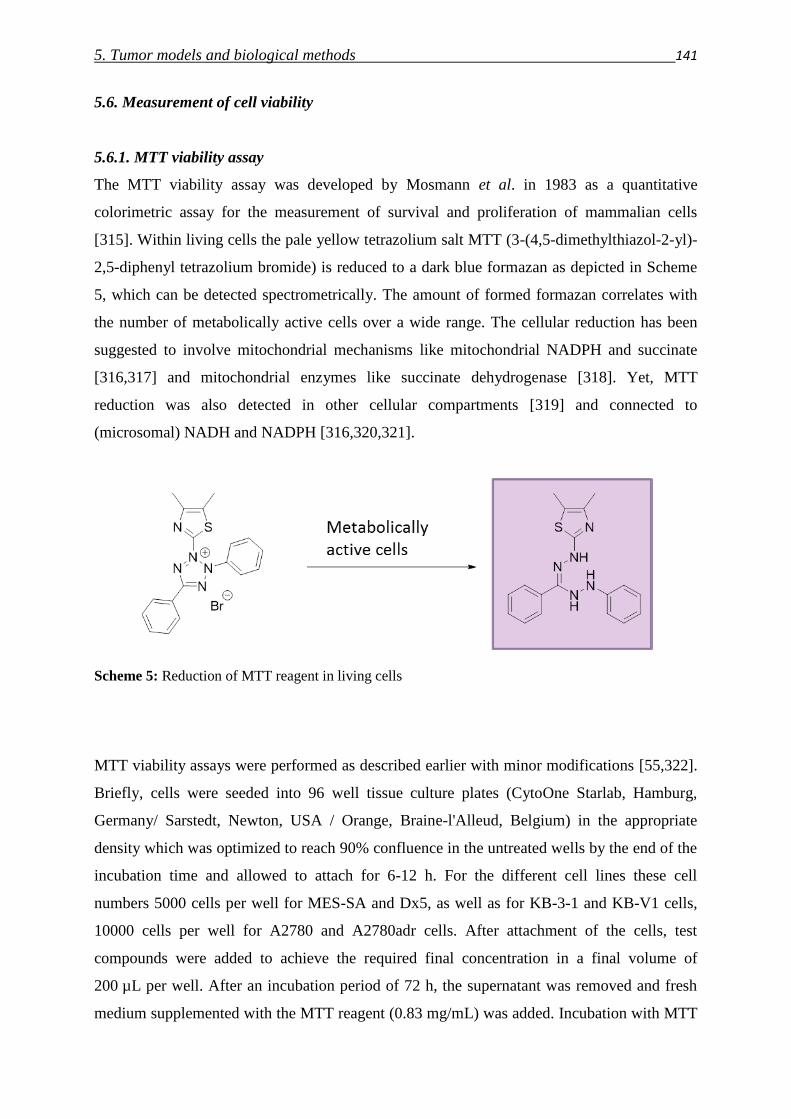
5. Tumor models and biological methods 141
5.6. Measurement of cell viability
5.6.1. MTT viability assay
The MTT viability assay was developed by Mosmann et al. in 1983 as a quantitative
colorimetric assay for the measurement of survival and proliferation of mammalian cells
[315]. Within living cells the pale yellow tetrazolium salt MTT (3-(4,5-dimethylthiazol-2-yl)-
2,5-diphenyl tetrazolium bromide) is reduced to a dark blue formazan as depicted in Scheme
5, which can be detected spectrometrically. The amount of formed formazan correlates with
the number of metabolically active cells over a wide range. The cellular reduction has been
suggested to involve mitochondrial mechanisms like mitochondrial NADPH and succinate
[316,317] and mitochondrial enzymes like succinate dehydrogenase [318]. Yet, MTT
reduction was also detected in other cellular compartments [319] and connected to
(microsomal) NADH and NADPH [316,320,321].
Scheme 5: Reduction of MTT reagent in living cells
MTT viability assays were performed as described earlier with minor modifications [55,322].
Briefly, cells were seeded into 96 well tissue culture plates (CytoOne Starlab, Hamburg,
Germany/ Sarstedt, Newton, USA / Orange, Braine-l'Alleud, Belgium) in the appropriate
density which was optimized to reach 90% confluence in the untreated wells by the end of the
incubation time and allowed to attach for 6-12 h. For the different cell lines these cell
numbers 5000 cells per well for MES-SA and Dx5, as well as for KB-3-1 and KB-V1 cells,
10000 cells per well for A2780 and A2780adr cells. After attachment of the cells, test
compounds were added to achieve the required final concentration in a final volume of
200 µL per well. After an incubation period of 72 h, the supernatant was removed and fresh
medium supplemented with the MTT reagent (0.83 mg/mL) was added. Incubation with MTT
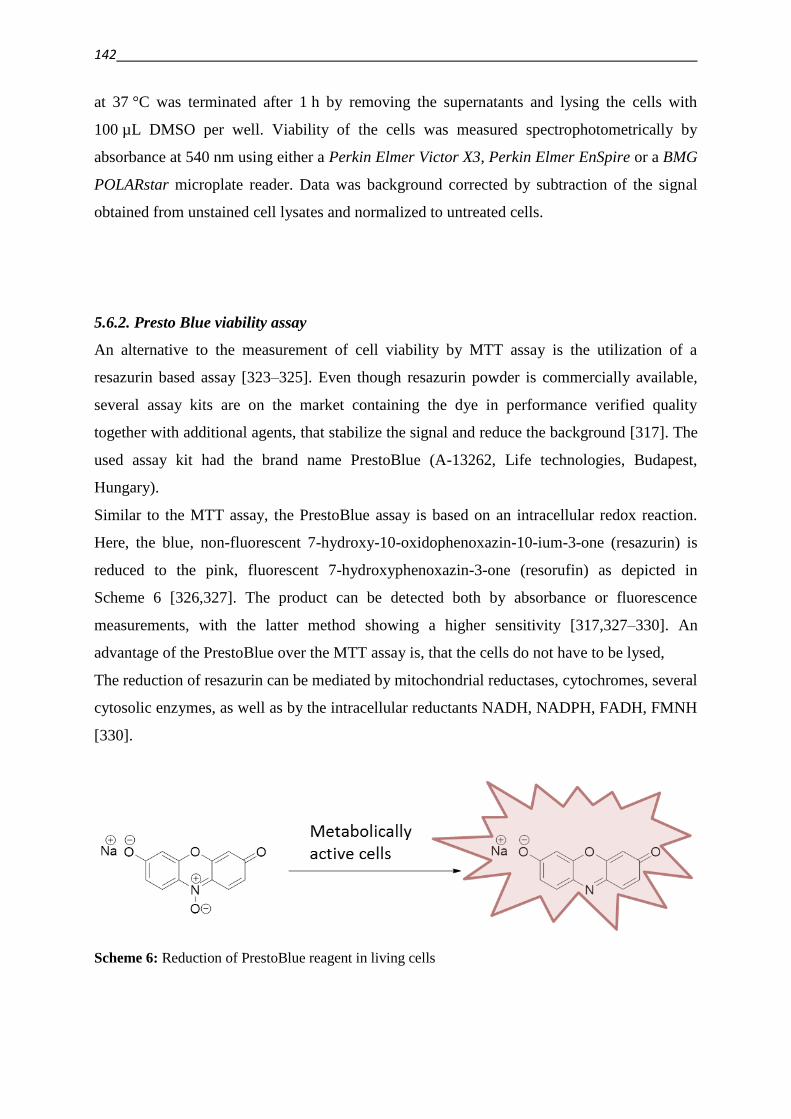
142
at 37 °C was terminated after 1 h by removing the supernatants and lysing the cells with
100 µL DMSO per well. Viability of the cells was measured spectrophotometrically by
absorbance at 540 nm using either a Perkin Elmer Victor X3, Perkin Elmer EnSpire or a BMG
POLARstar microplate reader. Data was background corrected by subtraction of the signal
obtained from unstained cell lysates and normalized to untreated cells.
5.6.2. Presto Blue viability assay
An alternative to the measurement of cell viability by MTT assay is the utilization of a
resazurin based assay [323–325]. Even though resazurin powder is commercially available,
several assay kits are on the market containing the dye in performance verified quality
together with additional agents, that stabilize the signal and reduce the background [317]. The
used assay kit had the brand name PrestoBlue (A-13262, Life technologies, Budapest,
Hungary).
Similar to the MTT assay, the PrestoBlue assay is based on an intracellular redox reaction.
Here, the blue, non-fluorescent 7-hydroxy-10-oxidophenoxazin-10-ium-3-one (resazurin) is
reduced to the pink, fluorescent 7-hydroxyphenoxazin-3-one (resorufin) as depicted in
Scheme 6 [326,327]. The product can be detected both by absorbance or fluorescence
measurements, with the latter method showing a higher sensitivity [317,327–330]. An
advantage of the PrestoBlue over the MTT assay is, that the cells do not have to be lysed,
The reduction of resazurin can be mediated by mitochondrial reductases, cytochromes, several
cytosolic enzymes, as well as by the intracellular reductants NADH, NADPH, FADH, FMNH
[330].
Scheme 6: Reduction of PrestoBlue reagent in living cells
5. Tumor models and biological methods 143
Cells are seeded in plates and treated with test compounds as described for the MTT assay
(chapter 5.6.1.). After 72 h of incubation with the test compounds, supernatants were either
removed, and a diluted solution of the PrestoBlue reagent (10%) was added to each well, or in
the case, where an interaction of the test compound with the resazurin dye could be excluded,
the reagent was directly added to yield a final concentration of 10% (as in case of Triton-X-
100 viability assays). After incubation with the reagent for one hour at 37 °C emission was
measured at 579 nm upon excitation at 540 nm using either a Perkin Elmer Victor X3 or
Perkin Elmer EnSpire microplate reader.
5.6.3. mCherry, eGFP, DsRed fluorescence assays
An alternative method which avoids the addition of exogenous assay substrate compounds to
indicate viability relies on the expression and retention of an intracellular fluorescent protein,
produced by a transfected cell [331]. Besides of avoiding putative side reactions, another
advantage of the fluorescent protein labeling is, that cells can be monitored in real time
without altering the system in any way, other than illuminating with light of the proper
excitation wavelength [307,331]. Damages in the cell membrane of dying or dead cells will
cause a leak-out of the soluble fluorescent proteins [332]. The basis of this technique was
established by Shimomura et al., who isolated the green fluorescent protein (GFP) from the
jellyfish Aequorea victoria in 1962, characterized its optical properties, and, in 1979,
identified the chemical nature of the fluorophore [333]. Following the recombinant expression
of GFP in E. coli Chalfie et al. envisioned that GFP could be used as a vital marker for the in
situ monitoring of cell growth [334]. Tsien et al. further characterized the fluorophore and
could engineer further fluorescent proteins with different colors based on GFP and DsRed
[333,335–337]. The latter protein was isolated from a coral Discosoma species [338,339]. In
2008, the Nobel Prize in Chemistry was awarded to those three researchers for the discovery
and development of the green fluorescent protein, GFP [333].
The fluorescent label proteins used in this study were eGFP, DsRed-II and mCherry. Stable
transfectants of OVCAR-8-DsRed-II and NCI/ADR-RES-eGFP (kind gifts Dr. Michael M.
Gottesman, National Institutes of Health, Bethesda) were obtained by lipofectamine
transfection upon by selection in presence of G418 [307]. MES-SA-mCherry and Dx5-
mCherry cells were created in the laboratory of Katalin Német (Hungarian Academy of
Sciences, Budapest) by a lentiviral method. Briefly, they inserted the sequence of the
144
fluorescent protein mCherry (kind gift of Erwin Welker, Hungarian Academy of Sciences,
Budapest) into the pRRL lentiviral plasmid vector containing the EF-1α (human elongation
factor-1α) promoter (obtained from Didier Trono, Lausanne, Switzerland) using XbaI-SalI
restriction sites, replacing the originally present GFP sequence. Cells were treated with the
virus containing supernatant with a multiplicity of infection of four (4 virus particles per cell).
Stable transfectants were sorted twice with a BD FACS Aria cell sorter (BD, Budapest,
Hungary), keeping only the cells with high fluorescence intensity. Thus, no antibiotic
selection was needed to eliminate non transfected cells.
For the viability assays, the stably transfected cells are seeded in plates and treated with test
compounds as described for the MTT assay (chapter 5.6.1.). After 72 h of incubation the
fluorescence of the respective protein was measured with a Perkin Elmer Victor X3 or Perkin
Elmer EnSpire microplate reader.
For eGFP transfected cells the emission was measured at 535 nm upon excitation at 490 nm,
for DsRed-II transfected cells the emission was measured at 579 nm upon excitation at
540 nm and the fluorescence of mCherry transfected cells was measured at 610 nm upon
excitation at 585 nm.
5.6.4. Evaluation of dose response curves
In order to compare the effectiveness of the investigated compounds, half maximal growth
inhibitory concentrations (IC50) were determined with the help of Prism software [340]. The
raw data was normalized to measured controls representing 100% cell viability for untreated
and 0% viability for dead controls (10% DMSO, or high concentration of toxic compounds,
respectively). The normalized data was analyzed with a sigmoidal dose-response model using
the four parameter logistic equation:
𝑦 = 𝐵𝑜𝑡𝑡𝑜𝑚 +(𝑇𝑜𝑝 − 𝐵𝑜𝑡𝑡𝑜𝑚)
1 + 10(𝐿𝑜𝑔𝐼𝐶50−𝑋)∙𝐻𝑖𝑙𝑙𝑆𝑙𝑜𝑝𝑒
The Top represents the Y-value at the top plateau, which is reached at 100% cell viability; the
bottom plateau is reached at 0% viability. The HillSlope describes the steepness of the curve.
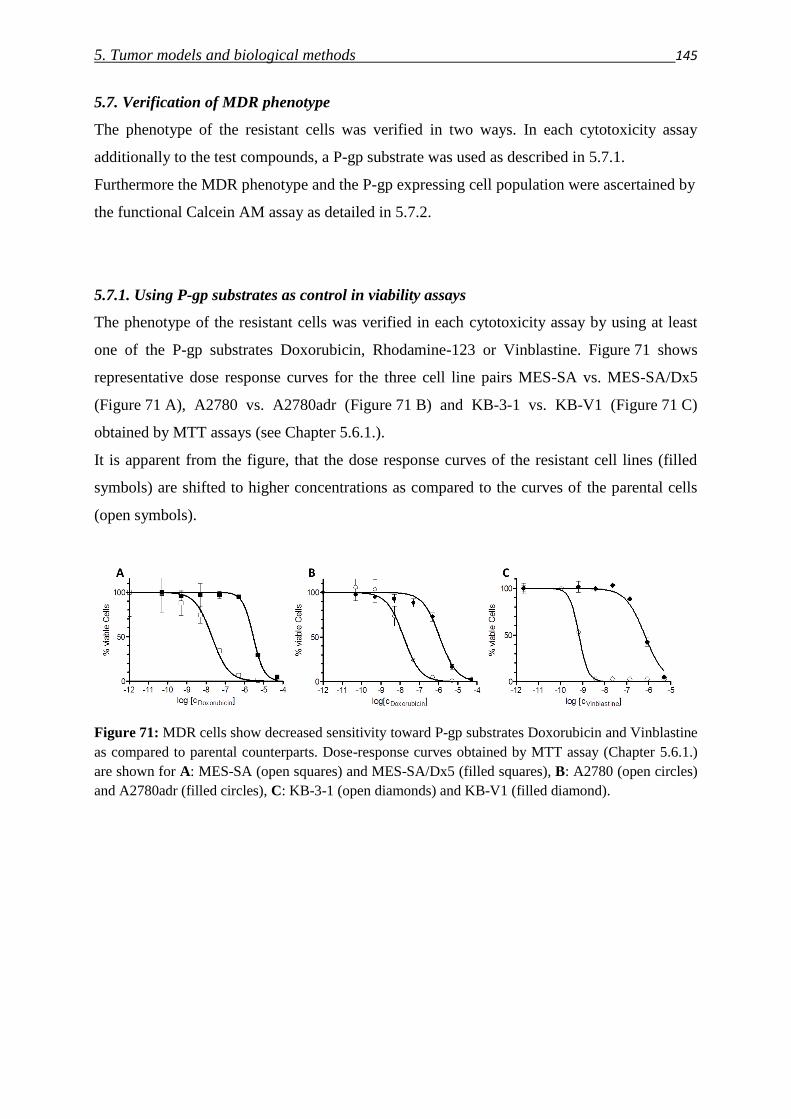
5. Tumor models and biological methods 145
5.7. Verification of MDR phenotype
The phenotype of the resistant cells was verified in two ways. In each cytotoxicity assay
additionally to the test compounds, a P-gp substrate was used as described in 5.7.1.
Furthermore the MDR phenotype and the P-gp expressing cell population were ascertained by
the functional Calcein AM assay as detailed in 5.7.2.
5.7.1. Using P-gp substrates as control in viability assays
The phenotype of the resistant cells was verified in each cytotoxicity assay by using at least
one of the P-gp substrates Doxorubicin, Rhodamine-123 or Vinblastine. Figure 71 shows
representative dose response curves for the three cell line pairs MES-SA vs. MES-SA/Dx5
(Figure 71 A), A2780 vs. A2780adr (Figure 71 B) and KB-3-1 vs. KB-V1 (Figure 71 C)
obtained by MTT assays (see Chapter 5.6.1.).
It is apparent from the figure, that the dose response curves of the resistant cell lines (filled
symbols) are shifted to higher concentrations as compared to the curves of the parental cells
(open symbols).
Figure 71: MDR cells show decreased sensitivity toward P-gp substrates Doxorubicin and Vinblastine
as compared to parental counterparts. Dose-response curves obtained by MTT assay (Chapter 5.6.1.)
are shown for A: MES-SA (open squares) and MES-SA/Dx5 (filled squares), B: A2780 (open circles)
and A2780adr (filled circles), C: KB-3-1 (open diamonds) and KB-V1 (filled diamond).
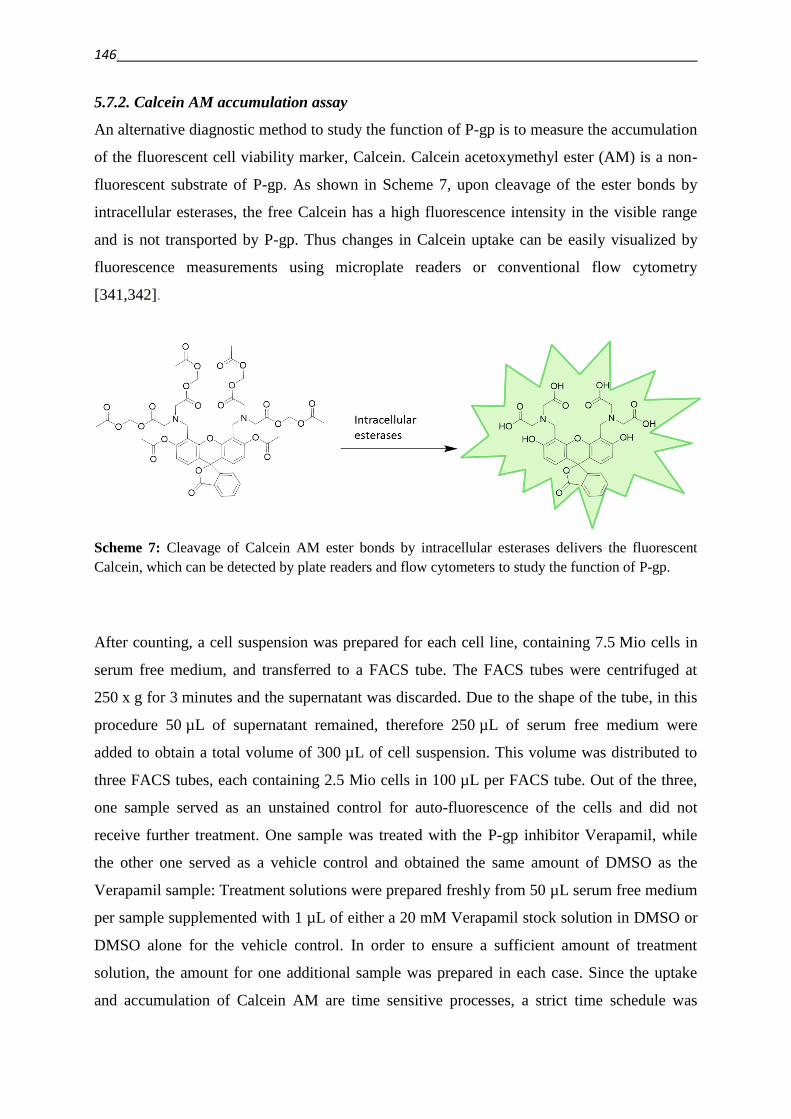
146
5.7.2. Calcein AM accumulation assay
An alternative diagnostic method to study the function of P-gp is to measure the accumulation
of the fluorescent cell viability marker, Calcein. Calcein acetoxymethyl ester (AM) is a non-
fluorescent substrate of P-gp. As shown in Scheme 7, upon cleavage of the ester bonds by
intracellular esterases, the free Calcein has a high fluorescence intensity in the visible range
and is not transported by P-gp. Thus changes in Calcein uptake can be easily visualized by
fluorescence measurements using microplate readers or conventional flow cytometry
[341,342].
Scheme 7: Cleavage of Calcein AM ester bonds by intracellular esterases delivers the fluorescent
Calcein, which can be detected by plate readers and flow cytometers to study the function of P-gp.
After counting, a cell suspension was prepared for each cell line, containing 7.5 Mio cells in
serum free medium, and transferred to a FACS tube. The FACS tubes were centrifuged at
250 x g for 3 minutes and the supernatant was discarded. Due to the shape of the tube, in this
procedure 50 µL of supernatant remained, therefore 250 µL of serum free medium were
added to obtain a total volume of 300 µL of cell suspension. This volume was distributed to
three FACS tubes, each containing 2.5 Mio cells in 100 µL per FACS tube. Out of the three,
one sample served as an unstained control for auto-fluorescence of the cells and did not
receive further treatment. One sample was treated with the P-gp inhibitor Verapamil, while
the other one served as a vehicle control and obtained the same amount of DMSO as the
Verapamil sample: Treatment solutions were prepared freshly from 50 µL serum free medium
per sample supplemented with 1 µL of either a 20 mM Verapamil stock solution in DMSO or
DMSO alone for the vehicle control. In order to ensure a sufficient amount of treatment
solution, the amount for one additional sample was prepared in each case. Since the uptake
and accumulation of Calcein AM are time sensitive processes, a strict time schedule was
5. Tumor models and biological methods 147
followed: Upon addition of the 50 µL treatment solution, the sample was vortexed and set into
a water bath shaker, thermostated to 37 °C. The time that passed between two sample
treatments was exactly 20 seconds. After the 5 minutes incubation time, the first sample was
treated with 50 µL of a Calcein AM treatment solution (100 µM in serum free medium),
vortexed and put back to the water bath shaker. The order and the time shifts between the
treated samples were kept as in the first treatment. After 10 minutes of incubation, the cellular
reaction was stopped by addition of 1 mL ice cold PBS per sample (again keeping the
20 seconds time shifts). Samples were centrifuged at 250 x g and 4 °C for 3 minutes, and after
one washing step, the supernatant was discarded and the cell pellet was resuspended in
250 µL of ice cold PBS. Samples were kept on ice until measured by flow cytometry on a
FACS Calibur instrument (BD Biosciences, USA) or an attune flow cytometer [343].
The data was visualized with the help of the program Cell-Quest Pro (BD Biosciences, USA).
Figure 72 shows an example experiment using MES-SA and MES-SA/Dx5 cells. In the so
called dot plots cellular detection is aligned with respect to cellular size (Forward scatter,
FSC: low angle light scatter, the light that strikes the cell) and granularity or structural
complexity inside the cell (Side scatter, SSC: scattered at larger angles). A “gate” was set,
selecting only viable cells according in the auto-fluorescence sample. Dead cells generally
have a lower size and intracellular complexity, and in a simple Calcein AM staining
experiment they should be low in quantity, but where necessary, they could be detected and
excluded by staining with the TO-PRO®-3 DNA dye (Life Technologies, USA).
Histograms, as shown in Figure 72, visualize the frequency distribution of fluorescently
labelled cells. It can be seen that P-gp expressing MES-SA/Dx5 (Figure 72 F) and KB-V1
(Figure 72 I) cells accumulate less amount of fluorescent Calcein as compared to their P-gp
negative MES-SA (Figure 72 E) and KB-3-1 (Figure 72 G) counterparts. The histogram of P-
gp positive cells is shifted to the right. The impact of P-gp on this accumulation is proven by
the impact of the P-gp inhibitor Verapamil, which shifts the histogram to the direction of P-gp
negative cells. The described panels show homogenous cell populations, while panel H shows
the histograms of KB-V1 cells, which partially lost the P-gp upon long term cell culture,
resulting in a heterogenous cell population.
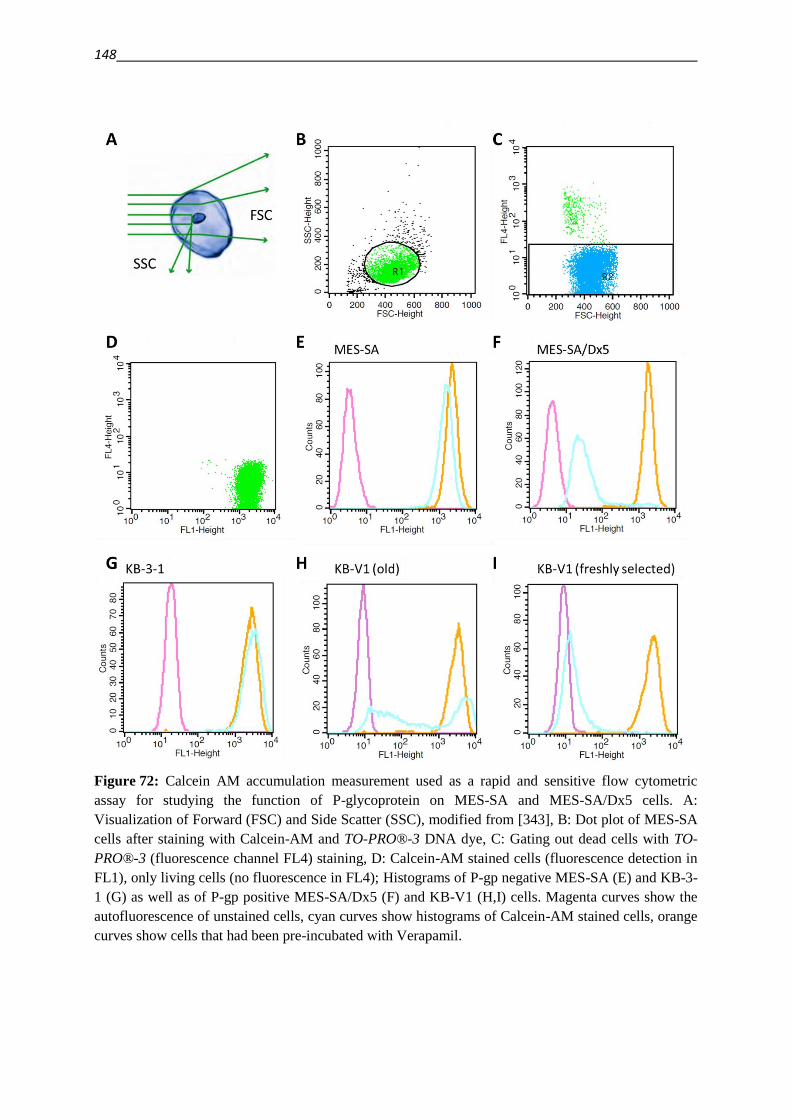
148
Figure 72: Calcein AM accumulation measurement used as a rapid and sensitive flow cytometric
assay for studying the function of P-glycoprotein on MES-SA and MES-SA/Dx5 cells. A:
Visualization of Forward (FSC) and Side Scatter (SSC), modified from [343], B: Dot plot of MES-SA
cells after staining with Calcein-AM and TO-PRO®-3 DNA dye, C: Gating out dead cells with TO-
PRO®-3 (fluorescence channel FL4) staining, D: Calcein-AM stained cells (fluorescence detection in
FL1), only living cells (no fluorescence in FL4); Histograms of P-gp negative MES-SA (E) and KB-3-
1 (G) as well as of P-gp positive MES-SA/Dx5 (F) and KB-V1 (H,I) cells. Magenta curves show the
autofluorescence of unstained cells, cyan curves show histograms of Calcein-AM stained cells, orange
curves show cells that had been pre-incubated with Verapamil.
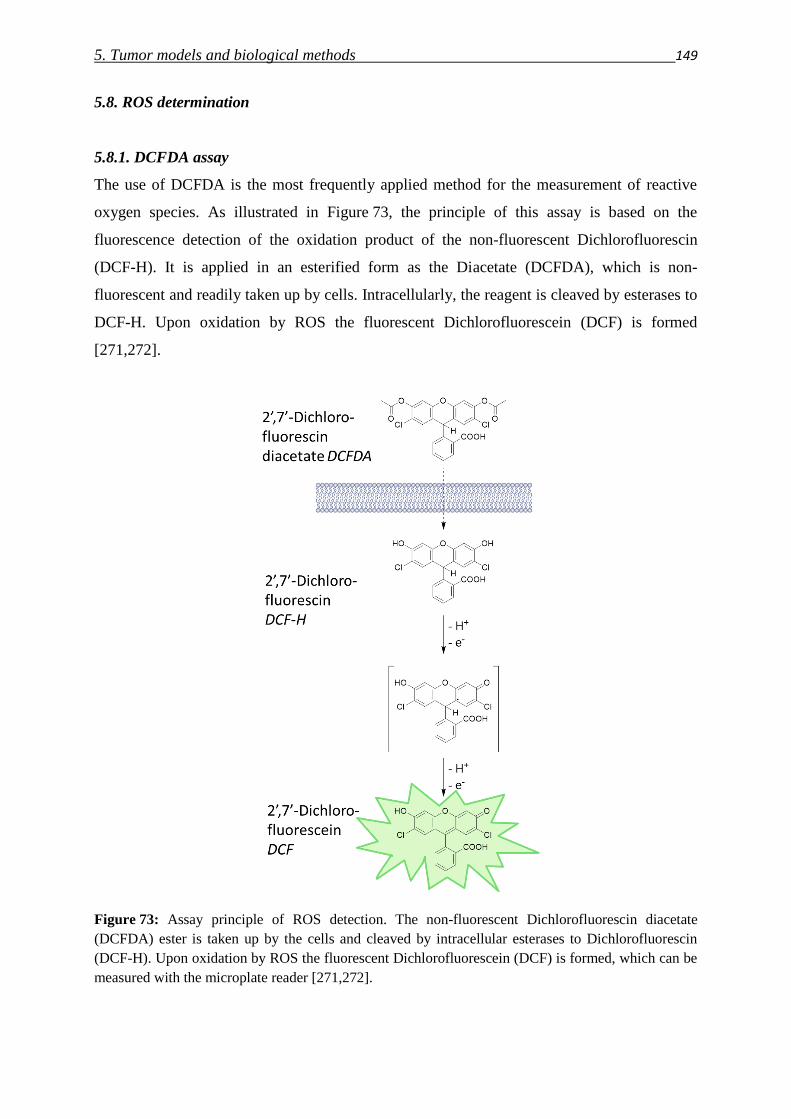
5. Tumor models and biological methods 149
5.8. ROS determination
5.8.1. DCFDA assay
The use of DCFDA is the most frequently applied method for the measurement of reactive
oxygen species. As illustrated in Figure 73, the principle of this assay is based on the
fluorescence detection of the oxidation product of the non-fluorescent Dichlorofluorescin
(DCF-H). It is applied in an esterified form as the Diacetate (DCFDA), which is non-
fluorescent and readily taken up by cells. Intracellularly, the reagent is cleaved by esterases to
DCF-H. Upon oxidation by ROS the fluorescent Dichlorofluorescein (DCF) is formed
[271,272].
Figure 73: Assay principle of ROS detection. The non-fluorescent Dichlorofluorescin diacetate
(DCFDA) ester is taken up by the cells and cleaved by intracellular esterases to Dichlorofluorescin
(DCF-H). Upon oxidation by ROS the fluorescent Dichlorofluorescein (DCF) is formed, which can be
measured with the microplate reader [271,272].
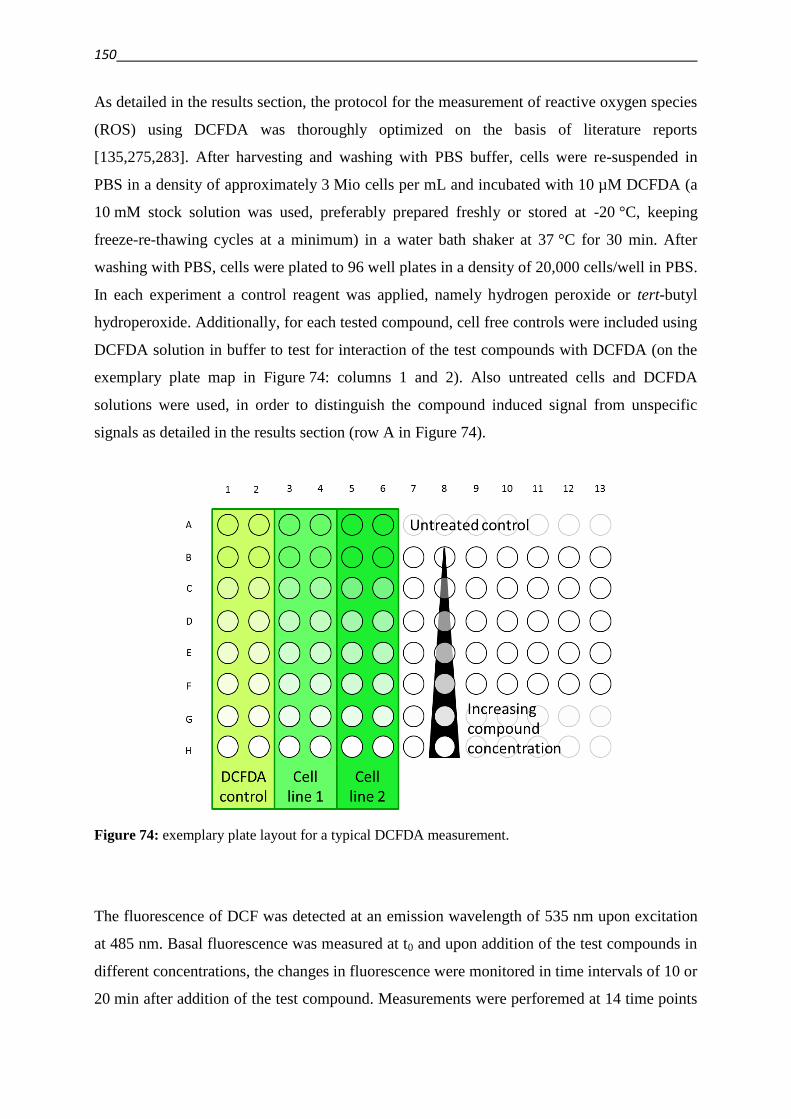
150
As detailed in the results section, the protocol for the measurement of reactive oxygen species
(ROS) using DCFDA was thoroughly optimized on the basis of literature reports
[135,275,283]. After harvesting and washing with PBS buffer, cells were re-suspended in
PBS in a density of approximately 3 Mio cells per mL and incubated with 10 µM DCFDA (a
10 mM stock solution was used, preferably prepared freshly or stored at -20 °C, keeping
freeze-re-thawing cycles at a minimum) in a water bath shaker at 37 °C for 30 min. After
washing with PBS, cells were plated to 96 well plates in a density of 20,000 cells/well in PBS.
In each experiment a control reagent was applied, namely hydrogen peroxide or tert-butyl
hydroperoxide. Additionally, for each tested compound, cell free controls were included using
DCFDA solution in buffer to test for interaction of the test compounds with DCFDA (on the
exemplary plate map in Figure 74: columns 1 and 2). Also untreated cells and DCFDA
solutions were used, in order to distinguish the compound induced signal from unspecific
signals as detailed in the results section (row A in Figure 74).
Figure 74: exemplary plate layout for a typical DCFDA measurement.
The fluorescence of DCF was detected at an emission wavelength of 535 nm upon excitation
at 485 nm. Basal fluorescence was measured at t0 and upon addition of the test compounds in
different concentrations, the changes in fluorescence were monitored in time intervals of 10 or
20 min after addition of the test compound. Measurements were perforemed at 14 time points
5. Tumor models and biological methods 151
tx where x = 1 referred to the measurement after 10 min or 20 min, and x = 14 to that after
140 min or 280 min, respectively. Data was expressed as fold change of fluorescence
compared to the basal levels (measurement of Sample at t0) and to the untreated cell control at
the respective time-point (measurement of untreated control at tx) by the following
normalization:
𝑦 =𝑆𝑎𝑚𝑝𝑙𝑒 𝑑𝑎𝑡𝑎(𝑡𝑥)
𝑆𝑎𝑚𝑝𝑙𝑒 𝑑𝑎𝑡𝑎(𝑡0) ∙ 𝐶𝑜𝑛𝑡𝑟𝑜𝑙 𝑑𝑎𝑡𝑎(𝑡𝑥)
5.8.2. HyPer fluorescent protein
Changes in intracellular H2O2 levels can be tracked in real time using HyPer, a ratiometric
genetically encoded fluorescent probe [297]. The fluorescence properties of circular permuted
(cp) fluorescent proteins are sensitive to protein conformation. The fusion of cpYFP (yellow
fluorescent protein) with the OxyR-RD regulatory domain of E. coli OxyR provides a sensor
protein, which will show increased fluorescence upon selective oxidation by hydrogen
peroxide [295]. The spectral properties of the reduced and oxidized sensor enable a
ratiometric measurement. Stably transfected cell lines would be beneficial for the
investigation of the effect of compounds on intracellular ROS – or H2O2 – levels, since
transiently transfected cells have to be assayed within 24 to 48 h after transfection [301].
5.8.2.1. Preparation of stably HyPer-expressing cells
Several people participated in the preparation of stably transfected cell lines, and I would like
to acknowledge their work. The plasmids encoding the H2O2 sensitive fluorescent proteins
HyPerC and the mutant HyPerC121s were kind gifts of Dr. Miklós Geiszt (Semmelweis
University, Budapest, Hungary). I want to thank Zsuzsanna Nagy (working group of Dr.
Gergely Szakács) for supervising me in performing the gene amplification and purification of
the plasmids, and Nóra Kucsma (working group of Dr. Gergely Szakács) and Áron Szepesi
(working group of Dr. Katalin Német) for performing the subsequent steps from the cloning
of DNA into a lentiviral vector to the transduction and sorting of MES-SA and MES-SA/Dx5
cells.
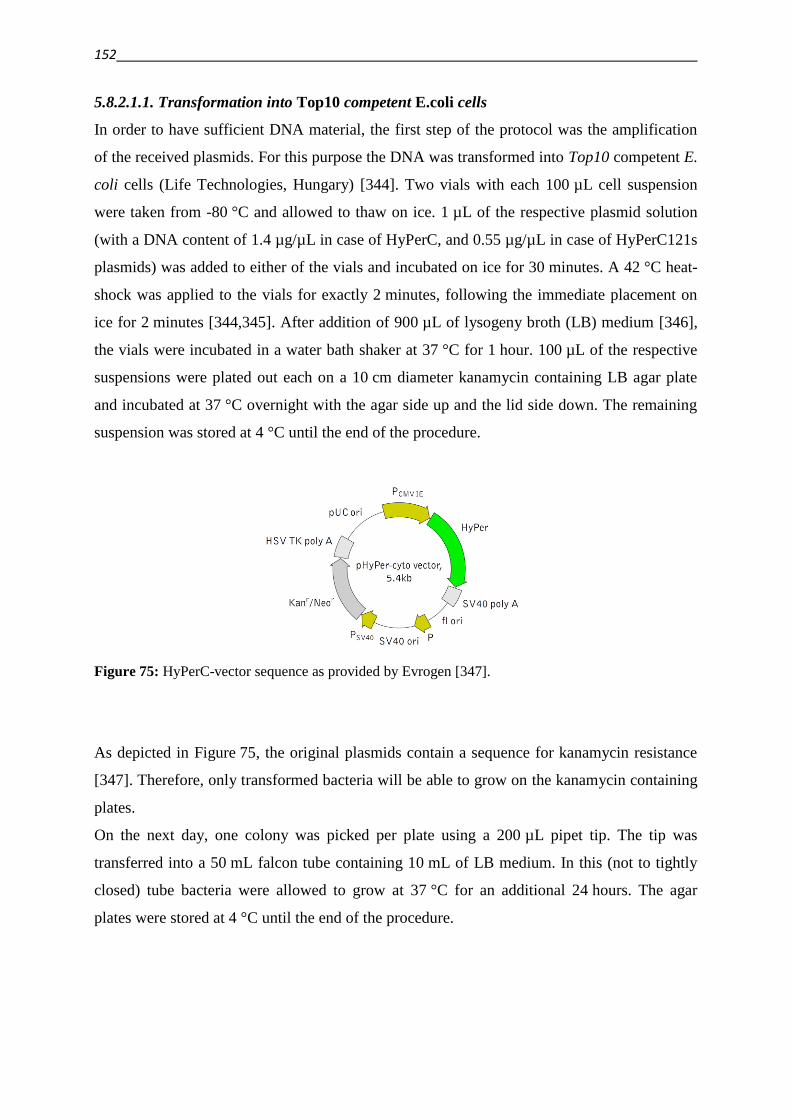
152
5.8.2.1.1. Transformation into Top10 competent E.coli cells
In order to have sufficient DNA material, the first step of the protocol was the amplification
of the received plasmids. For this purpose the DNA was transformed into Top10 competent E.
coli cells (Life Technologies, Hungary) [344]. Two vials with each 100 µL cell suspension
were taken from -80 °C and allowed to thaw on ice. 1 µL of the respective plasmid solution
(with a DNA content of 1.4 µg/µL in case of HyPerC, and 0.55 µg/µL in case of HyPerC121s
plasmids) was added to either of the vials and incubated on ice for 30 minutes. A 42 °C heat-
shock was applied to the vials for exactly 2 minutes, following the immediate placement on
ice for 2 minutes [344,345]. After addition of 900 µL of lysogeny broth (LB) medium [346],
the vials were incubated in a water bath shaker at 37 °C for 1 hour. 100 µL of the respective
suspensions were plated out each on a 10 cm diameter kanamycin containing LB agar plate
and incubated at 37 °C overnight with the agar side up and the lid side down. The remaining
suspension was stored at 4 °C until the end of the procedure.
Figure 75: HyPerC-vector sequence as provided by Evrogen [347].
As depicted in Figure 75, the original plasmids contain a sequence for kanamycin resistance
[347]. Therefore, only transformed bacteria will be able to grow on the kanamycin containing
plates.
On the next day, one colony was picked per plate using a 200 µL pipet tip. The tip was
transferred into a 50 mL falcon tube containing 10 mL of LB medium. In this (not to tightly
closed) tube bacteria were allowed to grow at 37 °C for an additional 24 hours. The agar
plates were stored at 4 °C until the end of the procedure.
5. Tumor models and biological methods 153
5.8.2.1.2. Isolation and Purification of amplified plasmid DNA
Plasmid DNA was isolated and purified from the bacteria using the QIAprep Spin Miniprep
Kit (QIAGEN, Hungary) [348]. The process is based on the selective alkaline denaturation of
high molecular weight DNA over closed circular double-stranded DNA. Upon re-
neutralization the chromosomal DNA renaturates to precipitate as a clot, while the plasmid
DNA stays in the supernatant [349].
Underlined buffers and solutions were components of the QIAprep Spin Miniprep Kit
(QIAGEN, Hungary) [348]. Prior to the procedure, buffers were controlled for precipitations.
If precipitations were observed, buffers were heated to 37 °C to re-dissolve the components.
The bacteria (as described in 5.8.2.1.1.) were centrifuged at 4500 x g at 25 °C for 3 min and
the pellet was resuspended in 500 µL of buffer P1, which was prior supplemented with
RNase A solution. 500 µL of buffer P2 was added and the vials were mixed thoroughly by
inverting the tubes 4-6 times. After addition of 700 µL of buffer N3 the vials were mixed
immediately and thoroughly by inverting the tubes 4-6 times, and centrifuged for 10 min at
17949 x g and 25 °C. The supernatants were pipetted to QIAprep spin columns, and
centrifuged (17949 x g, 25 °C) for 1 min. The filtrate was discarded and the columns washed
with 500 µL buffer PB, following centrifugation for 1 min. After discarding the filtrate,
columns were washed with 750 µL buffer PE (prior supplemented with ethanol), centrifuged
for 1 min, and after discarding of the filtrate again centrifuged for 1 min in order to remove
residual washing buffer. The columns were eluted into a 1.5 mL Eppendorf tube by twice
adding 50 µL of water and centrifuging for 1 min after a 1 min exposure time.
5.8.2.1.3. Quantification of DNA
The amount of DNA in the samples was quantified using a NanoDrop™ 2000 (Thermo
Scientific, Hungary). This device is a spectrophotometer capable of measuring small sample
volumes [350]. From the absorbance spectra of a DNA sample, the quantity and purity of
DNA can be estimated [351].
After cleaning of the optical pedestals of the instrument with 3 µL of MilliQ (MQ) water and
a laboratory wipe, a background spectrum was recorded of 1 µL of the buffer used for the
DNA-elution (MQ water). Following cleaning, the spectra of the DNA samples were
measured. The instrument calculates the ratios of absorbance values recorded at 260/280 nm,
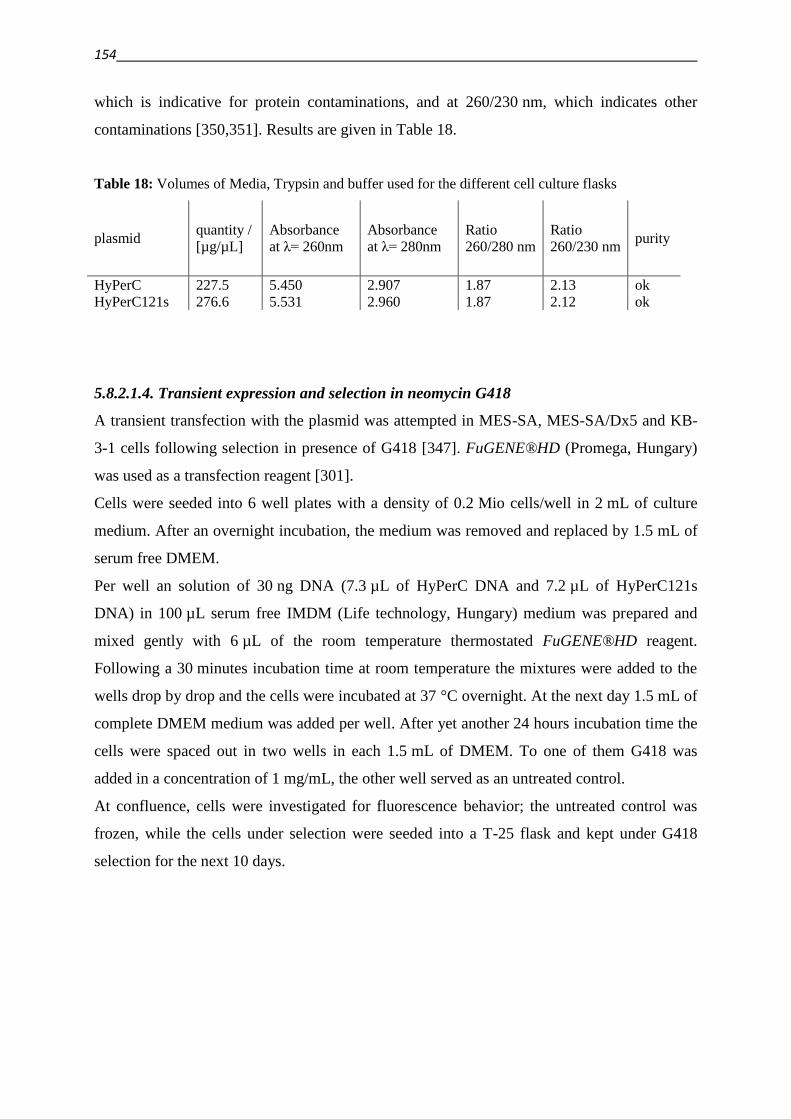
154
which is indicative for protein contaminations, and at 260/230 nm, which indicates other
contaminations [350,351]. Results are given in Table 18.
Table 18: Volumes of Media, Trypsin and buffer used for the different cell culture flasks
plasmid quantity /
[µg/µL]
Absorbance
at λ= 260nm
Absorbance
at λ= 280nm
Ratio
260/280 nm
Ratio
260/230 nm purity
HyPerC 227.5 5.450 2.907 1.87 2.13 ok
HyPerC121s 276.6 5.531 2.960 1.87 2.12 ok
5.8.2.1.4. Transient expression and selection in neomycin G418
A transient transfection with the plasmid was attempted in MES-SA, MES-SA/Dx5 and KB-
3-1 cells following selection in presence of G418 [347]. FuGENE®HD (Promega, Hungary)
was used as a transfection reagent [301].
Cells were seeded into 6 well plates with a density of 0.2 Mio cells/well in 2 mL of culture
medium. After an overnight incubation, the medium was removed and replaced by 1.5 mL of
serum free DMEM.
Per well an solution of 30 ng DNA (7.3 µL of HyPerC DNA and 7.2 µL of HyPerC121s
DNA) in 100 µL serum free IMDM (Life technology, Hungary) medium was prepared and
mixed gently with 6 µL of the room temperature thermostated FuGENE®HD reagent.
Following a 30 minutes incubation time at room temperature the mixtures were added to the
wells drop by drop and the cells were incubated at 37 °C overnight. At the next day 1.5 mL of
complete DMEM medium was added per well. After yet another 24 hours incubation time the
cells were spaced out in two wells in each 1.5 mL of DMEM. To one of them G418 was
added in a concentration of 1 mg/mL, the other well served as an untreated control.
At confluence, cells were investigated for fluorescence behavior; the untreated control was
frozen, while the cells under selection were seeded into a T-25 flask and kept under G418
selection for the next 10 days.
5. Tumor models and biological methods 155
5.8.2.1.5. Lentiviral transfection
As mentioned previously, the steps in this chapter were performed by Nóra Kucsma (working
group of Dr. Gergely Szakács) and Áron Szepesi (working group of Dr. Katalin Német).
The DNA was cloned into a lentiviral vector, and lentiviral particles were produced in
HEK293T cells transfected by the calcium phosphate co-precipitation method 2nd generation
lentiviral system. Viral titers were estimated from HEK cells infected with a dilution series of
HyPerC (259) and HyPerC121s (260) virus supernatants. For the transduction of MES-SA
and MES-SA/Dx5 cells, cells were seeded into 6 well plates at a density of 250.000 cells per
well and allowed to attach overnight. At the next day, cells were transduced in 1.5 ml fresh
DMEM with 75 or 200 µl virus supernatants and 15 µl (0.6 mg/ml) polybrene. At the
following day, cells were supplied with an additional 1.5 ml of fresh DMEM. The next day
(day 4), cells were passaged into T-25 (day 8) and subsequently to T-75 (day 10) culture
flasks. Upon confluency the cells were sorted FACS Aria for fluorescence at 488/530 (±15)
nm and seeded into T-25 flasks. Upon confluency cells were transferred to T-75 cells.
Propagated sorted cells were frozen and measured at the attune flow cytometer [343]. The
histograms characterizing the cells are shown in Figure 76.
5.8.2.2. Real time measurement of intracellular H2O2-levels
Additional to the microplate reader experiments (PerkinElmer EnSpire), real time
measurements were performed with either a PerkinElmer Luminescence Spectrometer LS50B
or a Varian Cary Eclipse Fluorescence Spectrophotometer in dual wavelengths kinetic mode.
4x optical acryl cuvettes were used (67.655, Sarstedt, Hungary). A homogenous distribution
of cells in the suspension was ensured with a mini magnetic stir bar (length: 5 mm, diameter:
2 mm; 442-0361, VWR, Hungary). Fluorescence was detected simultaneously at the emission
wavelength of 525 nm upon excitation at 490 and 420 nm and was followed over time. Times
of compound addition were noted, in order to follow the kinetics of induced effects.
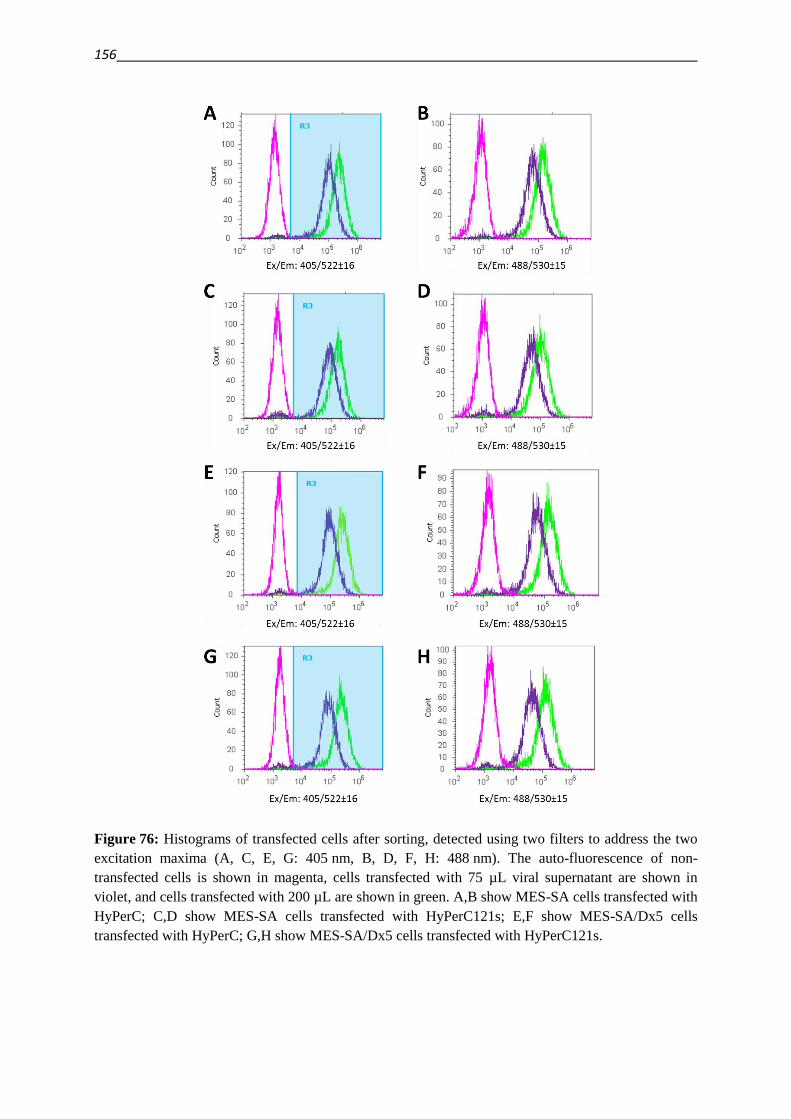
156
Figure 76: Histograms of transfected cells after sorting, detected using two filters to address the two
excitation maxima (A, C, E, G: 405 nm, B, D, F, H: 488 nm). The auto-fluorescence of non-
transfected cells is shown in magenta, cells transfected with 75 µL viral supernatant are shown in
violet, and cells transfected with 200 µL are shown in green. A,B show MES-SA cells transfected with
HyPerC; C,D show MES-SA cells transfected with HyPerC121s; E,F show MES-SA/Dx5 cells
transfected with HyPerC; G,H show MES-SA/Dx5 cells transfected with HyPerC121s.
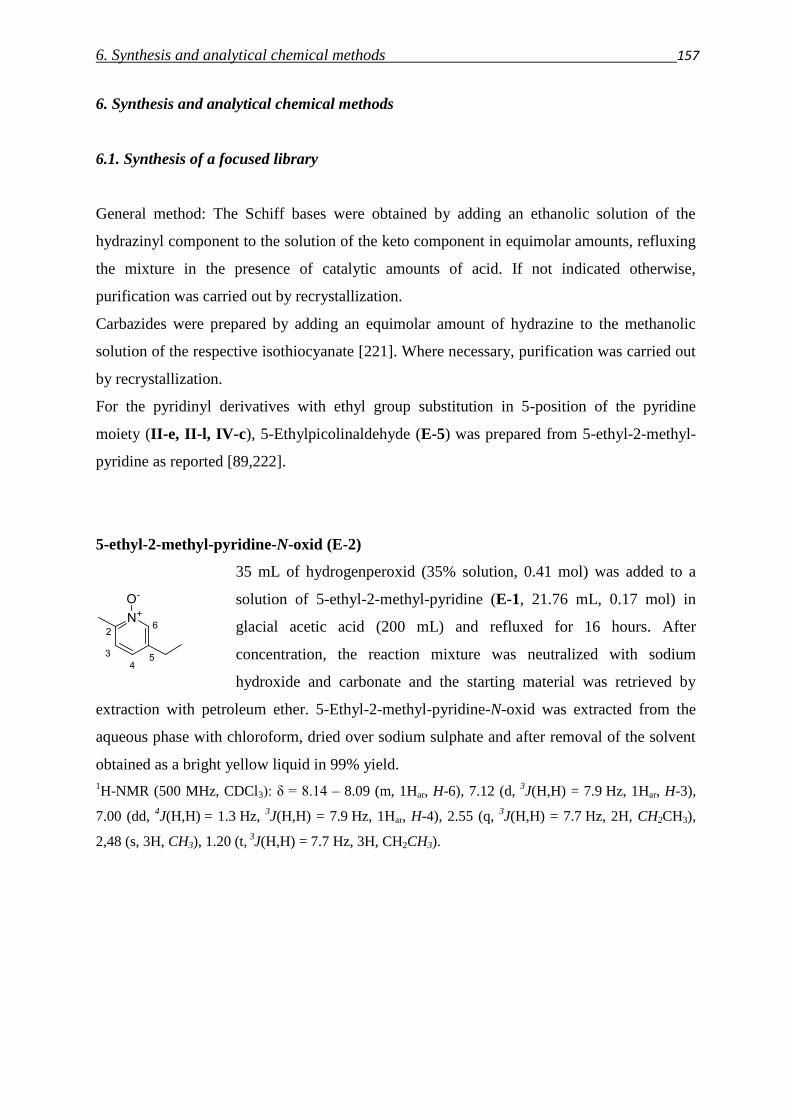
6. Synthesis and analytical chemical methods 157
6. Synthesis and analytical chemical methods
6.1. Synthesis of a focused library
General method: The Schiff bases were obtained by adding an ethanolic solution of the
hydrazinyl component to the solution of the keto component in equimolar amounts, refluxing
the mixture in the presence of catalytic amounts of acid. If not indicated otherwise,
purification was carried out by recrystallization.
Carbazides were prepared by adding an equimolar amount of hydrazine to the methanolic
solution of the respective isothiocyanate [221]. Where necessary, purification was carried out
by recrystallization.
For the pyridinyl derivatives with ethyl group substitution in 5-position of the pyridine
moiety (II-e, II-l, IV-c), 5-Ethylpicolinaldehyde (E-5) was prepared from 5-ethyl-2-methyl-
pyridine as reported [89,222].
5-ethyl-2-methyl-pyridine-N-oxid (E-2)
35 mL of hydrogenperoxid (35% solution, 0.41 mol) was added to a
solution of 5-ethyl-2-methyl-pyridine (E-1, 21.76 mL, 0.17 mol) in
glacial acetic acid (200 mL) and refluxed for 16 hours. After
concentration, the reaction mixture was neutralized with sodium
hydroxide and carbonate and the starting material was retrieved by
extraction with petroleum ether. 5-Ethyl-2-methyl-pyridine-N-oxid was extracted from the
aqueous phase with chloroform, dried over sodium sulphate and after removal of the solvent
obtained as a bright yellow liquid in 99% yield.
1H-NMR (500 MHz, CDCl3): δ = 8.14 – 8.09 (m, 1Har, H-6), 7.12 (d,
3J(H,H) = 7.9 Hz, 1Har, H-3),
7.00 (dd, 4J(H,H) = 1.3 Hz,
3J(H,H) = 7.9 Hz, 1Har, H-4), 2.55 (q,
3J(H,H) = 7.7 Hz, 2H, CH2CH3),
2,48 (s, 3H, CH3), 1.20 (t, 3J(H,H) = 7.7 Hz, 3H, CH2CH3).
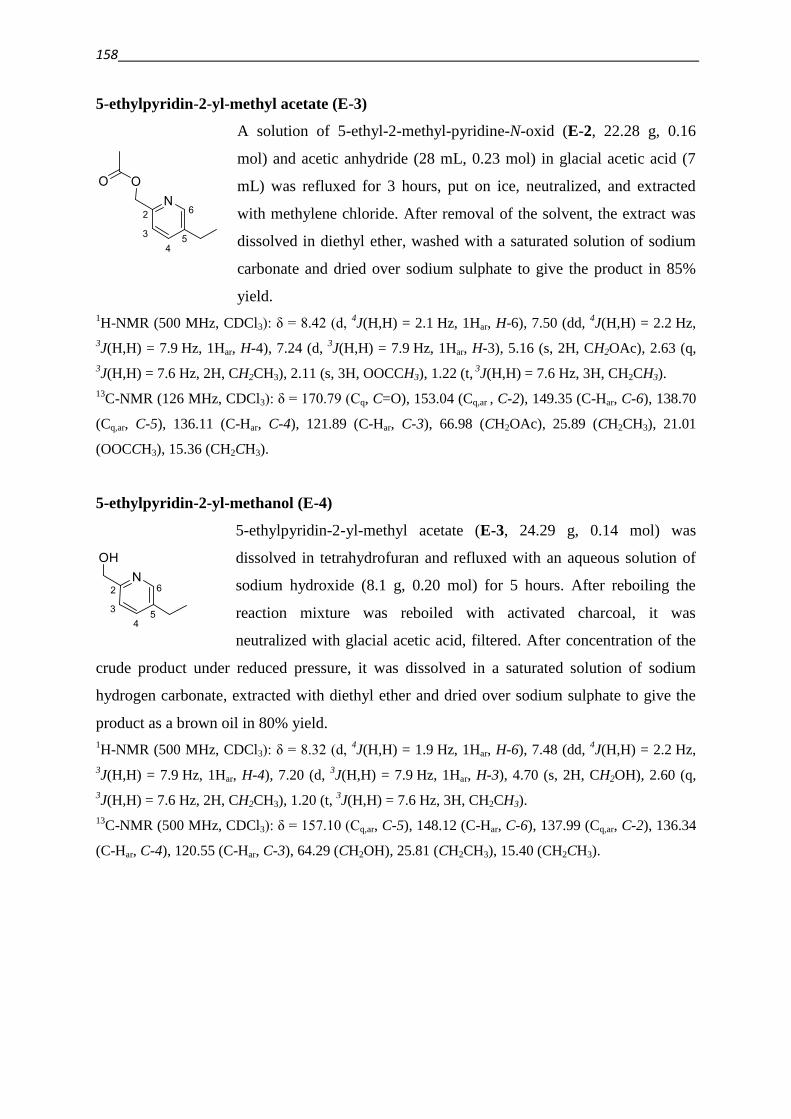
158
5-ethylpyridin-2-yl-methyl acetate (E-3)
A solution of 5-ethyl-2-methyl-pyridine-N-oxid (E-2, 22.28 g, 0.16
mol) and acetic anhydride (28 mL, 0.23 mol) in glacial acetic acid (7
mL) was refluxed for 3 hours, put on ice, neutralized, and extracted
with methylene chloride. After removal of the solvent, the extract was
dissolved in diethyl ether, washed with a saturated solution of sodium
carbonate and dried over sodium sulphate to give the product in 85%
yield.
1H-NMR (500 MHz, CDCl3): δ = 8.42 (d,
4J(H,H) = 2.1 Hz, 1Har, H-6), 7.50 (dd,
4J(H,H) = 2.2 Hz,
3J(H,H) = 7.9 Hz, 1Har, H-4), 7.24 (d,
3J(H,H) = 7.9 Hz, 1Har, H-3), 5.16 (s, 2H, CH2OAc), 2.63 (q,
3J(H,H) = 7.6 Hz, 2H, CH2CH3), 2.11 (s, 3H, OOCCH3), 1.22 (t,
3J(H,H) = 7.6 Hz, 3H, CH2CH3).
13C-NMR (126 MHz, CDCl3): δ = 170.79 (Cq, C=O), 153.04 (Cq,ar , C-2), 149.35 (C-Har, C-6), 138.70
(Cq,ar, C-5), 136.11 (C-Har, C-4), 121.89 (C-Har, C-3), 66.98 (CH2OAc), 25.89 (CH2CH3), 21.01
(OOCCH3), 15.36 (CH2CH3).
5-ethylpyridin-2-yl-methanol (E-4)
5-ethylpyridin-2-yl-methyl acetate (E-3, 24.29 g, 0.14 mol) was
dissolved in tetrahydrofuran and refluxed with an aqueous solution of
sodium hydroxide (8.1 g, 0.20 mol) for 5 hours. After reboiling the
reaction mixture was reboiled with activated charcoal, it was
neutralized with glacial acetic acid, filtered. After concentration of the
crude product under reduced pressure, it was dissolved in a saturated solution of sodium
hydrogen carbonate, extracted with diethyl ether and dried over sodium sulphate to give the
product as a brown oil in 80% yield.
1H-NMR (500 MHz, CDCl3): δ = 8.32 (d,
4J(H,H) = 1.9 Hz, 1Har, H-6), 7.48 (dd,
4J(H,H) = 2.2 Hz,
3J(H,H) = 7.9 Hz, 1Har, H-4), 7.20 (d,
3J(H,H) = 7.9 Hz, 1Har, H-3), 4.70 (s, 2H, CH2OH), 2.60 (q,
3J(H,H) = 7.6 Hz, 2H, CH2CH3), 1.20 (t,
3J(H,H) = 7.6 Hz, 3H, CH2CH3).
13C-NMR (500 MHz, CDCl3): δ = 157.10 (Cq,ar, C-5), 148.12 (C-Har, C-6), 137.99 (Cq,ar, C-2), 136.34
(C-Har, C-4), 120.55 (C-Har, C-3), 64.29 (CH2OH), 25.81 (CH2CH3), 15.40 (CH2CH3).
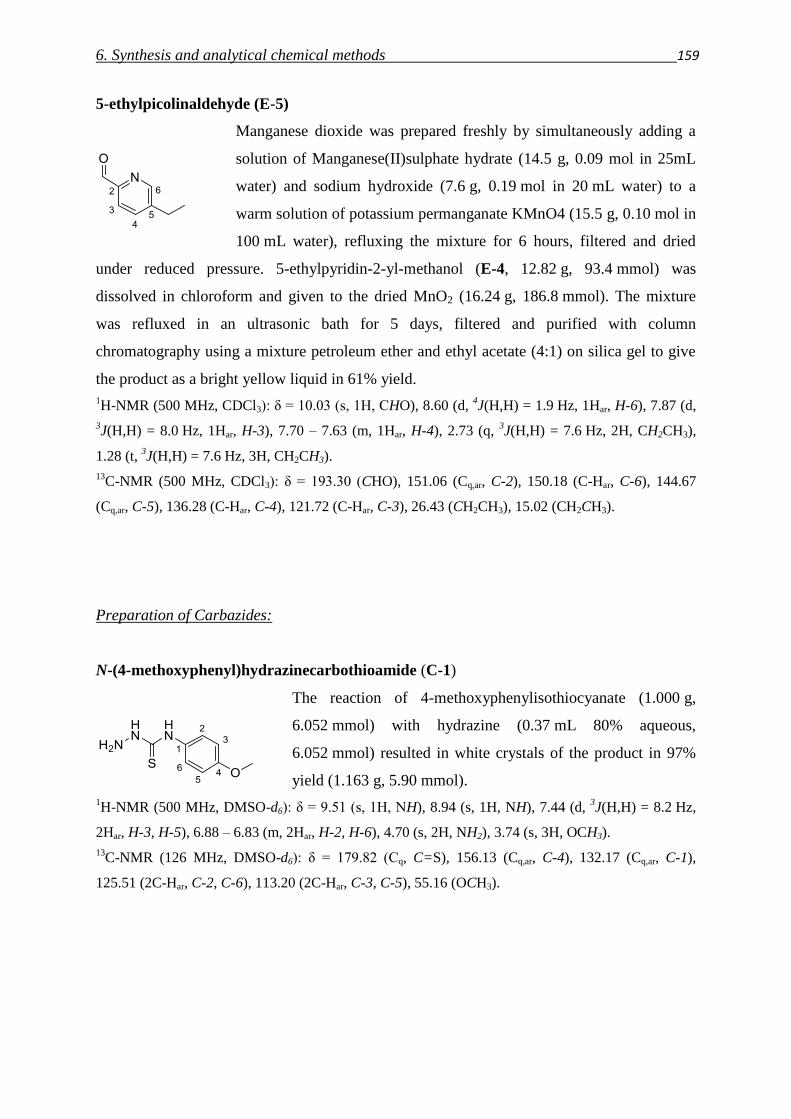
6. Synthesis and analytical chemical methods 159
5-ethylpicolinaldehyde (E-5)
Manganese dioxide was prepared freshly by simultaneously adding a
solution of Manganese(II)sulphate hydrate (14.5 g, 0.09 mol in 25mL
water) and sodium hydroxide (7.6 g, 0.19 mol in 20 mL water) to a
warm solution of potassium permanganate KMnO4 (15.5 g, 0.10 mol in
100 mL water), refluxing the mixture for 6 hours, filtered and dried
under reduced pressure. 5-ethylpyridin-2-yl-methanol (E-4, 12.82 g, 93.4 mmol) was
dissolved in chloroform and given to the dried MnO2 (16.24 g, 186.8 mmol). The mixture
was refluxed in an ultrasonic bath for 5 days, filtered and purified with column
chromatography using a mixture petroleum ether and ethyl acetate (4:1) on silica gel to give
the product as a bright yellow liquid in 61% yield.
1H-NMR (500 MHz, CDCl3): δ = 10.03 (s, 1H, CHO), 8.60 (d,
4J(H,H) = 1.9 Hz, 1Har, H-6), 7.87 (d,
3J(H,H) = 8.0 Hz, 1Har, H-3), 7.70 – 7.63 (m, 1Har, H-4), 2.73 (q,
3J(H,H) = 7.6 Hz, 2H, CH2CH3),
1.28 (t, 3J(H,H) = 7.6 Hz, 3H, CH2CH3).
13C-NMR (500 MHz, CDCl3): δ = 193.30 (CHO), 151.06 (Cq,ar, C-2), 150.18 (C-Har, C-6), 144.67
(Cq,ar, C-5), 136.28 (C-Har, C-4), 121.72 (C-Har, C-3), 26.43 (CH2CH3), 15.02 (CH2CH3).
Preparation of Carbazides:
N-(4-methoxyphenyl)hydrazinecarbothioamide (C-1)
The reaction of 4-methoxyphenylisothiocyanate (1.000 g,
6.052 mmol) with hydrazine (0.37 mL 80% aqueous,
6.052 mmol) resulted in white crystals of the product in 97%
yield (1.163 g, 5.90 mmol).
1H-NMR (500 MHz, DMSO-d6): δ = 9.51 (s, 1H, NH), 8.94 (s, 1H, NH), 7.44 (d,
3J(H,H) = 8.2 Hz,
2Har, H-3, H-5), 6.88 – 6.83 (m, 2Har, H-2, H-6), 4.70 (s, 2H, NH2), 3.74 (s, 3H, OCH3).
13C-NMR (126 MHz, DMSO-d6): δ = 179.82 (Cq, C=S), 156.13 (Cq,ar, C-4), 132.17 (Cq,ar, C-1),
125.51 (2C-Har, C-2, C-6), 113.20 (2C-Har, C-3, C-5), 55.16 (OCH3).
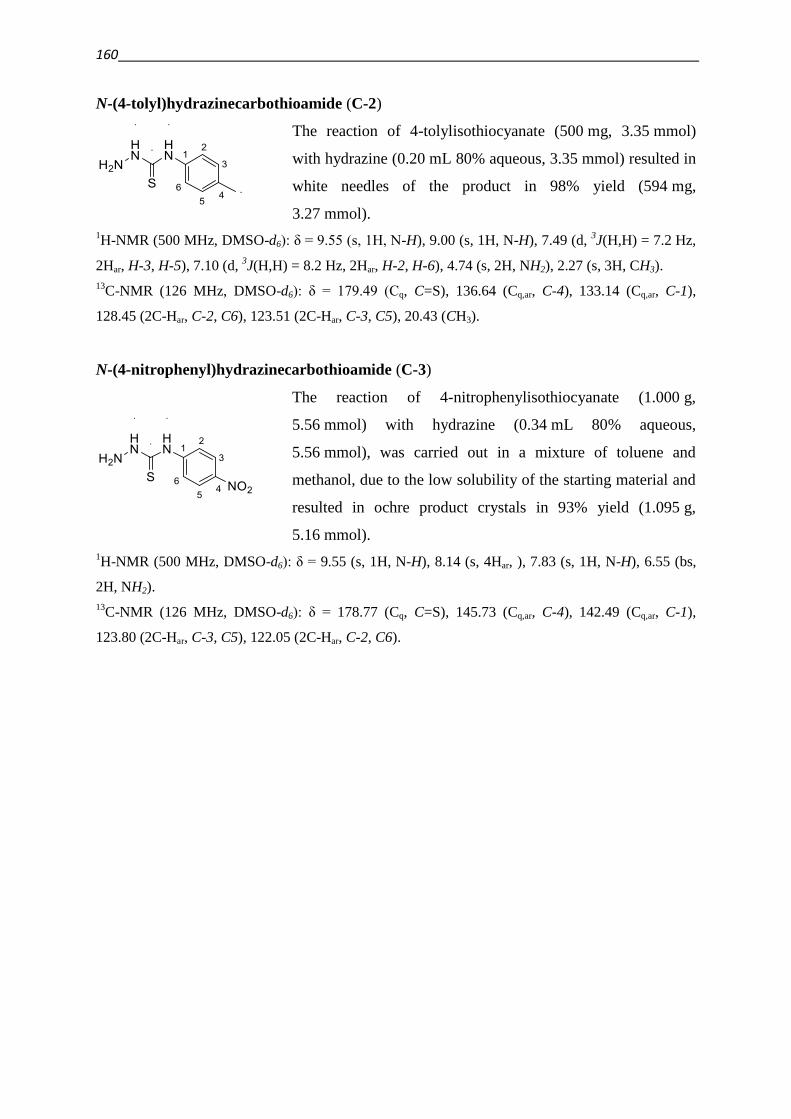
160
N-(4-tolyl)hydrazinecarbothioamide (C-2)
The reaction of 4-tolylisothiocyanate (500 mg, 3.35 mmol)
with hydrazine (0.20 mL 80% aqueous, 3.35 mmol) resulted in
white needles of the product in 98% yield (594 mg,
3.27 mmol).
1H-NMR (500 MHz, DMSO-d6): δ = 9.55 (s, 1H, N-H), 9.00 (s, 1H, N-H), 7.49 (d,
3J(H,H) = 7.2 Hz,
2Har, H-3, H-5), 7.10 (d, 3J(H,H) = 8.2 Hz, 2Har, H-2, H-6), 4.74 (s, 2H, NH2), 2.27 (s, 3H, CH3).
13C-NMR (126 MHz, DMSO-d6): δ = 179.49 (Cq, C=S), 136.64 (Cq,ar, C-4), 133.14 (Cq,ar, C-1),
128.45 (2C-Har, C-2, C6), 123.51 (2C-Har, C-3, C5), 20.43 (CH3).
N-(4-nitrophenyl)hydrazinecarbothioamide (C-3)
The reaction of 4-nitrophenylisothiocyanate (1.000 g,
5.56 mmol) with hydrazine (0.34 mL 80% aqueous,
5.56 mmol), was carried out in a mixture of toluene and
methanol, due to the low solubility of the starting material and
resulted in ochre product crystals in 93% yield (1.095 g,
5.16 mmol).
1H-NMR (500 MHz, DMSO-d6): δ = 9.55 (s, 1H, N-H), 8.14 (s, 4Har, ), 7.83 (s, 1H, N-H), 6.55 (bs,
2H, NH2).
13C-NMR (126 MHz, DMSO-d6): δ = 178.77 (Cq, C=S), 145.73 (Cq,ar, C-4), 142.49 (Cq,ar, C-1),
123.80 (2C-Har, C-3, C5), 122.05 (2C-Har, C-2, C6).
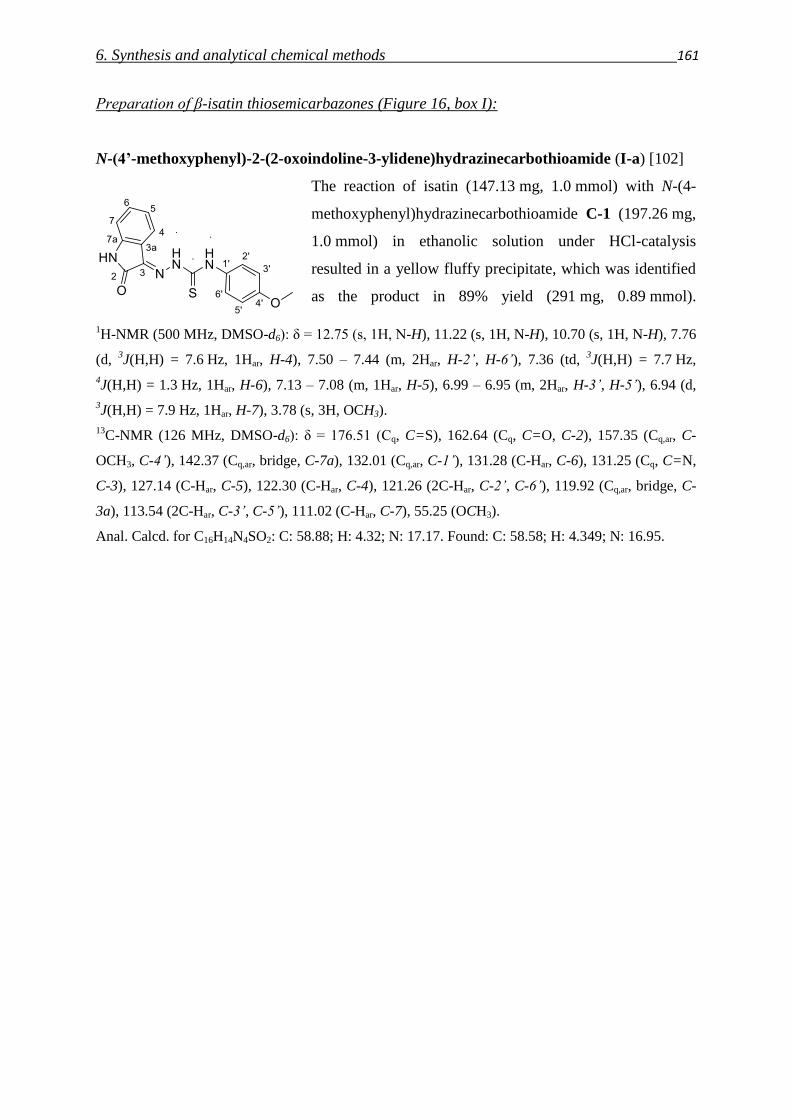
6. Synthesis and analytical chemical methods 161
Preparation of β-isatin thiosemicarbazones (Figure 16, box I):
N-(4’-methoxyphenyl)-2-(2-oxoindoline-3-ylidene)hydrazinecarbothioamide (I-a) [102]
The reaction of isatin (147.13 mg, 1.0 mmol) with N-(4-
methoxyphenyl)hydrazinecarbothioamide C-1 (197.26 mg,
1.0 mmol) in ethanolic solution under HCl-catalysis
resulted in a yellow fluffy precipitate, which was identified
as the product in 89% yield (291 mg, 0.89 mmol).
1H-NMR (500 MHz, DMSO-d6): δ = 12.75 (s, 1H, N-H), 11.22 (s, 1H, N-H), 10.70 (s, 1H, N-H), 7.76
(d, 3J(H,H) = 7.6 Hz, 1Har, H-4), 7.50 – 7.44 (m, 2Har, H-2’, H-6’), 7.36 (td,
3J(H,H) = 7.7 Hz,
4J(H,H) = 1.3 Hz, 1Har, H-6), 7.13 – 7.08 (m, 1Har, H-5), 6.99 – 6.95 (m, 2Har, H-3’, H-5’), 6.94 (d,
3J(H,H) = 7.9 Hz, 1Har, H-7), 3.78 (s, 3H, OCH3).
13C-NMR (126 MHz, DMSO-d6): δ = 176.51 (Cq, C=S), 162.64 (Cq, C=O, C-2), 157.35 (Cq,ar, C-
OCH3, C-4’), 142.37 (Cq,ar, bridge, C-7a), 132.01 (Cq,ar, C-1’), 131.28 (C-Har, C-6), 131.25 (Cq, C=N,
C-3), 127.14 (C-Har, C-5), 122.30 (C-Har, C-4), 121.26 (2C-Har, C-2’, C-6’), 119.92 (Cq,ar, bridge, C-
3a), 113.54 (2C-Har, C-3’, C-5’), 111.02 (C-Har, C-7), 55.25 (OCH3).
Anal. Calcd. for C16H14N4SO2: C: 58.88; H: 4.32; N: 17.17. Found: C: 58.58; H: 4.349; N: 16.95.
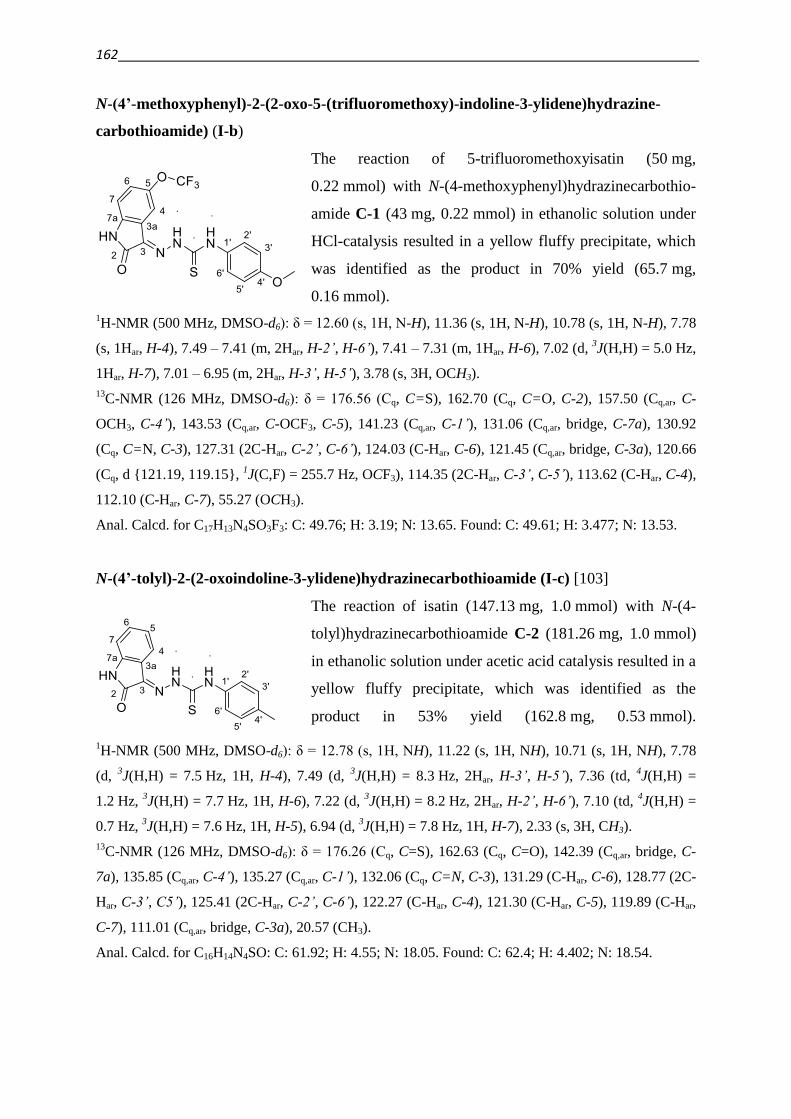
162
N-(4’-methoxyphenyl)-2-(2-oxo-5-(trifluoromethoxy)-indoline-3-ylidene)hydrazine-
carbothioamide) (I-b)
The reaction of 5-trifluoromethoxyisatin (50 mg,
0.22 mmol) with N-(4-methoxyphenyl)hydrazinecarbothio-
amide C-1 (43 mg, 0.22 mmol) in ethanolic solution under
HCl-catalysis resulted in a yellow fluffy precipitate, which
was identified as the product in 70% yield (65.7 mg,
0.16 mmol).
1H-NMR (500 MHz, DMSO-d6): δ = 12.60 (s, 1H, N-H), 11.36 (s, 1H, N-H), 10.78 (s, 1H, N-H), 7.78
(s, 1Har, H-4), 7.49 – 7.41 (m, 2Har, H-2’, H-6’), 7.41 – 7.31 (m, 1Har, H-6), 7.02 (d, 3J(H,H) = 5.0 Hz,
1Har, H-7), 7.01 – 6.95 (m, 2Har, H-3’, H-5’), 3.78 (s, 3H, OCH3).
13C-NMR (126 MHz, DMSO-d6): δ = 176.56 (Cq, C=S), 162.70 (Cq, C=O, C-2), 157.50 (Cq,ar, C-
OCH3, C-4’), 143.53 (Cq,ar, C-OCF3, C-5), 141.23 (Cq,ar, C-1’), 131.06 (Cq,ar, bridge, C-7a), 130.92
(Cq, C=N, C-3), 127.31 (2C-Har, C-2’, C-6’), 124.03 (C-Har, C-6), 121.45 (Cq,ar, bridge, C-3a), 120.66
(Cq, d {121.19, 119.15}, 1J(C,F) = 255.7 Hz, OCF3), 114.35 (2C-Har, C-3’, C-5’), 113.62 (C-Har, C-4),
112.10 (C-Har, C-7), 55.27 (OCH3).
Anal. Calcd. for C17H13N4SO3F3: C: 49.76; H: 3.19; N: 13.65. Found: C: 49.61; H: 3.477; N: 13.53.
N-(4’-tolyl)-2-(2-oxoindoline-3-ylidene)hydrazinecarbothioamide (I-c) [103]
The reaction of isatin (147.13 mg, 1.0 mmol) with N-(4-
tolyl)hydrazinecarbothioamide C-2 (181.26 mg, 1.0 mmol)
in ethanolic solution under acetic acid catalysis resulted in a
yellow fluffy precipitate, which was identified as the
product in 53% yield (162.8 mg, 0.53 mmol).
1H-NMR (500 MHz, DMSO-d6): δ = 12.78 (s, 1H, NH), 11.22 (s, 1H, NH), 10.71 (s, 1H, NH), 7.78
(d, 3J(H,H) = 7.5 Hz, 1H, H-4), 7.49 (d,
3J(H,H) = 8.3 Hz, 2Har, H-3’, H-5’), 7.36 (td,
4J(H,H) =
1.2 Hz, 3J(H,H) = 7.7 Hz, 1H, H-6), 7.22 (d,
3J(H,H) = 8.2 Hz, 2Har, H-2’, H-6’), 7.10 (td,
4J(H,H) =
0.7 Hz, 3J(H,H) = 7.6 Hz, 1H, H-5), 6.94 (d,
3J(H,H) = 7.8 Hz, 1H, H-7), 2.33 (s, 3H, CH3).
13C-NMR (126 MHz, DMSO-d6): δ = 176.26 (Cq, C=S), 162.63 (Cq, C=O), 142.39 (Cq,ar, bridge, C-
7a), 135.85 (Cq,ar, C-4’), 135.27 (Cq,ar, C-1’), 132.06 (Cq, C=N, C-3), 131.29 (C-Har, C-6), 128.77 (2C-
Har, C-3’, C5’), 125.41 (2C-Har, C-2’, C-6’), 122.27 (C-Har, C-4), 121.30 (C-Har, C-5), 119.89 (C-Har,
C-7), 111.01 (Cq,ar, bridge, C-3a), 20.57 (CH3).
Anal. Calcd. for C16H14N4SO: C: 61.92; H: 4.55; N: 18.05. Found: C: 62.4; H: 4.402; N: 18.54.
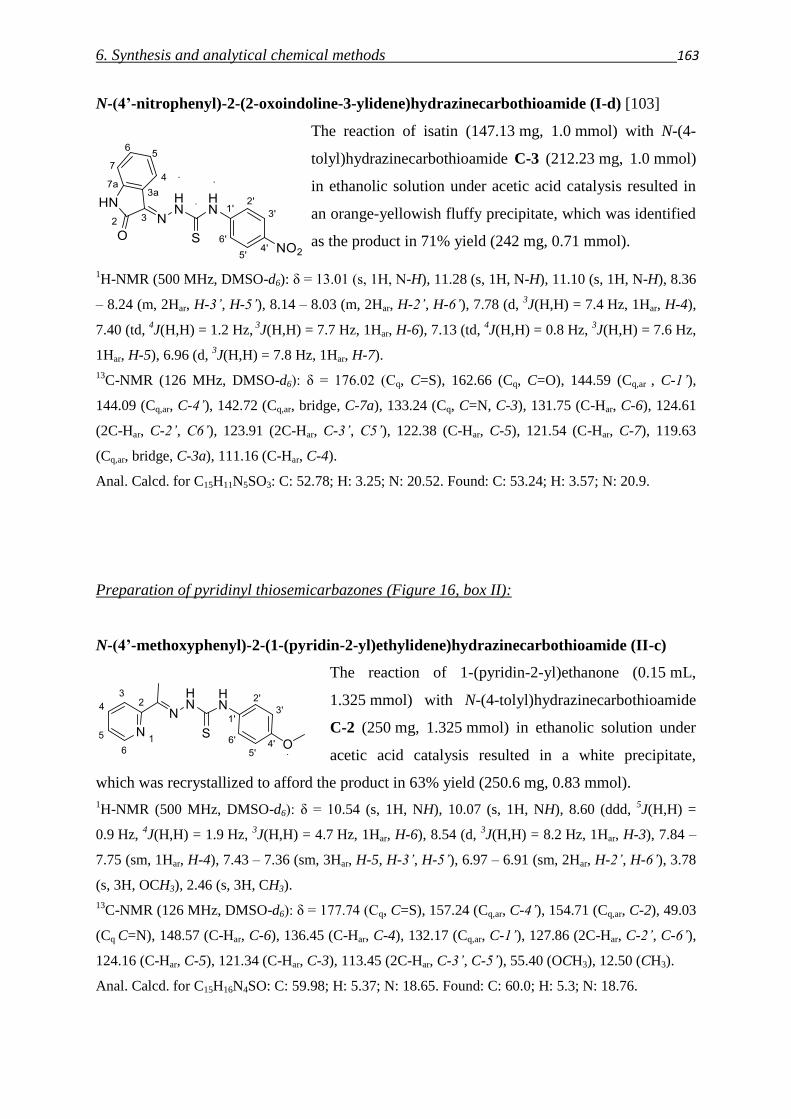
6. Synthesis and analytical chemical methods 163
N-(4’-nitrophenyl)-2-(2-oxoindoline-3-ylidene)hydrazinecarbothioamide (I-d) [103]
The reaction of isatin (147.13 mg, 1.0 mmol) with N-(4-
tolyl)hydrazinecarbothioamide C-3 (212.23 mg, 1.0 mmol)
in ethanolic solution under acetic acid catalysis resulted in
an orange-yellowish fluffy precipitate, which was identified
as the product in 71% yield (242 mg, 0.71 mmol).
1H-NMR (500 MHz, DMSO-d6): δ = 13.01 (s, 1H, N-H), 11.28 (s, 1H, N-H), 11.10 (s, 1H, N-H), 8.36
– 8.24 (m, 2Har, H-3’, H-5’), 8.14 – 8.03 (m, 2Har, H-2’, H-6’), 7.78 (d, 3J(H,H) = 7.4 Hz, 1Har, H-4),
7.40 (td, 4J(H,H) = 1.2 Hz,
3J(H,H) = 7.7 Hz, 1Har, H-6), 7.13 (td,
4J(H,H) = 0.8 Hz,
3J(H,H) = 7.6 Hz,
1Har, H-5), 6.96 (d, 3J(H,H) = 7.8 Hz, 1Har, H-7).
13C-NMR (126 MHz, DMSO-d6): δ = 176.02 (Cq, C=S), 162.66 (Cq, C=O), 144.59 (Cq,ar , C-1’),
144.09 (Cq,ar, C-4’), 142.72 (Cq,ar, bridge, C-7a), 133.24 (Cq, C=N, C-3), 131.75 (C-Har, C-6), 124.61
(2C-Har, C-2’, C6’), 123.91 (2C-Har, C-3’, C5’), 122.38 (C-Har, C-5), 121.54 (C-Har, C-7), 119.63
(Cq,ar, bridge, C-3a), 111.16 (C-Har, C-4).
Anal. Calcd. for C15H11N5SO3: C: 52.78; H: 3.25; N: 20.52. Found: C: 53.24; H: 3.57; N: 20.9.
Preparation of pyridinyl thiosemicarbazones (Figure 16, box II):
N-(4’-methoxyphenyl)-2-(1-(pyridin-2-yl)ethylidene)hydrazinecarbothioamide (II-c)
The reaction of 1-(pyridin-2-yl)ethanone (0.15 mL,
1.325 mmol) with N-(4-tolyl)hydrazinecarbothioamide
C-2 (250 mg, 1.325 mmol) in ethanolic solution under
acetic acid catalysis resulted in a white precipitate,
which was recrystallized to afford the product in 63% yield (250.6 mg, 0.83 mmol).
1H-NMR (500 MHz, DMSO-d6): δ = 10.54 (s, 1H, NH), 10.07 (s, 1H, NH), 8.60 (ddd,
5J(H,H) =
0.9 Hz, 4J(H,H) = 1.9 Hz,
3J(H,H) = 4.7 Hz, 1Har, H-6), 8.54 (d,
3J(H,H) = 8.2 Hz, 1Har, H-3), 7.84 –
7.75 (sm, 1Har, H-4), 7.43 – 7.36 (sm, 3Har, H-5, H-3’, H-5’), 6.97 – 6.91 (sm, 2Har, H-2’, H-6’), 3.78
(s, 3H, OCH3), 2.46 (s, 3H, CH3).
13C-NMR (126 MHz, DMSO-d6): δ = 177.74 (Cq, C=S), 157.24 (Cq,ar, C-4’), 154.71 (Cq,ar, C-2), 49.03
(Cq C=N), 148.57 (C-Har, C-6), 136.45 (C-Har, C-4), 132.17 (Cq,ar, C-1’), 127.86 (2C-Har, C-2’, C-6’),
124.16 (C-Har, C-5), 121.34 (C-Har, C-3), 113.45 (2C-Har, C-3’, C-5’), 55.40 (OCH3), 12.50 (CH3).
Anal. Calcd. for C15H16N4SO: C: 59.98; H: 5.37; N: 18.65. Found: C: 60.0; H: 5.3; N: 18.76.
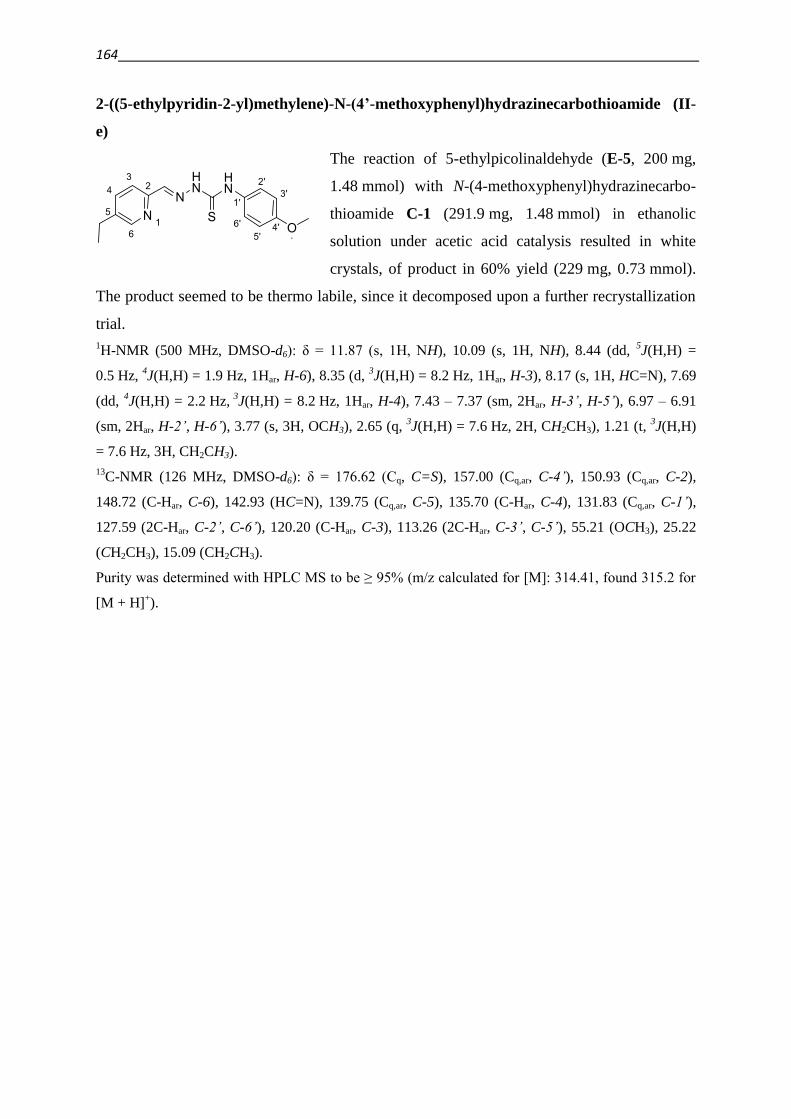
164
2-((5-ethylpyridin-2-yl)methylene)-N-(4’-methoxyphenyl)hydrazinecarbothioamide (II-
e)
The reaction of 5-ethylpicolinaldehyde (E-5, 200 mg,
1.48 mmol) with N-(4-methoxyphenyl)hydrazinecarbo-
thioamide C-1 (291.9 mg, 1.48 mmol) in ethanolic
solution under acetic acid catalysis resulted in white
crystals, of product in 60% yield (229 mg, 0.73 mmol).
The product seemed to be thermo labile, since it decomposed upon a further recrystallization
trial.
1H-NMR (500 MHz, DMSO-d6): δ = 11.87 (s, 1H, NH), 10.09 (s, 1H, NH), 8.44 (dd,
5J(H,H) =
0.5 Hz, 4J(H,H) = 1.9 Hz, 1Har, H-6), 8.35 (d,
3J(H,H) = 8.2 Hz, 1Har, H-3), 8.17 (s, 1H, HC=N), 7.69
(dd, 4J(H,H) = 2.2 Hz,
3J(H,H) = 8.2 Hz, 1Har, H-4), 7.43 – 7.37 (sm, 2Har, H-3’, H-5’), 6.97 – 6.91
(sm, 2Har, H-2’, H-6’), 3.77 (s, 3H, OCH3), 2.65 (q, 3J(H,H) = 7.6 Hz, 2H, CH2CH3), 1.21 (t,
3J(H,H)
= 7.6 Hz, 3H, CH2CH3).
13C-NMR (126 MHz, DMSO-d6): δ = 176.62 (Cq, C=S), 157.00 (Cq,ar, C-4’), 150.93 (Cq,ar, C-2),
148.72 (C-Har, C-6), 142.93 (HC=N), 139.75 (Cq,ar, C-5), 135.70 (C-Har, C-4), 131.83 (Cq,ar, C-1’),
127.59 (2C-Har, C-2’, C-6’), 120.20 (C-Har, C-3), 113.26 (2C-Har, C-3’, C-5’), 55.21 (OCH3), 25.22
(CH2CH3), 15.09 (CH2CH3).
Purity was determined with HPLC MS to be ≥ 95% (m/z calculated for [M]: 314.41, found 315.2 for
[M + H]+).
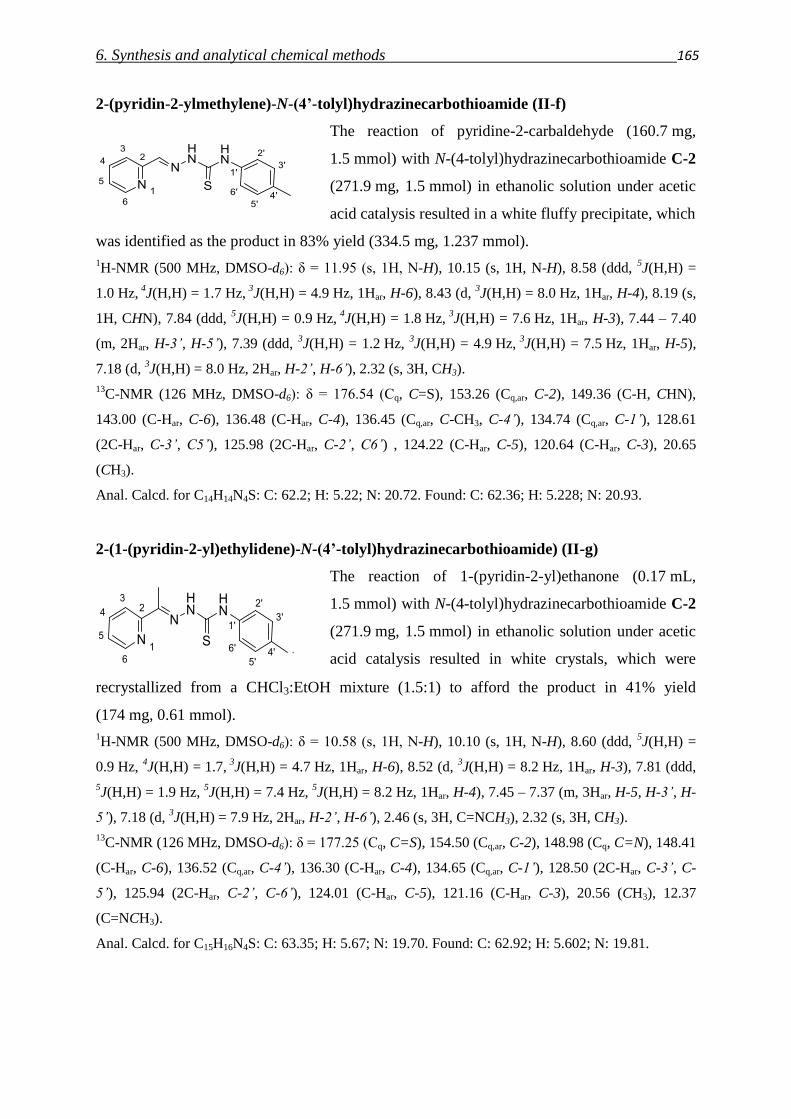
6. Synthesis and analytical chemical methods 165
2-(pyridin-2-ylmethylene)-N-(4’-tolyl)hydrazinecarbothioamide (II-f)
The reaction of pyridine-2-carbaldehyde (160.7 mg,
1.5 mmol) with N-(4-tolyl)hydrazinecarbothioamide C-2
(271.9 mg, 1.5 mmol) in ethanolic solution under acetic
acid catalysis resulted in a white fluffy precipitate, which
was identified as the product in 83% yield (334.5 mg, 1.237 mmol).
1H-NMR (500 MHz, DMSO-d6): δ = 11.95 (s, 1H, N-H), 10.15 (s, 1H, N-H), 8.58 (ddd,
5J(H,H) =
1.0 Hz, 4
J(H,H) = 1.7 Hz, 3
J(H,H) = 4.9 Hz, 1Har, H-6), 8.43 (d, 3J(H,H) = 8.0 Hz, 1Har, H-4), 8.19 (s,
1H, CHN), 7.84 (ddd, 5J(H,H) = 0.9 Hz,
4J(H,H) = 1.8 Hz,
3J(H,H) = 7.6 Hz, 1Har, H-3), 7.44 – 7.40
(m, 2Har, H-3’, H-5’), 7.39 (ddd, 3J(H,H) = 1.2 Hz,
3J(H,H) = 4.9 Hz,
3J(H,H) = 7.5 Hz, 1Har, H-5),
7.18 (d, 3J(H,H) = 8.0 Hz, 2Har, H-2’, H-6’), 2.32 (s, 3H, CH3).
13C-NMR (126 MHz, DMSO-d6): δ = 176.54 (Cq, C=S), 153.26 (Cq,ar, C-2), 149.36 (C-H, CHN),
143.00 (C-Har, C-6), 136.48 (C-Har, C-4), 136.45 (Cq,ar, C-CH3, C-4’), 134.74 (Cq,ar, C-1’), 128.61
(2C-Har, C-3’, C5’), 125.98 (2C-Har, C-2’, C6’) , 124.22 (C-Har, C-5), 120.64 (C-Har, C-3), 20.65
(CH3).
Anal. Calcd. for C14H14N4S: C: 62.2; H: 5.22; N: 20.72. Found: C: 62.36; H: 5.228; N: 20.93.
2-(1-(pyridin-2-yl)ethylidene)-N-(4’-tolyl)hydrazinecarbothioamide) (II-g)
The reaction of 1-(pyridin-2-yl)ethanone (0.17 mL,
1.5 mmol) with N-(4-tolyl)hydrazinecarbothioamide C-2
(271.9 mg, 1.5 mmol) in ethanolic solution under acetic
acid catalysis resulted in white crystals, which were
recrystallized from a CHCl3:EtOH mixture (1.5:1) to afford the product in 41% yield
(174 mg, 0.61 mmol).
1H-NMR (500 MHz, DMSO-d6): δ = 10.58 (s, 1H, N-H), 10.10 (s, 1H, N-H), 8.60 (ddd,
5J(H,H) =
0.9 Hz, 4J(H,H) = 1.7,
3J(H,H) = 4.7 Hz, 1Har, H-6), 8.52 (d,
3J(H,H) = 8.2 Hz, 1Har, H-3), 7.81 (ddd,
5J(H,H) = 1.9 Hz,
5J(H,H) = 7.4 Hz,
5J(H,H) = 8.2 Hz, 1Har, H-4), 7.45 – 7.37 (m, 3Har, H-5, H-3’, H-
5’), 7.18 (d, 3J(H,H) = 7.9 Hz, 2Har, H-2’, H-6’), 2.46 (s, 3H, C=NCH3), 2.32 (s, 3H, CH3).
13C-NMR (126 MHz, DMSO-d6): δ = 177.25 (Cq, C=S), 154.50 (Cq,ar, C-2), 148.98 (Cq, C=N), 148.41
(C-Har, C-6), 136.52 (Cq,ar, C-4’), 136.30 (C-Har, C-4), 134.65 (Cq,ar, C-1’), 128.50 (2C-Har, C-3’, C-
5’), 125.94 (2C-Har, C-2’, C-6’), 124.01 (C-Har, C-5), 121.16 (C-Har, C-3), 20.56 (CH3), 12.37
(C=NCH3).
Anal. Calcd. for C15H16N4S: C: 63.35; H: 5.67; N: 19.70. Found: C: 62.92; H: 5.602; N: 19.81.
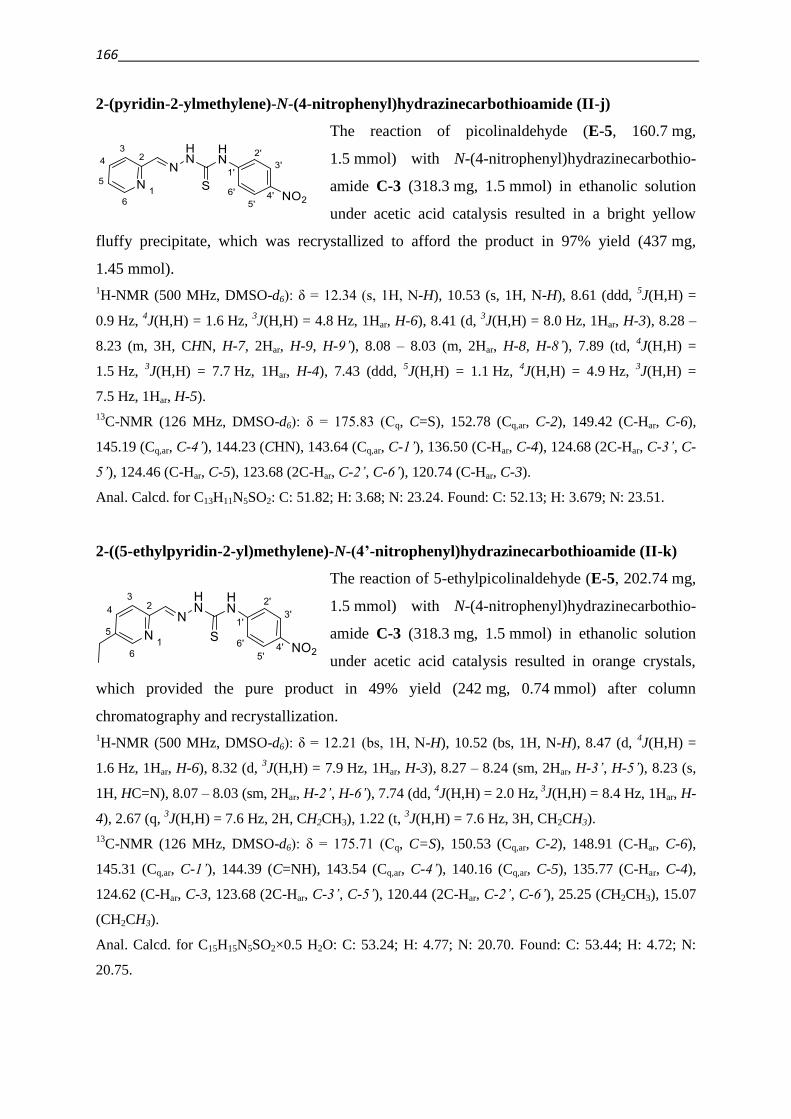
166
2-(pyridin-2-ylmethylene)-N-(4-nitrophenyl)hydrazinecarbothioamide (II-j)
The reaction of picolinaldehyde (E-5, 160.7 mg,
1.5 mmol) with N-(4-nitrophenyl)hydrazinecarbothio-
amide C-3 (318.3 mg, 1.5 mmol) in ethanolic solution
under acetic acid catalysis resulted in a bright yellow
fluffy precipitate, which was recrystallized to afford the product in 97% yield (437 mg,
1.45 mmol).
1H-NMR (500 MHz, DMSO-d6): δ = 12.34 (s, 1H, N-H), 10.53 (s, 1H, N-H), 8.61 (ddd,
5J(H,H) =
0.9 Hz, 4J(H,H) = 1.6 Hz,
3J(H,H) = 4.8 Hz, 1Har, H-6), 8.41 (d,
3J(H,H) = 8.0 Hz, 1Har, H-3), 8.28 –
8.23 (m, 3H, CHN, H-7, 2Har, H-9, H-9’), 8.08 – 8.03 (m, 2Har, H-8, H-8’), 7.89 (td, 4J(H,H) =
1.5 Hz, 3J(H,H) = 7.7 Hz, 1Har, H-4), 7.43 (ddd,
5J(H,H) = 1.1 Hz,
4J(H,H) = 4.9 Hz,
3J(H,H) =
7.5 Hz, 1Har, H-5).
13C-NMR (126 MHz, DMSO-d6): δ = 175.83 (Cq, C=S), 152.78 (Cq,ar, C-2), 149.42 (C-Har, C-6),
145.19 (Cq,ar, C-4’), 144.23 (CHN), 143.64 (Cq,ar, C-1’), 136.50 (C-Har, C-4), 124.68 (2C-Har, C-3’, C-
5’), 124.46 (C-Har, C-5), 123.68 (2C-Har, C-2’, C-6’), 120.74 (C-Har, C-3).
Anal. Calcd. for C13H11N5SO2: C: 51.82; H: 3.68; N: 23.24. Found: C: 52.13; H: 3.679; N: 23.51.
2-((5-ethylpyridin-2-yl)methylene)-N-(4’-nitrophenyl)hydrazinecarbothioamide (II-k)
The reaction of 5-ethylpicolinaldehyde (E-5, 202.74 mg,
1.5 mmol) with N-(4-nitrophenyl)hydrazinecarbothio-
amide C-3 (318.3 mg, 1.5 mmol) in ethanolic solution
under acetic acid catalysis resulted in orange crystals,
which provided the pure product in 49% yield (242 mg, 0.74 mmol) after column
chromatography and recrystallization.
1H-NMR (500 MHz, DMSO-d6): δ = 12.21 (bs, 1H, N-H), 10.52 (bs, 1H, N-H), 8.47 (d,
4J(H,H) =
1.6 Hz, 1Har, H-6), 8.32 (d, 3J(H,H) = 7.9 Hz, 1Har, H-3), 8.27 – 8.24 (sm, 2Har, H-3’, H-5’), 8.23 (s,
1H, HC=N), 8.07 – 8.03 (sm, 2Har, H-2’, H-6’), 7.74 (dd, 4J(H,H) = 2.0 Hz,
3J(H,H) = 8.4 Hz, 1Har, H-
4), 2.67 (q, 3J(H,H) = 7.6 Hz, 2H, CH2CH3), 1.22 (t,
3J(H,H) = 7.6 Hz, 3H, CH2CH3).
13C-NMR (126 MHz, DMSO-d6): δ = 175.71 (Cq, C=S), 150.53 (Cq,ar, C-2), 148.91 (C-Har, C-6),
145.31 (Cq,ar, C-1’), 144.39 (C=NH), 143.54 (Cq,ar, C-4’), 140.16 (Cq,ar, C-5), 135.77 (C-Har, C-4),
124.62 (C-Har, C-3, 123.68 (2C-Har, C-3’, C-5’), 120.44 (2C-Har, C-2’, C-6’), 25.25 (CH2CH3), 15.07
(CH2CH3).
Anal. Calcd. for C15H15N5SO2×0.5 H2O: C: 53.24; H: 4.77; N: 20.70. Found: C: 53.44; H: 4.72; N:
20.75.
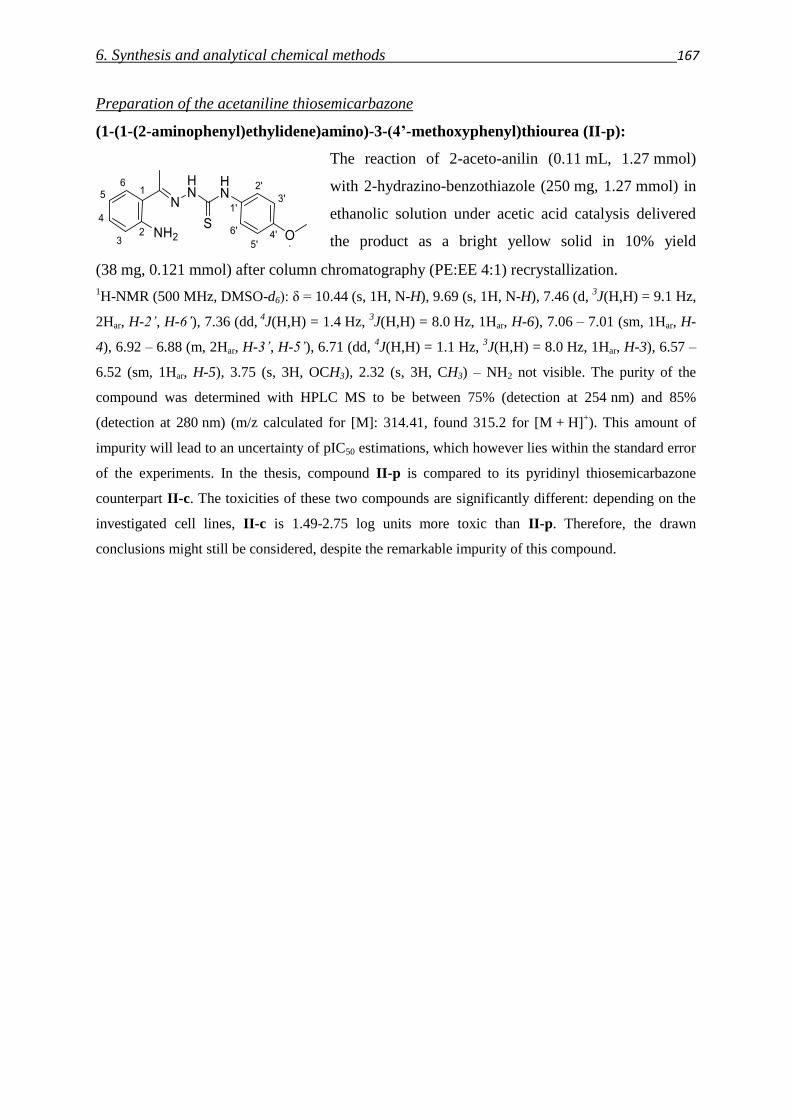
6. Synthesis and analytical chemical methods 167
Preparation of the acetaniline thiosemicarbazone
(1-(1-(2-aminophenyl)ethylidene)amino)-3-(4’-methoxyphenyl)thiourea (II-p):
The reaction of 2-aceto-anilin (0.11 mL, 1.27 mmol)
with 2-hydrazino-benzothiazole (250 mg, 1.27 mmol) in
ethanolic solution under acetic acid catalysis delivered
the product as a bright yellow solid in 10% yield
(38 mg, 0.121 mmol) after column chromatography (PE:EE 4:1) recrystallization.
1H-NMR (500 MHz, DMSO-d6): δ = 10.44 (s, 1H, N-H), 9.69 (s, 1H, N-H), 7.46 (d,
3J(H,H) = 9.1 Hz,
2Har, H-2’, H-6’), 7.36 (dd, 4
J(H,H) = 1.4 Hz, 3J(H,H) = 8.0 Hz, 1Har, H-6), 7.06 – 7.01 (sm, 1Har, H-
4), 6.92 – 6.88 (m, 2Har, H-3’, H-5’), 6.71 (dd, 4J(H,H) = 1.1 Hz,
3J(H,H) = 8.0 Hz, 1Har, H-3), 6.57 –
6.52 (sm, 1Har, H-5), 3.75 (s, 3H, OCH3), 2.32 (s, 3H, CH3) – NH2 not visible. The purity of the
compound was determined with HPLC MS to be between 75% (detection at 254 nm) and 85%
(detection at 280 nm) (m/z calculated for [M]: 314.41, found 315.2 for [M + H]+). This amount of
impurity will lead to an uncertainty of pIC50 estimations, which however lies within the standard error
of the experiments. In the thesis, compound II-p is compared to its pyridinyl thiosemicarbazone
counterpart II-c. The toxicities of these two compounds are significantly different: depending on the
investigated cell lines, II-c is 1.49-2.75 log units more toxic than II-p. Therefore, the drawn
conclusions might still be considered, despite the remarkable impurity of this compound.
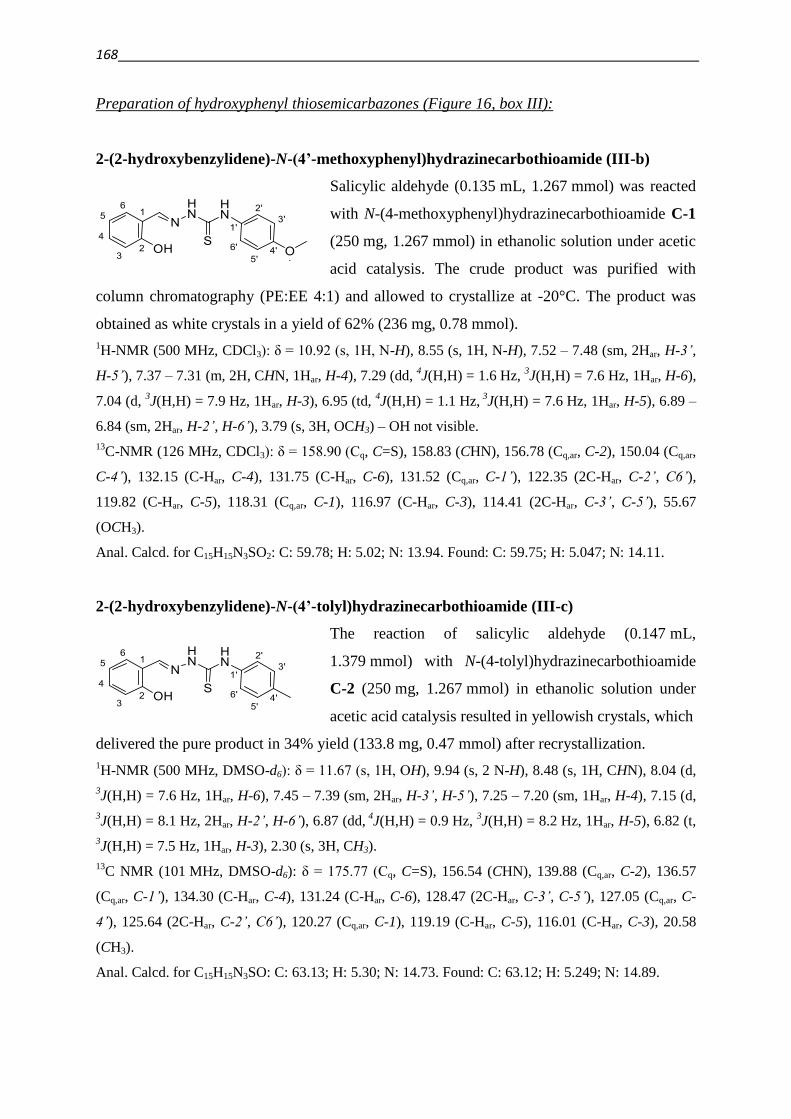
168
Preparation of hydroxyphenyl thiosemicarbazones (Figure 16, box III):
2-(2-hydroxybenzylidene)-N-(4’-methoxyphenyl)hydrazinecarbothioamide (III-b)
Salicylic aldehyde (0.135 mL, 1.267 mmol) was reacted
with N-(4-methoxyphenyl)hydrazinecarbothioamide C-1
(250 mg, 1.267 mmol) in ethanolic solution under acetic
acid catalysis. The crude product was purified with
column chromatography (PE:EE 4:1) and allowed to crystallize at -20°C. The product was
obtained as white crystals in a yield of 62% (236 mg, 0.78 mmol).
1H-NMR (500 MHz, CDCl3): δ = 10.92 (s, 1H, N-H), 8.55 (s, 1H, N-H), 7.52 – 7.48 (sm, 2Har, H-3’,
H-5’), 7.37 – 7.31 (m, 2H, CHN, 1Har, H-4), 7.29 (dd, 4J(H,H) = 1.6 Hz,
3J(H,H) = 7.6 Hz, 1Har, H-6),
7.04 (d, 3J(H,H) = 7.9 Hz, 1Har, H-3), 6.95 (td,
4J(H,H) = 1.1 Hz,
3J(H,H) = 7.6 Hz, 1Har, H-5), 6.89 –
6.84 (sm, 2Har, H-2’, H-6’), 3.79 (s, 3H, OCH3) – OH not visible.
13C-NMR (126 MHz, CDCl3): δ = 158.90 (Cq, C=S), 158.83 (CHN), 156.78 (Cq,ar, C-2), 150.04 (Cq,ar,
C-4’), 132.15 (C-Har, C-4), 131.75 (C-Har, C-6), 131.52 (Cq,ar, C-1’), 122.35 (2C-Har, C-2’, C6’),
119.82 (C-Har, C-5), 118.31 (Cq,ar, C-1), 116.97 (C-Har, C-3), 114.41 (2C-Har, C-3’, C-5’), 55.67
(OCH3).
Anal. Calcd. for C15H15N3SO2: C: 59.78; H: 5.02; N: 13.94. Found: C: 59.75; H: 5.047; N: 14.11.
2-(2-hydroxybenzylidene)-N-(4’-tolyl)hydrazinecarbothioamide (III-c)
The reaction of salicylic aldehyde (0.147 mL,
1.379 mmol) with N-(4-tolyl)hydrazinecarbothioamide
C-2 (250 mg, 1.267 mmol) in ethanolic solution under
acetic acid catalysis resulted in yellowish crystals, which
delivered the pure product in 34% yield (133.8 mg, 0.47 mmol) after recrystallization.
1H-NMR (500 MHz, DMSO-d6): δ = 11.67 (s, 1H, OH), 9.94 (s, 2 N-H), 8.48 (s, 1H, CHN), 8.04 (d,
3J(H,H) = 7.6 Hz, 1Har, H-6), 7.45 – 7.39 (sm, 2Har, H-3’, H-5’), 7.25 – 7.20 (sm, 1Har, H-4), 7.15 (d,
3J(H,H) = 8.1 Hz, 2Har, H-2’, H-6’), 6.87 (dd,
4J(H,H) = 0.9 Hz,
3J(H,H) = 8.2 Hz, 1Har, H-5), 6.82 (t,
3J(H,H) = 7.5 Hz, 1Har, H-3), 2.30 (s, 3H, CH3).
13C NMR (101 MHz, DMSO-d6): δ = 175.77 (Cq, C=S), 156.54 (CHN), 139.88 (Cq,ar, C-2), 136.57
(Cq,ar, C-1’), 134.30 (C-Har, C-4), 131.24 (C-Har, C-6), 128.47 (2C-Har, C-3’, C-5’), 127.05 (Cq,ar, C-
4’), 125.64 (2C-Har, C-2’, C6’), 120.27 (Cq,ar, C-1), 119.19 (C-Har, C-5), 116.01 (C-Har, C-3), 20.58
(CH3).
Anal. Calcd. for C15H15N3SO: C: 63.13; H: 5.30; N: 14.73. Found: C: 63.12; H: 5.249; N: 14.89.
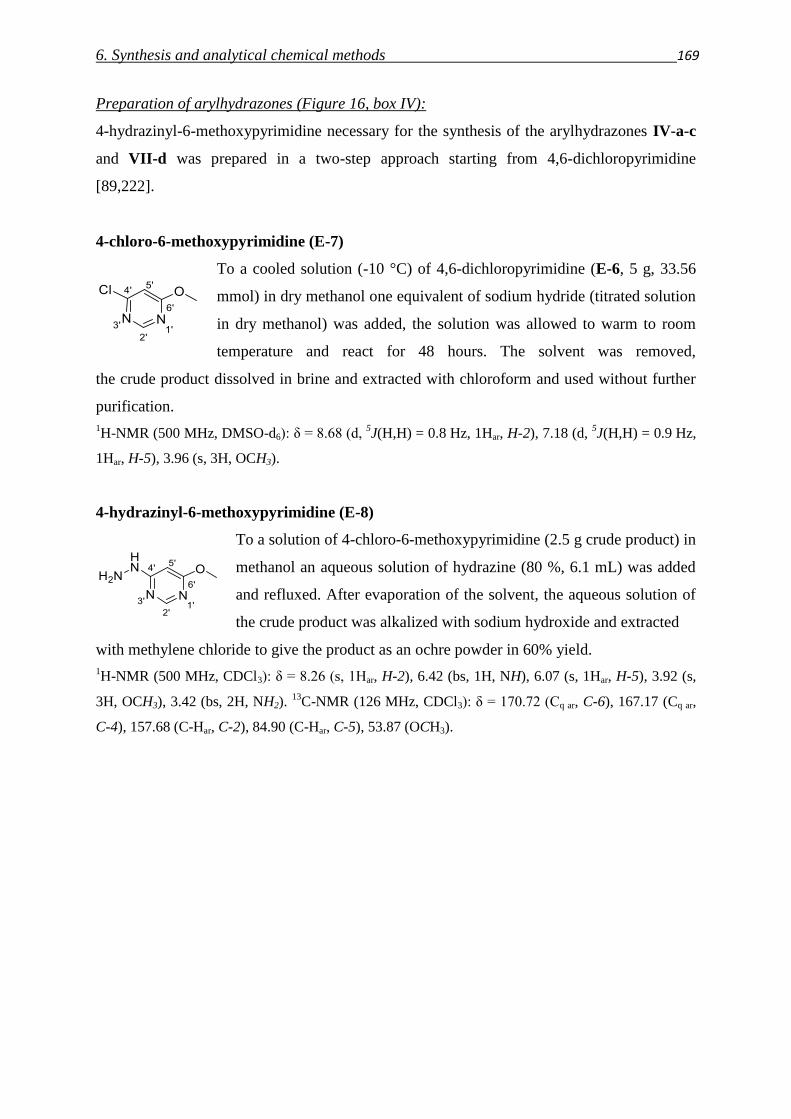
6. Synthesis and analytical chemical methods 169
Preparation of arylhydrazones (Figure 16, box IV):
4-hydrazinyl-6-methoxypyrimidine necessary for the synthesis of the arylhydrazones IV-a-c
and VII-d was prepared in a two-step approach starting from 4,6-dichloropyrimidine
[89,222].
4-chloro-6-methoxypyrimidine (E-7)
To a cooled solution (-10 °C) of 4,6-dichloropyrimidine (E-6, 5 g, 33.56
mmol) in dry methanol one equivalent of sodium hydride (titrated solution
in dry methanol) was added, the solution was allowed to warm to room
temperature and react for 48 hours. The solvent was removed,
the crude product dissolved in brine and extracted with chloroform and used without further
purification.
1H-NMR (500 MHz, DMSO-d6): δ = 8.68 (d,
5J(H,H) = 0.8 Hz, 1Har, H-2), 7.18 (d,
5J(H,H) = 0.9 Hz,
1Har, H-5), 3.96 (s, 3H, OCH3).
4-hydrazinyl-6-methoxypyrimidine (E-8)
To a solution of 4-chloro-6-methoxypyrimidine (2.5 g crude product) in
methanol an aqueous solution of hydrazine (80 %, 6.1 mL) was added
and refluxed. After evaporation of the solvent, the aqueous solution of
the crude product was alkalized with sodium hydroxide and extracted
with methylene chloride to give the product as an ochre powder in 60% yield.
1H-NMR (500 MHz, CDCl3): δ = 8.26 (s, 1Har, H-2), 6.42 (bs, 1H, NH), 6.07 (s, 1Har, H-5), 3.92 (s,
3H, OCH3), 3.42 (bs, 2H, NH2). 13
C-NMR (126 MHz, CDCl3): δ = 170.72 (Cq ar, C-6), 167.17 (Cq ar,
C-4), 157.68 (C-Har, C-2), 84.90 (C-Har, C-5), 53.87 (OCH3).
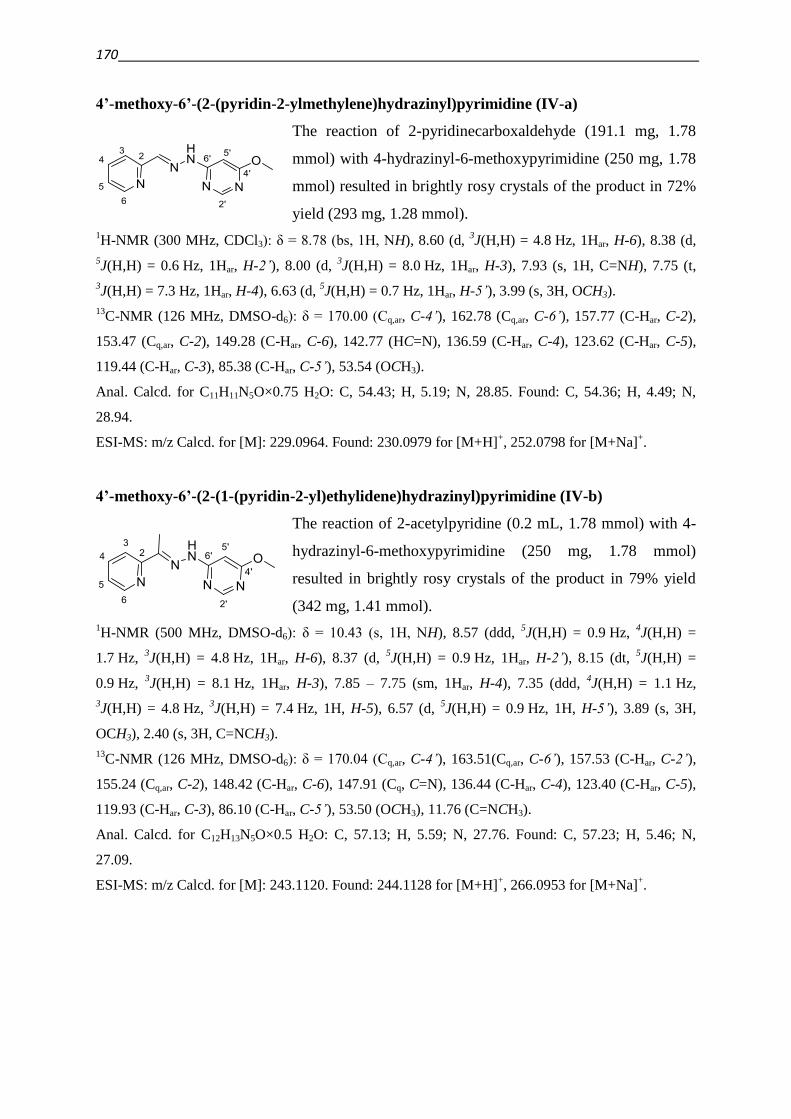
170
4’-methoxy-6’-(2-(pyridin-2-ylmethylene)hydrazinyl)pyrimidine (IV-a)
The reaction of 2-pyridinecarboxaldehyde (191.1 mg, 1.78
mmol) with 4-hydrazinyl-6-methoxypyrimidine (250 mg, 1.78
mmol) resulted in brightly rosy crystals of the product in 72%
yield (293 mg, 1.28 mmol).
1H-NMR (300 MHz, CDCl3): δ = 8.78 (bs, 1H, NH), 8.60 (d,
3J(H,H) = 4.8 Hz, 1Har, H-6), 8.38 (d,
5J(H,H) = 0.6 Hz, 1Har, H-2’), 8.00 (d,
3J(H,H) = 8.0 Hz, 1Har, H-3), 7.93 (s, 1H, C=NH), 7.75 (t,
3J(H,H) = 7.3 Hz, 1Har, H-4), 6.63 (d,
5J(H,H) = 0.7 Hz, 1Har, H-5’), 3.99 (s, 3H, OCH3).
13C-NMR (126 MHz, DMSO-d6): δ = 170.00 (Cq,ar, C-4’), 162.78 (Cq,ar, C-6’), 157.77 (C-Har, C-2),
153.47 (Cq,ar, C-2), 149.28 (C-Har, C-6), 142.77 (HC=N), 136.59 (C-Har, C-4), 123.62 (C-Har, C-5),
119.44 (C-Har, C-3), 85.38 (C-Har, C-5’), 53.54 (OCH3).
Anal. Calcd. for C11H11N5O×0.75 H2O: C, 54.43; H, 5.19; N, 28.85. Found: C, 54.36; H, 4.49; N,
28.94.
ESI-MS: m/z Calcd. for [M]: 229.0964. Found: 230.0979 for [M+H]+, 252.0798 for [M+Na]
+.
4’-methoxy-6’-(2-(1-(pyridin-2-yl)ethylidene)hydrazinyl)pyrimidine (IV-b)
The reaction of 2-acetylpyridine (0.2 mL, 1.78 mmol) with 4-
hydrazinyl-6-methoxypyrimidine (250 mg, 1.78 mmol)
resulted in brightly rosy crystals of the product in 79% yield
(342 mg, 1.41 mmol).
1H-NMR (500 MHz, DMSO-d6): δ = 10.43 (s, 1H, NH), 8.57 (ddd,
5J(H,H) = 0.9 Hz,
4J(H,H) =
1.7 Hz, 3J(H,H) = 4.8 Hz, 1Har, H-6), 8.37 (d,
5J(H,H) = 0.9 Hz, 1Har, H-2’), 8.15 (dt,
5J(H,H) =
0.9 Hz, 3J(H,H) = 8.1 Hz, 1Har, H-3), 7.85 – 7.75 (sm, 1Har, H-4), 7.35 (ddd,
4J(H,H) = 1.1 Hz,
3J(H,H) = 4.8 Hz,
3J(H,H) = 7.4 Hz, 1H, H-5), 6.57 (d,
5J(H,H) = 0.9 Hz, 1H, H-5’), 3.89 (s, 3H,
OCH3), 2.40 (s, 3H, C=NCH3).
13C-NMR (126 MHz, DMSO-d6): δ = 170.04 (Cq,ar, C-4’), 163.51(Cq,ar, C-6’), 157.53 (C-Har, C-2’),
155.24 (Cq,ar, C-2), 148.42 (C-Har, C-6), 147.91 (Cq, C=N), 136.44 (C-Har, C-4), 123.40 (C-Har, C-5),
119.93 (C-Har, C-3), 86.10 (C-Har, C-5’), 53.50 (OCH3), 11.76 (C=NCH3).
Anal. Calcd. for C12H13N5O×0.5 H2O: C, 57.13; H, 5.59; N, 27.76. Found: C, 57.23; H, 5.46; N,
27.09.
ESI-MS: m/z Calcd. for [M]: 243.1120. Found: 244.1128 for [M+H]+, 266.0953 for [M+Na]
+.
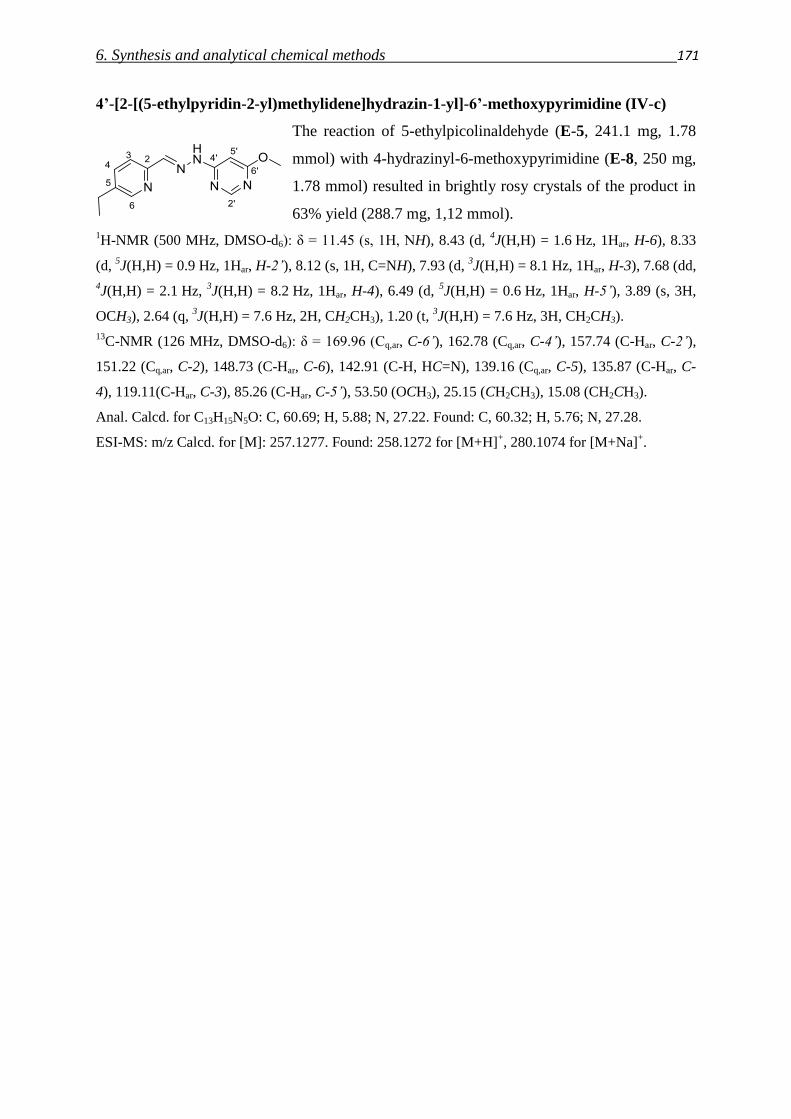
6. Synthesis and analytical chemical methods 171
4’-[2-[(5-ethylpyridin-2-yl)methylidene]hydrazin-1-yl]-6’-methoxypyrimidine (IV-c)
The reaction of 5-ethylpicolinaldehyde (E-5, 241.1 mg, 1.78
mmol) with 4-hydrazinyl-6-methoxypyrimidine (E-8, 250 mg,
1.78 mmol) resulted in brightly rosy crystals of the product in
63% yield (288.7 mg, 1,12 mmol).
1H-NMR (500 MHz, DMSO-d6): δ = 11.45 (s, 1H, NH), 8.43 (d,
4J(H,H) = 1.6 Hz, 1Har, H-6), 8.33
(d, 5J(H,H) = 0.9 Hz, 1Har, H-2’), 8.12 (s, 1H, C=NH), 7.93 (d,
3J(H,H) = 8.1 Hz, 1Har, H-3), 7.68 (dd,
4J(H,H) = 2.1 Hz,
3J(H,H) = 8.2 Hz, 1Har, H-4), 6.49 (d,
5J(H,H) = 0.6 Hz, 1Har, H-5’), 3.89 (s, 3H,
OCH3), 2.64 (q, 3J(H,H) = 7.6 Hz, 2H, CH2CH3), 1.20 (t,
3J(H,H) = 7.6 Hz, 3H, CH2CH3).
13C-NMR (126 MHz, DMSO-d6): δ = 169.96 (Cq,ar, C-6’), 162.78 (Cq,ar, C-4’), 157.74 (C-Har, C-2’),
151.22 (Cq,ar, C-2), 148.73 (C-Har, C-6), 142.91 (C-H, HC=N), 139.16 (Cq,ar, C-5), 135.87 (C-Har, C-
4), 119.11(C-Har, C-3), 85.26 (C-Har, C-5’), 53.50 (OCH3), 25.15 (CH2CH3), 15.08 (CH2CH3).
Anal. Calcd. for C13H15N5O: C, 60.69; H, 5.88; N, 27.22. Found: C, 60.32; H, 5.76; N, 27.28.
ESI-MS: m/z Calcd. for [M]: 257.1277. Found: 258.1272 for [M+H]+, 280.1074 for [M+Na]
+.
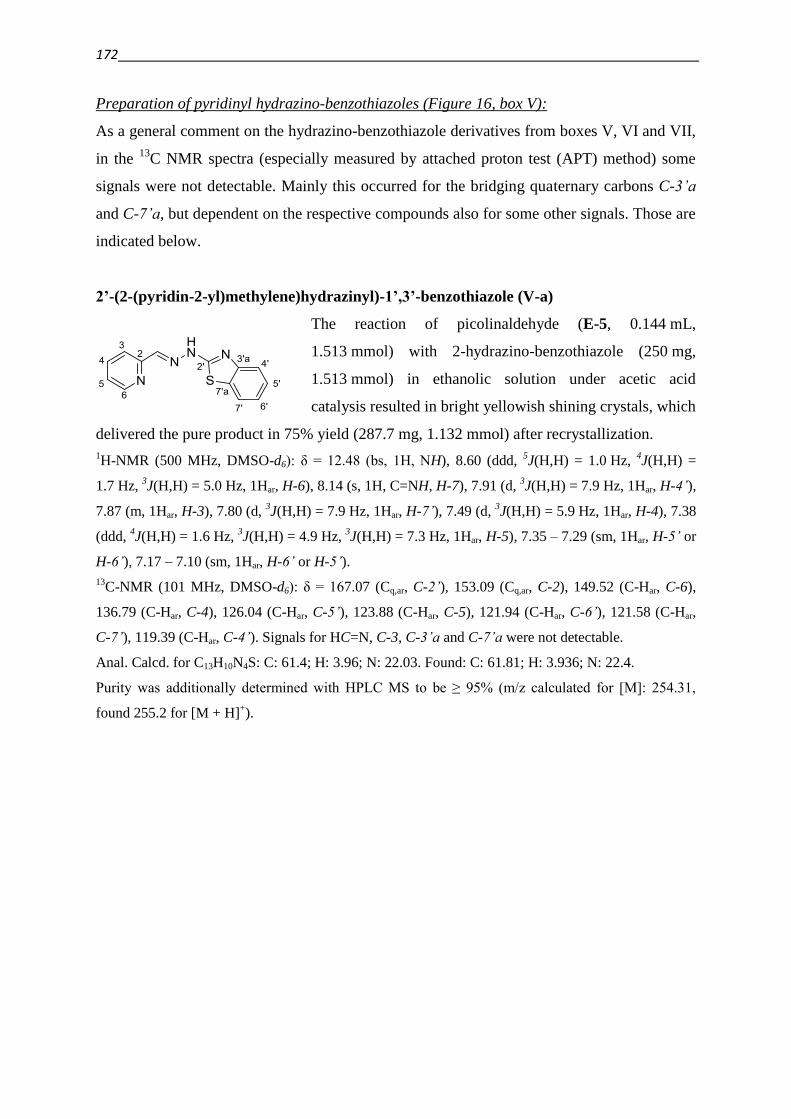
172
Preparation of pyridinyl hydrazino-benzothiazoles (Figure 16, box V):
As a general comment on the hydrazino-benzothiazole derivatives from boxes V, VI and VII,
in the 13
C NMR spectra (especially measured by attached proton test (APT) method) some
signals were not detectable. Mainly this occurred for the bridging quaternary carbons C-3’a
and C-7’a, but dependent on the respective compounds also for some other signals. Those are
indicated below.
2’-(2-(pyridin-2-yl)methylene)hydrazinyl)-1’,3’-benzothiazole (V-a)
The reaction of picolinaldehyde (E-5, 0.144 mL,
1.513 mmol) with 2-hydrazino-benzothiazole (250 mg,
1.513 mmol) in ethanolic solution under acetic acid
catalysis resulted in bright yellowish shining crystals, which
delivered the pure product in 75% yield (287.7 mg, 1.132 mmol) after recrystallization.
1H-NMR (500 MHz, DMSO-d6): δ = 12.48 (bs, 1H, NH), 8.60 (ddd,
5J(H,H) = 1.0 Hz,
4J(H,H) =
1.7 Hz, 3J(H,H) = 5.0 Hz, 1Har, H-6), 8.14 (s, 1H, C=NH, H-7), 7.91 (d,
3J(H,H) = 7.9 Hz, 1Har, H-4’),
7.87 (m, 1Har, H-3), 7.80 (d, 3J(H,H) = 7.9 Hz, 1Har, H-7’), 7.49 (d,
3J(H,H) = 5.9 Hz, 1Har, H-4), 7.38
(ddd, 4J(H,H) = 1.6 Hz,
3J(H,H) = 4.9 Hz,
3J(H,H) = 7.3 Hz, 1Har, H-5), 7.35 – 7.29 (sm, 1Har, H-5’ or
H-6’), 7.17 – 7.10 (sm, 1Har, H-6’ or H-5’).
13C-NMR (101 MHz, DMSO-d6): δ = 167.07 (Cq,ar, C-2’), 153.09 (Cq,ar, C-2), 149.52 (C-Har, C-6),
136.79 (C-Har, C-4), 126.04 (C-Har, C-5’), 123.88 (C-Har, C-5), 121.94 (C-Har, C-6’), 121.58 (C-Har,
C-7’), 119.39 (C-Har, C-4’). Signals for HC=N, C-3, C-3’a and C-7’a were not detectable.
Anal. Calcd. for C13H10N4S: C: 61.4; H: 3.96; N: 22.03. Found: C: 61.81; H: 3.936; N: 22.4.
Purity was additionally determined with HPLC MS to be ≥ 95% (m/z calculated for [M]: 254.31,
found 255.2 for [M + H]+).
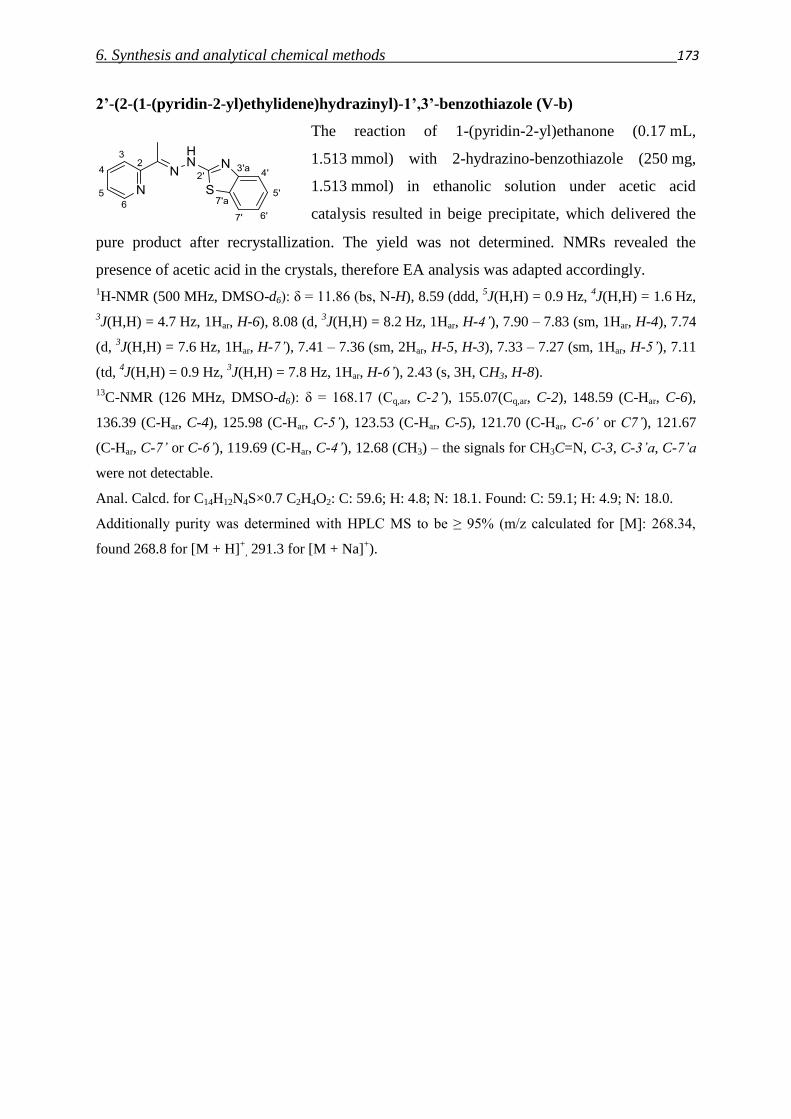
6. Synthesis and analytical chemical methods 173
2’-(2-(1-(pyridin-2-yl)ethylidene)hydrazinyl)-1’,3’-benzothiazole (V-b)
The reaction of 1-(pyridin-2-yl)ethanone (0.17 mL,
1.513 mmol) with 2-hydrazino-benzothiazole (250 mg,
1.513 mmol) in ethanolic solution under acetic acid
catalysis resulted in beige precipitate, which delivered the
pure product after recrystallization. The yield was not determined. NMRs revealed the
presence of acetic acid in the crystals, therefore EA analysis was adapted accordingly.
1H-NMR (500 MHz, DMSO-d6): δ = 11.86 (bs, N-H), 8.59 (ddd,
5J(H,H) = 0.9 Hz,
4J(H,H) = 1.6 Hz,
3J(H,H) = 4.7 Hz, 1Har, H-6), 8.08 (d,
3J(H,H) = 8.2 Hz, 1Har, H-4’), 7.90 – 7.83 (sm, 1Har, H-4), 7.74
(d, 3J(H,H) = 7.6 Hz, 1Har, H-7’), 7.41 – 7.36 (sm, 2Har, H-5, H-3), 7.33 – 7.27 (sm, 1Har, H-5’), 7.11
(td, 4J(H,H) = 0.9 Hz,
3J(H,H) = 7.8 Hz, 1Har, H-6’), 2.43 (s, 3H, CH3, H-8).
13C-NMR (126 MHz, DMSO-d6): δ = 168.17 (Cq,ar, C-2’), 155.07(Cq,ar, C-2), 148.59 (C-Har, C-6),
136.39 (C-Har, C-4), 125.98 (C-Har, C-5’), 123.53 (C-Har, C-5), 121.70 (C-Har, C-6’ or C7’), 121.67
(C-Har, C-7’ or C-6’), 119.69 (C-Har, C-4’), 12.68 (CH3) – the signals for CH3C=N, C-3, C-3’a, C-7’a
were not detectable.
Anal. Calcd. for C14H12N4S×0.7 C2H4O2: C: 59.6; H: 4.8; N: 18.1. Found: C: 59.1; H: 4.9; N: 18.0.
Additionally purity was determined with HPLC MS to be ≥ 95% (m/z calculated for [M]: 268.34,
found 268.8 for [M + H]+
, 291.3 for [M + Na]+).
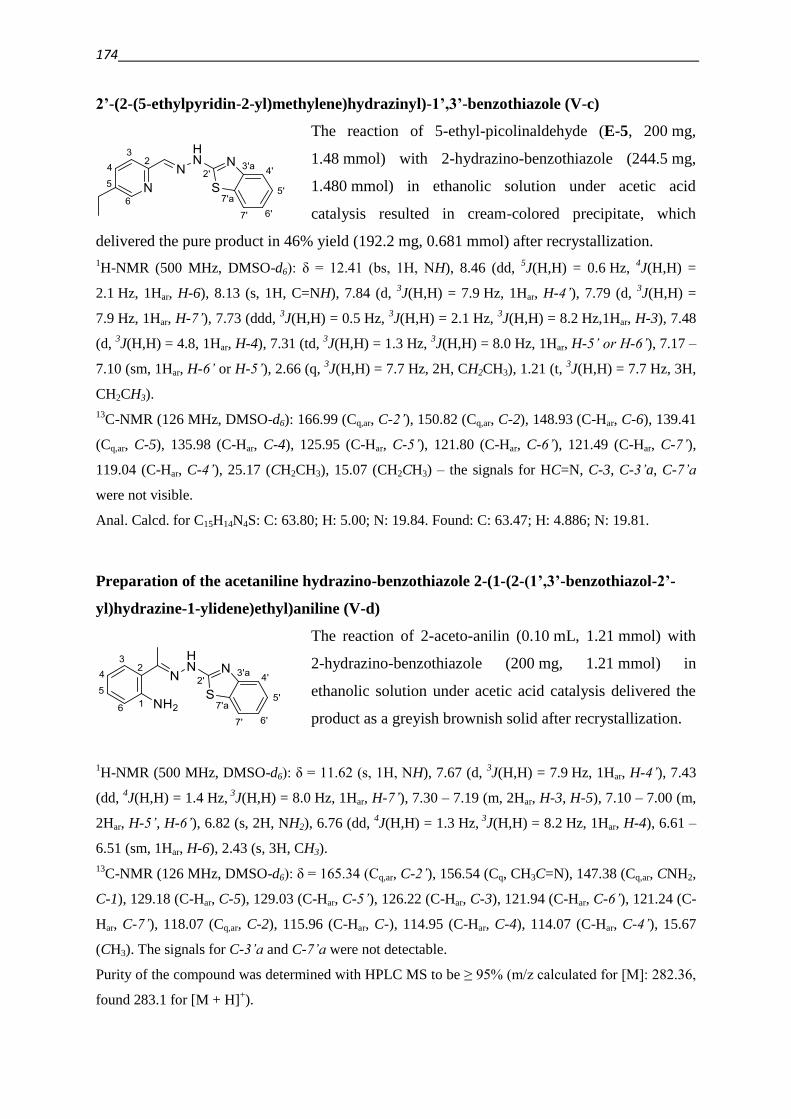
174
2’-(2-(5-ethylpyridin-2-yl)methylene)hydrazinyl)-1’,3’-benzothiazole (V-c)
The reaction of 5-ethyl-picolinaldehyde (E-5, 200 mg,
1.48 mmol) with 2-hydrazino-benzothiazole (244.5 mg,
1.480 mmol) in ethanolic solution under acetic acid
catalysis resulted in cream-colored precipitate, which
delivered the pure product in 46% yield (192.2 mg, 0.681 mmol) after recrystallization.
1H-NMR (500 MHz, DMSO-d6): δ = 12.41 (bs, 1H, NH), 8.46 (dd,
5J(H,H) = 0.6 Hz,
4J(H,H) =
2.1 Hz, 1Har, H-6), 8.13 (s, 1H, C=NH), 7.84 (d, 3J(H,H) = 7.9 Hz, 1Har, H-4’), 7.79 (d,
3J(H,H) =
7.9 Hz, 1Har, H-7’), 7.73 (ddd, 3J(H,H) = 0.5 Hz,
3J(H,H) = 2.1 Hz,
3J(H,H) = 8.2 Hz,1Har, H-3), 7.48
(d, 3J(H,H) = 4.8, 1Har, H-4), 7.31 (td,
3J(H,H) = 1.3 Hz,
3J(H,H) = 8.0 Hz, 1Har, H-5’ or H-6’), 7.17 –
7.10 (sm, 1Har, H-6’ or H-5’), 2.66 (q, 3J(H,H) = 7.7 Hz, 2H, CH2CH3), 1.21 (t,
3J(H,H) = 7.7 Hz, 3H,
CH2CH3).
13C-NMR (126 MHz, DMSO-d6): 166.99 (Cq,ar, C-2’), 150.82 (Cq,ar, C-2), 148.93 (C-Har, C-6), 139.41
(Cq,ar, C-5), 135.98 (C-Har, C-4), 125.95 (C-Har, C-5’), 121.80 (C-Har, C-6’), 121.49 (C-Har, C-7’),
119.04 (C-Har, C-4’), 25.17 (CH2CH3), 15.07 (CH2CH3) – the signals for HC=N, C-3, C-3’a, C-7’a
were not visible.
Anal. Calcd. for C15H14N4S: C: 63.80; H: 5.00; N: 19.84. Found: C: 63.47; H: 4.886; N: 19.81.
Preparation of the acetaniline hydrazino-benzothiazole 2-(1-(2-(1’,3’-benzothiazol-2’-
yl)hydrazine-1-ylidene)ethyl)aniline (V-d)
The reaction of 2-aceto-anilin (0.10 mL, 1.21 mmol) with
2-hydrazino-benzothiazole (200 mg, 1.21 mmol) in
ethanolic solution under acetic acid catalysis delivered the
product as a greyish brownish solid after recrystallization.
1H-NMR (500 MHz, DMSO-d6): δ = 11.62 (s, 1H, NH), 7.67 (d,
3J(H,H) = 7.9 Hz, 1Har, H-4’), 7.43
(dd, 4J(H,H) = 1.4 Hz,
3J(H,H) = 8.0 Hz, 1Har, H-7’), 7.30 – 7.19 (m, 2Har, H-3, H-5), 7.10 – 7.00 (m,
2Har, H-5’, H-6’), 6.82 (s, 2H, NH2), 6.76 (dd, 4J(H,H) = 1.3 Hz,
3J(H,H) = 8.2 Hz, 1Har, H-4), 6.61 –
6.51 (sm, 1Har, H-6), 2.43 (s, 3H, CH3).
13C-NMR (126 MHz, DMSO-d6): δ = 165.34 (Cq,ar, C-2’), 156.54 (Cq, CH3C=N), 147.38 (Cq,ar, CNH2,
C-1), 129.18 (C-Har, C-5), 129.03 (C-Har, C-5’), 126.22 (C-Har, C-3), 121.94 (C-Har, C-6’), 121.24 (C-
Har, C-7’), 118.07 (Cq,ar, C-2), 115.96 (C-Har, C-), 114.95 (C-Har, C-4), 114.07 (C-Har, C-4’), 15.67
(CH3). The signals for C-3’a and C-7’a were not detectable.
Purity of the compound was determined with HPLC MS to be ≥ 95% (m/z calculated for [M]: 282.36,
found 283.1 for [M + H]+).
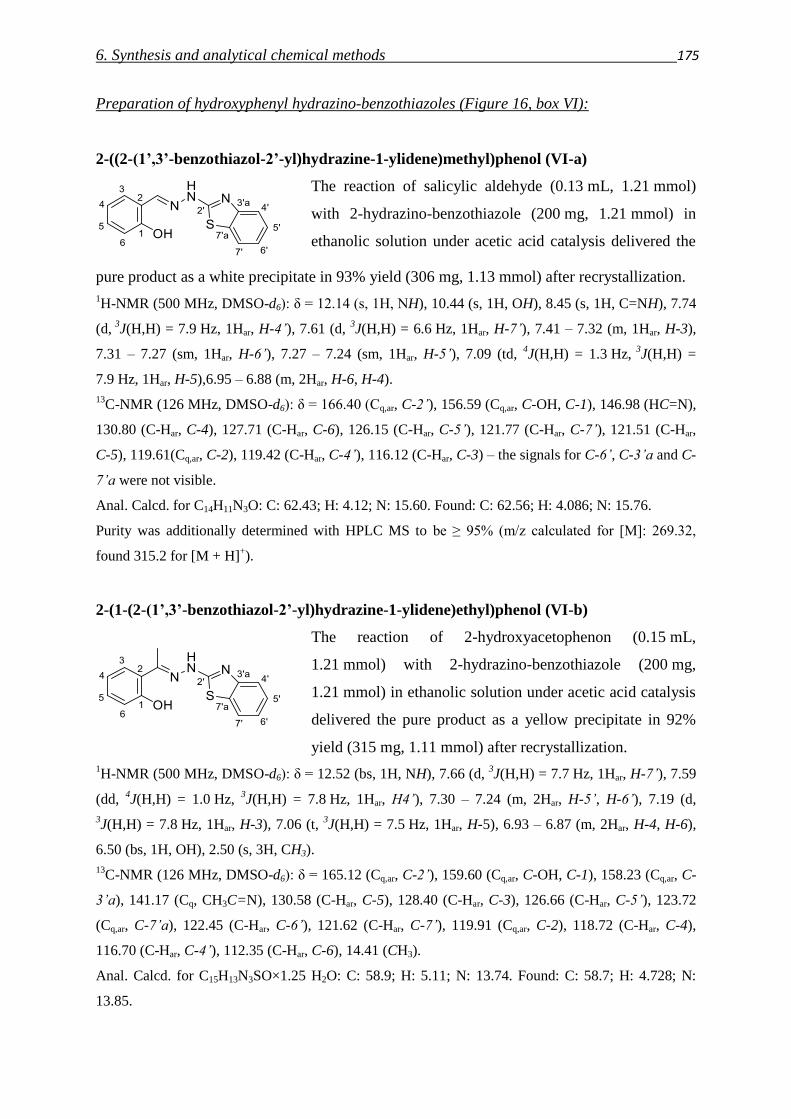
6. Synthesis and analytical chemical methods 175
Preparation of hydroxyphenyl hydrazino-benzothiazoles (Figure 16, box VI):
2-((2-(1’,3’-benzothiazol-2’-yl)hydrazine-1-ylidene)methyl)phenol (VI-a)
The reaction of salicylic aldehyde (0.13 mL, 1.21 mmol)
with 2-hydrazino-benzothiazole (200 mg, 1.21 mmol) in
ethanolic solution under acetic acid catalysis delivered the
pure product as a white precipitate in 93% yield (306 mg, 1.13 mmol) after recrystallization.
1H-NMR (500 MHz, DMSO-d6): δ = 12.14 (s, 1H, NH), 10.44 (s, 1H, OH), 8.45 (s, 1H, C=NH), 7.74
(d, 3
J(H,H) = 7.9 Hz, 1Har, H-4’), 7.61 (d, 3J(H,H) = 6.6 Hz, 1Har, H-7’), 7.41 – 7.32 (m, 1Har, H-3),
7.31 – 7.27 (sm, 1Har, H-6’), 7.27 – 7.24 (sm, 1Har, H-5’), 7.09 (td, 4J(H,H) = 1.3 Hz,
3J(H,H) =
7.9 Hz, 1Har, H-5),6.95 – 6.88 (m, 2Har, H-6, H-4).
13C-NMR (126 MHz, DMSO-d6): δ = 166.40 (Cq,ar, C-2’), 156.59 (Cq,ar, C-OH, C-1), 146.98 (HC=N),
130.80 (C-Har, C-4), 127.71 (C-Har, C-6), 126.15 (C-Har, C-5’), 121.77 (C-Har, C-7’), 121.51 (C-Har,
C-5), 119.61(Cq,ar, C-2), 119.42 (C-Har, C-4’), 116.12 (C-Har, C-3) – the signals for C-6’, C-3’a and C-
7’a were not visible.
Anal. Calcd. for C14H11N3O: C: 62.43; H: 4.12; N: 15.60. Found: C: 62.56; H: 4.086; N: 15.76.
Purity was additionally determined with HPLC MS to be ≥ 95% (m/z calculated for [M]: 269.32,
found 315.2 for [M + H]+).
2-(1-(2-(1’,3’-benzothiazol-2’-yl)hydrazine-1-ylidene)ethyl)phenol (VI-b)
The reaction of 2-hydroxyacetophenon (0.15 mL,
1.21 mmol) with 2-hydrazino-benzothiazole (200 mg,
1.21 mmol) in ethanolic solution under acetic acid catalysis
delivered the pure product as a yellow precipitate in 92%
yield (315 mg, 1.11 mmol) after recrystallization.
1H-NMR (500 MHz, DMSO-d6): δ = 12.52 (bs, 1H, NH), 7.66 (d,
3J(H,H) = 7.7 Hz, 1Har, H-7’), 7.59
(dd, 4J(H,H) = 1.0 Hz,
3J(H,H) = 7.8 Hz, 1Har, H4’), 7.30 – 7.24 (m, 2Har, H-5’, H-6’), 7.19 (d,
3J(H,H) = 7.8 Hz, 1Har, H-3), 7.06 (t,
3J(H,H) = 7.5 Hz, 1Har, H-5), 6.93 – 6.87 (m, 2Har, H-4, H-6),
6.50 (bs, 1H, OH), 2.50 (s, 3H, CH3).
13C-NMR (126 MHz, DMSO-d6): δ = 165.12 (Cq,ar, C-2’), 159.60 (Cq,ar, C-OH, C-1), 158.23 (Cq,ar, C-
3’a), 141.17 (Cq, CH3C=N), 130.58 (C-Har, C-5), 128.40 (C-Har, C-3), 126.66 (C-Har, C-5’), 123.72
(Cq,ar, C-7’a), 122.45 (C-Har, C-6’), 121.62 (C-Har, C-7’), 119.91 (Cq,ar, C-2), 118.72 (C-Har, C-4),
116.70 (C-Har, C-4’), 112.35 (C-Har, C-6), 14.41 (CH3).
Anal. Calcd. for C15H13N3SO×1.25 H2O: C: 58.9; H: 5.11; N: 13.74. Found: C: 58.7; H: 4.728; N:
13.85.
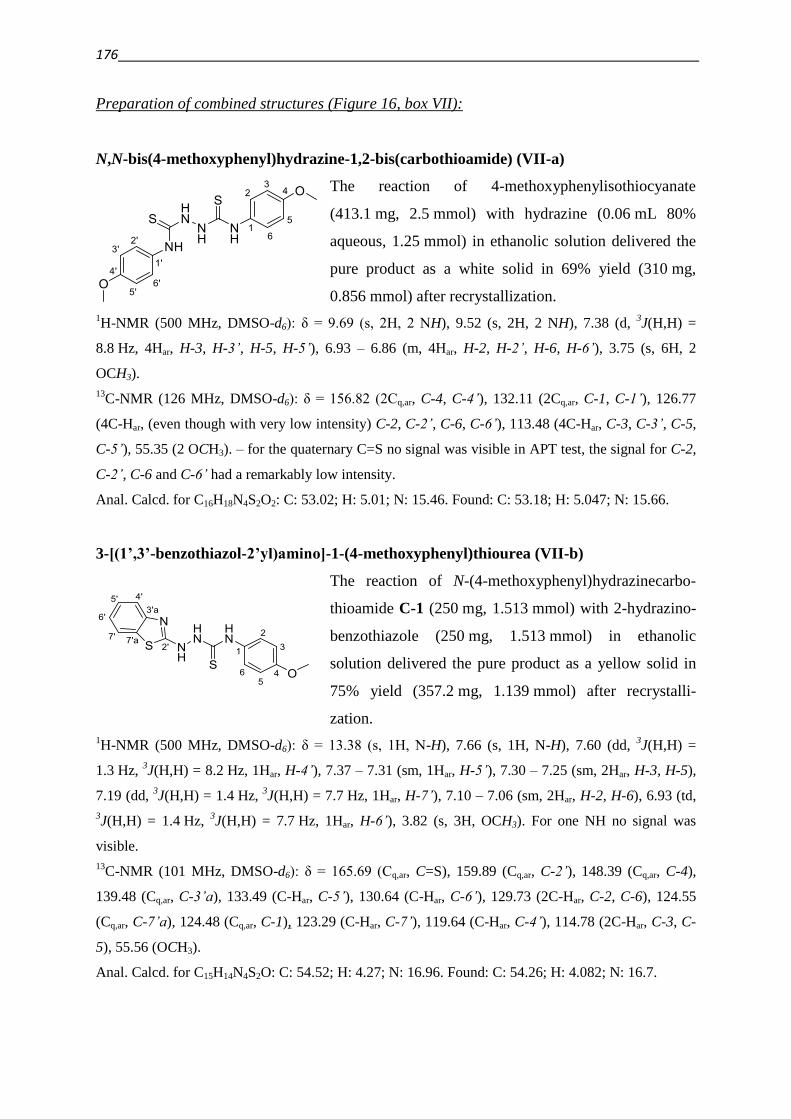
176
Preparation of combined structures (Figure 16, box VII):
N,N-bis(4-methoxyphenyl)hydrazine-1,2-bis(carbothioamide) (VII-a)
The reaction of 4-methoxyphenylisothiocyanate
(413.1 mg, 2.5 mmol) with hydrazine (0.06 mL 80%
aqueous, 1.25 mmol) in ethanolic solution delivered the
pure product as a white solid in 69% yield (310 mg,
0.856 mmol) after recrystallization.
1H-NMR (500 MHz, DMSO-d6): δ = 9.69 (s, 2H, 2 NH), 9.52 (s, 2H, 2 NH), 7.38 (d,
3J(H,H) =
8.8 Hz, 4Har, H-3, H-3’, H-5, H-5’), 6.93 – 6.86 (m, 4Har, H-2, H-2’, H-6, H-6’), 3.75 (s, 6H, 2
OCH3).
13C-NMR (126 MHz, DMSO-d6): δ = 156.82 (2Cq,ar, C-4, C-4’), 132.11 (2Cq,ar, C-1, C-1’), 126.77
(4C-Har, (even though with very low intensity) C-2, C-2’, C-6, C-6’), 113.48 (4C-Har, C-3, C-3’, C-5,
C-5’), 55.35 (2 OCH3). – for the quaternary C=S no signal was visible in APT test, the signal for C-2,
C-2’, C-6 and C-6’ had a remarkably low intensity.
Anal. Calcd. for C16H18N4S2O2: C: 53.02; H: 5.01; N: 15.46. Found: C: 53.18; H: 5.047; N: 15.66.
3-[(1’,3’-benzothiazol-2’yl)amino]-1-(4-methoxyphenyl)thiourea (VII-b)
The reaction of N-(4-methoxyphenyl)hydrazinecarbo-
thioamide C-1 (250 mg, 1.513 mmol) with 2-hydrazino-
benzothiazole (250 mg, 1.513 mmol) in ethanolic
solution delivered the pure product as a yellow solid in
75% yield (357.2 mg, 1.139 mmol) after recrystalli-
zation.
1H-NMR (500 MHz, DMSO-d6): δ = 13.38 (s, 1H, N-H), 7.66 (s, 1H, N-H), 7.60 (dd,
3J(H,H) =
1.3 Hz, 3J(H,H) = 8.2 Hz, 1Har, H-4’), 7.37 – 7.31 (sm, 1Har, H-5’), 7.30 – 7.25 (sm, 2Har, H-3, H-5),
7.19 (dd, 3J(H,H) = 1.4 Hz,
3J(H,H) = 7.7 Hz, 1Har, H-7’), 7.10 – 7.06 (sm, 2Har, H-2, H-6), 6.93 (td,
3J(H,H) = 1.4 Hz,
3J(H,H) = 7.7 Hz, 1Har, H-6’), 3.82 (s, 3H, OCH3). For one NH no signal was
visible.
13C-NMR (101 MHz, DMSO-d6): δ = 165.69 (Cq,ar, C=S), 159.89 (Cq,ar, C-2’), 148.39 (Cq,ar, C-4),
139.48 (Cq,ar, C-3’a), 133.49 (C-Har, C-5’), 130.64 (C-Har, C-6’), 129.73 (2C-Har, C-2, C-6), 124.55
(Cq,ar, C-7’a), 124.48 (Cq,ar, C-1), 123.29 (C-Har, C-7’), 119.64 (C-Har, C-4’), 114.78 (2C-Har, C-3, C-
5), 55.56 (OCH3).
Anal. Calcd. for C15H14N4S2O: C: 54.52; H: 4.27; N: 16.96. Found: C: 54.26; H: 4.082; N: 16.7.
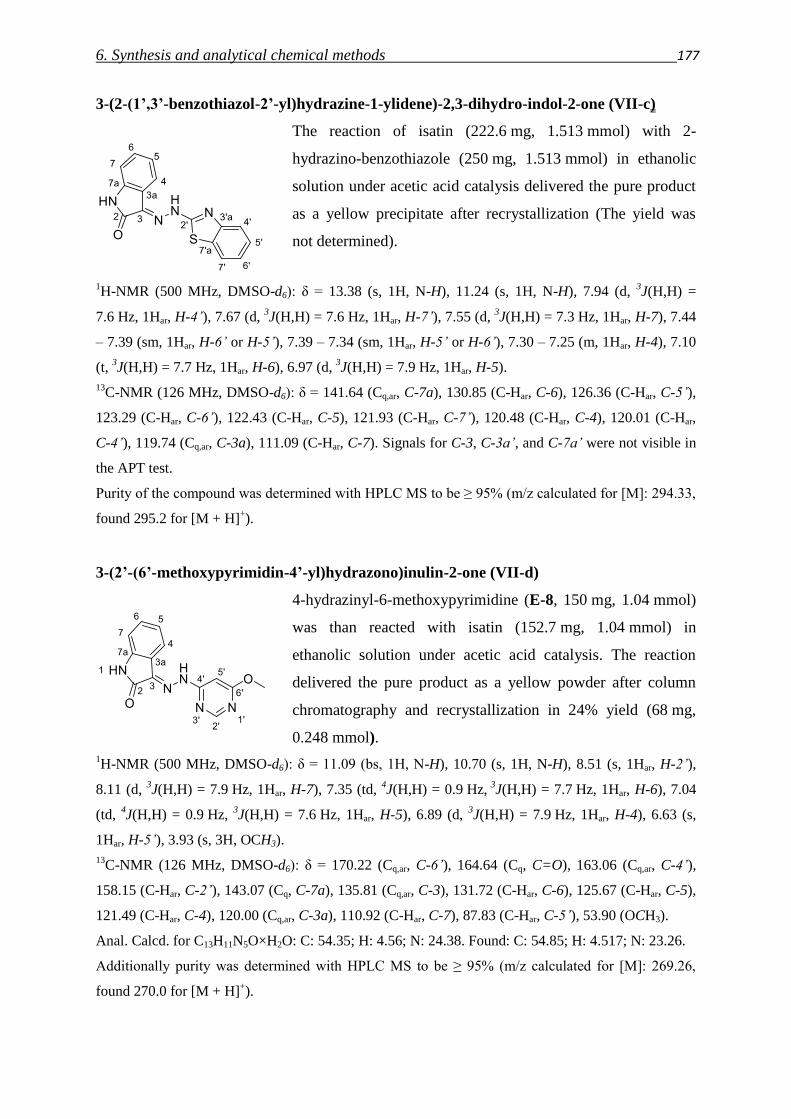
6. Synthesis and analytical chemical methods 177
3-(2-(1’,3’-benzothiazol-2’-yl)hydrazine-1-ylidene)-2,3-dihydro-indol-2-one (VII-c)
The reaction of isatin (222.6 mg, 1.513 mmol) with 2-
hydrazino-benzothiazole (250 mg, 1.513 mmol) in ethanolic
solution under acetic acid catalysis delivered the pure product
as a yellow precipitate after recrystallization (The yield was
not determined).
1H-NMR (500 MHz, DMSO-d6): δ = 13.38 (s, 1H, N-H), 11.24 (s, 1H, N-H), 7.94 (d,
3J(H,H) =
7.6 Hz, 1Har, H-4’), 7.67 (d, 3J(H,H) = 7.6 Hz, 1Har, H-7’), 7.55 (d,
3J(H,H) = 7.3 Hz, 1Har, H-7), 7.44
– 7.39 (sm, 1Har, H-6’ or H-5’), 7.39 – 7.34 (sm, 1Har, H-5’ or H-6’), 7.30 – 7.25 (m, 1Har, H-4), 7.10
(t, 3J(H,H) = 7.7 Hz, 1Har, H-6), 6.97 (d,
3J(H,H) = 7.9 Hz, 1Har, H-5).
13C-NMR (126 MHz, DMSO-d6): δ = 141.64 (Cq,ar, C-7a), 130.85 (C-Har, C-6), 126.36 (C-Har, C-5’),
123.29 (C-Har, C-6’), 122.43 (C-Har, C-5), 121.93 (C-Har, C-7’), 120.48 (C-Har, C-4), 120.01 (C-Har,
C-4’), 119.74 (Cq,ar, C-3a), 111.09 (C-Har, C-7). Signals for C-3, C-3a’, and C-7a’ were not visible in
the APT test.
Purity of the compound was determined with HPLC MS to be ≥ 95% (m/z calculated for [M]: 294.33,
found 295.2 for [M + H]+).
3-(2’-(6’-methoxypyrimidin-4’-yl)hydrazono)inulin-2-one (VII-d)
4-hydrazinyl-6-methoxypyrimidine (E-8, 150 mg, 1.04 mmol)
was than reacted with isatin (152.7 mg, 1.04 mmol) in
ethanolic solution under acetic acid catalysis. The reaction
delivered the pure product as a yellow powder after column
chromatography and recrystallization in 24% yield (68 mg,
0.248 mmol).
1H-NMR (500 MHz, DMSO-d6): δ = 11.09 (bs, 1H, N-H), 10.70 (s, 1H, N-H), 8.51 (s, 1Har, H-2’),
8.11 (d, 3J(H,H) = 7.9 Hz, 1Har, H-7), 7.35 (td,
4J(H,H) = 0.9 Hz,
3J(H,H) = 7.7 Hz, 1Har, H-6), 7.04
(td, 4J(H,H) = 0.9 Hz,
3J(H,H) = 7.6 Hz, 1Har, H-5), 6.89 (d,
3J(H,H) = 7.9 Hz, 1Har, H-4), 6.63 (s,
1Har, H-5’), 3.93 (s, 3H, OCH3).
13C-NMR (126 MHz, DMSO-d6): δ = 170.22 (Cq,ar, C-6’), 164.64 (Cq, C=O), 163.06 (Cq,ar, C-4’),
158.15 (C-Har, C-2’), 143.07 (Cq, C-7a), 135.81 (Cq,ar, C-3), 131.72 (C-Har, C-6), 125.67 (C-Har, C-5),
121.49 (C-Har, C-4), 120.00 (Cq,ar, C-3a), 110.92 (C-Har, C-7), 87.83 (C-Har, C-5’), 53.90 (OCH3).
Anal. Calcd. for C13H11N5O×H2O: C: 54.35; H: 4.56; N: 24.38. Found: C: 54.85; H: 4.517; N: 23.26.
Additionally purity was determined with HPLC MS to be ≥ 95% (m/z calculated for [M]: 269.26,
found 270.0 for [M + H]+).
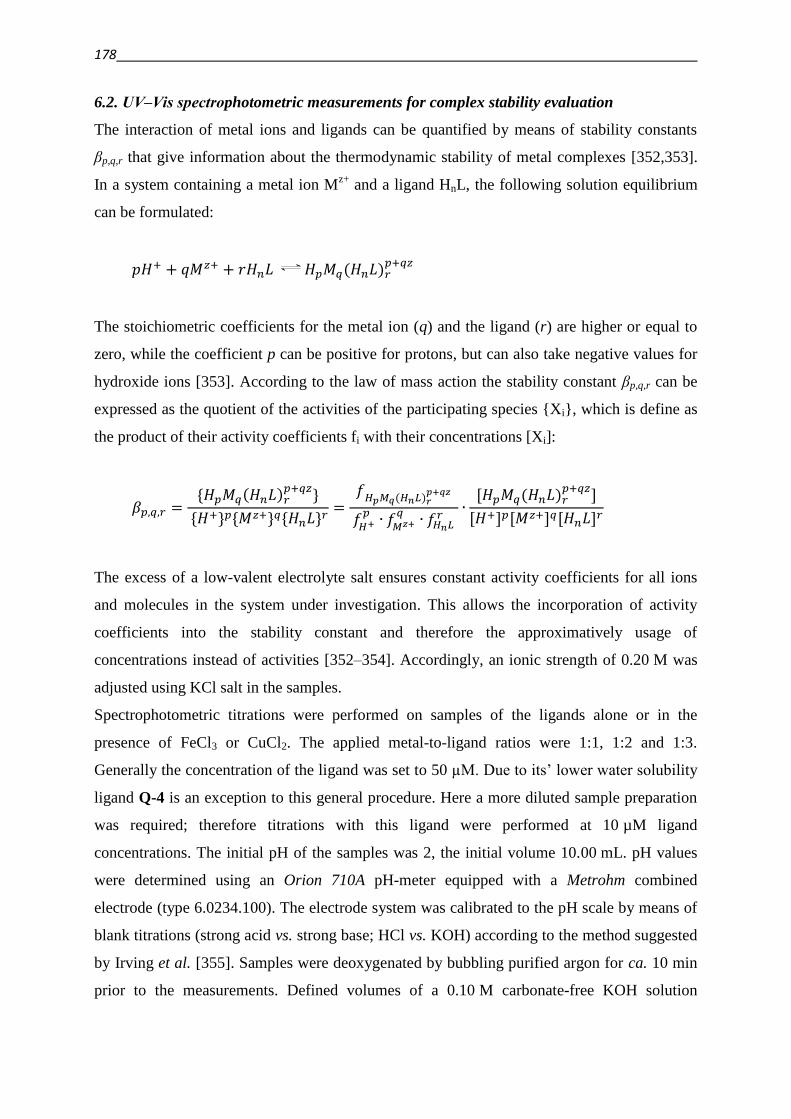
178
6.2. UV‒Vis spectrophotometric measurements for complex stability evaluation
The interaction of metal ions and ligands can be quantified by means of stability constants
βp,q,r that give information about the thermodynamic stability of metal complexes [352,353].
In a system containing a metal ion Mz+
and a ligand HnL, the following solution equilibrium
can be formulated:
𝑝𝐻+ + 𝑞𝑀𝑧+ + 𝑟𝐻𝑛𝐿 𝐻𝑝𝑀𝑞(𝐻𝑛𝐿)𝑟𝑝+𝑞𝑧
The stoichiometric coefficients for the metal ion (q) and the ligand (r) are higher or equal to
zero, while the coefficient p can be positive for protons, but can also take negative values for
hydroxide ions [353]. According to the law of mass action the stability constant βp,q,r can be
expressed as the quotient of the activities of the participating species {Xi}, which is define as
the product of their activity coefficients fi with their concentrations [Xi]:
𝛽𝑝,𝑞,𝑟 ={𝐻𝑝𝑀𝑞(𝐻𝑛𝐿)𝑟
𝑝+𝑞𝑧}
{𝐻+}𝑝{𝑀𝑧+}𝑞{𝐻𝑛𝐿}𝑟=𝑓𝐻𝑝𝑀𝑞(𝐻𝑛𝐿)𝑟
𝑝+𝑞𝑧
𝑓𝐻+𝑝 ∙ 𝑓
𝑀𝑧+𝑞 ∙ 𝑓𝐻𝑛𝐿
𝑟 ∙[𝐻𝑝𝑀𝑞(𝐻𝑛𝐿)𝑟
𝑝+𝑞𝑧]
[𝐻+]𝑝[𝑀𝑧+]𝑞[𝐻𝑛𝐿]𝑟
The excess of a low-valent electrolyte salt ensures constant activity coefficients for all ions
and molecules in the system under investigation. This allows the incorporation of activity
coefficients into the stability constant and therefore the approximatively usage of
concentrations instead of activities [352–354]. Accordingly, an ionic strength of 0.20 M was
adjusted using KCl salt in the samples.
Spectrophotometric titrations were performed on samples of the ligands alone or in the
presence of FeCl3 or CuCl2. The applied metal-to-ligand ratios were 1:1, 1:2 and 1:3.
Generally the concentration of the ligand was set to 50 µM. Due to its’ lower water solubility
ligand Q-4 is an exception to this general procedure. Here a more diluted sample preparation
was required; therefore titrations with this ligand were performed at 10 µM ligand
concentrations. The initial pH of the samples was 2, the initial volume 10.00 mL. pH values
were determined using an Orion 710A pH-meter equipped with a Metrohm combined
electrode (type 6.0234.100). The electrode system was calibrated to the pH scale by means of
blank titrations (strong acid vs. strong base; HCl vs. KOH) according to the method suggested
by Irving et al. [355]. Samples were deoxygenated by bubbling purified argon for ca. 10 min
prior to the measurements. Defined volumes of a 0.10 M carbonate-free KOH solution
6. Synthesis and analytical chemical methods 179
containing 0.10 M KCl were applied to the sample using a Metrohm 665 Dosimat burette until
a pH of 11.5 was reached. The reaction vial was thermostated to 25.0 ± 0.1 oC and kept under
argon atmosphere.
In case of ligand IV-b additional samples were prepared for the 1:1 Fe (III) to ligand ratio at
lower pH values. In this individual samples KCl was partially or completely replaced by HCl,
and pH values in the range between 0.7 and 2.0 were calculated from the HCl content.
In the evaluation of the equilibrium model 𝑝𝐻+ + 𝑞𝑀𝑧+ + 𝑟𝐻𝑛𝐿 𝐻𝑝𝑀𝑞(𝐻𝑛𝐿)𝑟𝑝+𝑞𝑧 for the
calculation of the stability constants βp,q,r it is good practice to analyze the two subsystems, in
which one or the other stoichiometric coefficient is set to zero. βp,q,0, in which r is zero,
describes the acid-base equilibria for the metal ion, βp,0,r the one for the free ligand. Therefore
from the latter system, the ligand’s pKa values can be determined. In case of the metal
hydroxido species, literature data was used [356].
Spectral changes upon addition of the base were recorded in the wavelength interval between
200 and 800 nm using a Hewlett Packard 8452A diode array spectrophotometer. Quartz glass
cuvettes with path lengths (l) of 1 or 2 cm were used (Hellma), depending on the molar
absorptivity (ε) of the applied ligand samples. During one titration spectra of approximately
30 samples were measured.
According to the Lambert-Beer law the absorption A of the sample (s) at a wavelength (λ) is
composed of the additive contributions of each single species Xi that is present in the solution
[353]:
𝐴𝑠,𝜆 =∑𝐴𝑖,𝑠,𝜆
𝑁
𝑖=1
= 𝑙 ∙∑𝜀𝑖,𝜆 ∙ 𝑐𝑖,𝑠
𝑁
𝑖=1
With the help of the program PSEQUAD the molar absorbance spectra of the individual
species Xi were calculated on the basis of deconvolution of the measured spectra. This is done
in two steps by first solving the matrices of data describing the equilibrium system through
the mass-balance equations at the applied pH values for the unknown free concentrations. The
second step includes refinement and minimizing steps in order to obtain the formation
constants βp,q,r and molar absorptivity values εi that best fit to the measured data and the
180
applied equilibrium model [357]. These calculations were done by Professor Éva A. Enyedy
(Department of Inorganic and Analytical Chemistry, University of Szeged, Hungary).
With the help of the computer program MEDUSA [358] the calculated data can be used to
predict further chemical equilibrium and distribution diagrams at given conditions.
βp,q,r is the overall stability constant, which is also called cumulative stability constant, since it
can be formulated as the product of stepwise stability constants [359]. For simplicity reasons
the following considerations are given for an example system of a ligand like Q-1, which
coordinates to the metal ion in its deprotonated form L-1
. With ironIII
(z = 3) three putative
complexes can be formed, which are described by the following equations:
𝑀𝑧+ + 𝐿−1 [𝑀𝐿](𝑧−1) with 𝐾1 =[[𝑀𝐿](𝑧−1)]
[𝑀𝑧+][𝐿−1]
[𝑀𝐿](𝑧−1) + 𝐿−1 [𝑀𝐿2](𝑧−2) with 𝐾2 =
[[𝑀𝐿2](𝑧−2)]
[[𝑀𝐿](𝑧−1)][𝐿−1]
and 𝛽[𝑀𝐿2](𝑧−2) = 𝐾1𝐾2 =[[𝑀𝐿2]
(𝑧−2)]
[𝑀𝑧+][𝐿−1]2
[𝑀𝐿2](𝑧−2) + 𝐿−1 [𝑀𝐿3]
(𝑧−3) with 𝐾3 =[[𝑀𝐿3]
(𝑧−3)]
[[𝑀𝐿2](𝑧−2)][𝐿−1]
and 𝛽[𝑀𝐿3](𝑧−3) = 𝐾1𝐾2𝐾3 =[[𝑀𝐿3]
(𝑧−3)]
[𝑀𝑧+][𝐿−1]3
Concentrations and distributions of the different species can be calculated based on the total
metal ion concentration [Mz+
]Σ:
[𝑀𝑧+]Σ = [𝑀𝑧+] + [[𝑀𝐿](𝑧−1)] + [[𝑀𝐿2]
(𝑧−2)] + [[𝑀𝐿3](𝑧−3)]
applying the above listed equilibria this can be written as:
[𝑀𝑧+]Σ = [𝑀𝑧+] ∙ {1 + 𝐾1[𝐿] + 𝐾1 ∙ 𝐾2[𝐿]
2 + 𝐾1 ∙ 𝐾2 ∙ 𝐾3[𝐿]3} = [𝑀𝑧+] ∙ ξ
the expression within the curly brackets can be summarized in ξ and is defined as the
reciprocal fraction of a species, which was not converted into another one. Applying these
formulas, the free metal ion concentration can be described as
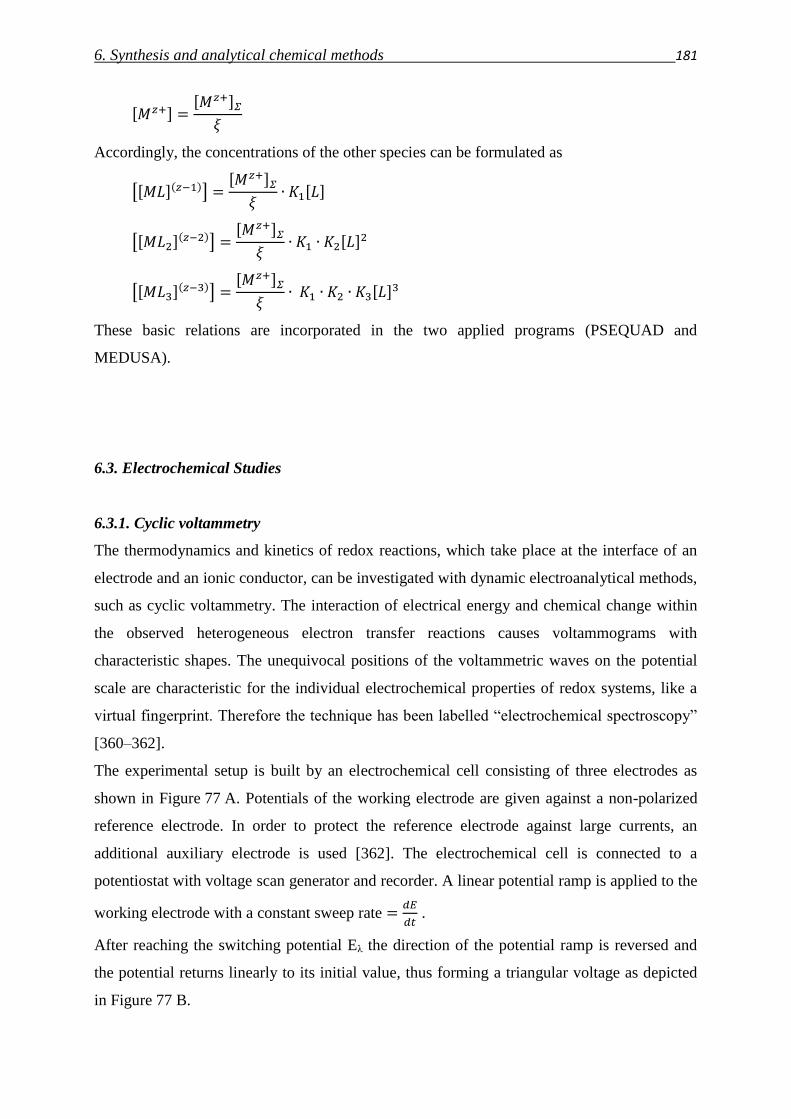
6. Synthesis and analytical chemical methods 181
[𝑀𝑧+] =[𝑀𝑧+]𝛴𝜉
Accordingly, the concentrations of the other species can be formulated as
[[𝑀𝐿](𝑧−1)] =[𝑀𝑧+]𝛴𝜉
∙ 𝐾1[𝐿]
[[𝑀𝐿2](𝑧−2)] =
[𝑀𝑧+]𝛴𝜉
∙ 𝐾1 ∙ 𝐾2[𝐿]2
[[𝑀𝐿3](𝑧−3)] =
[𝑀𝑧+]𝛴𝜉
∙ 𝐾1 ∙ 𝐾2 ∙ 𝐾3[𝐿]3
These basic relations are incorporated in the two applied programs (PSEQUAD and
MEDUSA).
6.3. Electrochemical Studies
6.3.1. Cyclic voltammetry
The thermodynamics and kinetics of redox reactions, which take place at the interface of an
electrode and an ionic conductor, can be investigated with dynamic electroanalytical methods,
such as cyclic voltammetry. The interaction of electrical energy and chemical change within
the observed heterogeneous electron transfer reactions causes voltammograms with
characteristic shapes. The unequivocal positions of the voltammetric waves on the potential
scale are characteristic for the individual electrochemical properties of redox systems, like a
virtual fingerprint. Therefore the technique has been labelled “electrochemical spectroscopy”
[360–362].
The experimental setup is built by an electrochemical cell consisting of three electrodes as
shown in Figure 77 A. Potentials of the working electrode are given against a non-polarized
reference electrode. In order to protect the reference electrode against large currents, an
additional auxiliary electrode is used [362]. The electrochemical cell is connected to a
potentiostat with voltage scan generator and recorder. A linear potential ramp is applied to the
working electrode with a constant sweep rate =𝑑𝐸
𝑑𝑡 .
After reaching the switching potential Eλ the direction of the potential ramp is reversed and
the potential returns linearly to its initial value, thus forming a triangular voltage as depicted
in Figure 77 B.
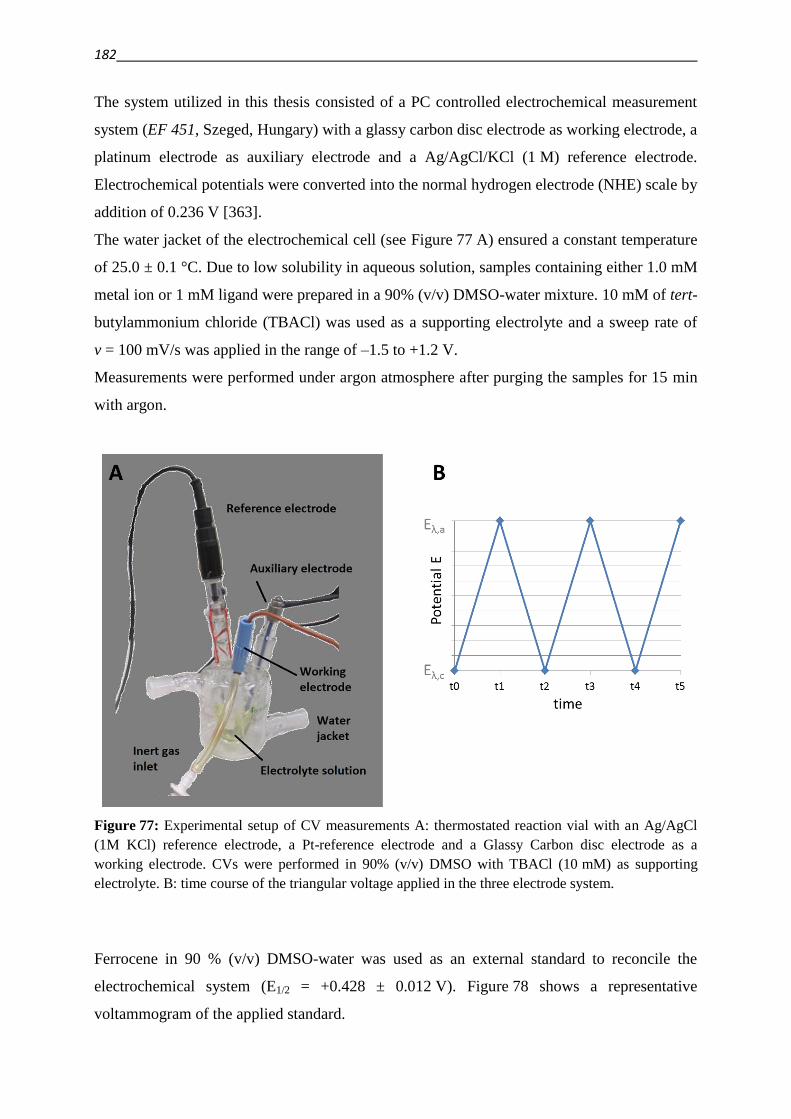
182
The system utilized in this thesis consisted of a PC controlled electrochemical measurement
system (EF 451, Szeged, Hungary) with a glassy carbon disc electrode as working electrode, a
platinum electrode as auxiliary electrode and a Ag/AgCl/KCl (1 M) reference electrode.
Electrochemical potentials were converted into the normal hydrogen electrode (NHE) scale by
addition of 0.236 V [363].
The water jacket of the electrochemical cell (see Figure 77 A) ensured a constant temperature
of 25.0 ± 0.1 °C. Due to low solubility in aqueous solution, samples containing either 1.0 mM
metal ion or 1 mM ligand were prepared in a 90% (v/v) DMSO-water mixture. 10 mM of tert-
butylammonium chloride (TBACl) was used as a supporting electrolyte and a sweep rate of
v = 100 mV/s was applied in the range of –1.5 to +1.2 V.
Measurements were performed under argon atmosphere after purging the samples for 15 min
with argon.
Figure 77: Experimental setup of CV measurements A: thermostated reaction vial with an Ag/AgCl
(1M KCl) reference electrode, a Pt-reference electrode and a Glassy Carbon disc electrode as a
working electrode. CVs were performed in 90% (v/v) DMSO with TBACl (10 mM) as supporting
electrolyte. B: time course of the triangular voltage applied in the three electrode system.
Ferrocene in 90 % (v/v) DMSO-water was used as an external standard to reconcile the
electrochemical system (E1/2 = +0.428 ± 0.012 V). Figure 78 shows a representative
voltammogram of the applied standard.
6. Synthesis and analytical chemical methods 183
At the initial potential (A) no electrochemical processes take place, yet [361]. Changing the
potential (from A to B), only capacitive currents flow, which are caused by the formation of
the Helmholtz double layer without charge transfer between electrode and electrolyte [362].
As soon as the electrochemical double layer is formed, the oxidation takes place (B), and a
Faradaic current occurs based on the heterogeneous charge transfer at the phase boundary
[362].
𝑋𝑟𝑒𝑑 𝑋𝑜𝑥 + 𝑧 𝑒−
The current I flowing as a result of this reaction with the transfer of z electrons is “diffusion
controlled”: It is proportional to the concentration gradient of the produced oxidized species
Xox at the electrode surface (x=0):
I = zFA ∙ 𝐷[𝑋𝑜𝑥] (𝜕[𝑋𝑜𝑥]
𝜕𝑥)𝑥=0
= 𝑗[𝑋𝑟𝑒𝑑] ∙ 𝑧𝐹𝐴
with F being the Faraday constant, A being the electrode surface and D being the diffusion
coefficient. The charge flux at this reaction j[X] is proportional to the concentration gradient at
the electrode surface [362]:
𝑗[𝑋𝑟𝑒𝑑] = −𝐷[𝑋𝑟𝑒𝑑] (𝜕[𝑋𝑟𝑒𝑑]
𝜕𝑥)𝑥=0
= 𝐷[𝑋𝑜𝑥] (𝜕[𝑋𝑜𝑥]
𝜕𝑥)𝑥=0
Therefore the current can be expressed as
I = 𝑗[𝑋𝑟𝑒𝑑] ∙ 𝑧𝐹𝐴.
The oxidation of the reduced species takes place, with its peak in position (C) in Figure 78. As
a consequence of the occurring reaction, the concentration of the reduced species at the
electrode surface decreases following the Nernst equation [361]:
𝐸 = 𝐸° −𝑅𝑇
𝑧𝐹∙ 𝑙𝑛[𝑋𝑟𝑒𝑑]
[𝑋𝑜𝑥]
This decrease in concentration results in a decrease of the diffusion dependent current, as seen
in the voltammogram from points (C) to (D). A slight increase in the current might be
observed from point (D) to the anodic switching potential Eλ,anodic, which is reached at point
(E) in Figure 78. This might indicate a new redox process – in aqueous solutions at 1.23 V
against NHE formation of O2 might be observed for example.
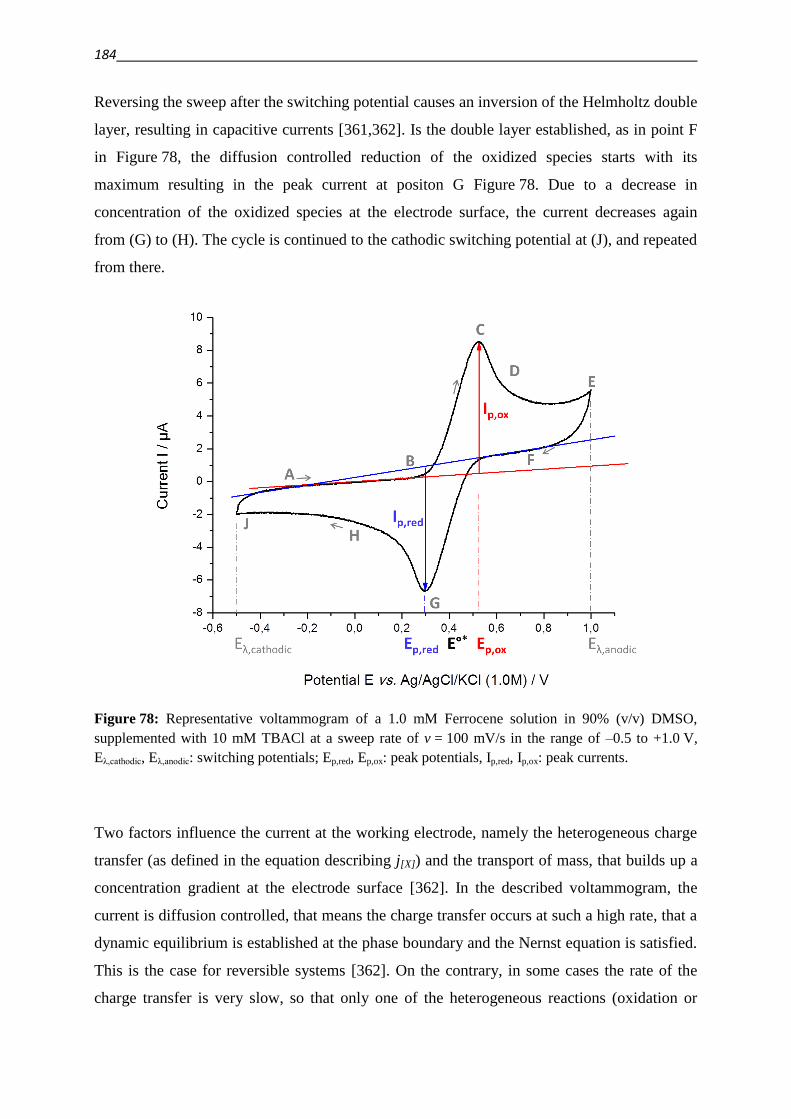
184
Reversing the sweep after the switching potential causes an inversion of the Helmholtz double
layer, resulting in capacitive currents [361,362]. Is the double layer established, as in point F
in Figure 78, the diffusion controlled reduction of the oxidized species starts with its
maximum resulting in the peak current at positon G Figure 78. Due to a decrease in
concentration of the oxidized species at the electrode surface, the current decreases again
from (G) to (H). The cycle is continued to the cathodic switching potential at (J), and repeated
from there.
Figure 78: Representative voltammogram of a 1.0 mM Ferrocene solution in 90% (v/v) DMSO,
supplemented with 10 mM TBACl at a sweep rate of v = 100 mV/s in the range of –0.5 to +1.0 V,
Eλ,cathodic, Eλ,anodic: switching potentials; Ep,red, Ep,ox: peak potentials, Ip,red, Ip,ox: peak currents.
Two factors influence the current at the working electrode, namely the heterogeneous charge
transfer (as defined in the equation describing j[X]) and the transport of mass, that builds up a
concentration gradient at the electrode surface [362]. In the described voltammogram, the
current is diffusion controlled, that means the charge transfer occurs at such a high rate, that a
dynamic equilibrium is established at the phase boundary and the Nernst equation is satisfied.
This is the case for reversible systems [362]. On the contrary, in some cases the rate of the
charge transfer is very slow, so that only one of the heterogeneous reactions (oxidation or
6. Synthesis and analytical chemical methods 185
reduction) can be measured. In that cases the current depends on this rate and is charge-
transfer controlled. These reactions are irreversible and the Nernst equation does not describe
these processes [362]. A third case can be distinguished, in which charge-transfer and
diffusion influence the measured current. In these reactions, which are termed “quasi-
reversible” the Nernst equation is approximately satisfied [362].
Correlating the described kinetics with observed experimental parameters, diagnostic criteria
could be identified for the characterization of electrochemical systems. For example the ratio
of anodic to cathodic peak currents has been found to be close to 1 for reversible processes
[360]. Also the half-peak potentials of a reversible process should have a distance of ΔE =
58 mV [361].
6.3.2. Oxidation of ascorbic acid (ASC) and glutathione (GSH)
The redox activity of compounds can also be investigated by monitoring reactions with
biologically relevant antioxidants. At pH 7.4 two powerful intracellular reducing agents are
glutathione (GSH) and ascorbate (ASC), with formals potential of the GSSG/GSH and the
dehydro-L-ascorbic acid/ASC redox pairs are -0.26 V and +0.05 V, respectively [255,256].
The changes in characteristic regions of the compounds’ spectra (especially those of metal
complexes) that occur upon reaction with the antioxidants were followed over time [89,263].
In order to address the reversibility of the observed reactions, hydrogen peroxide was added at
the end of the reaction with the antioxidants to re-oxidize the reduced products [89]. UV‒Vis
spectrophotometric measurements were performed under aseptic conditions using a Hewlett
Packard 8452A diode array spectrophotometer and a special, tightly closed tandem cuvette
(Hellma Tandem Cell, 238-QS, path length: 1 cm, Figure 79).
Figure 79: Tandem Cuvette used for GSH and ASC oxidation assay.
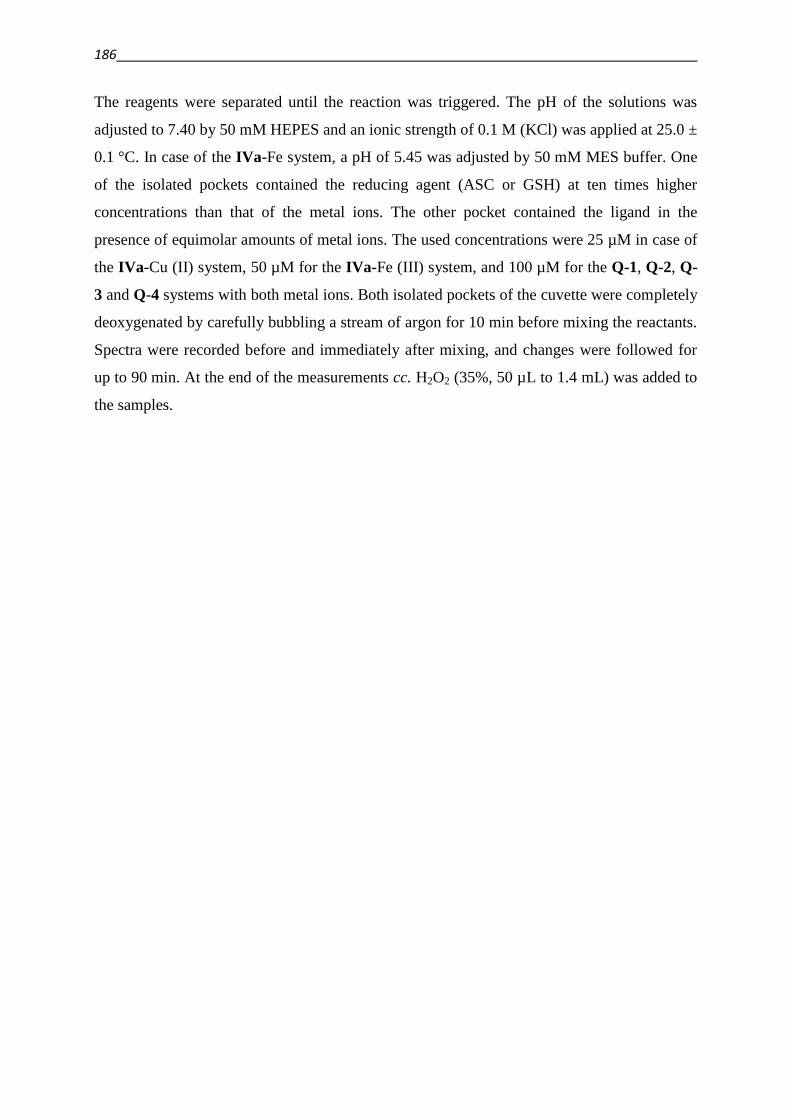
186
The reagents were separated until the reaction was triggered. The pH of the solutions was
adjusted to 7.40 by 50 mM HEPES and an ionic strength of 0.1 M (KCl) was applied at 25.0 ±
0.1 °C. In case of the IVa-Fe system, a pH of 5.45 was adjusted by 50 mM MES buffer. One
of the isolated pockets contained the reducing agent (ASC or GSH) at ten times higher
concentrations than that of the metal ions. The other pocket contained the ligand in the
presence of equimolar amounts of metal ions. The used concentrations were 25 µM in case of
the IVa-Cu (II) system, 50 µM for the IVa-Fe (III) system, and 100 µM for the Q-1, Q-2, Q-
3 and Q-4 systems with both metal ions. Both isolated pockets of the cuvette were completely
deoxygenated by carefully bubbling a stream of argon for 10 min before mixing the reactants.
Spectra were recorded before and immediately after mixing, and changes were followed for
up to 90 min. At the end of the measurements cc. H2O2 (35%, 50 µL to 1.4 mL) was added to
the samples.
7. List of Abbreviations 187
7. List of Abbreviations
6PGδL 6-phosphoglucono-δ-lactone
ABC ATP-binding-cassette
ADP Adenosine diphosphate
Akt1 threonine-protein kinase (PKB)
ASK1 apoptosis signal-regulating kinase-1
ATCC American tissue culture collection
ATP Adenosine triphosphate
Bad Bcl-2-associated death promoter
Bax Bcl-2-associated X protein
BCRP Breast Cancer Resistance Protein
bs NMR signal, broad singlet
Cat catalase
CDK2 Cyclin-dependent kinase 2
CHO Chinese Hamster ovary
CP ceruloplasmin
Cq NMR signal, quaternary carbon
Cq,ar NMR signal, quaternary aromatic carbon
CS collateral sensitivity
CTR1 copper transporter
d NMR signal, duplet
DCF Dichlorofluorescein
DCFDA 2’7’-Dichlorofluoresceindiacetate
DCF-H Dichlorofluorescin
dd NMR signal, duplet of duplets
ddd NMR signal, duplet of duplets of duplets
DMEM Dulbecco’s Modified Eagle Medium
DMSO dimethyl sulfoxide
188
DMT1 divalent metal transporter
DNA Deoxyribonucleic acid
dt NMR signal, duplet of triplets
DTP Developmental Therapeutics Program
DTT dithiothreitol
ECAR extracellular acidification rates
FACS Fluorescence-activated cell sorting
FBS fetal bovine serum
FPN1 ferroportin
G6P glucose-6-phosphate
G6PDH glucose-6-phosphate dehydrogenase
GPx glutathione peroxidase
GPx glutathione peroxidase
GR glutathione reductase
GRX glutaredoxin
GSH reduced glutathione
GS-SG oxidized glutathione
GSTπ Glutathione S-transferase π
HIF-1α Hypoxia-inducible factor 1-alpha
HSAB hard and soft acids and bases
IKK IκB-kinase
IRE-IRP iron-response element and iron-regulatory protein (1/2)
ISC iron sulfur cluster
IκB inhibitor of NFκB
J NMR signal, coupling constant
JNK c-Jun N-terminal kinase
Keap1 Kelch-like ECH-associated protein 1
m NMR signal, multiplet
MCX-I mitochondrial complex I
7. List of Abbreviations 189
MDR Multidrug Resistance
MRP1 Multidrug resistance-associated protein 1
MTFR mitotransferrin
mTOR mammalian target of rapamycin
MTT 3-(4,5-dimethylthiazol-2-yl)-2,5-diphenyl tetrazolium bromide
NAC N-acetylcysteine
NADP+ oxidized nicotinamide adenine dinucleotide phosphate
NADPH reduced nicotinamide adenine dinucleotide phosphate
NCI National Cancer Institute
NDRG1 N-myc downstream-regulated gene 1
NFκB nuclear factor κB
Nrf2 Nuclear factor (erythroid-derived 2)-like 2
OX oxidases
PBS phosphate buffered saline
PDK1 3’-phosphoinositide-dependent kinase-1
PG Plumbagin
P-gp P-glycoprotein
PI3K phosphatidylinositol-3-kinase
PI3K/AKT/mTOR Phosphatidylinositol-4,5-bisphosphate 3-kinase /
Protein kinase B (PKB) / mammalian target of rapamycin
PKC protein kinase C
PKD protein kinase D
PTEN phosphatidylinositol-3,4,5-trisphosphate 3-phosphatase
pyr pyruvate
q NMR signal, quartet
ROS reactive oxygen species
RPMI Roswell Park Memorial Institute medium,
RR Ribonucleotide reductase
s NMR signal, singlet
190
sm NMR signal, symmetrical multiplet
SNP single-nucleotide polymorphism
SOD superoxide dismutase
SR Selectivity ratio
STEAP3 six transmembrane epithelial antigen of the prostate 3 (ferrireductase)
t NMR signal, triplet
TBACl tert-butylammonium chloride
tBHP tert-butyl hydroperoxide
td NMR signal, triplet of duplets
tet-off tetracycline-repressible
Tf Transferrin
TfR transferrin receptor
TPx thioredoxin peroxidase
Trx thioredoxin
Trx-(SH)2 reduced thioredoxin
TrxR thioredoxin reductase
Trx-S2 oxidized thioredoxin
TSC thiosemicarbazone
8. Bibliography 191
8. Bibliography
[1] P. Chiba, G.F. Ecker, Inhibitors of ABC-type drug efflux pumps: an overview of the current
patent situation, Expert Opin. Ther. Pat. 14 (2004) 499–508. doi:10.1517/13543776.14.4.499.
[2] P. Boyle, B. Levin, International Agency for Research on Cancer., World cancer report 2008
2008, IARC Press, Lyon, 2008. http://site.ebrary.com/id/10306279 (accessed November 18,
2014).
[3] M.M. Gottesman, T. Fojo, S.E. Bates, MULTIDRUG RESISTANCE IN CANCER: ROLE OF
ATP-DEPENDENT TRANSPORTERS, Nat. Rev. Cancer. 2 (2002) 48–58.
doi:10.1038/nrc706.
[4] K. Aktories, U. Förstermann, F. Hofmann, K. Starke, Allgemeine und spezielle Pharmakologie
und Toxikologie, 9th ed., Elsevier, 2005.
[5] M.M. Gottesman, J. Ludwig, D. Xia, G. Szakacs, Defeating Drug Resistance in Cancer,
Discov. Med. 6 (2009) 18–23.
[6] L.A. Garraway, P.A. Jänne, Circumventing Cancer Drug Resistance in the Era of Personalized
Medicine, Cancer Discov. 2 (2012) 214–226. doi:10.1158/2159-8290.CD-12-0012.
[7] C. Bock, T. Lengauer, Managing drug resistance in cancer: lessons from HIV therapy, Nat.
Rev. Cancer. 12 (2012) 494–501. doi:10.1038/nrc3297.
[8] G.J. Schuurhuis, H.J. Broxterman, J.H. de Lange, H.M. Pinedo, T.H. van Heijningen, C.M.
Kuiper, et al., Early multidrug resistance, defined by changes in intracellular doxorubicin
distribution, independent of P-glycoprotein., Br. J. Cancer. 64 (1991) 857–861.
[9] G. Szakács, J.K. Paterson, J.A. Ludwig, C. Booth-Genthe, M.M. Gottesman, Targeting
multidrug resistance in cancer, Nat. Rev. Drug Discov. 5 (2006) 219–234.
doi:10.1038/nrd1984.
[10] B. Marquez, F. Van Bambeke, ABC multidrug transporters: target for modulation of drug
pharmacokinetics and drug-drug interactions, Curr. Drug Targets. 12 (2011) 600–620.
[11] O.H. Warburg, The Classic: The Chemical Constitution of Respiration Ferment, Clin. Orthop.
Relat. Res. 468 (2010) 2833–2839. doi:10.1007/s11999-010-1534-y.
[12] R.C. Lyon, J.S. Cohen, P.J. Faustino, F. Megnin, C.E. Myers, Glucose Metabolism in Drug-
sensitive and Drug-resistant Human Breast Cancer Cells Monitored by Magnetic Resonance
Spectroscopy, Cancer Res. 48 (1988) 870–877.
[13] M.-E. Harper, A. Antoniou, E. Villalobos-Menuey, A. Russo, R. Trauger, M. Vendemelio, et
al., Characterization of a novel metabolic strategy used by drug-resistant tumor cells, FASEB J.
Off. Publ. Fed. Am. Soc. Exp. Biol. 16 (2002) 1550–1557. doi:10.1096/fj.02-0541com.
[14] H.J. Broxterman, H.M. Pinedo, C.M. Kuiper, L.C. Kaptein, G.J. Schuurhuis, J. Lankelma,
Induction by verapamil of a rapid increase in ATP consumption in multidrug-resistant tumor
cells., FASEB J. 2 (1988) 2278–2282.
192
[15] H.J. Broxterman, H.M. Pinedo, C.M. Kuiper, G.J. Schuurhuis, J. Lankelma, Glycolysis in P-
glycoprotein-overexpressing human tumor cell lines Effects of resistance-modifying agents,
FEBS Lett. 247 (1989) 405–410. doi:10.1016/0014-5793(89)81380-8.
[16] E. Landwojtowicz, P. Nervi, A. Seelig, Real-Time Monitoring of P-Glycoprotein Activation in
Living Cells †, Biochemistry (Mosc.). 41 (2002) 8050–8057. doi:10.1021/bi025720s.
[17] E. Gatlik-Landwojtowicz, P. Äänismaa, A. Seelig, The Rate of P-Glycoprotein Activation
Depends on the Metabolic State of the Cell †, Biochemistry (Mosc.). 43 (2004) 14840–14851.
doi:10.1021/bi048761s.
[18] P.J. Thornalley, N. Rabbani, Glyoxalase in tumourigenesis and multidrug resistance, Semin.
Cell Dev. Biol. 22 (2011) 318–325. doi:10.1016/j.semcdb.2011.02.006.
[19] G.L. Semenza, HIF-1 mediates metabolic responses to intratumoral hypoxia and oncogenic
mutations, J. Clin. Invest. 123 (2013) 3664–3671. doi:10.1172/JCI67230.
[20] B. Zhivotovsky, S. Orrenius, The Warburg Effect returns to the cancer stage, Semin. Cancer
Biol. 19 (2009) 1–3. doi:10.1016/j.semcancer.2008.12.003.
[21] H.A. Burris, Overcoming acquired resistance to anticancer therapy: focus on the
PI3K/AKT/mTOR pathway, Cancer Chemother. Pharmacol. 71 (2013) 829–842.
doi:10.1007/s00280-012-2043-3.
[22] M. Wartenberg, F.C. Ling, M. Müschen, F. Klein, H. Acker, M. Gassmann, et al., Regulation
of the multidrug resistance transporter P-glycoprotein in multicellular tumor spheroids by
hypoxia-inducible factor (HIF-1) and reactive oxygen species, FASEB J. 17 (2003) 503–505.
[23] S. Doublier, D.C. Belisario, M. Polimeni, L. Annaratone, C. Riganti, E. Allia, et al., HIF-1
activation induces doxorubicin resistance in MCF7 3-D spheroids via P-glycoprotein
expression: a potential model of the chemo-resistance of invasive micropapillary carcinoma of
the breast, BMC Cancer. 12 (2012) 4.
[24] E. Wang, M.D. Lee, K.W. Dunn, Lysosomal accumulation of drugs in drug-sensitive MES-SA
but not multidrug-resistant MES-SA/Dx5 uterine sarcoma cells, J. Cell. Physiol. 184 (2000)
263–274. doi:10.1002/1097-4652(200008)184:2<263::AID-JCP15>3.0.CO;2-F.
[25] T. Yamagishi, S. Sahni, D.M. Sharp, A. Arvind, P.J. Jansson, D.R. Richardson, P-glycoprotein
Mediates Drug Resistance via a Novel Mechanism Involving Lysosomal Sequestration, J. Biol.
Chem. 288 (2013) 31761–31771. doi:10.1074/jbc.M113.514091.
[26] M. Dean, A. Rzhetsky, R. Allikmets, The Human ATP-Binding Cassette (ABC) Transporter
Superfamily, Genome Res. 11 (2001) 1156–1166. doi:10.1101/gr.184901.
[27] K. Dano, Active outward transport of daunomycin in resistant Ehrlich ascites tumor cells,
Biochim. Biophys. Acta. 323 (1973) 466–483.
[28] R.L. Juliano, V. Ling, A surface glycoprotein modulating drug permeability in Chinese hamster
ovary cell mutants, Biochim. Biophys. Acta. 455 (1976) 152–162.
8. Bibliography 193
[29] S.P. Cole, H.F. Downes, S.E. Mirski, D.J. Clements, Alterations in glutathione and glutathione-
related enzymes in a multidrug-resistant small cell lung cancer cell line, Mol. Pharmacol. 37
(1990) 192–197.
[30] S.P. Cole, G. Bhardwaj, J.H. Gerlach, J.E. Mackie, C.E. Grant, K.C. Almquist, et al.,
Overexpression of a transporter gene in a multidrug-resistant human lung cancer cell line,
Science. 258 (1992) 1650–1654.
[31] L.A. Doyle, W. Yang, L.V. Abruzzo, T. Krogmann, Y. Gao, A.K. Rishi, et al., A multidrug
resistance transporter from human MCF-7 breast cancer cells, Proc. Natl. Acad. Sci. 95 (1998)
15665–15670. doi:10.1073/pnas.95.26.15665.
[32] G.A. Altenberg, Structure of multidrug-resistance proteins of the ATP-binding cassette (ABC)
superfamily, Curr. Med. Chem.-Anti-Cancer Agents. 4 (2004) 53–62.
[33] I.D. Kerr, P.M. Jones, A.M. George, Multidrug efflux pumps: The structures of prokaryotic
ATP-binding cassette transporter efflux pumps and implications for our understanding of
eukaryotic P-glycoproteins and homologues: The structure of eukaryotic ABC multidrug
pumps, FEBS J. 277 (2010) 550–563. doi:10.1111/j.1742-4658.2009.07486.x.
[34] K. Wong, S.J. Briddon, N.D. Holliday, I.D. Kerr, Plasma membrane dynamics and tetrameric
organisation of ABCG2 transporters in mammalian cells revealed by single particle imaging
techniques, Biochim. Biophys. Acta BBA - Mol. Cell Res. 1863 (2016) 19–29.
doi:10.1016/j.bbamcr.2015.10.002.
[35] M. Yu, A. Ocana, I.F. Tannock, Reversal of ATP-binding cassette drug transporter activity to
modulate chemoresistance: why has it failed to provide clinical benefit?, Cancer Metastasis
Rev. 32 (2013) 211–227. doi:10.1007/s10555-012-9402-8.
[36] L. ChemAxon, Instant J Chem / MarvinSketch, ChemAxon Ltd., Budapest, Hungary, 2012.
http://www.chemaxon.com.
[37] A. Tamaki, C. Ierano, G. Szakács, R.W. Robey, S.E. Bates, The controversial role of ABC
transporters in clinical oncology, Essays Biochem. 50 (2011) 209–232.
doi:10.1042/bse0500209.
[38] X. Declèves, S. Bihorel, M. Debray, S. Yousif, G. Camenisch, J.-M. Scherrmann, ABC
transporters and the accumulation of imatinib and its active metabolite CGP74588 in rat C6
glioma cells, Pharmacol. Res. 57 (2008) 214–222. doi:10.1016/j.phrs.2008.01.006.
[39] E. Bakos, R. Evers, E. Sinkó, A. Váradi, P. Borst, B. Sarkadi, Interactions of the human
multidrug resistance proteins MRP1 and MRP2 with organic anions, Mol. Pharmacol. 57
(2000) 760–768.
[40] S.V. Ambudkar, S. Dey, C.A. Hrycyna, M. Ramachandra, I. Pastan, M.M. Gottesman,
Biochemical, cellular, and pharmacological aspects of the multidrug transporter, Annu. Rev.
Pharmacol. Toxicol. 39 (1999) 361–398.
194
[41] M.D. Hall, M.D. Handley, M.M. Gottesman, Is resistance useless? Multidrug resistance and
collateral sensitivity, Trends Pharmacol. Sci. 30 (2009) 546–556.
doi:10.1016/j.tips.2009.07.003.
[42] G. Szakács, M.D. Hall, M.M. Gottesman, A. Boumendjel, R. Kachadourian, B.J. Day, et al.,
Targeting the Achilles Heel of Multidrug-Resistant Cancer by Exploiting the Fitness Cost of
Resistance, Chem. Rev. 114 (2014) 5753–5774. doi:10.1021/cr4006236.
[43] S.G. Aller, J. Yu, A. Ward, Y. Weng, S. Chittaboina, R. Zhuo, et al., Structure of P-
Glycoprotein Reveals a Molecular Basis for Poly-Specific Drug Binding, Science. 323 (2009)
1718–1722. doi:10.1126/science.1168750.
[44] R. Callaghan, R.C. Ford, I.D. Kerr, The translocation mechanism of P-glycoprotein, FEBS Lett.
580 (2006) 1056–1063. doi:10.1016/j.febslet.2005.11.083.
[45] C. Van Der Does, R. Tampé, How do ABC transporters drive transport?, Biol. Chem. 385
(2004). doi:10.1515/BC.2004.121.
[46] P.D.W. Eckford, F.J. Sharom, ABC Efflux Pump-Based Resistance to Chemotherapy Drugs,
Chem. Rev. 109 (2009) 2989–3011. doi:10.1021/cr9000226.
[47] T. Tsuruo, H. Iida, S. Tsukagoshi, Y. Sakurai, Overcoming of vincristine resistance in P388
leukemia in vivo and in vitro through enhanced cytotoxicity of vincristine and vinblastine by
verapamil, Cancer Res. 41 (1981) 1967–1972.
[48] W. Klinkhammer, H. Müller, C. Globisch, I.K. Pajeva, M. Wiese, Synthesis and biological
evaluation of a small molecule library of 3rd generation multidrug resistance modulators,
Bioorg. Med. Chem. 17 (2009) 2524–2535. doi:10.1016/j.bmc.2009.01.072.
[49] P. Mistry, A.J. Stewart, W. Dangerfield, S. Okiji, C. Liddle, D. Bootle, et al., In Vitro and in
Vivo Reversal of P-Glycoprotein-mediated Multidrug Resistance by a Novel Potent Modulator,
XR9576, Cancer Res. 61 (2001) 749–758.
[50] O. Polgar, S.E. Bates, ABC transporters in the balance: is there a role in multidrug resistance?,
Biochem. Soc. Trans. 33 (2005) 241–246.
[51] G. Szakács, G.K. Chen, M.M. Gottesman, The molecular mysteries underlying P-glycoprotein-
mediated multidrug resistance, Cancer Biol. Ther. 3 (2004) 382–384.
[52] M. Falasca, K.J. Linton, Investigational ABC transporter inhibitors, Expert Opin. Investig.
Drugs. 21 (2012) 657–666. doi:10.1517/13543784.2012.679339.
[53] L. Amiri-Kordestani, A. Basseville, K. Kurdziel, A.T. Fojo, S.E. Bates, Targeting MDR in
breast and lung cancer: Discriminating its potential importance from the failure of drug
resistance reversal studies, Drug Resist. Updat. 15 (2012) 50–61.
doi:10.1016/j.drup.2012.02.002.
[54] K. Juvale, M. Wiese, 4-Substituted-2-phenylquinazolines as inhibitors of BCRP, Bioorg. Med.
Chem. Lett. 22 (2012) 6766–6769. doi:10.1016/j.bmcl.2012.08.024.
8. Bibliography 195
[55] K. Juvale, V.F.S. Pape, M. Wiese, Investigation of chalcones and benzochalcones as inhibitors
of breast cancer resistance protein, Bioorg. Med. Chem. 20 (2012) 346–355.
doi:10.1016/j.bmc.2011.10.074.
[56] K. Juvale, K. Stefan, M. Wiese, Synthesis and biological evaluation of flavones and
benzoflavones as inhibitors of BCRP/ABCG2, Eur. J. Med. Chem. 67 (2013) 115–126.
doi:10.1016/j.ejmech.2013.06.035.
[57] J.D. Allen, A. van Loevezijn, J.M. Lakhai, M. van der Valk, O. van Tellingen, G. Reid, et al.,
Potent and Specific Inhibition of the Breast Cancer Resistance Protein Multidrug Transporter in
Vitro and in Mouse Intestine by a Novel Analogue of Fumitremorgin C 1 This work was
supported in part by grant NKI 97-1433 from the Dutch Cancer Society (to A. H. S.). Synthesis
investigations by A. v. L. and G-J. K. were supported by the Netherlands Research Council for
Chemical Sciences (NWO/CW) and the Netherlands Technology Foundation (STW).1, Mol.
Cancer Ther. 1 (2002) 417–425.
[58] I. Ivnitski-Steele, R.S. Larson, D.M. Lovato, H.M. Khawaja, S.S. Winter, T.I. Oprea, et al.,
High-Throughput Flow Cytometry to Detect Selective Inhibitors of ABCB1, ABCC1, and
ABCG2 Transporters, ASSAY Drug Dev. Technol. 6 (2008) 263–276.
doi:10.1089/adt.2007.107.
[59] P. Matsson, J.M. Pedersen, U. Norinder, C.A.S. Bergström, P. Artursson, Identification of
Novel Specific and General Inhibitors of the Three Major Human ATP-Binding Cassette
Transporters P-gp, BCRP and MRP2 Among Registered Drugs, Pharm. Res. 26 (2009) 1816–
1831. doi:10.1007/s11095-009-9896-0.
[60] Z. Shi, A.K. Tiwari, S. Shukla, R.W. Robey, S. Singh, I.-W. Kim, et al., Sildenafil Reverses
ABCB1- and ABCG2-Mediated Chemotherapeutic Drug Resistance, Cancer Res. 71 (2011)
3029–3041. doi:10.1158/0008-5472.CAN-10-3820.
[61] S. Shukla, C.-P. Wu, S.V. Ambudkar, Development of inhibitors of ATP-binding cassette drug
transporters – present status and challenges, Expert Opin. Drug Metab. Toxicol. 4 (2008) 205–
223. doi:10.1517/17425255.4.2.205.
[62] K. Maeno, A. Nakajima, G. Conseil, A. Rothnie, R.G. Deeley, S.P.C. Cole, Molecular Basis for
Reduced Estrone Sulfate Transport and Altered Modulator Sensitivity of Transmembrane Helix
(TM) 6 and TM17 Mutants of Multidrug Resistance Protein 1 (ABCC1), Drug Metab. Dispos.
37 (2009) 1411–1420. doi:10.1124/dmd.109.026633.
[63] C.-P. Wu, A.M. Calcagno, S.V. Ambudkar, Reversal of ABC drug transporter-mediated
multidrug resistance in cancer cells: evaluation of current strategies, Curr. Mol. Pharmacol. 1
(2008) 93.
[64] S.C. Köhler, M. Wiese, HM30181 Derivatives as Novel Potent and Selective Inhibitors of the
Breast Cancer Resistance Protein (BCRP/ABCG2), J. Med. Chem. (2015).
doi:10.1021/acs.jmedchem.5b00188.
196
[65] W. Szybalski, V. Bryson, GENETIC STUDIES ON MICROBIAL CROSS RESISTANCE TO
TOXIC AGENTS I. , Cross Resistance of Escherichia coli to Fifteen Antibiotics, J. Bacteriol.
64 (1952) 489–499.
[66] K.M. Pluchino, M.D. Hall, A.S. Goldsborough, R. Callaghan, M.M. Gottesman, Collateral
sensitivity as a strategy against cancer multidrug resistance, Drug Resist. Updat. 15 (2012) 98–
105. doi:10.1016/j.drup.2012.03.002.
[67] K.M. Marks, E.S. Park, A. Arefolov, K. Russo, K. Ishihara, J.E. Ring, et al., The Selectivity of
Austocystin D Arises from Cell-Line-Specific Drug Activation by Cytochrome P450 Enzymes,
J. Nat. Prod. 74 (2011) 567–573. doi:10.1021/np100429s.
[68] S.P.C. Cole, R.G. Deeley, Transport of glutathione and glutathione conjugates by MRP1,
Trends Pharmacol. Sci. 27 (2006) 438–446. doi:10.1016/j.tips.2006.06.008.
[69] Z. Benderra, A. Trussardi, H. Morjani, A.M. Villa, S.M. Doglia, M. Manfait, Regulation of
cellular glutathione modulates nuclear accumulation of daunorubicin in human MCF7 cells
overexpressing multidrug resistance associated protein, Eur. J. Cancer Oxf. Engl. 1990. 36
(2000) 428–434.
[70] N.T. Bech-Hansen, J.E. Till, V. Ling, Pleiotropic phenotype of colchicine-resistant CHO cells:
Cross-resistance and collateral sensitivity, J. Cell. Physiol. 88 (1976) 23–31.
[71] R. Callaghan, J.R. Riordan, Collateral sensitivity of multidrug resistant cells to narcotic
analgesics is due to effects on the plasma membrane, Biochim. Biophys. Acta. 1236 (1995)
155–162.
[72] R. Callaghan, G. Berridge, D.R. Ferry, C.F. Higgins, The functional purification of P-
glycoprotein is dependent on maintenance of a lipid–protein interface, Biochim. Biophys. Acta
BBA - Biomembr. 1328 (1997) 109–124. doi:10.1016/S0005-2736(97)00079-5.
[73] D.Y. Alakhova, A.V. Kabanov, Pluronics and MDR Reversal: An Update, Mol. Pharm. 11
(2014) 2566–2578. doi:10.1021/mp500298q.
[74] C. Alemán, J.-P. Annereau, X.-J. Liang, C.O. Cardarelli, B. Taylor, J.J. Yin, et al., P-
glycoprotein, expressed in multidrug resistant cells, is not responsible for alterations in
membrane fluidity or membrane potential, Cancer Res. 63 (2003) 3084–3091.
[75] A.V. Kabanov, E.V. Batrakova, V.Y. Alakhov, An essential relationship between ATP
depletion and chemosensitizing activity of Pluronic block copolymers, J. Control. Release Off.
J. Control. Release Soc. 91 (2003) 75–83.
[76] D.Y. Alakhova, N.Y. Rapoport, E.V. Batrakova, A.A. Timoshin, S. Li, D. Nicholls, et al.,
Differential metabolic responses to pluronic in MDR and non-MDR cells: A novel pathway for
chemosensitization of drug resistant cancers, J. Controlled Release. 142 (2010) 89–100.
doi:10.1016/j.jconrel.2009.09.026.
8. Bibliography 197
[77] J. Bentley, D.M. Quinn, R.S. Pitman, J.R. Warr, G.L. Kellett, The human KB multidrug-
resistant cell line KB-C1 is hypersensitive to inhibitors of glycosylation, Cancer Lett. 115
(1997) 221–227.
[78] S.E. Bell, D.M. Quinn, G.L. Kellett, J.R. Warr, 2-Deoxy-D-glucose preferentially kills
multidrug-resistant human KB carcinoma cell lines by apoptosis., Br. J. Cancer. 78 (1998)
1464–1470.
[79] J.W. Polli, S.A. Wring, J.E. Humphreys, L. Huang, J.B. Morgan, L.O. Webster, et al., Rational
use of in vitro P-glycoprotein assays in drug discovery, J. Pharmacol. Exp. Ther. 299 (2001)
620–628.
[80] J.R. Warr, F. Brewer, M. Anderson, J. Fergusson, Verapamil hypersensitivity of vincristine
resistant Chinese hamster ovary cell lines, Cell Biol. Int. Rep. 10 (1986) 389–399.
doi:10.1016/0309-1651(86)90011-1.
[81] D.F. Cano-Gauci, J.R. Riordan, Action of calcium antagonists on multidrug resistant cells.
Specific cytotoxicity independent of increased cancer drug accumulation, Biochem. Pharmacol.
36 (1987) 2115–2123.
[82] J. Karwatsky, M.C. Lincoln, E. Georges, A mechanism for P-glycoprotein-mediated apoptosis
as revealed by verapamil hypersensitivity, Biochemistry (Mosc.). 42 (2003) 12163–12173.
[83] R.-M. Laberge, R. Ambadipudi, E. Georges, P-glycoprotein (ABCB1) modulates collateral
sensitivity of a multidrug resistant cell line to verapamil, Arch. Biochem. Biophys. 491 (2009)
53–60. doi:10.1016/j.abb.2009.09.012.
[84] A.S. Goldsborough, M.D. Handley, A.E. Dulcey, K.M. Pluchino, P. Kannan, K.R.
Brimacombe, et al., Collateral Sensitivity of Multidrug-Resistant Cells to the Orphan Drug
Tiopronin, J. Med. Chem. 54 (2011) 4987–4997. doi:10.1021/jm2001663.
[85] M.D. Hall, T.S. Marshall, A.D.T. Kwit, L.M.M. Jenkins, A.E. Dulcey, J.P. Madigan, et al.,
Inhibition of Glutathione Peroxidase Mediates the Collateral Sensitivity of Multidrug-Resistant
Cells to Tiopronin, J. Biol. Chem. (2014) jbc.M114.581702. doi:10.1074/jbc.M114.581702.
[86] M. Whitnall, J. Howard, P. Ponka, D.R. Richardson, A class of iron chelators with a wide
spectrum of potent antitumor activity that overcomes resistance to chemotherapeutics, Proc.
Natl. Acad. Sci. 103 (2006) 14901–14906.
[87] D.B. Lovejoy, P.J. Jansson, U.T. Brunk, J. Wong, P. Ponka, D.R. Richardson, Antitumor
Activity of Metal-Chelating Compound Dp44mT Is Mediated by Formation of a Redox-Active
Copper Complex That Accumulates in Lysosomes, Cancer Res. 71 (2011) 5871–5880.
doi:10.1158/0008-5472.CAN-11-1218.
[88] A.M. Merlot, D.S. Kalinowski, D.R. Richardson, Novel Chelators for Cancer Treatment:
Where Are We Now?, Antioxid. Redox Signal. 18 (2013) 973–1006.
doi:10.1089/ars.2012.4540.
198
[89] V.F.S. Pape, D. Türk, P. Szabó, M. Wiese, E.A. Enyedy, G. Szakács, Synthesis and
characterization of the anticancer and metal binding properties of novel pyrimidinylhydrazone
derivatives, J. Inorg. Biochem. 144 (2015) 18–30. doi:10.1016/j.jinorgbio.2014.12.015.
[90] P.J. Jansson, T. Yamagishi, A. Arvind, N. Seebacher, E. Gutierrez, A. Stacy, et al., Di-2-
pyridylketone 4,4-Dimethyl-3-thiosemicarbazone (Dp44mT) Overcomes Multidrug-Resistance
by a Novel Mechanism Involving the Hijacking of Lysosomal P-Glycoprotein (Pgp)., J. Biol.
Chem. 290 (2015) 9588–9603. doi:10.1074/jbc.M114.631283.
[91] J.H. Wu, S.L. Mao, S.X. Liao, Y.H. Yi, C.Q. Lan, Z.W. Su, Desmosdumotin B: a new special
flavone from Desmos dumosus, Chin. Chem. Lett. 12 (2001) 49–50.
[92] K. Nakagawa-Goto, K.F. Bastow, J.-H. Wu, H. Tokuda, K.-H. Lee, Total synthesis and
bioactivity of unique flavone desmosdumotin B and its analogs, Bioorg. Med. Chem. Lett. 15
(2005) 3016–3019. doi:10.1016/j.bmcl.2005.04.070.
[93] K. Nakagawa-Goto, K.F. Bastow, T.-H. Chen, S.L. Morris-Natschke, K.-H. Lee, Antitumor
Agents 260. New Desmosdumotin B Analogues with Improved In Vitro Anticancer Activity, J.
Med. Chem. 51 (2008) 3297–3303. doi:10.1021/jm701208v.
[94] K. Nakagawa-Goto, P.-C. Chang, C.-Y. Lai, H.-Y. Hung, T.-H. Chen, P.-C. Wu, et al.,
Antitumor Agents. 280. Multidrug Resistance-Selective Desmosdumotin B Analogues, J. Med.
Chem. 53 (2010) 6699–6705. doi:10.1021/jm100846r.
[95] G. Szakács, J.-P. Annereau, S. Lababidi, U. Shankavaram, A. Arciello, K.J. Bussey, et al.,
Predicting drug sensitivity and resistance: profiling ABC transporter genes in cancer cells,
Cancer Cell. 6 (2004) 129–137.
[96] W.C. Reinhold, M. Sunshine, H. Liu, S. Varma, K.W. Kohn, J. Morris, et al., CellMiner: A
Web-Based Suite of Genomic and Pharmacologic Tools to Explore Transcript and Drug
Patterns in the NCI-60 Cell Line Set, Cancer Res. 72 (2012) 3499–3511. doi:10.1158/0008-
5472.CAN-12-1370.
[97] R.H. Shoemaker, The NCI60 human tumour cell line anticancer drug screen, Nat. Rev. Cancer.
6 (2006) 813–823. doi:10.1038/nrc1951.
[98] D. Türk, M.D. Hall, B.F. Chu, J.A. Ludwig, H.M. Fales, M.M. Gottesman, et al., Identification
of Compounds Selectively Killing Multidrug-Resistant Cancer Cells, Cancer Res. 69 (2009)
8293–8301. doi:10.1158/0008-5472.CAN-09-2422.
[99] M. Liscovitch, D. Ravid, A case study in misidentification of cancer cell lines: MCF-7/AdrR
cells (re-designated NCI/ADR-RES) are derived from OVCAR-8 human ovarian carcinoma
cells, Cancer Lett. 245 (2007) 350–352. doi:10.1016/j.canlet.2006.01.013.
[100] J.A. Ludwig, G. Szakács, S.E. Martin, B.F. Chu, C. Cardarelli, Z.E. Sauna, et al., Selective
Toxicity of NSC73306 in MDR1-Positive Cells as a New Strategy to Circumvent Multidrug
Resistance in Cancer, Cancer Res. 66 (2006) 4808–4815. doi:10.1158/0008-5472.CAN-05-
3322.
8. Bibliography 199
[101] Y.N. Chen, L.A. Mickley, A.M. Schwartz, E.M. Acton, J.L. Hwang, A.T. Fojo,
Characterization of adriamycin-resistant human breast cancer cells which display
overexpression of a novel resistance-related membrane protein., J. Biol. Chem. 265 (1990)
10073–10080.
[102] M.D. Hall, N.K. Salam, J.L. Hellawell, H.M. Fales, C.B. Kensler, J.A. Ludwig, et al.,
Synthesis, Activity, and Pharmacophore Development for Isatin-β-thiosemicarbazones with
Selective Activity toward Multidrug-Resistant Cells, J. Med. Chem. 52 (2009) 3191–3204.
doi:10.1021/jm800861c.
[103] M.D. Hall, K.R. Brimacombe, M.S. Varonka, K.M. Pluchino, J.K. Monda, J. Li, et al.,
Synthesis and Structure–Activity Evaluation of Isatin-β-thiosemicarbazones with Improved
Selective Activity toward Multidrug-Resistant Cells Expressing P-Glycoprotein, J. Med. Chem.
54 (2011) 5878–5889. doi:10.1021/jm2006047.
[104] D.S. Kalinowski, D.R. Richardson, The Evolution of Iron Chelators for the Treatment of Iron
Overload Disease and Cancer, Pharmacol. Rev. 57 (2005) 547–583. doi:10.1124/pr.57.4.2.
[105] A. Budimir, Metal ions, Alzheimer’s disease and chelation therapy, Acta Pharm. 61 (2011) 1–
14. doi:10.2478/v10007-011-0006-6.
[106] H. Eklund, U. Uhlin, M. Färnegårdh, D.T. Logan, P. Nordlund, Structure and function of the
radical enzyme ribonucleotide reductase, Prog. Biophys. Mol. Biol. 77 (2001) 177–268.
doi:10.1016/S0079-6107(01)00014-1.
[107] N.T.V. Le, D.R. Richardson, The role of iron in cell cycle progression and the proliferation of
neoplastic cells, Biochim. Biophys. Acta BBA - Rev. Cancer. 1603 (2002) 31–46.
doi:10.1016/S0304-419X(02)00068-9.
[108] W. Kaim, B. Schwederski, Bioinorganic Chemistry: Inorganic Elements in the Chemistry of
Life - An Introduction and Guide, 1st ed., Wiley, West Sussex, England, 1994.
[109] J.A. Jacobsen, J.L. Fullagar, M.T. Miller, S.M. Cohen, Identifying Chelators for Metalloprotein
Inhibitors Using a Fragment-Based Approach, J. Med. Chem. 54 (2011) 591–602.
doi:10.1021/jm101266s.
[110] R. McRae, P. Bagchi, S. Sumalekshmy, C.J. Fahrni, In Situ Imaging of Metals in Cells and
Tissues, Chem. Rev. 109 (2009) 4780–4827. doi:10.1021/cr900223a.
[111] S.V. Torti, F.M. Torti, Ironing Out Cancer, Cancer Res. 71 (2011) 1511–1514.
doi:10.1158/0008-5472.CAN-10-3614.
[112] G.Y.L. Lui, Z. Kovacevic, V. Richardson, A.M. Merlot, D.S. Kalinowski, D.R. Richardson,
Targeting cancer by binding iron: Dissecting cellular signaling pathways, Oncotarget. 5 (2015).
http://www.impactjournals.com/oncotarget/index.php?journal=oncotarget&page=article&op=vi
ew&path%5B%5D=4349 (accessed July 20, 2015).
[113] A. Gupte, R.J. Mumper, Elevated copper and oxidative stress in cancer cells as a target for
cancer treatment, Cancer Treat. Rev. 35 (2009) 32–46. doi:10.1016/j.ctrv.2008.07.004.
200
[114] H. Tapiero, D.M. Townsend, K.D. Tew, Trace elements in human physiology and pathology.
Copper, Biomed. Pharmacother. 57 (2003) 386–398. doi:10.1016/S0753-3322(03)00012-X.
[115] D.J.R. Lane, T.M. Mills, N.H. Shafie, A.M. Merlot, R. Saleh Moussa, D.S. Kalinowski, et al.,
Expanding horizons in iron chelation and the treatment of cancer: Role of iron in the regulation
of ER stress and the epithelial–mesenchymal transition, Biochim. Biophys. Acta BBA - Rev.
Cancer. 1845 (2014) 166–181. doi:10.1016/j.bbcan.2014.01.005.
[116] U. Jungwirth, C.R. Kowol, B.K. Keppler, C.G. Hartinger, W. Berger, P. Heffeter, Anticancer
Activity of Metal Complexes: Involvement of Redox Processes, Antioxid. Redox Signal. 15
(2011) 1085–1127. doi:10.1089/ars.2010.3663.
[117] M. Valko, H. Morris, M.T.D. Cronin, Metals, toxicity and oxidative stress, Curr. Med. Chem.
12 (2005) 1161–1208.
[118] E.J. Martinez-Finley, S. Chakraborty, S.J.B. Fretham, M. Aschner, Cellular transport and
homeostasis of essential and nonessential metals, Metallomics. 4 (2012) 593.
doi:10.1039/c2mt00185c.
[119] M.L.-H. Huang, D.J.R. Lane, D.R. Richardson, Mitochondrial Mayhem: The Mitochondrion as
a Modulator of Iron Metabolism and Its Role in Disease, Antioxid. Redox Signal. 15 (2011)
3003–3019. doi:10.1089/ars.2011.3921.
[120] D.J.R. Lane, A.M. Merlot, M.L.-H. Huang, D.-H. Bae, P.J. Jansson, S. Sahni, et al., Cellular
iron uptake, trafficking and metabolism: Key molecules and mechanisms and their roles in
disease, Biochim. Biophys. Acta BBA - Mol. Cell Res. 1853 (2015) 1130–1144.
doi:10.1016/j.bbamcr.2015.01.021.
[121] D.R. Richardson, D.S. Kalinowski, S. Lau, P.J. Jansson, D.B. Lovejoy, Cancer cell iron
metabolism and the development of potent iron chelators as anti-tumour agents, Biochim.
Biophys. Acta BBA - Gen. Subj. 1790 (2009) 702–717. doi:10.1016/j.bbagen.2008.04.003.
[122] J. Wang, K. Pantopoulos, Regulation of cellular iron metabolism, Biochem. J. 434 (2011) 365–
381. doi:10.1042/BJ20101825.
[123] Y. Yu, D.S. Kalinowski, Z. Kovacevic, A.R. Siafakas, P.J. Jansson, C. Stefani, et al.,
Thiosemicarbazones from the Old to New: Iron Chelators That Are More Than Just
Ribonucleotide Reductase Inhibitors, J. Med. Chem. 52 (2009) 5271–5294.
doi:10.1021/jm900552r.
[124] C. Santini, M. Pellei, V. Gandin, M. Porchia, F. Tisato, C. Marzano, Advances in Copper
Complexes as Anticancer Agents, Chem. Rev. 114 (2014) 815–862. doi:10.1021/cr400135x.
[125] M. Shvartsman, Z.I. Cabantchik, Intracellular iron trafficking: role of cytosolic ligands,
BioMetals. 25 (2012) 711–723. doi:10.1007/s10534-012-9529-7.
[126] H. Fieten, P.A.J. Leegwater, A.L. Watson, J. Rothuizen, Canine models of copper toxicosis for
understanding mammalian copper metabolism, Mamm. Genome. 23 (2012) 62–75.
doi:10.1007/s00335-011-9378-7.
8. Bibliography 201
[127] Y. Hatori, S. Clasen, N.M. Hasan, A.N. Barry, S. Lutsenko, Functional Partnership of the
Copper Export Machinery and Glutathione Balance in Human Cells, J. Biol. Chem. 287 (2012)
26678–26687. doi:10.1074/jbc.M112.381178.
[128] C.M. Nutting, C.M.L. van Herpen, A.B. Miah, S.A. Bhide, J.-P. Machiels, J. Buter, et al.,
Phase II study of 3-AP Triapine in patients with recurrent or metastatic head and neck
squamous cell carcinoma, Ann. Oncol. 20 (2009) 1275–1279. doi:10.1093/annonc/mdn775.
[129] C.R. Kowol, R. Berger, R. Eichinger, A. Roller, M.A. Jakupec, P.P. Schmidt, et al.,
Gallium(III) and Iron(III) Complexes of α-N-Heterocyclic Thiosemicarbazones: Synthesis,
Characterization, Cytotoxicity, and Interaction with Ribonucleotide Reductase, J. Med. Chem.
50 (2007) 1254–1265. doi:10.1021/jm0612618.
[130] Y. Yu, J. Wong, D.B. Lovejoy, D.S. Kalinowski, D.R. Richardson, Chelators at the Cancer
Coalface: Desferrioxamine to Triapine and Beyond, Clin. Cancer Res. 12 (2006) 6876–6883.
doi:10.1158/1078-0432.CCR-06-1954.
[131] F. Saletta, Y.S. Rahmanto, A.R. Siafakas, D.R. Richardson, Cellular Iron Depletion and the
Mechanisms Involved in the Iron-dependent Regulation of the Growth Arrest and DNA
Damage Family of Genes, J. Biol. Chem. 286 (2011) 35396–35406.
doi:10.1074/jbc.M111.273060.
[132] D. Fu, D.R. Richardson, Iron chelation and regulation of the cell cycle: 2 mechanisms of
posttranscriptional regulation of the universal cyclin-dependent kinase inhibitor
p21CIP1/WAF1 by iron depletion, Blood. 110 (2007) 752–761. doi:10.1182/blood-2007-03-
076737.
[133] Z. Kovacevic, S. Chikhani, D.B. Lovejoy, D.R. Richardson, Novel Thiosemicarbazone Iron
Chelators Induce Up-Regulation and Phosphorylation of the Metastasis Suppressor N-myc
Down-Stream Regulated Gene 1: A New Strategy for the Treatment of Pancreatic Cancer, Mol.
Pharmacol. 80 (2011) 598–609. doi:10.1124/mol.111.073627.
[134] J. Yuan, D.B. Lovejoy, D.R. Richardson, Novel Di-2-Pyridyl-Derived Iron Chelators with
Marked and Selective Anti-Tumor Activity: In Vitro and In Vivo Assessment, Blood. 104
(2004) 1450–1458. doi:10.1182/blood-2004-03-0868.
[135] C.R. Kowol, P. Heffeter, W. Miklos, L. Gille, R. Trondl, L. Cappellacci, et al., Mechanisms
underlying reductant-induced reactive oxygen species formation by anticancer copper(II)
compounds, J. Biol. Inorg. Chem. 17 (2012) 409–423. doi:10.1007/s00775-011-0864-x.
[136] A. Gaál, G. Orgován, Z. Polgári, A. Réti, V.G. Mihucz, S. Bősze, et al., Complex forming
competition and in-vitro toxicity studies on the applicability of di-2-pyridylketone-4,4,-
dimethyl-3-thiosemicarbazone (Dp44mT) as a metal chelator, J. Inorg. Biochem. 130 (2014)
52–58. doi:10.1016/j.jinorgbio.2013.09.016.
[137] A. Kellett, O. Howe, M. O’Connor, M. McCann, B.S. Creaven, S. McClean, et al., Radical-
induced DNA damage by cytotoxic square-planar copper(II) complexes incorporating o-
202
phthalate and 1,10-phenanthroline or 2,2′-dipyridyl, Free Radic. Biol. Med. 53 (2012) 564–576.
doi:10.1016/j.freeradbiomed.2012.05.034.
[138] R. Buchtík, Z. Trávníček, J. Vančo, R. Herchel, Z. Dvořák, Synthesis, characterization, DNA
interaction and cleavage, and in vitro cytotoxicity of copper(II) mixed-ligand complexes with
2-phenyl-3-hydroxy-4(1H)-quinolinone, Dalton Trans. 40 (2011) 9404–9412.
doi:10.1039/C1DT10674K.
[139] S.S. Bhat, A.A. Kumbhar, H. Heptullah, A.A. Khan, V.V. Gobre, S.P. Gejji, et al., Synthesis,
Electronic Structure, DNA and Protein Binding, DNA Cleavage, and Anticancer Activity of
Fluorophore-Labeled Copper(II) Complexes, Inorg. Chem. 50 (2011) 545–558.
doi:10.1021/ic101534n.
[140] J. Luis García-Giménez, M. González-Álvarez, M. Liu-González, B. Macías, J. Borrás, G.
Alzuet, Toward the development of metal-based synthetic nucleases: DNA binding and
oxidative DNA cleavage of a mixed copper(II) complex with N-(9H-purin-6-
yl)benzenesulfonamide and 1,10-phenantroline. Antitumor activity in human Caco-2 cells and
Jurkat T lymphocytes. Evaluation of p53 and Bcl-2 proteins in the apoptotic mechanism, J.
Inorg. Biochem. 103 (2009) 923–934. doi:10.1016/j.jinorgbio.2009.04.003.
[141] D. Senthil Raja, N.S.P. Bhuvanesh, K. Natarajan, Effect of N(4)-Phenyl Substitution in 2-Oxo-
1,2-dihydroquinoline-3-carbaldehyde Semicarbazones on the Structure, DNA/Protein
Interaction, and Antioxidative and Cytotoxic Activity of Cu(II) Complexes, Inorg. Chem. 50
(2011) 12852–12866. doi:10.1021/ic2020308.
[142] S. Rajalakshmi, T. Weyhermüller, A.J. Freddy, H.R. Vasanthi, B.U. Nair, Anomalous behavior
of pentacoordinate copper complexes of dimethylphenanthroline and derivatives of terpyridine
ligands: Studies on DNA binding, cleavage and apoptotic activity, Eur. J. Med. Chem. 46
(2011) 608–617. doi:10.1016/j.ejmech.2010.11.041.
[143] A. Barve, A. Kumbhar, M. Bhat, B. Joshi, R. Butcher, U. Sonawane, et al., Mixed-Ligand
Copper(II) Maltolate Complexes: Synthesis, Characterization, DNA Binding and Cleavage, and
Cytotoxicity, Inorg. Chem. 48 (2009) 9120–9132. doi:10.1021/ic9004642.
[144] O.F. Ikotun, E.M. Higbee, W. Ouellette, R.P. Doyle, Pyrophosphate-bridged complexes with
picomolar toxicity, J. Inorg. Biochem. 103 (2009) 1254–1264.
doi:10.1016/j.jinorgbio.2009.07.010.
[145] K.G. Daniel, P. Gupta, R.H. Harbach, W.C. Guida, Q.P. Dou, Organic copper complexes as a
new class of proteasome inhibitors and apoptosis inducers in human cancer cells, Biochem.
Pharmacol. 67 (2004) 1139–1151. doi:10.1016/j.bcp.2003.10.031.
[146] Y. Xiao, D. Chen, X. Zhang, Q. Cui, Y. Fan, C. Bi, et al., Molecular study on copper-mediated
tumor proteasome inhibition and cell death, Int. J. Oncol. 37 (2010) 81–87.
8. Bibliography 203
[147] J.B. Baell, G.A. Holloway, New Substructure Filters for Removal of Pan Assay Interference
Compounds (PAINS) from Screening Libraries and for Their Exclusion in Bioassays, J. Med.
Chem. 53 (2010) 2719–2740. doi:10.1021/jm901137j.
[148] J. Baell, M.A. Walters, Chemistry: Chemical con artists foil drug discovery, Nat. News. 513
(2014) 481. doi:10.1038/513481a.
[149] J.A. Lee, M.T. Uhlik, C.M. Moxham, D. Tomandl, D.J. Sall, Modern Phenotypic Drug
Discovery Is a Viable, Neoclassic Pharma Strategy, J. Med. Chem. 55 (2012) 4527–4538.
doi:10.1021/jm201649s.
[150] J. Kotz, Phenotypic screening, take two, SciBX Sci.-Bus. Exch. 5 (2012).
doi:10.1038/scibx.2012.380.
[151] O. Sorg, Oxidative stress: a theoretical model or a biological reality?, C. R. Biol. 327 (2004)
649–662. doi:10.1016/j.crvi.2004.05.007.
[152] G.-Y. Liou, P. Storz, Reactive oxygen species in cancer, Free Radic. Res. 44 (2010) 479–496.
doi:10.3109/10715761003667554.
[153] W. Lopaczynski, S.H. Zeisel, Antioxidants, programmed cell death, and cancer, Nutr. Res. 21
(2001) 295–307.
[154] A.J. Nappi, E. Vass, Comparative studies of enhanced iron-mediated production of hydroxyl
radical by glutathione, cysteine, ascorbic acid, and selected catechols, Biochim. Biophys. Acta.
1336 (1997) 295–302.
[155] M. Valko, C.J. Rhodes, J. Moncol, M. Izakovic, M. Mazur, Free radicals, metals and
antioxidants in oxidative stress-induced cancer, Chem. Biol. Interact. 160 (2006) 1–40.
doi:10.1016/j.cbi.2005.12.009.
[156] B. Enyedi, P. Várnai, M. Geiszt, Redox state of the endoplasmic reticulum is controlled by Ero
1L-alpha and intraluminal calcium, Antioxid. Redox Signal. 13 (2010) 721–729.
[157] M. Carocho, I.C.F.R. Ferreira, A review on antioxidants, prooxidants and related controversy:
Natural and synthetic compounds, screening and analysis methodologies and future
perspectives, Food Chem. Toxicol. 51 (2013) 15–25. doi:10.1016/j.fct.2012.09.021.
[158] M. Landriscina, F. Maddalena, G. Laudiero, F. Esposito, Adaptation to oxidative stress,
chemoresistance, and cell survival, Antioxid. Redox Signal. 11 (2009) 2701–2716.
[159] M.P. Murphy, A. Holmgren, N.-G. Larsson, B. Halliwell, C.J. Chang, B. Kalyanaraman, et al.,
Unraveling the Biological Roles of Reactive Oxygen Species, Cell Metab. 13 (2011) 361–366.
doi:10.1016/j.cmet.2011.03.010.
[160] K. Jomova, M. Valko, Advances in metal-induced oxidative stress and human disease,
Toxicology. 283 (2011) 65–87. doi:10.1016/j.tox.2011.03.001.
[161] K. Jomova, S. Baros, M. Valko, Redox active metal-induced oxidative stress in biological
systems, Transit. Met. Chem. 37 (2012) 127–134. doi:10.1007/s11243-012-9583-6.
204
[162] A.P. Fernandes, A. Holmgren, Glutaredoxins: Glutathione-Dependent Redox Enzymes with
Functions Far Beyond a Simple Thioredoxin Backup System, Antioxid. Redox Signal. 6 (2004)
63–74. doi:10.1089/152308604771978354.
[163] H.-J. Choi, S.-J. Kim, P. Mukhopadhyay, S. Cho, J.-R. Woo, G. Storz, et al., Structural basis of
the redox switch in the OxyR transcription factor, Cell. 105 (2001) 103–113.
[164] H.E. Seifried, D.E. Anderson, E.I. Fisher, J.A. Milner, A review of the interaction among
dietary antioxidants and reactive oxygen species, J. Nutr. Biochem. 18 (2007) 567–579.
doi:10.1016/j.jnutbio.2006.10.007.
[165] M. Gutscher, A.-L. Pauleau, L. Marty, T. Brach, G.H. Wabnitz, Y. Samstag, et al., Real-time
imaging of the intracellular glutathione redox potential, Nat. Methods. 5 (2008) 553–559.
doi:10.1038/nmeth.1212.
[166] D. Trachootham, W. Lu, M.A. Ogasawara, N.R.-D. Valle, P. Huang, Redox Regulation of Cell
Survival, Antioxid. Redox Signal. 10 (2008) 1343–1374. doi:10.1089/ars.2007.1957.
[167] M.T. Kuo, Redox Regulation of Multidrug Resistance in Cancer Chemotherapy: Molecular
Mechanisms and Therapeutic Opportunities, Antioxid. Redox Signal. 11 (2009) 99–133.
doi:10.1089/ars.2008.2095.
[168] S. Ueda, H. Masutani, H. Nakamura, T. Tanaka, M. Ueno, J. Yodoi, Redox control of cell
death, Antioxid. Redox Signal. 4 (2002) 405–414.
[169] X. Wang, C.R. Campos, J.C. Peart, L.K. Smith, J.L. Boni, R.E. Cannon, et al., Nrf2
Upregulates ATP Binding Cassette Transporter Expression and Activity at the Blood–Brain
and Blood–Spinal Cord Barriers, J. Neurosci. 34 (2014) 8585–8593.
doi:10.1523/JNEUROSCI.2935-13.2014.
[170] C.M. Beaufort, J.C.A. Helmijr, A.M. Piskorz, M. Hoogstraat, K. Ruigrok-Ritstier, N.
Besselink, et al., Ovarian Cancer Cell Line Panel (OCCP): Clinical Importance of In Vitro
Morphological Subtypes, PLoS ONE. 9 (2014) e103988. doi:10.1371/journal.pone.0103988.
[171] W.G. Harker, B.I. Sikic, Multidrug (Pleiotropic) Resistance in Doxorubicin-selected Variants
of the Human Sarcoma Cell Line MES-SA, Cancer Res. 45 (1985) 4091–4096.
[172] D.-W. Shen, C. Cardarelli, J. Hwang, M. Cornwell, N. Richert, S. Ishii, et al., Multiple drug-
resistant human KB carcinoma cells independently selected for high-level resistance to
colchicine, adriamycin, or vinblastine show changes in expression of specific proteins., J. Biol.
Chem. 261 (1986) 7762–7770.
[173] J. Wang, L.-S. Tai, C.-H. Tzang, W.F. Fong, X.-Y. Guan, M. Yang, 1p31, 7q21 and 18q21
chromosomal aberrations and candidate genes in acquired vinblastine resistance of human
cervical carcinoma KB cells, Oncol. Rep. 19 (2008) 1155–1164.
[174] D. Türk, M.D. Hall, B.F. Chu, J.A. Ludwig, H.M. Fales, M.M. Gottesman, et al., Identification
of Compounds Selectively Killing Multidrug-Resistant Cancer Cells, Cancer Res. (2009).
doi:10.1158/0008-5472.CAN-09-2422.
8. Bibliography 205
[175] G. Maggiora, M. Vogt, D. Stumpfe, J. Bajorath, Molecular Similarity in Medicinal Chemistry,
J. Med. Chem. 57 (2014) 3186–3204. doi:10.1021/jm401411z.
[176] M.D. Hall, N.K. Salam, J.L. Hellawell, H.M. Fales, C.B. Kensler, J.A. Ludwig, et al.,
Synthesis, activity, and pharmacophore development for isatin-beta-thiosemicarbazones with
selective activity toward multidrug-resistant cells, J. Med. Chem. 52 (2009) 3191–3204.
doi:10.1021/jm800861c.
[177] P. Heffeter, A. Popovic-Bijelic, P. Saiko, R. Dornetshuber, U. Jungwirth, N. Voevodskaya, et
al., Ribonucleotide reductase as one important target of [Tris(1,10-
phenanthroline)lanthanum(III)] trithiocyanate (KP772), Curr. Cancer Drug Targets. 9 (2009)
595–607.
[178] F.A. Hart, F.P. Laming, Complexes of 1,10-phenanthroline with lanthanide chlorides and
thiocyanates, J. Inorg. Nucl. Chem. 26 (1964) 579–585. doi:10.1016/0022-1902(64)80291-8.
[179] G.A. Lawrance, Introduction to Coordination Chemistry, 1st edition, Wiley, 2011.
[180] R.W. Brockman, J.R. Thomson, M.J. Bell, H.E. Skipper, Observations on the Antileukemic
Activity of Pyridine-2-carboxaldehyde Thiosemicarbazone and Thiocarbohydrazone, Cancer
Res. 16 (1956) 167–170.
[181] G. Rappa, A. Lorico, M.-C. Liu, G.D. Kruh, A.H. Cory, J.G. Cory, et al., Overexpression of the
Multidrug Resistance Genes mdr1, mdr3, and mrp in L1210 Leukemia Cells Resistant to
Inhibitors of Ribonucleotide Reductase, Biochem. Pharmacol. 54 (1997) 649–655.
[182] W. Miklos, K. Pelivan, C.R. Kowol, C. Pirker, R. Dornetshuber-Fleiss, M. Spitzwieser, et al.,
Triapine-mediated ABCB1 induction via PKC induces widespread therapy unresponsiveness
but is not underlying acquired triapine resistance, Cancer Lett. 361 (2015) 112–120.
doi:10.1016/j.canlet.2015.02.049.
[183] C.R. Kowol, R. Trondl, P. Heffeter, V.B. Arion, M.A. Jakupec, A. Roller, et al., Impact of
Metal Coordination on Cytotoxicity of 3-Aminopyridine-2-carboxaldehyde Thiosemicarbazone
(Triapine) and Novel Insights into Terminal Dimethylation, J. Med. Chem. 52 (2009) 5032–
5043. doi:10.1021/jm900528d.
[184] P.V. Bernhardt, P.C. Sharpe, M. Islam, D.B. Lovejoy, D.S. Kalinowski, D.R. Richardson, Iron
Chelators of the Dipyridylketone Thiosemicarbazone Class: Precomplexation and
Transmetalation Effects on Anticancer Activity, J. Med. Chem. 52 (2009) 407–415.
doi:10.1021/jm801012z.
[185] D.R. Richardson, P.C. Sharpe, D.B. Lovejoy, D. Senaratne, D.S. Kalinowski, M. Islam, et al.,
Dipyridyl Thiosemicarbazone Chelators with Potent and Selective Antitumor Activity Form
Iron Complexes with Redox Activity, J. Med. Chem. 49 (2006) 6510–6521.
doi:10.1021/jm0606342.
[186] I.H. Hall, N.J. Peaty, J.R. Henry, J. Easmon, G. Heinisch, G. Pürstinger, Investigations on the
mechanism of action of the novel antitumor agents 2-benzothiazolyl, 2-benzoxazolyl, and 2-
206
benzimidazolyl hydrazones derived from 2-acetylpyridine, Arch. Pharm. (Weinheim). 332
(1999) 115–123.
[187] K.J. Schaper, J.K. Seydel, M. Rosenfeld, J. Kazda, Development of inhibitors of mycobacterial
ribonucleotide reductase, Lepr. Rev. 57 Suppl 3 (1986) 254–264.
[188] I. Machado, M. Fernández, L. Becco, B. Garat, R.F. Brissos, N. Zabarska, et al., New metal
complexes of NNO tridentate ligands: Effect of metal center and co-ligand on biological
activity, Inorganica Chim. Acta. 420 (2014) 39–46. doi:10.1016/j.ica.2013.10.022.
[189] M. Calinescu, E. Ion, R. Georgescu, T. Negreanuprjol, Synthesis and spectroscopic,
antibacterial and antifungal studies on copper (II) complexes with 2-benzothiazolyl hydrazones,
Rev Roum Chim. 53 (2008) 911–919.
[190] J.K. Seydel, K.-J. Schaper, B. Clement, S. Rüsch-Gerdes, N. Reiling, S. Ehlers, Pharmaceutical
compositions for treating infections with drug resistant mycobacteria, WO2011/047814, n.d.
[191] J.G. Cory, D.L. Downes, A.H. Cory, K.J. Schaper, J.K. Seydel, Substituted 2-acylpyridine-
alpha-(N)-hetarylhydrazones as inhibitors of ribonucleotide reductase activity and L1210 cell
growth, Anticancer Res. 14 (1994) 875–879.
[192] M.T. Cocco, C. Congiu, V. Lilliu, V. Onnis, Synthesis and in vitro antitumoral activity of new
hydrazinopyrimidine-5-carbonitrile derivatives, Bioorg. Med. Chem. 14 (2006) 366–372.
doi:10.1016/j.bmc.2005.08.012.
[193] M.A. Gaston, L.R.S. Dias, A.C.C. Freitas, A.L.P. Miranda, E.J. Barreiro, Synthesis and
analgesic properties of new 4-arylhydrazone 1-H pyrazole [3, 4-b] pyridine derivatives, Pharm.
Acta Helv. 71 (1996) 213–219.
[194] L. Savini, L. Chiasserini, A. Gaeta, C. Pellerano, Synthesis and anti-tubercular evaluation of 4-
quinolylhydrazones, Bioorg. Med. Chem. 10 (2002) 2193–2198.
[195] M.A. Soares, J.A. Lessa, I.C. Mendes, J.G. Da Silva, R.G. dos Santos, L.B. Salum, et al., N4-
Phenyl-substituted 2-acetylpyridine thiosemicarbazones: Cytotoxicity against human tumor
cells, structure–activity relationship studies and investigation on the mechanism of action,
Bioorg. Med. Chem. 20 (2012) 3396–3409. doi:10.1016/j.bmc.2012.04.027.
[196] J.A. Lessa, I.C. Mendes, P.R.O. da Silva, M.A. Soares, R.G. dos Santos, N.L. Speziali, et al., 2-
Acetylpyridine thiosemicarbazones: Cytotoxic activity in nanomolar doses against malignant
gliomas, Eur. J. Med. Chem. 45 (2010) 5671–5677. doi:10.1016/j.ejmech.2010.09.021.
[197] É.A. Enyedy, N.V. Nagy, É. Zsigó, C.R. Kowol, V.B. Arion, B.K. Keppler, et al., Comparative
Solution Equilibrium Study of the Interactions of Copper(II), Iron(II) and Zinc(II) with
Triapine (3-Aminopyridine-2-carbaldehyde Thiosemicarbazone) and Related Ligands, Eur. J.
Inorg. Chem. 2010 (2010) 1717–1728. doi:10.1002/ejic.200901174.
[198] I. Đilović, M. Rubčić, V. Vrdoljak, S.K. Pavelić, M. Kralj, I. Piantanida, et al., Novel
thiosemicarbazone derivatives as potential antitumor agents: Synthesis, physicochemical and
8. Bibliography 207
structural properties, DNA interactions and antiproliferative activity, Bioorg. Med. Chem. 16
(2008) 5189–5198. doi:10.1016/j.bmc.2008.03.006.
[199] V. Vrdoljak, M. Cindrić, D. Milić, D. Matković-Čalogović, P. Novak, B. Kamenar, Synthesis
of five new molybdenum(VI) thiosemicarbazonato complexes. Crystal structures of
salicylaldehyde and 3-methoxy-salicylaldehyde 4-methylthiosemicarbazones and their
molybdenum(VI) complexes, Polyhedron. 24 (2005) 1717–1726.
doi:10.1016/j.poly.2005.05.002.
[200] G. Tamasi, L. Chiasserini, L. Savini, A. Sega, R. Cini, Structural study of ribonucleotide
reductase inhibitor hydrazones. Synthesis and X-ray diffraction analysis of a copper(II)-
benzoylpyridine-2-quinolinyl hydrazone complex, J. Inorg. Biochem. 99 (2005) 1347–1359.
doi:10.1016/j.jinorgbio.2005.03.009.
[201] C.R. Kowol, R. Trondl, V.B. Arion, M.A. Jakupec, I. Lichtscheidl, B.K. Keppler, Fluorescence
properties and cellular distribution of the investigational anticancer drug Triapine (3-
aminopyridine-2-carboxaldehyde thiosemicarbazone) and its zinc(ii) complex, Dalton Trans. 39
(2010) 704. doi:10.1039/b919119b.
[202] D.X. West, J.J. Ingram III, N.M. Kozub, G.A. Bain, A.E. Liberta, Copper (II) complexes of 2-
formyl-, 2-acetyl-and 2-benzoyl-pyridine N (4)-phenyl-, N (4)-o-methoxyphenyl-, N (4)-p-
methoxy-phenyl-and N (4)-p-nitrophenylthiosemicarbazones, Transit. Met. Chem. 21 (1996)
213–218.
[203] J. Easmon, G. Pürstinger, K.-S. Thies, G. Heinisch, J. Hofmann, Synthesis, Structure−Activity
Relationships, and Antitumor Studies of 2-Benzoxazolyl Hydrazones Derived from Alpha-( N
)-acyl Heteroaromatics, J. Med. Chem. 49 (2006) 6343–6350. doi:10.1021/jm060232u.
[204] P. Sengupta, R. Dinda, S. Ghosh, Ruthenium(II) complexes of NSO donor ligands in the form
of ring-substituted 4-phenyl-thiosemicarbazones of salicylaldehyde and o-
hydroxyacetophenone, Transit. Met. Chem. 27 (2002) 665–667.
doi:10.1023/A:1019800729485.
[205] E.B. Seena, M.R.P. Kurup, Spectral and structural studies of mono- and binuclear copper(II)
complexes of salicylaldehyde N(4)-substituted thiosemicarbazones, Polyhedron. 26 (2007)
829–836. doi:10.1016/j.poly.2006.09.040.
[206] P. Bindu, M.R.P. Kurup, T.R. Satyakeerty, Epr, cyclic voltammetric and biological activities of
copper(II) complexes of salicylaldehyde N(4)-substituted thiosemicarbazone and heterocyclic
bases, Polyhedron. 18 (1998) 321–331. doi:10.1016/S0277-5387(98)00166-1.
[207] E. Pahontu, V. Fala, A. Gulea, D. Poirier, V. Tapcov, T. Rosu, Synthesis and Characterization
of Some New Cu(II), Ni(II) and Zn(II) Complexes with Salicylidene Thiosemicarbazones:
Antibacterial, Antifungal and in Vitro Antileukemia Activity, Molecules. 18 (2013) 8812–
8836. doi:10.3390/molecules18088812.
208
[208] V. Mahalingam, N. Chitrapriya, F.R. Fronczek, K. Natarajan, New Ru(II)–DMSO complexes
of ON/SN chelates: Synthesis, behavior of Schiff bases towards hydrolytic cleavage of CN
bond, electrochemistry and biological activities, Polyhedron. 29 (2010) 3363–3371.
doi:10.1016/j.poly.2010.09.019.
[209] Saswati, R. Dinda, C.S. Schmiesing, E. Sinn, Y.P. Patil, M. Nethaji, et al., Mixed-ligand
nickel(II) thiosemicarbazone complexes: Synthesis, characterization and biological evaluation,
Polyhedron. 50 (2013) 354–363. doi:10.1016/j.poly.2012.11.031.
[210] M. Cindrić, M. Rubčić, The Rare Examples of Thiosemicarbazonato Chromium(III)
Complexes: Crystal Structures of [Cr(Hsal 4- -Phtsc)2]Cl,
Croat. Chem. Acta. 85 (2012) 505–513. doi:10.5562/cca2153.
[211] V. Vrdoljak, D. Milić, M. Cindrić, D. Matković-Čalogović, D. Cinčić, Synthesis of novel
molybdenum(V) complexes: Structural characterization of two thiosemicarbazonato complexes
[MoOCl2{C6H4(O)CH:NNHC:SNHC6H5}] and
[MoOCl2{C10H6(O)CH:NNHC:SNHC6H5}]·CH3CN, and two oxohalomolybdates
NH4[MoOCl4(CH3CN)] and [C5H5NH]2[MoOCl5]·CH2Cl2, Polyhedron. 26 (2007) 3363–
3372. doi:10.1016/j.poly.2007.03.028.
[212] M. Cindrić, M. Uzelac, D. Cinčić, I. Halasz, G. Pavlović, T. Hrenar, et al., Three routes to
nickel( ii ) salicylaldehyde 4-phenyl and 4-methylthiosemicarbazonato complexes:
mechanochemical, electrochemical and conventional approach, CrystEngComm. 14 (2012)
3039–3045. doi:10.1039/C2CE06611D.
[213] V.V. Bon, S.I. Orysyk, V.I. Pekhnyo, S.V. Volkov, Square-planar 1:2 Ni(II) and Pd(II)
complexes with different coordination mode of salicylaldehyde (4)-phenylthiosemicarbazone:
Synthesis, structure and spectral properties, J. Mol. Struct. 984 (2010) 15–22.
doi:10.1016/j.molstruc.2010.08.046.
[214] M. Mohan, M.P. Gupta, L. Chandra, N.K. Jha, Synthesis, characterization and antitumour
properties of some metal(II) complexes of 2-pyridinecarboxaldehyde 2′-pyridylhydrazone and
related compounds, Inorganica Chim. Acta. 151 (1988) 61–68. doi:10.1016/S0020-
1693(00)83485-4.
[215] G. Vantomme, N. Hafezi, J.-M. Lehn, A light-induced reversible phase separation and its
coupling to a dynamic library of imines, Chem. Sci. 5 (2014) 1475–1483.
doi:10.1039/C3SC53130A.
[216] S.-Q. Wu, Y.-T. Wang, A.-L. Cui, H.-Z. Kou, Toward Higher Nuclearity: Tetranuclear
Cobalt(II) Metallogrid Exhibiting Spin Crossover, Inorg. Chem. 53 (2014) 2613–2618.
doi:10.1021/ic402971a.
[217] M.F. Primik, S. Göschl, M.A. Jakupec, A. Roller, B.K. Keppler, V.B. Arion,
Structure−Activity Relationships of Highly Cytotoxic Copper(II) Complexes with Modified
Indolo[3,2-c]quinoline Ligands, Inorg. Chem. 49 (2010) 11084–11095. doi:10.1021/ic101633z.
8. Bibliography 209
[218] E. Ion, M. Calinescu, A. Emandi, V. Badea, D. Negoiu, Copper (II) Complex Compounds with
Mixed Hydrazone Ligands, Rev. Chim.-Buchar.-Orig. Ed.-. 59 (2008) 12.
[219] S.R. Girish, V.K. Revankar, V.B. Mahale, Oxomolybdenum (V) complexes of 2-benzothiazolyl
hydrazones, Transit. Met. Chem. 21 (1996) 401–405.
[220] M. Călinescu, E. Ion, A.-M. Stadler, Studies on nickel (II) complex compounds with 2-
benzothiazolyl hydrazones, Rev Roum Chim. 53 (2008) 903–909.
[221] N.S. Youssef, E. El-Zahany, A.M.A. El-Seidy, A. Caselli, S. Fantauzzi, S. Cenini, Synthesis
and characterisation of new Schiff base metal complexes and their use as catalysts for olefin
cyclopropanation, Inorganica Chim. Acta. 362 (2009) 2006–2014.
doi:10.1016/j.ica.2008.09.012.
[222] J.K. Seydel, K.-J. Schaper, Substituierte 2-Acylpyridin-α-(N)-hetarylhydrazone sowie diese
enthaltende Arzneimittel, DE3716131A1, 1987.
[223] P.S. Kalsi, B.R. Chhabra, J. Singh, R. Vig, Selective Oxidation of Primary Allylic Alcohols to
αβ-Unsaturated Aldehydes, Synlett. 1992 (1992) 425–426. doi:10.1055/s-1992-21368.
[224] K.C. Agrawal, P.D. Mooney, A.C. Sartorelli, Potential antitumor agents. 13. 4-Methyl-5-
amino-1-formylisoquinoline thiosemicarbazone, J. Med. Chem. 19 (1976) 970–972.
[225] B.R. Chhabra, K. Hayano, T. Ohtsuka, H. Shirahama, T. Matsumoto, Selective oxidation of
allylic methyls in medium ring compounds, Chem. Lett. 10 (1981) 1703–1706.
[226] Y. Tagawa, K. Yamashita, Y. Higuchi, Y. Goto, IMPROVED OXIDATION OF ACTIVE
METHYL GROUP OF N-HETEROAROMATIC COMPOUNDS BY SELENIUM DIOXIDE
IN, Heterocycles. 60 (2003) 953–957.
[227] D.L. Klayman, J.F. Bartosevich, T.S. Griffin, C.J. Mason, J.P. Scovill, 2-Acetylpyridine
thiosemicarbazones. 1. A new class of potential antimalarial agents, J. Med. Chem. 22 (1979)
855–862.
[228] A.S. Dobek, D.L. Klayman, E.T. Dickson, J.P. Scovill, E.C. Tramont, Inhibition of clinically
significant bacterial organisms in vitro by 2-acetylpyridine thiosemicarbazones., Antimicrob.
Agents Chemother. 18 (1980) 27–36. doi:10.1128/AAC.18.1.27.
[229] X. Mei, P. Wang, A. Caracoti, P. Mingo, V. Boyd, R. Murray, et al., Hydrazone, hydrazine and
thiosemicarbazone derivatives as antifungal agents, Google Patents, 2001.
http://www.google.com/patents/US6329378 (accessed September 29, 2014).
[230] S.A. Thompson, L. Wheat, N.A. Brown, P.B. Wingrove, G.V. Pillai, P.J. Whiting, et al.,
Salicylidene salicylhydrazide, a selective inhibitor of β 1-containing GABA A receptors, Br. J.
Pharmacol. 142 (2004) 97–106. doi:10.1038/sj.bjp.0705689.
[231] K. Krishnan, K. Prathiba, V. Jayaprakash, A. Basu, N. Mishra, B. Zhou, et al., Synthesis and
ribonucleotide reductase inhibitory activity of thiosemicarbazones, Bioorg. Med. Chem. Lett.
18 (2008) 6248–6250. doi:10.1016/j.bmcl.2008.09.097.
210
[232] A. Shaikh Kabber, M.A. Basser, N.A. Mote, Synthesis and Antimicrobial Activity of Some
Schiff Bases from Benzothiazoles, Asian J. Chem. 13 (2001) 496–500.
[233] J. Easmon, G. Heinisch, J. Hofmann, T. Langer, H. Grunicke, J. Fink, et al., Thiazolyl and
benzothiazolyl hydrazones derived from α-(N)-acetylpyridines and diazines: synthesis,
antiproliferative activity and CoMFA studies, Eur. J. Med. Chem. 32 (1997) 397–408.
doi:10.1016/S0223-5234(97)81677-7.
[234] E.B. Lindgren, M.A. de Brito, T.R.A. Vasconcelos, M.O. de Moraes, R.C. Montenegro, J.D.
Yoneda, et al., Synthesis and anticancer activity of (E)-2-benzothiazole hydrazones, Eur. J.
Med. Chem. 86 (2014) 12–16. doi:10.1016/j.ejmech.2014.08.039.
[235] D. Gupta-Ostermann, J. Bajorath, The “SAR Matrix” method and its extensions for
applications in medicinal chemistry and chemogenomics, F1000Research. (2014).
doi:10.12688/f1000research.4185.2.
[236] K.L. Rinehart, Antitumor compounds from tunicates, Med. Res. Rev. 20 (2000) 1–27.
doi:10.1002/(SICI)1098-1128(200001)20:1<1::AID-MED1>3.0.CO;2-A.
[237] C.M. Rath, B. Janto, J. Earl, A. Ahmed, F.Z. Hu, L. Hiller, et al., Meta-omic Characterization
of the Marine Invertebrate Microbial Consortium That Produces the Chemotherapeutic Natural
Product ET-743, ACS Chem. Biol. 6 (2011) 1244–1256. doi:10.1021/cb200244t.
[238] E.L. Cooper, D. Yao, Diving for drugs: tunicate anticancer compounds, Drug Discov. Today.
17 (2012) 636–648. doi:10.1016/j.drudis.2012.02.006.
[239] R.G. Pearson, Hard and Soft Acids and Bases, J. Am. Chem. Soc. 85 (1963) 3533–3539.
doi:10.1021/ja00905a001.
[240] R.G. Pearson, Acids and bases, Science. 151 (1966) 172–177.
doi:10.1126/science.151.3707.172.
[241] K.L. Haas, K.J. Franz, Application of Metal Coordination Chemistry To Explore and
Manipulate Cell Biology, Chem. Rev. 109 (2009) 4921–4960. doi:10.1021/cr900134a.
[242] É.A. Enyedy, É. Zsigó, N.V. Nagy, C.R. Kowol, A. Roller, B.K. Keppler, et al., Complex-
Formation Ability of Salicylaldehyde Thiosemicarbazone towards ZnII, CuII, FeII, FeIII and
GaIII Ions, Eur. J. Inorg. Chem. 2012 (2012) 4036–4047. doi:10.1002/ejic.201200360.
[243] P.J. Jansson, C.L. Hawkins, D.B. Lovejoy, D.R. Richardson, The iron complex of Dp44mT is
redox-active and induces hydroxyl radical formation: An EPR study, J. Inorg. Biochem. 104
(2010) 1224–1228. doi:10.1016/j.jinorgbio.2010.07.012.
[244] E.M. Becker, D.B. Lovejoy, J.M. Greer, R. Watts, D.R. Richardson, Identification of the di-
pyridyl ketone isonicotinoyl hydrazone (PKIH) analogues as potent iron chelators and anti-
tumour agents, Br. J. Pharmacol. 138 (2003) 819–830. doi:10.1038/sj.bjp.0705089.
[245] Y. ’ning Song, H. Xu, W. Chen, P. Zhan, X. Liu, 8-Hydroxyquinoline: a privileged structure
with a broad-ranging pharmacological potential, MedChemComm. 6 (2015) 61–74.
doi:10.1039/C4MD00284A.
8. Bibliography 211
[246] G.S. Bajwa, K.E. Hartman, M.M. Joullié, Antimalarials. 1. Heterocyclic analogs of N-
substituted naphthalenebisoxazines, J. Med. Chem. 16 (1973) 134–138.
[247] É.A. Enyedy, O. Dömötör, E. Varga, T. Kiss, R. Trondl, C.G. Hartinger, et al., Comparative
solution equilibrium studies of anticancer gallium(III) complexes of 8-hydroxyquinoline and
hydroxy(thio)pyrone ligands, J. Inorg. Biochem. 117 (2012) 189–197.
doi:10.1016/j.jinorgbio.2012.08.005.
[248] Royal Society of Chemistry, SCQuery, The IUPAC Stability Constants Database, Academic
Software, 2005.
[249] R.J. Motekaitis, R.M. Smith, A.E. Martell, Critically Selected Stability Constants of Metal
Complexes Database, College Station, TX, USA, 1997.
[250] T.D. Turnquist, E.B. Sandell, Stability constants of iron(III)-8-hydroxyquinoline complexes,
Anal. Chim. Acta. 42 (1968) 239–245. doi:10.1016/S0003-2670(01)80304-4.
[251] G. Chen, Tris(quinolin-8-olato-κ 2 N , O )iron(III) methanol solvate, Acta Crystallogr. Sect. E
Struct. Rep. Online. 62 (2006) m3383–m3384. doi:10.1107/S1600536806048653.
[252] R.C. Hoy, R.H. Morriss, The crystal structure of the form of anhydrous copper 8-
hydroxyquinolinate, Acta Crystallogr. 22 (1967) 476–482.
[253] R.M. Smith, A.E. Martell, R.J. Motekaitis, NIST critically selected stability constants of metal
complexes database, National Institute of Standards and Technology, U.S. Dept. of Commerce,
Gaithersburg, MD, 2004. http://trove.nla.gov.au/work/20880716.
[254] S. Tardito, A. Barilli, I. Bassanetti, M. Tegoni, O. Bussolati, R. Franchi-Gazzola, et al.,
Copper-Dependent Cytotoxicity of 8-Hydroxyquinoline Derivatives Correlates with Their
Hydrophobicity and Does Not Require Caspase Activation, J. Med. Chem. 55 (2012) 10448–
10459. doi:10.1021/jm301053a.
[255] F.Q. Schafer, G.R. Buettner, Redox environment of the cell as viewed through the redox state
of the glutathione disulfide/glutathione couple, Free Radic. Biol. Med. 30 (2001) 1191–1212.
[256] C.G. Hartinger, S. Zorbas-Seifried, M.A. Jakupec, B. Kynast, H. Zorbas, B.K. Keppler, From
bench to bedside – preclinical and early clinical development of the anticancer agent
indazolium trans-[tetrachlorobis(1H-indazole)ruthenate(III)] (KP1019 or FFC14A), J. Inorg.
Biochem. 100 (2006) 891–904. doi:10.1016/j.jinorgbio.2006.02.013.
[257] R.T. Dean, P. Nicholson, The action of nine chelators on iron-dependent radical damage, Free
Radic. Res. 20 (1994) 83–101.
[258] R.J. Bergeron, J. Wiegand, J.S. McManis, J. Bussenius, R.E. Smith, W.R. Weimar,
Methoxylation of Desazadesferrithiocin Analogues: Enhanced Iron Clearing Efficiency, J.
Med. Chem. 46 (2003) 1470–1477. doi:10.1021/jm020412d.
[259] T.B. Chaston, D.B. Lovejoy, R.N. Watts, D.R. Richardson, Examination of the
Antiproliferative Activity of Iron Chelators Multiple Cellular Targets and the Different
212
Mechanism of Action of Triapine Compared with Desferrioxamine and the Potent Pyridoxal
Isonicotinoyl Hydrazone Analogue 311, Clin. Cancer Res. 9 (2003) 402–414.
[260] P.V. Bernhardt, L.M. Caldwell, T.B. Chaston, P. Chin, D.R. Richardson, Cytotoxic iron
chelators: characterization of the structure, solution chemistry and redox activity of ligands and
iron complexes of the di-2-pyridyl ketone isonicotinoyl hydrazone (HPKIH) analogues, JBIC J.
Biol. Inorg. Chem. 8 (2003) 866–880. doi:10.1007/s00775-003-0486-z.
[261] T.B. Chaston, D.R. Richardson, Interactions of the pyridine-2-carboxaldehyde isonicotinoyl
hydrazone class of chelators with iron and DNA: implications for toxicity in the treatment of
iron overload disease, J. Biol. Inorg. Chem. 8 (2003) 427–438. doi:10.1007/s00775-002-0434-
3.
[262] B. Song, N. Aebischer, C. Orvig, Reduction of [VO2(ma)2]- and [VO2(ema)2]- by Ascorbic
Acid and Glutathione: Kinetic Studies of Pro-Drugs for the Enhancement of Insulin Action†,
Inorg. Chem. 41 (2002) 1357–1364. doi:10.1021/ic0111684.
[263] T. Jakusch, É.A. Enyedy, K. Kozma, Z. Paár, A. Bényei, T. Kiss, Vanadate complexes of 3-
hydroxy-1,2-dimethyl-pyridinone: Speciation, structure and redox properties, Inorganica Chim.
Acta. 420 (2014) 92–102. doi:10.1016/j.ica.2013.12.034.
[264] J.J. Ruiz, A. Aldaz, M. Dominguez, Mechanism of L-ascorbic acid oxidation and dehydro-L-
ascorbic acid reduction on a mercury electrode. I. Acid medium, Can. J. Chem. 55 (1977)
2799–2806. doi:10.1139/v77-389.
[265] C. Kerksick, D. Willoughby, The Antioxidant Role of Glutathione and N-Acetyl-Cysteine
Supplements and Exercise-Induced Oxidative Stress, J. Int. Soc. Sports Nutr. 2 (2005) 38–44.
doi:10.1186/1550-2783-2-2-38.
[266] B. Noszál, D. Visky, M. Kraszni, Population, Acid−Base, and Redox Properties of N -
Acetylcysteine Conformers, J. Med. Chem. 43 (2000) 2176–2182. doi:10.1021/jm9909600.
[267] J.P. Baumberger, J.J. Jürgensen, K. Bardwell, The coupled redox potential of the lactate-
enzyme-pyruvate system, J. Gen. Physiol. 16 (1933) 961.
[268] W.W. Cleland, Dithiothreitol, a New Protective Reagent for SH Groups*, Biochemistry
(Mosc.). 3 (1964) 480–482. doi:10.1021/bi00892a002.
[269] A. Seo, J.L. Jackson, J.V. Schuster, D. Vardar-Ulu, Using UV-absorbance of intrinsic
dithiothreitol (DTT) during RP-HPLC as a measure of experimental redox potential in vitro,
Anal. Bioanal. Chem. 405 (2013) 6379–6384. doi:10.1007/s00216-013-7063-2.
[270] W. Jakubowski, 2,7-DICHLOROFLUORESCIN OXIDATION AND REACTIVE OXYGEN
SPECIES: WHAT DOES IT MEASURE?, Cell Biol. Int. 24 (2000) 757–760.
doi:10.1006/cbir.2000.0556.
[271] E. Eruslanov, S. Kusmartsev, Identification of ROS Using Oxidized DCFDA and Flow-
Cytometry, in: D. Armstrong (Ed.), Adv. Protoc. Oxidative Stress II, Humana Press, Totowa,
8. Bibliography 213
NJ, 2010: pp. 57–72. http://link.springer.com/10.1007/978-1-60761-411-1_4 (accessed
November 3, 2014).
[272] C.P. LeBel, H. Ischiropoulos, S.C. Bondy, Evaluation of the probe 2’, 7’-dichlorofluorescin as
an indicator of reactive oxygen species formation and oxidative stress, Chem. Res. Toxicol. 5
(1992) 227–231.
[273] J. Procházková, L. Kubala, H. Kotasová, I. Gudernová, Z. Šrámková, M. Pekarová, et al., ABC
transporters affect the detection of intracellular oxidants by fluorescent probes, Free Radic.
Res. 45 (2011) 779–787. doi:10.3109/10715762.2011.579120.
[274] M. Wartenberg, E. Hoffmann, H. Schwindt, F. Grünheck, J. Petros, J.R.S. Arnold, et al.,
Reactive oxygen species-linked regulation of the multidrug resistance transporter P-
glycoprotein in Nox-1 overexpressing prostate tumor spheroids, FEBS Lett. 579 (2005) 4541–
4549. doi:10.1016/j.febslet.2005.06.078.
[275] W.A. Morgan, B. Kaler, P.H. Bach, The role of reactive oxygen species in adriamycin and
menadione-induced glomerular toxicity, Toxicol. Lett. 94 (1998) 209–215.
[276] Y. Cai, J. Lu, Z. Miao, L. Lin, J. Ding, others, Reactive oxygen species contribute to cell killing
and P-glycoprotein downregulation by salvicine in multidrug resistant K562/A02 cells, Cancer
Biol. Ther. 6 (2007) 1794.
[277] Y. Jing, J. Dai, R.M. Chalmers-Redman, W.G. Tatton, S. Waxman, Arsenic trioxide selectively
induces acute promyelocytic leukemia cell apoptosis via a hydrogen peroxide-dependent
pathway, Blood. 94 (1999) 2102–2111.
[278] B.-Y. You, Y.-H. Wang, M.-L. Kuo, Role of reactive oxygen species in cupric 8-quinolinoxide-
induced genotoxic effect, Mutat. Res. Toxicol. Environ. Mutagen. 491 (2001) 45–56.
[279] H.-R. Lu, Reactive Oxygen Species Elicit Apoptosis by Concurrently Disrupting
Topoisomerase II and DNA-Dependent Protein Kinase, Mol. Pharmacol. 68 (2005) 983–994.
doi:10.1124/mol.105.011544.
[280] J. Yi, J. Yang, R. He, F. Gao, H. Sang, X. Tang, et al., Emodin enhances arsenic trioxide-
induced apoptosis via generation of reactive oxygen species and inhibition of survival
signaling, Cancer Res. 64 (2004) 108–116.
[281] T. Atsumi, S. Fujisawa, K. Tonosaki, Relationship between intracellular ROS production and
membrane mobility in curcumin-and tetrahydrocurcumin-treated human gingival fibroblasts
and human submandibular gland carcinoma cells, Oral Dis. 11 (2005) 236–242.
[282] L.K. Chin, J.Q. Yu, Y. Fu, T. Yu, A.Q. Liu, K.Q. Luo, Production of reactive oxygen species in
endothelial cells under different pulsatile shear stresses and glucose concentrations, Lab. Chip.
11 (2011) 1856. doi:10.1039/c0lc00651c.
[283] T. Ohashi, A. Mizutani, A. Murakami, S. Kojo, T. Ishii, S. Taketani, Rapid oxidation of
dichlorodihydrofluorescin with heme and hemoproteins: formation of the fluorescein is
independent of the generation of reactive oxygen species, FEBS Lett. 511 (2002) 21–27.
214
[284] Z.-F. Chen, M.-X. Tan, L.-M. Liu, Y.-C. Liu, H.-S. Wang, B. Yang, et al., Cytotoxicity of the
traditional chinese medicine (TCM) plumbagin in its copper chemistry, Dalton Trans. Camb.
Engl. 2003. (2009) 10824–10833. doi:10.1039/b910133k.
[285] S. Nazeem, A.S. Azmi, S. Hanif, A. Ahmad, R.M. Mohammad, S.M. Hadi, et al., Plumbagin
induces cell death through a copper-redox cycle mechanism in human cancer cells,
Mutagenesis. 24 (2009) 413–418. doi:10.1093/mutage/gep023.
[286] J.-H. Lee, J.-H. Yeon, H. Kim, W. Roh, J. Chae, H.-O. Park, et al., The Natural Anticancer
Agent Plumbagin Induces Potent Cytotoxicity in MCF-7 Human Breast Cancer Cells by
Inhibiting a PI-5 Kinase for ROS Generation, PLoS ONE. 7 (2012) e45023.
doi:10.1371/journal.pone.0045023.
[287] K.S. Kumar, S. Nazeem, A. Azmi, S. Hanif, Reactive Oxygen-Dependent DNA Damage
Resulting from the Oxidation of Plumbagin by a Copper-redox Cycle Mechanism: Implications
for its Anti-cancer Properties, Austral-Asian J. Cancer. 7 (2008) 65–72.
[288] A. Gomes, E. Fernandes, J.L.F.C. Lima, Fluorescence probes used for detection of reactive
oxygen species, J. Biochem. Biophys. Methods. 65 (2005) 45–80.
doi:10.1016/j.jbbm.2005.10.003.
[289] B. Kalyanaraman, V. Darley-Usmar, K.J.A. Davies, P.A. Dennery, H.J. Forman, M.B.
Grisham, et al., Measuring reactive oxygen and nitrogen species with fluorescent probes:
challenges and limitations, Free Radic. Biol. Med. 52 (2012) 1–6.
doi:10.1016/j.freeradbiomed.2011.09.030.
[290] H. Zhu, G.L. Bannenberg, P. Moldéus, H.G. Shertzer, Oxidation pathways for the intracellular
probe 2′,7′-dichlorofluorescin, Arch. Toxicol. 68 (1994) 582–587. doi:10.1007/s002040050118.
[291] M.J. Burkitt, P. Wardman, Cytochrome c Is a Potent Catalyst of Dichlorofluorescin Oxidation:
Implications for the Role of Reactive Oxygen Species in Apoptosis, Biochem. Biophys. Res.
Commun. 282 (2001) 329–333. doi:10.1006/bbrc.2001.4578.
[292] C.F. Chignell, R.H. Sik, A photochemical study of cells loaded with 2′,7′-dichlorofluorescin:
implications for the detection of reactive oxygen species generated during UVA irradiation,
Free Radic. Biol. Med. 34 (2003) 1029–1034. doi:10.1016/S0891-5849(03)00022-4.
[293] P. Wardman, Fluorescent and luminescent probes for measurement of oxidative and nitrosative
species in cells and tissues: Progress, pitfalls, and prospects, Free Radic. Biol. Med. 43 (2007)
995–1022. doi:10.1016/j.freeradbiomed.2007.06.026.
[294] M.B. Grisham, Methods to detect hydrogen peroxide in living cells: Possibilities and pitfalls,
Comp. Biochem. Physiol. A. Mol. Integr. Physiol. 165 (2013) 429–438.
doi:10.1016/j.cbpa.2013.02.003.
[295] V.V. Belousov, A.F. Fradkov, K.A. Lukyanov, D.B. Staroverov, K.S. Shakhbazov, A.V.
Terskikh, et al., Genetically encoded fluorescent indicator for intracellular hydrogen peroxide,
Nat. Methods. 3 (2006) 281–286. doi:10.1038/nmeth866.
8. Bibliography 215
[296] J.B. Lim, H.D. Sikes, Use of a genetically encoded hydrogen peroxide sensor for whole cell
screening of enzyme activity, Protein Eng. Des. Sel. PEDS. 28 (2015) 79–83.
doi:10.1093/protein/gzv003.
[297] K.N. Markvicheva, D.S. Bilan, N.M. Mishina, A.Y. Gorokhovatsky, L.M. Vinokurov, S.
Lukyanov, et al., A genetically encoded sensor for H2O2 with expanded dynamic range,
Bioorg. Med. Chem. 19 (2011) 1079–1084. doi:10.1016/j.bmc.2010.07.014.
[298] J. Weller, K.M. Kizina, K. Can, G. Bao, M. Müller, Response properties of the genetically
encoded optical H2O2 sensor HyPer, Free Radic. Biol. Med. 76 (2014) 227–241.
doi:10.1016/j.freeradbiomed.2014.07.045.
[299] A. Hernández-Barrera, A. Velarde-Buendía, I. Zepeda, F. Sanchez, C. Quinto, R. Sánchez-
Lopez, et al., Hyper, a Hydrogen Peroxide Sensor, Indicates the Sensitivity of the Arabidopsis
Root Elongation Zone to Aluminum Treatment, Sensors. 15 (2015) 855–867.
doi:10.3390/s150100855.
[300] A.J. Meyer, T.P. Dick, Fluorescent Protein-Based Redox Probes, Antioxid. Redox Signal. 13
(2010) 621–650. doi:10.1089/ars.2009.2948.
[301] FuGENE® HD Transfection Reagent, (n.d.).
https://worldwide.promega.com/products/reporter-assays-and-transfection/transfection-
reagents/fugene-hd-ultimate-transfection-performance/fugene-hd-transfection-reagent/
(accessed July 7, 2015).
[302] M. Wartenberg, M. Richter, A. Datchev, S. Günther, N. Milosevic, M.M. Bekhite, et al.,
Glycolytic pyruvate regulates P-Glycoprotein expression in multicellular tumor spheroids via
modulation of the intracellular redox state, J. Cell. Biochem. (2009) n/a–n/a.
doi:10.1002/jcb.22422.
[303] M. Wartenberg, Down-regulation of Intrinsic P-glycoprotein Expression in Multicellular
Prostate Tumor Spheroids by Reactive Oxygen Species, J. Biol. Chem. 276 (2001) 17420–
17428. doi:10.1074/jbc.M100141200.
[304] M. Bakker, J. Renes, A. Groenhuijzen, P. Visser, H. Timmer-Bosscha, M. Müller, et al.,
Mechanisms for high methoxymorpholino doxorubicin cytotoxicity in doxorubicin-resistant
tumor cell lines, Int. J. Cancer. 73 (1997) 362–366. doi:10.1002/(SICI)1097-
0215(19971104)73:3<362::AID-IJC10>3.0.CO;2-F.
[305] L. Mátés, M.K.L. Chuah, E. Belay, B. Jerchow, N. Manoj, A. Acosta-Sanchez, et al., Molecular
evolution of a novel hyperactive Sleeping Beauty transposase enables robust stable gene
transfer in vertebrates, Nat. Genet. 41 (2009) 753–761. doi:10.1038/ng.343.
[306] G. Szakács, C. Ozvegy, E. Bakos, B. Sarkadi, A. Váradi, Transition-state formation in ATPase-
negative mutants of human MDR1 protein, Biochem. Biophys. Res. Commun. 276 (2000)
1314–1319. doi:10.1006/bbrc.2000.3576.
216
[307] K.R. Brimacombe, M.D. Hall, D.S. Auld, J. Inglese, C.P. Austin, M.M. Gottesman, et al., A
Dual-Fluorescence High-Throughput Cell Line System for Probing Multidrug Resistance,
Assay Drug Dev. Technol. 7 (2009) 233–249. doi:10.1089/adt.2008.165.
[308] Common Stock Solutions, Buffers, and Media, Curr. Protoc. Neurosci. (1997).
http://onlinelibrary.wiley.com/doi/10.1002/0471142301.nsa02as00/full (accessed May 21,
2015).
[309] R.J. Geraghty, A. Capes-Davis, J.M. Davis, J. Downward, R.I. Freshney, I. Knezevic, et al.,
Guidelines for the use of cell lines in biomedical research, Br. J. Cancer. 111 (2014) 1021–
1046. doi:10.1038/bjc.2014.166.
[310] H.G. Drexler, C.C. Uphoff, Mycoplasma contamination of cell cultures: Incidence, sources,
effects, detection, elimination, prevention, Cytotechnology. 39 (2002) 75–90.
doi:10.1023/A:1022913015916.
[311] A. Downes, T.P. Blunt, On the Influence of Light upon Protoplasm, Proc. R. Soc. Lond. 28
(1878) 199–212. doi:10.1098/rspl.1878.0109.
[312] C.J. Miller, H.S. Kassem, S.D. Pepper, Y. Hey, T.H. Ward, G.P. Margison, Mycoplasma
infection significantly alters microarray gene expression profiles, BioTechniques. 35 (2003)
812–815.
[313] MycoAlertTM
Mycoplasma Detection Kit, (n.d.). http://www.lonza.com/products-services/bio-
research/cell-culture-products/mycoplasma-detection-and-removal/mycoalert-mycoplasma-
detection-kit.aspx (accessed July 5, 2015).
[314] E. Aldecoa-Otalora, W.B. Langdon, P. Cunningham, M.J. Arno, Unexpected presence of
mycoplasma probes on human microarrays, BioTechniques. 47 (2009) 1013–1016.
[315] T. Mosmann, Rapid colorimetric assay for cellular growth and survival: application to
proliferation and cytotoxicity assays, J. Immunol. Methods. 65 (1983) 55–63.
[316] M.V. Berridge, A.S. Tan, K.D. McCoy, R. Wang, others, The biochemical and cellular basis of
cell proliferation assays that use tetrazolium salts, Biochemica. 4 (1996) 15–19.
[317] T.L. Riss, R.A. Moravec, A.L. Niles, H.A. Benink, T.J. Worzella, L. Minor, Cell Viability
Assays, in: G.S. Sittampalam, N. Gal-Edd, M. Arkin, D. Auld, C. Austin, B. Bejcek, et al.
(Eds.), Assay Guid. Man., Eli Lilly & Company and the National Center for Advancing
Translational Sciences, Bethesda (MD), 2004.
http://www.ncbi.nlm.nih.gov/books/NBK144065/ (accessed May 21, 2015).
[318] F. Denizot, R. Lang, Rapid colorimetric assay for cell growth and survival. Modifications to the
tetrazolium dye procedure giving improved sensitivity and reliability, J. Immunol. Methods. 89
(1986) 271–277.
[319] T. Bernas, J. Dobrucki, Mitochondrial and nonmitochondrial reduction of MTT: Interaction of
MTT with TMRE, JC-1, and NAO mitochondrial fluorescent probes, Cytometry. 47 (2002)
236–242. doi:10.1002/cyto.10080.
8. Bibliography 217
[320] M.V. Berridge, A.S. Tan, Characterization of the Cellular Reduction of 3-(4,5-dimethylthiazol-
2-yl)-2,5-diphenyltetrazolium bromide (MTT): Subcellular Localization, Substrate
Dependence, and Involvement of Mitochondrial Electron Transport in MTT Reduction, Arch.
Biochem. Biophys. 303 (1993) 474–482. doi:10.1006/abbi.1993.1311.
[321] Y. Liu, D.A. Peterson, H. Kimura, D. Schubert, Mechanism of Cellular 3-(4,5-Dimethylthiazol-
2-yl)-2,5-Diphenyltetrazolium Bromide (MTT) Reduction, J. Neurochem. 69 (1997) 581–593.
doi:10.1046/j.1471-4159.1997.69020581.x.
[322] H. Mueller, M.U. Kassack, M. Wiese, Comparison of the Usefulness of the MTT, ATP, and
Calcein Assays to Predict the Potency of Cytotoxic Agents in Various Human Cancer Cell
Lines, J. Biomol. Screen. 9 (2004) 506–515. doi:10.1177/1087057104265386.
[323] T. Riss, M. O’Brien, R. Moravec, others, Choosing the right cell-based assay for your research,
Cell Notes. 6 (2003) 6.
[324] R. Hamid, Y. Rotshteyn, L. Rabadi, R. Parikh, P. Bullock, Comparison of alamar blue and
MTT assays for high through-put screening, Toxicol. In Vitro. 18 (2004) 703–710.
doi:10.1016/j.tiv.2004.03.012.
[325] S. Al-Nasiry, N. Geusens, M. Hanssens, C. Luyten, R. Pijnenborg, The use of Alamar Blue
assay for quantitative analysis of viability, migration and invasion of choriocarcinoma cells,
Hum. Reprod. 22 (2007) 1304–1309. doi:10.1093/humrep/dem011.
[326] J. O’Brien, I. Wilson, T. Orton, F. Pognan, Investigation of the Alamar Blue (resazurin)
fluorescent dye for the assessment of mammalian cell cytotoxicity, Eur. J. Biochem. 267 (2000)
5421–5426.
[327] G.R. Nakayama, M.C. Caton, M.P. Nova, Z. Parandoosh, Assessment of the Alamar Blue assay
for cellular growth and viability in vitro, J. Immunol. Methods. 204 (1997) 205–208.
[328] C. Mo, R. Yamagata, A. Pan, J. Reddy, N. Hazari, G. Duke, Development of a high-throughput
Alamar blue assay for the determination of influenza virus infectious dose, serum antivirus
neutralization titer and virus ca/ts phenotype, J. Virol. Methods. 150 (2008) 63–69.
doi:10.1016/j.jviromet.2008.03.006.
[329] S.A. Ahmed, R.M. Gogal, J.E. Walsh, A new rapid and simple non-radioactive assay to
monitor and determine the proliferation of lymphocytes: an alternative to [3H]thymidine
incorporation assay, J. Immunol. Methods. 170 (1994) 211–224.
[330] S.N. Rampersad, Multiple Applications of Alamar Blue as an Indicator of Metabolic Function
and Cellular Health in Cell Viability Bioassays, Sensors. 12 (2012) 12347–12360.
doi:10.3390/s120912347.
[331] G. Elliott, J. McGrath, E. Crockett-Torabi, Green Fluorescent Protein: A Novel Viability Assay
for Cryobiological Applications, Cryobiology. 40 (2000) 360–369.
doi:10.1006/cryo.2000.2258.
218
[332] C. Baumstark-Khan, M. Palm, J. Wehner, M. Okabe, M. Ikawa, G. Horneck, Green Fluorescent
Protein (GFP) as a Marker for Cell Viability After UV Irradiation, J. Fluoresc. 9 (1999) 37–43.
doi:10.1023/A:1020583623407.
[333] G.U. Nienhaus, The Green Fluorescent Protein: A Key Tool to Study Chemical Processes in
Living Cells, Angew. Chem. Int. Ed. 47 (2008) 8992–8994. doi:10.1002/anie.200804998.
[334] M. Chalfie, Y. Tu, G. Euskirchen, W.W. Ward, D.C. Prasher, Green fluorescent protein as a
marker for gene expression, Science. 263 (1994) 802–805.
[335] R.E. Campbell, O. Tour, A.E. Palmer, P.A. Steinbach, G.S. Baird, D.A. Zacharias, et al., A
monomeric red fluorescent protein, Proc. Natl. Acad. Sci. U. S. A. 99 (2002) 7877–7882.
doi:10.1073/pnas.082243699.
[336] N.C. Shaner, R.E. Campbell, P.A. Steinbach, B.N.G. Giepmans, A.E. Palmer, R.Y. Tsien,
Improved monomeric red, orange and yellow fluorescent proteins derived from Discosoma sp.
red fluorescent protein, Nat. Biotechnol. 22 (2004) 1567–1572. doi:10.1038/nbt1037.
[337] M.Z. Lin, M.R. McKeown, H.-L. Ng, T.A. Aguilera, N.C. Shaner, R.E. Campbell, et al.,
Autofluorescent Proteins with Excitation in the Optical Window for Intravital Imaging in
Mammals, Chem. Biol. 16 (2009) 1169–1179. doi:10.1016/j.chembiol.2009.10.009.
[338] M.A. Wall, M. Socolich, R. Ranganathan, The structural basis for red fluorescence in the
tetrameric GFP homolog DsRed, Nat. Struct. Mol. Biol. 7 (2000) 1133–1138.
doi:10.1038/81992.
[339] H. Mizuno, A. Sawano, P. Eli, H. Hama, A. Miyawaki, Red Fluorescent Protein from
Discosoma as a Fusion Tag and a Partner for Fluorescence Resonance Energy Transfer†,
Biochemistry (Mosc.). 40 (2001) 2502–2510. doi:10.1021/bi002263b.
[340] I. GraphPad Software, GraphPad Prism, GraphPad Software, Inc., 2007. www.graphpad.com.
[341] Z. Holló, L. Homolya, C.W. Davis, B. Sarkadi, Calcein accumulation as a fluorometric
functional assay of the multidrug transporter, Biochim. Biophys. Acta BBA - Biomembr. 1191
(1994) 384–388. doi:10.1016/0005-2736(94)90190-2.
[342] L. Homolya, M. Holló, M. Müller, E.B. Mechetner, B. Sarkadi, A new method for a
quantitative assessment of P-glycoprotein-related multidrug resistance in tumour cells., Br. J.
Cancer. 73 (1996) 849–855.
[343] Attune® Acoustic Focusing Cytometer User Guide (PN 4453328 Rev F) - cms_082577.pdf,
(n.d.).
https://www3.appliedbiosystems.com/cms/groups/mcb_support/documents/generaldocuments/c
ms_082577.pdf (accessed July 5, 2015).
[344] Routine Cloning Using Top10 Competent Cells, (n.d.).
http://www.lifetechnologies.com/hu/en/home/references/protocols/cloning/competent-cells-
protocol/routine-cloning-using-top10-competent-cells.html (accessed July 6, 2015).
8. Bibliography 219
[345] W.-T. Chan, C.S. Verma, D.P. Lane, S.K.-E. Gan, A comparison and optimization of methods
and factors affecting the transformation of Escherichia coli, Biosci. Rep. 33 (2013).
doi:10.1042/BSR20130098.
[346] G. Bertani, STUDIES ON LYSOGENESIS I. : The Mode of Phage Liberation by Lysogenic
Escherichia coli, J. Bacteriol. 62 (1951) 293.
[347] Evrogen HyPer: Summary, (n.d.). http://www.evrogen.com/products/HyPer/HyPer.shtml
(accessed July 6, 2015).
[348] QIAprep Spin Miniprep Kit - QIAGEN, (n.d.). https://www.qiagen.com/hu/shop/sample-
technologies/dna-sample-technologies/plasmid-dna/qiaprep-spin-miniprep-kit (accessed July 6,
2015).
[349] H.C. Birnboim, J. Doly, A rapid alkaline extraction procedure for screening recombinant
plasmid DNA., Nucleic Acids Res. 7 (1979) 1513.
[350] nanodrop_2000_user_manual.pdf, (n.d.). http://www.mlz-
garching.de/files/nanodrop_2000_user_manual.pdf (accessed July 5, 2015).
[351] S.R. Gallagher, P.R. Desjardins, Quantitation of DNA and RNA with absorption and
fluorescence spectroscopy, Curr. Protoc. Mol. Biol. Ed. Frederick M Ausubel Al. Appendix 3
(2006) Appendix 3D. doi:10.1002/0471142727.mba03ds76.
[352] R.S. Tobias, The determination of stability constants of complex inorganic species in aqueous
solutions, J. Chem. Educ. 35 (1958) 592. doi:10.1021/ed035p592.
[353] D.J. Leggett, Computational Methods for the Determination of Formation Constants, Springer
Science & Business Media, 2013.
[354] L.-O. Öhman, Experimental determination of stability constants of aqueous complexes, Chem.
Geol. 151 (1998) 41–50. doi:10.1016/S0009-2541(98)00069-2.
[355] H.M. Irving, M.G. Miles, L.D. Pettit, A study of some problems in determining the
stoicheiometric proton dissociation constants of complexes by potentiometric titrations using a
glass electrode, Anal. Chim. Acta. 38 (1967) 475–488. doi:10.1016/S0003-2670(01)80616-4.
[356] C.F. Baes, R.E. Mesmer, The Hydrolysis of Cations, Wiley, New York, 1976.
[357] L. Zékány, I. Nagypál, in: D.J. Leggett (Ed.), Comput. Methods Determ. Form. Constants,
1985: pp. 291–353.
[358] I. Puigdomenech, MEDUSA (Make Equilibrium Diagrams Using Sophisticated Algorithms),
Inorganic Chemistry Royal Institute of Technology, Stockholm, Sweden, 2009.
https://www.kth.se/en/che/medusa.
[359] R. Martens-Menzel, Physikalische Chemie in der Analytik: eine Einführung in die Grundlagen
mit Anwendungsbeispielen, 2., aktualisierte Aufl, Vieweg + Teubner, Wiesbaden, 2011.
[360] R.S. Nicholson, I. Shain, Theory of Stationary Electrode Polarography. Single Scan and Cyclic
Methods Applied to Reversible, Irreversible, and Kinetic Systems., Anal. Chem. 36 (1964)
706–723. doi:10.1021/ac60210a007.

220
[361] B. Speiser, Elektroanalytische Methoden II: cyclische voltammetrie, Chem. Unserer Zeit. 15
(1981) 62–67.
[362] J. Heinze, Cyclic Voltammetry—“Electrochemical Spectroscopy”. New Analytical Methods
(25), Angew. Chem. Int. Ed. Engl. 23 (1984) 831–847. doi:10.1002/anie.198408313.
[363] A.J. Bard, L.R. Faulkner, Electrochemical Methods–Fundamentals and Applications, John
Wiley & Sons, New York, 2000.
9. Appendix 221
9. Appendix
Table A1. Predicted physicochemical properties and measured biological data
(IC50 values in µM) of isatin β-TSCs page 222
Table A2. Predicted physicochemical properties and measured biological data
(IC50 values in µM) of pyridinecarbaldehyde TSCs page 223
Table A3. Predicted physicochemical properties and measured biological data
(IC50 values in µM) of salicylaldehyde TSCs and an aniline derivative page 225
Table A4. Predicted physicochemical properties and measured biological data
(IC50 values in µM) of arylhydrazones page 226
Table A5. Predicted physicochemical properties and measured biological data
(IC50 values in µM) of hydrazinobenzothiazoles page 227
22
2
Table A1. Predicted physicochemical properties and measured biological data (IC50 values in µM) of isatin β-TSCs
Compound code MW / g/mol
logD TPSA calc pKa
calc pKb
IC50 (MES-SA)
IC50 (MES-SA/Dx5)
IC50 (MES-SA_ mCh)
IC50 (MES-SA/Dx5_mCh)
IC50 (KB-3-1)
IC50 (KB-V1)
IC50 (A2780)
IC50 (A2780 adr)
I-a (NSC73306) 326.37 3.01 74.75 9.28 -1.48
6.10 ± 0.942
3.59 ± 1.01
12.06 ± 3.32
4.15 ± 0.895
7.82 ± 2.06
3.78 ± 0.433
7.49 ± 0.297
4.84 ± 1.21
I-b 410.37 4.44 83.98 9.31 -2.38 6.14 ± 2.41
2.78 ± 1.21
8.14 ± 2.34
2.52 ± 0.862
6.56 ± 2.69
3.92 ± 0.642
3.39 ± 0.932
3.77 ± 1.34
I-c 310.37 3.68 65.52 9.33 -1.23 5.33 ± 1.43
3.27 ± 0.751
11.31 ± 2.53
3.27 ± 0.850
4.44 ± 1.47
4.00 ± 0.618
9.70 ± 1.50
8.75 ± 1.94
I-d 341.35 3.11 108.66 9.17 -1.91 9.17 ± 3.64
4.74 ± 1.10
15.76 ± 7.57
7.55 ± 6.73
8.196 ± 1.52
4.58 ± 0.900
25.70 ± 6.92
8.78 ± 2.35
I-e 364.35 4.04 65.52 9.22 -2.14 2.06 ± 0.360
1.40 ± 0.349
3.34 ± 0.694
1.95 ± 0.905
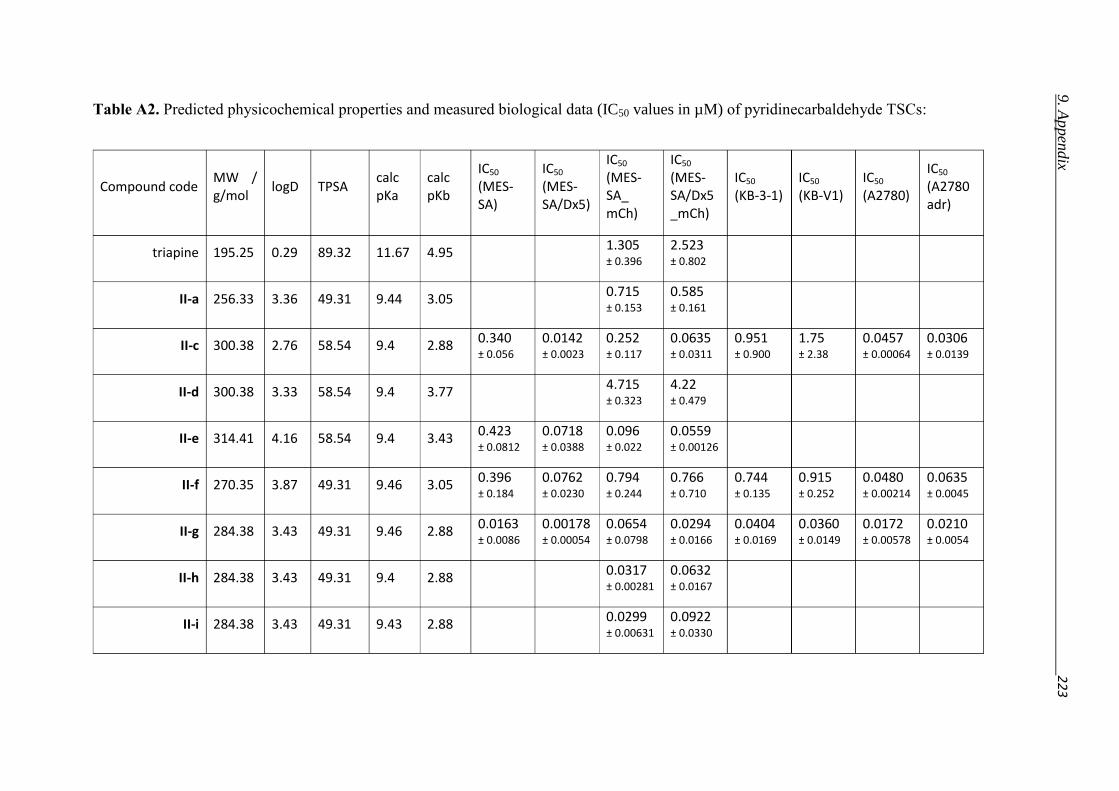
9. A
ppen
dix
2
23
Table A2. Predicted physicochemical properties and measured biological data (IC50 values in µM) of pyridinecarbaldehyde TSCs:
Compound code MW / g/mol
logD TPSA calc pKa
calc pKb
IC50 (MES-SA)
IC50 (MES-SA/Dx5)
IC50 (MES-SA_ mCh)
IC50 (MES-SA/Dx5_mCh)
IC50 (KB-3-1)
IC50 (KB-V1)
IC50 (A2780)
IC50 (A2780 adr)
triapine 195.25 0.29 89.32 11.67 4.95 1.305 ± 0.396
2.523 ± 0.802
II-a 256.33 3.36 49.31 9.44 3.05 0.715 ± 0.153
0.585 ± 0.161
II-c 300.38 2.76 58.54 9.4 2.88 0.340 ± 0.056
0.0142 ± 0.0023
0.252 ± 0.117
0.0635 ± 0.0311
0.951 ± 0.900
1.75 ± 2.38
0.0457 ± 0.00064
0.0306 ± 0.0139
II-d 300.38 3.33 58.54 9.4 3.77 4.715 ± 0.323
4.22 ± 0.479
II-e 314.41 4.16 58.54 9.4 3.43 0.423 ± 0.0812
0.0718 ± 0.0388
0.096 ± 0.022
0.0559 ± 0.00126
II-f 270.35 3.87 49.31 9.46 3.05 0.396 ± 0.184
0.0762 ± 0.0230
0.794 ± 0.244
0.766 ± 0.710
0.744 ± 0.135
0.915 ± 0.252
0.0480 ± 0.00214
0.0635 ± 0.0045
II-g 284.38 3.43 49.31 9.46 2.88 0.0163 ± 0.0086
0.00178 ± 0.00054
0.0654 ± 0.0798
0.0294 ± 0.0166
0.0404 ± 0.0169
0.0360 ± 0.0149
0.0172 ± 0.00578
0.0210 ± 0.0054
II-h 284.38 3.43 49.31 9.4 2.88 0.0317 ± 0.00281
0.0632 ± 0.0167
II-i 284.38 3.43 49.31 9.43 2.88 0.0299 ± 0.00631
0.0922 ± 0.0330
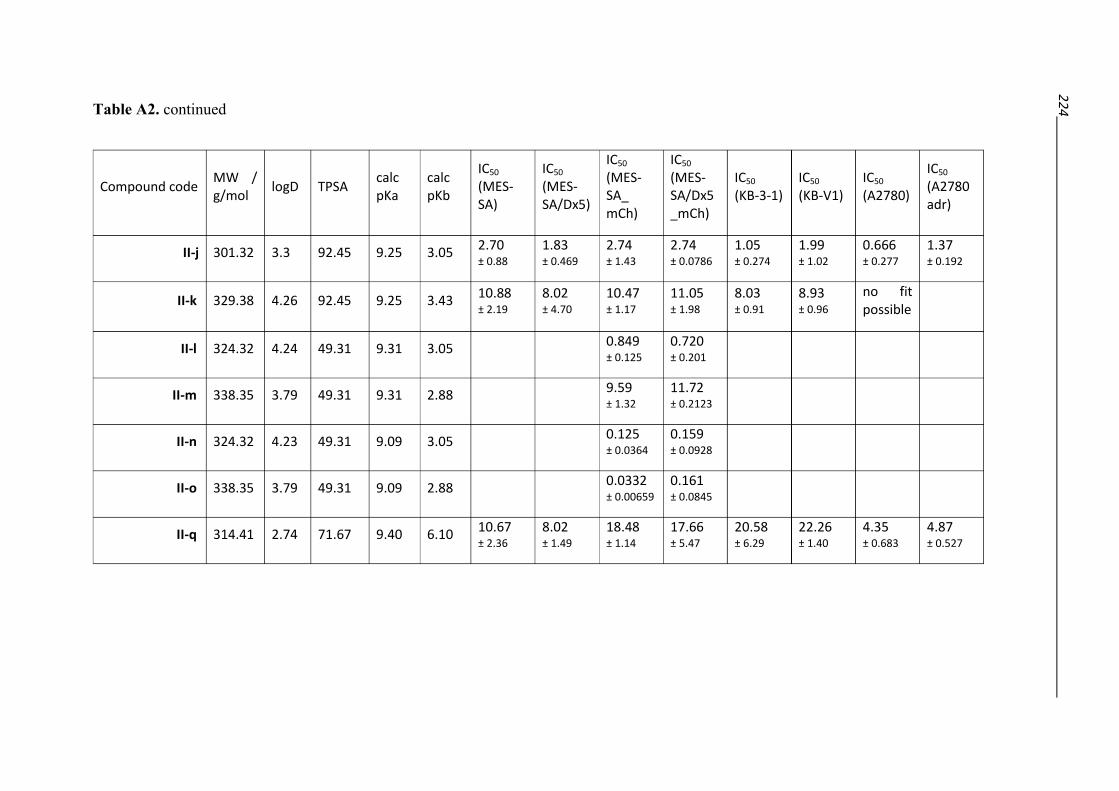
22
4
Table A2. continued
Compound code MW / g/mol
logD TPSA calc pKa
calc pKb
IC50 (MES-SA)
IC50 (MES-SA/Dx5)
IC50 (MES-SA_ mCh)
IC50 (MES-SA/Dx5_mCh)
IC50 (KB-3-1)
IC50 (KB-V1)
IC50 (A2780)
IC50 (A2780 adr)
II-j 301.32 3.3 92.45 9.25 3.05 2.70 ± 0.88
1.83 ± 0.469
2.74 ± 1.43
2.74 ± 0.0786
1.05 ± 0.274
1.99 ± 1.02
0.666 ± 0.277
1.37 ± 0.192
II-k 329.38 4.26 92.45 9.25 3.43 10.88 ± 2.19
8.02 ± 4.70
10.47 ± 1.17
11.05 ± 1.98
8.03 ± 0.91
8.93 ± 0.96
no fit possible
II-l 324.32 4.24 49.31 9.31 3.05 0.849 ± 0.125
0.720 ± 0.201
II-m 338.35 3.79 49.31 9.31 2.88 9.59 ± 1.32
11.72 ± 0.2123
II-n 324.32 4.23 49.31 9.09 3.05 0.125 ± 0.0364
0.159 ± 0.0928
II-o 338.35 3.79 49.31 9.09 2.88 0.0332 ± 0.00659
0.161 ± 0.0845
II-q 314.41 2.74 71.67 9.40 6.10 10.67 ± 2.36
8.02 ± 1.49
18.48 ± 1.14
17.66 ± 5.47
20.58 ± 6.29
22.26 ± 1.40
4.35 ± 0.683
4.87 ± 0.527
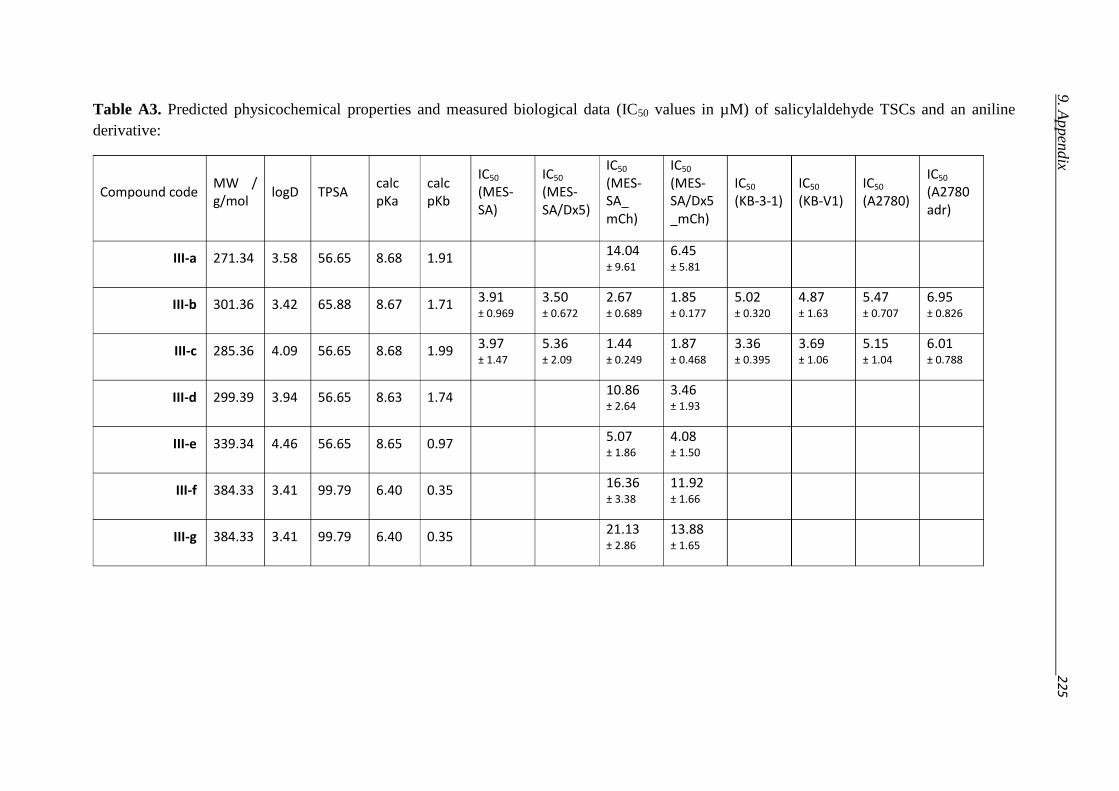
9. A
ppen
dix
2
25
Table A3. Predicted physicochemical properties and measured biological data (IC50 values in µM) of salicylaldehyde TSCs and an aniline
derivative:
Compound code MW / g/mol
logD TPSA calc pKa
calc pKb
IC50 (MES-SA)
IC50 (MES-SA/Dx5)
IC50 (MES-SA_ mCh)
IC50 (MES-SA/Dx5_mCh)
IC50 (KB-3-1)
IC50 (KB-V1)
IC50 (A2780)
IC50 (A2780 adr)
III-a 271.34 3.58 56.65 8.68 1.91 14.04 ± 9.61
6.45 ± 5.81
III-b 301.36 3.42 65.88 8.67 1.71 3.91 ± 0.969
3.50 ± 0.672
2.67 ± 0.689
1.85 ± 0.177
5.02 ± 0.320
4.87 ± 1.63
5.47 ± 0.707
6.95 ± 0.826
III-c 285.36 4.09 56.65 8.68 1.99 3.97 ± 1.47
5.36 ± 2.09
1.44 ± 0.249
1.87 ± 0.468
3.36 ± 0.395
3.69 ± 1.06
5.15 ± 1.04
6.01 ± 0.788
III-d 299.39 3.94 56.65 8.63 1.74 10.86 ± 2.64
3.46 ± 1.93
III-e 339.34 4.46 56.65 8.65 0.97 5.07 ± 1.86
4.08 ± 1.50
III-f 384.33 3.41 99.79 6.40 0.35 16.36 ± 3.38
11.92 ± 1.66
III-g 384.33 3.41 99.79 6.40 0.35 21.13 ± 2.86
13.88 ± 1.65
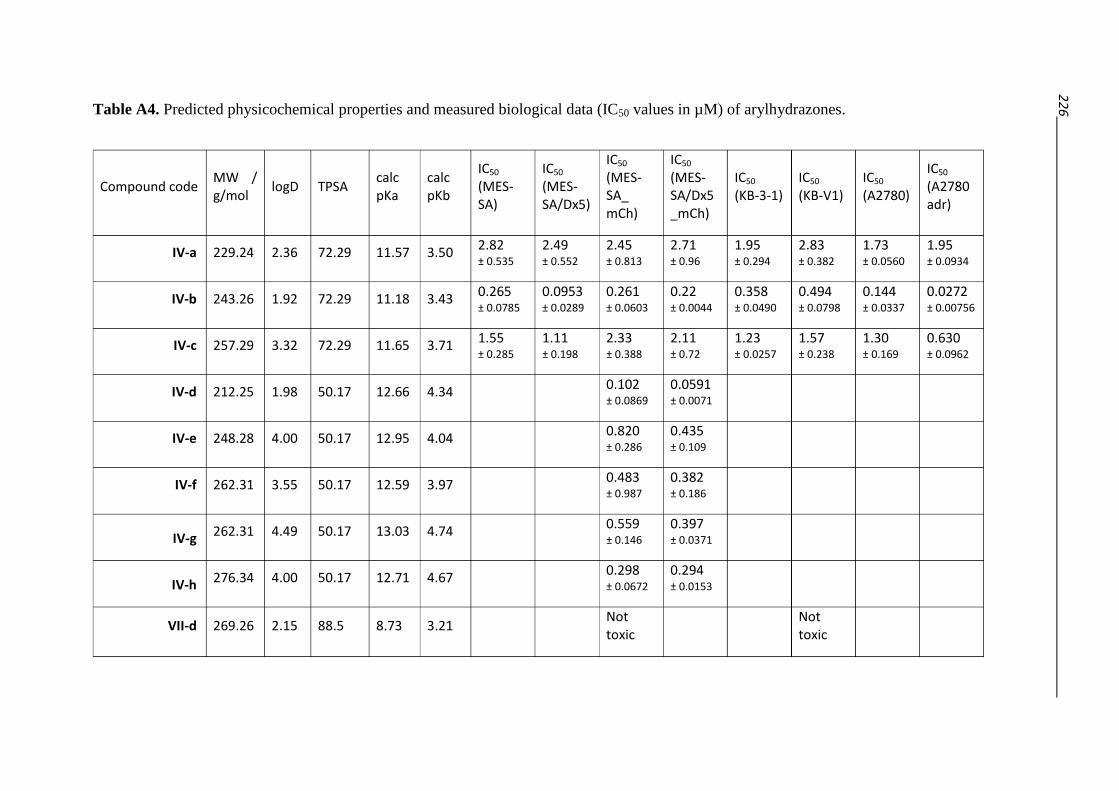
22
6
Table A4. Predicted physicochemical properties and measured biological data (IC50 values in µM) of arylhydrazones.
Compound code MW / g/mol
logD TPSA calc pKa
calc pKb
IC50 (MES-SA)
IC50 (MES-SA/Dx5)
IC50 (MES-SA_ mCh)
IC50 (MES-SA/Dx5_mCh)
IC50 (KB-3-1)
IC50 (KB-V1)
IC50 (A2780)
IC50 (A2780 adr)
IV-a 229.24 2.36 72.29 11.57 3.50 2.82 ± 0.535
2.49 ± 0.552
2.45 ± 0.813
2.71 ± 0.96
1.95 ± 0.294
2.83 ± 0.382
1.73 ± 0.0560
1.95 ± 0.0934
IV-b 243.26 1.92 72.29 11.18 3.43 0.265 ± 0.0785
0.0953 ± 0.0289
0.261 ± 0.0603
0.22 ± 0.0044
0.358 ± 0.0490
0.494 ± 0.0798
0.144 ± 0.0337
0.0272 ± 0.00756
IV-c 257.29 3.32 72.29 11.65 3.71 1.55 ± 0.285
1.11 ± 0.198
2.33 ± 0.388
2.11 ± 0.72
1.23 ± 0.0257
1.57 ± 0.238
1.30 ± 0.169
0.630 ± 0.0962
IV-d 212.25 1.98 50.17 12.66 4.34 0.102 ± 0.0869
0.0591 ± 0.0071
IV-e 248.28 4.00 50.17 12.95 4.04 0.820 ± 0.286
0.435 ± 0.109
IV-f 262.31 3.55 50.17 12.59 3.97 0.483 ± 0.987
0.382 ± 0.186
IV-g 262.31 4.49 50.17 13.03 4.74 0.559 ± 0.146
0.397 ± 0.0371
IV-h 276.34 4.00 50.17 12.71 4.67 0.298 ± 0.0672
0.294 ± 0.0153
VII-d 269.26 2.15 88.5 8.73 3.21 Not toxic
Not toxic
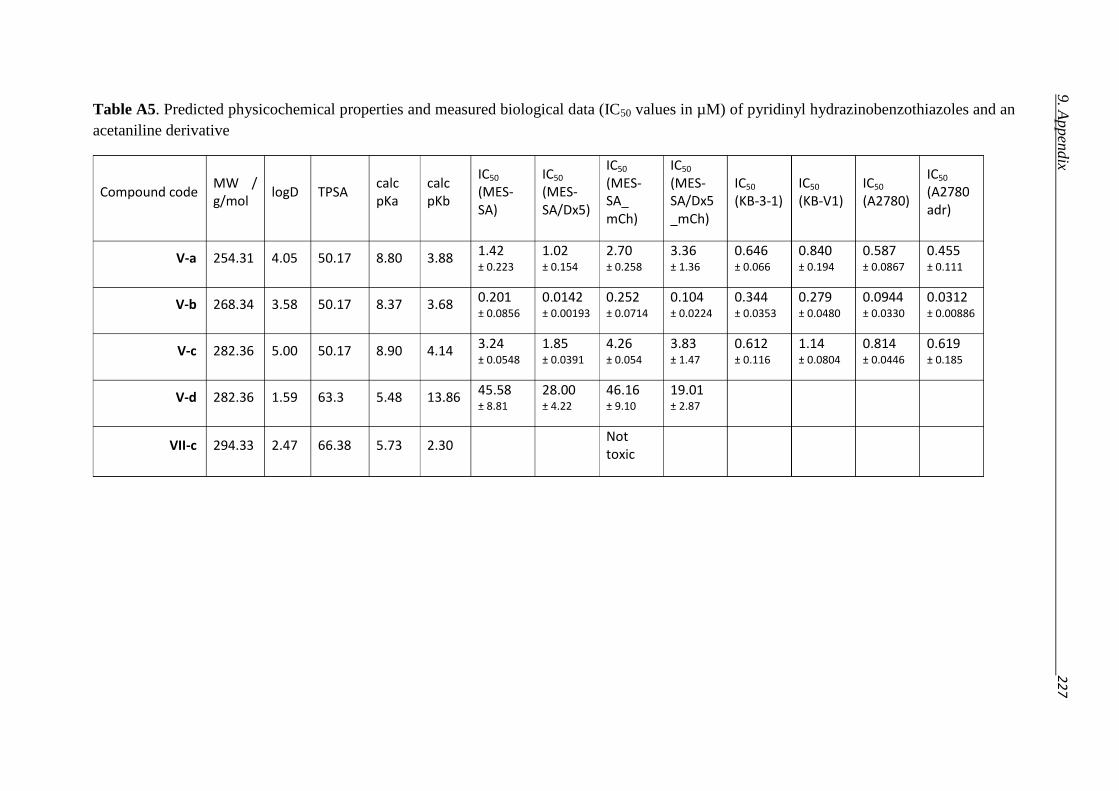
9. A
ppen
dix
2
27
Table A5. Predicted physicochemical properties and measured biological data (IC50 values in µM) of pyridinyl hydrazinobenzothiazoles and an
acetaniline derivative
Compound code MW / g/mol
logD TPSA calc pKa
calc pKb
IC50 (MES-SA)
IC50 (MES-SA/Dx5)
IC50 (MES-SA_ mCh)
IC50 (MES-SA/Dx5_mCh)
IC50 (KB-3-1)
IC50 (KB-V1)
IC50 (A2780)
IC50 (A2780 adr)
V-a 254.31 4.05 50.17 8.80 3.88 1.42 ± 0.223
1.02 ± 0.154
2.70 ± 0.258
3.36 ± 1.36
0.646 ± 0.066
0.840 ± 0.194
0.587 ± 0.0867
0.455 ± 0.111
V-b 268.34 3.58 50.17 8.37 3.68 0.201 ± 0.0856
0.0142 ± 0.00193
0.252 ± 0.0714
0.104 ± 0.0224
0.344 ± 0.0353
0.279 ± 0.0480
0.0944 ± 0.0330
0.0312 ± 0.00886
V-c 282.36 5.00 50.17 8.90 4.14 3.24 ± 0.0548
1.85 ± 0.0391
4.26 ± 0.054
3.83 ± 1.47
0.612 ± 0.116
1.14 ± 0.0804
0.814 ± 0.0446
0.619 ± 0.185
V-d 282.36 1.59 63.3 5.48 13.86 45.58 ± 8.81
28.00 ± 4.22
46.16 ± 9.10
19.01 ± 2.87
VII-c 294.33 2.47 66.38 5.73 2.30 Not toxic
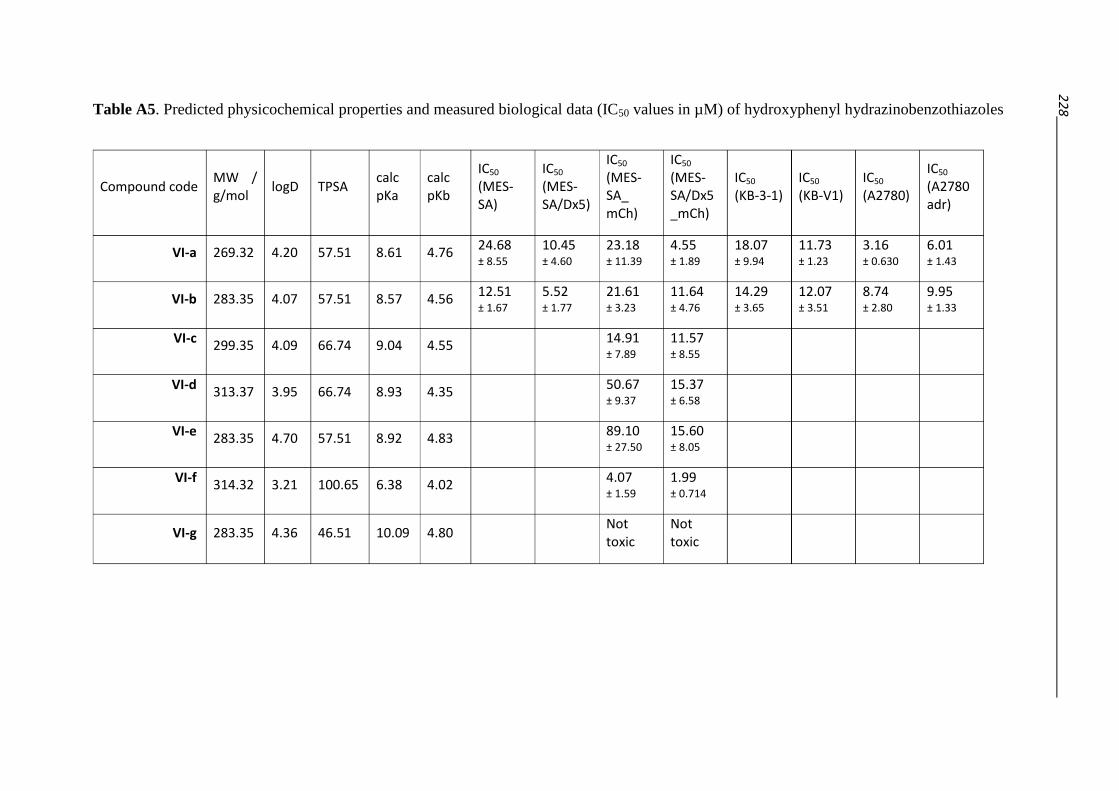
22
8
Table A5. Predicted physicochemical properties and measured biological data (IC50 values in µM) of hydroxyphenyl hydrazinobenzothiazoles
Compound code MW / g/mol
logD TPSA calc pKa
calc pKb
IC50 (MES-SA)
IC50 (MES-SA/Dx5)
IC50 (MES-SA_ mCh)
IC50 (MES-SA/Dx5_mCh)
IC50 (KB-3-1)
IC50 (KB-V1)
IC50 (A2780)
IC50 (A2780 adr)
VI-a 269.32 4.20 57.51 8.61 4.76 24.68 ± 8.55
10.45 ± 4.60
23.18 ± 11.39
4.55 ± 1.89
18.07 ± 9.94
11.73 ± 1.23
3.16 ± 0.630
6.01 ± 1.43
VI-b 283.35 4.07 57.51 8.57 4.56 12.51 ± 1.67
5.52 ± 1.77
21.61 ± 3.23
11.64 ± 4.76
14.29 ± 3.65
12.07 ± 3.51
8.74 ± 2.80
9.95 ± 1.33
VI-c 299.35 4.09 66.74 9.04 4.55 14.91 ± 7.89
11.57 ± 8.55
VI-d 313.37 3.95 66.74 8.93 4.35 50.67 ± 9.37
15.37 ± 6.58
VI-e 283.35 4.70 57.51 8.92 4.83
89.10 ± 27.50
15.60 ± 8.05
VI-f 314.32 3.21 100.65 6.38 4.02 4.07 ± 1.59
1.99 ± 0.714
VI-g 283.35 4.36 46.51 10.09 4.80 Not toxic
Not toxic

11. Verfassererklärung 229
10. Acknowledgement
I would like to thank my supervisor, Professor Dr. M. Wiese, for giving me the opportunity to
work on such an interesting topic. During the time of my PhD he was constantly available for
thorough and fruitful discussions, and I want to thank him for his helpful comments and his
constructive criticism. I appreciate the trust he had in me and the freedom he provided, to
develop my own thoughts about the project. Furthermore I would like to thank him for the
opportunity to foster a collaboration with Dr. Gergely Szakács at the Hungarian Academy of
Sciences and for providing the framework to spend a significant part of my PhD time in his
laboratory.
My unofficial second supervisor Dr. Gergely Szakács I would like to thank for hospitably
accepting me as a member of his work group and for teaching me to ask the right questions,
and to find suitable methods that might lead to answers (or further questions). I am grateful
for the uncountable opportunities he provided for me, to follow the path of my ideas on the
project and for his support in building up the network that was necessary to do so. I learned a
lot during the time I spent in his laboratory and not least through his unfatiguing critical
proof-reading of paper drafts, he helped to improve my scientific writing skills. I want to
thank him for very fruitful and inspiring discussions and the confidence he had in me.
I would like to thank Professor Dr. G. Bendas, for his willingness to take the co-referendum,
for very nice and fruitful discussions and for making the teaching in the first semester a
pleasant experience.
Professor Dr. U. Jaehde I would like to thank for taking part in the committee, for his
supervision in the BIGS DrugS graduate school and for the opportunity to perform work that
involved the handling of cytostatic agents in his laboratory.
I would like to thank Professor Dr. A. Meyer for taking part in the committee.
Having mentioned a network that was established in the scope of the project, I would
foremost like to thank our collaborator Professor Dr. Éva A. Enyedy from the University of
Szeged for her kind hospitality and for giving me the opportunity to work in her laboratory.
She gave me a deeper insight into the work of a bioinorganic chemist. I would like to

230
especially thank her for her help in data analysis, as well as in fixing technical issues in the
laboratory. I would like to furthermore thank her husband Dominik Hollender, as well as her
group members Dr. Orsolya Dömötör and Katalin Tóth Szűcsné for technical support in the
laboratory.
I am extremely grateful to Dr. Miklós Geiszt for thorough, helpful and fruitful discussions
about ROS related issues of the project and for providing the HyPerC and HyPerC121s
plasmids.
My former colleague Zsuzsanna Nagy I would like to thank for supervising me with the DNA
work that was necessary for the preparation of stably transfected cells, and Nóra Kucsma and
Áron Szepesi for the lentiviral transfection of MES-SA and MES-SA/Dx5 cells.
I am grateful for help in programming issues and for fruitful discussions I had with Dr. Anna
Lovrics and Judit Sessler, and further discussions with Dr. Anna Brozik. Also, I want to thank
my colleagues Szilárd Tóth and Dr. Dóra Türk for the help I have obtained with FACS
measurements and especially Szilárd for his support and contribution in creating the
corresponding figure. I am grateful to them and to András Füredi for their kind and
uncomplicated collaboration in common projects. I would like to thank them, as well as my
further office members Mihaly Cserepes, Anna Küllői, Tímea Windt, Lilla Hámori, Veronika
Nagy and Dániel Kiss, as well as Zsófia Rakvács and Ágnes Bilecz for a very nice and
stimulating working atmosphere. As a special office member I would like to thank Krisztina
Mohos for being an angel in ordering and organizational issues. As her German “counterpart”,
I would also like to thank Tatjana Müller for support in organizational issues in Bonn.
For their friendship, technical assistance in the cellular laboratory, very nice conversations, an
amazing optimism and a constant believe in me, I would like to thank Rozália Soós, Elvira
Komlósi, Ibolya Kurko, Iris Jusen and Dieter Baumert.
I would like to take the opportunity, to also thank my colleagues from the work group of
Professor Dr. M. Wiese, who provided a nice working atmosphere. I especially want to thank
Dr. Mathias Weigt for his help with computational problems and for sharing data he collected
from a crystal structure database. I want to thank Dr. Kapil Juvale, Dr. Martin Koch, Dr.
Svenja Wieschrath, Jennifer Gallus, Stefanie Kraege and my former office members Dr.
Kerstin Steggemann and Matthias Christlieb for nice conversations on scientific and non-
scientific issues. I am grateful to Dr. Katja Sterz for initial support in the cellular laboratory.
11. Verfassererklärung 231
Many people contributed to the analysis of synthesized compounds. For the measurement of
NMR spectra I would like to thank Sabine Terhart-Krabbe and Orsolya Egyed Lejtoviczné.
Furthermore, I would like to thank Herrmann Passgang for the measurement of combustion
analysis and Pál Szabó for conducting LC-MS measurements. Additionally, I would like to
thank my “Wahlpflichtstudenten” Sarah Hopp, Christian Müller and Roland Pietz for support
in the synthesis of presented compounds.
I would like to take the opportunity to thank all those friends who were there for me, and
accompanied me on my way as a PhD student.
I would like to express my gratitude to Dr. Flóra Szeri for her critical proof-reading of
excerpts from the manuscript of this thesis, for her honesty and very helpful comments, for
always being there for me, for cheering me up in difficult times, for never stopping to believe
in me, for making me climb up mountains and simply for being herself. I would like to thank
Kriszta Kerekes for cheerful conversations, and for the motivation and support I obtained
from her, Alasdair, Flóra and Mesi in overlooking and overcoming some of the stones on the
way.
I would like to thank Dr. Anja Voreck, as well as Oleg Pogrebnyak and Andrea László (and
their mothers) for their friendship, their support and believe in me. I am grateful to Anne
Thomas, with whom I could share the ups and downs of the writing process in regular
updates; I want to sincerely thank her for the mutual motivation. In the long list of people I
am grateful to, I also have to mention my long-time friends Dr. Julia Siebert-Krümpelmann,
Mareike Gammel and Nadine Witte, who frequently lent me an ear and cheered me up.
I am extremely grateful to the choir Wave of Joy, for being like a big second family, for the
opportunity to sing with you that always cheered me up and put a smile (back) into my face,
even in times, when I could only join via skype. I am happy that I met some very good friends
in this choir, and I thank you (especially Rolf Rau and Andrea Schulze, Anette and Volker
Schade, Anette and Reiner Viebahn, Dr. Elke Mannigel, Elfriede Szymczak, Ulrike Kemper
and many more) for your smiles and hugs, for supporting and motivating me and for
constantly believing in me.
Nicht zuletzt möchte ich mich ganz herzlich bei meinen Eltern bedanken, die immer für mich
da waren und mich in meinen Entscheidungen stets unterstützt haben. Durch Eure
Unterstützung, Eure Liebe und Euren Glauben an mich bin ich heute, wer ich bin. Ohne Euch
wären weder mein Chemie-Studium, noch diese Arbeit möglich gewesen.
232
11. Verfassererklärung
Ich erkläre, dass ich die vorgelegte Arbeit persönlich, selbständig und ohne Benutzung
anderer als der angegebenen Hilfsmittel verfasst habe. Die vorgelegte oder eine ähnliche
Arbeit wurden vorher nicht anderweitig als Dissertation eingereicht.
Auszüge der Arbeit wurden in den Fachzeitschriften „Journal of Inorganic Biochemistry“ und
„European Journal of Medicinal Chemistry“ veröffentlicht.
Bonn, 18.12.2015 Veronika F.S. Pape
12. List of Publications 233
12. List of Publications
Publications related to the thesis
Pape VFS, Türk D, Szabó P, Wiese M, Enyedy EA, Szakács G. Synthesis and
characterization of the anticancer and metal binding properties of novel pyrimidinylhydrazone
derivatives. J Inorg Biochem. 2015;144:18–30.
Pape VFS, Tóth S, Füredi A, Szebényi K, Lovrics A, Szabó P, et al. Design, synthesis and
biological evaluation of thiosemicarbazones, hydrazinobenzothiazoles and arylhydrazones as
anticancer agents with a potential to overcome multidrug resistance. Eur J Med Chem.
2016;117:335–54.
Szakács G, Füredi A, Tóth S, Pape VFS, Türk D, Soós T, Ferenczi-Palkó R, Fülöp F,
Szatmári I, Dormán G. „MDR-reversing 8-hydroxy-quinoline derivatives” P16 00234, 2016.
Publications not related to the thesis
Juvale K, Pape VFS, Wiese M. Investigation of chalcones and benzochalcones as inhibitors of
breast cancer resistance protein. Bioorg. Med. Chem. 2012;20:346–55.
Toth PM, Naruhn S, Pape VFS, Dörr SMA, Klebe G, Müller R, et al. Development of
Improved PPARβ/δ Inhibitors. ChemMedChem. 2012;7:159–70.
Naruhn S, Toth PM, Adhikary T, Kaddatz K, Pape V, Dorr S, et al. High-Affinity Peroxisome
Proliferator-Activated Receptor β/δ -Specific Ligands with Pure Antagonistic or Inverse
Agonistic Properties. Mol. Pharmacol. 2011;80:828–38.
Diederich W, Doerr S, Kaddatz K, Klebe G, Mueller R, Naruhn S, et al. Verbindungen Als
Ppar Beta/Delta Inhibitoren Für Die Behandlung Von Ppar Beta/Delta-Vermittelten
Erkrankungen „compounds as PPAR beta/delta inhibitors for treating PPAR beta/delta-
mediated diseases“ WO2012/168345A1, 2012. Available from:
http://depatisnet.dpma.de/DepatisNet/depatisnet?action=bibdat&docid=WO002012168345A1
234
13. Conference Presentations
2012: Poster at 4th FEBS Special meeting, ATP-Binding Cassette (ABC) Proteins: From
Multidrug Resistance to Genetic Diseases, Innsbruck, Austria:
Design, synthesis, testing and functional characterization of novel MDR
selective compounds targeting resistant cancer
Veronika F.S. Pape, Michael Wiese, Gergely Szakács
2013: Poster at Multi-Drug Efflux Systems - Gordon Research Conference, Ventura, USA:
Hitting where it hurts – compounds targeting MDR cells.
Szilárd Tóth, András Füredi, Veronika Pape, Eszter Kanta, Antónia Síkhegyi, Dóra
Türk, Gergely Szakács
Poster at MRIC - Redox Modulation of Health and Disease, Erlangen, Germany:
Chelators as anticancer agents with potential to overcome multidrug resistance
Veronika F.S. Pape, Éva A. Enyedy, Gabriella M. Bognár, Szilárd Tóth, András
Füredi, Dóra Türk, Michael Wiese, Gergely Szakács
Posters at Role of MDR proteins in pharmacokinetics and toxicology, Ryn, Poland:
Targeting the Achilles heel – application of a myth?
Veronika F.S. Pape, Szilárd Tóth, András Füredi, Dóra Türk, Michael Wiese,
Gergely Szakács
In search for molecules that selectively kill MDR cancer cells by exploiting the
function of P-glycoprotein
Szilárd Tóth, András Füredi, Eszter Kanta, Antónia Síkhegyi, Veronika F.S. Pape,
Dóra Türk, Gergely Szakács
2014: Poster at EuroBIC - 12th European Biological Inorganic Chemistry Conference,
Zürich, Switzerland:
Investigating the impact of ROS on the toxicity of Plumbagin and its copper
complexes
Veronika F.S. Pape, Éva A. Enyedy, Anna Lovrics, Zsuzsanna Nagy, Nóra Kucsma,
Áron Szepesi, Miklós Geiszt, Michael Wiese, Gergely Szakács

13. Conference Presentations 235
2015: Oral presentation at 5th
Gárdos György Szimpózium, Mátraháza, Hungary:
Daganatsejtek rezisztenciája – Az MDR szelektivitás a kémiai szempontból
(Resistance of tumor cells – MDR selectivity from a chemical viewpoint)